


Abstract
The mineral composition and chemistry of a Co-rich ferromanganese crust from Skornyakova Guyot in the Magellan Seamount Cluster is investigated by X-ray diffraction and ICP-OES to scrutinize the effects of phosphatization on the depletion of Co. The section of this crust is divided into four layers (layers I-1, I-2, II and III) from substrate to surface based on texture. The average Co concentrations of older layers I-1 and I-2 are 0.41% and 0.30%, respectively, whereas the average Co concentrations of younger layers II and III are 0.53% and 0.29%. The variation ranges of SiO2, Al2O3, CaO, P2O5, and Fe2O3 along the section are 1.5%–22.9%, 0.4%–6.9%, 2.7%–24.6%, 0.83%–15.26%, and 10.7%–28.4%, respectively, which are capable of diluting the Co concentrations significantly. The todorokite detectable by XRD does not occur in layers I-1 and I-2, which suggests that most of the depletion of Co in phosphatized crust cannot be attributed solely to the mineral transition from Fe-vernadite to todorokite during phosphatization, and other controls, including the dilution from detrital minerals and carbonate fluorapatite, need to be involved.
1. Introduction
Co-rich ferromanganese crusts (crusts hereafter) on seamounts contain some economically valuable elements such as Mn, Co, Ni, Cu, REEs, and PGE, and are one of the most important potential mineral resources in the deep ocean, especially in the western Pacific. The most fascinating feature of crusts is high Co concentration relative to other Fe-Mn deposits, including deep-sea manganese nodules or hydrothermal Mn deposits near mid-ocean ridges and island arcs [1,2,3]. The value of Co per metric ton Fe-Mn crusts is about USD 273, and it has the highest value among the elements mentioned [4]. The factors controlling the Co concentration in Fe-Mn crusts are, therefore, important for resource estimation.
In general, the sections of ferromanganese crusts from the Magellan Seamount Cluster can be divided into layer R, layer I-1, layer I-2, layer II, and layer III [5,6,7,8,9,10]. Relative to the younger layer II and layer III, the older layer R, layer I-1, and layer I-2 were phosphatized during diagenesis and are characterized by low average Co concentrations [7,11,12] even for shallow-buried crusts [13]. The mineralogy of crusts from the Magellan Seamount Cluster is dominated by poorly crystallized Fe-vernadite, and Mn-feroxigite and structurally ordered Fe-vernadite were identified in layer I-1, as well as layer I-2 [7,12,14,15]. Those phosphatized layers are also impregnated with carbonate fluorapatite (CFA) in cracks and interstices [13]. The relict layer R was deposited in the Campanian–Maastrichtian and Late Paleocene along the shores of guyots, and layer I-1 and layer I-2 were deposited in Late Paleocene–Early Eocene and in the Middle–Late Eocene, respectively, in a shallow-water shelf environment [16]. The younger layers, including layer II and layer III, were deposited in Miocene and Pliocene–Pleistocene, respectively, at water depths around the present sea level [16]. The evolution of global paleo-oceanography, such as the western Pacific warm pool, the opening of the Indonesian seaway, and global cooling, controls the geochemistry and growth process of crusts [17,18].
The Co concentrations in the younger non-phosphatized crusts are constrained by multiple factors such as the dilution effects from silicates, the diffusivity of Co ions in seawater, the temperature which controls the diffusivity, the Co ion concentration in seawater, the diffusion distance of Co ions near the interface of seawater and Fe-Mn crusts, the thickness of one molecular layer, growth rate, and specific surface area of Fe-Mn crusts [19]. The Co concentration in the older generation is depleted relative to that in the younger generation, which resulted from phosphatization [20]. Based on the analysis of the stratigraphic sections of 63 crusts from Fedorov Guyot of the Magellan Seamount Cluster, the average Co concentration in the phosphatized generation (layers I-1 and I-2) is 0.25% and 0.30%, whereas that in the non-phosphatized generation (Layers II and III) is 0.38% and 0.57% [7]. Co secondary enrichments around CFA also occurred during the impregnation of CFA into older crust layers [10].
Based on the analysis of 50 older crust generations and 172 young crust generations (values in wt.% of dry substance), the average Co concentration is 0.63% in phosphatized generations, and 0.92% in non-phosphatized generations [21]. Koschinsky et al. [20] attributed this discrepancy in Co concentrations between the two generations to phosphatization: the dilution effect of CFA and the Fe-vernadite transformation to todorokite. However, the occurrence of todorokite in hydrogenetic crusts is rare since only 2% of 640 X-ray diffraction analyses carried out by the USGS on Pacific crusts exhibit todorokite if offshore California samples are excluded [4]. The question, then, is whether the transformation of Fe-vernadite to todorokite is solely enough to result in the depletion of Co in the older crust generation.
In this research, we study the mineralogical and geochemical composition of a section of a crust from the Magellan Seamount Cluster at high resolution to discuss the controls of phosphatization on Co concentrations in older crust layers.
2. Sample and Methods
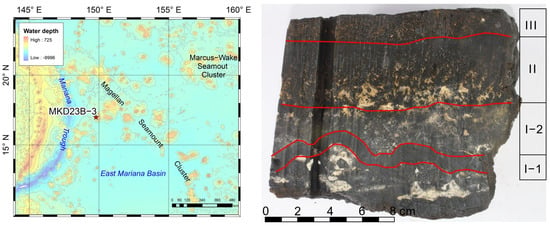
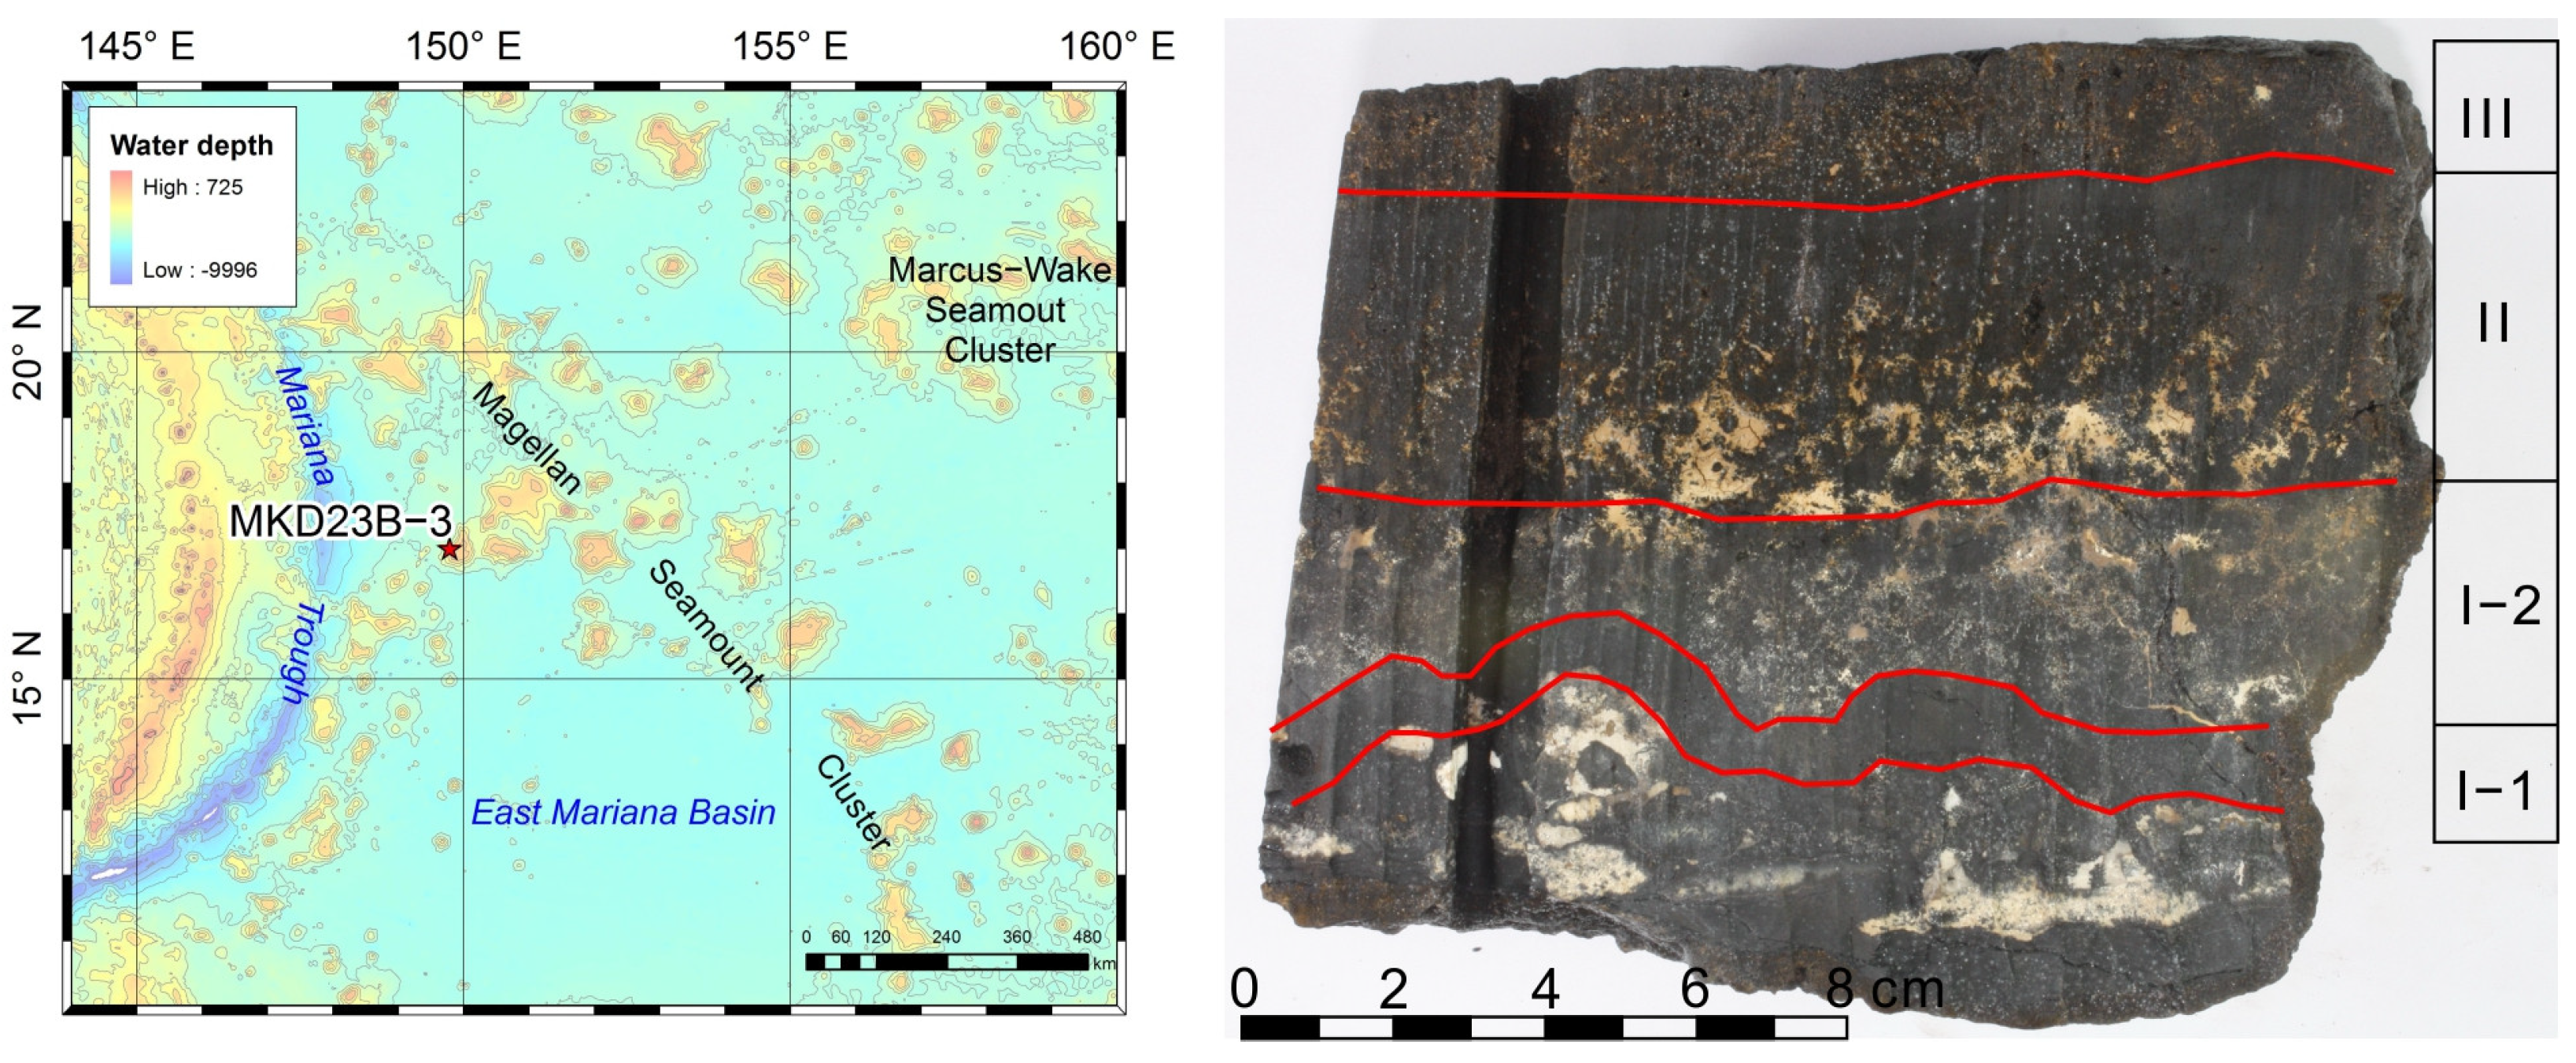
The Fe-Mn crust studied here (MKD23B-3) was collected at 149.79° E and 17.00° N by a dredge from Skornyakova Guyot in the Magellan Seamount Cluster at a water depth of approximately 2170 m during a cruise of R.V. Haiyangsihao in 2003. Skornyakova Guyot is located in the northwestern part of the Magellan Seamount Cluster (Figure 1).
Figure 1.
Location (left panel) and section (right panel) of Fe-Mn crust MKD23B-3.
The cross-section of Fe-Mn crust MKD23B-3 can be divided into four layers from substrate to surface according to the variation in texture (Figure 1). The substrate is an intergrowth of pale-yellow, dense, and hard phosphate, together with black Fe-Mn oxides. Layer I-1 is 11.8 mm thick, raven-black color, compact, hard and laminated in texture. Layer I-2 is 29.3 mm thick, black, and dendritic in texture. The CFA in layer I-2 shows snowflake-like intergrowths with black Fe-Mn oxides. Most of the CFA is white to pale yellow and soft, and a little CFA is brown and hard. Layer II is 42.1 mm thick. The texture varied from loose dendritic in the lower layer to compacted dendritic in the upper layer, and correspondingly the yellow-brown clay decreases from the lower to the upper layers. Layer III is 16.8 mm thick. The texture is characterized by friable, black, dendritic Fe-Mn oxides, and the interstices are filled with yellow clay.
Eighty-nine subsamples are taken layer by layer along the stratigraphic section of crust MKD23B-3 with a stainless-steel knife and then ground in an agate mortar into fine powder less than 200 mesh. Every two aliquots are selected and analyzed (forty-five aliquots in total as listed in Table 1). Mineralogical investigations are carried out by X-ray Powder Diffraction (Rigaku D/max 2500PC, Rigaku, Tokyo, Japan) using a Cu tube anode and scanning from 3 to 90° 2θ with a step of 2°/min. Minerals are identified using Jade 5.0 software.
Table 1.
Mineralogical and geochemical composition of crust MKD23B-3 by XRD and ICP-OES.
The chemical composition of the subsamples is determined using ICP-OES (iCAP 6300, Thermo Fisher Scientific Inc., Agawam, MA, USA). Prior to chemical analysis, (1) Fe-Mn crust aliquots are dried at 110 °C for 4 h and then cooled to room temperature in a silica gel desiccator. (2) The aliquots (0.0500 ± 0.0005 g) are digested at 190–200 °C for 48 h in sealed Teflon vessels using a mixture of 1.5 mL HNO3 and 1 mL HF. (3) The cooled aliquots are evaporated to incipient dryness on a hot plate, then 1 mL HNO3 is added and aliquots are evaporated again to incipient dryness to drive off the HF. (4) The aliquots are digested again at 150 °C for 12 h in sealed Teflon vessels using 4 mL 1:1 HNO3, and 1 mL Rh is added to the samples as an internal standard. (5) Aliquots are cooled to room temperature, and 1–2 drops of H2O2 are added to the aliquots in the Teflon vessels. The aliquots are then transferred into polyethylene bottles using 2% HNO3. Finally, the aliquot solutions are made up to 100 g for analysis. Major and minor elements are determined by ICP-OES at the First Institute of Oceanography, Ministry of Natural Resources of China (Table 1). In order to check the quality of the data, Co-rich Fe-Mn crust standards GSMC-1 and GSMC-2 (developed by the National Research Center for Geoanalysis of China) are measured with a standard deviation of less than 0.6%.
3. Results
3.1. Mineral Composition
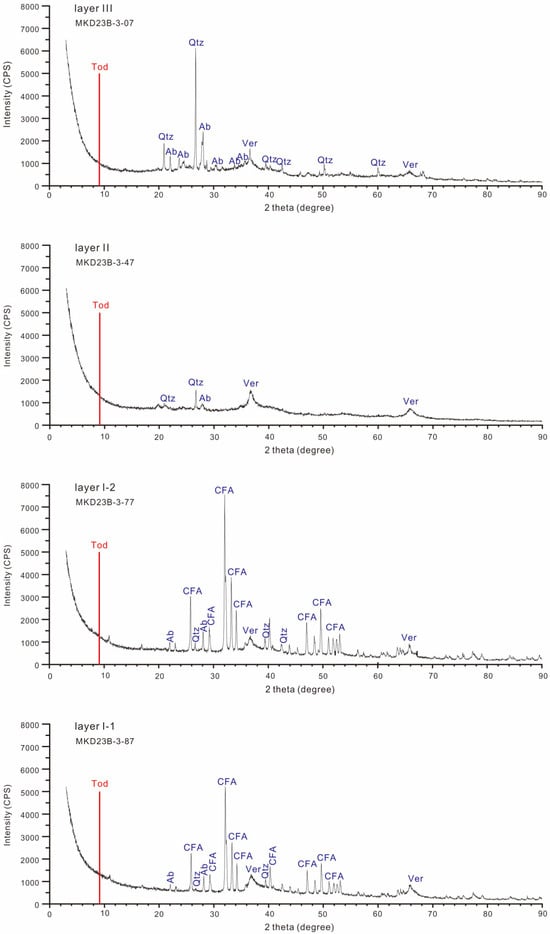
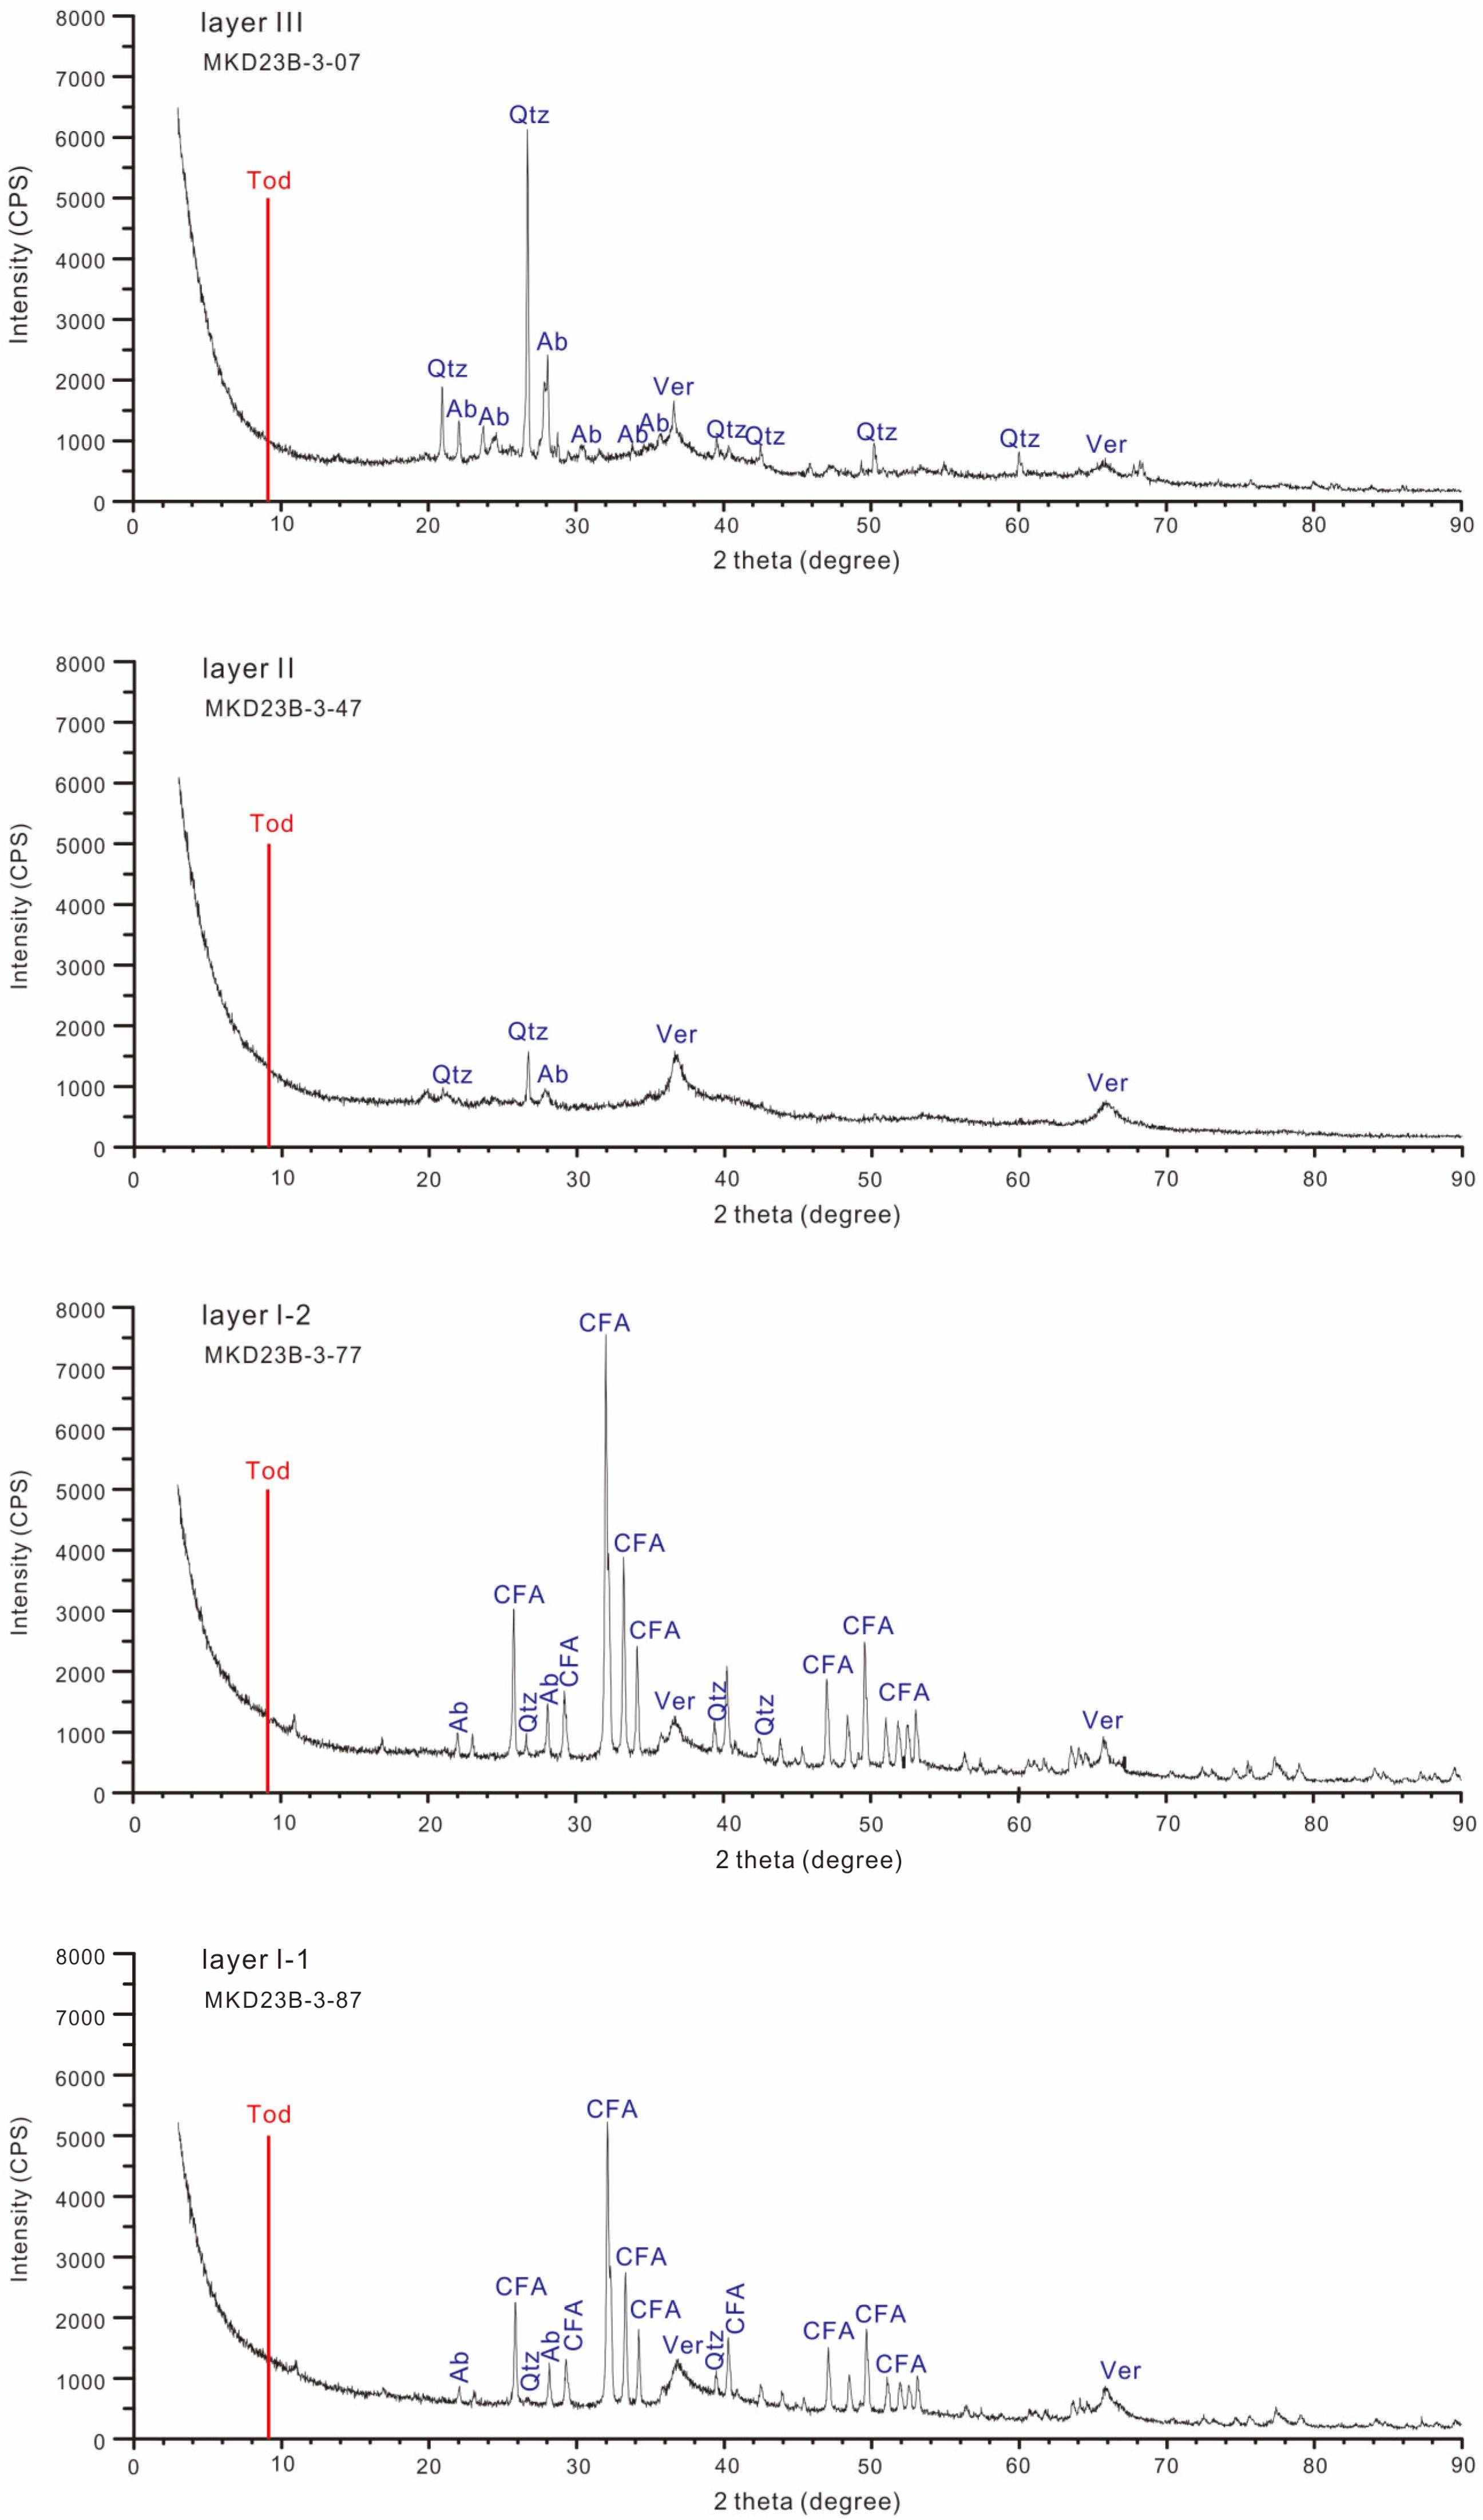
XRD diffraction patterns (Figure 2) show that the crystallized minerals that can be identified clearly from XRD curves are Fe-vernadite, CFA, albite, and quartz in layers I-1 and II, and Fe-vernadite, albite, and quartz in layers II and III. In layer III, the intensity of the peaks of quartz and albite is high relative to layers II, I-2 and I-1. Layer I-2 shows the high CFA peak relative to layer I-1. In all four layers, the intensity of the Fe-vernadite peak is low even though Mn is a major element in crusts, which indicates the poor crystallization of this mineral. It should be highlighted that the peak of todorokite at 9.7 Å (100) could not be distinguished from the XRD curve, either in the unphosphatized layers II and III or in the phosphatized layers I-1 and I-2.
Figure 2.
Typical X-ray diffraction patterns for four layers of crust MKD23B-3 (the red line is the 9.7 Å intensity peak for todorokite, Ver: Fe-vernadite, CFA: fluorapatite, Qtz: quartz, Ab: albite).
3.2. Chemical Composition
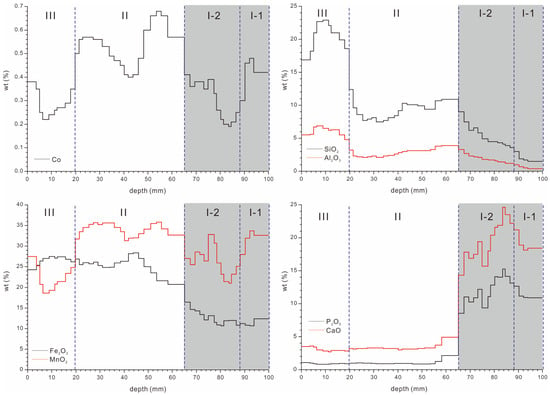
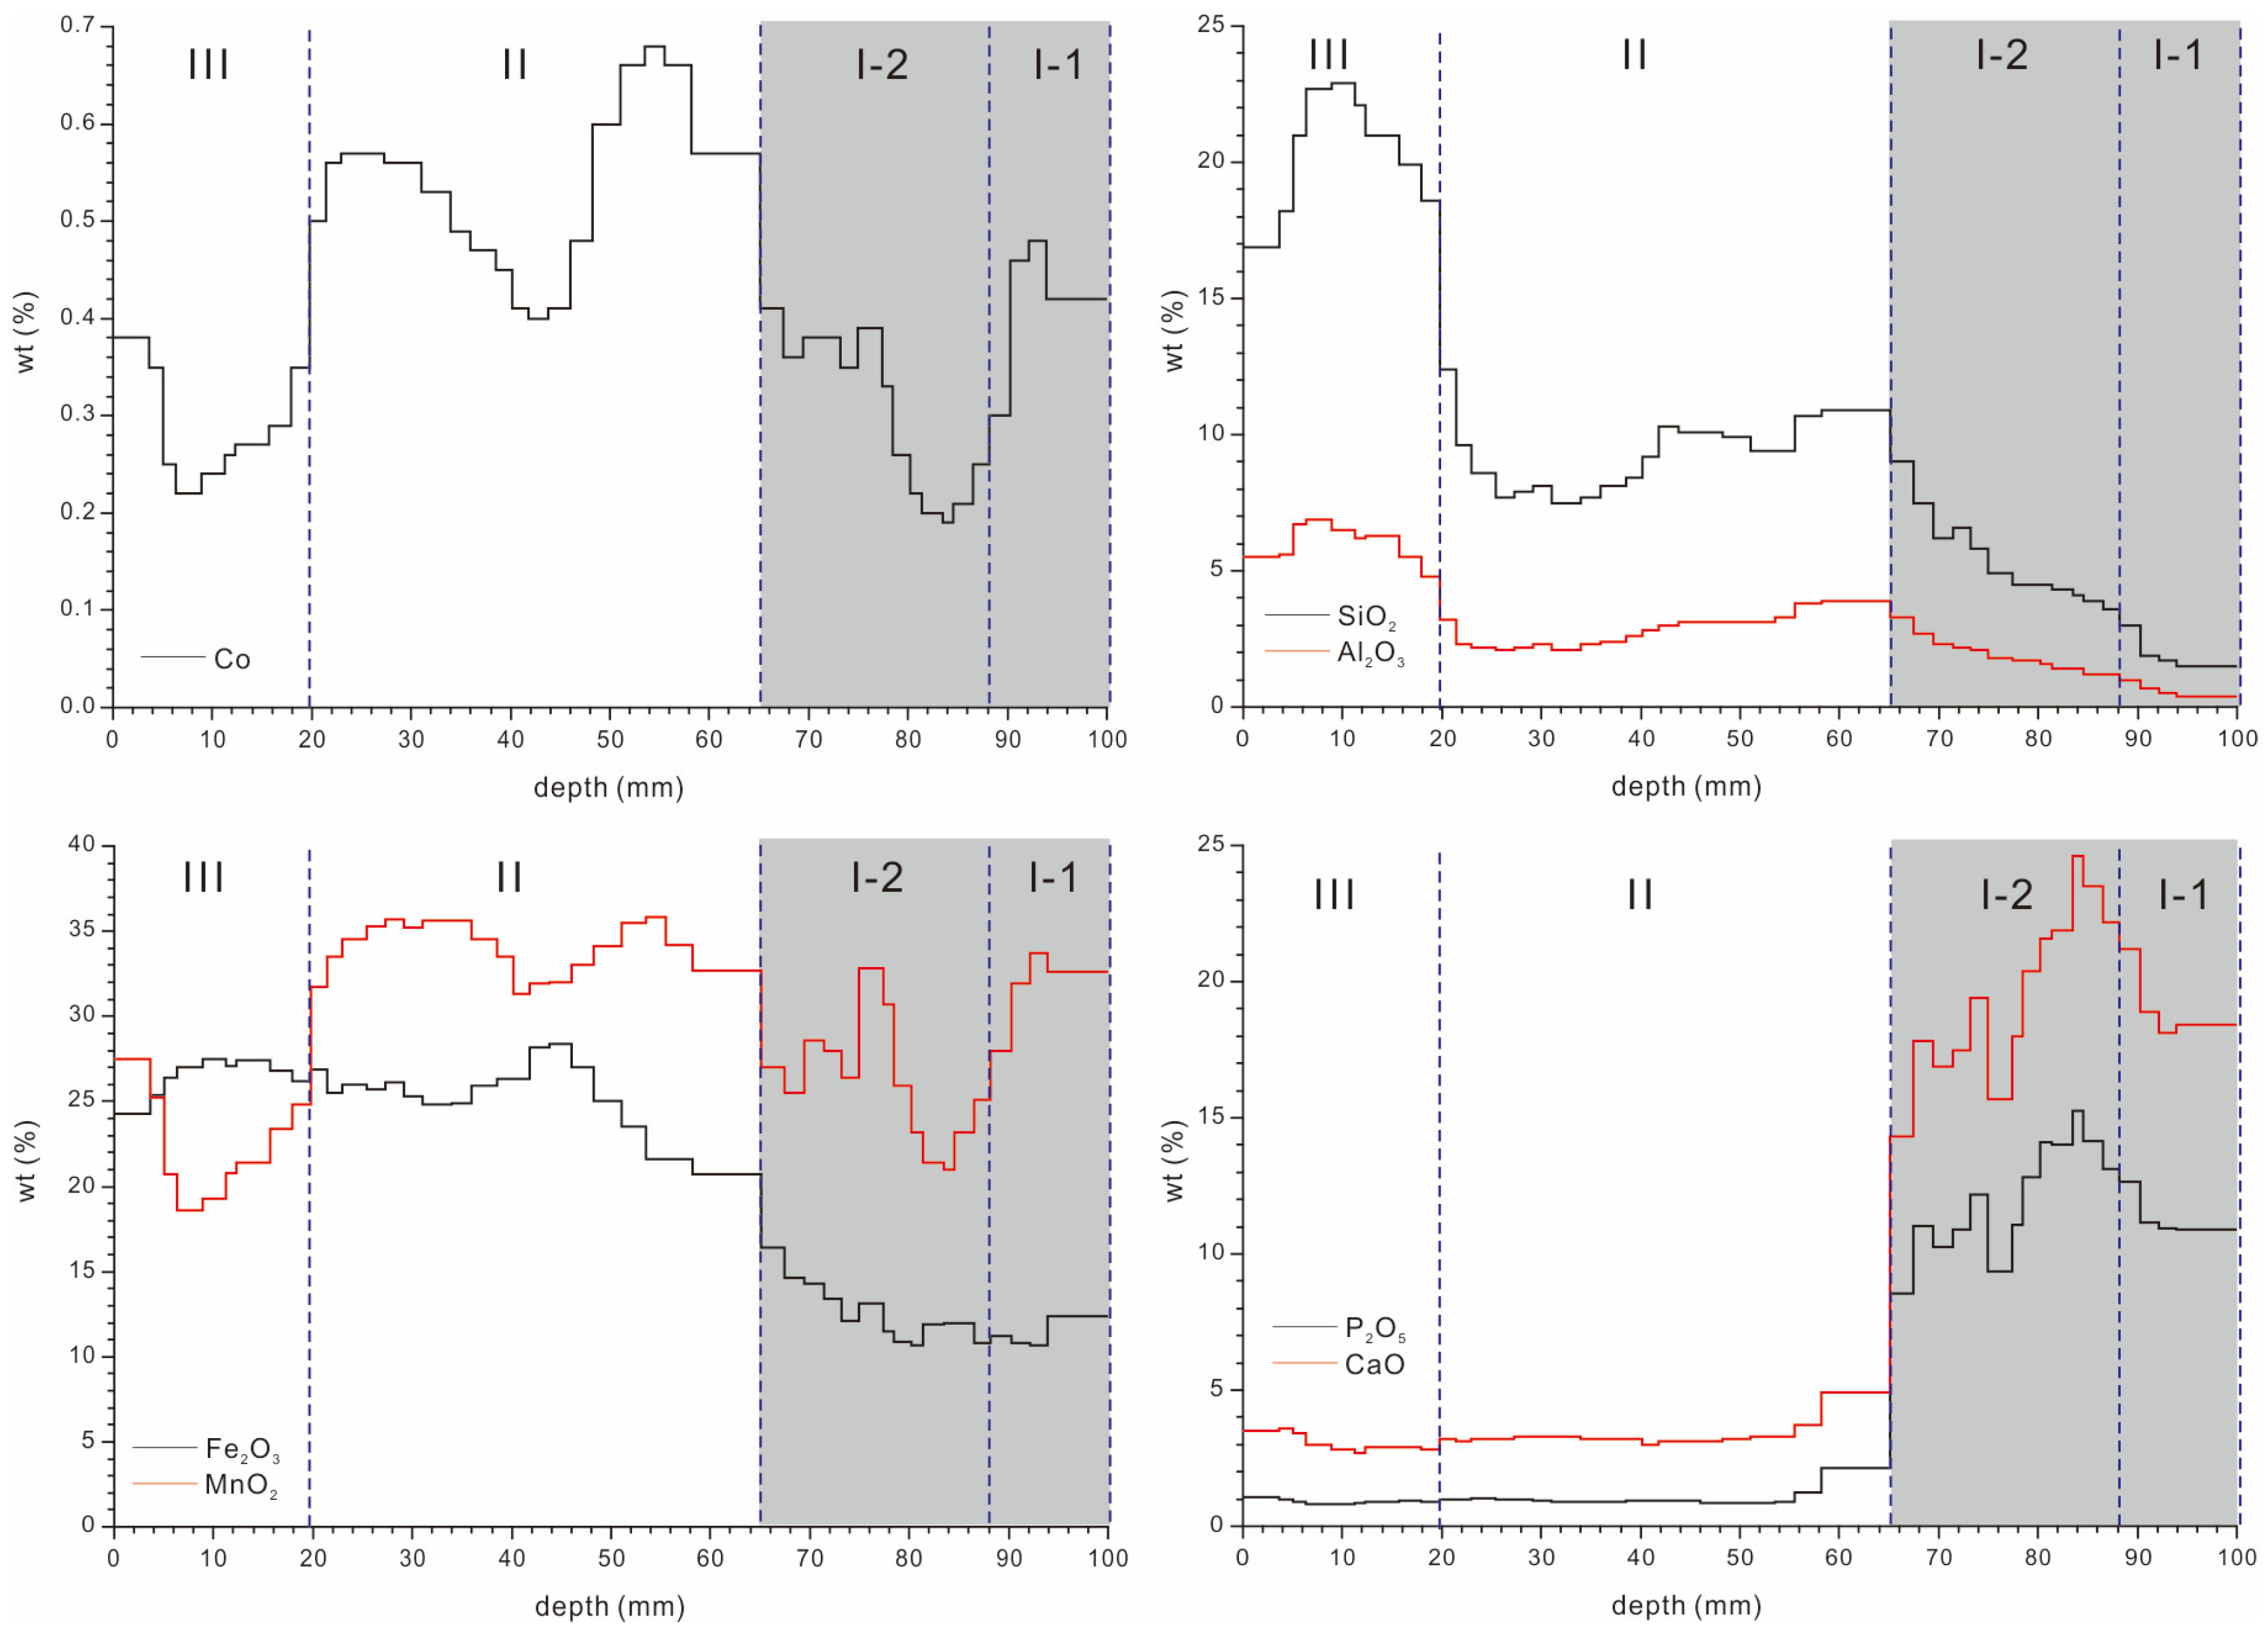
The concentration of major elements in the section of MKD23B-3 shows large variations (Figure 3). The SiO2 concentration varies from the lowest value of 1.5% in layer I-1 to the highest value of 22.9% in layer III. Al2O3 shows a similar variation trend as SiO2 and increases from 0.4% in layer I-1 to 6.9% in layer III.
Figure 3.
Profiles showing the distributions of seven major elements with depth in the crust based on 45-point analyses by ICP-OES along a vertical transect through the crust MKD23B-3. Shadow area are the phosphatized crustal layers.
The CaO and P2O5 concentrations show a distinct variation boundary from layer II to layer I-2. In layers III and II, the CaO concentration is nearly constant and varies from 2.7% to 3.7% if the subsample MKD23B-3-55 is excluded, which is the boundary layer adjacent to layer I-2. The P2O5 concentration in layer III and II varies from 0.83% to 1.23% if MKD23B-3-55 is excluded. The average concentration is 3.1% and 3.4% for CaO in layers III and II, and 0.93% and 1.04% for P2O5, respectively, while in layers I-2 and I-1, the average CaO increased to 19.5% and 19.1%, and the average P2O5 increased to 12.06% and 11.41%.
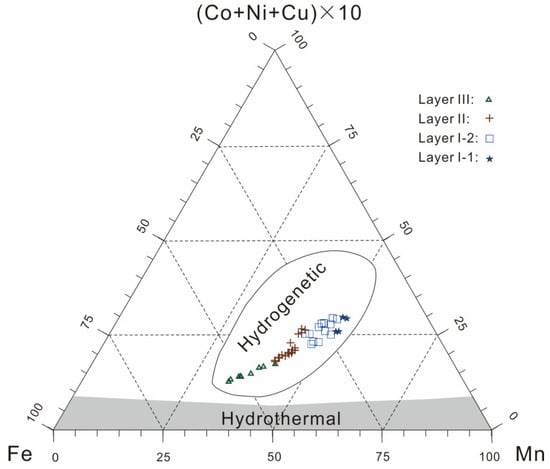
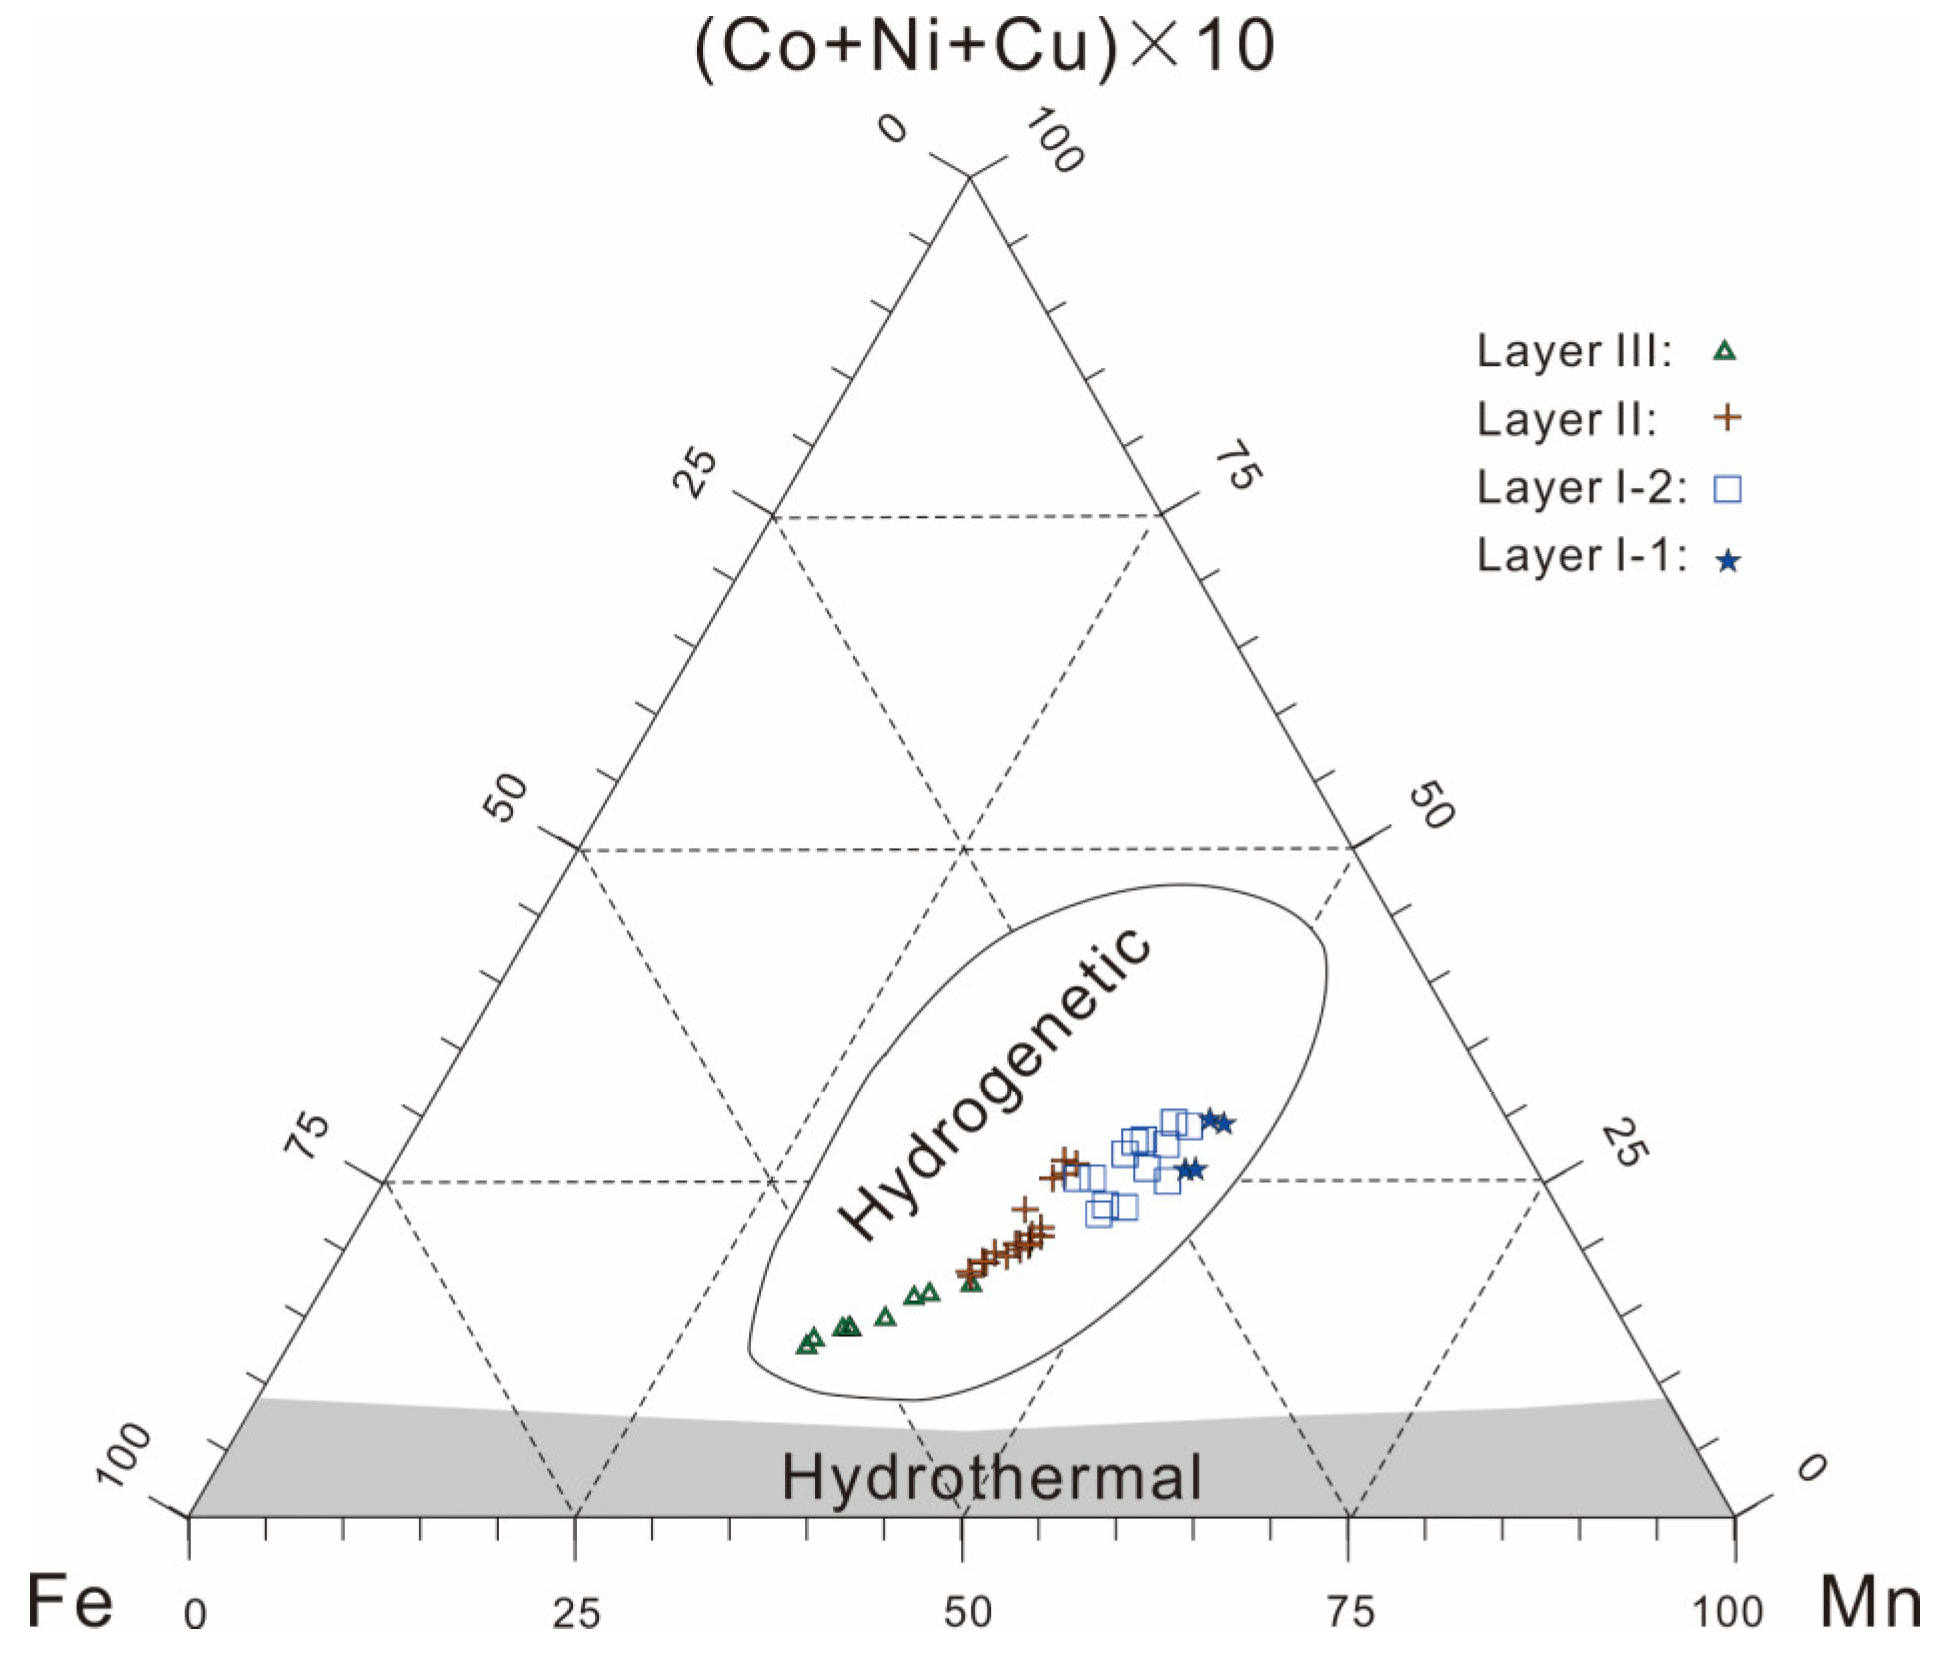
The average Fe2O3 concentration decreased significantly from 26.4% in layer III and 25.2% in layer II, to 12.6% in layer I-2 and 11.3% in layer I-1. The average MnO2 concentration shows a complex variation trend and is 22.4%, 34.0%, 26.1%, and 31.5% in layers III, II, I-2, and I-1, respectively. The average Co concentrations in older layers I-1 and I-2 are 0.41% and 0.30%, respectively, whereas the average Co concentrations in younger layers II and III are 0.53% and 0.29%. The transition element concentrations, including Mn, Fe, Co, Ni, and Cu, in the Fe-Mn crust MKD23B-3 (Figure 4) exhibit the characteristics of hydrogenetic Fe-Mn deposits. The plots show a trend toward the Fe end member from layer I-1 to layers I-2, II and III, which is consistent with the variation in Fe2O3 in the cross-section.
Figure 4.
The transition element concentrations along the section of crust MKD23B-3 from Skornyakova Guyot plotted on the Ternary discriminative diagram for genetic classification of marine ferromanganese deposits from Bonatti et al. [22].
In summary, the characteristics of minerals and major elements in crust MKD23B-3 suggest that this crust is hydrogenetic in origin and layers I-1 and I-2 were phosphatized.
4. Discussion
4.1. Depletion of Co in Phosphatized Crustal Layers
The variation trend in the Co concentration in the cross-section of crust MKD23B-3 is complicated, and the curve shows four peaks separated by three valleys (Figure 3). The average Co concentrations are similar in unphosphatized layer III and phosphatized layer I-2, and are 0.29% and 0.30%, respectively. Those data do not show the discrepancy in the Co concentration, and are inconsistent with the data from bulk samples [21], which indicates the Co concentration might not be controlled solely by phosphatization.
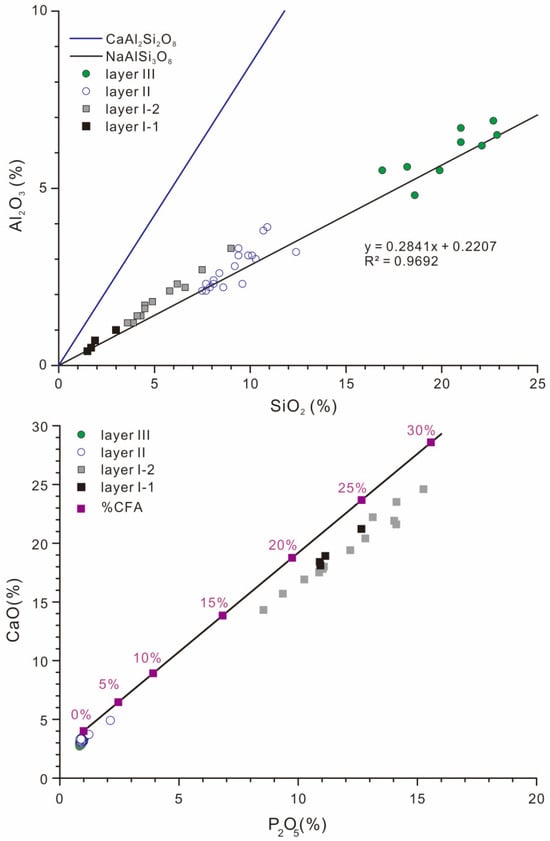
In crust MKD23B-3, SiO2 and Al2O3 show a significant linear positive correlation, and the correlation coefficient R2 is as high as 0.9692 (Figure 5). Furthermore, Figure 5 also shows that the plots of SiO2 vs. Al2O3 are close to albite (NaAlSi3O8). Combined with the XRD data, we are inclined to believe that most of the SiO2 and Al2O3 in this crust resides in albite, and a little SiO2 resides in quartz and/or opal. In layers I-1 and I-2, the P2O5 is correlated with CaO positively, with a high R2 of 0.96, and the ratio of P2O5 vs. CaO close to Ca10(PO4)5CO3F1.5(OH)0.5 (Figure 5). The XRD patterns of layers I-1 and I-2 also show significant peaks at 2.8 Å (100) (Figure 2). We suggest that the P and Ca in this crust reside in carbonate fluorapatite (CFA), which is consistent with the conclusion by Wu et al. [23] and Pan et al. [24]. The average Co concentration in CFA is 32.8 μg/g [25]. Therefore, the elements such as Si, Al, Ca, and P could dilute the Co concentrations in crusts significantly.
Figure 5.
Correlation diagrams of Al2O3 vs. SiO2 (upper panel) and P2O5 vs. CaO (lower panel). For the diagram of P2O5 vs. CaO (lower panel), CaO = 2.3133 + 1.6867 P2O5, and CFA wt% = 3.4305 (P2O5 − 1) [16].
The dilution effects from detrital minerals played a significant role in diluting Co concentrations in ferromanganese deposits, which was also evidenced by the depletion of Co concentrations in hydrogenetic nodules in marginal seas [26]. The Co concentrations in hydrogenetic nodules from the western Pacific, from the Philippine Basin, and from the South China Sea show a decreasing trend [26] closer to Asia, where the sediment is the source of Asian eolian dust [27].
4.2. Effects of Mn Mineral Transformation on the Depletion of Co
The transition from Fe-vernadite to todorokite during phosphatization results in the depletion of Co in Fe-Mn crusts [20,28], and other factors might be involved. If the depletion of Co results solely from the transition of Mn minerals from Fe-vernadite to todorokite, subsample MKD23B-3-77 will have the highest todorokite concentrations relative to other subsamples, and consequently this is highly possible to be detected by XRD.
The lowest and highest Co concentrations (normalized by MnO2 to 100% to exclude dilution effects) in unphosphatized layers II and III are recovered in subsamples MKD23B-3-07 and MKD23B-3-53, which are 1.17% and 1.93%, respectively. We chose the two layers to assess the range of todorokite for MKD23B-3-77. If the Co concentration in MKD23B-3-77 decreases from 1.17% or 1.93% to 0.88%, 25%–54% Fe-vernadite is required to be reduced and then transformed into todorokite. Given the MnO2 of MKD23B-3-77 is 21%, 5.25%–11.34% todorokite is expected to appear in the subsample of MKD23B-3-77, which would be identifiable by X-ray diffraction within the detection limit of 5%. However, any detectable peak cannot be identified from the XRD curve of MKD23B-3-77 (Figure 2).
Qian et al. [29] reported that, after drying at room temperature for 24 h and at 105 °C for 5 h, the 10 Å peak of todorokite (10 Å manganate) in polymetallic nodules weakened and the peak of 7 Å manganate strengthened. Neither the peak at 7 Å nor the peak at 10 Å could be distinguished from the background of the XRD curve of MKD23B-3-77 (Figure 2). This evidence suggests that the todorokite detectable by XRD does not occur in MKD23B-3-77, which indicates that the depletion of Co in this layer may not result solely from the transformation of Fe-vernadite to todorokite during phosphatization.
Hein [4] showed that, if offshore California samples are excluded, only 2% of the 640 X-ray diffraction analyses carried out by the U.S. Geological Survey on Pacific crusts contain todorokite, which suggests that the occurrence of todorokite in the crusts in the Pacific is rare or too low to be detected by XRD, although the phosphatization of thick crusts in the Pacific is ubiquitous. This is also validated by the data of Koschinsky et al. [20], which reported the todorokite is identified mostly in the phosphatized generation of crusts, and the todorokite is mostly less than 1%.
The intensity of the phosphatization of ferromanganese crusts resulted from the quantity of entrained biological carbonate particles and crust porosity/permeability [30], which is also demonstrated by the texture of crust MKD23B-3 in layers I-1 and I-2. Relative to layer I-1, layer I-2 contains more CFA and was more intensely phosphatized (Figure 2, Figure 3 and Figure 5), whereas todorokite cannot be identified from XRD patterns either in layer I-1 or in layer I-2. This indicates that the precipitation of CFA in the crustal layers might decouple from the mineral transition from Fe-vernadite to todorokite during phosphatization.
Based on above analysis, we suggest that the depletion of Co in the phosphatized layer of crust MKD23B-3 cannot be constrained solely by the mineral transition from Fe-vernadite to todorokite during phosphatization. Other factors need to be take into consideration for the variation in Co concentration, such as the diffusivity of Co ions in seawater, seawater temperature, which controls the diffusivity, the Co ion concentration in seawater, the diffusion distance of Co ions near the interface of seawater and Fe-Mn crusts, the thickness of one molecular layer, growth rate, and specific surface area of Fe-Mn crusts [19,31], as well as the dilution effects from CFA.
5. Conclusions
A Co-rich ferromanganese crust MKD23B-3 from Magellan Seamount Cluster is hydrogenetic in origin, and the older layers I-1 and I-2 were phosphatized. The dilution effect from elements such as Al, Si, Ca, P and Fe is one of the major controls for Co concentration in crusts. CFA exerted a dilution effect on the depletion of Co in the phosphatized crustal layer. The todorokite concentration at a lower-than-expected value suggests that most of the depletion of Co in the phosphatized crust cannot be attributed solely to phosphatization, and other controls need to be involved.
Author Contributions
X.R.: Funding acquisition, conceptualization of ideas, writing—original draft, writing—review, and editing. S.Y.: Data curation and visualization. A.Z.: Methodology and analyzing samples. G.Y.: Data visualization. J.Y.: Investigation. J.W.: Investigation. D.D.: Supervision. All authors have read and agreed to the published version of the manuscript.
Funding
This work was financially supported by The National Key R&D Program of China (No. 2025YFF0517001); the Marine S&T Fund of Shandong Province for Laoshan State Laboratory (No. LSKJ202203600-2); and the China Ocean Mineral Resources R&D Association project (No. DY125-13-R-06).
Data Availability Statement
Data are contained within the article.
Acknowledgments
We thank the captains and crews of the R/V Haiyangsihao, and the science party members of the Chinese Dayang Cruise. The crust sample in this study was provided by the China Ocean Sample Repository.
Conflicts of Interest
The authors declare no conflicts of interest.
References
- Morgan, C.L. Resource Estimates of the Clarion-Clipperton Manganese Nodule Deposits. In Handbook of Marine Mineral Deposits; Cronan, D.S., Ed.; CRC Press: Boca Raton, FL, USA, 2000; pp. 145–170. [Google Scholar] [CrossRef] [Scilit]
- Kuhn, T.; Bau, M.; Blum, N.; Halbach, P. Origin of negative Ce anomalies in mixed hydrothermal-hydrogenetic Fe-Mn crusts from the Central Indian Ridge. Earth Planet. Sci. Lett. 1998, 163, 207–220. [Google Scholar] [CrossRef] [Scilit]
- Moorby, S.A.; Cronan, D.S.; Glasby, G.P. Geochemistry of hydrothermal Mn-oxide deposits from the S.W. Pacific island arc. Geochim. Cosmochim. Acta 1984, 48, 433–441. [Google Scholar] [CrossRef] [Scilit]
- Hein, J.R. Cobalt-rich ferromanganese crusts: Global distribution, composition, origin and research activities. In Proceedings of the International Seabed Authority Workshop on Minerals Other Than Polymetallic Nodules of the International Seabed Area, Kingston, Jamaica, April 2004; pp. 188–256. [Google Scholar]
- Asavin, A.M.; Kubrakova, I.V.; Melnikov, M.E.; Tyutyunnik, O.A.; Chesalova, E.I. Geochemical Zoning in Ferromanganese Crusts of Ita-Mai-Tai Guyot. Geochem. Int. 2010, 48, 423–445. [Google Scholar] [CrossRef] [Scilit]
- Mel’nikov, M.E.; Pulyaeva, I.A. Ferromanganese Crusts of the Markus-Wake and Magellan Seamounts of the Pacific Ocean: Structure, Composition, and Age. Tikhookean. Geol. 1994, 4, 13–27. [Google Scholar]
- Glasby, G.P.; Ren, X.W.; Shi, X.F.; Pulyaeva, I.A. Co-rich Mn crusts from the Magellan Seamount Cluster: The long journey through time. Geo-Mar. Lett. 2007, 27, 315–323. [Google Scholar] [CrossRef] [Scilit]
- Mel’nikov, M.E.; Ponomareva, I.N.; Tugolesov, D.D.; Rozhdestvenskii, V.K. Results of Drilling of Cobalt-Bearing Manganese Crusts on Guyots of the Magellan Seamounts (Pacific Ocean). Tikhookean. Geol. 2005, 24, 36–49. [Google Scholar]
- Ren, X.W.; Pulyaeva, I.; Lu, H.H.; Shi, X.F. Calcareous Nannofossil Biostratigraphy of a Co-Rich Ferromanganese Crust from Seamount MK of Magellan Seamount Cluster. Earth Sci. Front. 2017, 24, 276–296. (In Chinese) [Google Scholar]
- Yang, Y.Z.; Xiao, B.; Shi, X.F.; Zhang, S.L. Unusual Cobalt Behaviors and Enrichment in Cobalt-Rich Crust from the Magellan Seamounts in the Western Pacific. Ore Geol. Rev. 2024, 173, 106234. [Google Scholar] [CrossRef] [Scilit]
- Novikov, G.V.; Sedysheva, T.E.; Bogdanova, O.Y.; Lobus, N.V. Cobalt-Rich Ferromanganese Crusts of the Kotzebue Guyot of the Magellan Seamount of the Pacific Ocean: Conditions of Occurrence, Mineralogy, and Geochemistry. Oceanology 2022, 62, 879–889. [Google Scholar] [CrossRef] [Scilit]
- Novikov, G.V.; Melnikov, M.E.; Bogdanova, O.Y.; Drozdova, A.N.; Lobus, N.V. Mineralogy and Geochemistry of Co-Bearing Manganese Crusts from the Govorov and Volcanologist Guyots of the Magellan Seamounts (Pacific Ocean). Oceanology 2017, 57, 716–722. [Google Scholar] [CrossRef] [Scilit]
- Yang, K.H.; Ma, W.L.; Zhang, W.Y.; Li, Z.G.; He, G.W.; Li, X.H.; Qiu, Z.Y.; Wang, H.; Zhao, B.; Yang, Y.; et al. Geological and Geochemical Characteristics of Shallow-Buried Ferromanganese Crusts from Weijia Guyot and Their Resource Potential. Mar. Geol. 2023, 464, 107119. [Google Scholar] [CrossRef] [Scilit]
- Novikov, G.V.; Lobkovsky, L.I.; Lobusa, N.V.; Bogdanova, O.Y.; Sedysheva, T.E. Ore Content of Co-Rich Ferromanganese Crust of the Govorov Guyot of the Magellanic Mountains of the Pacific Ocean. Dokl. Earth Sci. 2021, 499, 675–682. [Google Scholar] [CrossRef] [Scilit]
- Yang, K.H.; Park, H.; Son, S.K.; Baik, H.; Park, K.; Kim, J.; Yoon, J.; Park, C.H.; Kim, J. Electron Microscopy Study on the Formation of Ferromanganese Crusts, Western Pacific Magellan Seamounts. Mar. Geol. 2019, 410, 32–41. [Google Scholar] [CrossRef] [Scilit]
- Peretyazhko, I.S.; Savina, E.A.; Pulyaeva, I.A. Cobalt-Rich Fe-Mn Crusts in the Western Pacific Magellan Seamount Trail: Geochemistry and Chronostratigraphy. Geosciences 2025, 15, 411. [Google Scholar] [CrossRef] [Scilit]
- Wang, L.Z.; Zeng, Z.G. The Geochemical Features and Genesis of Ferromanganese Deposits from Caiwei Guyot, Northwestern Pacific Ocean. J. Mar. Sci. Eng. 2022, 10, 1275. [Google Scholar] [CrossRef] [Scilit]
- Park, J.; Hwang, H.; An, Y.; Yang, K. High-Resolution Reconstruction of Oxidation–Reduction Conditions: Raman Spectroscopy and μ-XRF Analysis of Manganese Nodule and Crust on Tabletop of Western Pacific Magellan Seamounts. Minerals 2024, 14, 1135. [Google Scholar] [CrossRef] [Scilit]
- Ren, X.W.; Hein, J.R.; Yang, Z.Z.; Xing, N.; Zhu, A.M. Controls on cobalt concentrations in ferromanganese crusts from the Magellan seamounts, west Pacific. Front. Mar. Sci. 2024, 11, 1489943. [Google Scholar] [CrossRef] [Scilit]
- Koschinsky, A.; Stascheit, A.; Bau, M.; Halbach, P. Effects of phosphatization on the geochemical and mineralogical composition of marine ferromanganese crusts. Geochim. Cosmochim. Acta 1997, 61, 4079–4094. [Google Scholar] [CrossRef] [Scilit]
- Puteanus, D.; Halbach, P. Correlation of Co Concentration and Growth Rate—A Method for Age Determination of Ferromanganese Crusts. Chem. Geol. 1988, 69, 73–85. [Google Scholar] [CrossRef] [Scilit]
- Bonatti, E.; Kraemer, T.; Rydell, H.S. Classification and genesis of iron-manganese deposits. In Ferromanganese Deposits on the Ocean Floor; Horn, D.R., Ed.; National Science Foundation: Washington, DC, USA, 1972; pp. 149–166. [Google Scholar]
- Wu, G.H.; Zhou, H.Y.; Ling, H.F.; Zhang, W.L. Phosphorites in Co-rich crusts and their palaeooceanographic significance. Acta Mineral. 2005, 25, 39–44. (In Chinese) [Google Scholar]
- Pan, J.H.; Liu, S.Q.; Luo, Z.H.; You, G.Q. Modes of occurrence and characteristics of phosphorates on Pacific Guyots and their genetic significance. Miner. Depos. 2007, 26, 195–203. (In Chinese) [Google Scholar]
- Pan, J.H.; Liu, S.Q.; Yang, Y.; Liu, X.Q. Research on geochemical characteristics of major, trace and rare-earth elements in phosphates from the west Pacific Seamounts. Geol. Rev. 2002, 48, 534–541. (In Chinese) [Google Scholar]
- Ren, J.B.; Yang, Y.; Zhang, L.X.; Zhang, L.M.; Deng, Y.N.; Ren, Y.Z.; Hong, S.; Ma, J.F.; Deng, X.Z.; Yu, M.; et al. Discovery of Dense Ferromanganese Nodules in the Central Basin of the South China Sea: Insights into Metallogenesis Processes and Resource Potential. Geophys. Res. Lett. 2025, 52, e2025GL115849. [Google Scholar] [CrossRef] [Scilit]
- Zhang, Q.; Roberts, A.P.; Yao, Z.Q.; Shi, X.F.; Hao, Q.Z.; Ju, L.X.; Tang, X.; Liu, J.X.; Liu, S.C.; Liu, Q.S. Does Eolian Flux to the North west Pacific Ocean Reflect Persistent Asian Interior Aridity on Orbital Time scales? Geophys. Res. Lett. 2025, 52, e2024GL112599. [Google Scholar] [CrossRef] [Scilit]
- Huang, S.; Fu, Y. Enrichment characteristics and mechanisms of critical metals in marine Fe-Mn crusts and nodules: A review. Minerals 2023, 13, 1532. [Google Scholar] [CrossRef] [Scilit]
- Qian, J.C.; Chu, F.Y.; Feng, X.W. The main manganates in the polymetallic nodules and their correlations. Acta Mineral. 2006, 26, 152–158, (In Chinese with English abstract). [Google Scholar]
- Benites, M.; Hein, J.R.; Mizell, K.; Jovane, L. Miocene phosphatization of rocks from the summit of Rio Grande Rise, Southwest Atlantic Ocean. Paleoceanogr. Paleoclimatol. 2021, 36, e2020PA004197. [Google Scholar] [CrossRef] [Scilit]
- Halbach, P.; Segl, M.; Puteanus, D.; Mangini, A. Co-fluxes and growth rates in ferromanganese deposits from central Pacific seamount areas. Nature 1983, 304, 716–719. [Google Scholar] [CrossRef] [Scilit]

Disclaimer/Publisher’s Note: The statements, opinions and data contained in all publications are solely those of the individual author(s) and contributor(s) and not of MDPI and/or the editor(s). MDPI and/or the editor(s) disclaim responsibility for any injury to people or property resulting from any ideas, methods, instructions or products referred to in the content. |
© 2026 by the authors. Licensee MDPI, Basel, Switzerland. This article is an open access article distributed under the terms and conditions of the Creative Commons Attribution (CC BY) license.