Article

Environmental Geochemistry of Sulfide-Bearing Iron Oxide Deposits in Scandinavia: Importance of Gangue Minerals and Sulfide Crystallinity in the Delay of Acid Generation

1
SRK Consulting (UK) Limited, Churchill House, 17 Churchill Way, Cardmliff CF10 2HH, UK
2
WSP, Blagnac, 31700 Toulouse, France
3
Mining Remediation Authority, 200 Lichfield Lane, Mansfield NG18 4RG, UK
4
Geochemic Ltd., WalesTy Cyd 2, Gilchrist Thomas Industrial Estate, Blaenavon NP4 9RL, UK
5
Petrolab Limited, C EdwARDMLs Offices, Gweal Pawl, Redruth TR15 3AE, UK
6
Kaunis Iron, Stationsgatan 46 SE, 972 33 Luleå, Sweden
7
Hannukainen Mining Oy, Hallitie 2, 95900 Kolari, Finland
*
Author to whom correspondence should be addressed.
Minerals 2026, 16(2), 171; https://doi.org/10.3390/min16020171
Submission received: 4 January 2026 / Revised: 27 January 2026 / Accepted: 28 January 2026 / Published: 3 February 2026
(This article belongs to the Special Issue Acid Mine Drainage: A Challenge or an Opportunity?)

Abstract

Sulfide-bearing iron oxide deposits consisting of magnetite and silicates are common within the greenstones of north-west Finland and northern Sweden. These iron oxide deposits have variable copper, gold, and uranium content and occur in association with tuffite, black schist, and dolomitic marble. The deposits have a resource size of up to 145 Mt and an iron content of 35%–50% (e.g., Stora Sahavaara). The total sulfur content of these deposits is typically in the range of 1%–5% but can have exceptional values up to 20.8%, and disseminated pyrite, pyrrhotite, and chalcopyrite are commonly present. The prediction of acid rock drainage and metal leaching potential requires a detailed understanding of the site-specific rates and mechanisms of weathering. This has been obtained through geochemical (multi-element analysis and acid–base accounting) and mineralogical characterization testing undertaken on representative materials, including multi-element analysis, acid–base accounting, net acid generation testing, and humidity cell testing. Despite the high sulfide content and low neutralizing potential of most rock types found in these deposits, the humidity cell tests showed a delayed onset to acid generation, which is primarily attributed to sulfide crystallinity and mafic silicate dissolution leading to slow oxidation and reaction rates. The need for long-term kinetic testing is evident from the Hannukainen amphibole and schist rock types. This study provides an overview of the environmental geochemistry of the skarn-hosted sulfide-bearing iron oxide deposits in Scandinavia. These deposits show potential for acid generation but due to the buffering reactivity of mafic silicates and the high crystallinity of the sulfides, the rate of acid generation is slow and the onset of these conditions delayed by mineral buffering.

1. Introduction

The weathering and oxidation of sulfide minerals exposed within mine wastes have the potential to result in acid rock drainage and metal(loid) leaching if not managed appropriately [1,2]. Failure to identify the potential for acidic and/or metal(loid)-rich drainage during the early phases of mine planning and development can result in serious environmental liability that greatly complicates and adds to the expense of environmental management, restoration, and site closure. Early-stage geochemical characterization permits the development and application of efficient waste rock management plans and can help determine if mitigation measures are needed during life of mine and post-closure. In addition, a well-planned characterization program enables early identification of inert or non-reactive waste materials that can be used in project development and construction.
One of the primary objectives of a geochemical characterization study is to determine if acid generation will occur and/or if contaminants will be released in contact waters, and to predict the rates at which these processes will occur from each mine waste type. To do this, it is necessary to undertake a series of characterization tests. These tests can generally be classified into two types [3]: (1) Static tests: These are rapid, relatively inexpensive testing procedures that deliver information on the finite characteristics of the waste materials, for example, if the material is potentially acid-forming, if it is enriched in certain elements of concern, what the immediate mobilities of such elements are, and the potential for long-term release of certain elements if the samples are fully oxidized. (2) Kinetic tests: These are laboratory or field column tests that are used to determine the rate at which acidity is generated and solutes are released, which also tend to be more time consuming and expensive.
Static and kinetic geochemical test data can be coupled with information from the mine plan and water balance to develop numerical predictions that assess potential future water quality associated with mine waste storage facilities (e.g., tailings storage facilities and waste rock dumps) [4,5,6]. This typically requires the scaling of laboratory geochemical data to field conditions. Scaling refers to the process by which laboratory data are modified by field parameters to be applicable for comparative purposes or for numerical predictions [6].
These water quality predictions form the basis of environmental and health impact assessment and the mine closure plan. Sulfide-bearing iron oxide deposits consisting of magnetite and silicates are common within the greenstones of north-west Finland and northern Sweden [7,8]. This paper describes the geochemical characterization of four iron ore deposits in the Fennoscandian Shield of Scandinavia: Sahavaara, Tapuli, Pellivuoma, and Hannukainen. These iron oxide deposits have variable copper, gold, and uranium content and occur in association with tuffite, black schist, and dolomitic marble [6,7,8,9,10,11,12,13,14,15,16]. Early recognition of potential water quality risks is particularly important under the pristine environmental conditions of these sites, to allow effective mitigation strategies to be integrated into mine planning and design. The prevailing Sub-Arctic climate also influences water availability and oxidation rates, which has implications for the development of acidic and/or metal(loid) rich drainage. The deposits typically tend to be large and complex in terms of mineralogy and setting and thus make a useful case study in which to evaluate the rate of mineral weathering and the influence this has on the environmental geochemistry of waste rock.
Northern Fennoscandia belongs to the sub-arctic coniferous–mixed forest climate zone and is characterized by temperate summers and cold winters. During the summer months (June–August), temperatures are mostly between 10 °C and 25 °C, and during the winter months (November–April), they range between −5 °C and −30 °C. Snow covers the terrain for an average of 183 days in the year, with the maximum snow thickness varying from 0.6 to 1.2 m in March.

2. Regional Geology

The Fennoscandian Shield is one of the most important mining areas in Europe and forms the most northwesterly part of the East European craton, covering vast extents of Sweden, Finland, and Norway. The northern part of the Shield, including Sweden and Finland, is intensely mineralized and hosts multiple sulfide-bearing iron ore deposits [7,8,9,10,11,12,13]. Major orogenies took place in the Archean and Paleoproterozoic, and the oldest rocks found in the Shield have been dated at 3.5 Ga [8]. Younger Meso- and Neoproterozoic crustal growth took place mainly in the western part; no major iron deposits are related to rocks of this age [9]. Mineral deposits of economic grade are principally restricted to the Paleoproterozoic parts of the Shield, which is intensely mineralized in its northern parts, including Sweden and Finland [12].
The bedrock in this region consists of Archean granitoid gneiss unconformably overlain by Paleoproterozoic supracrustal sequences [17]. The major mineral deposit types in the region include volcanogenic massive sulfide (VMS) deposits, mesothermal (orogenic) gold (Au) deposits, mafic- and ultramafic-hosted chromium (Cr), nickel–copper (Ni-Cu), platinum group element (PGE) deposits, and banded iron formations (BIFs) [9].
In addition to these major deposit types, the Paleoproterozoic part of the Shield is also recognized for its iron (Fe) oxide deposits, including the famous Kiruna-type Fe-apatite deposits. Large-tonnage low-grade copper–gold (Cu–Au) deposits are associated with intrusive rocks in the northern part of the Fennoscandian Shield. These deposits have been described as porphyry style deposits with features that also warrant classification as iron oxide–copper–gold (IOCG) deposits [9,10].
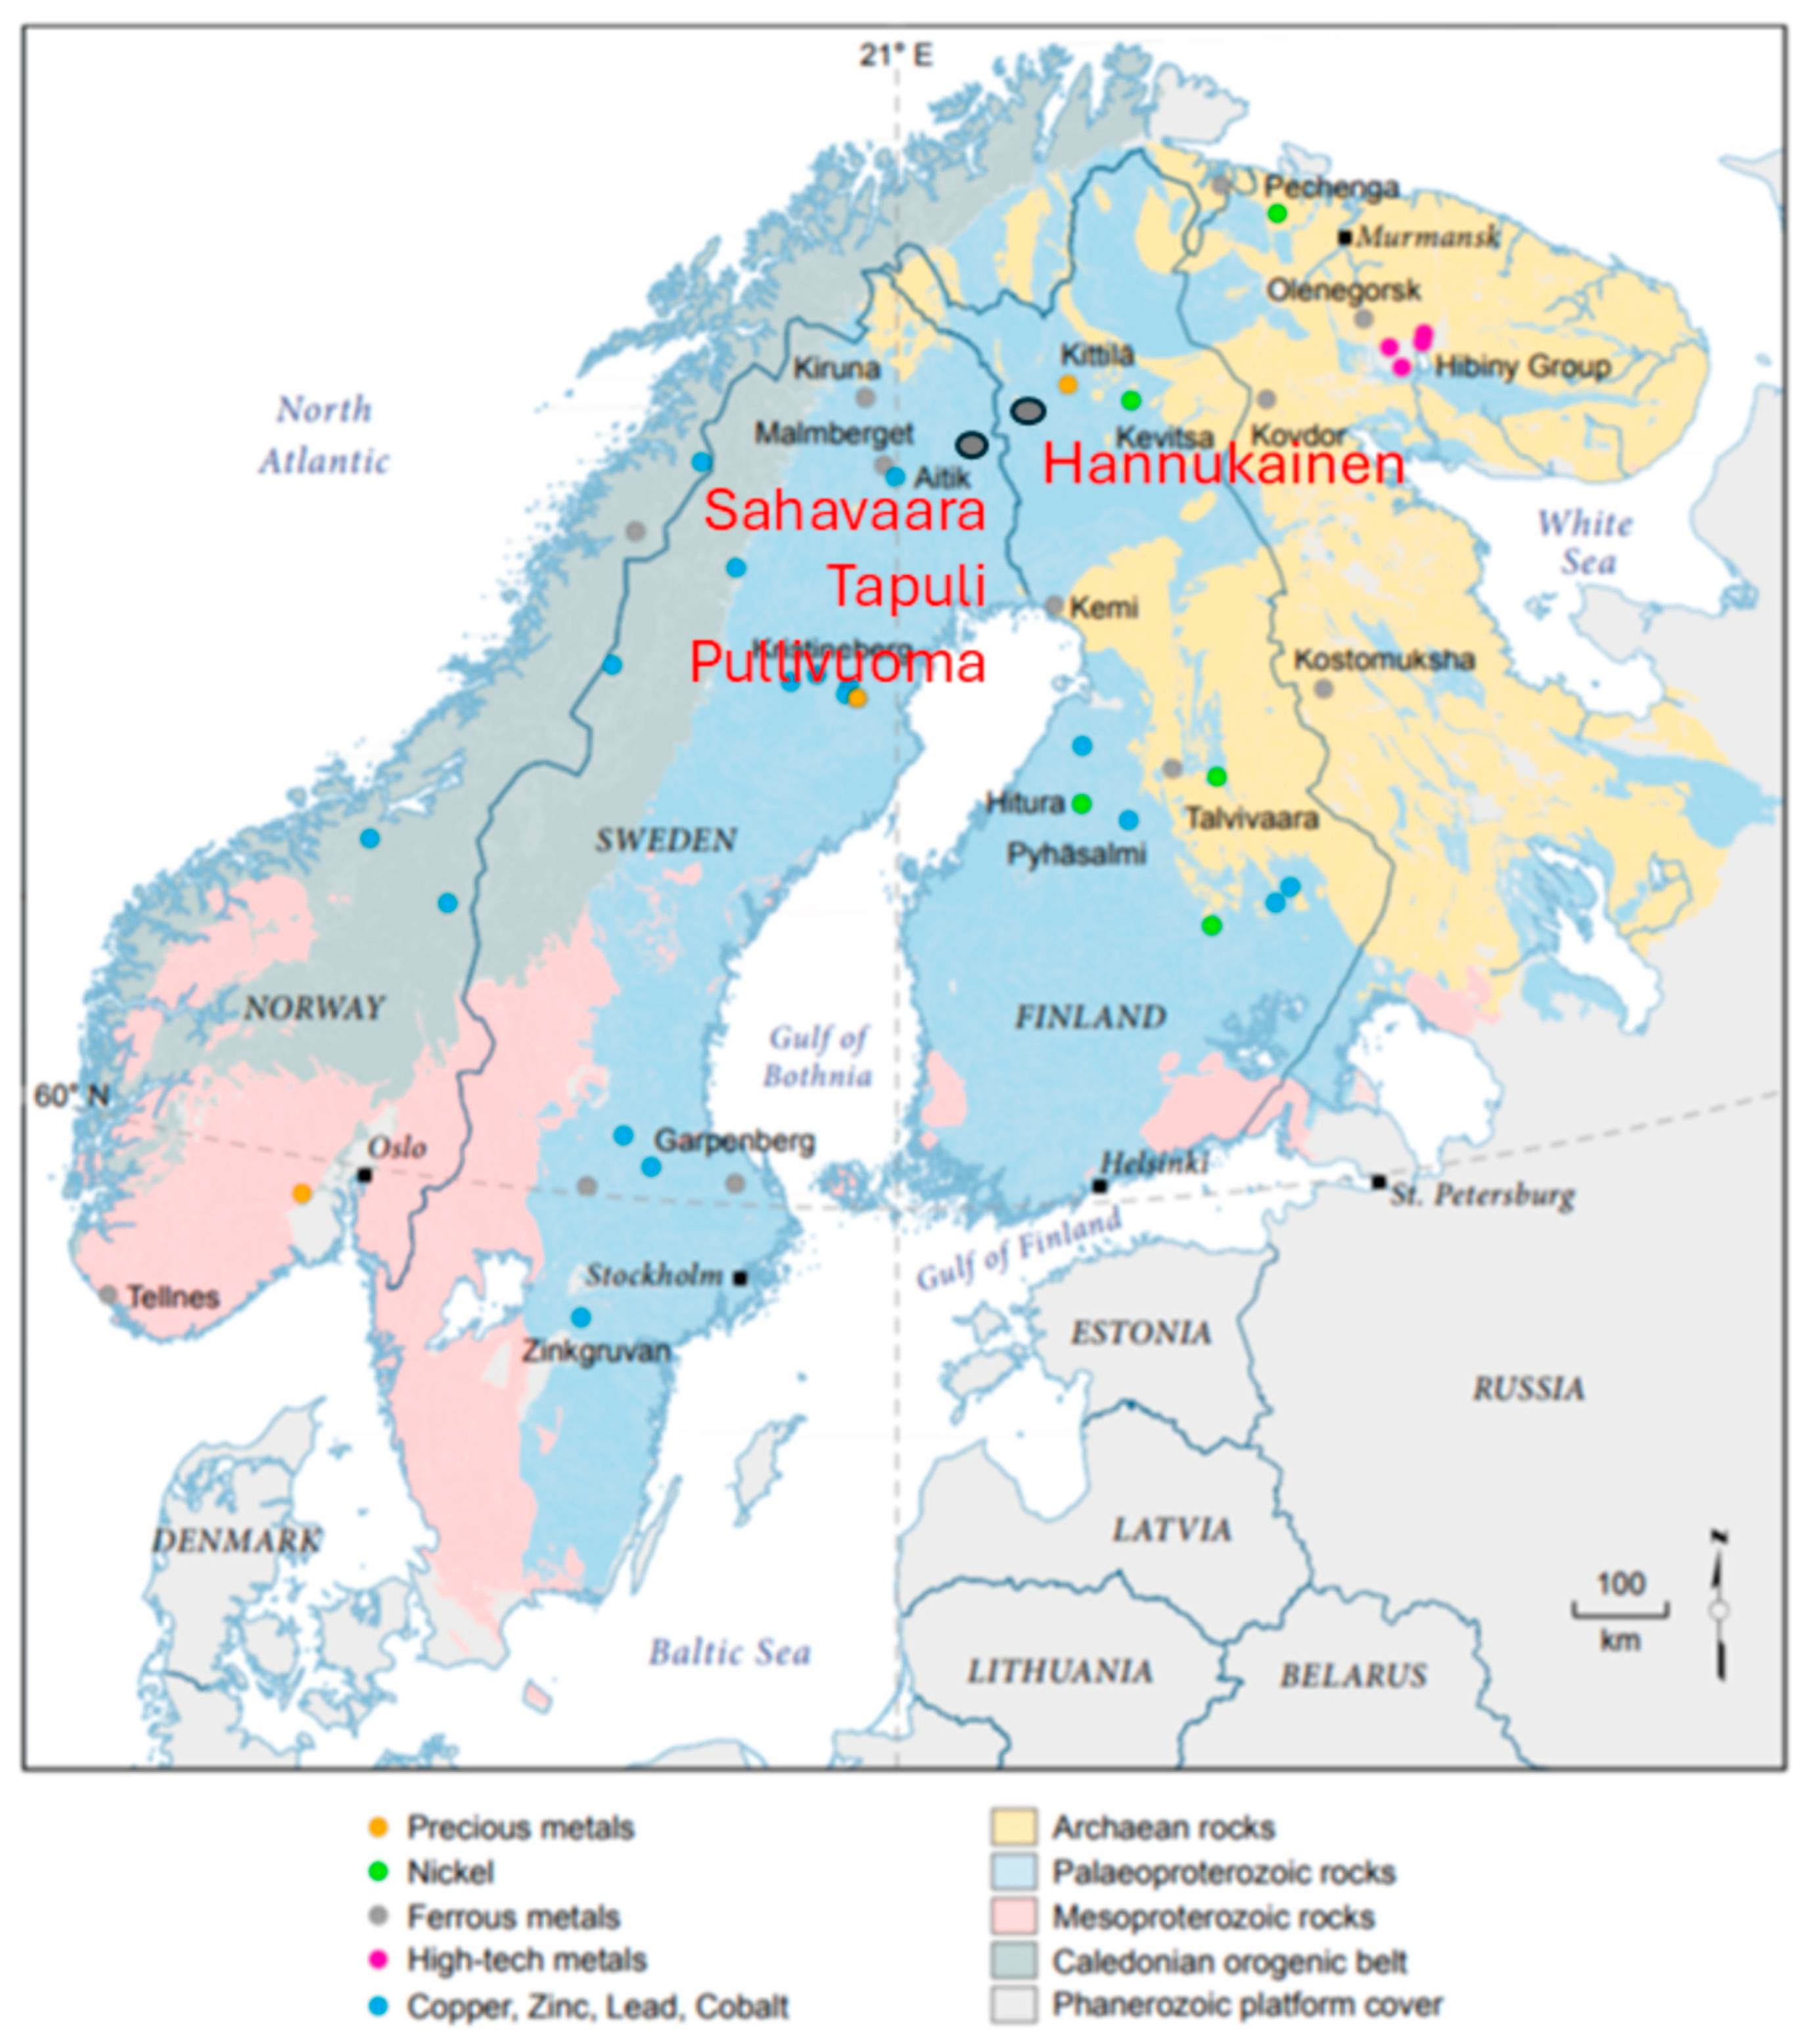
A total of around 25 deposits are known within the Kolari (Finland) and Pajala (Sweden) areas of the Fennoscandian Shield [7]. The iron ore deposits of Sahavaara, Tapuli, and Pellivuoma (collectively known as Kaunisvaara) are in the Pajala region of northern Sweden (Figure 1). The IOGC deposit of Hannukainen is in the Kolari area of north-west Finland. Within the greenstones in northern Sweden and the westernmost part of northern Finland, lens- and irregular-shaped iron occurrences consisting of magnetite, as well as Mg and Ca-Mg silicates, are common [8]. Deposits in the region appear to be spatially associated with oxide- and silicate-facies BIFs. Resources in the region are up to 145 Mt and have an iron content of 35%–50% (e.g., Stora Sahavaara). Disseminated pyrite (FeS2), pyrrhotite (Fe1−xS), and chalcopyrite (CuFeS2) are commonly present, with a total sulfur content up to 5 wt.% [14,15].

3. Local Geology

3.1. Sahavaara, Tapuli and Pellivuoma

The Sahavaara iron ore comprises three lenses of skarn-rich iron formation [11,12]. The Sahavaara deposit is the largest of the known iron deposits in the Pajala area; resources at Stora Sahavaara amount to 145 Mt, with 43.1% Fe and 0.076% Cu [12]. The ore zone consists of serpentine-rich, high-grade magnetite ore, including lenses and layers of serpentine–diopside–tremolite skarn, and is up to 80 m thick [11,12,13]. Pyrrhotite and pyrite occur disseminated in the ore together with minor chalcopyrite; the total sulfur content is in the range of 1–5 wt.%. Other gangue minerals include phlogopite, diopside, chlorite, talc, valleriite, graphite, scapolite, vesuvianite, and apatite.
The Tapuli deposit is located about 3.5 km NE of the Stora Sahavaara deposit. The stratabound planar structure of the Tapuli deposit hosts Precambrian supracrustal sedimentary rocks. Proven and probable reserves are estimated at 164.9 Mt, graded at 32.74% Fe [14]. The Tapuli deposit contains high-grade magnetite and low-grade chalcopyrite, pyrite, pyrrhotite, and tochilinite. The deposit is the second largest by tonnage in the Kaunisvaara subarea but has a lower Fe grade than Hannukainen [14,15,16].
The supracrustal sequence at Pellivuoma consists of quartzites, dolomitic marbles, black schists, mica schists, and mafic volcanic rocks, with minor phyllites and quartz-rich phyllites. The main iron ore mineral is magnetite. In addition, small amounts of copper and cobalt are bound in sulfide minerals, but these are of minor economic significance. Resources at Pellivuoma are 87.4 Mt, with 29.9% Fe, 0.19% Mn, and 0.47% S [15].

3.2. Hannukainen

Iron ore deposits such as Hannukainen in the Kolari district of north-west Finland contain significant amounts of copper and gold, hence its classification as an IOCG deposit [15,16,18]. The ore is hosted by diopside skarn and quartz–albite rocks. The hanging wall of the deposit is formed of a variably altered diorite intrusion and mafic metamorphosed volcaniclastics. Mica gneiss, quartzite, and quartz feldspar schist comprise the footwall rocks [12]. The typical ore mineral association at Hannukainen is magnetite, chalcopyrite, pyrite, and pyrrhotite with molybdenite and uraninite [12]. In places, the amount of pyrrhotite exceeds that of pyrite. Native gold occurs in silicate gangue and as inclusions in sulfides and magnetite [12].
The Hannukainen deposit is the largest known deposit in the Kolari area. The deposit produced 1.96 Mt of iron, 40,000 t of copper, and 4300 kg of gold in 1978–1992, and the present in situ resource estimate is 17.23 t of Au, 393,000 t of Cu, and 73 Mt of Fe. Five lenticular semi-massive ore bodies comprise the Hannukainen deposit: Lauku, Laurinoja, Vuopio, Kuervaara, and Kivivuopio. Of these ore bodies, only Laurinoja and Kuervaara have been partially mined, during 1978–1990 [15].

4. Materials and Methods

4.1. Sample Selection

The goal of geochemical characterization is to develop a geochemical dataset that is spatially and lithologically representative of material types (both waste rock and ore) that will be encountered during mining [17,19]. Geochemical testing is typically undertaken on exploration drill core materials. The availability of assayed material is important as it allows the sample selection to be targeted at rock types that are most representative of the range of compositions encountered within the deposit. Samples are selected based on the abundance of the various waste rock material types, with sampling focusing on rock types that will comprise a greater proportion of waste. The primary material types for the Sahavaara, Tapuli, Pellivuoma, and Hannukainen deposits were delineated from a review of data available from exploration drilling programs including the lithology and assay logs (Table 1). The following sample selection criteria were applied across all deposits: (1) Samples were selected from a drill core that lies within the proposed pit shells or will be in proximity to the anticipated final pit walls. (2) Target sample intervals were selected on the basis of the relative lithological abundance, sulfur content, and spatial distribution. Drill core sulfur assay data were used to determine the range of sulfur concentrations in the various lithological units. This was undertaken to allow selection of samples representative of the range of compositions and concentrations likely to be encountered. (3) Continuous 5–10 m intervals of the drill core were selected to generate representative samples. The 5–10 m interval is designed to provide an average composition for waste rock materials. Potential over- or under-estimation of characteristics may occur from sampling of shorter sections and localized heterogeneity in sulfide or metals content. (4) Each sample interval was restricted to a single lithological unit (e.g., either all marble or all schist), such that an understanding of the geochemical contribution of each lithology within the future waste rock dump(s) and pit walls can be ascertained. (7) Spatial representation of sample intervals was ensured through the use of Leapfrog 3D visualization software package (Version 4.4).

4.2. Testing

Laboratory static and kinetic geochemical characterization tests were undertaken in addition to a mineralogical study to determine the elemental and mineralogical composition of rock types associated with the Sahavaara, Tapuli, Pellivuoma, and Hannukainen deposits, and to understand the leaching behavior of each rock type.

4.2.1. Static Testing

Multi-element analysis was carried out to allow comprehensive geochemical characterization of the samples. The analysis involved an aqua regia digestion followed by Inductively Coupled Plasma Mass Spectrometry (ICP-MS) analysis for a suite of elements. This included determination of major elements (e.g., aluminum, calcium, magnesium, sodium, potassium, iron, sulfur) and trace elements (e.g., zinc, copper, cadmium, lead). The resulting data were assessed using the Geochemical Abundance Index (GAI) to compare the concentration of an element in each sample to the average crustal abundance of that element. GAI values are particularly useful in determining the relative enrichment of elements based on lithology and may be used to identify elements enriched above average crustal concentrations [17,20,21,22]. Elements enriched relative to average crustal concentrations may provide an indication of potentially higher concentrations in contact waters. However, the release of an element into water is a function of many factors, such as solubility, pH, and oxidation conditions, and not just of the solid concentration or enrichment factor.
Acid–base accounting (ABA) evaluates the potential for materials to be net acid-generating or net neutralizing depending on the balance between acid-producing potential and acid-consuming capacity. The technique can be considered as characterizing the ‘total potential reservoir of acidity or alkalinity in a given material’. The approach does not take into account mineralogy, kinetics, grain size, or other influencing factors that control sulfide oxidation and its rate. ABA testing was carried out in order to evaluate the acid-generating potential (AP), based on speciated sulfur analysis, and neutralizing potential (NP) of the samples. AP is characterized by measuring the total sulfur and sulfide sulfur content. The sulfide sulfur content is then converted to a value of AP based on the assumption that all sulfur or sulfide occurs as pyrite. Neutralization potential (NP) was measured by titration following the modified Sobek method [23]. The calculation method from inorganic carbon content assumes that all inorganic carbon occurs as carbonate in a form that will neutralize acidity [19,23].
The difference between acid-generating potential (AP) and neutralizing potential (NP) is referred to as the net neutralization potential (NNP), where NNP = NP − AP. The NNP allows classification of the samples as potentially net acid-consuming or net acid-producing. A positive value of NNP indicates the sample neutralizes more acid than is produced during oxidation. A negative NNP value indicates that there are more acid-producing constituents than acid-neutralizing constituents. Material that would be considered to have a high potential for acid neutralization produces a net neutralizing potential of greater than 20 kg CaCO3 eq/ton. Acid–base accounting data are also described using the neutralization potential ratio (NPR), where NPR = NP/AP [17,19,23]. Rock types with an NPR of <1 are typically considered potentially acid-forming. The results of ABA testwork are a means to classify the samples for each lithology based on their acid-generating potential by the AP (i.e., NP:AP). The criteria used for the assessment of acid generation for the rock types are outlined in Table 2 [24].
The net acid generation (NAG) procedure is commonly used as a complimentary method to ABA for the confirmation of a material’s acid-generating potential. The method has been developed by several researchers over the past 40 years [17,19,24,25,26] and references therein. NAG testwork was carried out on the samples to determine the maximum potential for acid generation from the waste rock.
The static NAG test differs from the ABA test in that it provides a direct empirical estimate of the overall sample reactivity, including any acid generated by semi-soluble sulfate minerals (i.e., jarosite) as well as other potentially acid-generating sulfide minerals. The NAG test method essentially involves intensive oxidation of the sample using hydrogen peroxide (H2O2), which accelerates the dissolution of sulfide minerals and has the net result that acid production and neutralization can be measured directly [24].
The guidelines used for assessing the acid generation potential based on NAG results are summarized in Table 3. In general, an NAG pH of <4.5 and an NAG value > 10 kg H2SO4 eq/t are indicative of a potentially acid-forming material. NAG results greater than 1 kg H2SO4 eq/t indicate the sample will generate some acidity more than available alkalinity and is also potentially acid-forming. Mineralogy was also undertaken to provide direct characterization of minerals potentially involved in ABA and NAG accounting [23,24].

4.2.2. Kinetic Testing

Kinetic testing enables the determination of rates of acid generation and elemental leaching from a particular material type and therefore allows the quantification of metal leaching, which is essential for prediction of source-term leachate quality. A sequence of kinetic testing was carried out as part of the Hannukainen, Pellivuoma, and Sahavaara geochemical characterization studies to validate and substantiate trends observed during the static testing.
Humidity cell testing (HCT) was carried out on 22 samples in accordance with the ASTM D5744-96 methodology, which is the industry standard kinetic test method for accelerated leaching of mine waste [5,18,22,25,26]. The test is designed to simulate the long-term weathering of material under accelerated laboratory conditions, which allows prediction of sulfide mineral oxidation rates, acid generation, and trace element mobility. The humidity cell tests followed a seven-day cycle, which consisted of three days circulating dry air, three days circulating humid air (at 25 °C), followed by a leach day in which the column was flooded with deionized water prior to draining, and leachate collection. Following overnight draining, the cycle was restarted. Each week, the collected leachate was filtered through 0.45 µm membrane filters prior to analysis for major cations and anions, trace elements, pH, and electrical conductivity.
For the Hannukainen deposit, eight samples of moderate-to-high sulfur waste (including one sample of skarn, one sample of schist, three samples of amphibolite, and three samples of diorite) were submitted for humidity cell testing, with cells being operated for up to 170 weeks. For the Pellivuoma deposit, two NAF skarn samples, an NAF marble sample, and three PAF skarn samples were subjected to long-term HCTs for a period of between 40 and 60 weeks. Four waste rock samples from the Sahavaara deposit (two phyllite, one schist, and one quartzite) and four samples from the Tapuli deposit (two phyllite, one marble, and one skarn) were submitted for humidity cell testing for periods of between 40 and 140 weeks. An important note on humidity cells, or indeed any type of geochemical testwork, is that they are laboratory tests and do not simulate environmental conditions [6]. They determine the response of a material to a leaching cycle by a lixivant. The application of this information to the environment requires scaling of this information to the specific environment the material is in and is influenced by various factors including temperature, rainfall, rock–water ratios, grain size, and oxygen availability. The results only reflect leaching from the material in the laboratory, not the environment, but are a useful indicator to review prior to numerical calculations [4,5,6].

4.2.3. Mineralogy

An environmental mineralogical assessment was carried out on 26 samples, including ten samples from the Hannukainen deposit, eleven samples from the Pellivuoma deposit, two samples from Sahavaara, and three samples from Tapuli. The aim of the mineralogical study was to classify the mineralogy relevant to acid rock drainage and metal leaching, focusing on acid-producing sulfides and neutralizing silicate and carbonate minerals [23,27,28].
The principal method of analysis used for this study was optical microscopy, which was completed on polished thin sections of material taken from the waste rock samples using a Meiji MX9000 microscope (Meiji Techno Co., Ltd., Saitama, Japan) ourced) fitted with a mounted Canon EOS 600D digital camera (Canon Inc., Tokyo, Japan). A Scanning Electron Microscope (SEM) with INCA wave- and energy-dispersive X-Ray spectroscopy was utilized for semi-quantitative analysis of minerals present within the polished thin sections. X-Ray Diffraction analysis was carried out using a Philips PW1710 Powder Diffractometer (Malvern Panalytical, Worcestershire, UK). Scans were run using Cu Kα radiation at 35 kV and 40 mA, between 2 and 70 °2θ, at a scan speed of 0.04 °2θ/s. From the scans, phases were identified, and from the peak areas, semi-quantitative analysis was performed and a percentage of each phase present calculated.

5. Results

5.1. Mineralogy

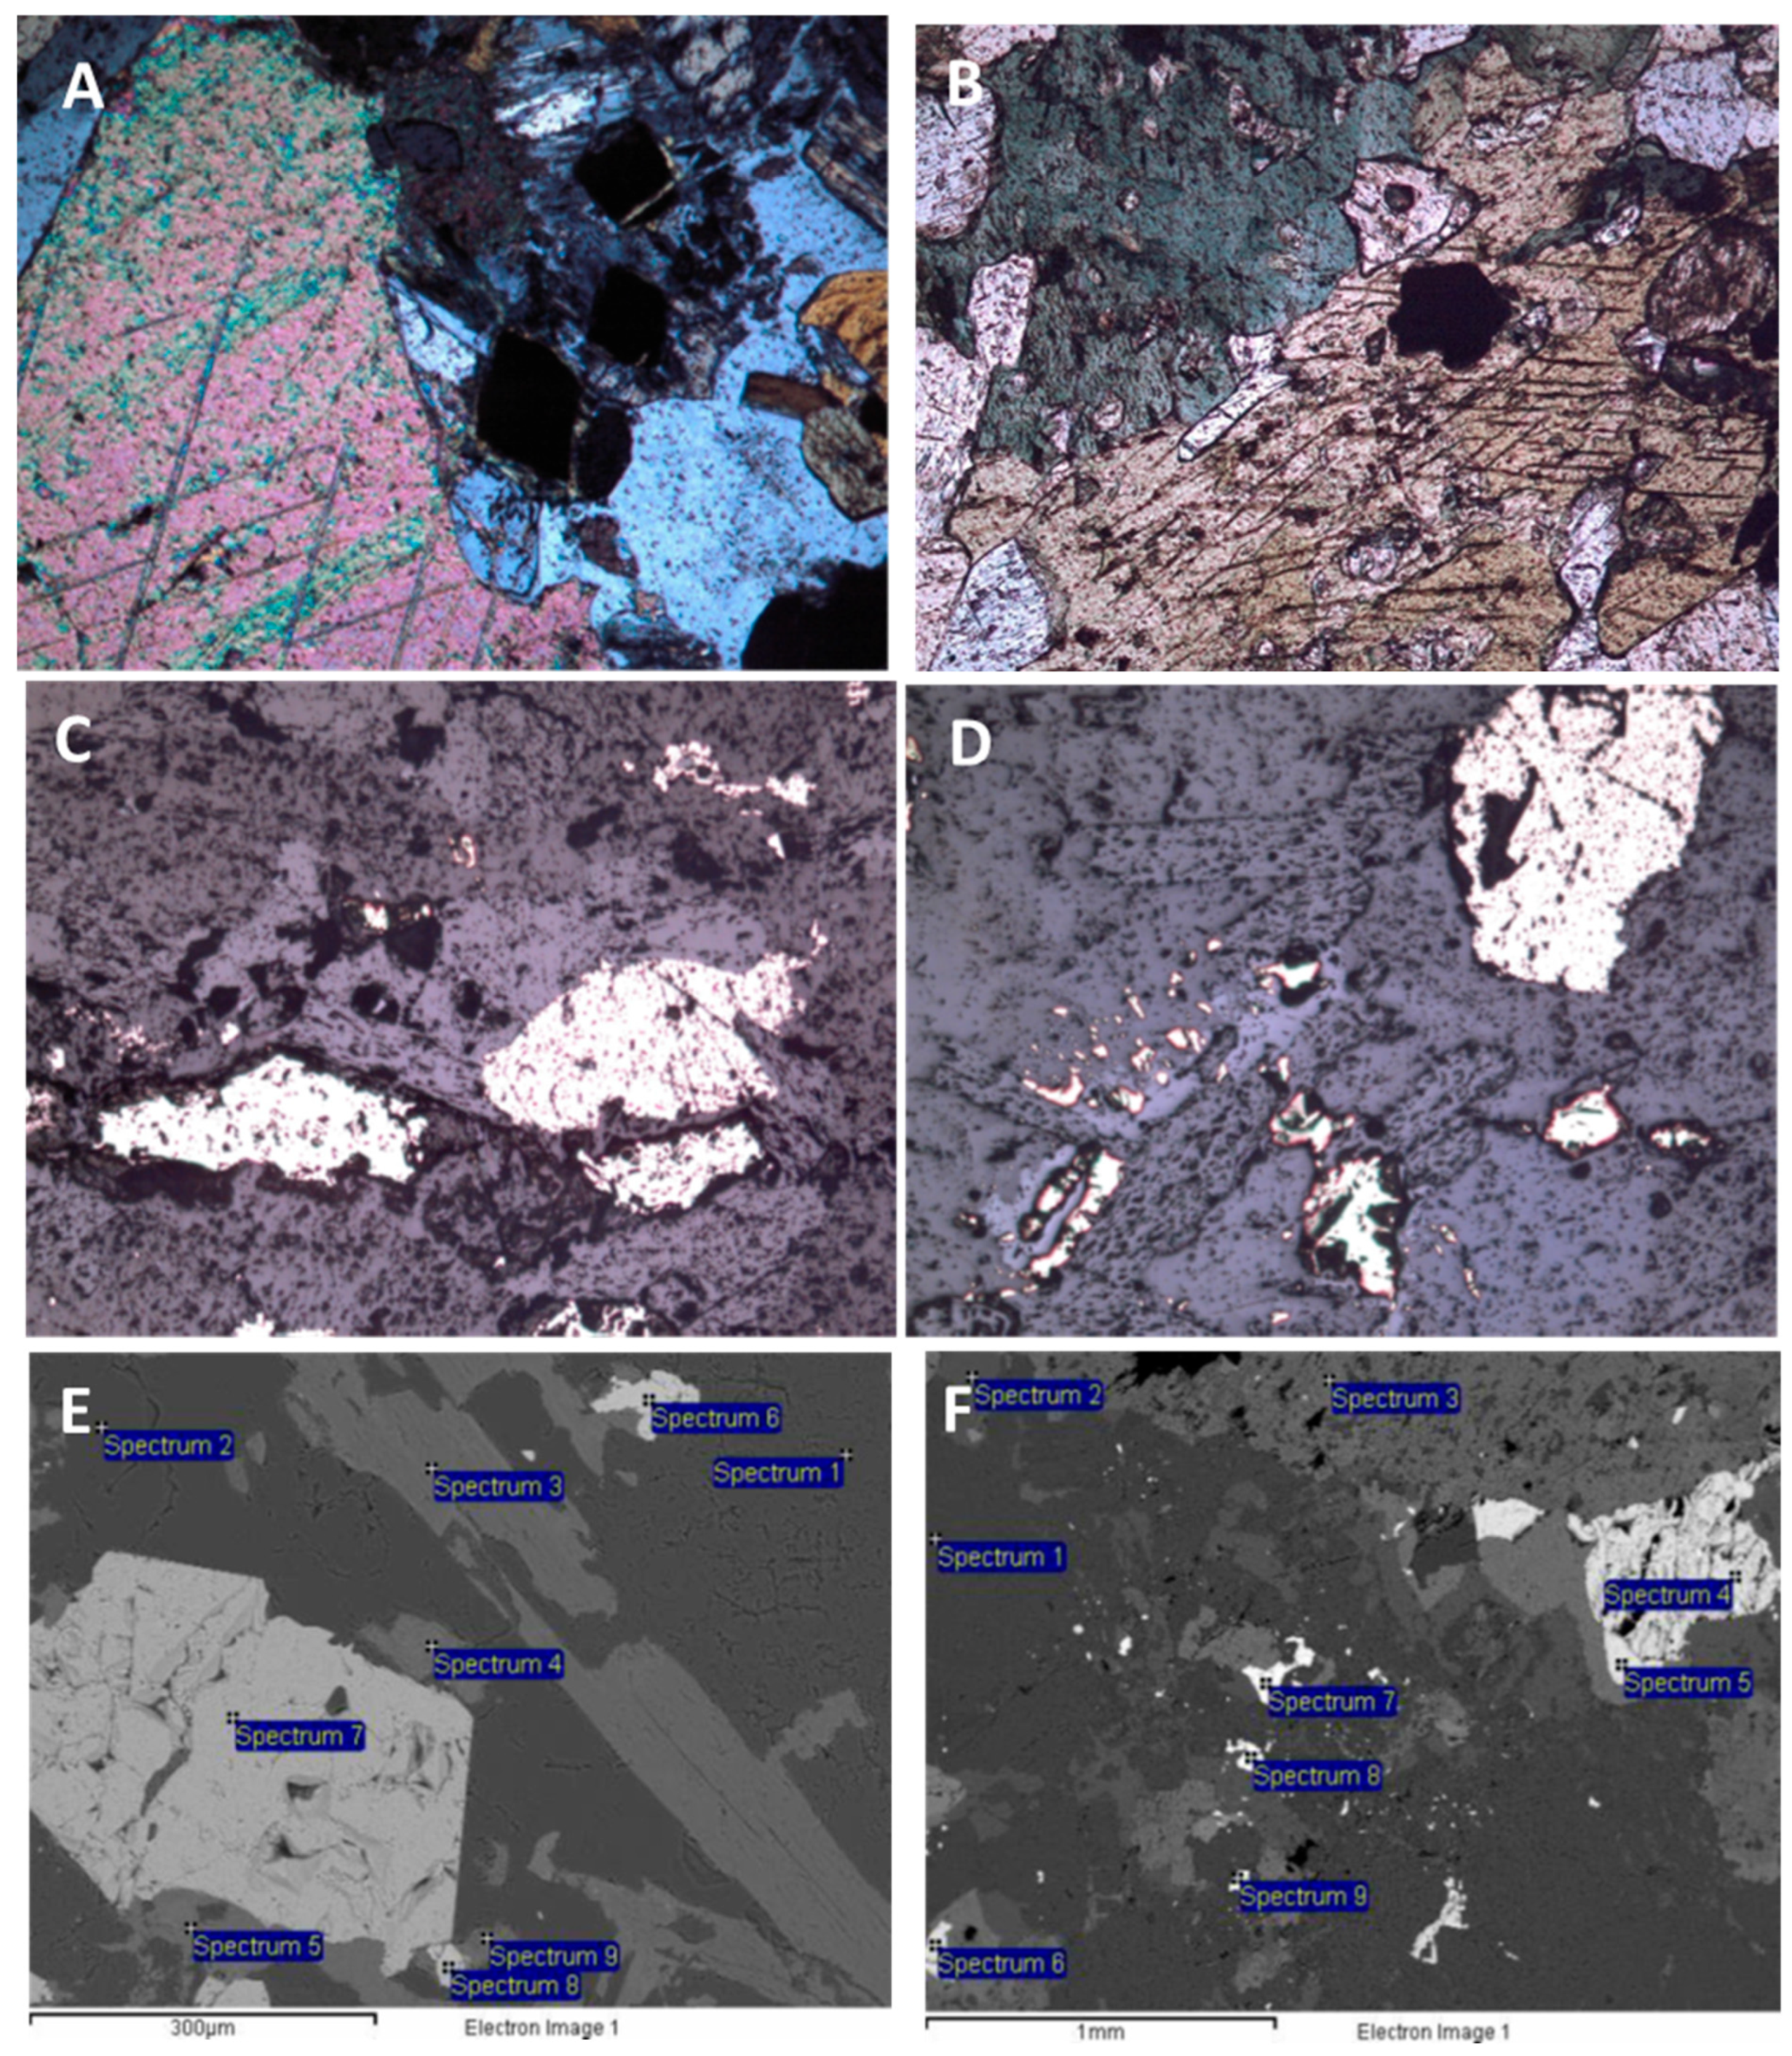
For the Hannukainen deposit, sulfide mineralization consisted of pyrite, pyrrhotite, chalcopyrite, bornite (Cu5FeS4), galena (PbS), and mackinawite (Fe,Ni)9S8. Acid-neutralizing potential in the form of calcite (CaCO3) was observed as a trace (<1% by volume) to minor (1%–10% by volume) constituent within the samples. However, in addition to this, intermediate- and long-term neutralizing potential was observed in the presence of ultramafic minerals (amphibole, pyroxene, and mafic micas). These ultramafic minerals form a major component (>10% by volume) and, given that they are fine-grained and evenly distributed, are likely to provide considerable neutralizing capacity. The presence of trace elements identified in pyrite particularly, As, Co and Ni influences reactivity and oxidation rate [29].
The sulfides in the Hannukainen rocks were found to be disseminated. In particular, the pyrite occurred in a variety of different habits and sizes, sometimes occurring as massive sub-euhedral crystals in the skarn, and occurring as sub-euhedral crystals and large masses of finer grained crystals in the amphibolite and schist, both forms often being up to 1 mm and larger but mostly 0.1–0.5 mm in size. In the schist, pyrrhotite was found to be banded structures that run parallel throughout the section. Copper mineralization is finer grained than the iron sulfides and is often associated with pyrite and magnetite. It is principally in the form of chalcopyrite, and bornite occurs as an accompanying mineral with chalcopyrite. Both galena and mackinawite occur sporadically as very fine grains in the matrix.
Within the samples from the Kaunisvaara deposits (Pellivuoma and Sahavaara), sulfide mineralization was found to consist largely of pyrrhotite and pyrite, with minor chalcopyrite and traces of galena and sphalerite (ZnS). The presence of galena, chalcopyrite, and sphalerite indicates that there is some potential for release of lead, copper, and zinc during sulfide weathering. Of these, copper and zinc were found to be elevated in both Tapuli and Sahavaara, and it is therefore likely that this enrichment is as sulfides. The carbonate mineralogy consists of calcite and dolomite (Ca,Mg(CO3)2), which are both acid-neutralizing carbonate minerals and are likely to offer some buffering capacity.

5.2. Multi Element Analysis

Arsenic, copper, sulfur, and selenium were found to be significantly enriched relative to average crustal abundance in one or more of the rock types in the four deposits (Table 4). The use of crustal abundance is used to determine potential enrichment of environmentally significant elements [19,20,21].
Selenium concentrations are notably elevated in the schist material from Hannukainen and Sahavaara, with average concentrations of 4.17 and 3.82 mg/kg, respectively, compared to an average crustal abundance of 0.1 mg/kg. Copper and sulfur are also elevated in the schist and skarn material from these deposits, with concentrations greater than four times the average crustal abundance.
Arsenic is reported at concentrations greater than four times in average crustal abundance in the skarn and schist material from the Sahavaara deposit. The average arsenic content of the Sahavaara schist is 24.6 mg/kg compared to an average crustal abundance of 1.8 mg/kg [20,21]. Similar concentrations of enrichment are reported in the schist material from the Hannukainen deposit at an average of 10.4 mg/kg.
Antimony concentrations up to two times greater than the average crustal abundance of 0.2 mg/kg are reported in the amphibolite, overburden, and schist material from the Hannukainen deposit, with average concentrations up to 0.5 mg/kg reported for the overburden and schist. The highest concentrations of iron enrichment are reported in the schist and skarn material of the Hannukainen deposit, with average concentrations of 15.6% reported for the skarn material.
The marble rocks from the Pellivuoma and Tapuli deposits show significant enrichment (greater than five times the average crustal abundance) of sulfur. Selenium and cadmium are also significantly enriched in the Tapuli marble (Table 4).

5.3. Acid Generation Potential

Acid–base accounting was carried out to assess the balance of acid-producing and acid-neutralizing minerals in the waste rock materials (Table 5). Static NAG testing was undertaken on the samples to provide a more empirical estimate of field acid generation (Table 6).
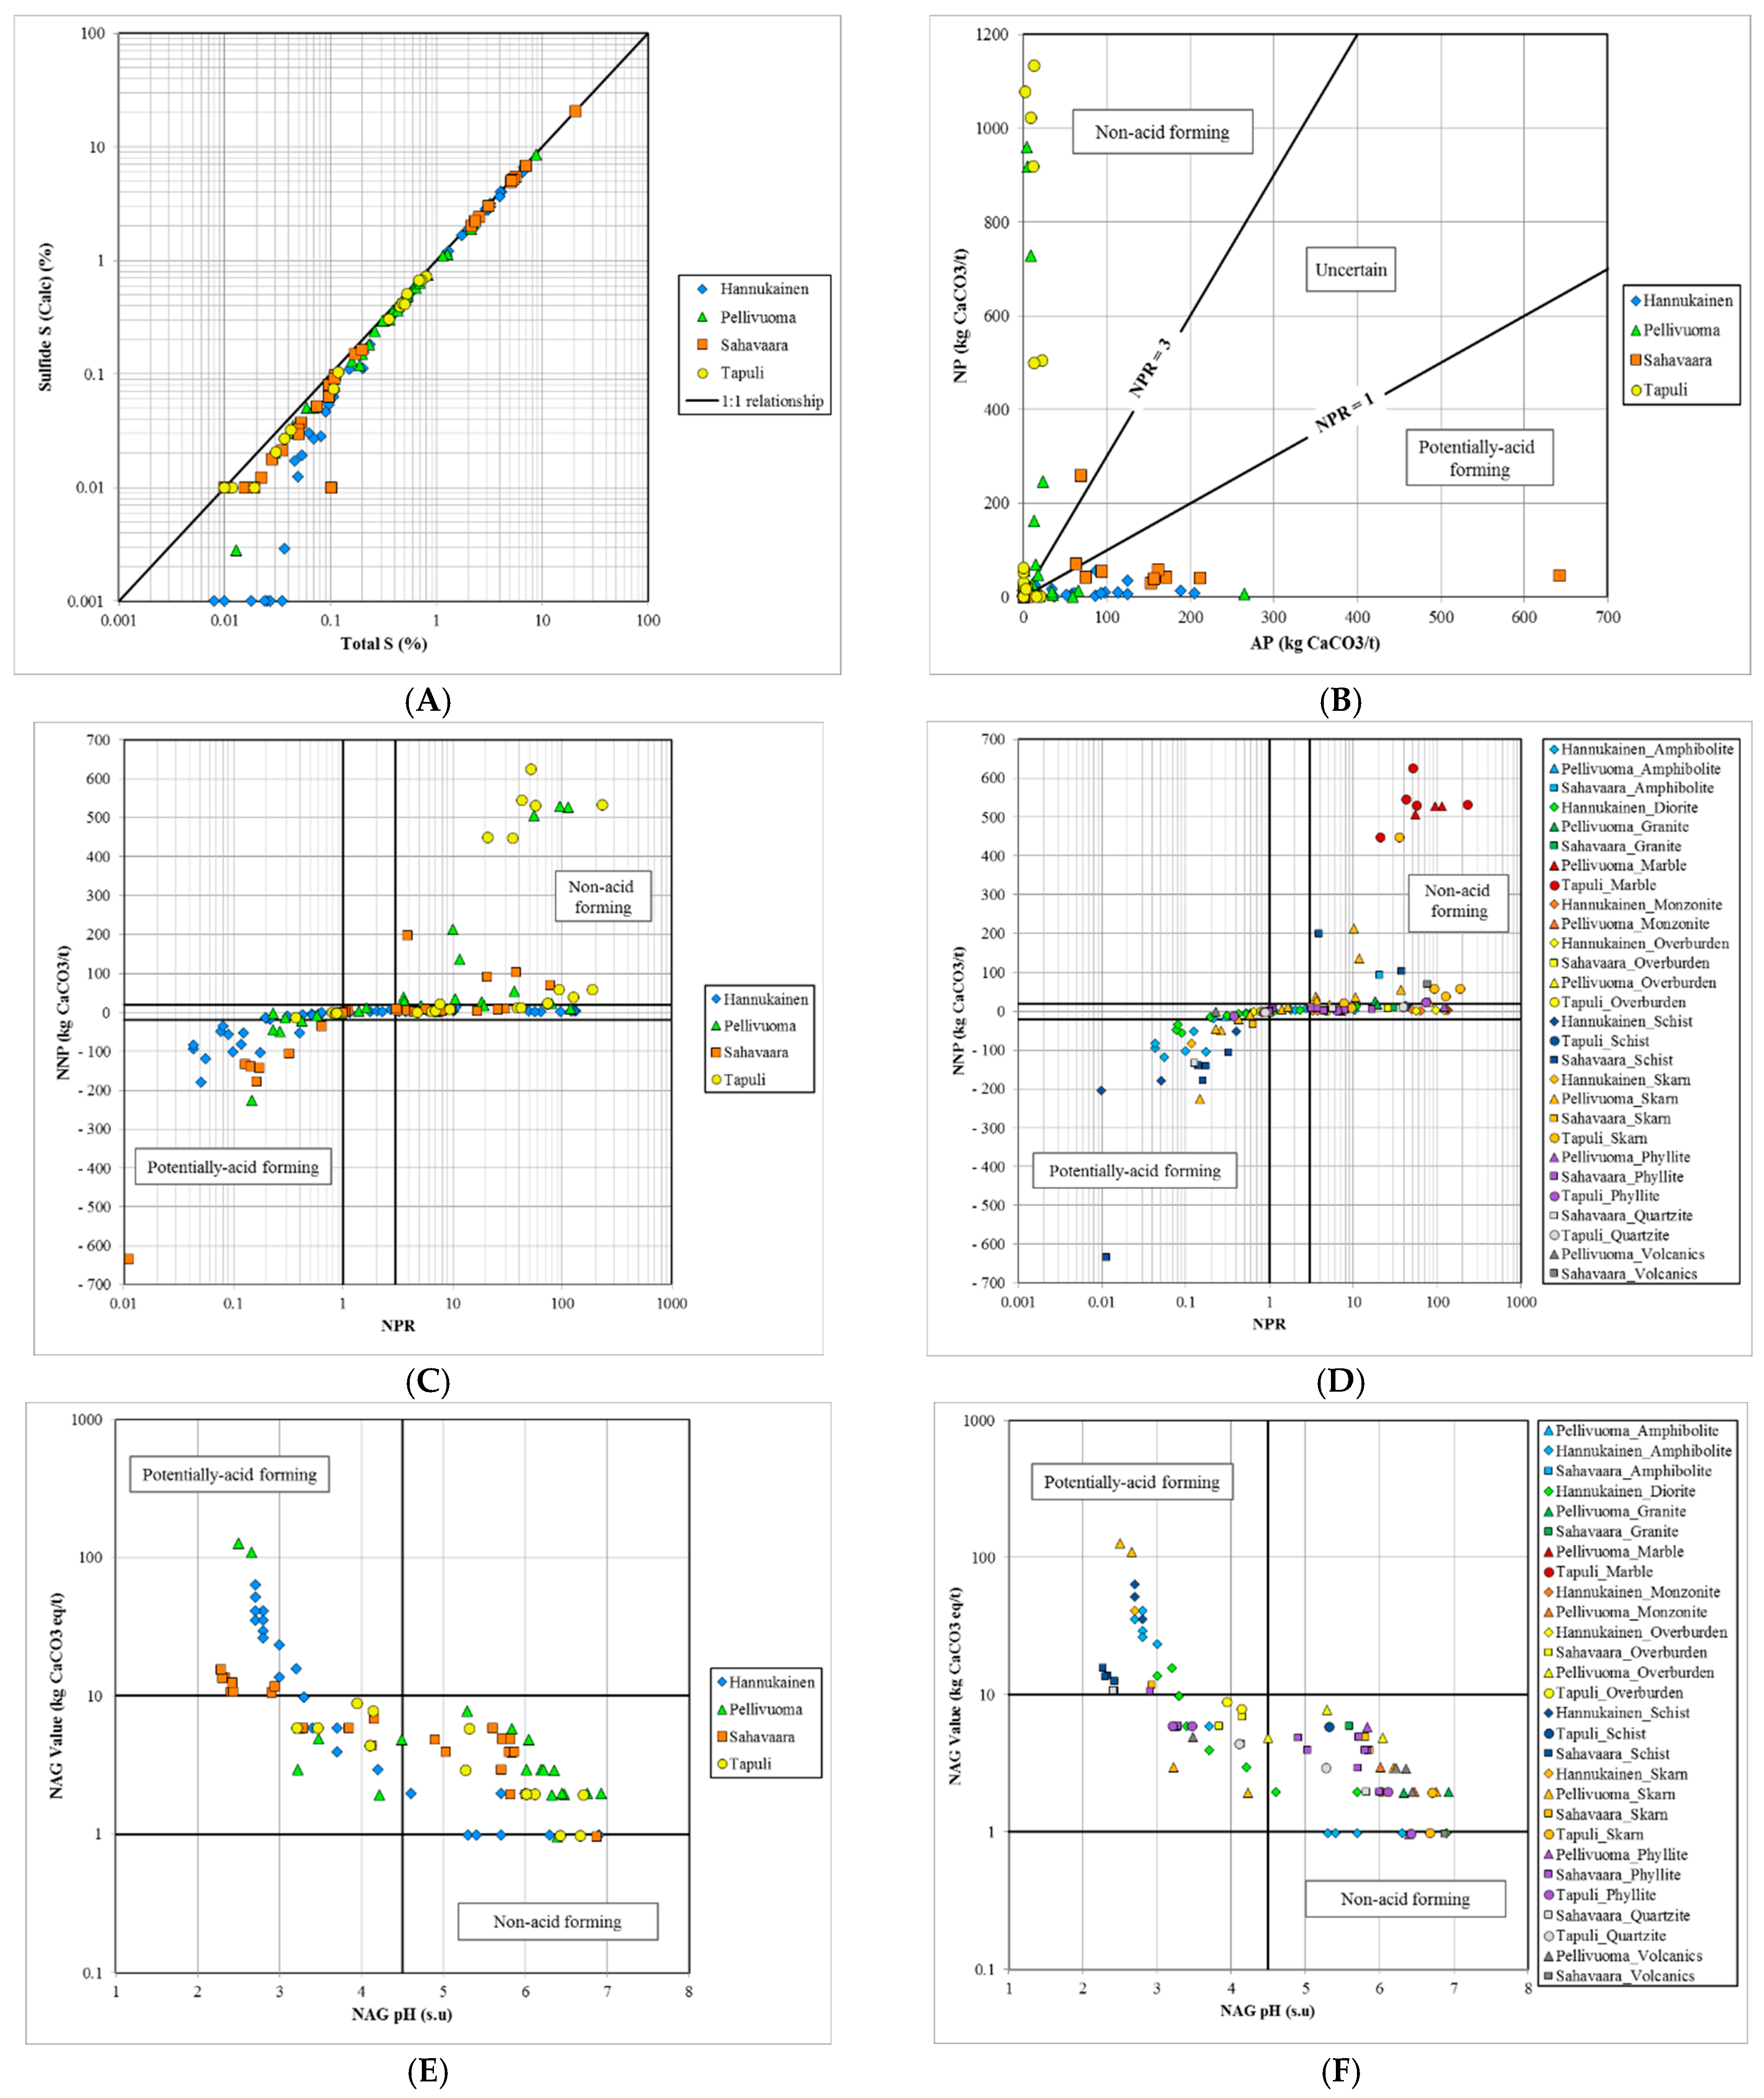
The sulfide content of the waste rock samples tested ranges from less than the analytical limit of detection (<0.01%) to 20.5%. The highest sulfide contents are exhibited in the Sahavaara rocks, with average sulfide contents in the schist material of 6.47% and 1.07% in the skarn material (Table 6). The sulfide content of the Hannukainen Schist and skarn material is also elevated, with average concentrations of 5.13% and 2.04%, respectively. The skarn material of the Pellivuoma deposit has an average sulfide content of 1.07%. Sulfate sulfur concentrations were below or near the limit of analytical detection (<0.01%), resulting in total sulfur and sulfide sulfur concentrations being at near parity (Figure 2A). Sulfide sulfur content has been used to determine AP.
NP calculated from total inorganic carbon (TIC) and NP determined by titration were typically equivalent, with NP-by-titration content being marginally higher than TIC, suggesting the presence of some neutralizing potential from silicate minerals. NP by titration has been used to calculate NNP and NPR. The highest average NP values are reported in the marble rocks of the Pellivuoma and Tapuli deposits, with 527 kg CaCO3 eq/t and 548 kg CaCO3 eq/t, respectively.
Of the 134 samples analyzed, 25 samples (i.e., 19%) have an NNP < −20 kg CaCO3 eq/t and are therefore characterized as PAF based on NNP. Forty-seven samples (35%) have an NNP greater than 20 kg CaCO3 eq/t and are therefore characterized as NAF. The remaining 62 samples (42%) have an NNP from −20 and 20 kg CaCO3 eq/t and therefore exhibit an uncertain acid-generating potential based on NNP. When NPR is used to characterize the samples, 58 samples (43%) have an NPR < 1 and are classified as PAF; 10 samples (7%) have an NPR between 1 and 3 and are classified as uncertain; and 66 (49%) samples have an NPR greater than 3 and are classified as NAF. Samples characterized as PAF based on NPR and NNP values are principally from the Hannukainen and Sahavaara deposits (Figure 2C,D). Almost half of the samples characterized as PAF based on NPR are from the Hannukainen deposit.
PAF characteristics are exhibited in multiple samples from the Hannukainen amphibolite, diorite, and schist materials. When comparing the NP of the deposits, Pellivuoma and Tapuli have a notably higher NP, particularly in marble material types. Materials classified as PAF are generally from the amphibolite, schist, skarn, and diorite rock types. AP is typically higher in the Hannukainen and Sahavaara samples; this is linked to samples from these deposits exhibiting a higher average sulfur content than the other deposits.
Of the samples tested (Figure 3), almost a third (31%) are classified as potentially acid-forming, based on an NAG pH of <4.5. Of these, eleven of the Hannukainen samples, eight of the Sahavaara samples, and two of the Pellivuoma samples had an NAG pH less than 4.5 and an NAG value greater than 10, indicating a high potential for acid generation. The results of the NAG testing support the ABA results and indicate that a large proportion of the material tested is likely to be potentially acid-forming, in particular, the schist and skarn rock types from Hannukainen and Sahavaara and some of the amphibolite material at Hannukainen.
The results of the static tests showed that a large proportion (around 40%) of the samples fall into the potentially acid-forming (PAF) category for waste characterization, having a sulfide sulfur content greater than 0.5% or an NPR < 1 and an NAG pH of <4.5.

5.4. Kinetic Tests

Kinetic humidity cell testing was carried out on 22 representative samples of waste rock material. The static test results for these samples are summarized in Table 7, along with a summary of the kinetic testing results. All of the HCT samples for Hannukainen were classified as PAF based on the ABA and NAG testing, whereas the Pellivuoma, Sahavaara, and Tapuli HCT samples cover a range of acid-generating and neutralizing characteristics.
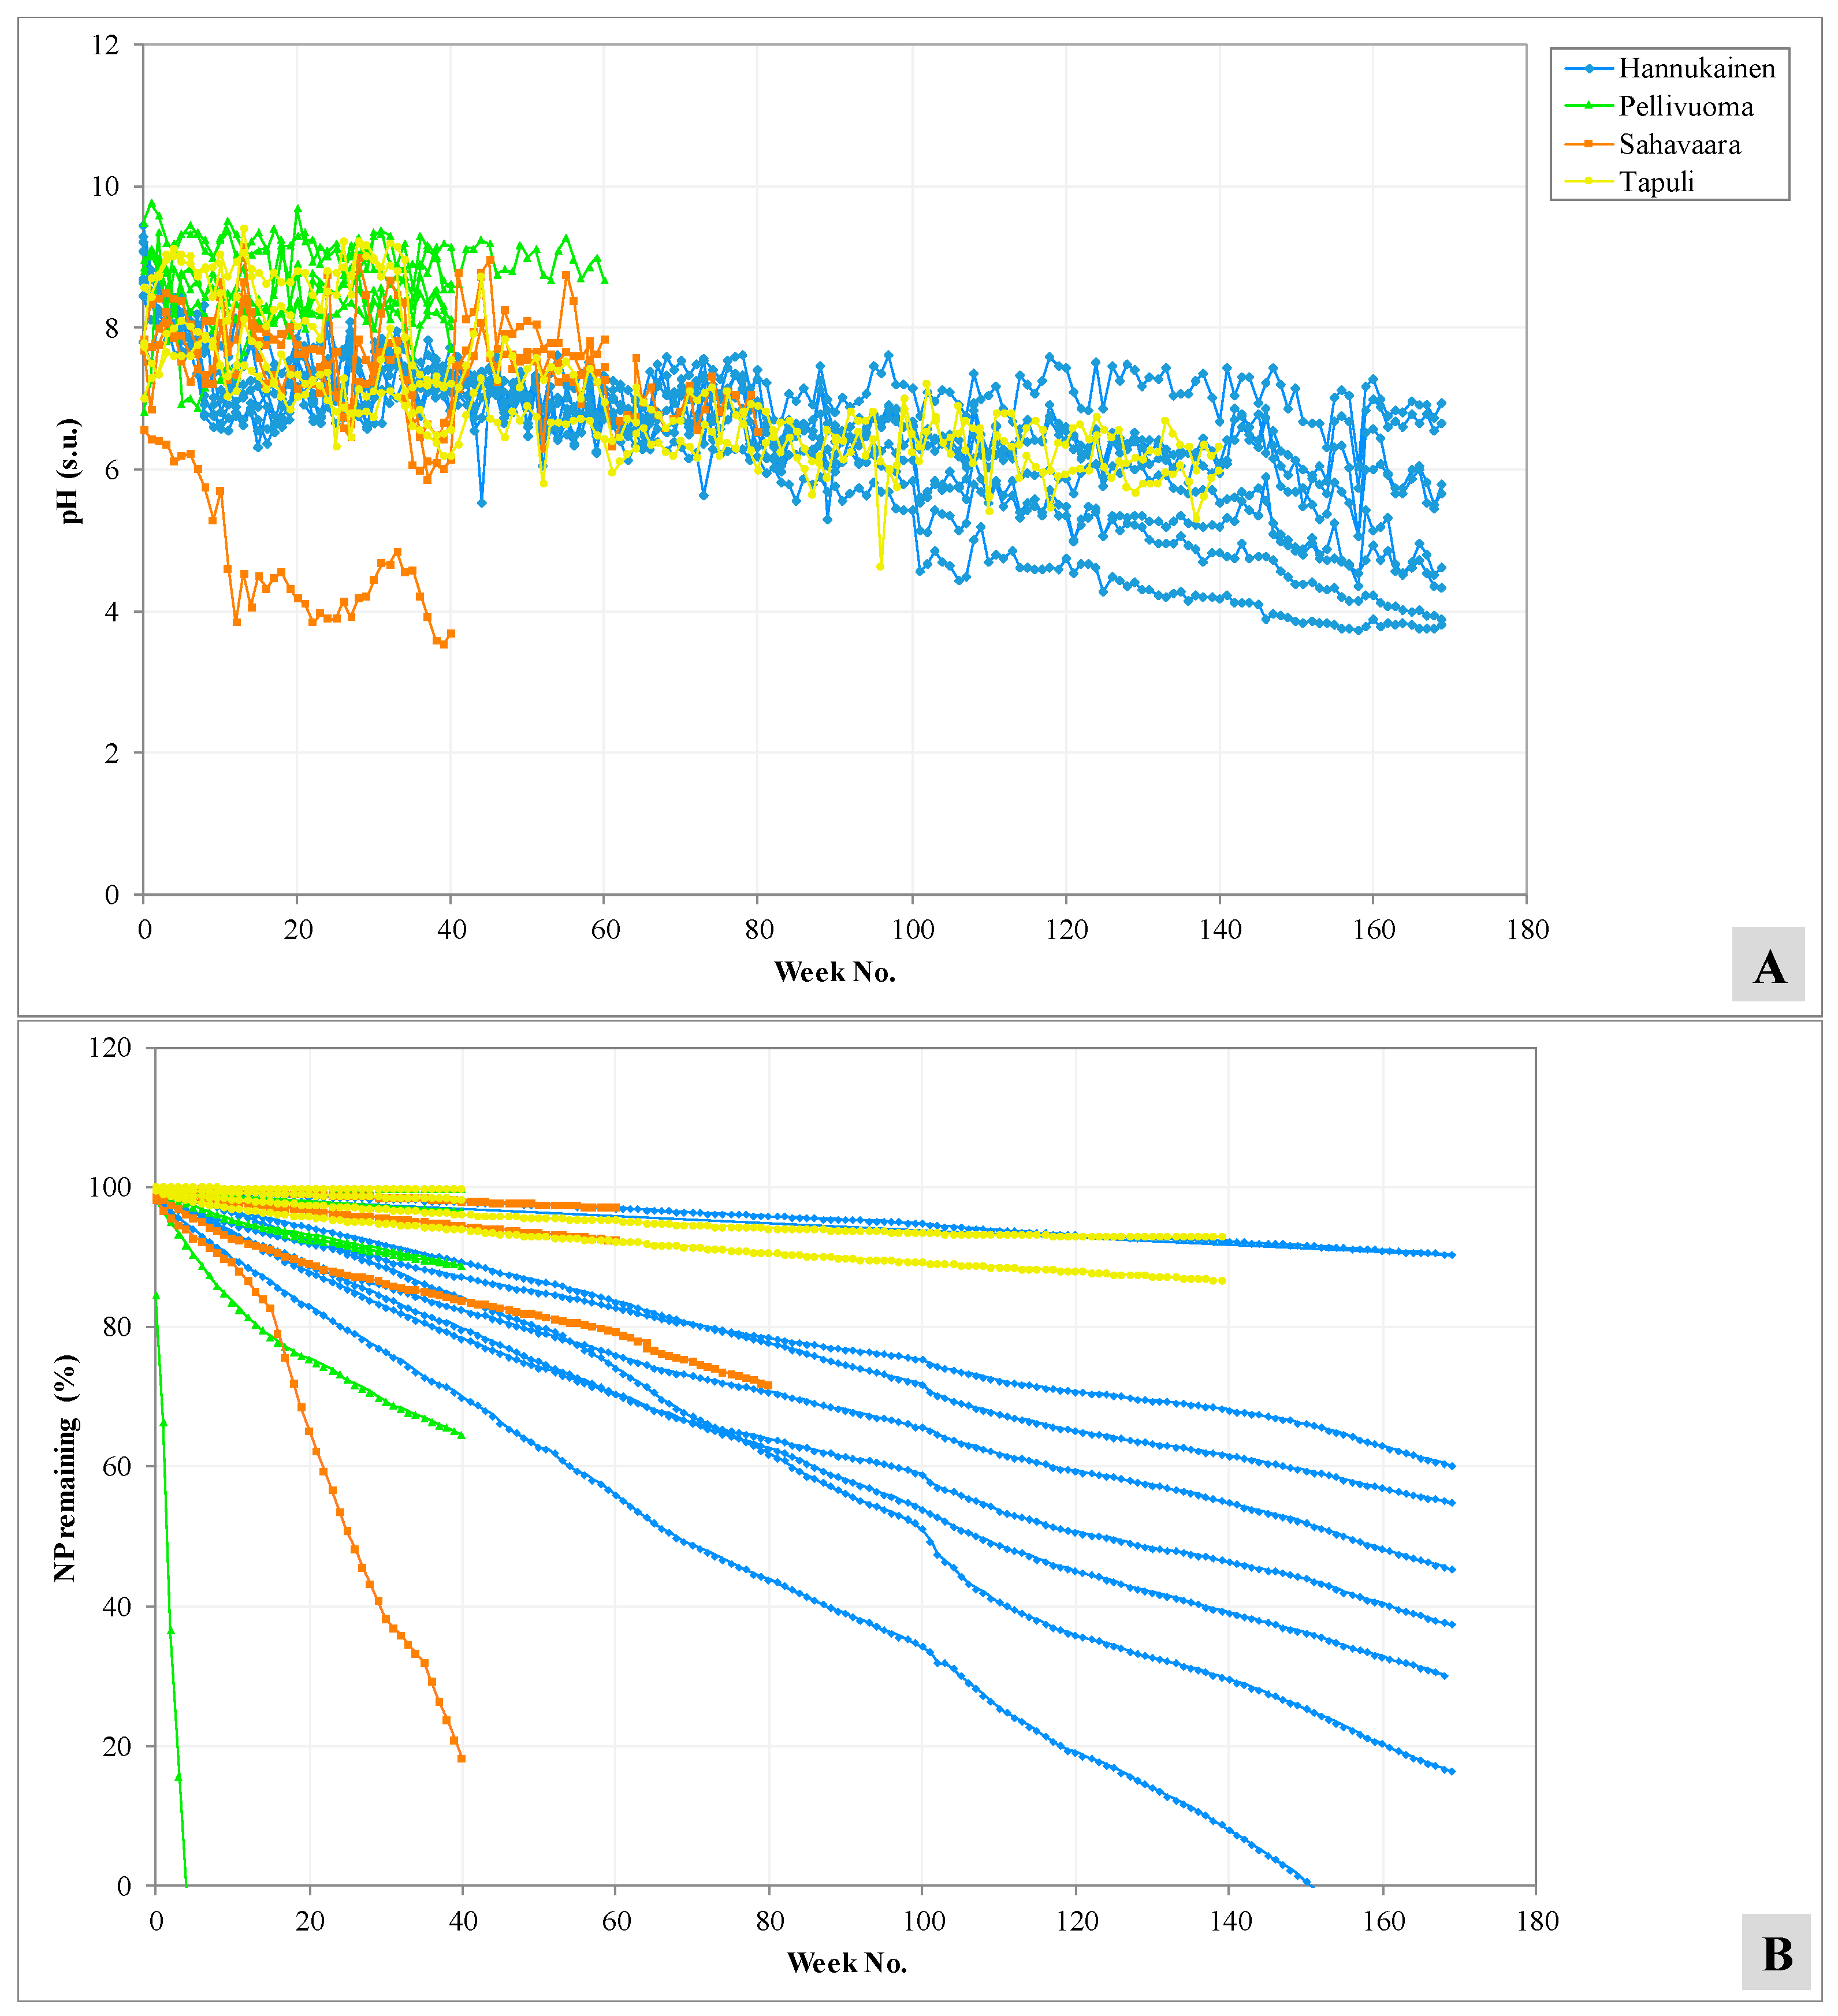
The onset of acid generation in the Hannukainen HCTs exhibited a considerable lag time, with acidic conditions only being realized after greater than 100 weeks of testing; Hannukainen Amphibolite 3 and Hannukainen Schist fall below pH 4.5 after week 125 and week 149, respectively. The initial effluent pH in all Hannukainen HCTs was approximately pH 9, with a relatively rapid decline to circum-neutral values after 10 weeks. From 10 to 60 weeks, the pH of the Hannukainen HCTs generally remained circum-neutral and thereafter declined gradually. The pH of the Hannukainen HCTs shows a slow, generally gradual decline down to a pH of 4 after 150 weeks of testing (Figure 4A).
This long lag time for the onset of acidic conditions is hypothesized to be caused by the coarse crystallinity of sulfide minerals and a subsequent low oxidation rate. Sulfide grain size, crystallinity, and liberation are fundamental parameters controlling the quality of HCT leachate, and the balance between them can be complex. Mineralogical work also indicated that the presence of mafic silicates within the Hannukainen rock types contributes significantly to their neutralizing capacity. The combination of slow-reacting sulfides, coupled with the dissolution of silicate minerals such as olivine and serpentine, which buffers acid generation, results in extremely long lag times in multiple HCTs.
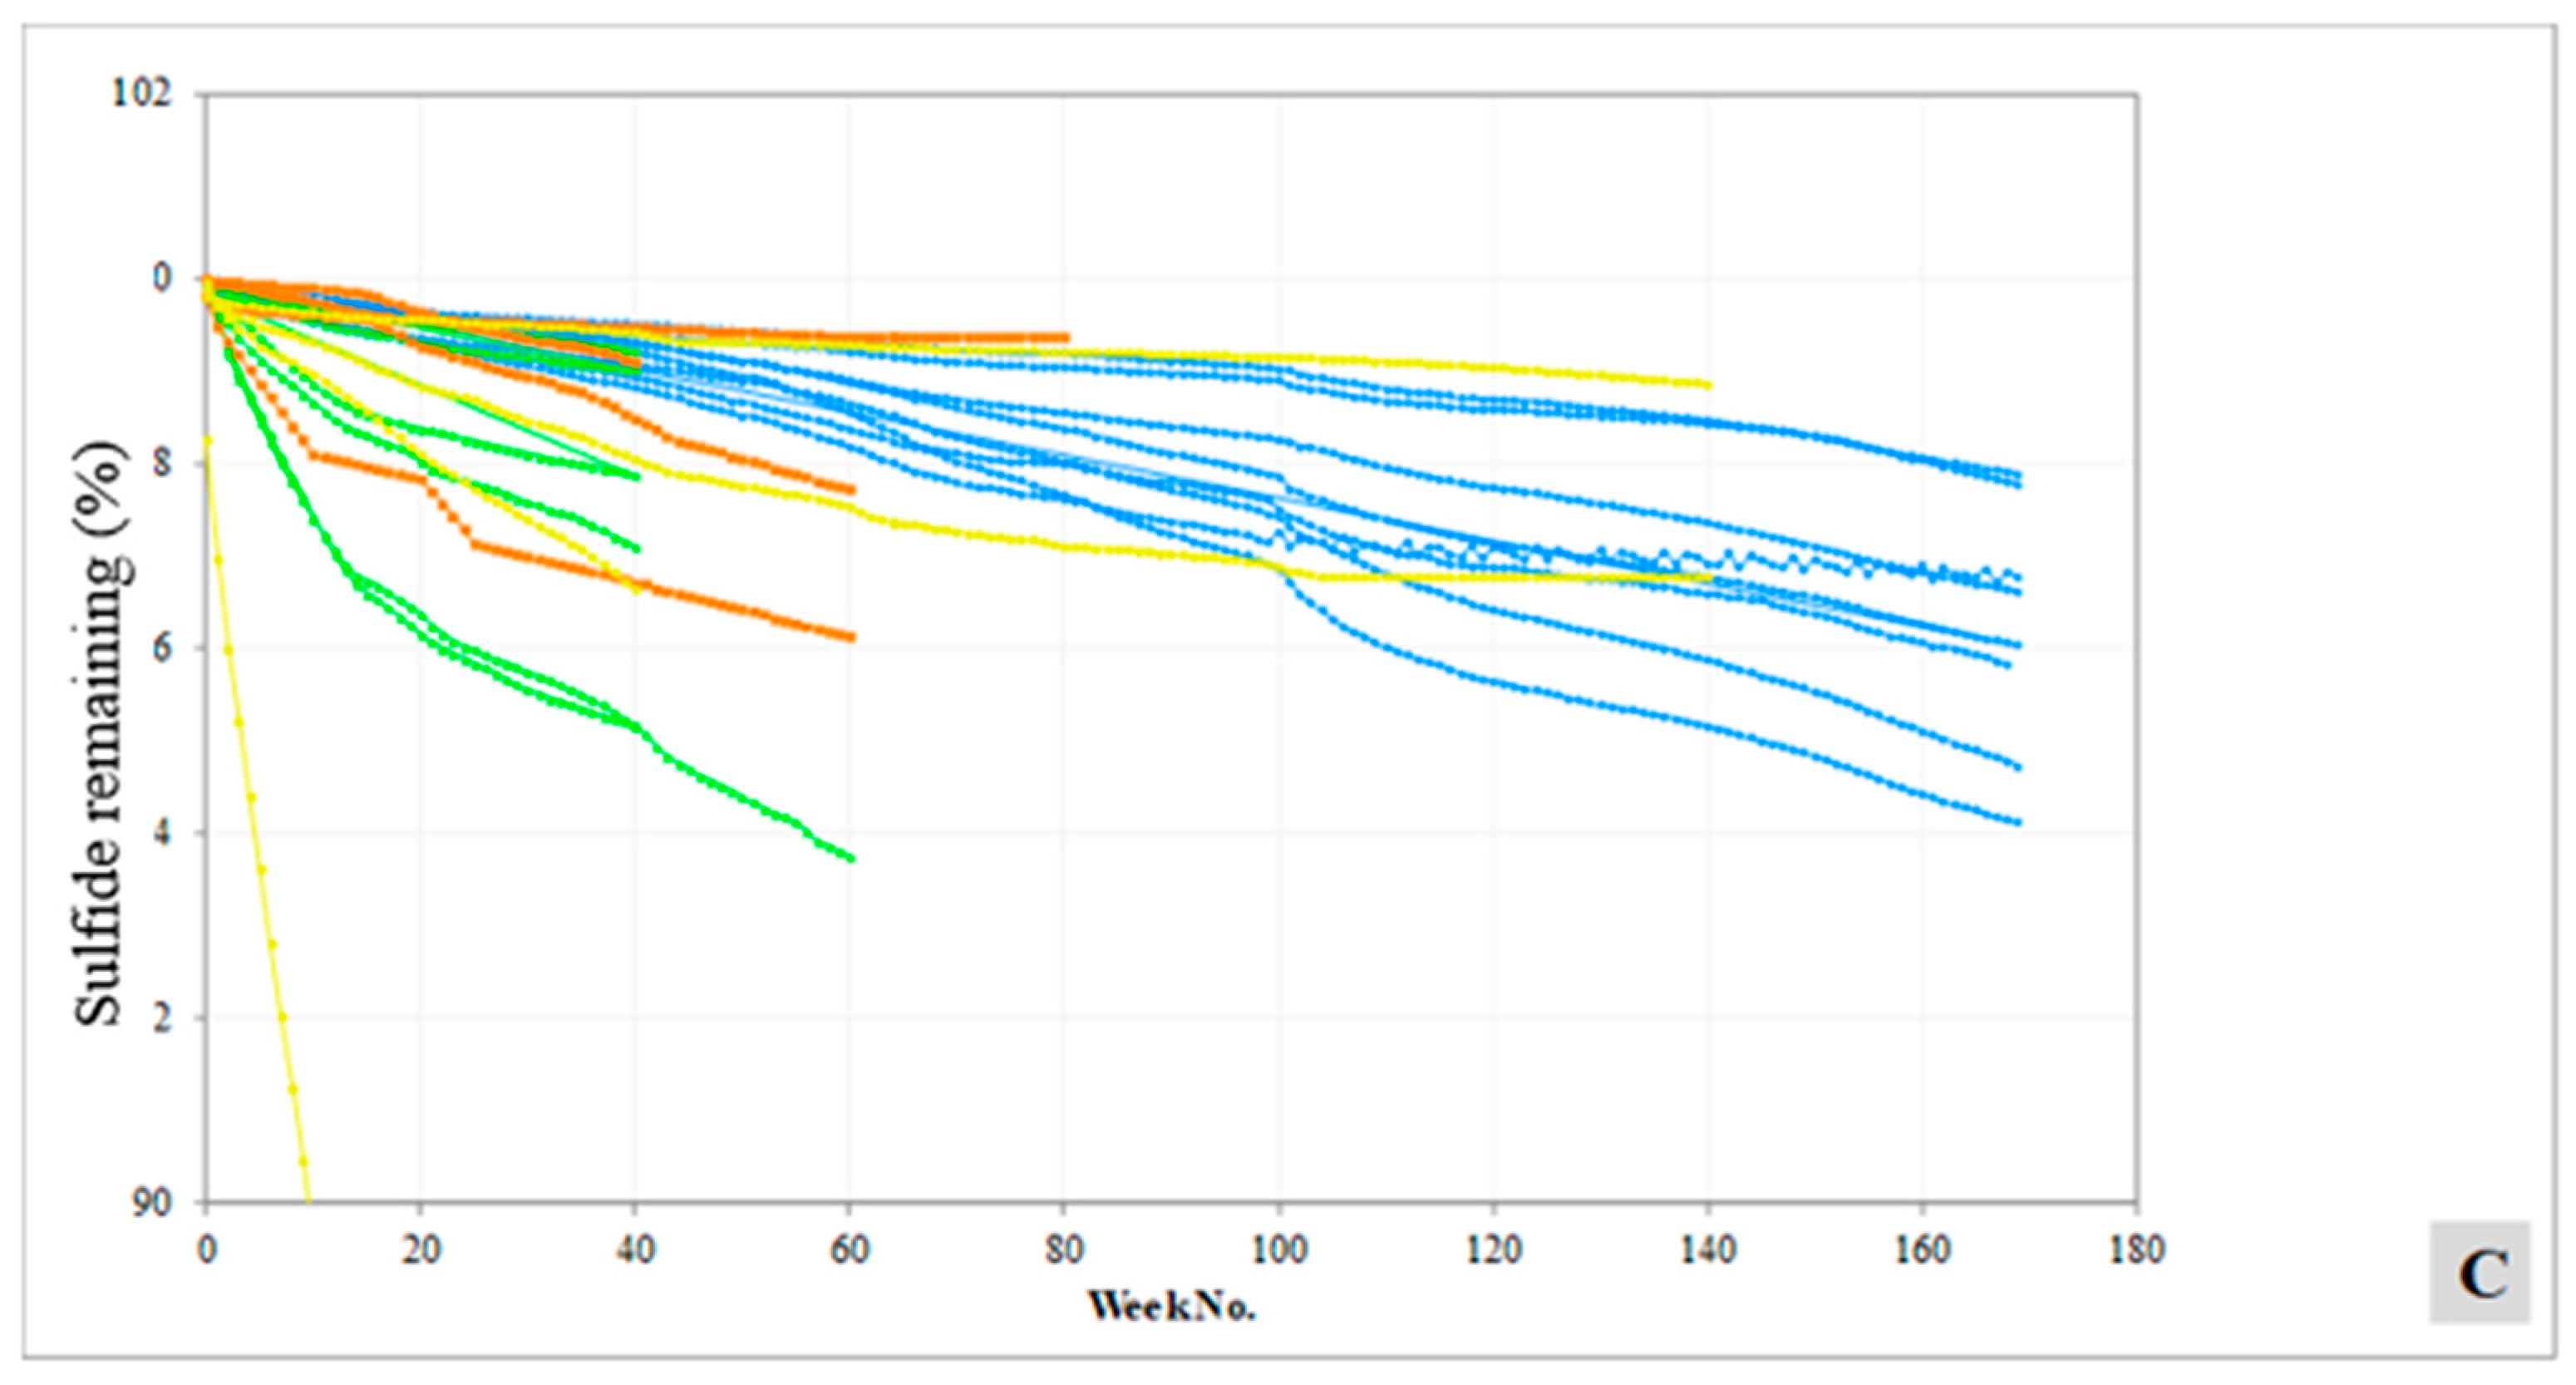
Acidic conditions were also reached in Sahavaara PAF Schist HCT, which was only run for 40 weeks. This sample had significant AP, with a sulfide content of 21% and minimal NP of 7.21 kg CaCO3 eq/t (Figure 4). The consumption of NP in this sample was rapid, with just 18.3% NP remaining after the 40 weeks of testing. The majority of sulfide (99.1%) remained in the sample when it was terminated.
Despite being classed as PAF in the ABA testing, none of the Pellivuoma HCTs reported an acidic pH during the 40 to 60 weeks of testing. NP was consumed in the Pellivuoma PAF Skarn 3 sample, and, except for Pellivuoma NAF Skarn 1, more than 85% NP remained in the Pellivuoma HCTs when they were terminated (Figure 4B). However, the sulfide content of all samples remained greater than 95% upon termination (Figure 4C).
Based on their NPR values, the Tapuli Phyllite samples were predicted to be PAF. By week 140 of the humidity cell test, the Tapuli Phyllite samples were beginning to report below circum-neutral pH readings (pH 6.0 and 6.3); however, they did not turn fully acidic. Significant NP (86.7 to 92.9%) and sulfide (96.8 to 98.9%) remained in both of the samples when the test was terminated (Figure 4B,C).
When comparing the results of the ABA tests with the effluent pH exhibited in the HCTs, there is potential that some of the HCTs were not run for enough time to allow for acid generation to occur. The long lead time between the initiation of the tests and the time at which the test matures, i.e., when the data obtained from the test are suitable for use in long-term water quality predictions, can be many months or even years (e.g., 26). This is especially applicable to rock types that are slow-reacting and demonstrate a significant lag time to the onset of persistent acidic leaching conditions at which solute mobility and release from the cell is at its highest and most representative of long-term weathering.

6. Discussion

The results of the static tests showed that a large proportion of the samples (around 40%) are classed as potentially acid-forming, based on a sulfide sulfur content greater than 0.5% or an NPR < 1 and an NAG pH of <4.5. The results of the NAG testing support the ABA results and indicate that a large proportion of the rock types tested are PAF; in particular, the schist and skarn rocks from Hannukainen and Sahavaara and some of the amphibolite rocks at Hannukainen.
Despite the low carbon and high sulfur content in the majority of the PAF samples, a delayed onset for acid generation in the HCTs was observed. Previous multiple studies have shown that the rate of acid generation during humidity cell testing often does not show agreement with the predicted ARDML potential from static testing. This is commonly due to textural and mineralogical controls including grain size, crystallinity, encapsulation, and mineral speciation [6,23,27,28].
The results showed a lower-than-average sulfide oxidation rate which meant a relatively slow depletion of carbonate NP as opposed to any significant silicate mineral buffering (Figure 4). I think the theory was that the rocks are very crystalline and therefore the sulfides poorly liberated, react slowly and then take a long time to consume the available NP. That made sense as the NP deletion plots (Figure 4B) only showed the depletion of NP after near on 2 years.
The long lag time in acid generation (more than 100 weeks) for the Hannukainen samples is primarily attributed to sulfide crystallinity and mafic silicate dissolution leading to a slow reaction time/rate of oxidation [9,26]. Subsequently it is predicted that there will be a delayed onset for impacts, which is further compounded in Arctic or Sub-Arctic environmental conditions where weathering kinetics are slow under the permafrost climatic conditions.
The pH of the Pellivuoma, Sahavaara, and Tapuli HCTs gradually declined across the weeks of testing; however, the HCTs were terminated prior to the samples generating acid leachates (except for the Sahavaara PAF schist sample). As shown by the Hannukainen rocks, humidity cell testing requires significant time to generate representative data, with typical test durations of more than 40 weeks [5,6]. It can be many months between the commencement of the HCTs and when the test matures, i.e., when the test data are appropriate for use in long-term water quality predictions [26]. This is especially applicable to rock types that are slow-reacting and demonstrate a significant lag time to the onset of persistent acidic leaching conditions at which solute mobility and release from the cell is at its highest and most representative of long-term weathering [30,31]. It is essential that these release rates are used in scaling the laboratory results to field conditions so that the release of metal(loid)s can be incorporated into geochemical calculations to generate applicable source terms for numerical predictions [26,32,33].
The assessment of acid rock drainage and/or metal(loid) leaching risk forms an integral part of pre-feasibility and feasibility level mine studies. The assessment of acid rock drainage and/or metal(loid) leaching is a requirement of the Equator Principles governing Environmental and Social Impact Assessment and permitting projects funded by the World Bank. The importance of this work on several projects is that, despite initial static test predictions, the development of acidic conditions is slow and likely not to occur during operations. In the planning and permitting phase of work, this has important implications in that material can largely be comingled without concerns over segregating PAF and NAF materials. In addition, control of drainage during operations can be undertaken with collection and control of water quality through passive means rather than the development of treatment plants. Obviously the testwork feeds directly into predictive calculations and estimation of water quality changes, and these would reflect the slow development of acid generation and the delay in the release of metal(loid)s from mine waste. Due to slow oxidation of sulfides, mafic silicates that also have slow kinetics in reaction [4,5,20,25,26] can participate in acid buffering, often in contrast to other styles of mineralization where sulfide reactivity is greater [4,5,25].
Defining the amount of time it will take for acidic conditions to develop (lag time) from mine waste materials is key for the development of successful mine waste management plans, which will prevent or mitigate the effects ARDML [33]. For example, where lag times are sufficient to ensure that neutral pH conditions can be maintained for a period, it may be possible to backfill, cover, or freeze the material to prevent ARDML from developing. Similarly, it may be possible to delay the construction of a treatment plant and thereby defer some of the start-up costs for a period.

7. Conclusions

Defining the environmental geochemistry of sulfide-bearing iron oxide deposits in Arctic regions is key to minimizing the potential environmental impact of mine waste storage facilities. Early recognition of potential water quality risks is particularly important under the pristine environmental conditions of these sites, to allow effective mitigation strategies to be integrated into mine planning and design in the Arctic. Where a lag time is identified to the water quality risks emerging, there may also be strategies that can be employed in mine waste handling that reduce short-term costs without impacting the environment. This represents a significant benefit of identifying lag time and, therefore, further rationale for undertaking HCT tests.
Static and kinetic geochemical characterization data were compiled for four sulfide-bearing iron oxide deposits in the Fennoscandian Shield to determine their environmental geochemistry. Despite the low carbon and high sulfur content in most of the waste rock materials from these deposits, there was found to be a delayed onset to acid generation in the kinetic testing, with minimal sulfide consumption. This delay is primarily attributed to sulfide crystalline and mafic silicate dissolution, leading to slow reaction times and rates of oxidation.
Typically, the Hannukainen and Sahavaara deposits showed higher potential for acid generation than the Pellivuoma and Tapuli deposits; this can be linked to elevated AP (sulfur) content in the former deposits and elevated NP in the latter deposits. Skarn rocks from Hannukainen and Pellivuoma are generally characterized as potentially acid-forming based on the static testing results and also generated acid leachate in the humidity cell testing. Schist rocks at Sahavaara also show potentially acid-forming characteristics. Marble is seen as a source of acid neutralization in the Pellivuoma and Tapuli deposits, with the highest NP values reported in this material type. Rock types with high neutralization potential/carbonate content, such as marble, should be incorporated into the waste rock management plan to provide a source for neutralization potential. Potential waste handling methods could include the blending of PAF waste rock with high-NP waste rocks (e.g., marble) or the encapsulation of PAF waste rock with waste rock types containing excess neutralizing capacity.
This study provides an overview of the environmental geochemistry of the skarn-hosted sulfide-bearing iron oxide deposits in Scandinavia. These deposits show potential for acid generation but due to the buffering reactivity of mafic silicates and the high crystallinity of the sulfides; the rate of acid generation is slow, and the onset of these conditions delayed by mineral buffering.

Author Contributions

Conceptualization, R.J.B. and A.B.; methodology, R.J.B., J.E., J.D. and A.B.; software, R.J.B., J.D., R.G., A.B. and L.F.; validation R.J.B., J.D., R.G. and A.B.; formal analysis, R.J.B., J.E. and L.F.; investigation, J.E., A.B. and L.F.; resources, R.J.B., J.E., J.D., R.G., A.B., C.B., L.F., E.C. and T.L.; data curation, R.J.B. and L.F.; writing—original draft preparation, R.J.B. and J.E.; writing—review and editing, R.J.B., J.E., J.D., R.G., A.B., C.B., L.F., E.C. and T.L.; visualization, J.E. and L.F.; supervision, R.J.B.; project administration, E.C. and T.L.; funding acquisition E.C. and T.L. All authors have read and agreed to the published version of the manuscript.

Funding

Kaunis Iron and Hannukainen Mining and their predecessor (Northlands Mining).

Data Availability Statement

All data has been made available via Environmental Authorities in Finland and Sweden.

Acknowledgments

Data used in this study were from several geochemical characterization programs that were completed by SRK in support of mining or mine development projects. We would like to acknowledge and thank the many companies that funded these programs and allowed us to use the data.

Conflicts of Interest

Julien Declercq, Andrew Barnes, Christopher Brough, Elasbe Cloete, and Tuomas Lahti are affiliated with the companies WSP, Petrolab Limited, Kaunis Iron, and Hanukainen Mining plc. This work was funded by Kaunis Iron and Hanukainen Mining plc. The funding sponsors had no role in the design of the study; in the collection, analysis, or interpretation of data; in the writing of the manuscript; or in the decision to publish the results.

References

  1. Dowd, P.J. The business case for the prevention of acid drainage. In Proceedings of the 5th Australian Workshop on Acid and Metalliferous Drainage, ACMER, Brisbane, Australia, 29–31 August 2005. [Google Scholar]
  2. Lottermoser, B.G. Mine Wastes. Characterization, Treatment, Environmental Impacts; Springer: Berlin/Heidelberg, Germany, 2010; 400p. [Google Scholar]
  3. ASTM D 5744-13e1; StandARDML Test Method for Laboratory Weathering of Solid Material Using a Humidity Cell. ASTM: Washington, DC, USA, 2013.
  4. Darrell Kirk, N. A Hydrogeochemist’s Mindful Toolkit: Conceptualization, Characterization, and Modeling of Mine Sites Producing Acid Mine Drainage. In Proceedings of the International Mine Water Association Conference—Time to Come (IMWA 2025–Time to Come), Braga, Portugal, 6–11 July 2025; Valente, T., Mühlbauer, R., Ordóñez, A., Wolkersdorfer, C., Eds.; International Mine Water Association: Lakewood, CO, USA, 2025; pp. 739–744. [Google Scholar]
  5. Bezaazoua, B.; Bussieré, B.; Dagenais, A.M.; Archambault, M. Kinetic tests comparison and interpretation for prediction of the Joutel tailings acid generation potential. Environ. Geol. 2004, 46, 1086–1101. [Google Scholar] [CrossRef] [Scilit]
  6. Bowell, R.J.; Sapsford, D.J.; Dey, M.; Williams, K.P. Protocols affecting the reactivity of mine waste during laboratory-based kinetic tests. In Proceedings of the 7th International Conference on Acid Rock Drainage (ICARDML), St Louis, MO, USA, 26–30 March 2006. [Google Scholar]
  7. Hiltunen, A. The Precambrian Geology and Skarn Iron Ores of the Rautuvaara Area, Northern Finland: Geological Survey of Finland; Bulletin 318; Geologinen Tutkimuslaitos: Espoo, Finland, 1982; 133p. [Google Scholar]
  8. Huhma, H.; Mutanen, T.; Whitehouse, M. Oldest rocks of the Fennoscandian Shield: The 3.5 Ga Siurua trondhjemite gneiss in the Archaean Pudasjärvi Granulite Belt, Finland. Bull. Geol. Soc. Finl. 2004, 75, 51–68. [Google Scholar] [CrossRef] [Scilit]
  9. Weihed, P.; Arndt, N.; Billström, C.; Duchesne, J.C.; Eilu, P.; Martinsson, O.; Papunen, H.; Lahtinen, R. Precambrian geodynamics and ore formation: The Fennoscandian Shield. Ore Geol. Rev. 2005, 27, 273–322. [Google Scholar] [CrossRef] [Scilit]
  10. Wanhainen, C.; Billström, K.; Martinsson, O.; Stein, H.; Nordin, R. 160 Ma of magmatic/hydrothermal activity in the Gällivare area: Re-Os dating of molybdenite and U-Pb dating of titanite from the Aitik Cu-Au-Ag deposit, northern Sweden. Miner. Depos. 2005, 40, 435–447. [Google Scholar] [CrossRef] [Scilit]
  11. Lundberg, B. The Stora Sahavaara Iron Ore Deposit, Northern Sweden; The Geological Survey of Sweden: Stockholm, Sweden, 1967; 37p, Available online: https://resource.sgu.se/dokument/publikation/c/c620rapport/c620-rapport.pdf (accessed on 10 December 2025).
  12. Martinsson, O. Skarn Like Iron Ore Deposits; Guide 54; Geological Survey of Finland: Espoo, Finland, 2007. [Google Scholar]
  13. Baker, H.; Lepley, B.; Arthur, J. Mineral resource estimate for the Sahavaara iron deposit, Pajala municipality, Norbotten county Sweden. In SRK Consulting Report; SRK Consulting (UK) Ltd.: Cardiff, UK, 2010; 171p. [Google Scholar]
  14. Baker, H.; Lepley, B.; Arthur, J. Mineral resource estimate for the Tapuli iron deposit, Pajala municipality, Norbotten county Sweden. In SRK Consulting Report; SRK Consulting (UK) Ltd.: Cardiff, UK, 2010; 178p. [Google Scholar]
  15. Baker, H.; Lepley, B.; Arthur, J. Mineral resource estimate for the Pellivouma iron deposit, Pajala municipality, Norbotten county Sweden. In SRK Consulting Report; SRK Consulting (UK) Ltd.: Cardiff, UK, 2010. [Google Scholar]
  16. Niiranen, T. Iron oxide-copper-gold and porphyry-Cu deposits in Northern Finland and Sweden. In Proceedings of the Excursion Guide in the 25th International Applied Geochemistry Symposium 2011, Rovaniemi, Finland, 22–26 August 2011; Series B92-12; Vuorimiesyhdistys-Finnish Association of Mining and Metallurgical Engineers: Helsinki, Finland, 2011; 40p. [Google Scholar]
  17. Smart, R.; Skinner, W.M.; Levay, G.; Gerson, A.R.; Thomas, J.E.; Sobieraj, H.; Schumann, R.; Weisener, C.G.; Weber, P.A.; Miller, S.D.; et al. ARDML Test Handbook: Project P387, A Prediction and Kinetic Control of Acid Mine Drainage; AMIRA, International Ltd.: Melbourne, Australia, 2002; 42p. [Google Scholar]
  18. Ojala, V.J.; Weihed, P.; Eilu, P.; Iljina, M. Guide 54; Geological Survey of Finland: Espoo, Finland, 2007; 102p. [Google Scholar]
  19. Price, W.A. Prediction Manual for Drainage Chemistry from Sulfidic Geological Materials; Mine Environment Neutral Drainage (MEND) Report 1.20.1; Mining and Mineral Sciences Laboratories Natural Resources Canada: Ottawa, ON, Canada, 2009; 579p. [Google Scholar]
  20. Mason, B. Principles of Geochemistry, 3rd ed.; John Wiley: Hoboken, NJ, USA, 1966; Volume 329, 190p. [Google Scholar]
  21. Rose, A.W.; Hawkes, H.E.; Webb, J.S. Geochemistry in Mineral Exploration, 2nd ed.; Academic Press: Cambridge, MA, USA, 1979; 657p. [Google Scholar]
  22. Sobek, A.A.; Schuller, W.A.; Freemen, J.R.; Smith, R.M. Field and Laboratory Methods Applicable to Overburdens and Minesoils; Report EPA-600/2-78-054, US National Technical Information Service Report PB-280, 495; Industrial Environmental Research Laboratory, Office of Research and Development, U.S. Environmental Protection Agency: Cincinnati, OH, USA, 1978. [Google Scholar]
  23. Prestia, A.; Bowell, R.; Warrender, R.; Barnes, A.; Lassiter, D. Environmental geochemistry of the Hycroft Mine: A case study on the limitation of Sobek-style acid-generation predictions. Geochem. Explor. Environ. Anal. 2013, 13, 171–182. [Google Scholar] [CrossRef] [Scilit]
  24. O’Shay, T.A.; Hossner, L.R.; Dixon, J.B. A modified hydrogen peroxide oxidation method for determination of potential acidity in pyritic overburden. J. Environ. Qual. 1990, 19, 778–782. [Google Scholar] [CrossRef] [Scilit]
  25. Stewart, W.A.; Miller, S.D.; Smart, R. Advances in Acid Rock Drainage (ARDML) Characterization of Mine Wastes. In Proceedings of the 7th International Conference on Acid Rock Drainage (ICARDML), St Louis, MO, USA, 26–30 March 2006; Barnhisel, R.I., Ed.; American Society of Mining and Reclamation (ASMR): Lexington, KY, USA, 2006; pp. 2098–2119. [Google Scholar]
  26. Barnes, A.; Bowell, R.; Warrender, R.; Sapsford, D.; Sexsmith, K.; Charles, J.; Declercq, J.; Santonastaso, M.; Dey, B. Comparison between Long-Term Humidity Cell Testing and Static Net Acid Generation (NAG) Tests: Potential for NAG Use in Preliminary Mine Site Water Quality Predictions. In Proceedings of the 10th ICARDML & IMWA Annual Conference, Santiago, Chile, 21–24 April 2015. [Google Scholar]
  27. Brough, C.P.; Warrender, R.; Bowell, R.J.; Barnes, A.; Parbhakar-Fox, A. The process mineralogy of mine wastes. Miner. Eng. 2013, 52, 125–135. [Google Scholar] [CrossRef] [Scilit]
  28. Brough, C.P.; Strongman, J.; Bowell, R.; Warrender, R.; Prestia, A.; Barnes, A.; Fletcher, J. Automated environmental mineralogy; the use of liberation analysis in humidity cell testwork. Miner. Eng. 2016, 107, 112–122. [Google Scholar] [CrossRef] [Scilit]
  29. Lehner, S.; Savage, K.; Ciobanu, M.; Cliffel, D.E. The effect of As, Co and Ni impurities on pyrite oxidation kinetics: An electrochemical study of synthetic pyrite. Geochem. Cosmochim. Acta 2007, 71, 2491–2509. [Google Scholar] [CrossRef] [Scilit]
  30. Sapsford, D.; Bowell, R.; Dey, M.; Williams, K.A. Humidity cell tests for the prediction of acid rock drainage. Miner. Eng. 2009, 22, 25–36. [Google Scholar] [CrossRef] [Scilit]
  31. Sexsmith, K.; MacGregor, D.; Barnes, A. Comparison of actual and calculated lag times in humidity cell tests. In Proceedings of the 10th International Conference on Acid Rock Drainage and IMWA Annual Conference, Santiago, Chile, 21–24 April 2015. [Google Scholar]
  32. Bowell, R.; Brough, C.; Barnes, A.; Vardanyan, A. Geometallurgy of Trace Elements in the Hrazdan Iron Deposit. Minerals 2021, 11, 1085. [Google Scholar] [CrossRef] [Scilit]
  33. Griffiths, R.; Prestia, A.; Bowell, R.; Brough, C.; Donkervoort, L.; Dixon, J. Environmental Geochemistry of the Round Mountain Gold Mine, Nevada, and Mineralogical Controls on Acid Generation. Econ. Geol. 2023, 118, 549–570. [Google Scholar] [CrossRef] [Scilit]
Figure 1. Geological map of the Fennoscandian Shield, showing geology and the more significant metal mines of the region. The largest active mines are named. Black squares indicate major cities. Hannukainen, Sahavaara, Pellivuoma, and Tapuli are shown in red text. Modified from a publication by the Geological Survey of Finland, 2012 [7].
Minerals 16 00171 g001
Figure 2. Microphotographs of representative thin sections of the samples from Hannukainen. (A) Cross-Polarized Transmitted Light Micrograph. X 5.0 Field of View = 2.32 mm. Calcite (pink) has high interference colors next to feldspar (gray) and magnetite (opaque). (B) Plane-Polarized Transmitted Light Micrograph. X 5.0 Field of View = 2.32 mm. Amphibole (hornblende—green/brown) with albite (clear). (C) Plane-Polarized Reflected Light Micrograph. X 5.0 Field of View = 2.32 mm. Pyrite (bright yellow center) and chalcopyrite (gold top right). (D) Plane-Polarized Reflected Light Micrograph. X 5.0 Field of View = 2.32 mm. Pyrite (bright yellow—e.g., top right) appears next to more finely disseminated chalcopyrite (darker gold). (E) SEM Micrograph. Albite (spectrum 1), quartz (spectrum 2), and biotite (spectra 3 and 9) matrix contains the sulfides pyrite (spectrum 7), chalcopyrite (spectrum 6), and mackinawite (spectrum 8). Clinochlore occurs next to the sulfides (spectra 4 and 5). (F) SEM Micrograph. Albite (spectrum 1), microcline (spectrum 2), and hornblende (spectrum 3); magnetite (spectra 4 and 6) is next to pyrite (spectrum 5), and chalcopyrite (spectra 7, 8, and 9) is disseminated in the silicate matrix.
Minerals 16 00171 g002
Figure 3. Scatter plots of ABA and NAG data: (A) total sulfur vs. sulfide sulfur; (B) acid generation potential vs. neutralization potential; (C,D) neutralization potential ratio vs. net neutralization potential; and (E,F) net acid generation potential pH vs. net acid generation (NAG) value.
Minerals 16 00171 g003
Figure 4. Humidity cell test time series plots for (A) leachate pH; (B) remaining neutralizing potential; and (C) remaining sulfur content.
Minerals 16 00171 g004aMinerals 16 00171 g004b
Table 1. Summary of samples collected from the four study sites submitted for static testing.
SahavaaraTapuliPellivuomaHannukainen
Amphibolite1 119
Diorite 13
Granite1 3
Marble 53
Monzonite 28
Overburden2234
Phyllite1042
Quartzite32
Schist72 3
Skarn37172
Volcanics1 4
Total28223549
Table 2. Interpretation of acid–base accounting (ABA) data [24].
NNP (kg CaCO3 eq/t)NPR
Potentially Acid-Forming (PAF)<−20<1
Uncertainty Zone−20 to 201 to 3
Non-Acid-Forming (NAF)>20>3
Table 3. Acid generation criteria for net acid generation (NAG) test results [25,26].
Acid Generation CapacityFinal NAG pH
(s.u.)
Static NAG Value
(kg H2SO4 eq/t)
Potentially Acid-Forming (PAF)Higher Capacity<4.5<10
Lower Capacity<4.5<10–>1
Non-Acid-Forming (NAF)>4.50
Table 4. Summary of multi-element assay results for key parameters for Hannukainen, Pellivuoma, Sahavara, and Tapuli, with comparison to average crustal abundance [20].
CountAsCdCoCuFeMnNiPbSSbSeVZn
mg/kgmg/kgmg/kgmg/kgmg/kgmg/kgmg/kgmg/kg%mg/kgmg/kgmg/kgmg/kg
Crustal Abundance [20] 1.800.2025.055.050,00095075.013.00.0300.200.1013570.0
HannukainenAmphibolite191.440.1843.737973,38985362.79.521.260.421.0215555.0
Diorite130.950.1526.621859,71556228.26.000.680.350.5010539.5
Granite0-------------
Marble0-------------
Monzonite81.690.1113.350.239,58856524.79.040.0390.130.5093.446.2
Overburden41.450.106.3321.224,17535317.110.40.0200.501.6367.426.8
Phyllite0-------------
Quartzite0-------------
Schist310.40.2379.2709104,833114612318.15.370.504.1731568.0
Skarn21.400.1081.1375156,000159365.74.502.250.100.5513548.5
Volcanics0-------------
PellivuomaAmphibolite14.740.4028.720141,575135833.54.670.630.220.2099.9448
Diorite0-------------
Granite36.070.0538.7821.728,0452646.207.140.0330.190.3244.926.4
Marble36.850.0979.2238.212,413212414.73.170.310.0820.2012.14.33
Monzonite21.170.09412.134.133,1364829.382.120.0270.0850.2977.338.7
Overburden31.360.0327.4127.321,75325314.43.810.0110.330.2055.119.5
Phyllite24.630.09322.166.733,97882239.66.860.0140.320.3713730.8
Quartzite0-------------
Schist0-------------
Skarn172.160.02456.434348,6107106.802.071.060.0551.089.2913.6
Volcanics43.460.1319.048.826,69452332.12.490.0970.270.3575.138.4
SahavaaraAmphibolite10.490.01523.68.4941,73884662.70.700.0430.0500.2099.933.1
Diorite0-------------
Marble0-------------
Monzonite0-------------
Granite10.100.0155.9712.820,64918311.85.910.0150.0920.3260.812.6
Overburden20.650.03437.311084,20785964.73.800.180.130.2023752.9
Phyllite102.000.03119.994.941,18636758.25.090.570.120.6910434.2
Quartzite34.130.0286.7330.923,06621817.95.540.0690.0780.7439.116.0
Schist724.60.08654.646598,9204151436.966.310.303.8212420.6
Skarn310.90.06937.429768,3075431385.182.600.171.0414234.4
Volcanics10.920.0157.0212.728,87631335.14.870.0590.0500.2066.317.3
TapuliAmphibolite0-------------
Diorite0-------------
Marble53.380.6814.367.016,04688914.836.00.520.0500.968.22234
Monzonite0-------------
Granite0-------------
Overburden20.900.0336.459.9522,85021328.23.530.0100.0620.2049.330.7
Phyllite43.540.02527.285.142,9735591043.050.380.250.2011043.8
Quartzite20.380.02720.064.633,26329886.69.120.280.0660.2094.417.3
Schist21.120.01519.96.8635,22224675.90.360.0150.0500.2269.413.2
Skarn70.650.01515.021.623,77923543.21.620.110.0870.4244.56.79
Volcanics0-------------
2× average crustal abundance (gray shade)
3× average crustal abundance (gray shade, bold font)
4× average crustal abundance (gray shade, bold and underlined font)
Table 5. Summary of acid–base accounting (ABA) test results for Hannukainen, Pellivuoma, Sahavaara, and Tapuli.
CountTotal S (%)Sulfide S (%)TIC (%)AP (kg CaCO3/t)NP (kg CaCO3/t)NNP (kg CaCO3/t)NPR
AverageMinMaxAverageMinMaxAverageMinMaxAverageMinMaxAverageMinMaxAverageMinMaxAverageMinMax
HannukainenAmphibolite191.260.0494.11.170.0134.010.0810.010.4236.60.391257.883.7522.0−28.8−1188.191.900.04310.2
Diorite130.680.0632.180.610.0301.960.0560.010.1619.20.9461.35.923.0015.5−13.3−55.814.11.730.07710.7
Granite 0---------------------
Marble 0---------------------
Monzonite80.0390.0080.070.00880.0010.0270.020.010.0500.270.0280.843.472.005.003.191.474.4163.83.26133
Overburden40.02<0.010.0270.0010.0010.0010.0270.0130.0530.0310.0310.0312.130.0203.752.10−0.0113.7268.20.64120
Phyllite0---------------------
Quartzite0---------------------
Schist35.372.926.655.132.816.560.310.0900.6816087.820515.72.0035.5−145−203−52.30.150.00980.4
Skarn22.251.253.252.041.092.990.150.10.2063.834.293.312.411.013.8−51.4−82.3−20.40.260.120.4
Volcanics0---------------------
PellivuomaAmphibolite10.620.620.620.590.590.590.030.030.0318.418.418.45.55.505.50−12.9−12.9−12.90.300.300.3
Diorite0---------------------
Granite30.0430.030.060.0330.020.050.150.010.251.040.631.5615.5028.614.5−0.6327.112.5019.2
Marble30.260.20.360.210.150.310.48.7411.56.574.699.3852751553452050652987.655.0113
Monzonite20.027<0.010.0440.0220.010.0340.0230.010.0360.680.311.051.1202.240.44−1.051.933.5807.16
Overburden30.010.010.010.010.010.010.0950.0120.150.310.310.31000−0.31−0.31−0.31000
Phyllite20.011<0.010.0130.00640.00280.010.160.010.320.200.0870.315.22010.45.02−0.3110.459.90120
Quartzite0---------------------
Schist0---------------------
Skarn171.19<0.018.71.110.0108.490.480.012.9534.60.3126547.46.9723612.8−2262129.850.1579.6
Volcanics40.094<0.010.310.0870.0100.290.0140.000330.0362.720.319.200.06200.25−2.66−9.20−0.310.05700.23
SahavaaraAmphibolite10.170.170.170.150.150.150.210.210.214.714.714.7197.597.597.592.892.892.820.720.720.7
Diorite0---------------------
Granite10.0150.0150.0150.010.010.010.010.010.010.310.310.319.369.369.369.059.059.0530.030.030.0
Marble 0---------------------
Monzonite0---------------------
Overburden20.056<0.01<0.010.0100.0100.0100.0610.010.110.310.310.314.0008.003.69−0.317.6912.8025.6
Phyllite100.510.0192.520.480.0102.400.170.010.8514.90.3175.119.01.9878.34.080.0116.815.091.0116.8
Quartzite31.71<0.015.051.650.0104.890.160.0310.3651.60.311539.64019.7−42.0−1337.631.9305.67
Schist76.620.1120.86.470.09020.50.860.223.112022.8364274.17.21267−128−6351986.040.01137.6
Skarn31.120.053.121.070.0333.010.230.010.6633.41.0294.128.49.9559.8−4.99−34.310.44.480.649.73
Volcanics10.050.050.050.0300.0300.0300.180.180.180.920.920.9271.471.471.470.570.570.577.277.277.2
TapuliDiorite0---------------------
Granite0---------------------
Diorite0---------------------
Marble50.440.110.80.380.0740.7211.26.0513.611.92.3222.654847163853644862580.720.8231
Monzonite0---------------------
Overburden2<0.01<0.01<0.010.010.010.0100.0980.0630.130.310.310.310.870.251.490.55−0.0651.172.770.794.75
Phyllite40.36<0.010.720.340.010.670.0210.010.05110.60.3120.912.62.0022.92.01−13.122.620.20.3773.2
Quartzite20.27<0.010.530.260.010.500.010.010.018.020.3115.713.012.213.95.00−1.8811.919.90.8839.0
Schist20.0150.0110.0190.010.010.010.320.320.320.310.310.3118.113.123.117.812.822.858.041.974.0
Skarn70.11<0.010.50.0880.010.411.140.0106.002.750.3112.994.15.9146091.35.0744766.87.02188
Volcanics0---------------------
Table 6. Summary of NAG test results for Hannukainen, Pellivuoma, Sahavaara, and Tapuli.
CountNAG pH (s.u.)NAG Value (kg H2SO4 eq/t)
AverageMinMaxAverageMinMax
HannukainenAmphibolite195.392.709.809.28041.2
Diorite135.323.0010.54.52015.7
Granite0------
Marble0------
Monzonite87.447.307.60000
Overburden47.207.107.30000
Phyllite0------
Quartzite0------
Schist32.732.702.8050.335.363.7
Skarn25.002.707.3020.6041.2
Volcanics0------
PellivuomaAmphibolite13.243.243.245.885.885.88
Diorite0------
Granite36.796.337.101.2901.96
Marble37.697.547.93000
Monzonite26.246.016.472.451.952.94
Overburden35.274.496.045.824.827.78
Phyllite26.115.846.393.390.965.81
Quartzite0------
Schist0------
Skarn176.462.508.4114.50127
Volcanics45.623.486.443.161.964.88
SahavaaraAmphibolite17.157.157.15000
Diorite0------
Granite15.605.605.605.865.865.86
Marble0------
Monzonite0------
Overburden24.003.844.156.365.866.86
Phyllite105.242.917.274.28010.6
Quartzite34.122.415.825.691.9410.7
Schist73.922.288.049.44015.6
Skarn34.872.945.866.863.9211.8
Volcanics16.886.886.880.960.960.96
TapuliAmphibolite0------
Diorite0------
Granite0------
Marble57.937.468.41000
Monzonite0------
Overburden24.043.944.148.317.818.82
Phyllite44.813.216.433.660.975.88
Quartzite24.694.115.283.652.914.39
Schist26.195.327.062.9105.81
Skarn76.946.027.840.6901.94
Volcanics0------
Table 7. Summary of static and kinetic test results.
SampleSulfide SAPNPNNPNPRTotal NAGNAG pHFinal HCT pHMin HCT pHNP Remaining at TerminationS Remaining at TerminationTotal No. of Weeks
%kg CaCO3 eq/t kg H2SO4 eq/ts.u.s.u.s.u.%%#
Hannukainen Skarn2.9993.311.0−82.30.12 *41.22.74.34.316.594.1170
Hannukainen Schist2.8187.835.5−52.30.40 *35.32.83.93.990.494.7170
Hannukainen Amphibolite 10.7022.04.75−17.30.22 *5.93.74.64.437.496.8170
Hannukainen Amphibolite 21.8858.87.25−51.50.12 *9.83.35.75.160.197.8170
Hannukainen Amphibolite 32.7886.83.75−83.00.04 *26.52.83.83.7096.6170
Hannukainen Diorite 11.9661.35.50−55.80.09 *15.73.25.85.154.896170
Hannukainen Diorite 20.4614.54.50−10.00.31 *2.94.26.96.130.295.8170
Hannukainen Diorite 31.6752.24.00−48.20.08 *9.83.36.65.745.497.9170
Pellivuoma NAF Skarn 10.247.506.97−0.530.93 *07.27.77.764.697.940
Pellivuoma NAF Skarn 20.4815.053.938.93.6008.08.68.196.695.240
Pellivuoma Marble0.309.385155065507.58.68.599.897.140
Pellivuoma PAF Skarn 11.0934.133.2−0.890.97 *1.94.28.17.988.899.040
Pellivuoma PAF Skarn 22.1266.317.6−48.70.27 *54.42.58.07.688.899.240
Pellivuoma PAF Skarn 31.8959.113.5−45.60.23 *08.28.76.8093.860
Sahavaara NAF Phyllite0.061.971.980.011.015.93.36.55.971.899.480
Sahavaara PAF Schist20.56427.21−6350.01 *12.53.33.73.518.399.140
Sahavaara PAF Phyllite2.4075.0783.131.0410.62.47.46.097.197.760
Sahavaara NAF Quartzite0.051.639.277.635.671.92.97.86.492.596.160
Tapuli PAF Phyllite 10.6720.9017.8−3.150.85 *5.95.86.04.692.996.8140
Tapuli PAF Phyllite 20.6720.817.75−13.10.37 *5.93.26.35.486.798.9140
Tapuli NAF Marble0.3912.363862552.003.57.27.299.896.640
Tapuli NAF Skarn0.010.3139.839.412707.77.67.298.379.840
* Indicates PAF classification based on static testwork.
Disclaimer/Publisher’s Note: The statements, opinions and data contained in all publications are solely those of the individual author(s) and contributor(s) and not of MDPI and/or the editor(s). MDPI and/or the editor(s) disclaim responsibility for any injury to people or property resulting from any ideas, methods, instructions or products referred to in the content.