


Abstract
Coarse particle flotation technologies have emerged to overcome the limitations of conventional flotation circuits, whose performance decreases for coarse fractions. Metso’s Coarse Particle Flotation (CPF) technology takes an approach based on feeding directly into the froth zone, where particle collection and froth transport processes occur. Currently, there are no models that link operating variables with the metallurgical performance of this technology. This work presents a model for the Metso’s CPF cell based on the two phenomena that occur simultaneously in the froth zone: particle collection and the transport of particle–bubble aggregates by the froth. The collection process is modelled using a rectangular distribution for flotation kinetics and a residence time distribution based on three perfectly mixed reactors in series: two small reactors and one large. The transport of the froth is represented as a function of froth stability, froth transport distance, and gas residence time. The model was calibrated using laboratory experimental data from copper ore, showing a maximum absolute error in Cu recovery of 2.9%. The main results showed recoveries of approximately 70% for the 300–425 μm class and approximately 50% for the +425 μm class. The size analysis showed a systematic decrease in recovery with particle size, with critical behavior at low froth depths and low superficial gas velocity. A sensitivity analysis confirmed consistent model responses to changes in the main operating variables.
1. Introduction
Conventional flotation circuits have been built around two types of cells: conventional mechanical cells and pneumatic columns. The circuits are configured in different stages. The rougher flotation stage, which includes conventional mechanical cells, aims to maximize recovery. The cleaning, recirculation, and secondary cleaning stages, which include mechanical cells and columns, aim to reach the target concentrate grade.
These configurations have worked as expected, achieving high recoveries for intermediate particle sizes (for example, 20–150 µm) and lower recoveries at the fine and coarse ends, which is a phenomenon reported across multiple studies and known as the “elephant curve” [1].
For decades, the presence of high-grade ores with characteristics that made them relatively easy to process meant that the losses associated with fine and coarse size fractions were minor compared to the total valuable mineral.
In recent decades, this situation has changed drastically due to the progressive depletion of high-grade mineral deposits. The drop in ore grades, along with increased mineralogical complexity and low liberation levels, has made efficient recovery using conventional technologies increasingly difficult. As a result, metallurgical losses associated with fine and coarse particles have become increasingly important in the overall performance of concentrator plants.
Several studies have investigated the effect of particle size on the flotation process, showing that the loss mechanisms are different for fine, intermediate, and coarse particles [2]. These findings have driven the development of processing strategies tailored to each size, aiming to maximize overall circuit recovery and highlighting the need for differentiated treatment depending on the size class [3]. In this context, hybrid circuits have emerged that combine conventional mechanical cells with specialized technologies for recovering fine and/or coarse particles.
1.1. Coarse Particle Flotation
The recovery of coarse particles is limited by mineralogical and hydrodynamic factors. As particle size increases, the probability of finding properly liberated particles decreases, reducing the hydrophobic surface available for adhesion. At the same time, the increased mass and inertia of the particles enhance the hydrodynamic and gravitational forces acting on the bubble–particle aggregate. Due to both effects, the stability of the bubble–particle aggregate decreases, increasing the probability of detachment and reducing recovery in conventional flotation circuits [4].
Identifying the phenomena that limit the recovery of coarse particles has allowed for proposing various conceptual solutions aimed at mitigating their effects. Most technological developments have focused on promoting the stability of the bubble–particle aggregate. The main strategies include reducing hydrodynamic forces, improving the probability of attachment, and optimizing the contact and transport stages [4].
The concepts described above have been implemented in various technologies aimed at coarse particle recovery and overcoming the limitations of conventional flotation equipment. Among the main alternatives developed in recent years are HydroFloat [5,6], NovaCell [7,8], Reflux Flotation Cell (RFC) [9,10], and CoarseAir [11], which promote the stability of the bubble–particle aggregate, mainly through the generation of low-turbulence zones [12].
Another alternative is Metso’s Coarse Particle Flotation (CPF) technology [13], which takes a different approach. Unlike conventional cells, where the feed enters the pulp zone, in Metso’s CPF technology, the feed is introduced directly into the froth zone (feed to froth) through a system designed to evenly distribute the pulp and promote aeration [14]. This configuration allows the separation to occur mainly in the froth, reducing losses from particles that break off and fall through the pulp–froth interface. Also, by shortening the transport distance to the concentrate and exposure to high-turbulence zones, Metso’s CPF technology helps recover coarse particles better compared to conventional flotation systems [13,14,15]. This approach has allowed coarse particles with limited exposure of valuable minerals on the surface to be recovered, showing the effective flotation of partially liberated composites. Cu recoveries of approximately 72%–85% have been reported for particles with less than 20% exposed valuable mineral surface [16]. Metso’s CPF technology does not require extra water for fluidization and works without pre-classifying the feed, which results in lower water demand and a simpler flotation flow diagram [17].
1.2. Modelling Structure of Flotation Equipment
The development of metallurgical performance models for flotation equipment has followed a common structure based on the physical zones of the equipment, and understanding this structure is necessary to identify why Metso’s CPF technology requires a different modelling approach.
1.2.1. Mechanical Cells
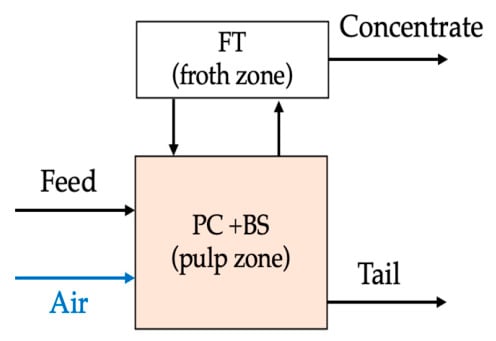
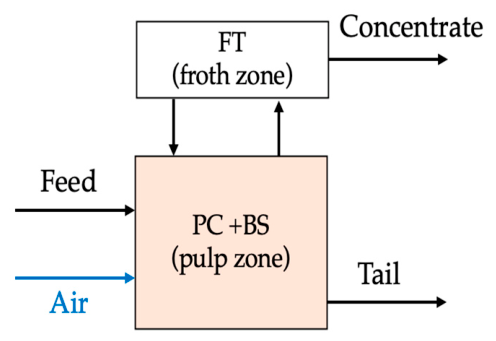
In conventional mechanical cells, the modelling of metallurgical performance is structured around two main zones: the particle collection (PC) and bubble–particle aggregate separation (BS) zone, and the froth transport (FT) zone, as shown in Figure 1. In this case, there is a single volume in which the zone (PC + BS) is confined. Particle collection and bubble-particle separation occur within the pulp zone, governed by the apparent flotation kinetics of the pulp.
Figure 1.
Mechanical forced air flotation cell.
The froth zone is a separate cleaning stage that allows reaching concentrate grades with a reduced amount of gangue mineral entrained. In this zone, some of the collected valuable mineral detaches and drops back into the pulp zone before reaching the concentrate.
1.2.2. Metso’s CPF Technology
Unlike conventional mechanical cells, the recovery of valuable minerals in the CPF technology occurs exclusively in the froth zone. In addition, a shallow pulp zone is needed for the generation and dispersion of bubbles, creating a distinctive interface between the pulp and the froth, which receives the uncollected material and discharges it as tailings. This key difference from conventional flotation means that existing flotation models, which are usually based on collecting particles in the pulp zone followed by transporting and cleaning the froth, cannot be directly applied to CPF operations. Therefore, the development of a dedicated modelling framework is required to describe the unique feed-to-froth separation mechanism of CPF technology. In this study, the model development considers a process that occurs exclusively within the froth volume, incorporating its kinetic and hydrodynamic characteristics.
The proposed approach represents particle collection and froth transport as simultaneous phenomena occurring within the froth zone and, to the authors’ knowledge, is the first phenomenological model specifically developed for a coarse particle flotation technology with direct pulp feeding into the froth. Its novelty lies in coupling and adapting established formulations for particle collection and froth transport to capture the distinctive feed-to-froth configuration of CPF technology.
The experimental laboratory data allowed for the model’s fitting, validation, and simulation of a continuous operation. This article shows the results of the adjustment for both bulk particles responses and by particle size-class, followed by a sensitivity analysis that shows how the model responds to changes in the main operating variables and identifies the operating conditions needed to maintain the recovery of coarse particles.
2. Process Modelling
2.1. Development of a Flotation Model for CPF Cell
2.1.1. Modelling Structure
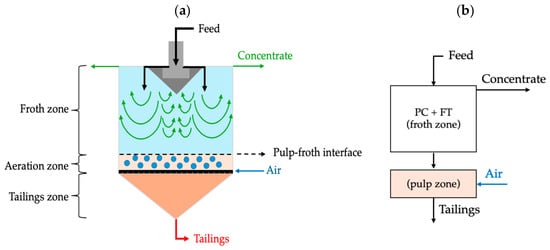
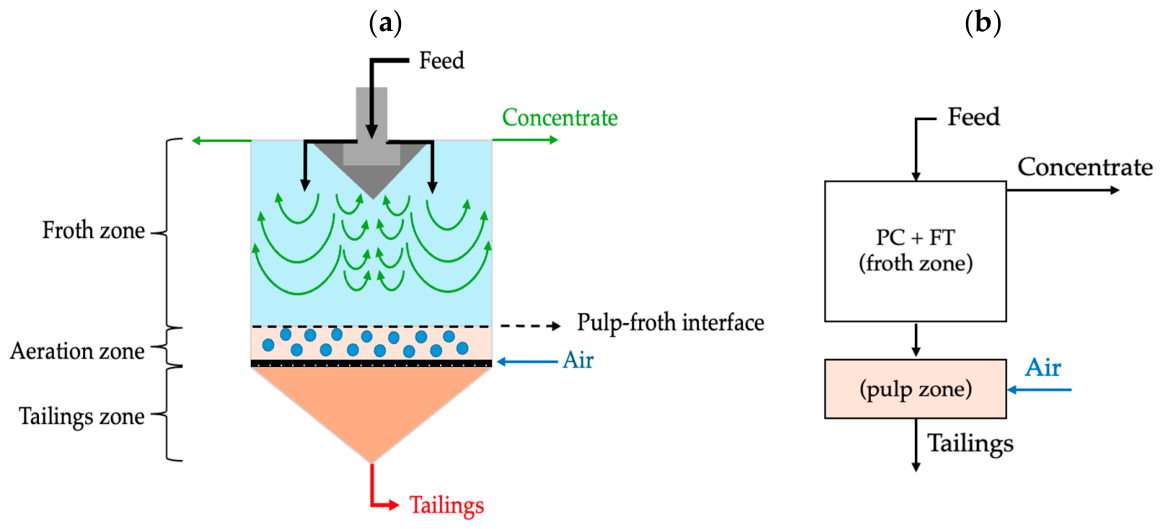
The CPF cell in Figure 2a has three zones: (i) a froth zone where particle collection and separation happen, (ii) an aeration zone responsible for spreading air and generating bubbles to create the pulp–froth interface, and (iii) a tailings zone that receives the unrecovered material for discharge [13].
Figure 2.
(a) Metso’s CPF technology (adapted from Carvalho et al. [18]), and (b) model structure of the CPF cell.
For modelling purposes, only two zones represent the cell operation, as shown in Figure 2b. The first one corresponds to the froth zone, where particle collection and froth transport (PC + FT) are represented together. The second zone corresponds to the pulp zone, where the aeration system and tailings discharge are shown.
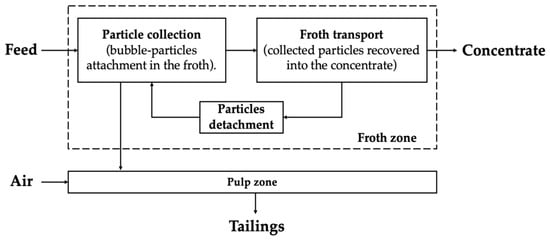
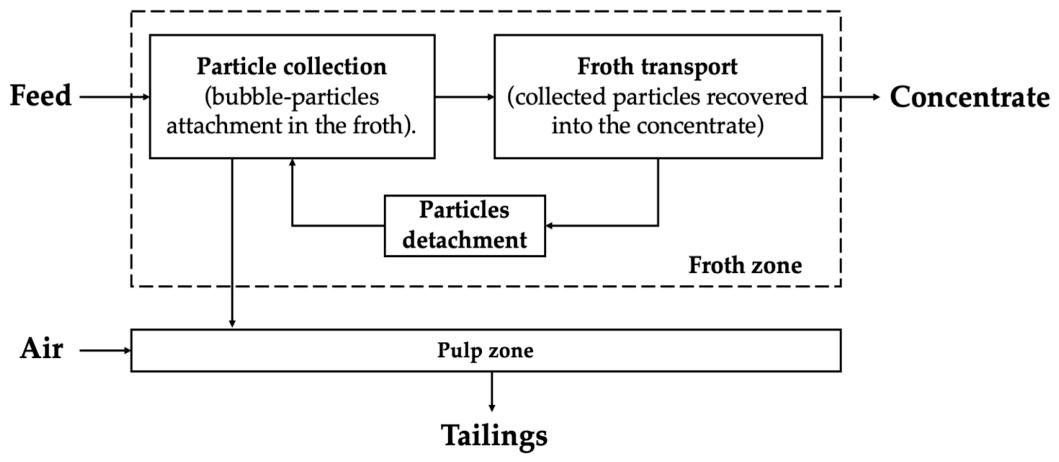
Figure 3 shows a diagram of the stages considered in the model, showing the mass flows between the different zones of the system. For modelling purposes, the froth zone is divided into two phenomenological stages to represent the following processes: (i) the net particle collection and (ii) the froth transport.
Figure 3.
Modelling of the different zones of the CPF cell.
The valuable mineral in the feed goes straight into the froth zone. Inside this zone, particle–bubble interactions occur, giving particles a chance to be collected. Then, the collected particles are transported in the froth to the concentrate.
During froth transport, collected particles moving towards the cell lip may detach but remain within the froth zone, where they can potentially be recollected. Particles that are neither collected nor recollected move downward and reach the pulp zone. For modelling purposes, it is assumed that particles entering the pulp zone are not recovered and are ultimately discharged as tailings. This assumption is considered reasonable for coarse particles, as particles that are not retained in the froth have a low probability of reentering the froth zone and subsequently being collected and transported to the cell lip.
2.1.2. Calculation of the Total Recovery of the CPF Cell
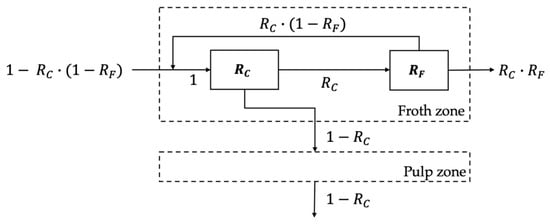
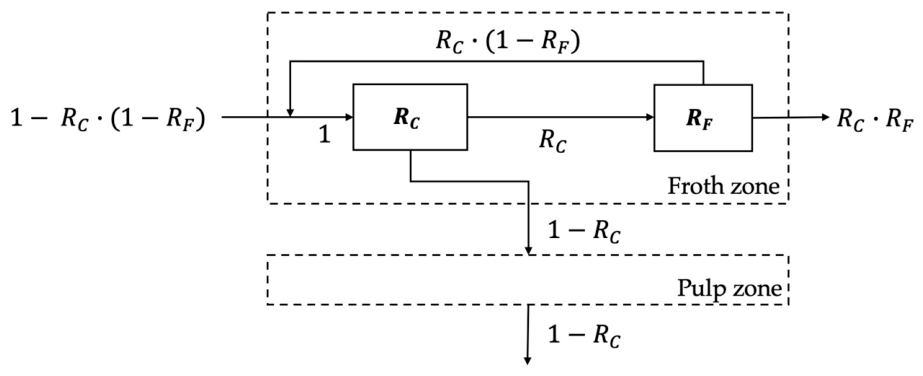
The modelling objective is to represent the CPF cell considering the sub-processes and the internal recirculation occurring inside the froth zone (Figure 3). In conventional mechanical cells, recovery depends on both collection and froth recoveries, according to the two-stage mass balance (pulp and froth) within the cell [19], including froth drop-back [20]. Similarly, Figure 4 shows the recovery of the CPF cell from each individual zone using a mass balance, where the recovery of valuable minerals is expressed in terms of the recoveries from the two processes: collection recovery () and froth transport recovery (). The feed flow to the collection stage (fresh feed plus detachment) is normalized to 1.
Figure 4.
Mass balance inside a CPF cell for estimating total recovery.
By solving the mass balance, the total recovery () is calculated as shown in Equation (1) as the flow of valuable mineral in the concentrate divided by that in the feed.
In addition, the concentrate grade of the valuable mineral () is calculated from the total recovery (), the feed grade of the mineral (), the grade of the valuable element (e.g., Cu) in the mineral species (), and the recovery () and grade (), of the gangue, as shown in Equation (2).
The recovery of gangue () is obtained by applying Equation (1) to the non-valuable material, using the same froth collection and transport model as for the valuable mineral. In this case, the gangue model represents the net effect of gangue associated to the valuable mineral and the entrained gangue that reaches the froth zone directly.
2.1.3. Characteristics of the CPF Cell for Process Modelling
The CPF cell model considers the processes occurring in the froth zone to estimate metallurgical performance. The input variables for modelling are classified into three categories:
- Feed characteristics: feed solids flowrate, solids content, solids density, and feed grade.
- Equipment design specifications: cell volume, froth crowder volume, and froth transport distance.
- Operating conditions: froth depth () and superficial gas velocity ().
The main modelling assumptions for the CPF cell performance are:
- The process consists of two sub-processes occurring simultaneously within the froth zone: particle collection (PC) and froth transport (FT).
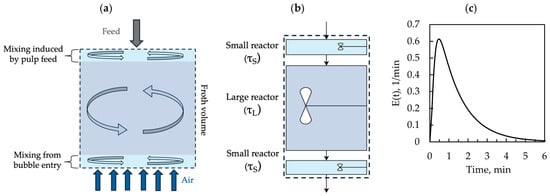
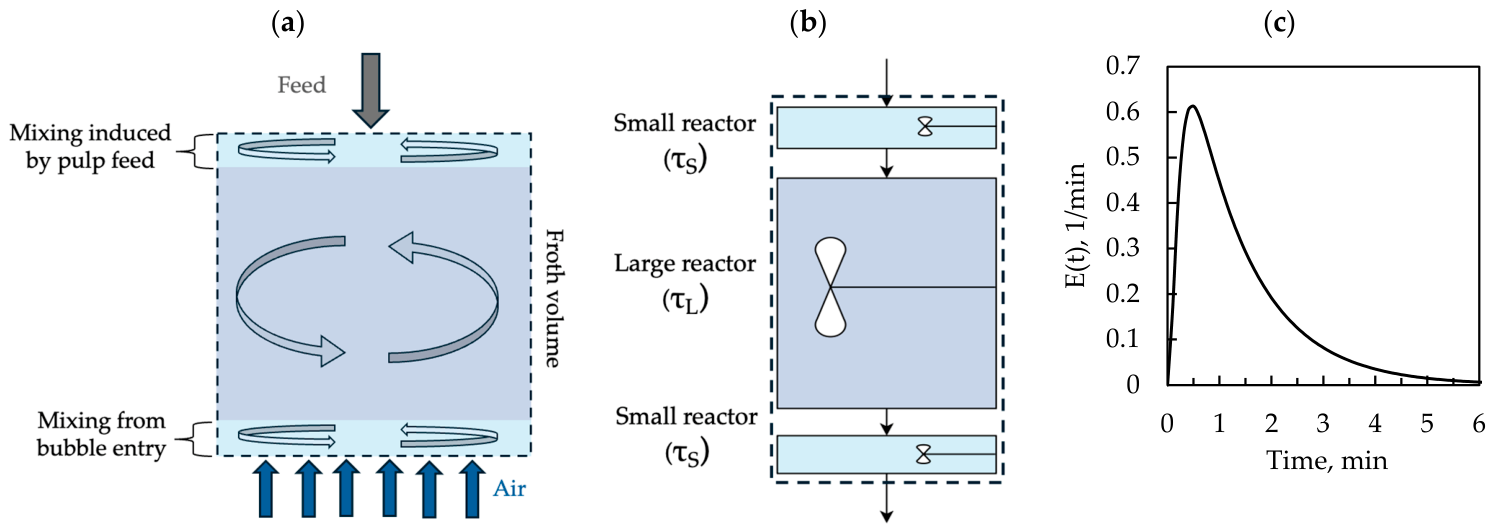
- The residence time distribution during the collection process is represented by two small and one large perfectly mixed reactor in series, based on the model used for the collection zone of industrial flotation columns. This assumption is based on qualitative observations that suggest non-ideal mixing and pulp distribution within the froth zone. A large mixing zone between the pulp and air bubbles was observed in the froth, as well as two smaller and local mixing zones. The first small zone was caused by the pulp entering the froth near the top of the cell, and the second one was near the pulp–froth interface, caused by the air bubbles entering the froth. Figure 5 schematically illustrates these mixing regions and their phenomenological representation by the three perfectly mixed reactors in series.
- The particle residence time in the froth zone during the collection process is equal to the liquid residence time.
- The residence time associated with froth transport corresponds to the gas residence time.
- Entrainment of particles from the pulp zone is neglected, assuming that the downward flow generated by the direct feed to the froth zone acts similarly to wash water in flotation columns, generating a positive bias [21].
- Particle collection in the pulp zone is assumed to be negligible, as particles reaching this zone are expected to be predominantly intermediate-to-coarse in size and are likely to detach while crossing the pulp–froth interface.
- The system operates under continuous steady-state conditions.
Figure 5.
Phenomenological representation of froth mixing in the CPF cell: (a) conceptual mixing regions, (b) three-reactor representation, and (c) residence time distribution.
The following sections describe the models used to represent each process occurring in the froth zone of the CPF cell.
2.1.4. Particle Collection Modelling
Consistent with the visual flow patterns observed during feeding, the mixing regime in the froth zone for the collection process was represented by a residence time distribution (RTD) based on three perfectly mixed reactors in series: two small reactors (with residence time ) and one large reactor (with residence time ), as proposed by Yianatos et al. [22]. A rectangular distribution of rate constants [23] describes the net collection kinetics. The froth collection recovery () of the valuable mineral is thus estimated as shown in Equation (3):
where is the maximum rate constant of the rectangular distribution, is the maximum recovery, and is defined in Equation (4):
The value of is modelled as a function of the superficial gas rate () and froth depth () as shown in Equation (5), where , , and are fitting parameters for each case, to account for the effect of gas rate () and froth depth ():
The residence times of the large and small reactors are estimated as and [22], where corresponds to the mean liquid residence time in the froth, which can be calculated according to Equation (6):
where is the total froth zone volume, is the volumetric flowrate of the feed slurry, and is the average gas holdup in the froth.
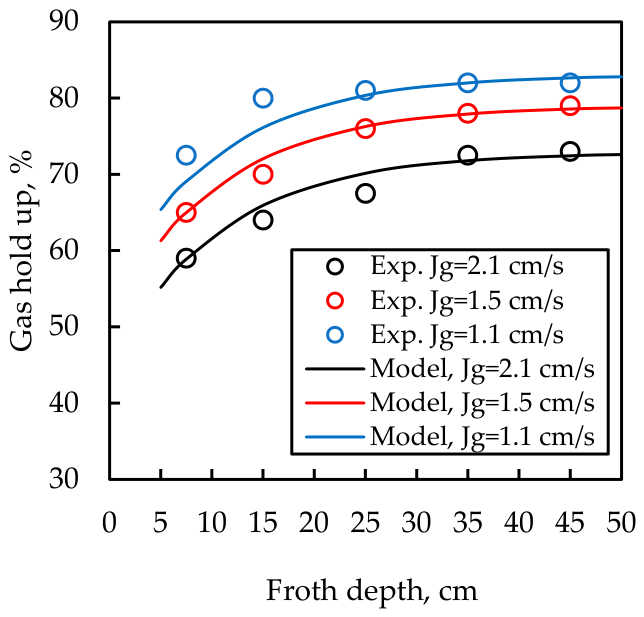
Gas holdup is not uniform throughout the froth zone and depends on superficial gas velocity and froth depth, among other factors. Based on the experimental results of Yianatos et al. [24], a model was developed to describe the behavior of gas holdup as a function of froth depth () and superficial gas velocity (), as shown in Equation (7):
where , , , and are fitting parameters whose values are presented in Table 1.
Table 1.
Parameters of gas holdup distribution in the froth model.
Since the air supply and pulp feed are distributed throughout the cell cross-sectional area, variations in gas holdup along the cell width are assumed to be negligible. Therefore, the average gas holdup over the froth volume with depth is obtained by integrating Equation (7) from to , as shown in Equation (8):
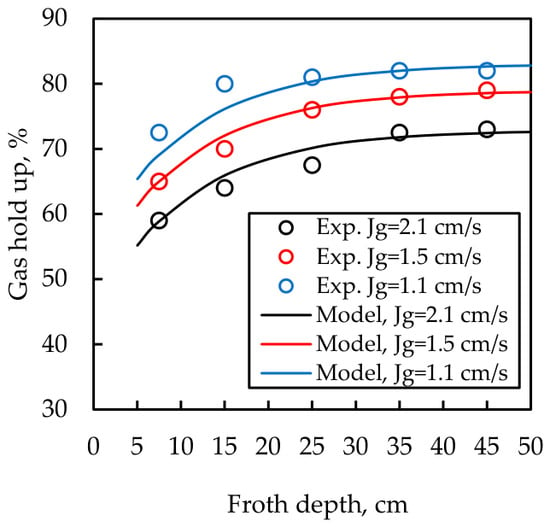
Figure 6 shows the results of fitting the gas holdup model for two-dimensional froth in a two-phase system (air and water), according to the data presented by Yianatos et al. [24].
Figure 6.
Gas holdup in the froth zone as a function of froth depth at different superficial gas rates.
2.1.5. Froth Transport Modelling
The froth transport recovery () corresponds to an adaptation of the model proposed by Yianatos et al. [25] for conventional mechanical cells, in which is expressed as a function of a froth stability factor (), gas residence time in the froth (), and the nominal froth transport distance to the discharge lip ().
The stability factor () is calculated as a function of the collected solids flowrate () [25] and the cross-sectional area of the froth zone (), as shown in Equation (9):
The collected solids flowrate () is given by the collection recovery, as shown in Equation (10), considering the feed solids flowrate () with valuable feed grade () and different mineral species in the process.
The gas residence time () is calculated as a function of the superficial gas velocity (), the average gas holdup (), and the effective froth depth (), as shown in Equation (11):
The effective froth depth () represents the average vertical depth within the froth zone at which particle collection occurs. Since the feed is introduced at the top of the froth zone, the net collection is assumed to occur within only a fraction of the total froth depth (). Therefore, the effective froth depth is estimated using a reduction factor (), as shown in Equation (12). In this work, = 0.50 was adopted as an initial approximation, corresponding to an average collection depth equal to half of the froth depth, according to the visual observation.
This parameter can be calibrated in future work, for instance, in terms of particle size and liberation.
The nominal froth transport distance () in the case of the CPF cell corresponds to the distance between the pulp feed entrance and the overflow lip.
2.2. Model Testing from Experimental Data
The model was calibrated using experimental data obtained from flotation tests conducted in a laboratory-scale cell (prototype) of Metso’s CPF technology with copper ore, whose primary valuable mineral is chalcopyrite. The laboratory equipment used had bi-dimensional (rectangular) geometry and represented a radial section of the industrial unit.
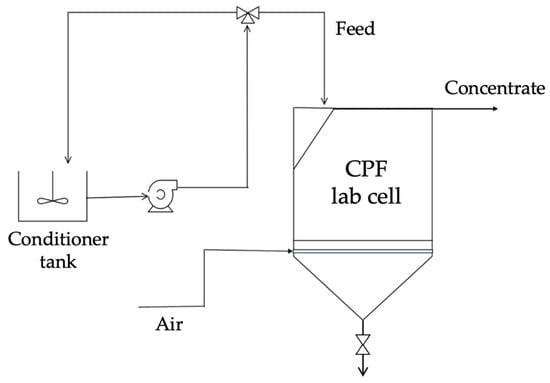
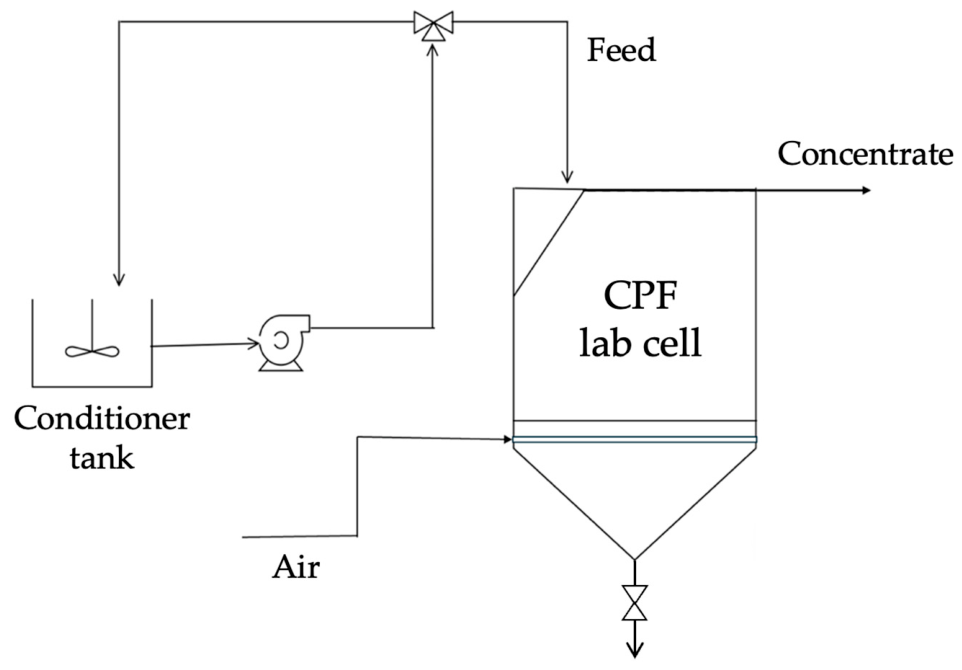
The slurry entered the conditioning tank under continuous stirring at approximately 60% solids. Once reagent conditioning was finished, the pulp feed entered continuously at the top of the froth zone through the froth-crowder. The system operated under semi-batch conditions, where feed and concentrate discharge were continuous, but unrecovered material accumulated in the lower section without discharge. Figure 7 shows the laboratory experimental setup diagram.
Figure 7.
Diagram of the laboratory unit setup of the CPF cell (adapted from Carvalho et al. [18]).
This article presents the model fitting using data from a gangue rejection test in which the effect of froth depth () and superficial gas velocity () on copper recovery and concentrate grade was evaluated. Two replicate tests were conducted as part of the experimental campaign. Table 2 shows the operating conditions.
Table 2.
Experimental conditions.
The experimental data were analyzed by size class, considering four fractions: −150 µm, 150–300 µm, 300–425 µm, and +425 µm. Model fitting was performed at two levels: (i) a global fit using the bulk feed composition and (ii) individual fits per size class. In both cases, the parameters and (governing the dependence of on and , respectively) were constrained to be equal for the valuable mineral and gangue to reduce the risk of overfitting. The sensitivity analysis presented in Section 3.3 was conducted using the parameters obtained from the global fit.
3. Results
3.1. Fitting of Experimental Data
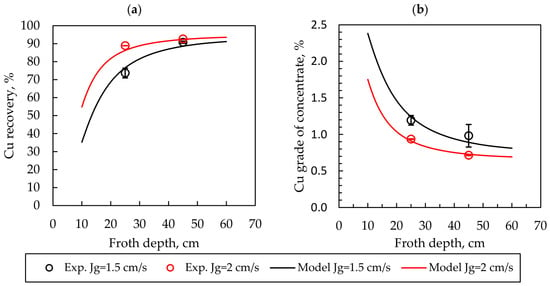
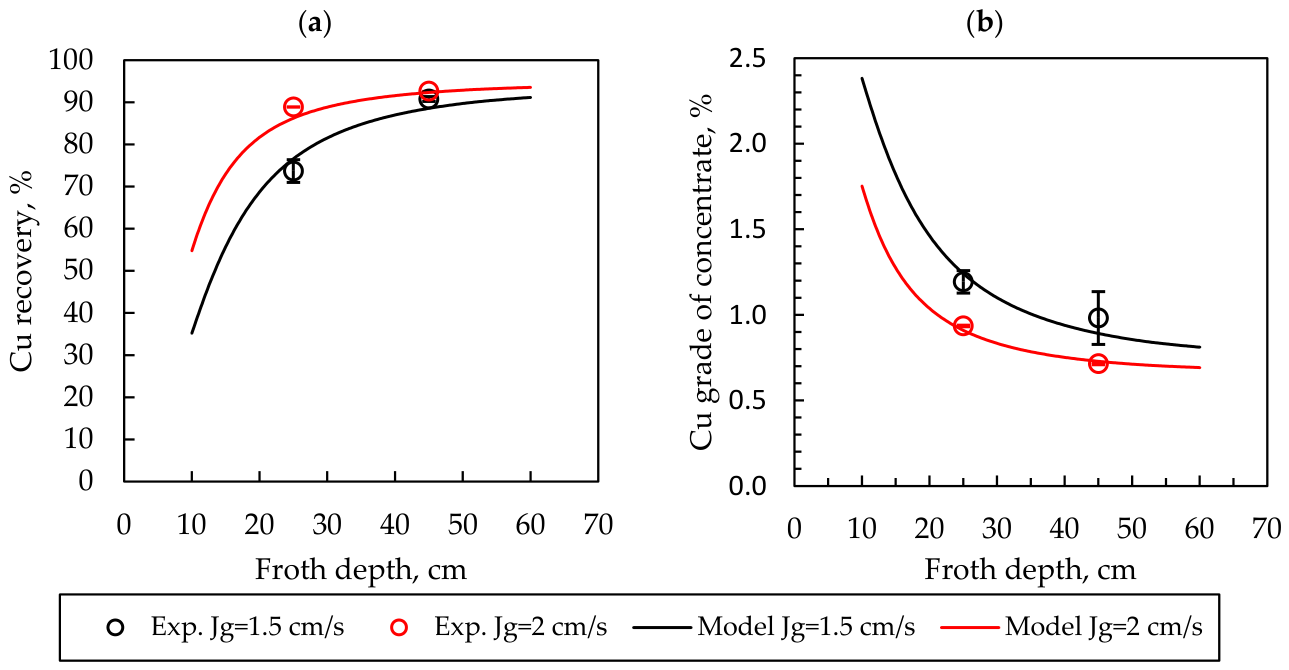
The copper recoveries and concentrate grades obtained from the experimental tests allowed for the analysis and fitting of the data using the proposed model. Figure 8 shows the fitting results for recovery and grade, expressed as a function of froth depth for two different superficial gas velocities. The markers represent the experimental data, and the solid lines represent the model predictions. The error bars correspond to the standard deviations of the experimental data.
Figure 8.
Fitting results for Cu: (a) recovery and (b) concentrate grade.
The experimental results show a significant difference in the sensitivity of recovery to changes in froth depth, depending on the considered. The model adequately represented these trends, capturing the effect of both operating variables on copper recovery (Figure 8a) and concentrate grade (Figure 8b), with a maximum absolute error in Cu recovery of 2.9%.
To further examine the contribution of the two sub-processes represented by the model, the predicted collection recovery (), froth transport recovery (), and total recovery () were analyzed separately for the four operating conditions, as summarized in Table 3.
Table 3.
Predicted collection and froth transport recoveries from the global model fit.
Within the evaluated froth depth range, increasing had a positive effect on both collection and froth transport recoveries. For the collection process, the larger froth volume and lower average gas holdup increased the liquid residence time, promoting particle collection. Consequently, increased with froth depth at both superficial gas velocities. Froth transport recovery also increased slightly with , despite the longer time taken by the gas to reach the discharge lip as froth depth increased. Under the evaluated conditions, this unfavorable effect was offset by the increase in froth stability resulting from the higher collected solids flowrate. Similarly, increasing at a fixed froth depth improved both and through enhanced collection kinetics and a shorter gas residence time, respectively. These results explained the greater sensitivity of the overall recovery to froth depth at a low , where the more limited collection kinetics made the residence time available for particle collection increasingly important.
3.2. Model Fitting per Size Class
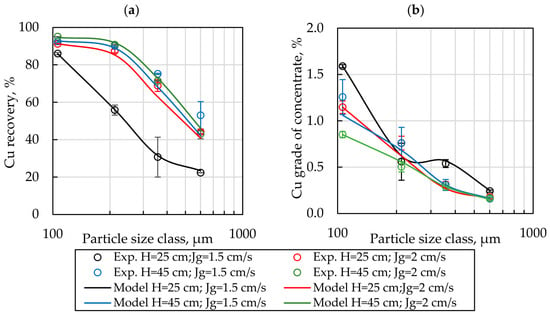
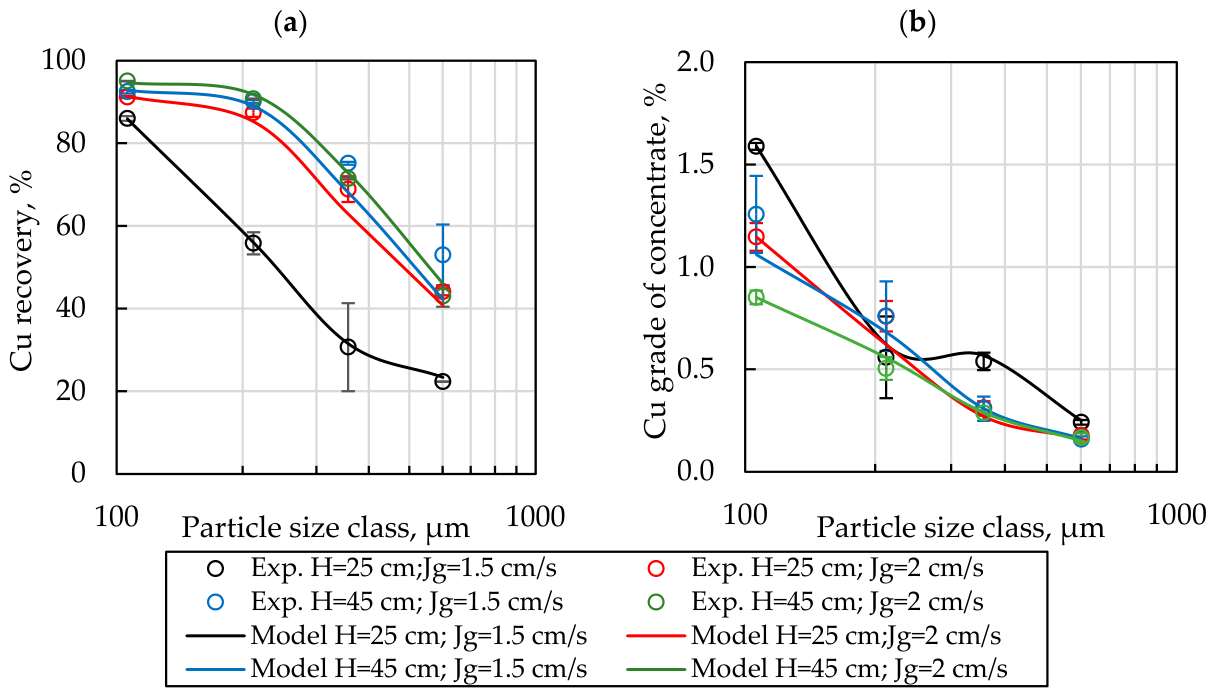
Figure 9 shows copper recovery and concentrate grade by size class for the four operating conditions evaluated. Error bars represent the standard deviations of the experimental data. Overall, the size-by-size model showed a mean absolute error of 4.5% in Cu recovery. The largest deviations were observed for the coarsest particle-size fraction, with a maximum absolute error of 10.8%.
Figure 9.
Fitting results for Cu by size class: (a) recovery and (b) concentrate grade.
The experimental results show a systematic decrease in recovery with increasing particle size across all conditions (Figure 9a). In most operating conditions, recovery in size class 300–425 µm remained at approximately 70%, a value that exceeded the typical ones reported for conventional mechanical cells in this size range. However, a critical behavior was observed under shallow froth depth and low superficial gas velocity ( = 25 cm and = 1.5 cm/s), where recovery dropped significantly in the coarser fractions, reaching an average recovery of below 35% for the 300–425 µm class. The sharp decrease in coarse particle recovery observed under these conditions suggested the existence of a critical operating regime for CPF technology. For the 300–425 µm size class, the analysis of the two sub-processes showed that, at = 1.5 cm/s, increasing the froth depth from 25 to 45 cm increased from 38.4% to 73.1%, while increased only from 74% to 79%. This indicated that the strong sensitivity of coarse particle recovery to froth depth at a low was mainly associated with the collection process due to the longer liquid residence time available for particle–bubble interactions. At the shallowest froth depth ( = 25 cm), increasing from 1.5 to 2.0 cm/s also enhanced both (from 38.4% to 66.8%) and (from 74% to 82%), further indicating that the critical condition resulted from the combined effects of shallow froth and low superficial gas velocity. Since coarse particles require stronger attachment to overcome gravitational and inertial effects, they are affected more severely than finer size fractions. This explained the abrupt reduction in recovery observed for the coarsest size fractions.
The existence of this transition is especially relevant for CPF technology because, unlike conventional flotation systems, particle collection occurs directly within the froth phase. If collection is insufficient with the available froth residence time, particles rapidly report to the tailings zone. The observed behavior therefore suggests the existence of a minimum combination of froth depth and gas velocity required to sustain adequate coarse particle recovery. Above this threshold, the model predicted relatively stable recoveries and limited sensitivity to operating conditions, whereas below it, recovery became highly sensitive to small changes in either variable.
In general, the model showed good agreement, representing the observed trends and the decrease in recovery towards the coarser particle classes. For all conditions except the lowest recovery case, the data showed low sensitivity of recovery in terms of operating conditions. Concentrate grade decreased with particle size, whose behavior was consistent with lower liberation of coarser particles. Conditions with = 1.5 cm/s exhibited greater variability in concentrate grade (Figure 8b).
For the remaining conditions, the model followed the general trend of the experimental data. The ability of the model to capture the critical behavior while following the general trend of the non-critical conditions suggested that the formulation incorporating both Jg and froth depth dependence was adequate to represent the transition between these two operating regimes.
3.3. Sensitivity Analysis
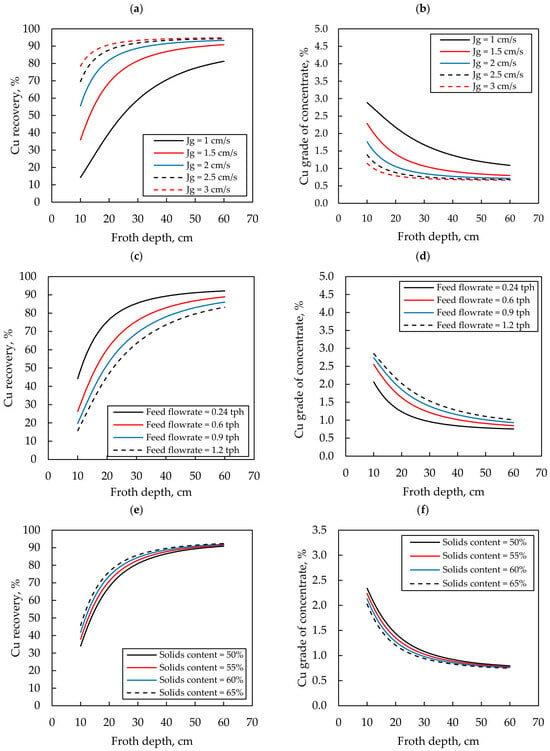
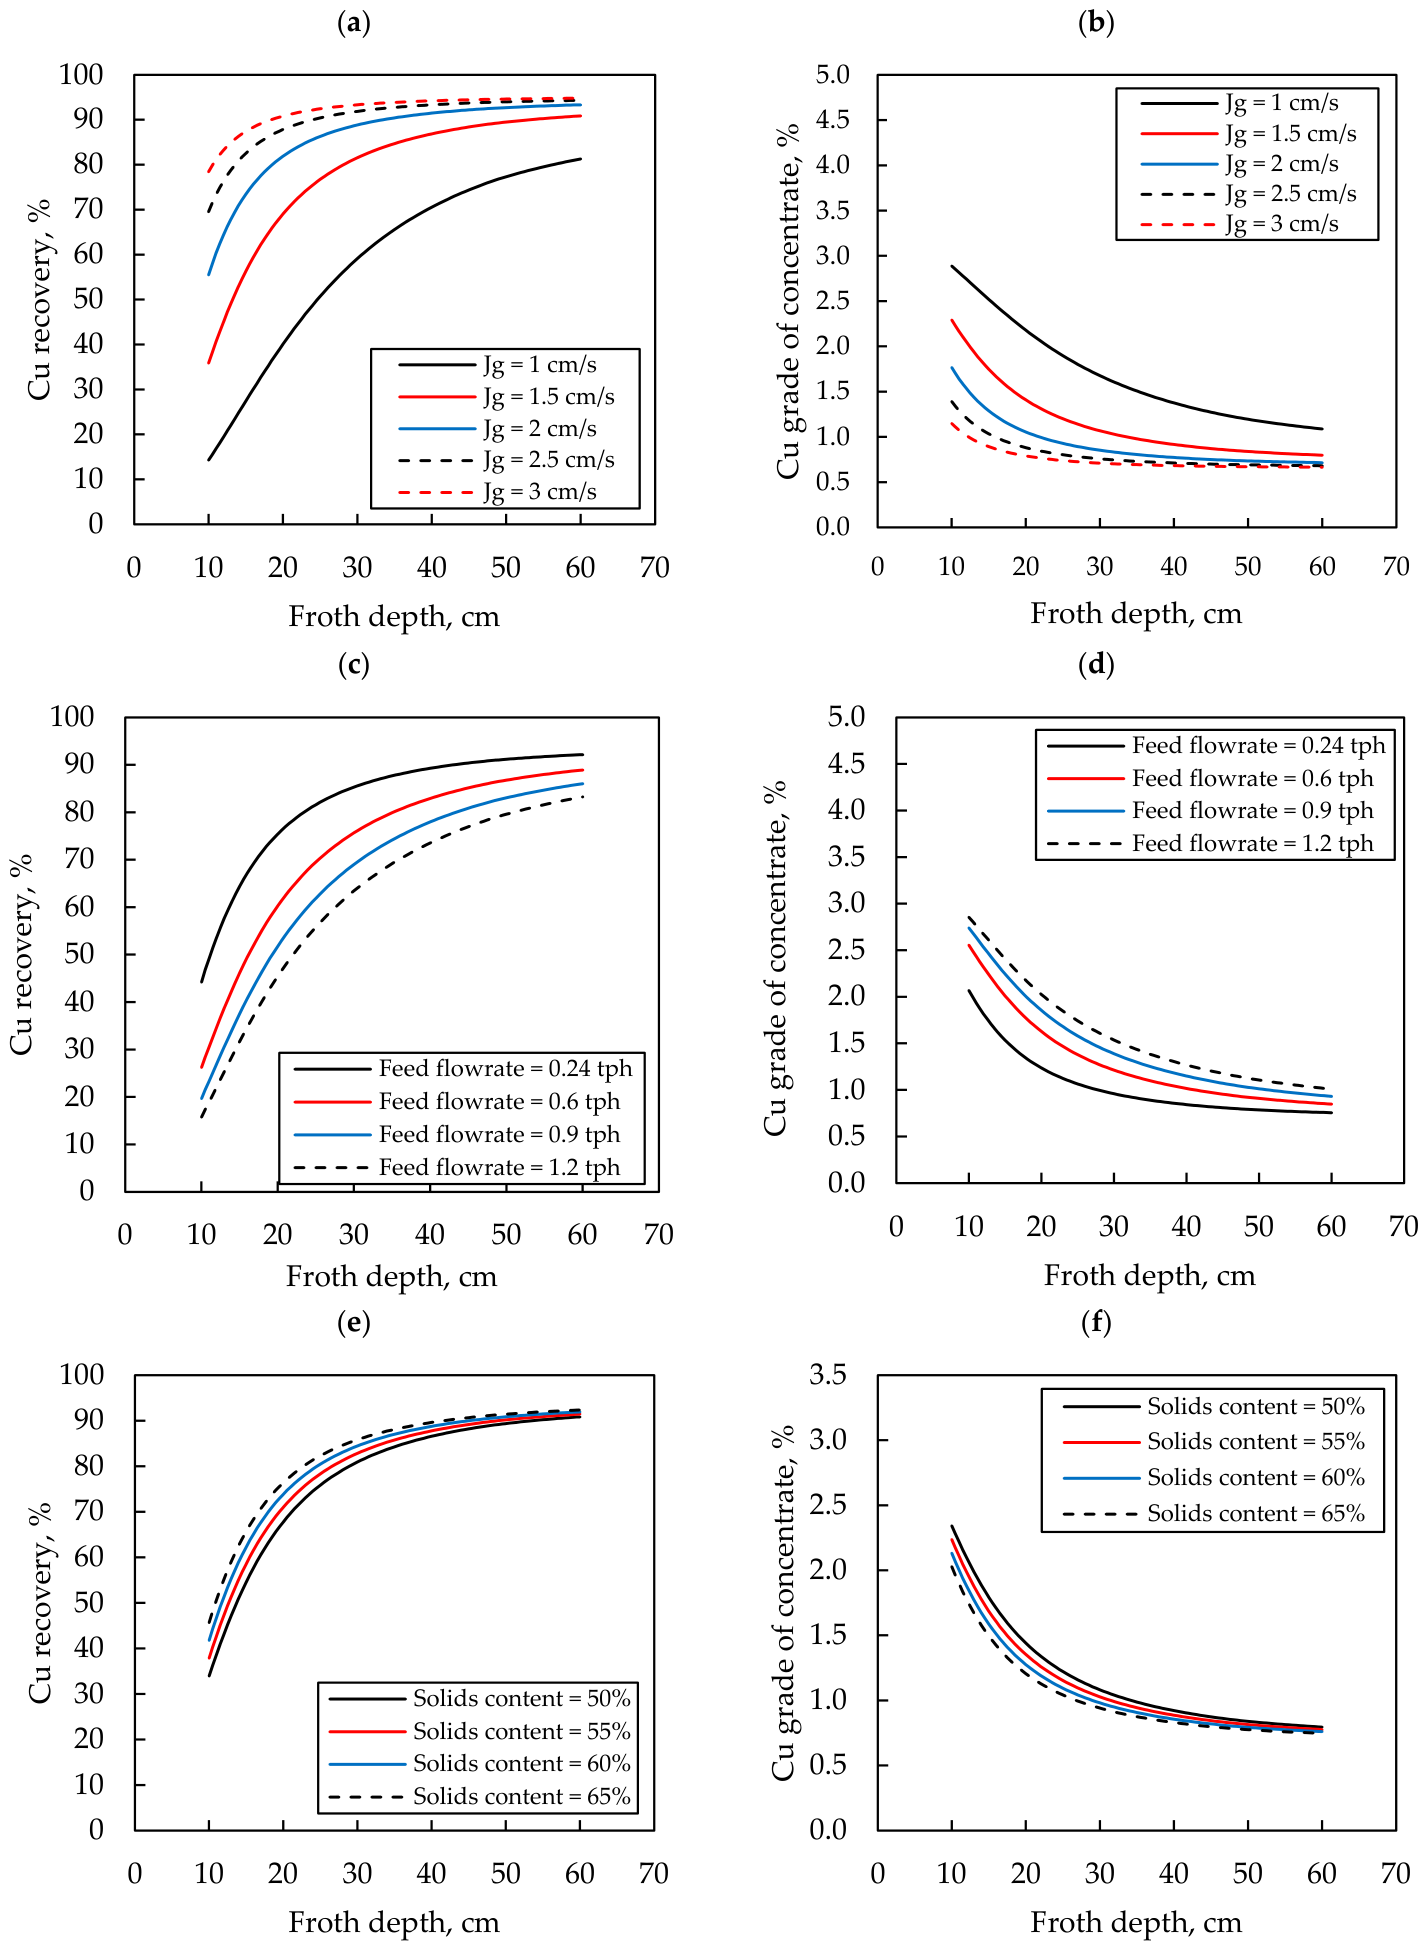
A sensitivity analysis of the model, using the parameters obtained from the overall experimental data, allowed for evaluating the effects of operating variables on copper recovery and concentrate grade over a range of froth depth of 10 to 60 cm.
Figure 10a,b show the effect of on recovery and concentrate grade, respectively. As increased, recovery increased while concentrate grade decreased, with the most pronounced changes occurring at lower values (1–2 cm/s).
Figure 10.
Model sensitivity of Cu recovery and concentrate grade to operating variables: (a,b) superficial gas velocity, (c,d) feed flowrate, and (e,f) solids content.
The strong influence of resulted from its simultaneous effect on both particle collection and froth transport. In the collection process, increasing enhanced the collection kinetics by increasing the surface area available for particle capture, while also reducing gas holdup, thereby increasing the liquid residence time available for particle collection. In the froth transport process, higher reduced the gas residence time in the froth, resulting in a shorter transport time for particle–bubble aggregates to reach the discharge lip. On the other hand, this also increased water recovery and fine particles entrainment, reducing the process selectivity and concentrate grade.
Figure 10c,d show that an increase in feed solids flowrate to the froth reduced copper recovery and increased concentrate grade. This behavior was associated with the reduction in residence time for collection, which increased selectivity.
Figure 10e,f show that an increase in solids content increased recovery and slightly reduced concentrate grade. This behavior was explained by the reduction in pulp volumetric flow rate, which increased the residence time available for collection in the froth zone, and by the increase in froth stability, which favored froth transport towards the concentrate.
3.4. Implications for Scale-Up
The model was calibrated using data obtained from a laboratory scale CPF unit. However, several aspects of the equipment design were intentionally selected to minimize scale dependent effects. In particular, both the nominal froth transport distance () and the operating froth depth () were maintained within ranges comparable to those of industrial units. This design philosophy aimed to preserve the characteristic collection and transport environment within the froth and thereby keep the scale-up factor as close as possible to unity.
Unlike many conventional flotation technologies, where increasing equipment size is accompanied by changes in froth transport distance and froth geometry, CPF design seeks to maintain similar froth transport conditions across scales. The CPF cells used at laboratory and pilot scales represent prototype cross-sections of the industrial equipment, allowing the maximum froth transport distances expected at the industrial scale (approximately 30–50 cm) to be replicated. In both units, the feed inlet position can be adjusted by replacing the cell crowder, enabling different feed locations to be evaluated while maintaining a froth transport distance (L) representative of industrial operation. Because L remains essentially independent of equipment scale, the froth transport sub-model is expected to be largely scale-independent. Consequently, the froth transport mechanisms observed in the laboratory unit are considered representative of those occurring in industrial operation.
Similarly, CPF prototypes allow froth depth and gas flow rate to be evaluated and optimized over ranges extending beyond those typically applied in industrial rougher flotation cells. Maintaining froth depths representative of the intended industrial operation helps minimize scale-related differences in residence time and froth hydrodynamics that could affect the collection process. Because both particle collection and subsequent transport occur within the froth zone, preserving these characteristic length scales and operating conditions is expected to support the transfer of laboratory-scale observations to full-scale operation.
Under these conditions, any remaining scale-up effects are more likely to arise from differences in local hydrodynamics, air dispersion, feed distribution, bubble-size distribution, and froth structure, rather than from geometric changes in the fundamental collection and transport pathways represented by the model. Therefore, while the model structure is expected to remain applicable across scales, some kinetic parameters may still require validation under industrial operating conditions.
An additional aspect requiring future investigation is the effective froth depth factor (). In the present work, 0.5 was adopted as a first order approximation and from visual observations. Although the similarity of froth depth and froth transport distance between laboratory and industrial CPF units is expected to reduce scale related effects, the average collection location within the froth may still depend on particle size, liberation characteristics, and operating conditions. Future work should therefore evaluate whether these can be related to measurable froth hydrodynamic variables.
In general, the design of the CPF provides a favorable basis for scaling up because the main geometric variables that determine froth collection and transport are intentionally maintained between the laboratory and industrial operation. This enables the proposed model to focus on the underlying collection and transport mechanisms within the froth zone rather than relying on empirical correction factors associated with large changes in equipment geometry.
4. Conclusions
A new flotation model was developed to describe the metallurgical performance of the Metso’s CPF cell. The model consists of representing two processes occurring simultaneously within the froth zone: particle collection and froth transport. Unlike models for conventional mechanical cells, where collection mainly occurs in the pulp zone, the proposed model considers that the recovery process occurs entirely within the froth zone, with its own kinetic and hydrodynamic characteristics.
The model fitting using laboratory experimental data showed good predictive performance, with a maximum absolute error in Cu recovery of 2.9% for the tests evaluated. The model adequately captured the effect of froth depth and superficial gas velocity on copper recovery and concentrate grade.
The analysis per size class showed that recovery decreased significantly for larger particle size, but for the particle size class 300–425 µm, recoveries were still approximately 70%, greater than those typically observed in conventional mechanical cells. On the other hand, a critical behavior was observed at low froth depth (25 cm) and low superficial gas velocity (Jg = 1.5 cm/s), showing a significant loss of recovery.
The model successfully captured the key behavior of the process and followed the general trend of the experimental data for the other operating conditions, which made it possible to optimize the operation.
A sensitivity analysis confirmed that the model responded consistently with the expected physical behavior when the main operating variables change.
The superficial gas velocity acted at the same time on the collection kinetics and froth transport, having the greatest influence on the balance between recovery and the concentrate grade. The feed solids flowrate and solids content also showed significant effects on metallurgical performance.
Industrial-scale tests for model validation at a larger scale are currently being developed to validate the model, which will be considered in future work.
Author Contributions
Conceptualization, J.Y., P.V. and M.C.; methodology, J.Y., P.V. and F.F.; software, P.V. and F.F.; validation, J.Y., M.C. and C.E.; formal analysis, J.Y., P.V. and F.F.; investigation, J.Y., P.V., F.F., M.C. and C.E.; resources, J.Y. and I.S.; data curation, F.F., M.C. and C.E.; writing—original draft preparation, J.Y., P.V. and F.F.; writing—review and editing, M.C., C.E. and I.S.; visualization, J.Y., P.V. and F.F.; supervision, J.Y. and I.S.; project administration, P.V. and M.C.; funding acquisition, J.Y. and I.S. All authors have read and agreed to the published version of the manuscript.
Funding
This research was funded by the Agencia Nacional de Investigación y Desarrollo (ANID), Fondecyt Project 1201335.
Data Availability Statement
The data presented in this study are available on request from the corresponding author. The data are not publicly available due to confidentiality restrictions.
Acknowledgments
The authors are grateful to the Agencia Nacional de Investigación y Desarrollo (ANID), FONDECYT Project 1241830, and Universidad Técnica Federico Santa María, Chile, for providing funding for research in industrial process characterization and modelling. Additionally, the invaluable contribution of the personnel at Metso Finland, and their permission to present these results, are acknowledged.
Conflicts of Interest
Marly Carvalho, Cagri Emer, and Ian Sherrell are employed by the company Metso Finland Oy. The remaining authors declare that the research was conducted in the absence of any commercial or financial relationships that could be construed as a potential conflict of interest.
References
- Lynch, A.J.; Johnson, N.W.; Manlapig, E.V.; Thorne, C.G. Mineral and Coal Flotation Circuits: Their Simulation and Control, 1st ed.; Elsevier Scientific Publishing Company: Amsterdam, The Netherlands, 1981. [Google Scholar]
- Trahar, W.J. A rational interpretation of the role of particle size in flotation. Int. J. Miner. Process. 1981, 8, 289–327. [Google Scholar] [CrossRef] [Scilit]
- Jameson, G.J. New directions in flotation machine design. Miner. Eng. 2010, 23, 835–841. [Google Scholar] [CrossRef] [Scilit]
- Anzoom, S.J.; Bournival, G.; Ata, S. Coarse particle flotation: A review. Miner. Eng. 2024, 206, 108499. [Google Scholar] [CrossRef] [Scilit]
- Kohmuench, J.N.; Mankosa, M.J.; Thanasekaran, H.; Hobert, A. Improving coarse particle flotation using the HydroFloat™ (raising the trunk of the elephant curve). Miner. Eng. 2018, 121, 137–145. [Google Scholar] [CrossRef] [Scilit]
- Fosu, S.; Awatey, B.; Skinner, W.; Zanin, M. Flotation of coarse composite particles in mechanical cell vs. the fluidised-bed separator (The HydroFloat™). Miner. Eng. 2015, 77, 137–149. [Google Scholar] [CrossRef] [Scilit]
- Jameson, G.J.; Emer, C. Coarse chalcopyrite recovery in a universal froth flotation machine. Miner. Eng. 2019, 134, 118–133. [Google Scholar] [CrossRef] [Scilit]
- Jameson, G.J.; Cooper, L.; Tang, K.K.; Emer, C. Flotation of coarse coal particles in a fluidized bed: The effect of clusters. Miner. Eng. 2020, 146, 106099. [Google Scholar] [CrossRef] [Scilit]
- Chahardahmasoumi, S.; Firouzi, M.; Galvin, K.P. Promoting fine and coarse particle flotation performance in the REFLUX™ Flotation Cell. Miner. Eng. 2026, 246, 110422. [Google Scholar] [CrossRef] [Scilit]
- Sutherland, J.L.; Dickinson, J.E.; Galvin, K.P. Flotation of coarse coal particles in the Reflux™ Flotation Cell. Miner. Eng. 2020, 149, 106224. [Google Scholar] [CrossRef] [Scilit]
- Crompton, L.J.; Islam, M.T.; Galvin, K.P. Investigation of internal classification in coarse particle flotation of chalcopyrite using the CoarseAIR™. Minerals 2022, 12, 783. [Google Scholar] [CrossRef] [Scilit]
- Kromah, V.; Powoe, S.B.; Khosravi, R.; Neisiani, A.A.; Chehreh Chelgani, S. Coarse particle separation by fluidized-bed flotation: A comprehensive review. Powder Technol. 2022, 409, 117831. [Google Scholar] [CrossRef] [Scilit]
- Carvalho, M.; Sherrell, I.; Niskala, J.; Saloranta, J.; Aho, R.; Rinne, A.; Lukkanen, S. Advancing coarse particles recovery: Pilot trial of a novel flotation cell. Chem. Eng. J. Adv. 2025, 24, 100879. [Google Scholar] [CrossRef] [Scilit]
- Carvalho, M.; Sherrell, I.; Emer, C.; Rinne, A. Enhanced coarse particle flotation: A novel approach. Physicochem. Probl. Miner. Process. 2025, 61, 211192. [Google Scholar] [CrossRef] [Scilit]
- Emer, C.; Aho, R.; Barrueto, M.; de Avila Carvalho, M.; Rinne, A. Flotation of coarse particles from Antofagasta region in a novel flotation device. In Proceedings of the 20th International Conference on Mineral Processing and Geometallurgy (Procemin-Geomet 2024), Santiago, Chile, 7–9 August 2024. [Google Scholar]
- Carvalho, M.; Emer, C.; Kuva, J.; Sherrell, I.; Rinne, A.; Luukkanen, S. Metallurgical performance of a next generation coarse particle flotation cell in sulfide ore processing. Miner. Eng. 2026, 248, 110586. [Google Scholar] [CrossRef] [Scilit]
- Kupka, N.; Yáñez, A.; Concha, V.; Emer, C.; Rinne, A. Reimagining flotation circuits with novel flotation technologies through pre-concentration and scalping. In Proceedings of the 21st International Conference on Mineral Processing and Geometallurgy (Procemin-Geomet 2025), Santiago, Chile, 6–8 August 2025. [Google Scholar]
- Carvalho, M.; Rinne, A.; Sherrell, I.; Bayarmagnai, E.; Kravtsov, T. The Effects of Process Parameters on a Pathbreaking Coarse Particles Flotation Device. In Proceedings of the XXXI International Mineral Processing Congress (IMPC 2024), Washington, DC, USA, 29 September–3 October 2024. [Google Scholar]
- Finch, J.A.; Dobby, G.S. Column Flotation, 1st ed.; Pergamon Press: Oxford, UK, 1990. [Google Scholar]
- Falutsu, M.; Dobby, G.S. Direct measurement of froth drop-back and collection zone recovery in a laboratory flotation column. Miner. Eng. 1989, 2, 377–386. [Google Scholar] [CrossRef] [Scilit]
- Ata, S.; Jameson, G.J. Recovery of coarse particles in the froth phase—A case study. Miner. Eng. 2013, 45, 121–127. [Google Scholar] [CrossRef] [Scilit]
- Yianatos, J.; Bucarey, R.; Larenas, J.; Henríquez, F.; Torres, L. Collection zone kinetic model for industrial flotation columns. Miner. Eng. 2005, 18, 1373–1377. [Google Scholar] [CrossRef] [Scilit]
- Klimpel, R.R. Selection of chemical reagents for flotation. In Mineral Processing Plant Design, 2nd ed.; Chapter 45; Mular, A.L., Bhappu, R.B., Eds.; AIME: New York, NY, USA, 1980; pp. 907–934. [Google Scholar]
- Yianatos, J.B.; Finch, J.A.; Laplante, A.R. Holdup profile and bubble size distribution of flotation column froths. Can. Metall. Q. 1986, 25, 23–29. [Google Scholar] [CrossRef]
- Yianatos, J.; Vallejos, P.; Grau, R.; Yañez, A. New approach for flotation process modelling and simulation. Miner. Eng. 2020, 156, 106482. [Google Scholar] [CrossRef] [Scilit]

Disclaimer/Publisher’s Note: The statements, opinions and data contained in all publications are solely those of the individual author(s) and contributor(s) and not of MDPI and/or the editor(s). MDPI and/or the editor(s) disclaim responsibility for any injury to people or property resulting from any ideas, methods, instructions or products referred to in the content. |
© 2026 by the authors. Licensee MDPI, Basel, Switzerland. This article is an open access article distributed under the terms and conditions of the Creative Commons Attribution (CC BY) license.