


Abstract
The Çıralı (Yanartaş) gas seepage system in the Tekirova Peridotite, SW Türkiye, is an ophiolitic H2–CH4 system associated with serpentinized ultramafic rocks and fault-controlled pathways. This study evaluates molecular compositions, C1–C3 compound-specific carbon isotope data, and methane hydrogen isotope compositions from four newly sampled gas outlets together with previously published data for which the full parameter set is available. The new samples contain 85.5–91.6% CH4 and 2.6–5.3% H2, with δ13C-CH4 values of −7.3 to −4.4‰ and δ2H-CH4 values of −121 to −104‰. The C1–C2 isotope reversal index (RI12) ranges from +13.6 to +14.5‰, whereas the C2–C3 isotope proximity index (PI23) ranges from 0.2 to 1.3‰. These values indicate the clear isotopic decoupling of methane from ethane and propane, whereas the C2–C3 pair shows comparatively small isotopic differences. The same relative pattern occurs at all four outlets, indicating consistency between samples. The results are consistent with a multistage model in which C2+ components are compatible with a thermogenic contribution, whereas methane may have been affected by serpentinization-related H2 input, fracture-controlled flow, and shallow ophiolitic modification. Catalytic CO2 hydrogenation is evaluated not as a demonstrated field-scale process but as a hypothesis requiring testing in chromitite–serpentinite-related microenvironments.
1. Introduction
Natural hydrogen has attracted increasing attention as both a geochemical phenomenon and a potential energy resource. It has been investigated across diverse tectonic settings, including sedimentary basins, rift–volcanic systems, and ophiolite belts. He–H2 accumulations in the Bohai Bay Basin have been evaluated in terms of crust–mantle interaction, water–rock reactions, water radiolysis, and resource quantification [1,2]. Comparative studies have assessed the formation and enrichment mechanisms of He–H2 in sedimentary basins, while quantitative work in the volcanic-bearing Songliao Basin has addressed the origin, transformation, and generation rates of natural hydrogen [3,4]. Although these basin examples demonstrate the broad geological significance of natural hydrogen, ophiolitic and serpentinized ultramafic settings provide a distinct mineral–fluid context.
Serpentinized ultramafic rocks are important geological settings for investigating natural H2 generation, methane formation and transformation, and ophiolitic rock–fluid interactions. During the interaction of water with olivine- and pyroxene-rich harzburgite, dunite, and related ultramafic rocks, oxidation of Fe(II)-bearing minerals, magnetite formation, and H2 generation may occur together. These processes can affect not only the mineralogical transformation of ultramafic rocks but also the formation, transport, and molecular or isotopic modification of H2–CH4 gases [5,6,7,8,9].
The Çıralı (Yanartaş) gas seepage system is a terrestrial ophiolitic gas system associated with the Tekirova Ophiolite within the Antalya Nappes in SW Türkiye and is known for its long-burning natural flames and persistent gas emissions. Previous studies have shown that Çıralı gas is methane-rich and dry, contains H2, and consistently includes C2+ hydrocarbons [10,11,12,13]. On this basis, Çıralı has been interpreted as a hybrid system with characteristics of both classical thermogenic gas systems and serpentinization-related abiotic endmembers. High-pH fluid discharge reported from the Yanartaş field also supports the presence of near-surface alkaline conditions associated with serpentinization [14].
The principal geochemical feature distinguishing the Çıralı system is that methane and C2+ hydrocarbons do not display the same carbon isotope behavior. Published datasets show that methane is isotopically heavier than expected in classical thermogenic systems, whereas the carbon isotope compositions of ethane and propane remain comparatively close to one another [10,11,12]. This pattern is expressed by the contrast between C1–C2 isotope reversal and close C2–C3 isotopic proximity [15,16,17,18].
In this study, the term ophiolitic modification refers to compositional or isotopic modification of deeply transported gas during interaction with serpentinized ultramafic rocks through H2 input, fracture-controlled flow, and possible mineral-surface-controlled catalytic microenvironments. This concept provides an interpretive framework for evaluating inherited deep thermogenic C2+ components and shallow ophiolitic processes within the same gas system.
Although previous studies have indicated a hybrid C1–C3 pattern in the Çıralı gas system, whether this pattern is preserved at newly sampled gas outlets has not been adequately tested. Identifying the same relative methane–ethane–propane relationships across multiple outlets would reduce the likelihood that the pattern reflects a local or isolated sampling effect and would support sample-to-sample consistency. However, this consistency alone does not demonstrate temporal stability or field-wide representativeness.
This study geochemically evaluates the Çıralı (Yanartaş) gas seepage system within the mineralogical context of the Tekirova Peridotite and associated ophiolitic units. Molecular compositions, C1–C3 compound-specific carbon isotope data, and methane hydrogen isotope compositions from four newly sampled gas outlets were therefore compared with the published reference dataset. The RI12 and PI23 parameters were used to quantify C1–C2 isotopic decoupling and C2–C3 isotopic proximity, respectively. These parameters are treated not as universal classification thresholds that determine gas origin, but as empirical descriptors that make the relative C1–C3 isotopic pattern in the Çıralı dataset explicit.
This evaluation addresses three questions: (i) whether the hybrid C1–C3 pattern reported in published data is also observed at the new outlets; (ii) whether compound-specific isotopic relationships are preserved across different outlet types and H2 abundances; and (iii) how this pattern can be interpreted in a multistage system involving serpentinized ultramafic rocks, chromitite-bearing microenvironments, and fault-controlled flow.
2. Geological and Mineralogical Framework
2.1. Antalya Nappes and the Tekirova Ophiolite
The Çıralı (Yanartaş) gas seepage system is associated with the Tekirova Ophiolite within the Antalya Nappes in southwestern Türkiye. The Antalya Nappes are an allochthonous nappe stack tectonically emplaced onto the Beydağları Relative Autochthon and include major structural units such as the Tekirova Ophiolite, ophiolitic mélange, Tahtalıdağ Nappe, and Alakırçay Nappe. This tectonostratigraphic architecture brought ultramafic rocks to near-surface levels [19,20,21,22,23,24,25]. The distribution of ophiolites and suture zones across Türkiye is shown in Figure 1a [26,27,28].
Figure 1.
Regional location, geological–tectonic framework, and gas sampling layout of the Çıralı–Yanartaş gas seepage system. (a) Generalized distribution of Neotethyan ophiolites and ophiolitic mélanges in Türkiye, major suture zones (İzmir–Ankara–Erzincan, Inner Tauride, and Bitlis–Zagros), tectonic blocks (Pontides, Tauride Belt, and Arabian Platform), the Tekirova Peridotite, and the study-area location [26,27,28]. The index frame labeled “b” marks the location of the study area shown in panel (b). (b) Regional geological map between Finike and Antalya showing the distribution of the Tekirova Peridotite, ophiolitic mélange, Tahtalıdağ and Alakırçay nappes, Beydağları Platform Carbonates, Eocene turbidites, Miocene clastic rocks, Quaternary travertine and alluvium, together with thrusts, normal faults, and faults of unspecified kinematics [19,20,21,22,23,24,25]. The index frame labeled “c” marks the location of the area shown in panel (c). (c) Yanartaş gas seepage area, showing the relationships among the Tekirova Peridotite, Tahtalıdağ Nappe, and alluvium; a thrust fault and a fault of unspecified kinematics; and the YN-1–YN-4 gas sampling points. Panels (a,b) were independently compiled and redrawn from published geological and tectonic data together with the author’s field observations and location data; geological simplification and interpretation were performed by the author. The basemap for panel (c) was obtained from the Copernicus Land Monitoring Service Very High Resolution Image Mosaic 2021 True Colour (raster 2 m) web map service [29]. The image was reprojected from EPSG:3035 to WGS 84 UTM Zone 36N (EPSG:32636), cropped, and annotated by the author. Panel (a) uses WGS 84 geographic coordinates, whereas panels (b,c) use WGS 84/UTM Zone 36N (EPSG:32636). Boundaries shown on the map are intended only to define the study area and do not represent official national boundaries.
Figure 1a–c presents a three-tier visual hierarchy from the country-scale tectonic setting, through regional geology, to the sampling-point scale.
At the local scale, the gas outlets are associated with fault-controlled contact zones between serpentinized ultramafic rocks of the Tekirova Peridotite, ophiolitic mélange, and carbonate-dominated nappe units (Figure 1b). In this study, “Tekirova Ophiolite” denotes the regional ophiolitic framework, whereas “Tekirova Peridotite” denotes the local ultramafic rock context of the gas outlets [19,20,21,22,23,24,25].
The schematic, non-scale tectonostratigraphic framework used to interpret the Çıralı system is presented in Figure 2.
Figure 2.
Schematic, non-scale tectonostratigraphic framework used to interpret the Çıralı (Yanartaş) gas seepage system. The diagram shows the principal tectonostratigraphic relationships among the Antalya Nappes, Tekirova Peridotite, ophiolitic mélange, younger sedimentary cover and basin-fill units, and the Beydağları Relative Autochthon, together with the lithological contexts used in interpreting the gas system [19,20,21,22,23,24,25,30,31,32].
2.2. Tekirova Peridotite and Serpentinized Ultramafic Rocks
The Tekirova Ophiolite is a multistage oceanic lithosphere slice represented by harzburgitic tectonites, ultramafic–mafic cumulates, isotropic gabbros, and dikes. The crustal rocks record island-arc tholeiitic, low-Ti boninitic, and locally OIB-like magma series, supporting Late Cretaceous supra-subduction-zone/forearc development [33]. Ophitic–subophitic textures, LILE enrichment, and HFSE depletion in diabase and metasomatized dikes are also consistent with the influence of subduction-derived fluids [34]. Comparable trends in southeastern Anatolian ophiolites provide only a regional comparison and do not directly demonstrate the origin of Çıralı gas [28].
The Tekirova Peridotite provides the local ultramafic rock context of the Çıralı gas system. During serpentinization of harzburgite, dunite, and related rocks, oxidation of Fe(II)-bearing minerals, magnetite formation, and H2 generation may occur together; these processes provide the fundamental mineralogical and geochemical conditions for the formation, transport, and subsequent modification of reduced gas components in ophiolitic gas systems [5,6,7,8,9]. Serpentine minerals, magnetite, carbonation products, and fracture fillings may create distinct microenvironments that control fluid circulation and gas–mineral-surface contact. Reported δ60Ni and δ13C data for Tekirova serpentinites and carbonates provide field-based constraints on serpentinization and carbonation processes in the region [35].
Opaque-mineral studies of the Çıralı (Chimaera) peridotites have directly documented sulfide–alloy transformations, including pentlandite breakdown and awaruite formation [36]. These local mineralogical records provide a more direct basis than analogies with distant ophiolites, but they do not by themselves demonstrate catalytic CO2 hydrogenation.
Field evidence for microbial communities and methanogenic archaea associated with serpentinized fluids and vein fillings has also been reported from the site [14,37,38]; however, these findings do not quantify a microbial methane contribution to the sampled outlets.
This study presents no new XRD, SEM–EDS, Raman, thin-section petrography, mineral chemistry, or chromitite analyses. Serpentinized ultramafic rocks, chromitite-bearing microenvironments, and fault-controlled flow paths are used as an interpretive framework based on field observations and published ophiolite studies. Accordingly, the term “mineralogical framework” does not imply the generation of new mineralogical data.
2.3. Chromitite-Bearing Microenvironments and Ophiolitic Modification
Chromitite-bearing zones in ophiolitic ultramafic rocks host Fe–Cr oxides, sulfides, and trace-metal-bearing phases, and these mineral assemblages may be transformed during serpentinization [39,40]. Under H2-rich reducing conditions, such phases may provide catalytic surfaces for low-temperature reactions; however, any such activity depends on fluid access to the mineral phases, fracture connectivity, reactive surface area, and local redox conditions [41].
X-ray microtomography of chromitites from other ophiolitic settings shows that microfracture networks may form a three-dimensional architecture that permits fluids to access metal-bearing phases [42]. These findings do not demonstrate that Çıralı chromitites perform the same function; they provide only a testable mineralogical analogy.
2.4. Fault-Controlled Flow Pathways and Gas Outlets
The Çıralı–Yanartaş gas outlets are associated not only with lithological units but also with structural discontinuities between them. Faults, tectonic contacts, mélange zones, and fracture systems form permeability pathways and may facilitate interaction or mixing between deeper gas components and shallow, H2-bearing fluids associated with serpentinization.
The YN-1 and YN-2 outlets sampled in this study are focused, flaming gas outlets, whereas YN-3 and YN-4 are gas seepage zones directly associated with surface fractures (Figure 1c). This classification does not define mutually exclusive genetic categories; focused and flaming outlets may also be structurally controlled by fractures or faults. The distinction is used only to describe the observed outlet type and local structural context.
3. Materials and Methods
3.1. Study Design and Data Sources
This study is based on the joint evaluation of new samples collected from four different gas outlets in the Çıralı (Yanartaş) gas seepage system and previously published gas geochemical data. The new dataset includes samples collected from the YN-1, YN-2, YN-3, and YN-4 sites during the August 2025 field campaign (Figure 1c; Supplementary Table S1). Sampling points were selected to include focused and continuously flaming gas outlets as well as seepage zones associated with surface fractures. This distinction describes the observed field morphology and local structural context and does not imply mutually exclusive genetic categories.
Published Çıralı data [10,11,12] were evaluated in three groups based on data completeness and direct comparability: the published complete-comparison subset, the published broader compositional group, and partial Istituto Nazionale di Geofisica e Vulcanologia (INGV) records. The term “complete-comparison subset” does not imply an independent ranking of analytical quality; rather, it denotes samples for which complete C1–C3 compound-specific carbon isotope data and comparable H2 measurements are available for the same sample. The sample contents, data coverage, and role of each group in this study are summarized in Table 1, whereas data compilation and inclusion–exclusion criteria are described in Section 3.5.
Table 1.
Data groups, samples, and analytical data coverage used in this study.
Combining the new samples with the two main published data groups yields an integrated Çıralı dataset of 14 samples. However, parameter-specific sample numbers vary depending on data availability. Parameters such as H2 content and the CH4/H2 ratio were evaluated only for the new samples and the published complete-comparison subset, for which comparable H2 measurements are available.
3.2. Field Sampling and Selection of Gas Outlets
New gas samples were collected from the Çıralı (Yanartaş) site between 9 and 11 August 2025. YN-1 and YN-2 represent focused and continuously flaming gas outlets, whereas YN-3 and YN-4 represent seepage zones associated with surface fractures. This classification describes the outlet type observed during sampling and does not define mutually exclusive categories of gas origin.
The YN-4 sample was collected from a gas outlet along a fracture surface in serpentinized harzburgite, where fresh-looking alteration surfaces and carbonate encrustation were observed. These features were recorded as field-scale alteration indicators; no direct mineralogical analysis was conducted to confirm the mineral phases.
Gas samples were collected in 250 mL borosilicate glass bottles equipped with metal valves and PTFE seals. The bottles were flushed in the laboratory at least three times with high-purity helium and evacuated to approximately 10−2 mbar. An inverted stainless-steel funnel was placed over each gas outlet and connected through silicone tubing to a 100 mL glass gas-tight syringe with a PTFE plunger.
YN-1 and YN-2 were visibly flaming gas outlets during sampling. At these sites, sampling was conducted using an inverted funnel–silicone tubing–gas syringe assembly directed toward the gas outlet rather than the combustion plume. The funnel was positioned as close as possible to the outlet to reduce the entry of atmospheric air and combustion products into the sampling line. Whether the flame was extinguished before sampling, any possible waiting time, and the outlet gas temperature were not recorded as separate quantitative field parameters. Therefore, combustion-zone and atmospheric-mixing effects could not be quantitatively corrected for the flaming outlets. To minimize atmospheric mixing, the syringe was filled and emptied for at least five full volumes, passing approximately 500 mL of outlet gas through the sampling line. After line flushing, fresh gas was transferred into the evacuated bottle in three transfers of approximately 100 mL each. Thus, a total of approximately 300 mL of gas was transferred into each bottle. The reported bottle pressure of 1.1–1.2 bar was not measured with a pressure gauge; it represents an estimated absolute pressure calculated from the transferred gas volume.
Coordinates of the sampling points were recorded in the WGS 84 coordinate system, and elevation, gas outlet type, and field morphology were entered into the field records. According to the corrected metadata, the elevations of YN-1, YN-2, YN-3, and YN-4 are 174, 183, 68, and 50 m, respectively. Coordinates, gas outlet types, and morphological field descriptions are provided in Supplementary Table S1.
Field quality control was evaluated through laboratory flushing/evacuation of sample containers, valve leak checks, and duplicate sampling at selected sites. Blank measurements, vacuum level, leak tightness, and pressure stability were monitored as part of the laboratory quality-control procedure; duplicate differences are reported in the main text as quantitative indicators of reproducibility. The primary sample value for each gas outlet is reported in the main text and tables. Absolute differences between the YN-1 and YN-3 duplicate samples were 0.1–0.2 vol.% for CH4, 0.1 vol.% for H2, 0.01 vol.% for C2H6, 0.2‰ for δ13C-CH4, and 2‰ for δ2H-CH4. All differences were within predefined acceptance limits. Duplicate results and acceptance criteria are presented in Supplementary Table S3.
3.3. Molecular Composition Analyses
The molecular compositions of the gas samples were determined at ARGETEST Analysis and Mineral Technologies Laboratory (Ankara, Türkiye) using an Agilent 7890B gas chromatograph (Agilent Technologies, Santa Clara, CA, USA) equipped with a thermal conductivity detector (TCD) and a flame ionization detector (FID). The TCD was used for H2, N2, O2, CO2, and CH4 measurements, whereas the FID was used for C2H6 and C3H8 measurements.
An HP-PLOT Molesieve 5Å column (30 m × 0.53 mm × 50 µm; Agilent Technologies, Santa Clara, CA, USA) was used in the TCD channel for the separation of H2, O2, N2, and CH4, whereas an HP-PLOT Al2O3/KCl column (50 m × 0.32 mm × 8 µm; Agilent Technologies, Santa Clara, CA, USA) was used in the FID channel. The method form did not specify details of the chromatographic route used for CO2 measurement, such as a backflush arrangement, second column, or separate channel. Therefore, CO2 values were not used as a primary basis for process interpretation and were evaluated only in the context of major gas composition and mass closure. According to the laboratory method record, the carrier gas for the TCD/FID configuration, including H2 analysis, was high-purity helium (He ≥ 99.9999%), with a constant flow rate of 3.0 mL min−1.
H2 was quantified in the same helium-carrier TCD configuration by the external standard method against a certified multicomponent gas standard containing H2. Calibration was performed using a certified multicomponent natural-gas standard containing 5.00 vol.% H2 with an absolute tolerance of ±0.10%. The standard was measured at the beginning and end of each analytical sequence and at least twice per day, with an acceptance criterion of ±2% relative to the certified value. The highest H2 value, 5.3%, slightly exceeds the single certified calibration level of 5.00%; it therefore involves minor extrapolation and carries additional uncertainty. The H2 calibration level, control frequency, and acceptance criteria are provided in Supplementary Table S2. H2 repeatability in duplicate sampling was at the level of 0.1 vol.% (Supplementary Table S3). Because the thermal conductivities of helium and H2 are close, absolute H2 values carry higher analytical uncertainty than hydrocarbon species; therefore, H2 comparisons among independently analyzed datasets were evaluated with this uncertainty in mind.
Injections were made with a 100 µL gas-tight syringe using the 1:10 split setting specified in the laboratory method record and an injector temperature of 150 °C. The oven program consisted of a 5 min hold at 40 °C, followed by heating to 200 °C at 10 °C min−1 and a 10 min hold at 200 °C. Chromatographic data acquisition and processing were performed using Agilent OpenLAB CDS ChemStation Edition software (Agilent Technologies, Santa Clara, CA, USA); the software version was not specified in the laboratory method record.
Gas components were reported as volume percent, and no numerical renormalization to force totals to 100% was applied. Therefore, the sum of reported components may deviate from 100%. Although the TCD system is suitable for O2 measurement, O2 results were not reported as an independent parameter in the final dataset. Because no independent validation/reporting criterion for O2 and no Ar data were available, atmospheric mixing was not quantitatively corrected.
3.4. Compound-Specific Carbon Isotope and Methane Hydrogen Isotope Analyses
Compound-specific carbon isotope analyses were performed using a gas chromatography–combustion–isotope ratio mass spectrometry (GC–C–IRMS) configuration. The system consisted of a Thermo Scientific Delta V Plus isotope ratio mass spectrometer (Thermo Fisher Scientific, Bremen, Germany), a Thermo Scientific GC IsoLink II combustion interface (Thermo Fisher Scientific, Bremen, Germany), and a Thermo Scientific TRACE 1310 gas chromatograph (Thermo Fisher Scientific, Milan, Italy). Gas components were separated on an Agilent HP-PLOT Q column (30 m × 0.32 mm × 20 µm; Agilent Technologies, Santa Clara, CA, USA).
For carbon isotope analyses, combustion was performed at 1000 °C in an oxidative reactor containing a CuO/NiO/Pt catalyst. The resulting water was removed using a Nafion membrane and a cold trap operated at −80 °C. The methane hydrogen isotope composition was measured using the GC–high-temperature conversion–IRMS (GC–TC–IRMS) configuration of the same instrument, with high-temperature conversion at 1420 °C.
δ13C results are reported in per mil relative to VPDB, whereas δ2H-CH4 results are reported in per mil relative to VSMOW. The H3+ contribution was corrected using an H3+ factor determined daily.
Isotopic scale normalization was performed through the laboratory reference system traceable to the international VPDB and VSMOW scales. The carbon isotope scale (VPDB) was established by two-point normalization using USGS-24 (−16.05‰) and NBS-19 (+1.95‰) reference materials, with IAEA-CH-6 (−10.45‰) measured as an independent control material. The compound-specific δ13C scale was transferred from a CO2 working reference gas (−32.15‰ VPDB) to the compound signals, and independent quality control was provided through USGS-24 and NBS-19. No certified compound-specific hydrocarbon isotope standard was used in this study; compound-specific δ13C values were made traceable through the stated scale transfer and control materials. Because of this limitation, absolute δ13C differences between the new and published datasets were not used alone as process diagnostics; the main interpretation is based on the within-sample relative C1–C3 isotopic pattern. The methane hydrogen isotope scale (VSMOW/SLAP2) was normalized using NGS-1 (−138.0‰), NGS-2 (−173.0‰), and IAEA-CH-7 (−100.3‰) reference materials. The CO2 working reference gas (δ13C = −32.15‰ VPDB) and H2 working reference gas (δ2H = −205.8‰ VSMOW) were measured repeatedly to monitor instrument stability and daily drift. Reference gas measurements were repeated in each analytical sequence, and each sample was analyzed by triplicate injection.
Analytical precision at the 1σ level was determined as ±0.3‰ for δ13C-CH4, ±0.4‰ for δ13C-C2H6, ±0.5‰ for δ13C-C3H8, and ±3.0‰ for δ2H-CH4. Because no separate certified compound-specific hydrocarbon standard was available for peak amplitude/linearity control, quality control was limited to triplicate-injection repeatability, working reference gas stability, and control materials. The combined standard uncertainties of the RI12 and PI23 parameters were calculated by the square-root-of-the-sum-of-squares method, assuming that the relevant isotope measurements are independent: σ(RI12) = √(σ2_C1 + σ2_C2); σ(PI23) = √(σ2_C2 + σ2_C3). Accordingly, the combined standard uncertainties for RI12 and PI23 are approximately ±0.5‰ and ±0.6‰, respectively. IRMS data acquisition and processing were performed using Thermo Isodat software (version 3.0; Thermo Fisher Scientific, Bremen, Germany). Analytical instruments, column programs, working reference gases, measurement conditions, and quality-control information are detailed in Supplementary Table S2.
3.5. Compilation and Grouping of the Published Dataset
Published Çıralı data were transferred from the original sources at the sample level, checked for duplicate records, and harmonized using common units and isotope scales. Gas compositions were compiled as volume percent, carbon isotope values on the VPDB scale, and hydrogen isotope values on the VSMOW scale. No values were imputed for missing data, and no additional numerical renormalization was applied to gas compositions.
The published complete-comparison subset consists of samples K01, K02, K03, K05, and CH2010 [11,12]. Because this subset includes both complete C1–C3 compound-specific carbon isotope data and comparable H2 measurements, it was used as the primary reference group for direct comparison with the new gas-outlet samples.
The published broader compositional group, consisting of samples GS9914–GS9918 [10], represents the broader geochemical variability reported for the system. However, because of possible atmospheric mixing noted in the original study, these samples were not included in the complete-comparison subset.
The partial INGV records K03* and K06* [11] include limited molecular composition data and were therefore not included in the main comparison dataset or in derived-parameter calculations. They were used only as auxiliary contextual records. In the text and tables, the partial record is denoted as K03*, whereas the analytically more complete record is denoted as K03; the two records were kept separate.
3.6. Derived Geochemical Parameters
To evaluate the new and published datasets within a common interpretive framework, five derived geochemical parameters were calculated: RI12, PI23, Bernard ratio, CH4/H2 ratio, and apparent wetness. However, because apparent wetness is an algebraic transformation of the Bernard ratio, it was not used as an independent interpretive parameter in the main text and is provided only in Supplementary Table S4. In the calculations, C1 = CH4, C2 = C2H6, and C3 = C3H8.
RI12 was used to quantify the directional carbon isotope difference between methane and ethane:
RI12 = δ13C-CH4 − δ13C-C2H6
RI12 indicates the magnitude of C1–C2 isotope reversal in the Çıralı system. Positive RI12 values mean that methane is enriched in 13C relative to ethane and that the classical isotopic ordering expected with increasing carbon number is reversed.
PI23 was defined to evaluate the absolute magnitude of the carbon isotope difference between ethane and propane:
PI23 = |δ13C-C2H6 − δ13C-C3H8|
Low PI23 values indicate a small isotopic difference between the C2–C3 components. When PI23 values are less than or equal to the combined standard uncertainty, the result is interpreted not as proof of complete isotopic equality, but as close proximity that cannot be resolved within measurement precision.
RI12 and PI23 were not used as universal genetic classification thresholds; they were treated only as empirical descriptors that make the relative C1–C3 isotopic pattern in the Çıralı dataset explicit.
The Bernard ratio was calculated to describe the C1 dominance of the gas [43]:
Bernard ratio = C1/(C2 + C3)
Apparent wetness was calculated to indicate the relative contribution of C2 and C3 components within C1–C3 hydrocarbons:
Apparent wetness = [(C2H6 + C3H8)/(CH4 + C2H6 + C3H8)] × 100
The use of only C1–C3 components in the apparent wetness calculation reflects the fact that C4+ results are not available for all samples in the published datasets. Therefore, this parameter was interpreted not as a complete measure of total C2+ wetness, but as a comparable indicator of the C2–C3 contribution among datasets.
Apparent wetness is an algebraic transformation of the Bernard ratio (W = 100/(B + 1)); therefore, it is not an independent parameter. Because of this algebraic dependence, only the Bernard ratio was reported in the main text for gas dryness, whereas apparent wetness is provided in Supplementary Table S4. The CH4/H2 ratio was calculated to evaluate the relative H2 abundance among gas outlets:
The Bernard and CH4/H2 ratios were calculated using the same volume percent units and are reported as dimensionless values. Definitions of the parameters, uncertainty approach, and interpretive principles are presented in Supplementary Table S4.
3.7. Comparative Evaluation and Graphical Analysis
The comparison was conducted at three levels: variability among the new outlets, descriptive statistics for the published complete-comparison subset, and the integrated Çıralı dataset. Because of the limited sample size, the mean, standard deviation, and range were used; no inferential tests were applied, missing values were not imputed, and parameter-specific n was used. Graphical analyses included C1–C3 isotopic relationships, Bernard ratio versus CH4/H2, RI12 versus PI23, and global comparison diagrams. Only systems reporting gas-phase H2 in volume percent were included in the global H2 panel because of unit and matrix incompatibility. The diagrams were not used for genetic classification. Derived parameters were calculated using Equations (1)–(5). Generative AI provided technical assistance in the Python (Python Software Foundation, Wilmington, DE, USA; version information was not retained in the script-development records) visualization scripts; the data, formulas, calculations, and outputs were independently verified by the author.
4. Results
4.1. Molecular Gas Composition and Gas-Outlet-Scale Variability
All new gas-outlet samples show methane-dominated compositions. CH4 contents range from 85.5 to 91.6 vol.%, with a mean of 88.5 ± 2.6 vol.% (sample standard deviation, 1σ). Quantitatively determined H2 contents range from 2.6 to 5.3 vol.%, with a mean of 4.1 ± 1.1 vol.%. N2 values range from 4.3 to 7.5 vol.%, whereas CO2 values remain between 0.06 and 0.13 vol.%. C2H6 and C3H8 were measured in all samples; C2H6 contents range from 0.17 to 0.30 vol.%, and C3H8 contents range from 0.08 to 0.13 vol.% (Table 2).
Table 2.
Molecular composition of the new gas-outlet samples from the Çıralı (Yanartaş) site.
Descriptive compositional differences are observed among the gas outlets. YN-1 and YN-2 show higher CH4 and lower H2 values than YN-3 and YN-4. In contrast, CO2 remains low in all samples, and both C2H6 and C3H8 were detected at all four gas outlets. This comparison describes the observed variability among sampling points and does not, by itself, demonstrate that the two outlet groups are genetically distinct.
4.2. Compound-Specific Carbon Isotopes and Methane Hydrogen Isotope Composition
The carbon isotope composition of methane is heavier than those of ethane and propane in all samples. δ13C-CH4 values range from −7.3 to −4.4‰, with a mean of −6.0 ± 1.2‰. δ13C-C2H6 values range from −21.8 to −18.0‰, with a mean of −19.9 ± 1.6‰, whereas δ13C-C3H8 values range from −20.6 to −17.8‰, with a mean of −18.9 ± 1.2‰. Methane hydrogen isotope values range from −121 to −104‰, with a mean of −113 ± 7‰ (Table 3).
Table 3.
Compound-specific carbon isotope and methane hydrogen isotope composition of the new gas-outlet samples from the Çıralı (Yanartaş) site.
When evaluated as a function of carbon number, all four samples show the same basic relative order: δ13C-CH4 values are markedly less negative than δ13C-C2H6 and δ13C-C3H8 values. In contrast, the absolute carbon isotope difference between ethane and propane is limited to 0.2–1.3‰. Thus, a large C1–C2 decoupling and a small C2–C3 difference are observed together in the new samples (Figure 3).
Figure 3.
Compound-specific carbon isotope pattern of the new Çıralı (Yanartaş) gas-outlet samples and comparison with published data. (A) δ13C values of CH4, C2H6, and C3H8 for the YN-1–YN-4 samples. Each sample is shown with a separate marker and connecting line. Methane is isotopically heavier than ethane and propane, whereas the C2–C3 difference is small. (B) Comparison of the new samples with the published complete-comparison subset [11,12] on the same axes. The grey band shows the range of published values, the grey dashed line shows the published arithmetic mean, the blue band shows the range of the new samples, and the blue line and markers show the mean of the new samples. Although absolute δ13C values differ between the two datasets, the relative order in which methane is decoupled from the C2–C3 components is observed in both datasets. All δ13C values are reported relative to VPDB.
4.3. Relative Isotopic Pattern Defined by RI12 and PI23
All RI12 values calculated for the new samples are positive and vary within a narrow range from +13.6 to +14.5‰. The mean RI12 value is +13.9 ± 0.4‰. These values exceed the combined standard uncertainty of approximately ±0.5‰ calculated for RI12, indicating that directional isotopic decoupling between methane and ethane is resolved in all new samples.
PI23 values range from 0.2 to 1.3‰, with a mean of 1.0 ± 0.5‰. The 0.2‰ difference calculated for YN-2 is smaller than the combined standard uncertainty of approximately ±0.6‰ for PI23; in this sample, the ethane–propane difference cannot be resolved within measurement precision. The 1.2–1.3‰ values in YN-1, YN-3, and YN-4 are larger than this standard uncertainty, but remain small compared with the RI12 values. The results show that all new samples display a large and directionally consistent C1–C2 decoupling, whereas the C2–C3 difference remains small (Table 4; Figure 4).
Table 4.
Derived geochemical parameters calculated for the new gas-outlet samples from the Çıralı (Yanartaş) site.
Figure 4.
RI12–PI23 cross-plot for the new gas-outlet samples and published Çıralı data. Red circles represent the new samples, yellow squares represent the published complete-comparison subset, and blue squares represent the published broader compositional group. RI12 represents the directional carbon isotope difference between methane and ethane (δ13C-CH4 − δ13C-C2H6), whereas PI23 represents the absolute carbon isotope difference between ethane and propane (|δ13C-C2H6 − δ13C-C3H8|). The dashed lines at RI12 = +10‰ and PI23 = 1.5‰ are not universal genetic thresholds; they are dataset-specific visual guides used only to display the relative distribution of the integrated Çıralı dataset. Published data were compiled from [10,11,12].
4.4. Gas Dryness, H2 Variability, and the Presence of C2–C3 Hydrocarbons
The Bernard ratios of the new samples range from 204 to 366, with a mean of 271 ± 73. These values show that the samples have C1-dominated compositions and that the dryness indicator varies among the gas outlets.
CH4/H2 ratios range from 16.1 to 35.2, with a mean of 23.6 ± 8.3. The highest CH4/H2 ratio was determined in YN-2, whereas the lowest ratio was determined in YN-4. This distribution indicates that the abundance of H2 relative to CH4 varies among the sampling points. However, because CH4 is present in the numerator of both the Bernard ratio and the CH4/H2 ratio, the joint distribution shown in Figure 5 was not interpreted as a statistical correlation between independent variables.
Figure 5.
Comparison of the joint distribution of Bernard ratio and CH4/H2 for the new gas-outlet samples with the published complete-comparison subset [11,12]. (A) Full-range view showing the new samples and the published subset on the same axes. Red circles represent the new samples, and yellow squares represent the published subset. (B) Enlarged view of the published complete-comparison subset. Bernard ratios partially overlap between the two datasets, whereas CH4/H2 ranges do not overlap. The graph was used for descriptive comparison and was not interpreted as a correlation analysis because of the shared CH4 term and the limited number of samples.
The quantitative determination of C2H6 and C3H8 in all samples shows that C2–C3 hydrocarbons are present at all four gas outlets despite the methane-dominated and dry composition.
4.5. Comparison with the Published Complete-Comparison Subset
The molecular compositions of the new samples and the published complete-comparison subset show both overlapping and distinct characteristics. CH4 ranges partially overlap. C2H6 ranges intersect over a narrow interval, whereas C3H8 values are comparable between the two datasets. In contrast, the H2 range in the new samples, 2.6–5.3%, is lower than the range in the published subset, 7.5–10.2%, and the two ranges do not overlap. Mean H2 content is approximately 4.1% in the new samples and approximately 9.4% in the published subset. This comparison is descriptive; method-related uncertainties between different sampling campaigns and analytical configurations should be considered, particularly when evaluating H2 results.
In terms of carbon isotope values, the ranges of the two datasets do not overlap. The new samples are, on average, approximately 5.1‰ heavier for δ13C-CH4, 5.3‰ heavier for δ13C-C2H6, and 7.1‰ heavier for δ13C-C3H8 than the published subset. The largest mean difference is observed in the C3 component. The δ2H-CH4 ranges partially overlap, with the new samples generally occupying the heavier part of the published subset.
Despite differences in absolute isotope values, the RI12 and PI23 ranges are similar in the two datasets. The RI12 range of the new samples, +13.6 to +14.5‰, falls within the +12.6 to +16.4‰ range of the published subset. PI23 ranges also largely overlap: 0.2–1.3‰ in the new samples and 0.4–1.2‰ in the published subset. Thus, both datasets show a large and directionally consistent methane–ethane difference and a small ethane–propane difference (Table 5; Figure 4).
Table 5.
Comparison of the new gas-outlet samples with the published complete-comparison subset.
4.6. Dataset-to-Dataset Pattern Consistency in the Integrated Dataset
When the new samples and the two main published data groups are evaluated together, all 14 samples in the integrated Çıralı dataset show methane dominance together with the presence of C2H6 and C3H8. In the samples for which complete C1–C3 carbon isotope data are available, RI12 values range from +10.1 to +16.4‰, whereas PI23 values range from 0.1 to 1.3‰. Thus, in the integrated dataset, the methane–ethane difference is positive and large in all samples, whereas the ethane–propane difference is comparatively small.
The observation of this relative isotopic order in both the new samples and samples compiled from previous studies supports dataset-to-dataset pattern consistency. However, H2 content, CH4/H2 ratio, Bernard ratio, and absolute carbon and hydrogen isotope values vary among sampling points and datasets. Therefore, the present results show that the relative C1–C3 pattern is observed across different datasets, but they do not demonstrate that the system is temporally invariant or that the four new samples represent the full field-scale variability.
Taken together, the new samples are characterized by methane-dominated composition, measured C2H6 and C3H8 at all gas outlets, large and positive RI12 values, small PI23 values, and H2 variability among the gas outlets. The genetic and process-related interpretation of these observations is addressed in Section 5.
5. Discussion
5.1. Deep Thermogenic C2+ Contribution and C2–C3 Isotopic Proximity
The joint evaluation of the new samples and published Çıralı data shows that C2H6 and C3H8 are consistently detected across different sampling campaigns. In the new samples, C2H6 contents range from 0.17 to 0.30 vol.%, whereas C3H8 contents range from 0.08 to 0.13 vol.%; both components were measured at all four gas outlets. Although their concentrations are low, the persistent occurrence of C2–C3 hydrocarbons makes it difficult to explain the Çıralı gas solely as a simple serpentinization-related H2–CH4 end-member.
The isotopic proximity between the C2–C3 components is important for this interpretation. PI23 values range from 0.2 to 1.3‰ in the new samples and from 0.4 to 1.2‰ in the published complete-comparison subset. The 0.2‰ difference calculated for YN-2 cannot be resolved within the combined standard uncertainty, whereas the 1.2–1.3‰ values in the other new samples remain small when compared with the RI12 values. Therefore, the data indicate a relatively close isotopic relationship between the C2–C3 components rather than absolute isotopic equality.
Low PI23 values alone are not definitive evidence of a thermogenic origin; abiogenic hydrocarbon formation has also been reported in hydrothermal and ophiolitic environments [13]. Nevertheless, when the persistent detection of C2H6 and C3H8 across different campaigns, the close C2–C3 isotopic relationship, and the regional sedimentary framework are considered together, a deep thermogenic C2+ contribution is among the main explanations consistent with the available data [15,16,17,18]. This interpretation does not imply that all methane was derived from the same deep source or that the C2–C3 components remained completely unmodified after formation.
The regional geological structure also provides a plausible framework for transporting such components. Faults and tectonic contacts related to the Tekirova Ophiolite, ophiolitic mélange, and deeper sedimentary units within the Antalya Nappes may form structural permeability pathways along which gases can migrate upward [19,20,21,22,23,24,25]. Eocene turbiditic units, Aquitanian reefal limestones, and Burdigalian turbiditic fills provide a regional sedimentary context for potential deeper hydrocarbon generation and migration [30,31,32]. This study does not directly identify a specific source rock or formation depth; however, the persistence of C2+ hydrocarbons shows that a deep thermogenic contribution cannot be excluded on geological and geochemical grounds.
5.2. Reaction Framework for Gas Formation, Modification, and Consumption in the Ophiolitic System
This section groups the reaction, transport, and mixing processes compatible with the relative isotopic pattern of Çıralı gas into four families and summarizes representative net reactions and evidentiary limits (Table 6).
Table 6.
Process families that may contribute to gas formation, modification, and consumption in the Çıralı (Yanartaş) ophiolitic gas system, with representative net reactions, expected effects, and evidentiary limits.
Fe(II) oxidation and H2 generation. Hydration of ideal Mg-forsterite produces serpentine and brucite and does not generate H2 (Equation (6)). H2 is released principally through Fe(II) oxidation and water reduction, depending on the partitioning of iron among serpentine, brucite, and magnetite (Equation (7)). Yield depends on temperature, rock composition, water-to-rock ratio, and kinetics; low-temperature pathways also exist [9], and electron transfer at spinel surfaces has been shown to support H2 formation at 55 and 100 °C [44]. Experiments at 311 °C and 3 kbar showed that peridotite produced more H2 and CH4 than pure olivine, demonstrating the importance of mineralogical composition, including the possible catalytic effect of aluminum released from spinel and pyroxene during serpentinization [45]. Separate experiments showed that CO2 concentration modifies serpentinization kinetics and H2 yield [46]. H2 is also released during water–olivine reactions at much higher temperatures, but these conditions cannot be transferred directly to the shallow Çıralı setting [47]. This process family does not directly affect carbon isotopes. Instead, it influences carbon-bearing reactions indirectly by controlling H2 availability and thus the thermodynamic feasibility of CO2 reduction [8].
2 Mg2SiO4 + 3 H2O → Mg3Si2O5(OH)4 + Mg(OH)2
6 Fe2SiO4 + 7 H2O → 3 Fe3Si2O5(OH)4 + Fe3O4 + H2
CO2 reduction and CH4 formation. Abiotic and microbial pathways can be represented by the same overall net reaction (Equation (8)). The carbon source is written as a CO2 equivalent in the equation; however, dissolved inorganic carbon may occur primarily as HCO3− and CO32− in high-pH fluids. Kinetically controlled abiotic methanation produces methane depleted in 13C relative to its source, whereas fractionation decreases toward equilibrium [48,49]. Microbial hydrogenotrophic methanogenesis generally produces strongly 13C-depleted methane, but apparent fractionation decreases under carbon-limited conditions and relatively heavy methane may form [50]. Archaeal methanogenesis has been reported in veins at Chimaera (Yanartaş) [38]. Metal-bearing phases such as chromitite and awaruite may provide potential catalytic surfaces [36,41,42], and experiments with natural chromitite at 300 °C and 500 bar support the laboratory-scale feasibility of this pathway; however, the results cannot be transferred directly to shallow Çıralı conditions [51]. This study does not directly demonstrate fluid-accessible catalytic phases in Çıralı chromitites or the occurrence of CO2 hydrogenation in the field. A high degree of conversion in a carbonate-buffered, carbon-limited microenvironment may have contributed to heavy δ13C-CH4 values, but this possibility remains untested because δ13C-CO2 and dissolved inorganic carbon data are unavailable. Low gas-phase CO2 content alone does not indicate the size of the carbon pool or the extent of consumption.
CO2 + 4 H2 → CH4 + 2 H2O
C2–C3 formation and reorganization. Inverted or nearly flat C1–C3 sequences have been observed in some experimental and natural Fischer–Tropsch-type abiotic systems (Equation (9)); however, the pattern depends on the catalyst, degree of conversion, and whether the system is open or closed, and is not by itself diagnostic of an abiotic origin [13]. Equation (9) does not demonstrate a specific mechanism; it presents representative overall stoichiometry for C2–C3 alkanes. In the Çıralı samples, methane is distinctly heavier than ethane, whereas ethane and propane are close to one another; reversal occurs only in the C1–C2 pair, and this arrangement is consistent with C2–C3 components derived from a common or coevolved component. However, C2–C3 proximity alone does not determine origin; maturity, closed-system evolution, mixing, and secondary transformation can also produce similar sequences or isotope reversals [52]. Moreover, a single-process model based only on methanogenic production cannot explain the presence of C2H6–C3H8 detected at all four new outlets and reported in previous Çıralı studies.
n CO2 + (3n + 1) H2 → CnH2n+2 + 2n H2O (n = 2–3)
Oxidation, consumption, diffusion, and mixing. Methane consumption may proceed aerobically or through sulfate-dependent anaerobic pathways documented in serpentinite environments (Equations (10) and (11)) [53]; this consumption enriches residual methane in both 13C and 2H, with a greater effect on hydrogen than on carbon [18]. Diffusion and mixing are not reactions, but they may leave similar signatures: diffusion can enrich the residual gas in heavy isotopes and shift the Bernard ratio, whereas mixing can produce an apparent reversal even when no individual process generates one [54]. Because the initial gas composition and initial CH4 amount are unknown, the extent of oxidation cannot be quantified; the high residual CH4 abundance provides only a qualitative constraint against extreme consumption scenarios. Atmospheric mixing cannot be quantitatively tested because O2 and Ar data are unavailable.
CH4 + 2 O2 → CO2 + 2 H2O
CH4 + SO42− → HCO3− + HS− + H2O
The repeated association of high RI12 with low PI23 at the four new gas outlets and in published Çıralı samples shows that methane does not share a single, unmodified formation history with the C2–C3 components. The C2–C3 pattern is consistent with a common or coevolved deeper component, particularly a thermogenic contribution, whereas methane records an additional formation or secondary modification process. Nevertheless, the available data do not uniquely distinguish this additional process among catalytic methanation, microbial production, oxidation, and mixing. Serpentinization-related H2 generation is geologically plausible; however, because δ2H-H2 was not measured, neither the origin nor the formation mechanism of H2 can be uniquely determined.
5.3. Gas-Outlet-Scale Variability and Multistage Conceptual Model
The new dataset shows that molecular composition varies at the gas-outlet scale. The focused and flaming YN-1 and YN-2 sites contain higher CH4 and lower H2 than YN-3 and YN-4, whereas the fracture-related YN-3 and YN-4 sites show lower CH4 and higher H2.
CH4/H2 ratios range from 16.1 to 35.2 and show that H2 abundance differs among sampling sites. This difference may reflect variable H2 generation, H2 consumption, gas–rock contact time, flow rate, and shallow mixing. The four-sample dataset is insufficient to distinguish these mechanisms or establish a generalizable relationship between outlet morphology and gas composition.
Flow paths that allow longer gas–rock contact may show more pronounced H2 input, H2 consumption, or shallow methane modification. Testing this hypothesis requires simultaneous flow measurements and repeated sampling.
The conceptual model presented in Figure 6 integrates these observations into a three-stage framework: transport of CH4 and C2+ components from deeper units into the ophiolitic zone along structural permeability pathways [19,20,21,22,23,24,25,30,31,32], interaction with serpentinization-related H2-bearing fluids and possible shallow modification, and formation of the final composition through outlet-specific flow geometry. The model is not a depth profile, but an interpretive framework that organizes the observations and testable hypotheses.
Figure 6.
Proposed multistage conceptual model for the Çıralı (Yanartaş) gas seepage system. The diagram shows the interaction between a thermogenic C2+ contribution assumed to be transported from deeper units and serpentinization-related H2 input within the ophiolitic zone along fault- and fracture-controlled permeability pathways. Three interpretive stages are shown: (1) transport of deeper gas components into the ophiolitic zone and mixing with H2-bearing fluids; (2) a possible shallow modification zone in which catalytic, microbial, or oxidative processes are evaluated as testable alternatives; and (3) formation of the final composition through outlet-specific flow geometry and near-surface mixing. The reaction CO2 + 4H2 → CH4 + 2H2O is not a mechanism demonstrated in the field, but a hypothesis requiring experimental testing. Flux values were not measured in this study and were transferred contextually from published sources [11,12]. The diagram is not to scale, and the depths shown are not based on direct field measurements.
A recent study of the Bulqizë ophiolite showed that intense natural H2 release may be associated with a deeper, structurally controlled reservoir [55]. This result does not provide direct evidence for Çıralı; it offers a useful physical analogy for evaluating deep gas storage, transport, and discharge in ophiolitic settings.
Published field data describe Çıralı as a multi-outlet system distributed over approximately 5000 m2, with active flames observed at 12 of 32 gas outlets [11]. The estimated discharge from flaming outlets exceeds 60 kg CH4 day−1, equivalent to approximately 22 t CH4 year−1. When non-flaming outlets and soil seepage are included, a field-scale lower bound of >50 t CH4 year−1 and a system-scale range of 150–190 t CH4 year−1 have been reported [11,12]. Because these values do not represent the same measurement scope, they should not be treated as directly equivalent; they are summarized in Supplementary Table S5.
Because this study includes no direct gas-flux measurements, no quantitative relationship can be established between the composition of the new samples and field-scale CH4 discharge. Published flux data are used here only to indicate the scale of the system.
5.4. RI12–PI23 Framework and Comparative Context
The RI12 and PI23 parameters are descriptive tools for summarizing the relative C1–C3 isotopic ordering in the Çıralı dataset. The distribution of new and published samples within similar RI12–PI23 fields makes cross-dataset pattern consistency visually explicit. These parameters complement, rather than replace, established molecular and isotopic genetic diagrams [54] and cannot be used to assign the gas to a single genetic field. Classical molecular and isotopic approaches provide a broader framework for evaluating gas origins [15,16,17,18].
The RI12 = +10‰ and PI23 = 1.5‰ lines are not universal thresholds; they serve only as dataset-specific visual guides for the distribution of the integrated Çıralı dataset. PI23 values in particular should be evaluated together with analytical uncertainty; a low PI23 value alone does not demonstrate a common origin or a preserved thermogenic component.
Nevertheless, relative to the published complete-comparison subset, the new samples are heavier in δ13C-CH4, δ13C-C2H6, and δ13C-C3H8 by approximately 5.1‰, 5.3‰, and 7.1‰, respectively. The shift in all three components in the same direction shows that the absolute isotopic differences between campaigns cannot be explained solely by a shallow reaction affecting only methane. Changes in source mixing, different flow paths and residence times, and sampling- or laboratory-related compound-specific effects may also have contributed to this shift. Therefore, the interpretation that methane records an evolution different from that of the C2–C3 components is based not on absolute cross-campaign δ13C differences, but on the association of high RI12 with low PI23 repeated within each sample.
The broader geochemical context of Çıralı can be examined by comparison with selected ophiolitic and serpentinization-related systems (Figure 7). In δ13C-CH4–δ2H-CH4 space, the new Çıralı samples have heavier carbon and hydrogen isotope values than the published Çıralı data. Comparison with Lost City, Zambales, and Hakuba shows that Çıralı cannot be readily matched to a single endmember [56,57,58,59]. Although δ2H-CH4 values from −121 to −104‰ overlap those of some serpentinization-related systems, they are not genetically diagnostic because the isotope composition of the source water and δ2H-H2 are unknown. Comparisons among different systems also involve important differences in gas- and water-sampling matrices, temperatures, laboratory methods, timescales, and source-water isotope composition.
Figure 7.
Comparison of the Çıralı (Yanartaş) system with selected ophiolitic and serpentinization-related gas systems. (A) The δ13C-CH4–δ2H-CH4 diagram compares the new Çıralı samples and the published complete-comparison subset with data from Zambales, Lost City, and Hakuba. (B) The δ13C-CH4–H2 diagram includes only systems in which H2 was reported as a gas-phase volume percentage. Systems in which H2 was reported as a dissolved aqueous concentration were excluded because of differences in sampling matrix and units. Horizontal and vertical bars for the Çıralı groups show the observed minimum–maximum ranges rather than analytical error bars. The diagrams are used for descriptive comparison, not genetic classification. Data were compiled from this study, Hoşgörmez et al. [11], and Etiope et al. [12] for Çıralı; Abrajano et al. [57] for Zambales; Kelley et al. [56] and Proskurowski et al. [58] for Lost City; and Suda et al. [59] for Hakuba.
Similarly, studies of reduced-gas seepage in different ophiolitic complexes show that H2–CH4–N2 mixtures may have multiple origins, emphasizing the importance of mixing and transport processes [60].
In the gas-phase H2 comparison panel, Çıralı has lower H2 contents than Zambales; however, this difference alone does not demonstrate a different formation mechanism. Because H2 analyses were conducted in different laboratories using different instrumental configurations, the comparison remains descriptive, and Figure 7 provides context rather than genetic classification.
5.5. Limitations and Testable Future Work
The main interpretation of this study relies more on within-sample C1–C3 relationships than on absolute isotope values. Although RI12 and PI23 are more resistant to co-directional absolute isotope shifts, they do not eliminate compound-specific calibration, matrix, and analytical biases; absolute cross-study δ13C comparisons were therefore evaluated cautiously.
The new dataset is limited to four gas outlets and a single sampling campaign conducted in August 2025; field-scale spatial variability, seasonal change, and long-term stability cannot be evaluated. Because the highest H2 value of 5.3% slightly exceeds the single certified calibration level of 5.00%, interlaboratory H2 comparisons carry additional uncertainty. The absence of O2 and Ar as independent parameters precludes quantitative constraints on atmospheric mixing.
No new mineralogical, petrographic, microbiological, or direct flux data were generated in this study. Chromitite-bearing microenvironments, catalytic CO2 hydrogenation, microbial methanogenesis, and methane oxidation therefore cannot be regarded as demonstrated field processes. Because δ2H-H2, δ13C-CO2, and source-water isotope composition are unavailable, the hydrogen isotope data cannot be linked to a single mechanism.
Future studies should first include seasonal and multiyear repeated sampling at the same gas outlets, simultaneous gas-flux measurements, and measurements of outlet temperature and flow rate. Combined measurements of O2, N2, and Ar would permit quantitative evaluation of atmospheric mixing. Time-series sampling that measures flux, gas composition, and C–H isotopes within the same setup would also test whether a Rayleigh-type δ13C–δ2H relationship is a reproducible process signal.
Second, δ13C-CO2, δ2H-H2, δ2H-H2O, noble gases, and methane clumped isotopologues could provide stronger constraints on the existing source and process models. Because clumped-isotopologue measurements were not made, the available bulk δ13C and δ2H data cannot uniquely distinguish among microbial, abiotic, thermogenic, and secondary-alteration contributions. Measurements of Δ13CH3D and Δ12CH2D2 would constrain apparent formation temperatures and disequilibrium processes [50,61].
Third, a possible microbial contribution should be tested using archaeal 16S rRNA gene sequencing, mcrA-targeted analyses, compound-specific δ13C measurements of lipid biomarkers, and incubation experiments, thereby distinguishing presence from current metabolic activity.
Fourth, serpentinite–chromitite relationships in the Tekirova Peridotite should be investigated directly by X-ray microtomography, thin-section petrography, SEM–EDS, electron-microprobe analysis, and Raman spectroscopy [42]. The same investigation should use Raman spectroscopy to test whether gas or gas–liquid inclusions occur in chromite crystals [62], with complementary microthermometric analyses. The composition of any detected inclusions should then be used to constrain the origin and evolution of deep gas components. After fluid-accessible microfractures and potential catalytic metal phases have been identified, 13CO2–H2 experiments should be conducted under conditions representative of field temperature and gas partial pressures and compared with mineral-free, sterile, and thermal controls.
Finally, the RI12–PI23 framework should be applied to independent C1–C3 datasets from Tablelands and comparable terrestrial serpentinization systems [63]. This comparison would test whether these parameters are only Çıralı-specific descriptors or have broader utility in multistage gas systems.
6. Conclusions
This study evaluated molecular compositions, C1–C3 compound-specific carbon isotope data, and methane hydrogen isotope compositions from four new gas outlets in the Çıralı (Yanartaş) H2–CH4 system together with published Çıralı datasets. The conclusions are presented at three levels of evidence: directly measured findings, inferences strongly supported by the data, and hypotheses requiring testing.
Directly measured findings. All new samples are dry and methane-dominated and contain H2 together with C2H6 and C3H8: CH4 85.5–91.6%, H2 2.6–5.3%, δ13C-CH4 −7.3 to −4.4‰, and δ2H-CH4 −121 to −104‰. RI12 values range from +13.6 to +14.5‰, showing a large and directionally consistent carbon isotope difference between methane and ethane at all four outlets. PI23 values range from 0.2 to 1.3‰; the 0.2‰ difference at YN-2 is unresolved within the combined standard uncertainty. H2 content and the CH4/H2 ratio vary among outlets, with YN-1 and YN-2 showing higher CH4 and lower H2; the four-sample dataset is insufficient to distinguish the causes of this difference. The same RI12–PI23 pattern occurs in the published complete-comparison subset. This dataset is limited to four gas outlets and a single field campaign.
Inferences supported by the data. The repeated association of high RI12 with low PI23 shows that methane does not share a single, unmodified formation history with the C2–C3 components. When the repeated detection of C2H6 and C3H8 across different sampling campaigns, the close C2–C3 relationship, and the regional sedimentary framework are considered together, the data are consistent with a common or coevolved deeper component, particularly a thermogenic contribution. Methane records an additional formation or secondary modification process. Cross-dataset pattern consistency reduces the likelihood that the pattern is a local sampling effect, but does not demonstrate temporal stability or field-wide representativeness. RI12 and PI23 are not universal genetic thresholds, but empirical descriptors that summarize relative C1–C3 ordering.
Hypotheses requiring testing. Low-temperature CO2 hydrogenation in chromitite–serpentinite-associated microenvironments, microbial methanogenesis, methane oxidation, and a high degree of conversion in a carbon-limited microenvironment are candidate processes that may contribute to the isotopic decoupling of methane. Because this study generated no mineralogical, microbiological, or experimental evidence and did not measure δ13C-CO2, δ2H-H2, or source-water isotope composition, none of these processes can be regarded as a demonstrated field mechanism. H2 generation during serpentinization remains geologically plausible, but the origin and formation mechanism of H2 cannot be constrained without δ2H-H2 data.
Çıralı is a terrestrial ophiolitic gas field in which a thermogenic C2+ contribution, serpentinization-related H2 input, and possible shallow modification processes can be investigated together within the same natural system. Testing the proposed multistage model requires time-series sampling at the same outlets, flux measurements, δ13C-CO2 and δ2H-H2 analyses, clumped-isotopologue measurements, and mineralogical and experimental studies.
Supplementary Materials
The following supporting information can be downloaded at: https://www.mdpi.com/article/10.3390/min16080845/s1, Table S1: Field characteristics of the new gas-outlet samples; Table S2: Analytical instruments, calibration, and traceability conditions; Table S3: Duplicate-sample repeatability and acceptance criteria; Table S4: Definitions of derived geochemical parameters and apparent wetness values; Table S5: Summary of published field observations and flux estimates.
Funding
This research received no external funding.
Institutional Review Board Statement
Not applicable. This study did not involve human participants, human data, human tissue, or animal experiments.
Informed Consent Statement
Not applicable. This study did not involve human participants or personal data.
Data Availability Statement
The new gas-outlet data presented in this study are archived in the Mendeley Data repository [64] (https://doi.org/10.17632/bnvcydgvcg.1). The dataset includes molecular gas compositions, C1–C3 compound-specific carbon isotope data, methane hydrogen isotope compositions, sample metadata, and derived geochemical parameters. The data files are embargoed until 3 June 2027; if the article is published before this date, the embargo will be lifted on the publication date. Previously published comparison data were used with citations to the relevant sources.
Acknowledgments
The author thanks the researchers who made previous datasets on the Çıralı (Yanartaş) gas system available for scientific use and ARGETEST Analysis and Mineral Technologies Laboratory for technical contributions to the molecular composition and compound-specific isotope analyses. During the preparation of this manuscript, the author used ChatGPT (OpenAI, San Francisco, CA, USA; model versions varied across sessions, and exact session-level identifiers were not retained in the preparation records) and Claude (Anthropic, San Francisco, CA, USA; model versions varied across sessions, and exact session-level identifiers were not retained in the preparation records) for linguistic and structural editing, consistency checks, submission-format preparation, and technical assistance with Python-based data-visualization scripts. The author reviewed and independently verified all text, data inputs, calculations, code, and graphical outputs and takes full responsibility for the content of this publication. The graphical abstract was originally drawn manually by the author. During final revision, the author used OpenAI GPT Image 2.0, accessed through ChatGPT, solely to reorient the H2 arrows in Panel 2 so that they originate within the peridotite/serpentinite block and point upward toward the ascending gas pathway, to replace the orange-red basal glow in Panel 1 with a muted, layered deep sedimentary domain, and to increase image resolution. The prompts used were: “Edit only the two specified areas of the supplied graphical abstract. In Panel 2, replace the downward green H2 input arrows with arrows originating within the peridotite/serpentinite block and pointing upward toward the ascending gas pathway, and label them ‘serpentinization-derived H2’. In Panel 1, remove the orange-red basal glow that could imply a magmatic source and replace it with a muted, layered deep sedimentary domain. Preserve all other text, numerical values, scientific symbols, colors, layout, and content.”; “Enhance the corrected graphical abstract to a high-resolution output while preserving its composition, scientific labels, isotope values, formulas, typography, colors, and linework, without adding or altering any scientific content.” The author reviewed and edited the output and takes full responsibility for the content of this publication. No scientific data, numerical values, labels, interpretations, or conclusions were generated or altered by the AI tool. No generative image model was used to create or edit Figure 1, Figure 2, Figure 3, Figure 4, Figure 5, Figure 6 and Figure 7. Figure 6 was drawn and edited manually by the author using CorelDRAW 2022 (Corel Corporation, Ottawa, ON, Canada), Procreate (Savage Interactive, Hobart, TAS, Australia), Autodesk SketchBook (Autodesk, San Francisco, CA, USA), and Adobe Photoshop (Adobe, San Jose, CA, USA); version information for the latter three applications was not retained in the figure-preparation records. This publication was produced using European Union Copernicus Land Monitoring Service information.
Conflicts of Interest
The author declares no conflicts of interest.
References
- Wei, Y.B.; Liu, Q.Y.; Zhu, D.Y.; Meng, Q.Q.; Xu, H.Y.; Zhang, W.; Wu, X.Q.; Li, P.P.; Huang, X.W.; Fu, Y.; et al. Accumulation and quantification of He–H2 in the Bohai Bay Basin, China: Insights from crust–mantle interaction. Mar. Geosci. Energy Resour. 2026, 186, 207693. [Google Scholar] [CrossRef] [Scilit]
- Wei, Y.B.; Liu, Q.Y.; Zhu, D.Y.; Meng, Q.Q.; Xu, H.Y.; Zhang, W.; Wu, X.Q.; Li, P.P.; Huang, X.W.; Mou, Y.C.; et al. Helium and natural hydrogen in the Bohai Bay Basin, China: Occurrence, resources, and exploration prospects. Appl. Energy 2025, 383, 125398. [Google Scholar] [CrossRef] [Scilit]
- Liu, Q.Y.; Wei, Y.B.; Zhu, D.Y.; Wu, X.Q.; Meng, Q.Q.; Li, P.P.; Fu, Y.; Zhu, D.; Zhang, W.; Jin, Z.J. Formation and enrichment mechanisms of precious gas in sedimentary basins. Sci. China Earth Sci. 2025, 68, 3268–3287. [Google Scholar] [CrossRef] [Scilit]
- Liu, Q.Y.; Wei, Y.B.; Li, P.P.; Huang, X.W.; Meng, Q.Q.; Wu, X.Q.; Zhu, D.Y.; Xu, H.Y.; Fu, Y.; Zhu, D.; et al. Natural hydrogen in the volcanic-bearing sedimentary basin: Origin, conversion, and production rates. Sci. Adv. 2025, 11, eadr6771. [Google Scholar] [CrossRef] [Scilit] [PubMed]
- Barnes, I.; LaMarche, V.C.; Himmelberg, G.R. Geochemical evidence of present-day serpentinization. Science 1967, 156, 830–832. [Google Scholar] [CrossRef] [Scilit] [PubMed]
- Barnes, I.; O’Neil, J.R.; Trescases, J.J. Present day serpentinization in New Caledonia, Oman and Yugoslavia. Geochim. Cosmochim. Acta 1978, 42, 144–145. [Google Scholar] [CrossRef] [Scilit]
- Neal, C.; Stanger, G. Hydrogen generation from mantle source rocks in Oman. Earth Planet. Sci. Lett. 1983, 66, 315–320. [Google Scholar] [CrossRef] [Scilit]
- McCollom, T.M.; Bach, W. Thermodynamic constraints on hydrogen generation during serpentinization of ultramafic rocks. Geochim. Cosmochim. Acta 2009, 73, 856–875. [Google Scholar] [CrossRef] [Scilit]
- Neubeck, A.; Duc, N.T.; Bastviken, D.; Crill, P.; Holm, N.G. Formation of H2 and CH4 by weathering of olivine at temperatures between 30 and 70 °C. Geochem. Trans. 2011, 12, 6. [Google Scholar] [CrossRef] [Scilit] [PubMed]
- Hoşgörmez, H. Origin of the natural gas seep of Çıralı (Chimera), Turkey: Site of the first Olympic fire. J. Asian Earth Sci. 2007, 30, 131–141. [Google Scholar] [CrossRef] [Scilit]
- Hoşgörmez, H.; Etiope, G.; Yalçın, M.N. New evidence for a mixed inorganic and organic origin of the Olympic Chimaera fire (Turkey): A large onshore seepage of abiogenic gas. Geofluids 2008, 8, 263–273. [Google Scholar] [CrossRef] [Scilit]
- Etiope, G.; Schoell, M.; Hoşgörmez, H. Abiotic methane flux from the Chimaera seep and Tekirova ophiolites (Turkey): Understanding gas exhalation from low temperature serpentinization and implications for Mars. Earth Planet. Sci. Lett. 2011, 310, 96–104. [Google Scholar] [CrossRef] [Scilit]
- Etiope, G.; Sherwood Lollar, B. Abiotic methane on Earth. Rev. Geophys. 2013, 51, 276–299. [Google Scholar] [CrossRef] [Scilit]
- Meyer-Dombard, D.R.; Woycheese, K.M.; Yargıçoğlu, E.N.; Cardace, D.; Shock, E.L.; Güleçal-Pektaş, Y.; Temel, M. High pH microbial ecosystems in a newly discovered, ephemeral, serpentinizing fluid seep at Yanartaş (Chimera), Turkey. Front. Microbiol. 2015, 5, 723. [Google Scholar] [CrossRef] [Scilit] [PubMed]
- Schoell, M. Genetic characterization of natural gases. AAPG Bull. 1983, 67, 2225–2238. [Google Scholar] [CrossRef] [Scilit]
- Schoell, M. Multiple origins of methane in the Earth. Chem. Geol. 1988, 71, 1–10. [Google Scholar] [CrossRef] [Scilit]
- Whiticar, M.J. A geochemical perspective of natural gas and atmospheric methane. Org. Geochem. 1990, 16, 531–547. [Google Scholar] [CrossRef] [Scilit]
- Whiticar, M.J. Carbon and hydrogen isotope systematics of bacterial formation and oxidation of methane. Chem. Geol. 1999, 161, 291–314. [Google Scholar] [CrossRef] [Scilit]
- Yılmaz, P.O. Geology of the Antalya Complex, SW Turkey. Ph.D. Thesis, The University of Texas at Austin, Austin, TX, USA, 1981. [Google Scholar]
- Yılmaz, P.O. The Alakırçay unit, Antalya Complex: A tectonic enigma. In Geology of the Taurus Belt, Proceedings of the International Symposium, Ankara, Türkiye; Tekeli, O., Göncüoğlu, M.C., Eds.; General Directorate of Mineral Research and Exploration (MTA): Ankara, Türkiye, 1984; pp. 27–40. [Google Scholar]
- Şenel, M. Discussion on the Antalya nappes. In Geology of the Taurus Belt, Proceedings of the International Symposium, Ankara, Türkiye; Tekeli, O., Göncüoğlu, M.C., Eds.; General Directorate of Mineral Research and Exploration (MTA): Ankara, Türkiye, 1984; pp. 41–52. [Google Scholar]
- Poisson, A.; Yağmurlu, F.; Bozcu, M.; Şentürk, M. New insights on the tectonic setting and evolution around the apex of the Isparta Angle (SW Turkey). Geol. J. 2003, 38, 257–282. [Google Scholar] [CrossRef] [Scilit]
- Bağcı, U.; Parlak, O.; Höck, V. Geochemical character and tectonic environment of ultramafic to mafic cumulate rocks from the Tekirova (Antalya) ophiolite (southern Turkey). Geol. J. 2006, 41, 193–219. [Google Scholar] [CrossRef] [Scilit]
- Yağmurlu, F.; Tagliasacchi, E.; Şentürk, M. The significant hydrocarbon seepages in the Eastern Mediterranean region: Çıralı (Chimera) natural gas potential, Kemer-Antalya, SW Turkey. In Engineering Research Papers; Günday, A., Pehlivan, E., Minaz, M.R., Eds.; Gece Kitaplığı: Ankara, Türkiye, 2019; pp. 45–63. [Google Scholar]
- Yağmurlu, F. The origin of natural gas seeps in the Antalya-Çıralı region (SW-Anatolia) and their location and importance within the geological setting of the Eastern Mediterranean region. Türkiye Jeol. Bül. 2025, 68, 109–130. [Google Scholar] [CrossRef] [Scilit]
- Okay, A.I.; Tüysüz, O. Tethyan sutures of northern Turkey. Geol. Soc. Lond. Spec. Publ. 1999, 156, 475–515. [Google Scholar] [CrossRef] [Scilit]
- Parlak, O. The Tauride ophiolites of Anatolia (Turkey): A review. J. Earth Sci. 2016, 27, 901–934. [Google Scholar] [CrossRef] [Scilit]
- Parlak, O.; Rızaoğlu, T.; Bağcı, U.; Karaoğlan, F.; Höck, V. Tectonic significance of the geochemistry and petrology of ophiolites in southeast Anatolia, Turkey. Tectonophysics 2009, 473, 173–187. [Google Scholar] [CrossRef] [Scilit]
- Copernicus Land Monitoring Service. Very High Resolution Image Mosaic 2021 True Colour (Raster 2 m), Europe. European Union’s Copernicus Land Monitoring Service Information. Available online: https://land.copernicus.eu/en/products/european-image-mosaic/very-high-resolution-image-mosaic-2021-true-colour-2m (accessed on 28 July 2026).
- Demirel, I.H.; Günay, Y. Tectonic and karstic effects on the Western Taurus Region, southwestern Turkey: Relations to the present temperature gradients and total organic carbon content. Energy Sources 2000, 22, 431–441. [Google Scholar] [CrossRef] [Scilit]
- Bozcu, A.; Yağmurlu, F. Correlation of sedimentary units in the Western Taurides from the point of petroleum geology. In Proceedings of the 4th International Symposium on Eastern Mediterranean Geology, Isparta, Türkiye, 21–25 May 2001; pp. 139–148. [Google Scholar]
- Özçelik, O.; Altunsoy, M.; Acar, F.; Erik, N.Y. Organic geochemical characteristics of the Miocene Lycian Basin, western Taurides, Turkey. Int. Geol. Rev. 2009, 51, 77–93. [Google Scholar] [CrossRef] [Scilit][Green Version]
- Bağcı, U.; Parlak, O. Petrology of the Tekirova (Antalya) ophiolite (Southern Turkey): Evidence for diverse magma generations and their tectonic implications during Neotethyan subduction. Int. J. Earth Sci. 2009, 98, 387–405. [Google Scholar] [CrossRef] [Scilit]
- Güneş, A.; İlbeyli, N.; Rasimgil, S.; Demirbilek, M. Petrological and geochemical characteristics of the diabase and metasomatised dikes from the Tekirova ophiolite (SW Anatolia, Turkey): Tectonomagmatic evolution of the southern Neotethys. Geochemistry 2021, 81, 125767. [Google Scholar] [CrossRef] [Scilit]
- Neubeck, A.; Boosman, A.; Hoşgörmez, H.; Özcan, Z.; Boskabadi, A.; Ivarsson, M.; Rouxel, O. δ60Ni and δ13C Composition of Serpentinites and Carbonates of the Tekirova Ophiolite, Turkey, and Meatiq Ophiolite, Egypt. Front. Earth Sci. 2021, 9, 651967. [Google Scholar] [CrossRef] [Scilit]
- Schwarzenbach, E.M.; Vrijmoed, J.C.; Engelmann, J.M.; Liesegang, M.; Wiechert, U.; Rohne, R.; Plümper, O. Sulfide Dissolution and Awaruite Formation in Continental Serpentinization Environments and Its Implications to Supporting Life. J. Geophys. Res. Solid. Earth 2021, 126, e2021JB021758. [Google Scholar] [CrossRef] [Scilit]
- Neubeck, A.; Sun, L.; Müller, B.; Ivarsson, M.; Hoşgörmez, H.; Özcan, D.; Broman, C.; Schnürer, A. Microbial Community Structure in a Serpentine-Hosted Abiotic Gas Seepage at the Chimaera Ophiolite, Turkey. Appl. Environ. Microbiol. 2017, 83, e03430-16. [Google Scholar] [CrossRef] [Scilit] [PubMed]
- Zwicker, J.; Birgel, D.; Bach, W.; Richoz, S.; Smrzka, D.; Grasemann, B.; Gier, S.; Schleper, C.; Rittmann, S.K.-M.R.; Koşun, E.; et al. Evidence for archaeal methanogenesis within veins at the onshore serpentinite-hosted Chimaera seeps, Turkey. Chem. Geol. 2018, 483, 567–580. [Google Scholar] [CrossRef] [Scilit]
- Thayer, T.P. Serpentinization considered as a constant-volume metasomatic process. Am. Mineral. 1966, 51, 685–710. [Google Scholar]
- Ramdohr, P. A widespread mineral association connected with serpentinization. Neues Jahrb. Mineral. Abh. 1967, 107, 241–265. [Google Scholar]
- Etiope, G.; Ionescu, A. Low-temperature catalytic CO2 hydrogenation with geological quantities of ruthenium: A possible abiotic CH4 source in chromitite-rich serpentinized rocks. Geofluids 2015, 15, 438–452. [Google Scholar] [CrossRef] [Scilit]
- Pappalardo, L.; Buono, G.; Procesi, M.; Etiope, G. The link between ophiolitic chromitites, natural hydrogen and methane: Insights from 3D microtomography. Chem. Geol. 2025, 676, 122575. [Google Scholar] [CrossRef] [Scilit]
- Bernard, B.B.; Brooks, J.M.; Sackett, W.M. Light hydrocarbons in recent Texas continental shelf and slope sediments. J. Geophys. Res. 1978, 83, 4053–4061. [Google Scholar] [CrossRef] [Scilit]
- Mayhew, L.E.; Ellison, E.T.; McCollom, T.M.; Trainor, T.P.; Templeton, A.S. Hydrogen generation from low-temperature water–rock reactions. Nat. Geosci. 2013, 6, 478–484. [Google Scholar] [CrossRef] [Scilit]
- Huang, R.F.; Sun, W.D.; Ding, X.; Liu, J.Z.; Peng, S.B. Olivine versus peridotite during serpentinization: Gas formation. Sci. China Earth Sci. 2015, 58, 2165–2174. [Google Scholar] [CrossRef] [Scilit]
- Huang, R.F.; Li, W.W.; Zhang, M.; Sun, W.D.; Shang, X.Q. The influence of CO2 on hydrogen generation and reaction kinetics during olivine and peridotite serpentinization. J. Geophys. Res. Solid Earth 2026, 131, e2025JB033295. [Google Scholar] [CrossRef] [Scilit]
- Zelenski, M.; Plyasunov, A.V.; Kamenetsky, V.S.; Nekrylov, N.; Matveev, D.; Korneeva, A. High-temperature water–olivine interaction and hydrogen liberation in the subarc mantle. Contrib. Mineral. Petrol. 2022, 177, 47. [Google Scholar] [CrossRef] [Scilit]
- Horita, J.; Berndt, M.E. Abiogenic methane formation and isotopic fractionation under hydrothermal conditions. Science 1999, 285, 1055–1057. [Google Scholar] [CrossRef] [Scilit] [PubMed]
- McCollom, T.M. Laboratory simulations of abiotic hydrocarbon formation in Earth’s deep subsurface. Rev. Mineral. Geochem. 2013, 75, 467–494. [Google Scholar] [CrossRef] [Scilit]
- Nothaft, D.B.; Templeton, A.S.; Rhim, J.H.; Wang, D.T.; Labidi, J.; Miller, H.M.; Boyd, E.S.; Matter, J.M.; Ono, S.; Young, E.D.; et al. Geochemical, Biological, and Clumped Isotopologue Evidence for Substantial Microbial Methane Production Under Carbon Limitation in Serpentinites of the Samail Ophiolite, Oman. J. Geophys. Res. Biogeosci. 2021, 126, e2020JG006025. [Google Scholar] [CrossRef] [Scilit]
- Ueda, H.; Matsui, Y.; Sawaki, Y. Abiotic methane generation via CO2 hydrogenation with natural chromitite under hydrothermal conditions. Geochem. Geophys. Geosyst. 2021, 22, e2020GC009533. [Google Scholar] [CrossRef] [Scilit]
- Tilley, B.; Muehlenbachs, K. Isotope reversals and universal stages and trends of gas maturation in sealed, self-contained petroleum systems. Chem. Geol. 2013, 339, 194–204. [Google Scholar] [CrossRef] [Scilit]
- Kumawat, P.; Albers, E.; Bach, W.; Klein, F.; Menapace, W.; Vogt, C.; Schubotz, F. Biomarker evidence of a serpentinite chemosynthetic biosphere at the Mariana forearc. Commun. Earth Environ. 2025, 6, 659. [Google Scholar] [CrossRef] [Scilit]
- Milkov, A.V.; Etiope, G. Revised genetic diagrams for natural gases based on a global dataset of >20,000 samples. Org. Geochem. 2018, 125, 109–120. [Google Scholar] [CrossRef] [Scilit]
- Truche, L.; Donzé, F.-V.; Goskolli, E.; Muceku, B.; Loisy, C. A deep reservoir for hydrogen drives intense degassing in the Bulqizë ophiolite. Science 2024, 383, 618–621. [Google Scholar] [CrossRef] [Scilit] [PubMed]
- Kelley, D.S.; Karson, J.A.; Früh-Green, G.L.; Yoerger, D.R.; Shank, T.M.; Butterfield, D.A.; Hayes, J.M.; Schrenk, M.O.; Olson, E.J.; Proskurowski, G.; et al. A serpentinite-hosted ecosystem: The Lost City hydrothermal field. Science 2005, 307, 1428–1434. [Google Scholar] [CrossRef] [Scilit] [PubMed]
- Abrajano, T.A.; Sturchio, N.C.; Böhlke, J.K.; Lyon, G.L.; Poreda, R.J.; Stevens, C.M. Methane-hydrogen gas seeps, Zambales Ophiolite, Philippines: Deep or shallow origin? Chem. Geol. 1988, 71, 211–222. [Google Scholar] [CrossRef] [Scilit]
- Proskurowski, G.; Lilley, M.D.; Seewald, J.S.; Früh-Green, G.L.; Olson, E.J.; Lupton, J.E.; Sylva, S.P.; Kelley, D.S. Abiogenic hydrocarbon production at Lost City hydrothermal field. Science 2008, 319, 604–607. [Google Scholar] [CrossRef] [Scilit] [PubMed]
- Suda, K.; Ueno, Y.; Yoshizaki, M.; Nakamura, H.; Kurokawa, K.; Nishiyama, E.; Yoshino, K.; Hongoh, Y.; Kawachi, K.; Omori, S.; et al. Origin of methane in serpentinite-hosted hydrothermal systems: The CH4–H2–H2O hydrogen isotope systematics of the Hakuba Happo hot spring. Earth Planet. Sci. Lett. 2014, 386, 112–125. [Google Scholar] [CrossRef] [Scilit]
- Vacquand, C.; Deville, E.; Beaumont, V.; Guyot, F.; Sissmann, O.; Pillot, D.; Arcilla, C.; Prinzhofer, A. Reduced gas seepages in ophiolitic complexes: Evidences for multiple origins of the H2–CH4–N2 gas mixtures. Geochim. Cosmochim. Acta 2018, 223, 437–461. [Google Scholar] [CrossRef] [Scilit]
- Ojeda, L.; Etiope, G.; Jiménez-Gavilán, P.; Martonoş, I.M.; Röckmann, T.; Popa, M.E.; Sivan, M.; Castro-Gámez, A.F.; Benavente, J.; Vadillo, I. Combining methane clumped and bulk isotopes, temporal variations in molecular and isotopic composition, and hydrochemical and geological proxies to understand methane’s origin in the Ronda peridotite massifs (Spain). Chem. Geol. 2023, 642, 121799. [Google Scholar] [CrossRef] [Scilit]
- Zaccarini, F.; Kiss, G.B.; Garuti, G.; Mauro, D.; Economou-Eliopoulos, M.; Hegedűs, M.; Biagioni, C. Methane in fluid inclusions in ophiolitic chromitites revealed by Raman spectroscopy: Preliminary results. Minerals 2025, 15, 335. [Google Scholar] [CrossRef] [Scilit]
- Szponar, N.; Brazelton, W.J.; Schrenk, M.O.; Bower, D.M.; Steele, A.; Morrill, P.L. Geochemistry of a continental site of serpentinization, the Tablelands Ophiolite, Gros Morne National Park: A Mars analogue. Icarus 2013, 224, 286–296. [Google Scholar] [CrossRef] [Scilit]
- Şentürk, M. Vent-Scale Molecular and Compound-Specific Stable Isotope Geochemistry of the Çıralı (Yanartaş) Gas Seep, SW Türkiye; Version 1; Mendeley Data: London, UK, 2026. [Google Scholar] [CrossRef]
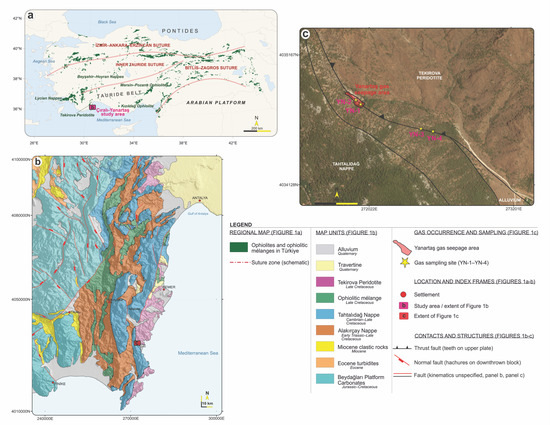
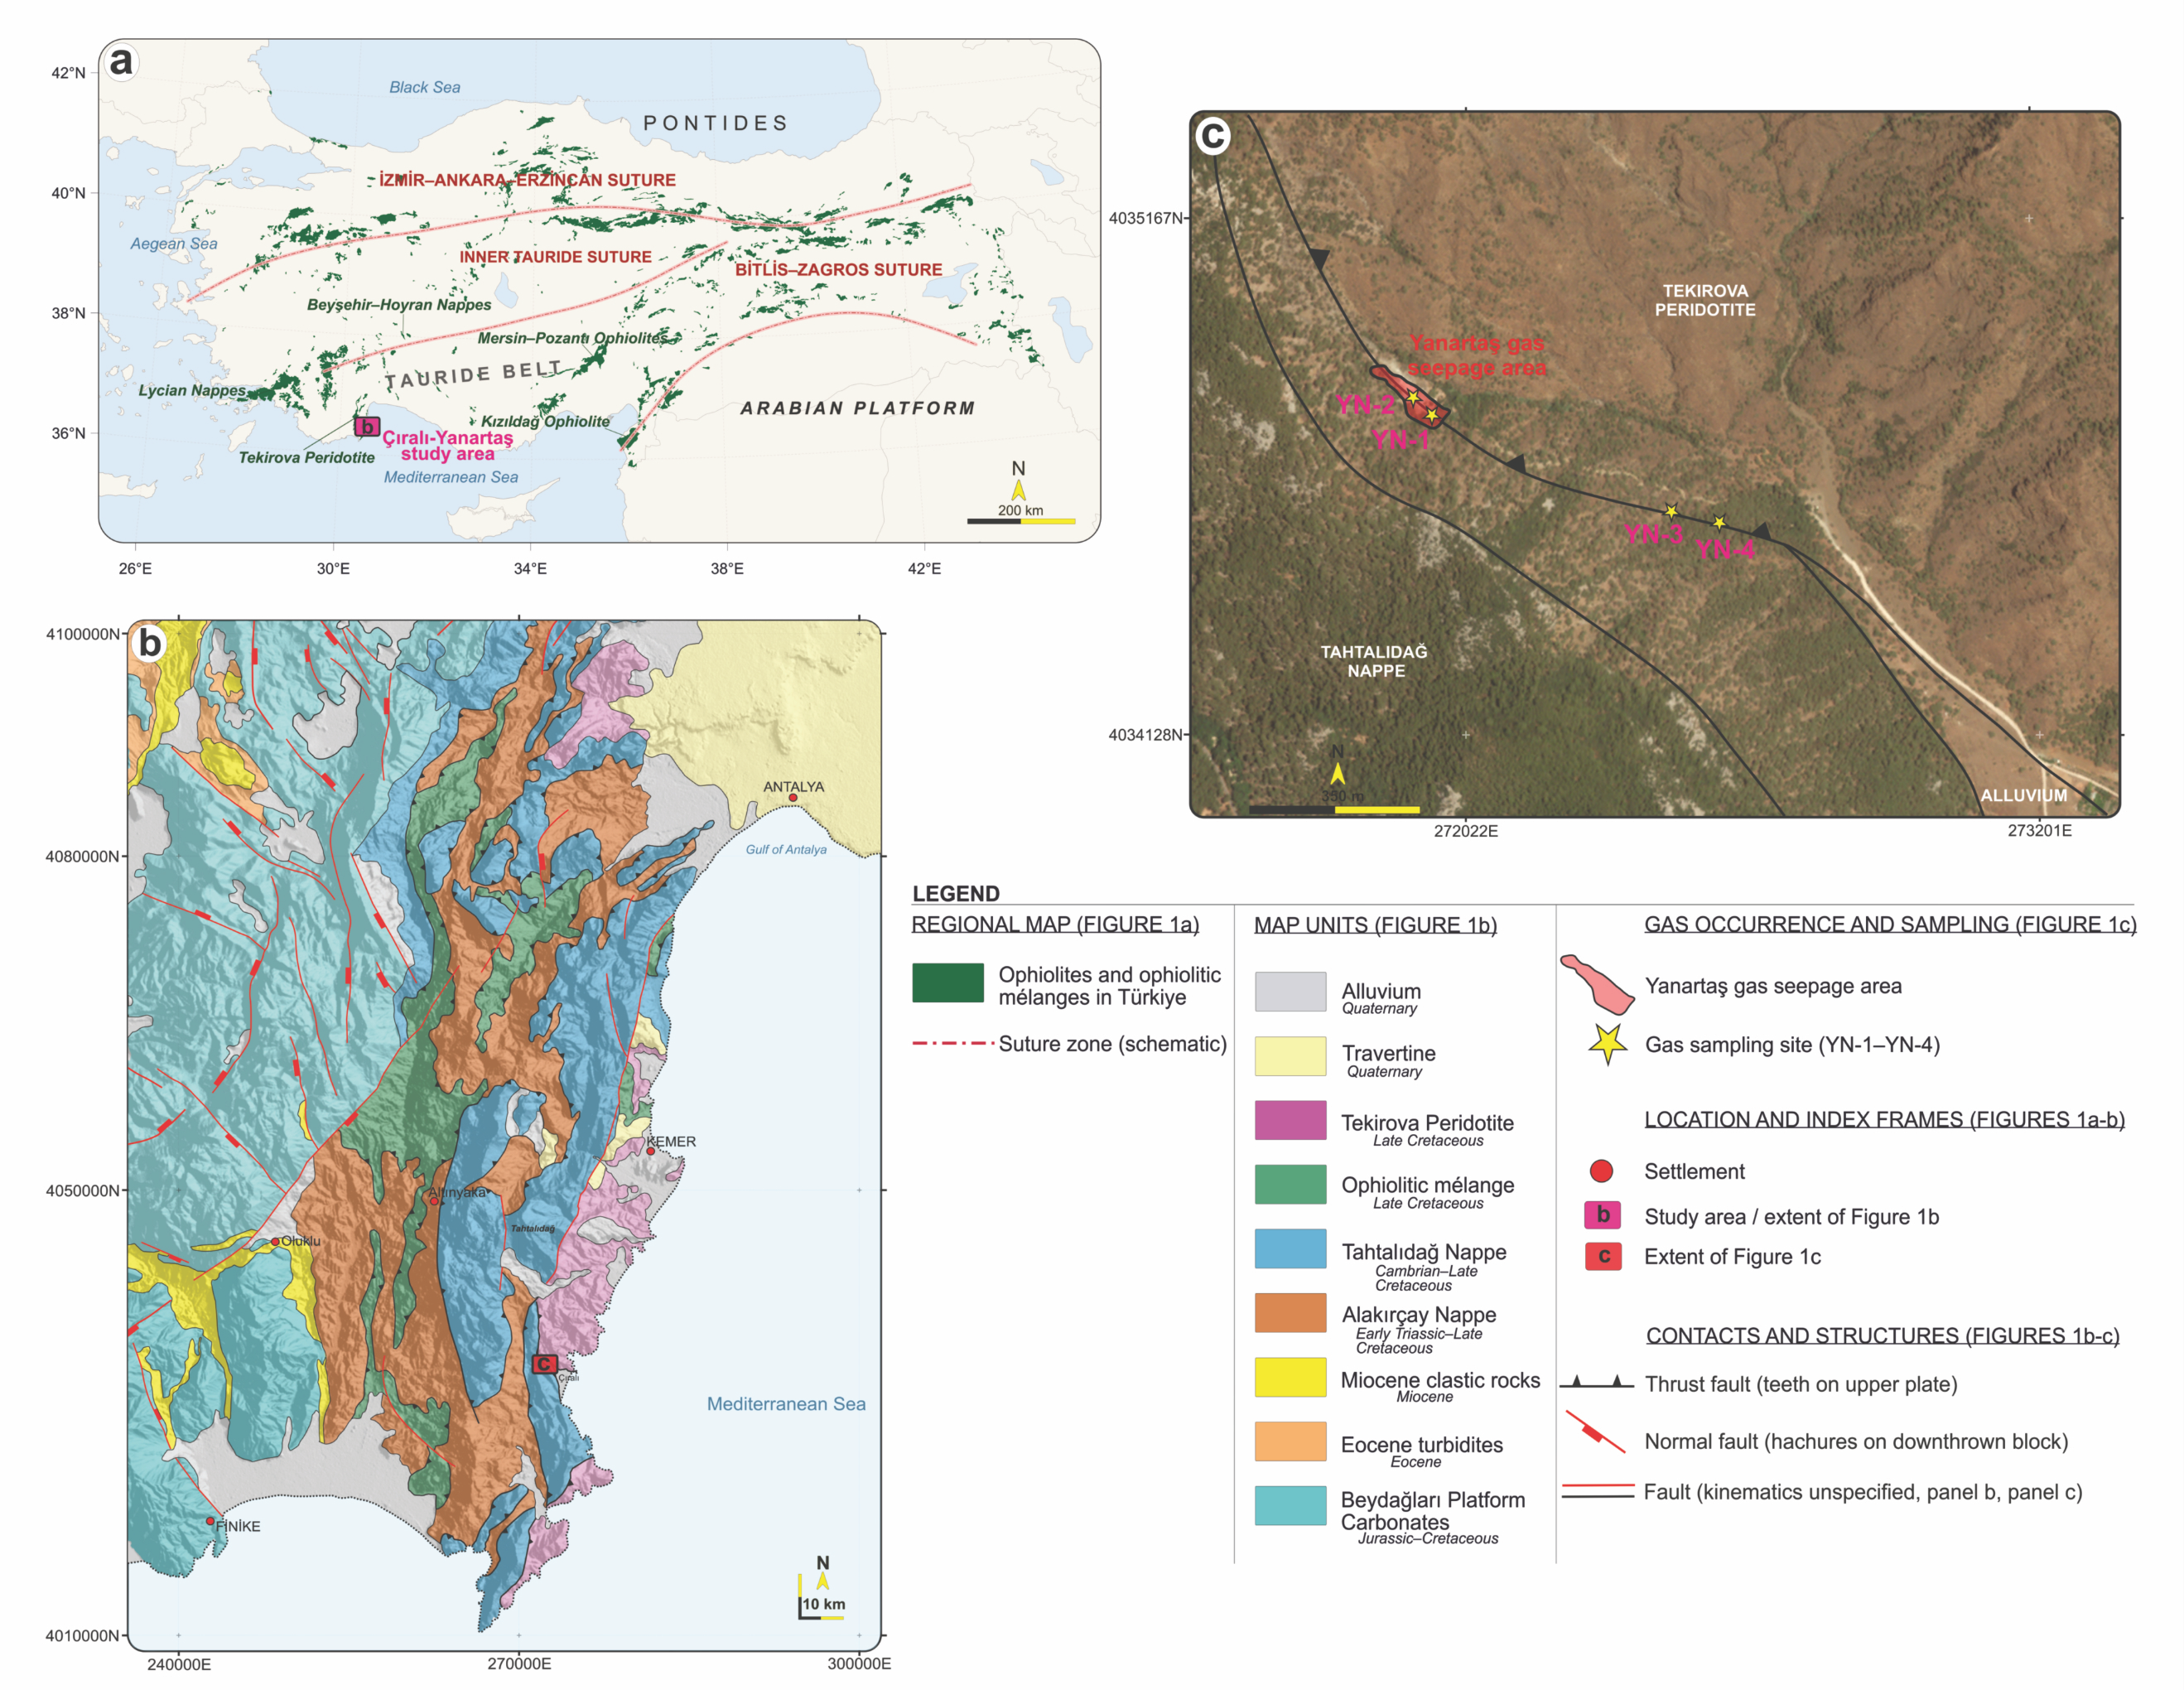
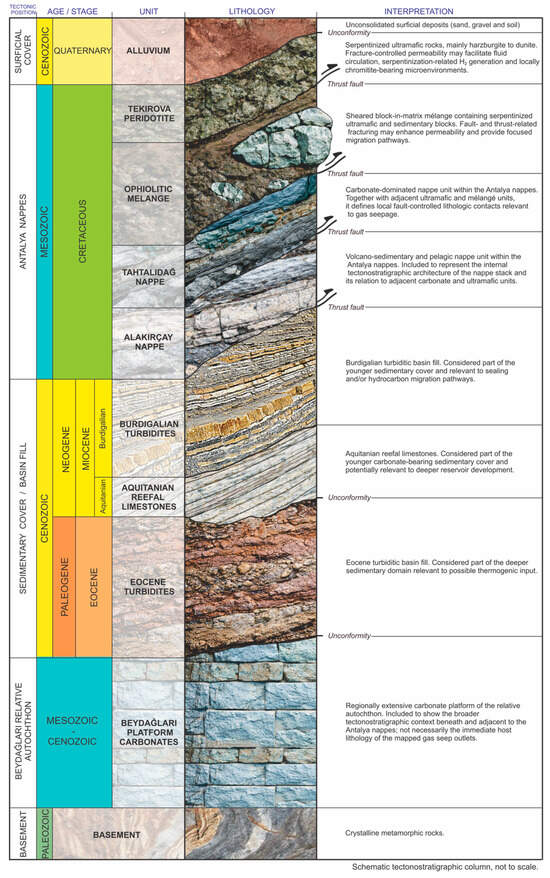
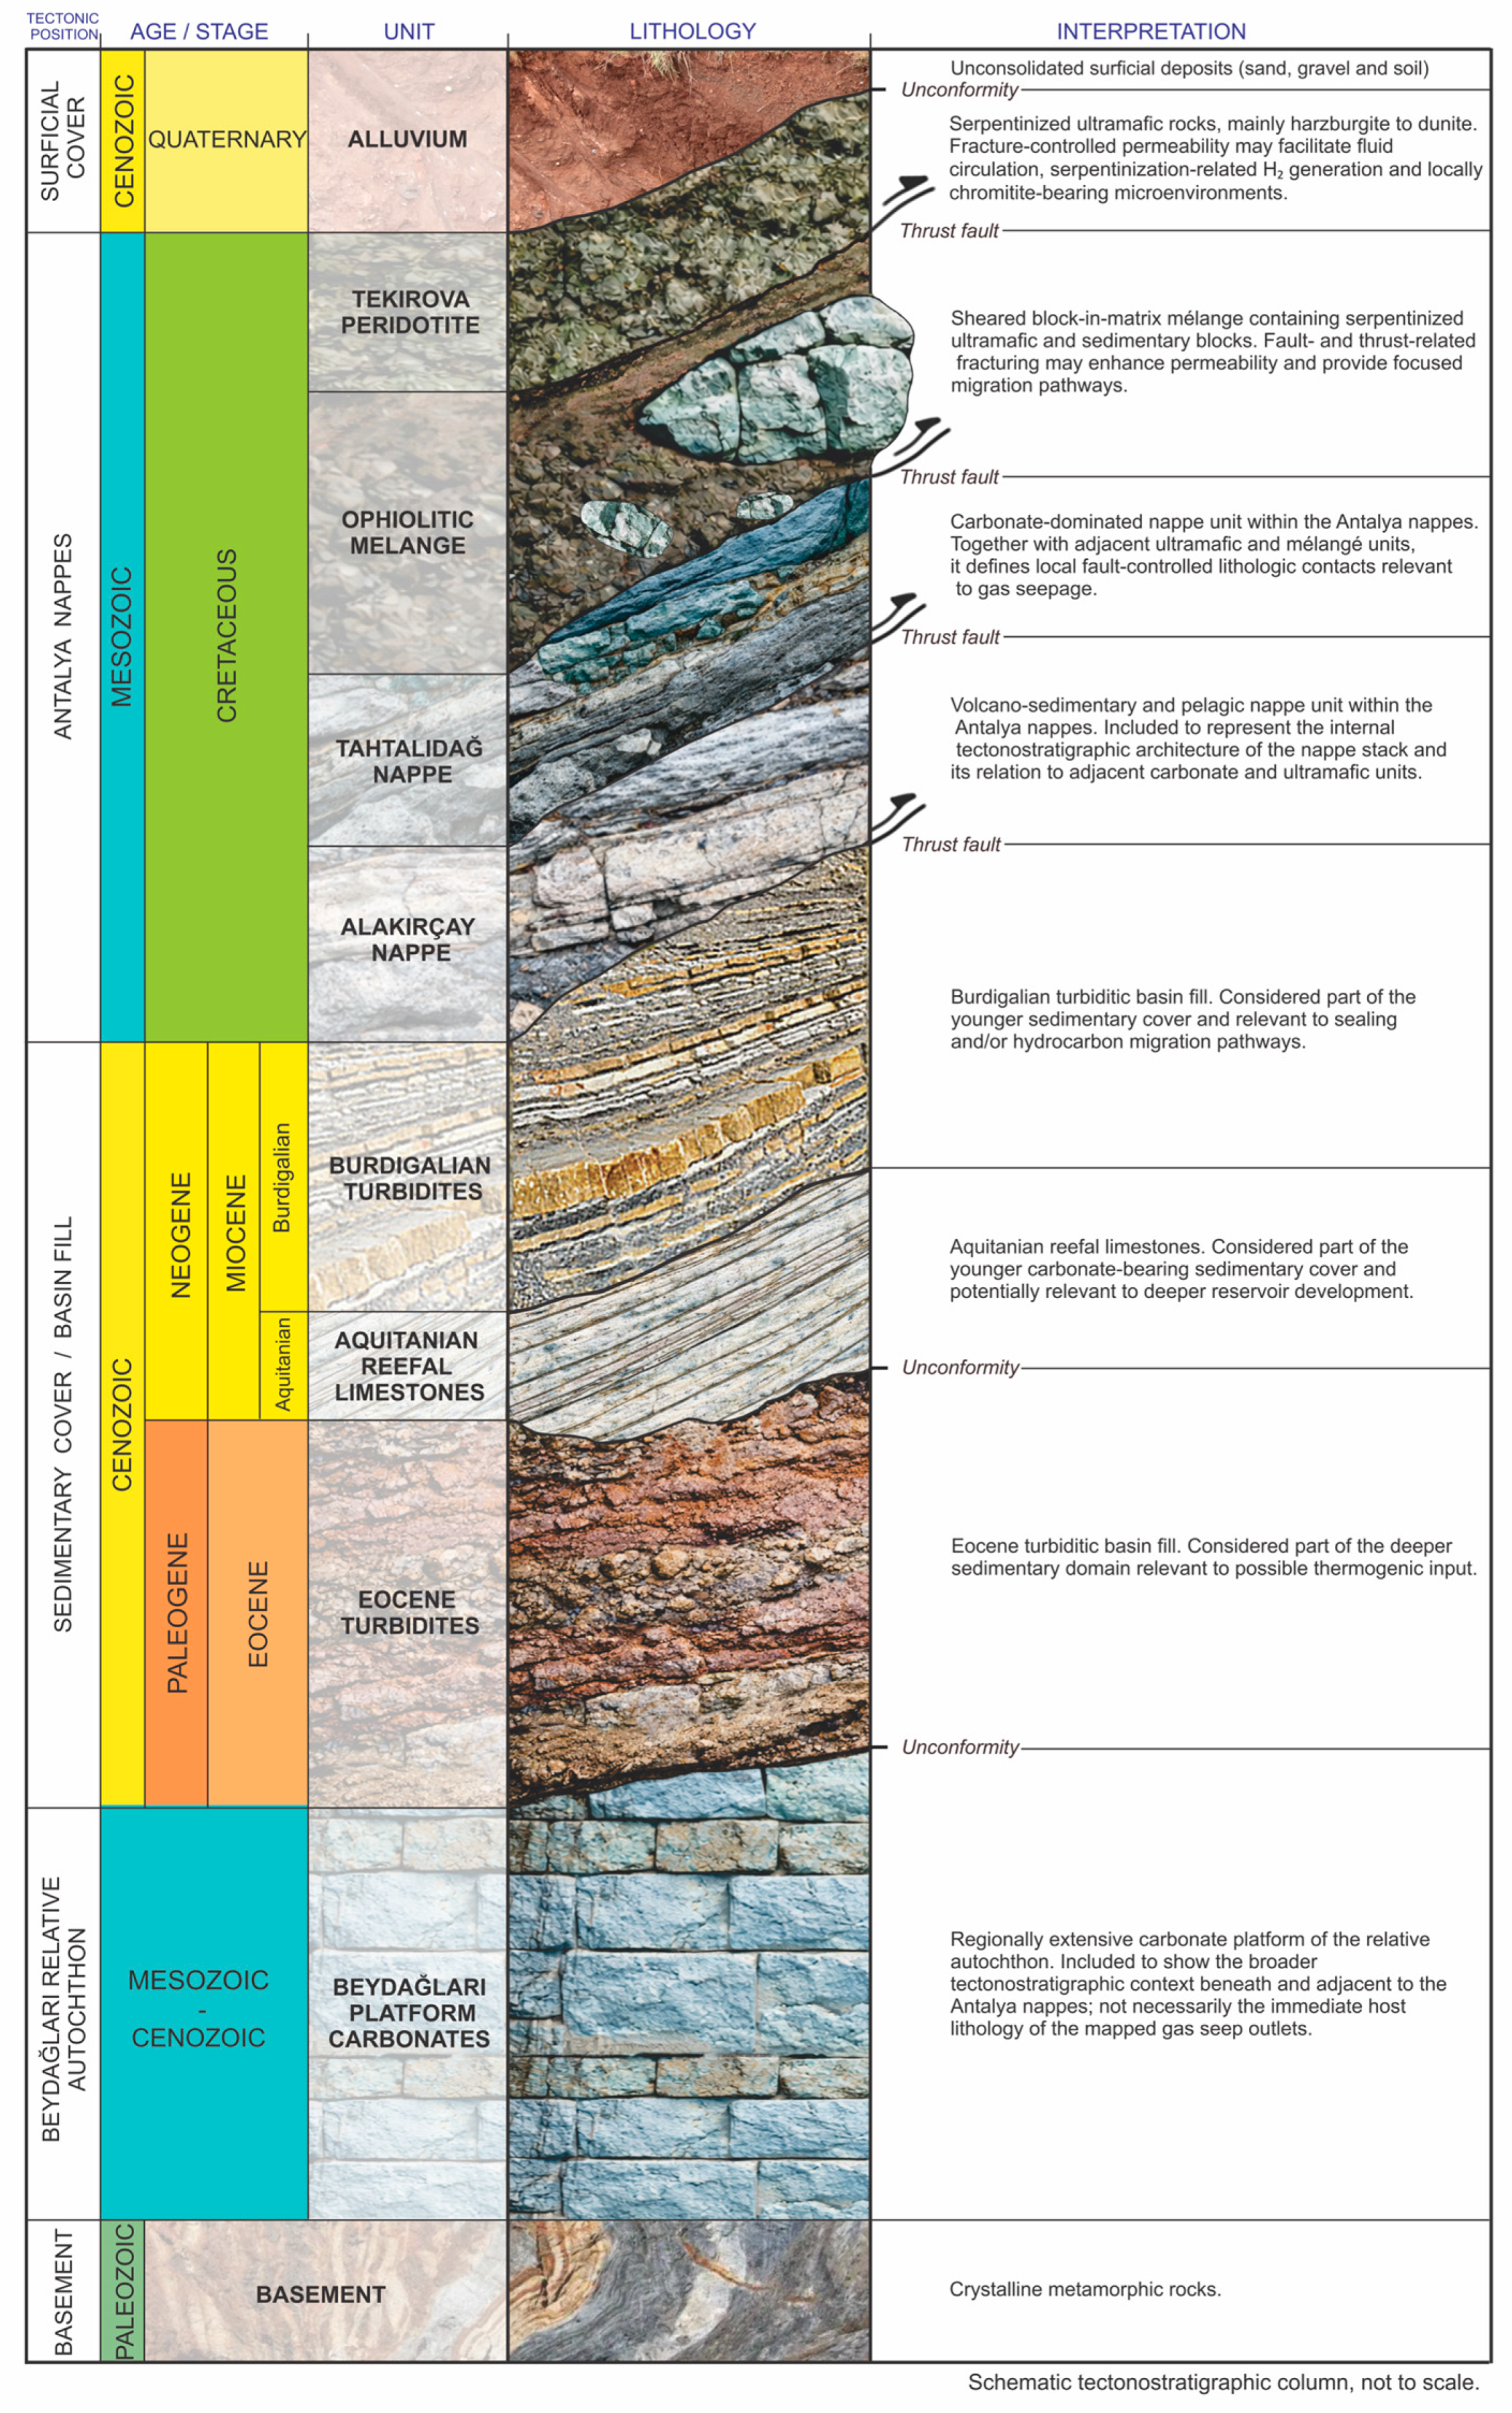
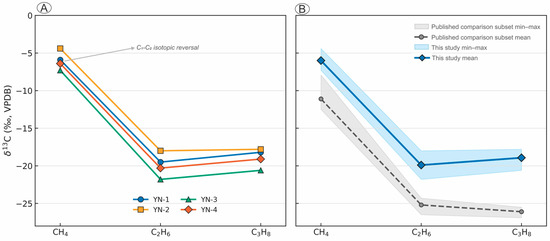
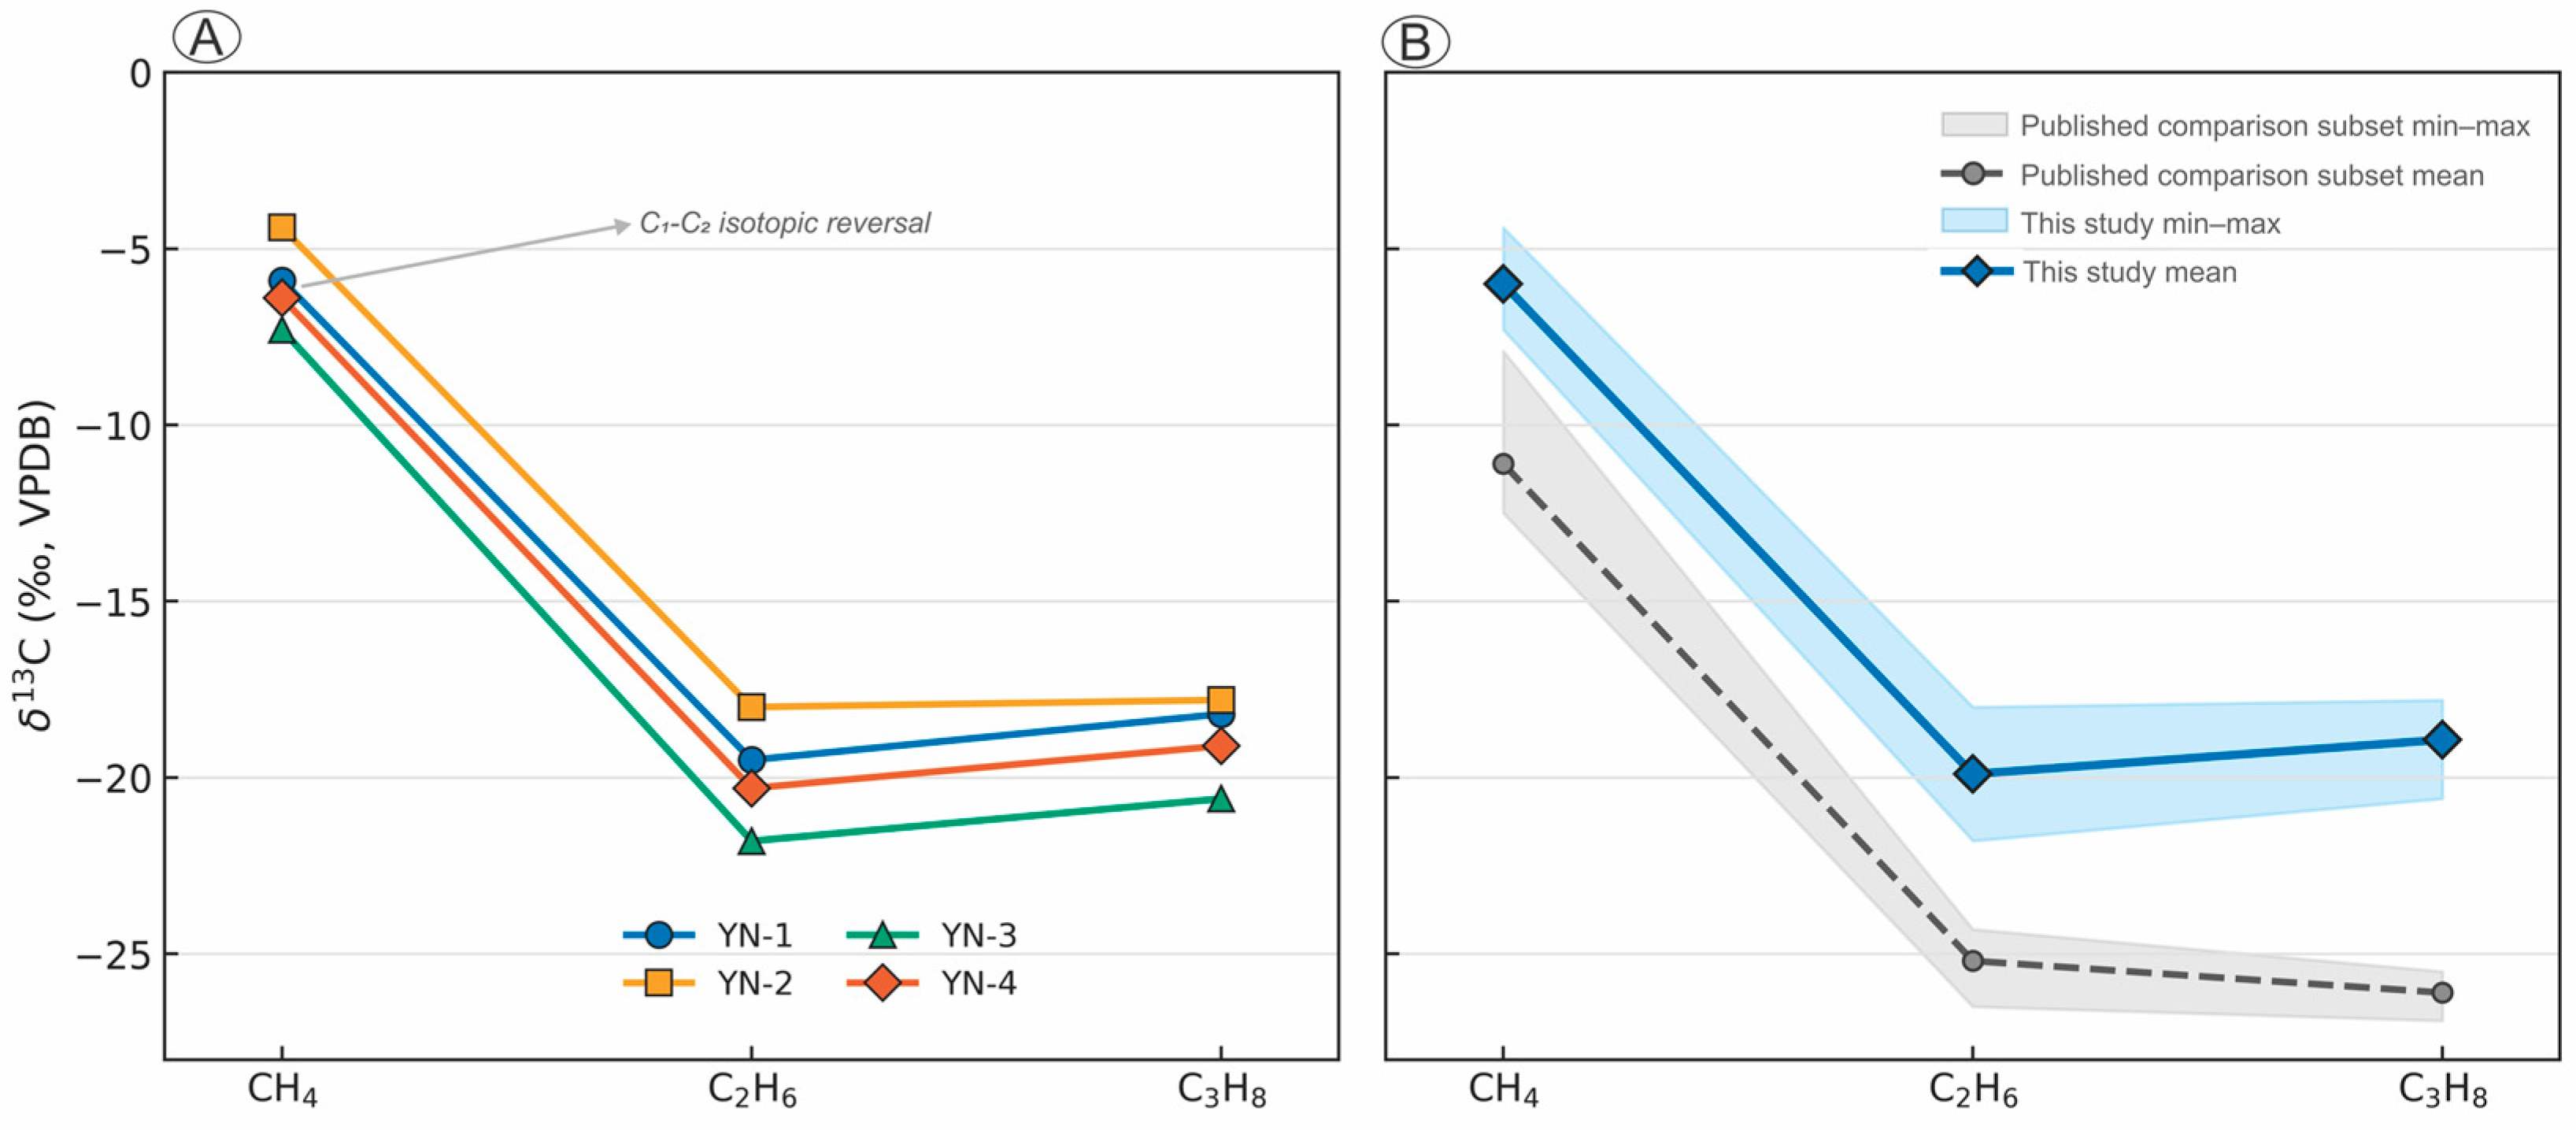
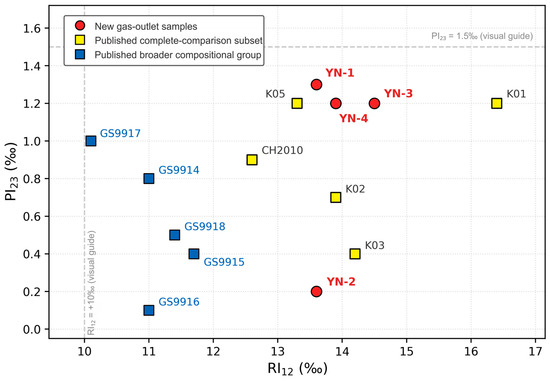
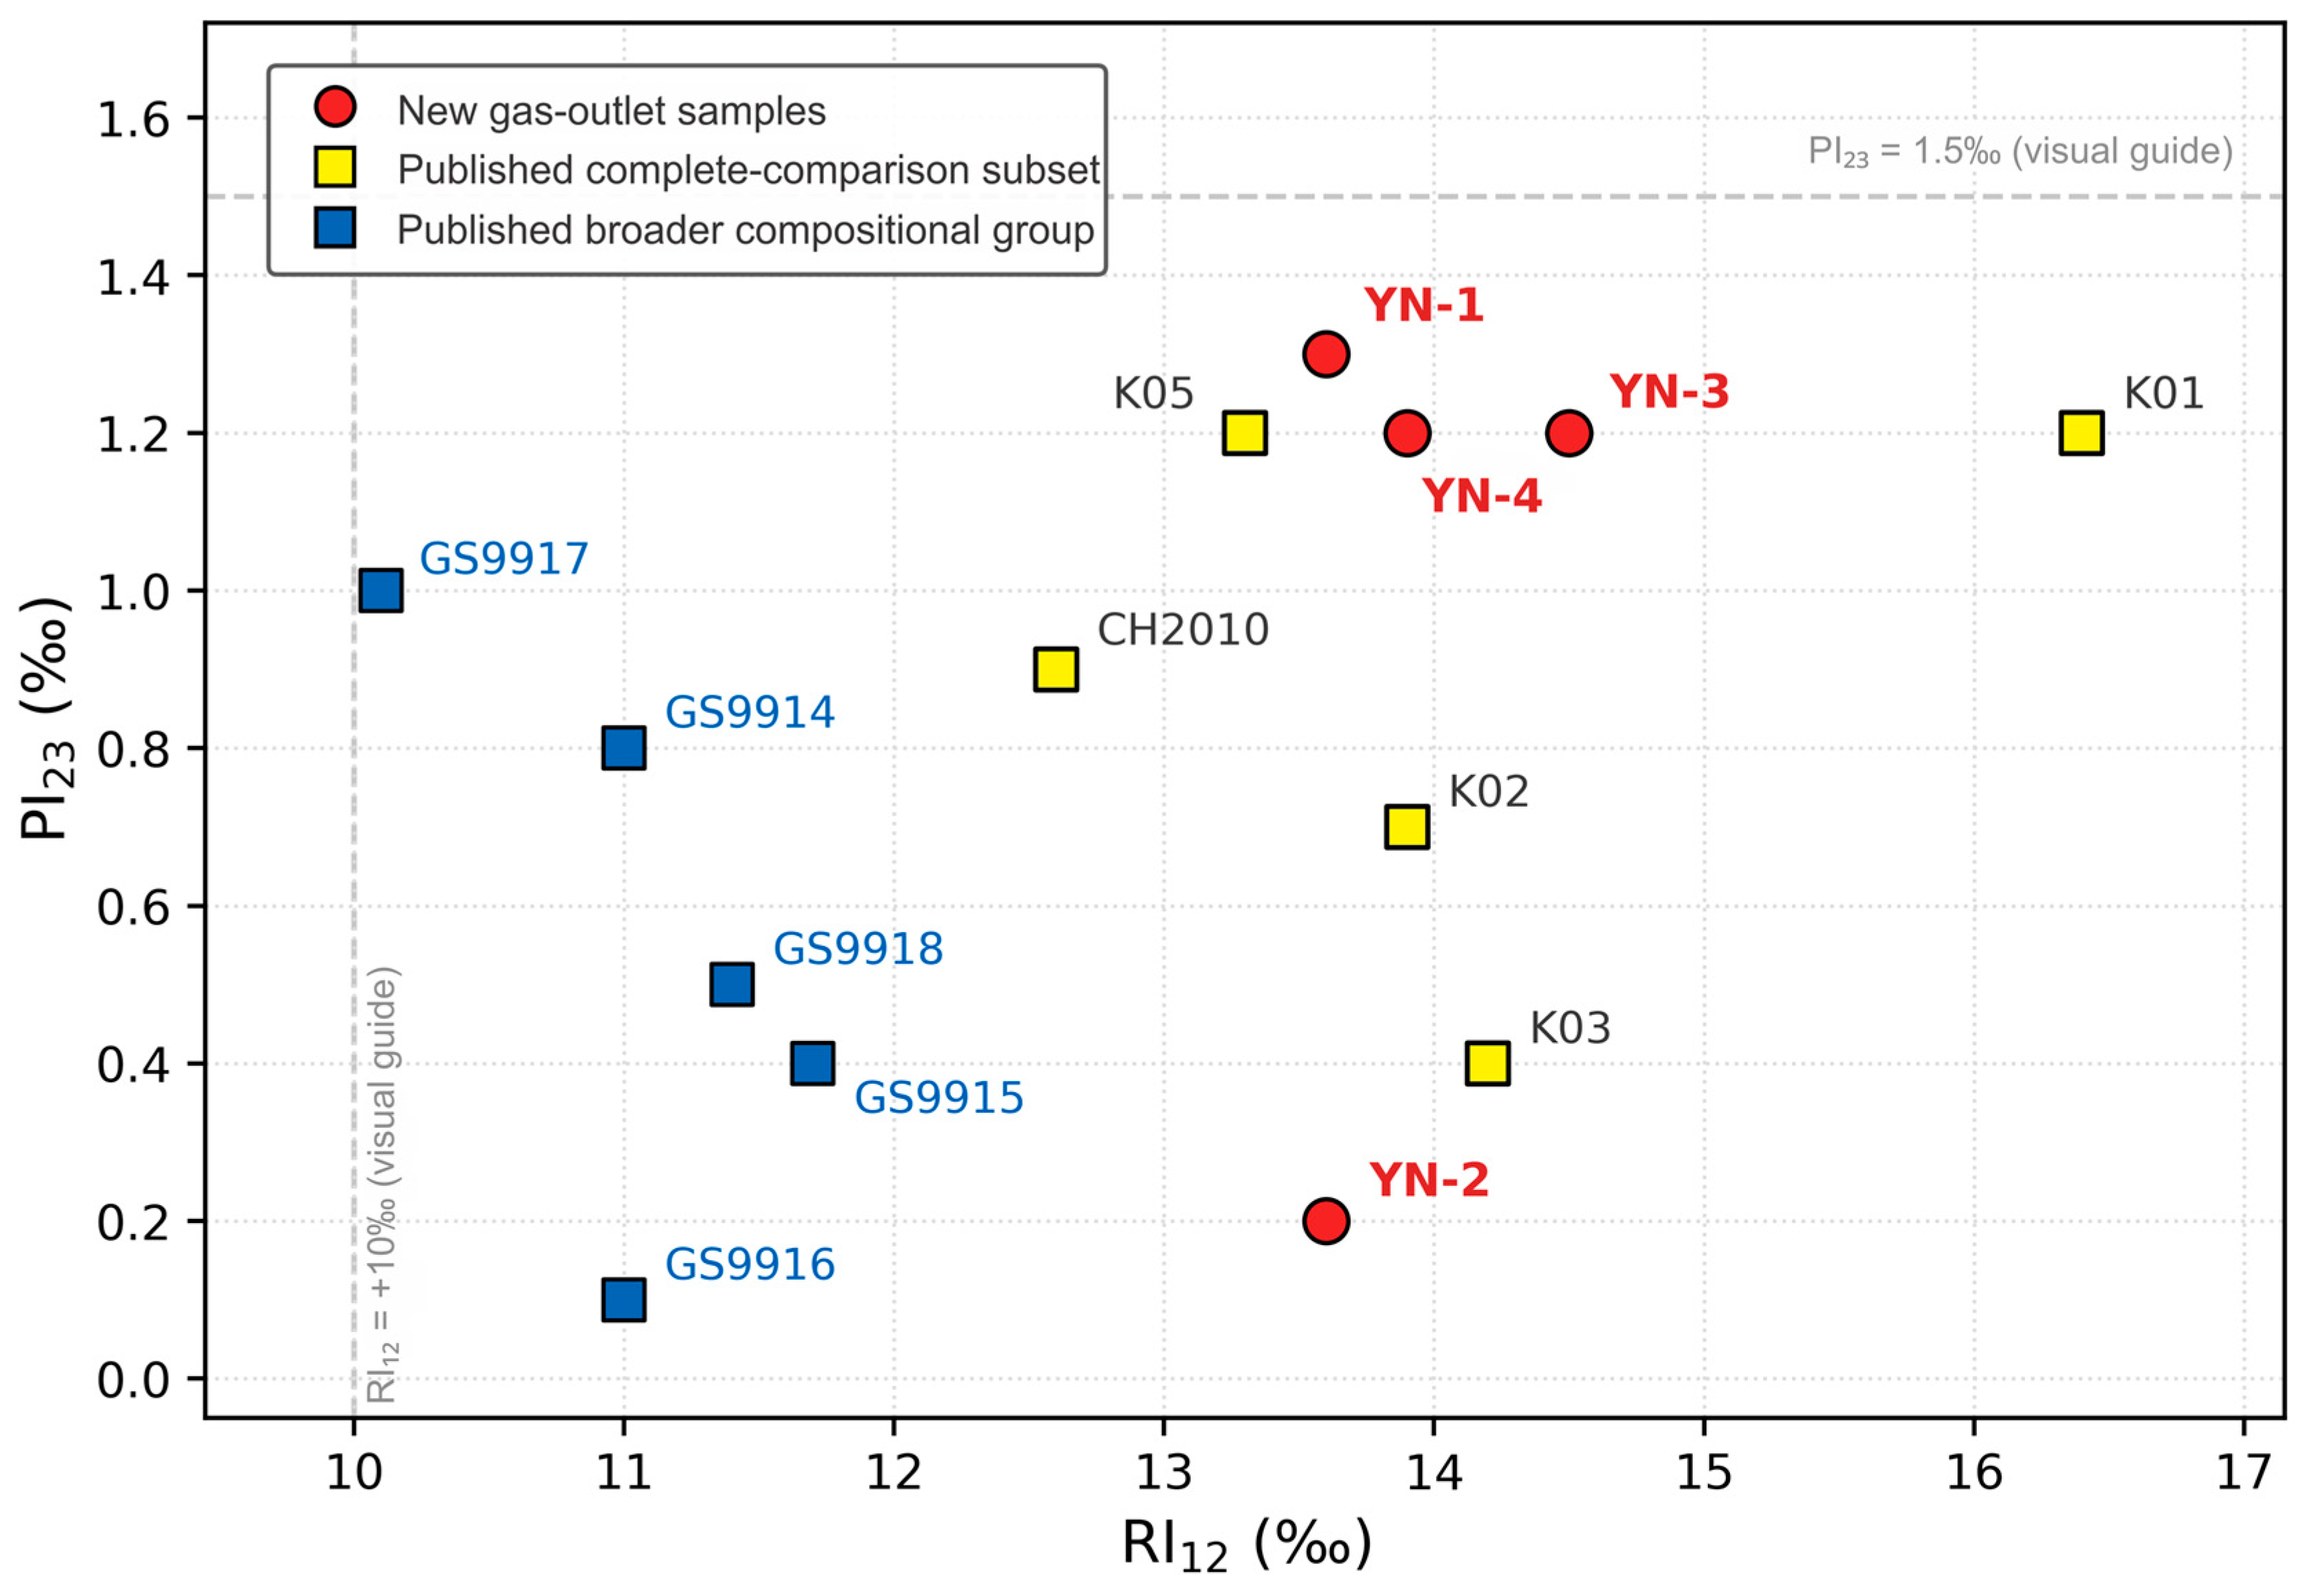
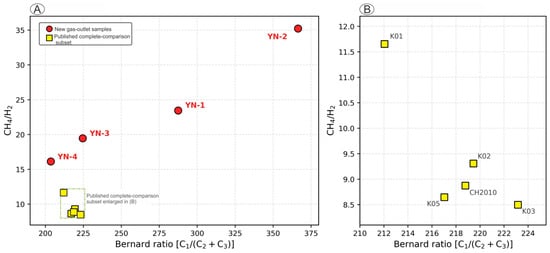
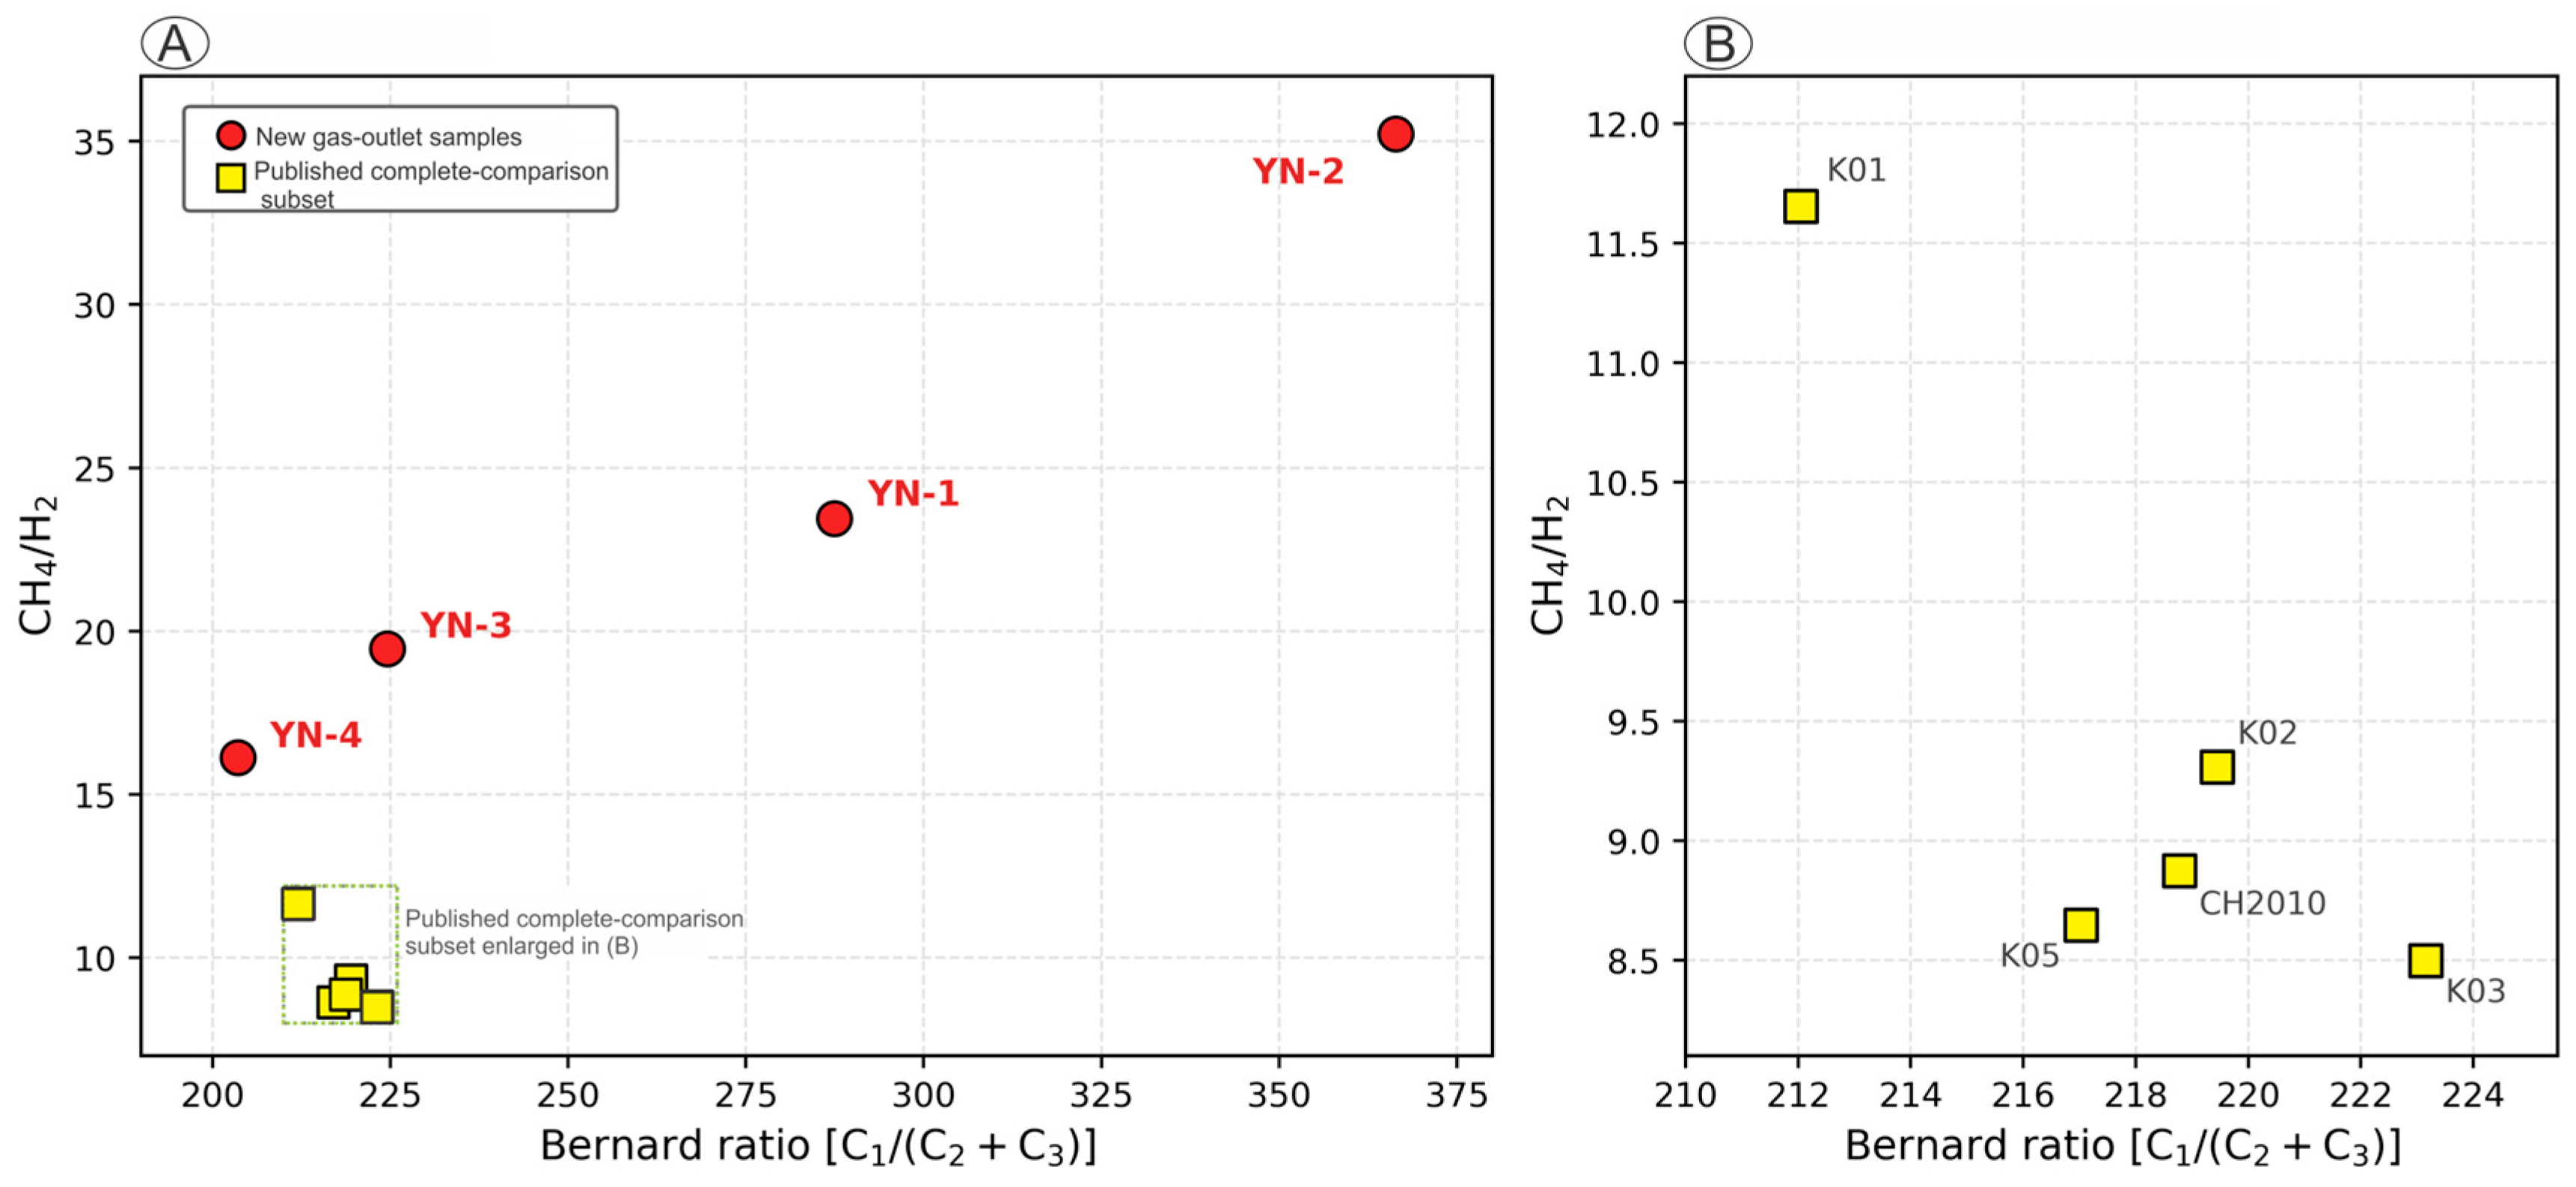
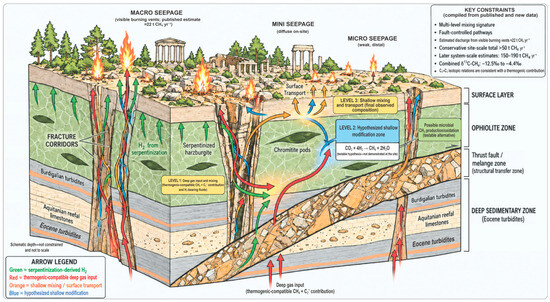
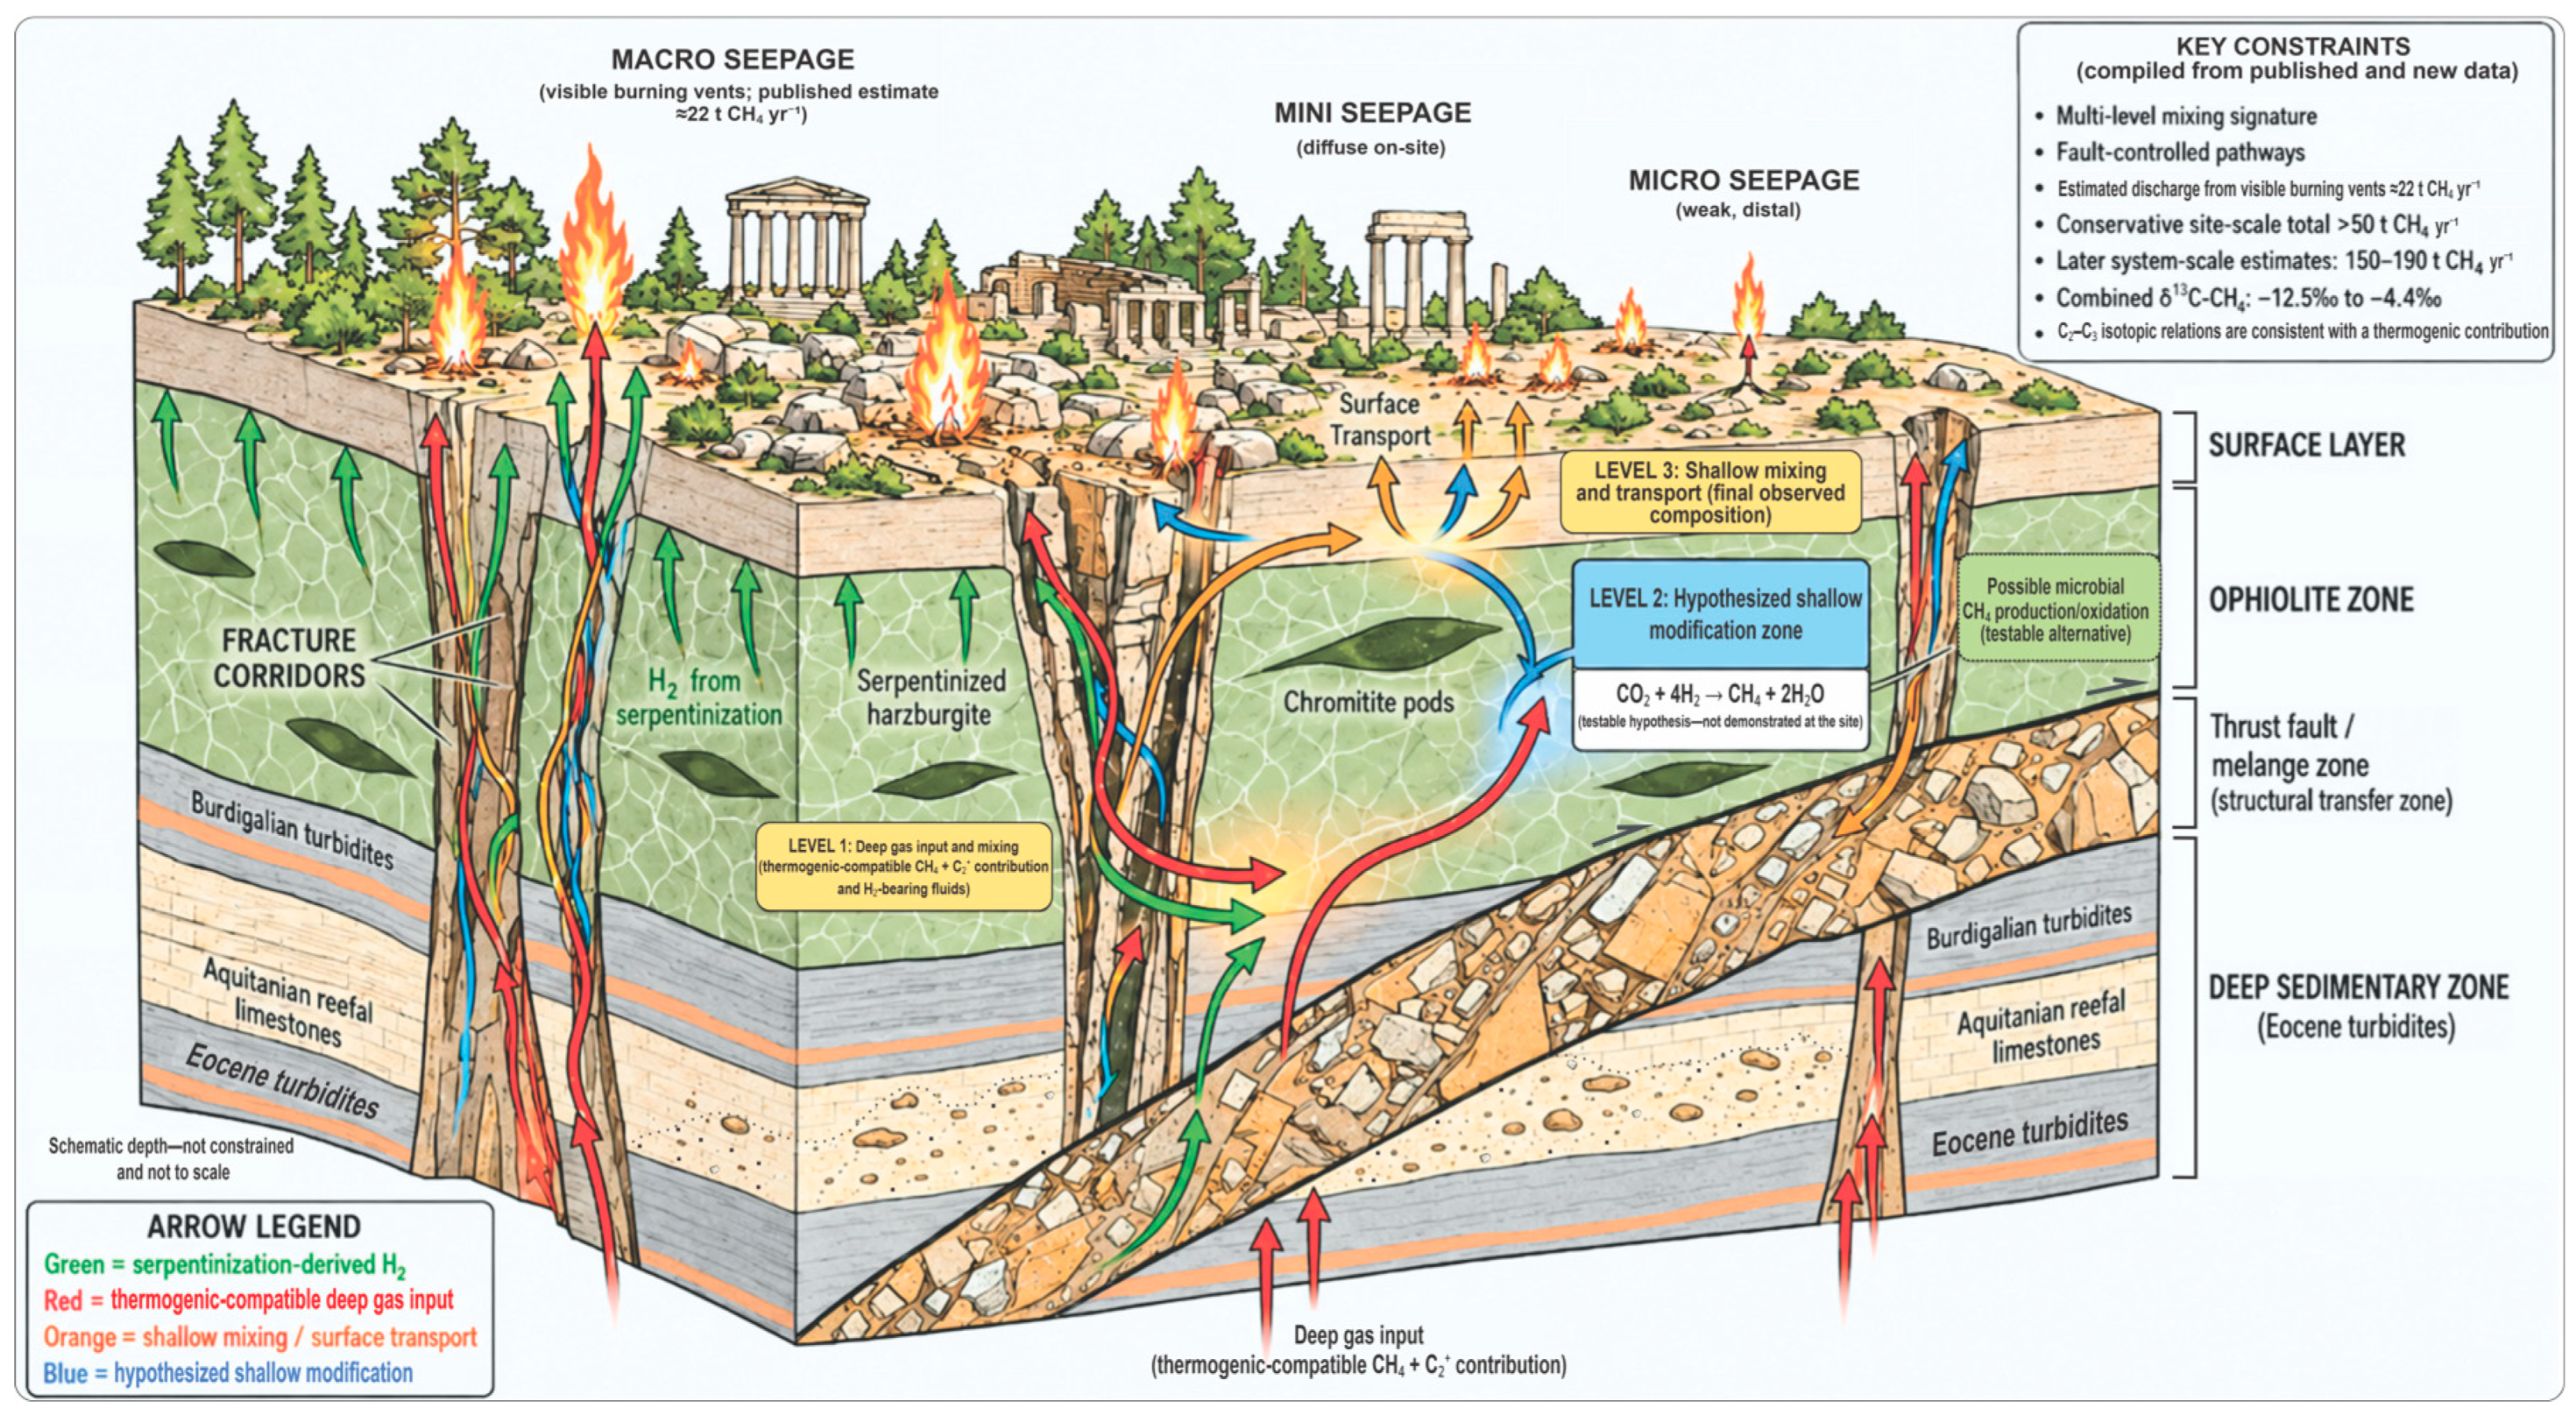
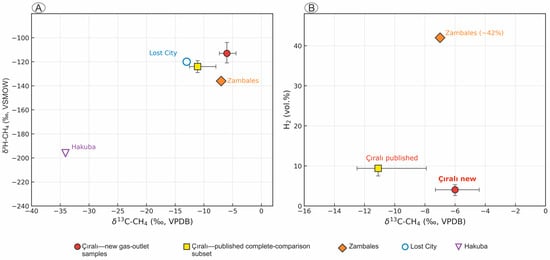
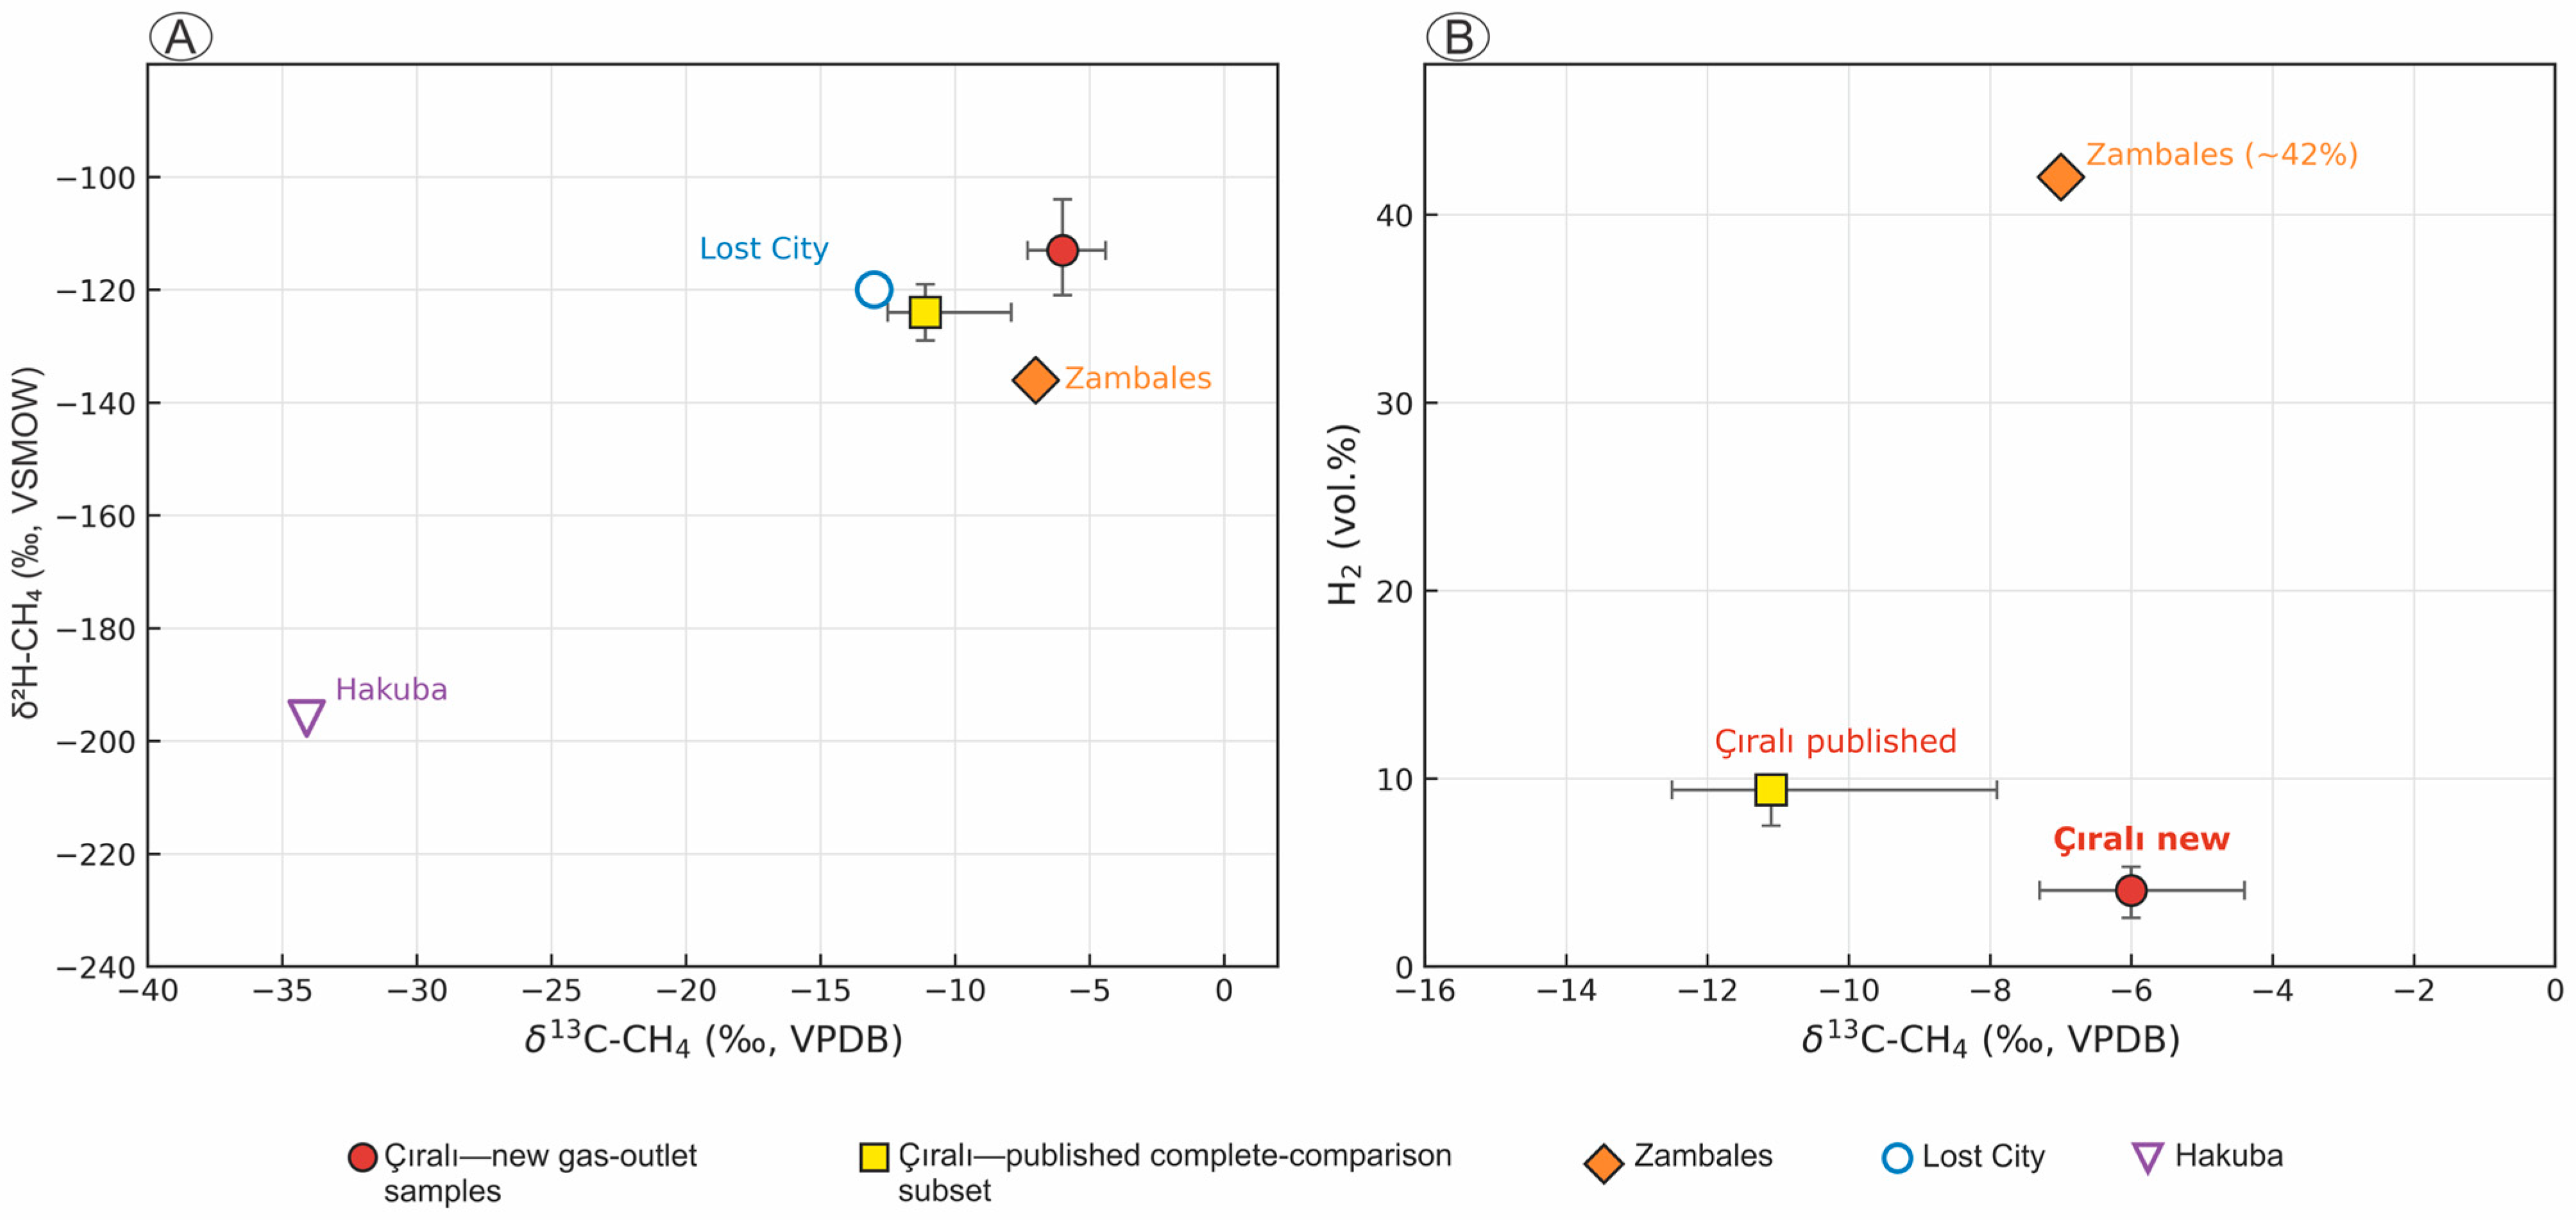

Disclaimer/Publisher’s Note: The statements, opinions and data contained in all publications are solely those of the individual author(s) and contributor(s) and not of MDPI and/or the editor(s). MDPI and/or the editor(s) disclaim responsibility for any injury to people or property resulting from any ideas, methods, instructions or products referred to in the content. |
© 2026 by the author. Licensee MDPI, Basel, Switzerland. This article is an open access article distributed under the terms and conditions of the Creative Commons Attribution (CC BY) license.