


Abstract
In this study, we explore the static and dynamic mechanical responses of layered cemented backfill subjected to blasting loads. Variable-rate uniaxial compression tests and Split Hopkinson Pressure Bar (SHPB) numerical simulations were performed on specimens with three different interlayer cement-to-tailings ratios. All samples were cured for 28 days before testing. The test results reveal that uniaxial compressive strength rises and then falls with increasing loading rates, and mixed tensile-shear failure dominates quasi-static loading conditions. The interlayer cement-to-tailings ratio dominates the bearing capacity of backfill. At the test loading rate of 0.02 mm/s, lowering the interlayer ratio from 1:4 to 1:8 sharply reduces peak strength from 5.595 MPa to 1.285 MPa, with a total drop of 77.0%. SHPB simulation results show obvious strain-rate hardening under dynamic impact. For samples with an interlayer ratio of 1:4, dynamic compressive strength increases from 5.38 MPa to 6.16 MPa as impact velocity rises from 4 m/s to 13 m/s, a 14.5% improvement caused by rapid compaction of internal micropores. Combining damage mechanics and energy conservation principles, we establish a dynamic damage constitutive model that couples inherent layered interfacial damage with blasting-induced dynamic disturbance. Model predictions match experimental measurements well. The peak strength error is only 1.3% at a loading rate of 0.005 mm/s, and peak deviations for all test cases are controlled within 5.0%. This work quantitatively clarifies the static and dynamic mechanical evolution of layered cemented backfill, and provides solid theoretical support for mixture proportion design and blasting stability assessment in high-stage sequential backfilling mining.
1. Introduction
Because of its high efficiency, environmental protection and safety, the high-stage subsequent filling mining method is widely used in underground mines in China and other countries [1,2]. Due to the influence of the size of the high-stage mine room and the limitation of the filling capacity, when filling the large size of the mine room, it is common to fill the empty zone several times with filling slurries with different cement-to-tailings ratios: i.e., the top and the bottom are filled with slurry with a high cement-to-tailings ratio (higher cement content), and the intermediate layer is filled with slurry with a relatively low cement-to-tailings ratio, which results in the layered characteristic of the cemented backfill. Figure 1 indicates the final layered cemented backfill structure with structural planes [3,4]. Compared with cemented backfill formed in a single pour, the presence of structural interfaces disrupts the integrity of the backfill, resulting in different mechanical properties for layered cemented backfill relative to intact backfill. Therefore, it is necessary to further study the mechanical properties of the layered cemented filling.
Figure 1.
Layered structure of cemented backfill.
With the wide application of the backfill mining method, cemented backfill as the key structure to support the mining zone has received wide attention. To investigate the factors influencing the strength of cemented backfill, previous studies have characterized the variation of backfill strength with factors including curing age [5], cement-to-tailings ratio [6], temperature [7], and hydrophobic agent addition [8] via laboratory tests at both macroscopic and microscopic scales. These studies have also optimized fill-mining methods and proposed the high-stage sequential backfilling mining method. Due to the large size of high-stage mining rooms, in order to balance filling strength and cost, more and more mines adopt multiple filling methods to fill the goaf, forming a “high-low-high” cemented backfill structure with cement-to-tailings ratio. Wu et al. [9], developed a numerical model that takes into account the hydration of cementitious materials, heat conduction, fluid flow, mechanical actions, and other relevant effects. The model was validated using on-site monitoring data from the mine, and the influence law of the filling retaining wall on the strength of the cemented backfill was revealed. Wang et al. [10] conducted triaxial cyclic loading–unloading tests on layered cemented backfill specimens with different backfilling times and found that backfilling times significantly affect the peak strength, peak strain, deformation modulus and failure characteristics of layered cemented backfill. Cui et al. [11], proposed a multi-physics model for Cemented Paste Backfill (CPB), which takes into account the thermo-hydro-mechanical-chemical (THMC) processes that affect the strength of CPB. The multi-physics model was validated using experimental data, and the changes and development of CPB strength were successfully evaluated and predicted.
Li et al. [12], by introducing CO2 during the process of stirring the filling slurry, caused the filling slurry to undergo carbonation and hydration reactions simultaneously, and studied the changes in the micropore structure and the mechanical properties of the cemented backfill under the action of carbonization. To explore the mechanical properties of this structure, some scholars have applied the method of studying complete cemented fillings to layered cemented fillings. Through laboratory experiments, they studied the effects of curing age, cement-to-tailings ratio, and temperature on the strength of layered cemented fillings. It was found that layered cemented fillings have a significant strength reduction effect [13,14,15,16,17]. To explore the reasons behind this phenomenon, scholars have analyzed the impact of changes in the structure of layered cemented fill on its strength. They have conducted mechanical tests on cemented fills under different conditions such as the number of fillings [18], the angle of the filling surface [19], the time interval between fillings [20] and the composition of filling materials [21]. Cheng et al. [22], through uniaxial compression experiments on Cemented Tailings Backfill with different cement-to-tailings ratios, proposed a constitutive model for Cemented Tailings Backfill. These studies have revealed that the pattern of strength changes in layered cemented fills. Blasting and seismic dynamic disturbances induce complex stress wave propagation and accelerate the initiation and propagation of internal microcracks in cemented backfill. Characterizing the nonlinear mechanical response of backfill under impact loading is therefore critical for optimizing its structural support performance in underground mines [23,24]. To accurately describe this dynamic deterioration process, recent studies widely adopt Split Hopkinson Pressure Bar (SHPB) tests to develop multidimensional dynamic damage constitutive models, which provide the key theoretical basis for revealing the damage evolution mechanism of backfill under impact loading [25,26,27]. Yin et al. [28] investigated the dynamic mechanical behavior of cemented backfill under impact loading based on Split Hopkinson Pressure Bar tests and developed a novel three stage dynamic damage constitutive model. This model successfully overcame the deviations of traditional theories in predicting the post-peak failure stage and accurately revealed the progressive damage evolution mechanism within the backfill.
In summary, while substantial progress has been made in backfill mechanics, existing studies and constitutive models primarily focus on the quasi-static mechanical properties of intact continuous backfill. The mechanical behavior of backfill under the combined influence of inherent layered interfaces formed by multiple fillings and dynamic working conditions like blast-induced loads remains insufficiently explored. Traditional constitutive models struggle to accurately capture the superimposed damage effects induced by these internal structural weaknesses and external dynamic disturbances, limiting their ability to reflect the complex stress state of the cemented backfill during high-stage subsequent filling.
Guided by the necessity to address this gap, this study formulates two core research hypotheses as the theoretical premise for model construction:
- The macroscopic failure of layered backfill under blasting disturbance is a coupled consequence of its initial structural weakness (layered interfaces) and the combined action of overlying rock mass load and horizontal dynamic stress waves.
- Based on the Lemaitre strain equivalence principle, the dynamic damage evolution of the layered structure can be accurately quantified by superimposing the initial interfacial damage and the load-induced damage, where the failure of cemented backfill microelements follows a three-parameter Weibull distribution.
Therefore, in this study, three types of layered cemented backfill specimens with varying interlayer cement-to-tailings ratios were prepared. Uniaxial compression and SHPB impact numerical simulations were conducted to reveal the dynamic load mechanical properties and the crack formation mechanism of the layered backfill. By applying damage mechanics and energy conservation principles, the dynamic disturbance force of blasting was introduced as a time-varying external load and coupled with the initial damage variable generated by the layered structural planes. Ultimately, a dynamic damage constitutive equation for layered cemented backfill was established to account for both internal structural defects and external blasting-load disturbances. Unlike previous static models, this equation reflects the strength deterioration law of layered backfill under actual blasting operations, providing a reliable theoretical basis for optimizing backfill design in high-stage subsequent filling mining.
2. Experimental Study on the Dynamic Load Mechanical Characteristics of Layered Cemented Backfill
2.1. Materials and Methods
Experimental instruments: JJ-5 cement mortar mixer (Wuxi Jianyi Instrument Co., Ltd., Wuxi, China), YH-40B automatic standard constant temperature and humidity curing box (Beijing Jingang Keyi Measurement and Control Equipment Co., Ltd., Beijing, China), electronic hydraulic pressure testing machine (Xiamen East Instrument Co., Ltd., Xiamen, China), bucket, 50 mm × 100 mm standard test mold, electronic scale, etc.
In order to study the relationship between the mechanical strength of the cemented backfill and the loading rate, considering the influence of the loading rate on the strength of the layered cemented backfill with different cement-to-tailings ratios in the middle layer, the uniaxial compressive strength laboratory test was carried out. The test uses a mine’s total tailings as aggregate and Portland cement as cementing material to make a layered cemented backfill. The cemented backfill is divided into three layers: upper, middle and lower. The height ratio of the three layers is 1:3:1. Among them, the cement-to-tailings ratio of the upper and lower layers is designed to be 1:4, the three cement-to-tailings ratios of the middle layer are designed to be 1:4, 1:6, and 1:8, and the slurry concentration is designed to be 70%.
After mixing the whole tailings, cement and water according to the ratio, the standard cemented backfill specimens with diameter Φs = 50 mm and height h = 100 mm were made by filling the plastic pipe. After filling 1/5 of the plastic pipe, it is maintained for 24 h. After pouring the first 1/5 of the specimen height into the plastic mold, the sample was cured for 24 h. The middle 3/5 portion was then poured and cured for another 24 h. Finally, the remaining top 1/5 was added, as illustrated in Figure 2. Fifteen groups of specimens were designed. The finished specimens were demoulded after 48 h, and then placed in a standard curing box with constant temperature (temperature 20 ± 1 °C) and constant humidity (humidity 95 ± 1%) for 28 days.
Figure 2.
Specimen preparation and testing.
2.2. Experimental Process and Results
Different mining blasting methods will have different effects on the stability of the cemented backfill. From the perspective of mechanics, this is mainly because different blasting methods have different strain rates on the surrounding rock. Therefore, studying the influence of loading rate on the mechanical properties of the cemented backfill has a certain theoretical guiding significance for the design of on-site blasting parameters.
In this paper, the influence of different loading rates on the strength of layered backfill under different cement-to-tailings ratios in the middle layer is mainly considered. In order to study the relationship between the mechanical strength of backfill and the loading rate, the uniaxial compressive strength laboratory experiment is carried out.
Five different loading rates (0.005, 0.01, 0.02, 0.04, and 0.08 mm/s) were applied to the 15 cured specimens to measure their uniaxial compressive strength. Then obtain the Uniaxial Compressive Strength (UCS) and Modulus of Elasticity of each group of specimens. The specimens are named according to the convention “A-B-C”, where “A” represents the denominator of the middle layer cement-to-tailings ratio (4, 6, or 8), “B” represents the loading rate converted to mm/min (0.3, 0.6, 1.2, 2.4, or 4.8), and “C” represents the curing age in days (28). The test results are shown in Table 1.
Table 1.
Mechanical parameters of layered cemented backfill specimens.
2.3. Discussion
2.3.1. Analysis of Uniaxial Compressive Strength of Layered Cemented Backfill
Figure 3 shows the relationship curves between uniaxial compressive strength and loading rate for cemented backfill with different cement-to-tailings ratios. It is found from Figure 3 that when the cement-to-tailings ratio of the middle layer is constant, the uniaxial compressive strength of the layered cemented backfill increases first and then decreases with the increase in the loading rate.
Figure 3.
Effect of loading rate on the uniaxial compressive strength of layered cemented backfill under different fitting functions. (a) Polynomial function fitting; (b) Exponential function fitting; (c) Power function fitting; (d) x Logarithmic function fitting.
Taking the specimen with a middle-layer cement-to-tailings ratio of 1:4 as an example, the compressive strengths at loading rates of 0.01, 0.02, 0.04, and 0.08 mm/s increased by 7.9%, 23.1%, 21.1%, and 8.1%, respectively, relative to the baseline strength at the lowest loading rate (0.005 mm/s). This relative variation clearly demonstrates the trend where the strength first rises to a peak at 0.02 mm/s and subsequently falls at higher rates. When the loading rate is constant, the compressive strength increases with the increase of cement-to-tailings ratio (higher cement content). Taking the loading rate of 0.02 mm/s as an example, when the cement-to-tailings ratio of the intermediate layer increases from 1:8 to 1:4, the corresponding compressive strength increases by 109.3% and 335.4%, respectively.
Keeping the cement-to-tailings ratio unchanged, the strength changes in layered cemented backfill with different loading rates were studied. Polynomial, exponential, power function and logarithmic fitting were performed on the UCS changes of different layered cemented backfills, and the fitted correlation coefficient (R2) was obtained as shown in Table 2. The results show that for cement-to-tailings ratios across the three middle-layer cement-to-tailings ratios (1:4, 1:6, and 1:8), the average R2 for the polynomial, exponential, power, and logarithmic fitting functions are 0.96, 0.82, 0.31, and 0.42, respectively. The exponential, power function and logarithmic fitting degree are all less than the polynomial fitting degree. The influence of loading rate on the strength of layered cemented backfill conforms to the variation law of polynomial function. The related expression of polynomial equation can be defined as
Table 2.
Uniaxial compressive strength fitting results of layered cemented backfill specimens.
In the formula A1, B1, C1 and D1 are the relevant fitting parameters of the loading rate and the strength of the layered cemented backfill.
The loading rate at the turning point of strength change is called the critical loading rate [29]. With the increase in loading rate, the strength of the layered cemented backfill increases first and then decreases. This trend arises because loading rates influence the evolution of the internal structure of layered cemented backfill. At loading rates below the critical value, loading rate constraints suppress the initiation of pores and microcracks in the early deformation stage, leading to a positive correlation between compressive strength and loading rate. When the critical loading rate is exceeded, the larger loading rate causes the expansion and extension of the original defects and the rapid dislocation separation of the layered structure, resulting in the overall failure of the layered cemented backfill, thus reducing the compressive strength [30,31,32,33,34]. Based on the polynomial fitting results presented in Table 2, the continuous relationship between the compressive strength and the loading rate is mathematically established. The theoretical peak strength is subsequently identified by determining the extreme value of the fitted polynomial function, which is achieved by setting its first derivative to zero. Following this mathematical procedure, the critical loading rate for the layered backfill specimens with a 70% concentration is calculated to be approximately 0.03 mm/s. Consequently, the compressive strength of the backfill specimen exhibits an ascending trend when the loading rate remains below 0.03 mm/s, whereas it demonstrates a progressive reduction at loading rates exceeding this critical threshold.
2.3.2. Analysis of Full Stress–Strain Curve of Layered Cemented Backfill
Through the above test results, the full stress–strain curves of backfill under different loading rates are summarized.
Figure 4 shows the complete stress–strain curves of layered cemented fill specimens with a middle layer cement-to-tailings ratio of 1:4 under five different loading rates. It can be seen from Figure 4 that the peak strains of specimens with different loading rates are almost the same. In addition, according to the development process of the stress–strain curve, it can be roughly divided into four stages:
Figure 4.
Full stress–strain curve of cemented backfill under different loading rates.
- Stage I (OA): Layer interface and pore closure stage. In this stage, under the action of load, the layer interfaces continue to close and internal cracks are continuously compacted, forming early nonlinear deformation. The stress–strain curve in this stage is concave downward;
- Stage II (AB): Elastic deformation stage. As the layer interfaces and pores are compacted, the specimen gradually exhibits elastic characteristics and the stress–strain curve rises almost linearly. If unloaded at this stage, the strain produced in this stage can be completely recovered.
- Stage III (BC): Yield stage. When the load exceeds the elastic limit of the specimen, the specimen begins to yield, changing from elastic deformation to plastic deformation, and the development of internal micro-cracks undergoes a qualitative change, continuously developing until the specimen fails. The stress–strain curve in this stage is convex upward.
- Stage IV (CD): Post-peak failure stage. When the load exceeds the ultimate bearing capacity of the specimen, the specimen undergoes instability failure, but due to the residual strength of the specimen, the stress–strain curve does not decrease rapidly, but slowly extends forward.
The stress–strain curves of the layered cemented backfill under different loading rates are generally the same, but there are also some differences. As shown in the AB section, the degree of linear inclination in the elastic deformation stage increases with the increase in the loading rate. The change law of slowing down is observed; that is, the elastic modulus increases first and then decreases, and the highest point of the crack propagation stage curve increases first and then decreases with the increase in the loading rate. That is, with the increase in the loading rate, the peak strength increases first and then decreases. The maximum peak strength of the layered cemented backfill appears at the critical loading rate.
2.3.3. Analysis of Failure Characteristics of Layered Cemented Backfill
The longitudinal wave velocities of each specimen before and after loading were measured and the results are shown in Table 3.
Table 3.
Longitudinal wave test values before and after cemented backfill loading.
According to Table 3, due to the differences in micro-cracks within the cemented backfill, the unevenness of the longitudinal wave velocity is caused. Before the experiment, the determined longitudinal wave velocity of the cemented backfill with a middle layer cement-to-tailings ratio of 1:4 was between 2.301 and 2.463 km/s, the cement-to-tailings ratio of 1:6 was between 1.96 and 1.742 km/s, and the cement-to-tailings ratio of 1:8 was between 1.689 and 1.592 km/s. With the change in loading rate, the attenuation of the longitudinal wave velocity fluctuates rather than following a strictly regular trend, which reflects the complex and random development of internal micro-cracks. However, it can be generally observed that when the sample is more thoroughly damaged at specific critical or higher displacement loading rates, a large number of unconnected small cracks are generated within the sample in addition to the main through-cracks. This intensive internal fracturing disrupts the wave propagation path and ultimately results in a larger attenuation value of the wave velocity.
In order to explore the macroscopic failure law of layered cemented backfill, the damaged specimens were photographed and the main crack distribution map was drawn. Figure 5 is the failure mode of the layered cemented backfill specimens with the cement-to-tailings ratio of 1:4, 1:6 and 1:8 under different loading rates at the curing age of 28 d. It can be seen from Figure 5a that when the cement-to-tailings ratio of the middle layer is 1:4 and the loading rate is 0.005 mm/s, the tensile-shear mixed failure occurs in the middle layer of the cemented backfill with low cement-to-tailings ratio. When the loading rate increases to 0.01 mm/s, the middle layer is broken and expanded seriously. When the loading rate continues to increase to 0.02 mm/s, a main crack from the middle layer through the layered structural plane at both ends is generated. When the loading rate continues to increase to 0.04 mm/s and 0.08 mm/s, the cracks at the sub-layers increase significantly and the shear failure is obvious.
Figure 5.
Damage diagram of cemented backfill under different loading rates: (a) Intermediate gray-to-sand ratio 1:4; (b) Intermediate gray-to-sand ratio 1:6; (c) Intermediate gray-to-sand ratio 1:8.
It can be seen from Figure 5b that when the cement-to-tailings ratio of the middle layer is 1:6 and the loading rate is 0.005 mm/s, the tensile-shear failure occurs. When the loading rate increases to 0.01 mm/s, the cracks in the middle layer increase and extend to the end. When the loading rate continues to increase to 0.02 mm/s, the damage change is not obvious. When the loading rate continues to increase to 0.04 mm/s and 0.08 mm/s, the crack damage intensifies, resulting in a conjugate shear failure that implements the layered structural plane.
From Figure 5c, it can be seen that when the cement-to-tailings ratio of the middle layer is 1:8, the loading rate is 0.005 mm/s and 0.01 mm/s, the tensile failure of the specimen occurs and the upper and lower layers are obviously carried out. When the loading rate is 0.02 mm/s, the conjugate shear failure occurs, and the separation and dislocation occur at the sub-layers. When the loading rate continues to increase to 0.04 mm/s and 0.08 mm/s, the middle layer is destroyed in a short period of time and there are large pieces of shedding.
This comprehensive analysis shows that the failure mode of the cemented backfill specimen is mainly characterized by the tensile-shear mixed failure of the middle layer and the conjugate shear failure through the sub-layer. When the loading rate is less than 0.02 mm/s, the failure of the specimen mainly occurs in the middle layer. When the loading rate increases to 0.02 mm/s and above, the crack propagation leads to the separation and dislocation of the layered structural plane, and further promotes the extension of the original defect to the end.
3. Dynamic Impact Numerical Simulation and Simulation Analysis of Layered Cemented Backfill Based on SHPB
3.1. Hopkinson Experimental Principle and Condition Assumption
Under the action of dynamic force, the bullet acts on the incident rod at a certain speed. Based on the one-dimensional stress wave theory, an elastic stress wave with a certain velocity v is formed in the rod and propagates forward along the rod. After a time t (t = L/v, where L is the length of the incident rod), the stress wave reaches the junction between the incident rod and the specimen. Due to the material difference between the specimen and the rod, some energy will be reflected back at the interface and some energy will be transmitted into the specimen. The transmitted wave reaches the junction between the specimen and the transmission rod and, similarly, energy reflection and transmission phenomena occur. After multiple reflections and transmissions of the stress wave in the specimen, the system, including the specimen and the rods, reaches a stress–strain equilibrium state. At this time, by processing and analyzing the stress wave data monitored during the experiment, the stress–strain relationship of the specimen can be obtained.
During the SHPB impact test, the stress wave propagated in the striker is assumed to be a one-dimensional elastic stress wave, that is, the stress wave remains consistent at the interface between the specimen and the striker throughout the entire experiment, and the specimen is only subjected to stress in the direction of the impact velocity. The stress in the SHPB system is assumed to be in a state of stress equilibrium after multiple reflections, and the stress at the specimen and the interface is consistent.
On the basis of these two assumptions, the two-wave and three-wave methods are widely adopted to calculate the stress, strain, and strain rate of specimens under impact loading. The governing equations for the three-wave method [27] are given by
The calculation formula of the second wave method is as follows:
In the formula c0 is the longitudinal wave velocity of the incident rod and the transmitted rod; εi, εr, and εt are the incident strain, reflected strain, and transmitted strain, respectively; l0 and A0 are the length and cross-sectional area of the specimen, respectively; A and E are the cross-sectional area and elastic modulus of the incident rod and the transmitted rod, respectively; and σ, ε, and are the internal stress, strain, and strain rate of the specimen, respectively.
3.2. Model Construction and Simulation Scheme
In this experiment, Ansys Workbench 2021 R1 (Ansys Inc., Canonsburg, PA, USA) was used to establish the model and export the K-file, which was then modified in LS-PrePost 4.8 (LSTC, Livermore, CA, USA), and solved by the standalone LS-DYNA R11.2.0 explicit solver (Ansys Inc., Canonsburg, PA, USA). To ensure the calculation accuracy of stress-wave propagation, 8-node solid elements were used for meshing. The SHPB model mainly includes four parts: bullet, incident bar, transmission bar, and layered cemented backfill specimen. The three-dimensional model established by ANSYS is shown in Figure 6 and Figure 7. As shown in the figures, the lengths of the bullet, incident bar, and transmission bar are 0.6 m, 3.0 m, and 2.5 m, respectively, and the radii are all 35.0 mm. The cemented backfill specimen is divided into three layers, with the top and bottom layers having a height of 5.0 mm and the middle layer having a height of 15.0 mm, and the radius of the specimen is 25.0 mm. Among them, the bullet, incident bar, and transmission bar adopt (*MAT_PLASTIC_KINEMATIC) material model, and the cemented backfill specimen adopts (*MAT_JOHNSON_HOLMQUIST_CONCRETE) material model. For the dynamic interaction, the contact algorithm (*CONTACT_AUTOMATIC_SURFACE_TO_SURFACE) was defined for the interfaces between the bars and the specimen. Finally, the impact loading was implemented by applying an initial velocity (*INITIAL_VELOCITY) to the bullet. Table 4, Table 5 and Table 6 present the primary parameters of the JHC material model for backfills with cement to tailings ratios of 1:4, 1:6, and 1:8 respectively. Relevant fundamental parameters including RO, G, FC, PC and T were directly determined through laboratory experiments. Based on these experimental results the remaining material parameters were subsequently derived via fitting calculations utilizing theoretical formulas [35,36,37].
Figure 6.
Model of bullet/incoming (transmissive) rod and specimen model.
Figure 7.
Experimental strain wave curves for numerical simulation of SHPB: (a) bullet velocity of 4 m/s; (b) bullet velocity of 7 m/s; (c) bullet velocity of 10 m/s; and (d) bullet velocity of 13 m/s.
Table 4.
JHC material parameters for the backfill with a cement to tailings ratio of 1:4.
Table 5.
JHC material parameters for backfill with a cement-to-tailings ratio of 1:6.
Table 6.
JHC material parameters for backfill with a cement-to-tailings ratio of 1:8.
Where MID represents the material identification, RO represents the mass density, G represents the shear modulus, A represents the normalized cohesive strength, B represents the normalized pressure hardening, C represents the strain rate coefficient, N represents the pressure hardening exponent, FC represents the quasi-static uniaxial compressive strength, T represents the maximum tensile hydrostatic pressure, EPS0 represents the reference strain rate, EFMIN represents the amount of plastic strain before fracture, SFMAX represents the normalized maximum strength, PC represents the crushing pressure, UC represents the crushing volumetric strain, PL represents the locking pressure, UL represents the locking volumetric strain, D1 and D2 represent the damage constants, K1, K2 and K3 represent the pressure constants, and FS represents the failure type.
To investigate the failure modes of three types of layered cemented backfill specimens with intermediate cement-to-tailings ratios of 1:4, 1:6, and 1:8 under four impact velocities, numerical simulations were performed using the measured backfill parameters, with tensile strength defined as the failure criterion. A total of 12 simulation cases were carried out, and the simulation scheme is shown in Table 7.
Table 7.
Simulation scheme design.
3.3. Stress and Strain Analysis of Cemented Backfill Under Impact Action
Based on the simulation results, organize the following data:
Figure 7 shows the SHPB strain wave curves of the stratified cemented backfill specimen under impact failure. It can be seen from the figure that with the increase in impact velocity, the peak values of strain waves corresponding to the incident wave and the transmitted wave become larger.
According to the obtained impact damage strain wave curve, the three-wave method is used for analysis, and the stress–strain curves of the layered cemented backfill with middle layer cement-to-tailings ratios of 1:4, 1:6, and 1:8 are shown in Figure 8.
Figure 8.
Stress–strain curves of layered cemented backfill under SHPB impact damage: (a) interlayer gray-to-sand ratio 1:4; (b) interlayer gray-to-sand ratio 1:6; and (c) interlayer gray-to-sand ratio 1:8.
According to the analysis in Figure 8, it can be seen that under dynamic impact loading, the stress–strain curve of the layered cemented fill is similar to that of quasi-static uniaxial stress loading; however, compared with quasi-static stress loading, under dynamic impact loading, the stress of the specimen reaches a position close to peak strength under extremely small strain conditions, and then slowly reaches peak with the increase in strain. After that, as the number of failed units increases, the strength of the fill decreases. Compared with quasi-static loading, under dynamic impact loading, the peak strength of the layered cemented fill is higher. This is because under high-speed impact, the internal micropores of the fill are rapidly compacted, increasing the compressive strength of the fill; at the same time, as the impact speed continues to increase, the compaction speed of the internal micropores of the fill also increases, and the strain required to reach peak stress becomes smaller and smaller.
Figure 8 shows the variation law of the strength of layered cemented fill with impact velocity. Under the condition of a certain cement-to-tailings ratio, as the impact velocity increases, the strength of the specimen increases. When the middle layer cement-to-tailings ratio is 1:4, the strength of the specimen is 5.38 MPa at an impact velocity of 4 m/s. When the impact velocity increases from 4 m/s to 7 m/s, the corresponding strength is 5.54 MPa, an increase of 2.9%. Continuing to increase the impact velocity to 10 m/s, the strength becomes 5.86 MPa, an increase of 8.9%. When the impact velocity increases to 13 m/s, the maximum strength is 6.16 MPa, which is 14.5% higher than that at an impact velocity of 4 m/s. Similarly, when the cement-to-tailings ratio are 1:6 and 1:8, the dynamic compressive strength of the layered cemented fill increases with the increase in impact velocity.
Linear, exponential, polynomial, and power function fits were performed on the dynamic compressive strength changes of different specimens, and the resulting fitting multiple correlation coefficients (R2) are shown in Figure 9. As can be seen from Figure 9, when the cement-to-tailings ratio are 1:4, 1:6 and 1:8, the fitting correlation coefficients of linear, exponential, polynomial and power functions are 0.9591, 0.9806, 0.9851 and 0.9315, respectively. The polynomial function has the largest fitting multiple correlation coefficient, and it is considered that the influence of impact velocity on the compressive strength behavior of layered cemented fill conforms to the law of quadratic polynomial function. The related expression of the quadratic polynomial equation can be defined as
Figure 9.
Peak strength versus impact velocity curves of layered cemented backfill under SHPB impact damage: (a) linear fit; (b) exponential fit; (c) polynomial fit; and (d) power function fit.
The cement-to-tailings ratios in the formula A2, B2, and C2 are the relevant fitting parameters representing the relationship between the impact velocity and the dynamic compressive strength of the layered cemented backfill. Within the tested velocity range, the dynamic compressive strength exhibits a continuous increasing trend due to the strain-rate hardening effect, and no critical impact velocity or peak threshold is observed.
3.4. Analysis of Failure Modes of Cemented Backfill Under Impact Action
Figure 10, Figure 11, Figure 12 and Figure 13 show the failure process of layered filling specimens with a middle layer cement-to-tailings ratio of 1:8 under different impact velocities.
Figure 10.
Equivalent stress cloud diagram of cemented backfill with a cement-to-tailings ratio of 1:8 (v = 4 m/s).
Figure 11.
Equivalent stress cloud diagram of cemented backfill with a cement-to-tailings ratio of 1:8 (v = 7 m/s).
Figure 12.
Equivalent stress cloud diagram of cemented backfill with a cement-to-tailings ratio of 1:8 (v = 10 m/s).
Figure 13.
Equivalent stress cloud diagram of cemented backfill with a cement-to-tailings ratio of 1:8 (v = 13 m/s).
According to the analysis of Figure 10, it can be seen that when the specimen is subjected to an impact velocity of 4 m/s, the destruction of the cemented filling starts from the middle layer, and at the same time, the phenomenon of the top and bottom layers being destroyed from the periphery to the center weakens. According to the analysis in Figure 11, it can be seen that as the impact velocity increases to 7 m/s, the phenomenon of specimen failure from the periphery to the center becomes more obvious, and the phenomenon of unit failure and ejection occurs. From the analysis in Figure 12 and Figure 13, it can be seen that after the initial failure of the cemented backfill specimen starts from the middle layer, at the same impact velocity, the bottom layer cemented backfill in contact with the transmission rod is not as damaged as the specimen with a middle layer cement-to-tailings ratio of 1:4. This is because the tensile strength of the middle layer cemented backfill differs greatly from that of the top and bottom layers. When the top and bottom layers have not reached their own failure criteria, the middle layer cemented backfill has already completely failed. In the LS-DYNA dynamic simulation, the system defaults to the specimen being completely damaged, so the situation shown in Figure 13 occurs. Similarly, due to different impact speeds, after the cemented backfill specimen fails and is damaged, the large block rate and large block volume vary. Different from the gray sand ratio of 1:6, the reduction in strength leads to a more obvious throwing phenomenon after the specimen is damaged.
Figure 14 shows the damage evolution curves of backfill under different cement-to-tailings ratios and impact velocities, revealing the damage evolution laws of the specimens under various conditions. As the strain increases the damage variable exhibits a distinct non-linear S-shaped evolution trend. Notably, under the same cement-to-tailings ratio, a higher impact velocity results in a steeper damage curve and a shorter span along the strain axis. This phenomenon indicates that under high-speed impact the backfill rapidly reaches its critical damage state at a smaller macroscopic strain. The underlying mechanism is that higher impact velocities inject massive kinetic energy in an extremely short period forcing internal microcracks to rapidly propagate and directly penetrate through the matrix rather than developing slowly along weak interfaces. Consequently, the material exhibits significantly enhanced dynamic brittleness and severe macroscopic fragmentation. The variation trend in the damage curves corroborates the phenomena observed in the stress cloud diagrams, revealing the dynamic brittleness mechanism of the backfill.
Figure 14.
Damage evolution curves of backfill under different cement-to-tailings ratios and impact velocities: (a) cement-to-tailings ratio 1:4; (b) cement-to-tailings ratio 1:6; and (c) cement-to-tailings ratio 1:8.
According to the simulation results, the failure of the layered cemented backfill mainly occurred through the compaction of micro-cracks, the penetration of the main crack through the fracture surface, and the phenomenon of specimen fragmentation and ejection. By analyzing the failure process of the specimen, it can be seen that the failure of the layered cemented backfill specimen is mainly tensile failure. Under the condition that the cement-to-tailings ratio of the middle layer filling body remains unchanged, as the impact velocity increases, the failure occurs earlier and more thoroughly. When the impact velocity is constant, the degree of specimen failure is affected by the cement-to-tailings ratio of the middle layer cemented backfill. As the cement-to-tailings ratio decreases, the degree of failure intensifies, which is similar to the failure mode under quasi-static uniaxial stress. Based on the stress wave theory, the compressive stress wave propagates through the specimen and reflects as a tensile stress wave upon reaching the free boundary. Because the dynamic tensile strength of the cemented backfill is much lower than its compressive strength, the reflected tensile stress wave easily exceeds the material tensile limit, leading to the dominance of tensile failure during dynamic impact. This tension-induced mechanism directly aligns with the failure sequence observed in the simulation cloud diagrams. For the specimen with a cement-to-tailings ratio of 1:8 shown in Figure 13, the weak layered interface acts as a structural plane with low bonding strength where obvious stress concentration occurs under the dynamic load. Consequently, microcracks preferentially initiate and coalesce near the intermediate layer. As the impact velocity increases, the extensive crack propagation along these horizontal bedding planes leads to severe block shedding and the prominent unit ejection phenomenon. The mismatch in mechanical properties between different layers prevents the main failure cracks from penetrating vertically through the top and bottom layers rapidly, which explains why the damage in the bottom layer in contact with the transmission bar remains less severe when the intermediate layer has already fully failed.
To further clarify the rationality of the numerical scheme in this work, we elaborate on the selection basis and existing limitations of the test matrix. This study adopts three interlayer cement-to-tailings ratios and four impact velocities, forming a total of twelve simulation cases, which are selected to match typical working conditions of high-stage subsequent backfilling mines. In field production, the interlayer cement-to-tailings ratio generally falls within the range of 1:4–1:8 to coordinate structural bearing capacity and filling cost. Meanwhile, the impact velocity range of 4–13 m/s can well reproduce the dynamic disturbance intensity induced by underground blasting in adjacent stopes, so the designed parameter combinations possess good field representativeness. Nevertheless, this relatively small test matrix inevitably has certain limitations. The current scheme fails to consider more complex field factors, such as different interlayer dip angles and variable interlayer thickness ratios. Subsequent research will expand the range of working conditions and incorporate these variables to explore the dynamic mechanical response and damage evolution of layered backfill, so as to further narrow the gap between theoretical models and actual complex mining environments.
4. Theoretical Analysis and Damage Constitutive Model of Layered Cemented Backfill
4.1. The Law of Action of Blasting Disturbance Force
During the blasting process, the rock medium is simultaneously subjected to the geostress field of the mining area itself and the disturbance of blasting. The explosive stress wave is incident on the rock medium in the horizontal direction, the stress acts on the longitudinal section of the rock medium, and a blasting disturbance force qm is generated at the particle point. Combining the mechanism of the blasting stress wave, the Formula (5) of the blasting disturbance force is obtained. According to the theory of rock mechanics, the magnitude of blasting disturbance force is affected by wave velocity, particle vibration velocity, and medium density. The wave velocity is also affected by the medium density. Therefore, this section mainly studies the influence of blasting seismic wave velocity and particle vibration velocity on the blasting disturbance force.
where ρ represents the density of the medium, v represents the vibration velocity of the blasting particle, and Cp represents the longitudinal wave velocity of the medium (blasting seismic wave velocity).
In an infinite elastic medium, the longitudinal waves of blasting seismic waves propagate forward or backward in the form of rarefaction and compression within the elastic medium, and their propagation velocity is a constant Cp [38]:
where Cp represents the longitudinal wave velocity, λ represents Lame constant; G represents the shear modulus, ρ represents the density of the medium, v represents the Poisson’s ratio of the medium, and E represents the elastic modulus of the medium.
In an infinite elastic medium, the shear wave of blasting seismic waves propagates forward or backward within the medium in the form of shear strain lateral displacement, and its propagation velocity is a constant Cs [39]:
where Cs represents the transverse wave velocity.
- particle vibration velocity
The relationship between the peak particle velocity of blasting and the equivalent of explosives and the distance from the blast center is usually represented by the Sadowski empirical formula [40]:
where vmax represents the peak particle velocity of blasting, Q represents the explosive charge weight, defined as the maximum single-segment explosive quantity during delayed blasting or the total explosive quantity during simultaneous blasting, R represents the distance from the explosion center to the particle, k represents the site-specific empirical coefficient, and α represents the attenuation exponent, both of which depend on the characteristics of the propagating media such as the rock mass and the cemented backfill.
- 2.
- The law of action of blasting disturbance force
The magnitude of the blasting disturbance force is mainly determined by the seismic wave velocity and the particle vibration velocity. As the propagation distance changes, the blasting disturbance force tends to zero at infinity. During the blasting disturbance process, the longitudinal wave of the seismic wave propagates faster than the transverse wave and has a greater impact on the particles. Therefore, the longitudinal wave velocity is selected for the study of the blasting disturbance force.
The blasting disturbance force mainly has a significant impact on the near blasting area and a smaller impact on the far blasting area. Therefore, this paper mainly explores the variation law of the blasting disturbance force in the near blasting area. Substitute Equations (6) and (8) into Equation (5) to obtain the blasting disturbance force calculation Equation (9).
Analysis shows that the blasting stress is affected by many factors, such as explosive equivalent, medium elastic modulus, Poisson’s ratio, medium density, particle position and distance from the blast source. To study the influence of explosive equivalent, medium elastic modulus, Poisson’s ratio, medium density, particle position, and distance from the blast source on the evolution law of blasting disturbance force, where k represents the site-specific empirical coefficient and α represents the attenuation exponent from Equation (8), taking the specific values of 75.6 and 1.11 respectively. By keeping other variables constant and changing only one variable at a time, the evolution characteristics of the blasting disturbance force are analyzed. The results are shown in Figure 15.
Figure 15.
The relationship between blasting disturbance force and medium mechanical parameters. (a) The relationship between blasting disturbance force and explosive equivalent. (b) The relationship between blasting disturbance force and horizontal distance. (c) The relationship between blasting disturbance force and elastic modulus. (d) The relationship between blasting disturbance force and density. (e) Curve of the relationship between blasting disturbance force and medium Poisson’s ratio.
Figure 15 shows the relationship curve between blasting disturbance force and the mechanical parameters of the propagation medium. The blasting disturbance force has an almost linear functional relationship with the explosive equivalent, elastic modulus, and density of the medium, and increases with the increase in the explosive equivalent, medium elastic modulus, and medium density. The blasting disturbance force decreases with the increase in the horizontal distance between the particle and the blast source. The blasting disturbance force has an almost exponential functional relationship with the Poisson’s ratio of the medium, and increases with the increase in the medium Poisson’s ratio.
4.2. Construction of Constitutive Equations
In actual filling, due to the insufficient filling capacity of the filling station and other reasons, continuous filling cannot be achieved, so multiple fillings are required and a layered structure of the cemented backfill is thus generated, as shown in Figure 16. In Figure 16, σ1 represents the load applied from above on the cemented backfill, σ2 represents the horizontal load applied by the surrounding ore and rock, h and b respectively represent the height and width of the cemented backfill. The damage caused by the cemented backfill mainly comes from the action of overlying load and body. The explosion stress wave acts on the cemented backfill, as shown in Figure 16a, causing stress concentration at the ends of the original pores and fractures inside it. The original stress field is unbalanced, the fractures expand, and when a certain limit is reached, the fractures will be through, thereby affecting its bearing capacity.
Figure 16.
Forces on the cemented filling under the action of blasting disturbing force. (a) Schematic diagram of blasting stress wave acting on cemented backfill; (b) Schematic diagram of stress superposition after blasting disturbance loading.
On the basis of existing research, according to the theory of damage mechanics and the law of conservation of energy, construct the damage evolution equation of stratified cemented backfill under the action of dynamic disturbance force. Assuming that the explosion stress wave is incident on the cemented backfill in the form of dynamic load in the horizontal direction, and the stress load is uniformly applied on the longitudinal section of the pillar, as shown in Figure 16b, the dynamic disturbance force of the explosion stress wave on the cemented backfill is obtained as qm.
Since the cross-sectional area of the backfill is uniform along its length, the stress state of the cemented backfill is simplified as a plane stress problem. By applying the dynamic disturbance force qm and adopting the semi-inverse method, the internal stress components of the backfill can be derived as follows [41]:
The definitions of damage in several commonly used micro or macro measurement forms in damage mechanics are as follows:
Expressed by the cross-sectional area of the rock mass:
Expressed in terms of elastic modulus:
Expressed in terms of rock mass wave velocity:
where A is the apparent area of the unit rock mass; AD is damage area; E and E* are the elastic moduli of lossless materials and lossy materials respectively; and Ci and C are the wave velocities of lossless materials and lossy materials respectively.
When the cemented backfill has a layered structural surface, the initial damage to the layered structural surface causes changes in the microstructure of the cemented backfill and deterioration in its mechanical properties. According to the definition of macroscopic damage measurement, the initial delamination damage Dn to the cemented backfill can be defined as
where E0 is the initial elastic modulus of the complete cemented backfill; n is layer number; and En is the elastic modulus of the cemented backfill with n layers.
Due to the presence of a large number of microcracks, micropores, and other defects in the cemented backfill, based on the Lemaitre strain equivalence principle [42] the constitutive relation of the cemented backfill damage can be obtained as
where Ds is the damage variable of the cemented backfill under load and E is the elastic modulus of the lossless material.
Assuming that the damage amount D to the cemented backfill is a function of axial strain, and the damage threshold is εe, then when the axial strain is less than εe the cemented backfill undergoes elastic deformation, and its damage amount D = 0. The failure of the cemented backfill microelement is random. In order to consider the influence of the cemented backfill damage threshold on its mechanical properties, the three-parameter Weibull [43,44,45] distribution is used to describe the damage evolution law of the cemented backfill.
When ε > εe, the damage to the cemented backfill begins to occur and the density function of the damage amount D is
where εc is axial strain and m and ε0 are the shape parameter and scale parameter of the three-parameter Weibull distribution, respectively.
The expression of damage amount D can be represented by the density function as
By combining Equations (16) and (17), we can obtain
For stratified cemented fill bodies, the damage caused by the layered structure is the initial damage. Under the action of external loads, micro-pores and micro-cracks in the fill body expand and produce damage. The damage under the coupling effect of both is the damage failure of the stratified fill body. Therefore, the internal damage constitutive relationship of the stratified fill body can be expressed as
From Equations (14) and (15), the stress–strain relationship of the cemented backfill expressed in terms of the initial layered damage variable and the loaded damage variable can be obtained as
According to Equation (20), the total damage variable coupled with layered loading of the cemented backfill can be obtained as
where D is the coupling damage variable of layered load for cemented backfill.
When the cemented backfill reaches the yield state, irreversible deformation occurs, and at this point, damage begins to occur and gradually accumulates. The corresponding strength criterion can be introduced to determine the damage threshold of the cemented backfill. Assuming that the strength characteristics of the cemented backfill obey the Mohr–Coulomb strength criterion, that is
where φ is internal friction angle of cemented backfill and c is the cohesion of the cemented backfill.
From Equations (19) and (22), the basic relationship of the damage constitutive model for layered filling bodies under general triaxial conditions can be obtained as
where μn is the Poisson’s ratio of the cemented backfill with n layers.
Since the external load is the resultant force of the upper rock mass load and the horizontal dynamic load, substituting Equation (22) into it, we therefore obtain the following:
where σx1, σy1 represent the vertical and horizontal components, respectively, of the dynamic load disturbance force on the cemented backfill, and σx2 and σy2 represent the vertical and horizontal components, respectively, of the upper rock mass load on the cemented backfill.
During the deformation and failure process of the cemented backfill, its stress–strain relationship curve satisfies the following geometric conditions at the peak point:
- σ1 = σx1 + σx2, when εc = εf, σ1 = σf;
- When εc = εf,
Take the partial derivative of Equation (27) to obtain Equation (29).
Substituting Condition 1 yields
Substituting condition 2 yields
Combining Equations (30) and (31) yields
Equations (32) and (33) are the constitutive equation parameters of the cemented backfill damage, which together with Equation (22) constitute the complete layered cemented backfill damage evolution equation.
To fully address the engineering significance of the statistical damage model, the physical interpretation of all core constitutive parameters is detailed here. The initial damage variable Dn quantifies the inherent structural weakness caused by cold joints formed during multiple pouring stages in actual mine backfilling. The damage threshold εe represents the elastic deformation limit of the backfill, beyond which overlying rock pressure and blasting stress waves trigger the propagation of internal microcracks. The shape parameter m reflects the homogeneity of the internal microelement strength distribution within the cemented backfill. A higher value of m indicates a more uniform material structure with fewer initial macroscopic defects, which typically manifests as higher brittleness at the macroscopic level. The scale parameter ε0 represents the macroscopic reference strength of the material and reflects the energy absorption capacity before failure. Furthermore, the cohesion c denotes the chemical bonding strength provided by cement hydration products, while the internal friction angle φ represents the mechanical interlocking and friction resistance among tailings particles. Through the analysis of the damage evolution process, the damage constitutive equation of layered cemented fill under the coupled action of blasting disturbance force and upper rock mass load can be obtained as
The parameter identification method relies on the geometric characteristics of the experimental stress–strain curves and standard rock mechanics tests. The initial damage variable Dn is determined by the ratio of the elastic modulus of the layered backfill to that of the intact backfill. The damage threshold εe corresponds to the yield point on the initial loading curve. The cohesion c and internal friction angle φ can be derived from conventional triaxial compression tests. Finally, by applying the boundary conditions at the peak point, where the derivative of stress with respect to strain equals zero at the peak strain, the parameters m and ε0 can be theoretically determined through the derived mathematical relations. This method ensures that the mathematical model accurately captures the actual mechanical response measured in the laboratory experiments.
Notably, the analytical relationship between blasting disturbance force and mechanical parameters derived in this study remains a theoretical formulation based on controlled laboratory impact tests. Actual underground blasting environments are highly complex, involving the superposition of multiple stress waves under in situ stress conditions and the influence of geological discontinuities. Accordingly, conducting systematic field monitoring to validate and further refine this theoretical constitutive model under complex in situ conditions will be the primary focus of our future work.
4.3. Verification of Constitutive Equations
To validate the proposed damage constitutive model incorporating the blasting disturbance term, this study adopts the widely recognized equivalent static load principle in rock mechanics [46]. Given the extreme complexity of transient blasting strain rates, a preliminary validation is conducted by utilizing quasi-static uniaxial compression test data, where the applied pressure is treated as an equivalent dynamic disturbance force. This fundamental assumption effectively isolates the baseline damage evolution characteristics of the layered cemented backfill, allowing for the verification of the model’s mathematical reliability under controlled stress conditions. While this equivalent quasi-static approach does not fully capture the time-dependent strain-rate effects of actual explosive loads, it provides a necessary mathematical foundation. The explicit dynamic responses under realistic blasting conditions will be deeply investigated in future numerical simulations using advanced software such as LS-DYNA. Assuming that the pressure is the dynamic disturbance force and the vertical pressure under different loading rates, taking the middle layer cement-to-tailings ratio of 1:8 as an example, substitute into the theoretical curve of the damage constitutive equation of different layered fill bodies in Formula (34), and compare and analyze with the corresponding indoor test curve. The results are shown in Figure 17.
Figure 17.
Stress–strain theoretical curves versus experimental curves: (a) loading rate 0.005 mm/s; (b) loading rate 0.01 mm/s; (c) loading rate 0.02 mm/s; (d) loading rate 0.04 mm/s; and (e) loading rate mm/s.
From the analysis in Figure 17a, it can be seen that when the loading rate is 0.005 mm/s, the theoretical curve and the experimental curve have a good coincidence in the pre-peak and peak stages, with differences of 5.2% and 1.3%, respectively. The post-peak curves match poorly, with a difference of 15.3%, but the basic trend of the curves is consistent. The reason is that the model is established based on the Lemaitre strain equivalence assumption, which posits that the essence of damage is the formation of voids in the material and these voids cannot withstand force, thus ignoring the residual strength of the material. Analyzing Figure 17b–d, the peak values of the curves basically coincide, with differences not exceeding 1%. The post-peak curves differ slightly, with differences around 10%. However, there is a larger deviation in the degree of fit before the peak. Under three different loading rates, the differences between theory and experiment are 42.7%, 28.9%, and 19.7%, respectively, but the trend in the curves remains consistent. For Figure 17e, the theoretical curve and the measured curve have a high degree of overlap, with an overall difference not exceeding 5%. In general, the theoretical curve in the damage constitutive equation for layered cemented fill under dynamic loading conditions constructed in this paper highly coincides with the curve obtained from experiments at the peak, and there are differences in the pre- and post-peak stages. Therefore, this equation can be used to predict the peak strength of the fill and optimize the corresponding blasting and filling schemes based on this conclusion.
To quantitatively evaluate the reliability of the numerical simulation, the numerical data were compared with the theoretical predictions derived from the dynamic damage constitutive model. Taking the condition with a cement-to-tailings ratio of 1:8 as an example, five strain points at 0.5%, 1.0%, 1.5%, 2.0%, and 2.5% were extracted from the stress–strain curves. The Stress–Strain Mean Absolute Error (MAE) and the Correlation Coefficient (R2) were calculated. As shown in Table 8, the average Mean Absolute Error is 0.0864 MPa, and the average Correlation Coefficient is 0.9624. These metrics indicate a low deviation and a strong positive correlation between the simulated and theoretical stress values, verifying that the numerical method captures the dynamic mechanical response of the layered cemented backfill. To evaluate the applicability of the proposed formulation, it is compared with the widely used RHT dynamic damage constitutive model. The RHT model demonstrates good prediction accuracy for the peak strength of homogeneous rock masses under dynamic loading. However, when applied to low-strength layered cemented backfill its prediction in the post-peak softening stage often deviates because it assumes a continuous medium and does not account for macroscopic weak structural planes. In contrast the proposed model explicitly couples the initial interfacial damage with the dynamic disturbance. This approach provides an accurate prediction of the pre peak compaction stage and peak strength for layered backfill and simplifies the parameter calibration process. Although the post-peak residual strength prediction of the proposed model requires further refinement, its overall accuracy and computational efficiency make it applicable to evaluating the dynamic stability of layered backfill in mining engineering.
Table 8.
Quantitative comparison between numerical simulation and theoretical model.
4.4. Sensitivity Analysis of the Constitutive Model
Sensitivity analysis represents a systematic approach to evaluating how variations in model parameters influence the corresponding output variables [47]. In the present study, this method is implemented to quantitatively assess the specific regulatory effects of different constitutive parameters on the dynamic stress–strain response of the layered backfill. The experimental condition with an interlayer cement-to-tailings ratio of 1:6 and an impact velocity of 7 m/s is selected as the baseline for sensitivity analysis. For this baseline condition, the core parameters are calculated as elastic modulus E equals 2134.95 MPa, initial damage D0 equals 0.20, Weibull shape parameter m equals 1.09, and Weibull scale parameter ε0 equals 0.00591. An equal percentage perturbation method is employed to eliminate the influence of dimensional differences among parameters. Each parameter is independently varied by negative 50 percent, negative 25 percent, positive 25 percent, and positive 50 percent from its baseline value. The resulting theoretical stress–strain curve families are illustrated in Figure 18.
Figure 18.
Parameter sensitivity analysis of the theoretical constitutive model: (a) elastic modulus E; (b) initial damage D0; (c) Weibull shape parameter m; and (d) Weibull scale parameter ε0.
As shown in Figure 18 the influence of four key parameters on the theoretical stress–strain curves of layered backfill is obtained through the equal percentage perturbation method. Figure 18a indicates that as the elastic modulus E increases the initial slope of the curve, becomes steeper, and the peak stress increases proportionally, while the corresponding peak strain remains unchanged. This shows that the elastic modulus mainly affects the deformation characteristics of the backfill in the elastic stage. Figure 18b shows that an increase in the initial damage variable D0 leads to a uniform reduction in both the initial slope and the peak stress. This is because the initial damage directly reduces the bearing capacity of the backfill. Figure 18c demonstrates that as the Weibull shape parameter m increases the peak stress of the curve gradually rises but the stress drops faster in the post-peak stage exhibiting a lower residual stress. Specifically, when m equals 0.545 the stress–strain curve does not exhibit a distinct peak within the current strain range, indicating that the backfill does not show obvious strain-softening behavior under this condition. Figure 18d demonstrates that as the Weibull scale parameter ε0 increases both the peak stress and peak strain increase substantially, extending the entire curve toward the upper right. This parameter primarily controls the deformation magnitude of the backfill before reaching peak strength.
Based on the calculation results of the equal percentage perturbation method, the sensitivity of these four parameters can be ranked. For peak stress, the sensitivity ranking is Weibull scale parameter ε0 > elastic modulus E > initial damage variable D0 > Weibull shape parameter m. Concerning peak strain, the model is only sensitive to the Weibull scale parameter ε0 and the shape parameter m. In conclusion, the overall sensitivity ranking of the constitutive model is ε0 > E > m > D0.
5. Conclusions
This paper conducts uniaxial compression experiments and SHPB numerical simulation experiments on layered cemented fill under different loading rates. Based on the theory of continuous damage and the principle of energy conservation, the damage constitutive equation of layered cemented fill under the action of blasting disturbance force is constructed, and the following conclusions are obtained:
- Layered cemented backfill experiences combined compaction of internal defects and structural interfaces during the initial loading stage, and exhibits a critical loading rate of approximately 0.03 mm/s, at which the peak compressive strength transitions from increasing to decreasing with rising loading rates. The interlayer cement-to-tailings ratio dominates the bearing capacity leading to a remarkable 77.0% drop in peak strength when the ratio decreases (i.e., lower cement content) from 1:4 to 1:8.
- Under dynamic impact the layered cemented backfill demonstrates a significant strain-rate hardening effect, with dynamic peak stress increasing alongside impact velocity following a polynomial function. Driven by rapid micropore compaction, higher impact velocities enhance dynamic compressive strength by up to 14.5% over baseline values, significantly exceeding quasi-static peak strengths.
- The failure mode of the backfill transitions from mixed tensile shear failure under quasi-static loading to tensile-failure-dominated mechanisms under dynamic impact. High impact velocities promote rapid crack penetration through the matrix, enhancing dynamic brittleness, while a lower interlayer cement-to-tailings ratio exacerbates stress concentration at weak structural planes, triggering severe penetrating failure and block ejection.
- By integrating damage mechanics and energy conservation principles, a dynamic damage constitutive model for layered cemented backfill was developed, which couples dynamic disturbance forces with initial structural damage. The high reliability of the model is validated by an average correlation coefficient of 0.9624 against experimental data, with peak strength prediction errors strictly controlled within 5.0% across all tested conditions.
- Parameter sensitivity analysis reveals that the regulatory sensitivity of core parameters on mechanical response ranks as Weibull scale parameter followed by elastic modulus Weibull shape parameter and initial damage variable. The scale parameter and elastic modulus dominate the peak strength and elastic deformation characteristics, respectively, providing robust theoretical support for mixture optimization and stability assessment in high-stage sequential backfilling.
Author Contributions
Conceptualization, Y.T., Z.Z. and F.Z.; methodology, Y.T., Z.Z. and F.Z.; software, Z.Z., F.Z. and Z.X.; validation, Z.Z., F.Z. and Z.X.; formal analysis, Z.Z., F.Z. and Z.X.; investigation, Z.Z., F.Z. and Z.X.; resources, Y.T. and W.S.; data curation, Z.Z. and F.Z.; writing—original draft preparation, Z.Z. and F.Z.; writing—review and editing, Y.T. and Z.X.; visualization, Z.Z., F.Z. and Z.X.; supervision, Y.T. and W.S.; project administration, Y.T. and W.S.; funding acquisition, Y.T. and W.S. All authors have read and agreed to the published version of the manuscript.
Funding
This research was funded by the National Natural Science Foundation of China, grant number 52274110, and National Key Research and Development Program of China, grant number 2022YFC2905003, and the Growth Program for Young Teachers at Beijing University of Science and Technology, grant number QNXM20220004, and the National Natural Science Foundation of China, grant number 52004019, and the China Scholarship Council, grant number 202206465005.
Data Availability Statement
The raw data supporting the conclusions of this article will be made available by the authors on request.
Acknowledgments
The experimental works described in this study were conducted at the Key Laboratory of High-Efficient Mining and Safety of Metal Mines of the Ministry of Education in the University of Science and Technology Beijing. The authors gratefully acknowledge the staff and students at the laboratory for technical help during testing.
Conflicts of Interest
Fenghao Zhu and Zhaohui Xiong were employed by the companies Sinomine Resource Group Co., Ltd. and Shanghai Donghe Trading Co., Ltd., respectively. The remaining authors declare that the research was conducted in the absence of any commercial or financial relationships that could be construed as a potential conflict of interest.
References
- Yu, X.; Tan, Y.; Song, W.; Wang, J. Strength and failure mechanism of the rock-encased by backfills structure. J. China Univ. Min. Technol. 2023, 52, 30–42. [Google Scholar]
- Jie, W. Research and Application of Damage and Failure Evolution Mechanism and Strength Model of Layered Cemented Tailings Backfill. Ph.D. Thesis, University of Science and Technology Beijing, Beijing, China, 2021. [Google Scholar]
- Cheng, A.; Dong, F.; Zhang, Y.; Wang, P.; Dai, S. Crack propagation and convergence mode of cemented backfill under uniaxial compression. J. China Univ. Min. Technol. 2021, 50, 50–59. [Google Scholar]
- Xiong, Z.; Tan, Y.; Chu, L.; Song, W. Study on Strength and Structure Optimization of High-stage Subsequent Layered Cemented Backfill. Metal. Mine 2022, 3, 35–42. [Google Scholar]
- Li, S. Strength and Acoustic Characteristics of Layered Cemented Tailing Backfill. Master’s Thesis, Jiangxi University of Science and Technology, Ganzhou, China, 2021. [Google Scholar]
- Tang, Y.; Fu, J.; Song, W.; Zhang, Y. Mechanical properties and crack evolution of interbedded cemented tailings backfill. Chin. J. Eng. 2020, 42, 1286–1298. [Google Scholar]
- Fang, K.; Zhang, J.; Cui, L.; Ding, L.; Xu, X.; Timms, W. Mathematical modelling and simulation for hydrating backfill body under cemented paste backfill/rock interface loading. Int. J. Min. Reclam. Environ. 2022, 37, 87–109. [Google Scholar] [CrossRef] [Scilit]
- Yan, B.; Ren, F.; Cai, M.; Qiao, C. Influence of new hydrophobic agent on the mechanical properties of modified cemented paste backfill. J. Mater. Res. Technol. 2019, 8, 5716–5727. [Google Scholar] [CrossRef] [Scilit]
- Wu, D.; Hou, W.; Liu, S.; Liu, H. Mechanical Response of Barricade to Coupled THMC Behavior of Cemented Paste Backfill. Int. J. Concr. Struct. Mater. 2020, 14, 288–301. [Google Scholar] [CrossRef] [Scilit]
- Wang, J.; Song, W.; Cao, S.; Tan, Y. Mechanical properties and failure modes of stratified backfill under triaxial cyclic loading and unloading. Int. J. Min. Sci. Technol. 2019, 29, 809–814. [Google Scholar] [CrossRef] [Scilit]
- Cui, L.; Fall, M. Multiphysics Modeling and Simulation of Strength Development and Distribution in Cemented Tailings Backfill Structures. Int. J. Concr. Struct. Mater. 2018, 12, 25. [Google Scholar] [CrossRef] [Scilit]
- Li, Y.; Fu, J.; Jing, P.; Wang, J.; Wang, K. Experimental study on the macroscopic and microscopic properties of cement paste backfill after treatment with carbon dioxide carbonize filling slurries during the mixing process. J. Mater. Res. Technol. 2024, 33, 1654–1666. [Google Scholar] [CrossRef] [Scilit]
- Wang, R.; Jin, A.; Wu, Z.; Gao, Y.; Zhang, J. Analysis of the Stability of the Cemented Backfill with Unilateral Exposureand Posterior Compression. Metal. Mine 2018, 8, 23–28. [Google Scholar]
- Gan, D.; Han, L.; Liu, Z.; Zhao, H. Experimental Study of the Effect of Loading Rate on Strength Performance of Filling body. Metal. Mine 2016, 12, 150–153. [Google Scholar]
- Gan, D.; Han, L.; Liu, Z.; Zhao, H.; Zhang, X. Study on strength characteristics and fracture mechanism of filling body under different stress rates. China Min. Mag. 2017, 26, 123–126+141. [Google Scholar]
- Yang, Q. Research on the Mechanical Characteristics of Backfill under Different Loading Rates. Min. Technol. 2019, 19, 35–36+46. [Google Scholar] [CrossRef] [Scilit]
- Hou, Y.; Yin, S.; Cao, Y.; Dai, C. Research on Damage and Energy Dissipation Characteristicsof Cemented Backfill under Different Loading Rates. J. Hunan Univ. Nat. Sci. 2020, 47, 108–117. [Google Scholar]
- Zhu, P.; Song, W.; Xu, L.; Wang, J.; Wan, F. A study on mechanical properties of cemented backfills under impact compressive loading. J. Vib. Shock 2018, 37, 131–137. [Google Scholar] [CrossRef] [Scilit]
- Han, L.; Liu, J. Experimental study on mechanical properties of cemented backfill under dynamic loading. Eng. Blasting 2021, 27, 35–41. [Google Scholar]
- Huang, S. Investigation of Mechanical Properties and Influencing Factors of Layered Tailings Cemented Backfill. Master’s Thesis, Qingdao University of Science and Technology, Qingdao, China, 2023. [Google Scholar]
- Yu, K.; Ma, L.; Huo, B.; Ngo, I.; Wu, Y.; Zhai, J. Study on the fluidity and mechanical properties of multi-source coal-based solid waste (MCSW) filling material. J. Mater. Res. Technol. 2024, 28, 2924–2934. [Google Scholar] [CrossRef] [Scilit]
- Cheng, A.; Zhou, C.; Huang, S.; Zhang, Y.; Pei, M. Study on the nonlinear deformation characteristics and constitutive model of cemented tailings backfill considering compaction hardening and strain softening. J. Mater. Res. Technol. 2022, 19, 4627–4644. [Google Scholar] [CrossRef] [Scilit]
- Li, G.; Deng, G.; Ma, J. Numerical modelling of the response of cemented paste backfill under the blasting of an adjacent ore stope. Constr. Build. Mater. 2022, 343, 128051. [Google Scholar] [CrossRef] [Scilit]
- Zhang, H.; Zhang, H.; Chen, S.; Li, Z.; Qin, X.; Guo, S.; Meng, X. Dynamic mechanical behavior and damage constitutive model of sandstone with various fracture inclinations under impact loading after different freeze–thaw cycles. Theor. Appl. Fract. Mech. 2026, 141, 105318. [Google Scholar] [CrossRef] [Scilit]
- Zhang, B.; Ping, Q. Experimental Study on Dynamic Mechanical Response Characteristics and Damage Mechanisms of Deep Sandstone Under THM Coupling. Rock Mech. Rock Eng. 2026. Prepublish. [Google Scholar] [CrossRef] [Scilit]
- Wu, W.; Gu, Y.; Xu, X. Study on energy evolution and dynamic damage constitutive model of rocks under medium to high strain rates. Mech. Mater. 2026, 219, 105710. [Google Scholar] [CrossRef] [Scilit]
- Dong, Q.; Jia, L.; Liang, B.; Yin, W. Prediction of acidity potential with sulfur containing lead–zinc tailings and damage constitutive model of cemented paste backfill. Environ. Geochem. Health 2025, 47, 343. [Google Scholar] [CrossRef] [Scilit] [PubMed]
- Yin, S.; Zeng, J.; Yan, Z.; Wang, L.; Chen, W.; Chen, D.; Yang, J. Damage constitutive models and damage evolution of cemented tailings and waste-rock backfill under impact loading. Constr. Build. Mater. 2025, 460, 139838. [Google Scholar] [CrossRef] [Scilit]
- Jiang, L.; Su, Y.; Dai, Q. Dynamic response mechanisms of layered cemented backfill pillars under horizontal stress wave disturbance of far-field blasting. Chin. J. Rock. Mech. Eng. 2020, 39, 34–44. [Google Scholar]
- Zhou, T.; Wang, Y.; Yu, Z.; Liang, Z. Effect of Loading Rate on Strength Characteristics of Layered Backfill. Sci. Technol. Eng. 2021, 21, 14535–14541. [Google Scholar]
- Wang, Y.; Zhou, T.; Yu, Z.; Huang, S. Study on the Mechanical Properties of Layered Cemented Backfill Under Different Curing Ages. Min. Res. Dev. 2021, 41, 52–55. [Google Scholar]
- Zhou, T. Experimental Study on Mechanical Properties of Cemented Backfill Considering Layered Characteristics Under the Influence Multiple Factors. Master’s Thesis, Qingdao University of Science and Technology, Qingdao, China, 2023. [Google Scholar]
- Cheng, A.; Dong, F.; Dai, S.; Shu, P.; Fu, Z. Experimental Study on Delamination Characteristics of Full Tailings Cemented Backfill. Metal. Mine 2020, 8, 13–19. [Google Scholar] [CrossRef] [Scilit]
- Cao, S.; Song, W.; Xue, G.; Ma, R.; Zhu, P. Mechanical characteristics variation of stratified cemented tailing backfilling and its failure modes. J. China Univ. Min. Technol. 2016, 45, 717–722+728. [Google Scholar]
- Guan, Z.; Li, Y.; Lai, Z.; Zhou, H.; Qin, J.; Wen, Y.; Chen, Y.; Huang, R. Size effect of concrete based on split Hopkinson pressure bar (SHPB) test. Constr. Build. Mater. 2024, 441, 137499. [Google Scholar] [CrossRef] [Scilit]
- Wei, S.; Li, J.; Wang, M.; Yu, C. Parameter Determination and Numerical Simulation of the Sandstone HJC Constitutive Model. ACS Omega 2025, 10, 18744–18752. [Google Scholar] [CrossRef] [Scilit] [PubMed]
- Zhang, Y.; Zheng, Y.; Li, Z.; Zhang, Y.; Liu, C.; Yan, W.; Song, G.; Sun, S.; Liu, H. Damage characteristics of mudstone in loosening blasting: An HJC model-based study. Sci. Rep. 2026. preprint. [Google Scholar] [CrossRef] [Scilit] [PubMed]
- Song, L.; Hu, S. Two-wave and three-wave method in SHPB data processing. Explos. Shock Waves 2005, 04, 368–373. [Google Scholar]
- Xie, J. The Analysis of Blasting Seismic Effect Factors Based on Ansys/ls-dyna Numerical Simulation. Master’s Thesis, Chang’an University, Xi’an, China, 2014. [Google Scholar]
- Jiang, L.; Su, Y. Theoretical model and application of critical blasting vibration velocity for instability of cemented backfill pillar. Chin. J. Nonferr. Met. 2019, 29, 2663–2670. [Google Scholar]
- Meng, F.; Yuen Wong, L.N.; Zhou, H.; Wang, Z.; Zhang, L. Asperity Degradation Characteristics of Soft Rock-Like Fractures Under Shearing Based on Acoustic Emission Monitoring. Eng. Geol. 2020, 266, 105392. [Google Scholar] [CrossRef] [Scilit]
- Lemaitre, J. How to use damage mechanics. Nucl. Eng. Des. 1984, 80, 233–245. [Google Scholar] [CrossRef] [Scilit]
- Gao, F.; Xiong, X.; Xu, C.; Zhou, K. Mechanical property deterioration characteristics and a new constitutive model for rocks subjected to freeze-thaw weathering process. Int. J. Rock. Mech. Min. Sci. 2021, 140, 104642. [Google Scholar] [CrossRef] [Scilit]
- Zhang, H.; Meng, X.; Yang, G. A study on mechanical properties and damage model of rock subjected to freeze-thaw cycles and confining pressure. Cold Reg. Sci. Technol. 2020, 174, 103056. [Google Scholar] [CrossRef] [Scilit]
- Lu, Y.; Li, X.; Chan, A. Damage constitutive model of single flaw sandstone under freeze-thaw and load. Cold Reg. Sci. Technol. 2019, 159, 20–28. [Google Scholar] [CrossRef] [Scilit]
- Ye, Z.; Li, X.; Liu, X.; Ma, C.; Yin, T. Testing studies on rock failure modes of statically loads under dynamic loading. Trans. Tianjin Univ. 2025, 14, 530–535. [Google Scholar]
- Niu, F.; He, J.; Jiang, H.; Jiao, C. Damage constitutive model for concrete under the coupling action of freeze–thaw cycles and load based on homogenization theory. J. Build. Eng. 2023, 76, 107152. [Google Scholar] [CrossRef] [Scilit]
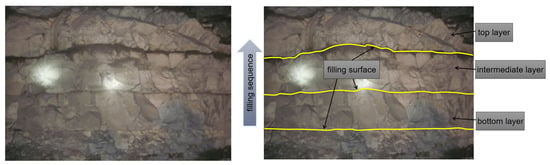
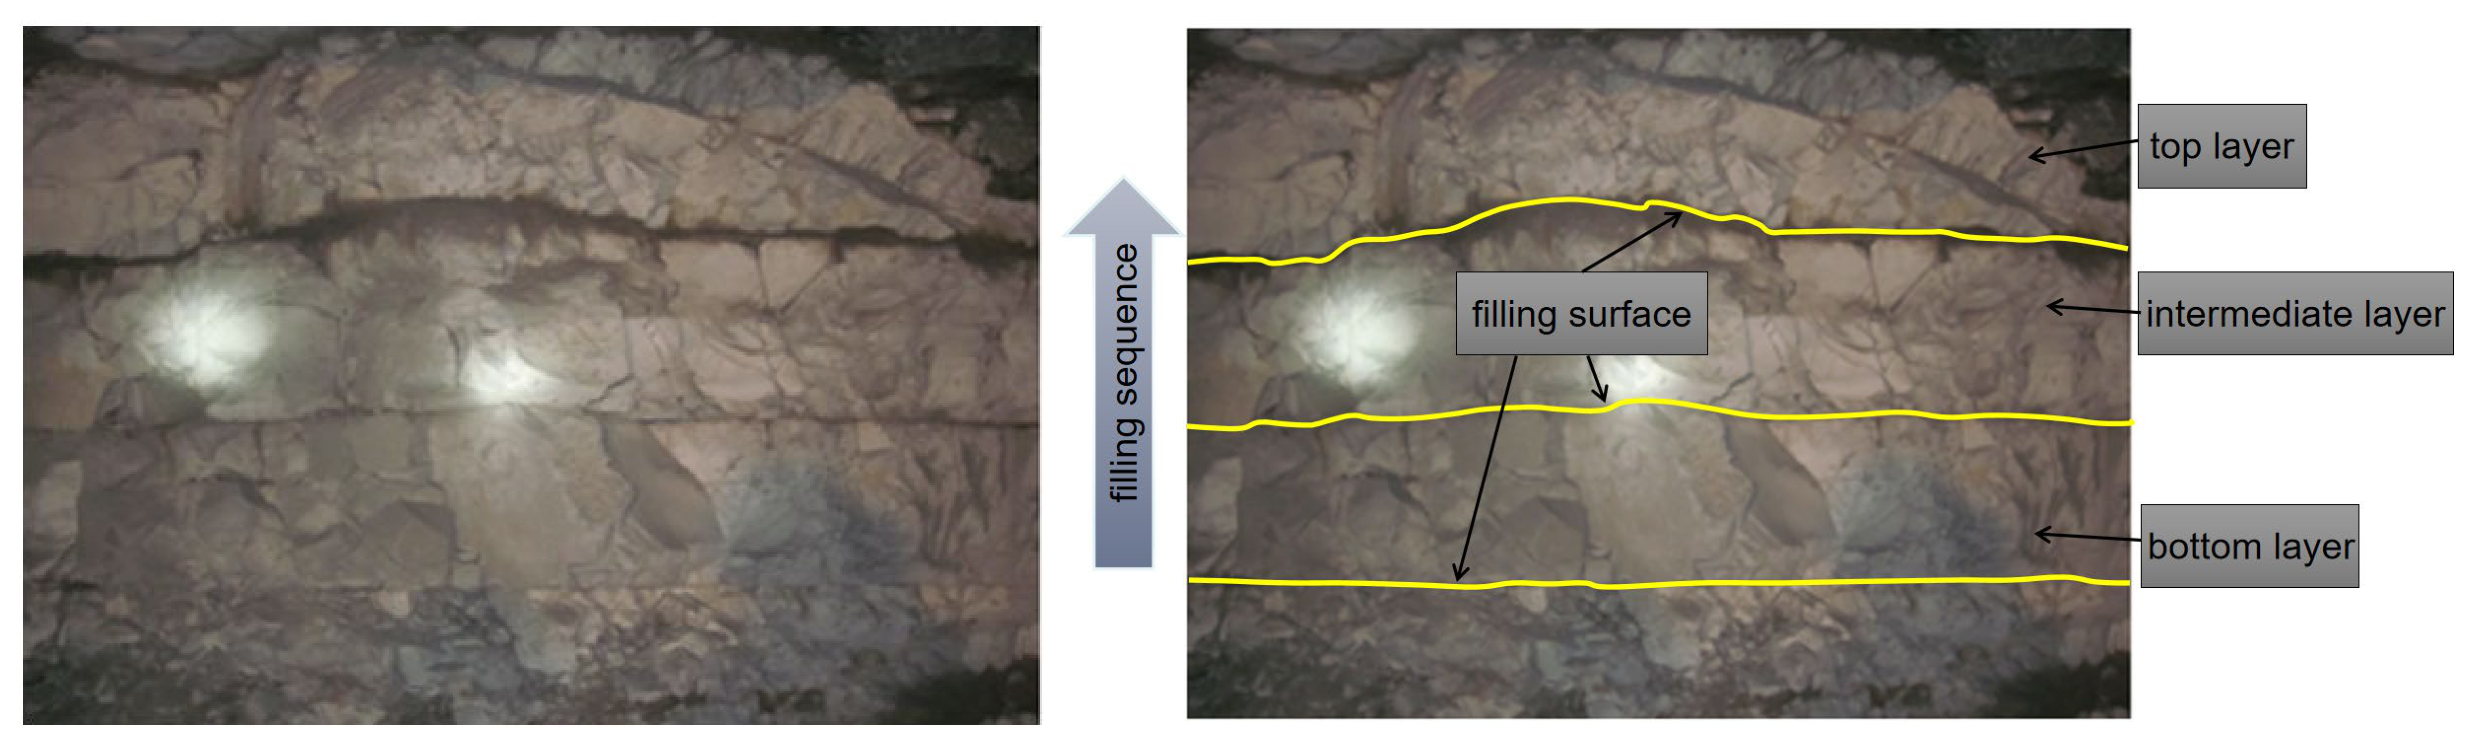
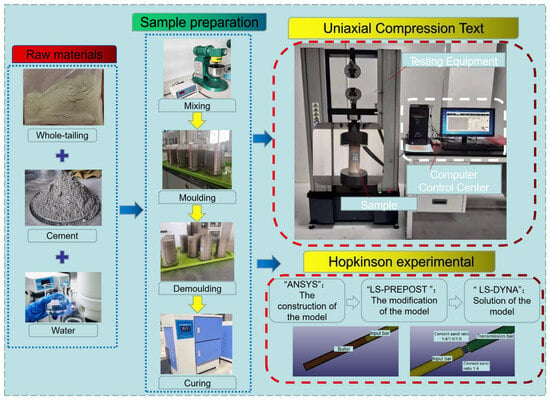
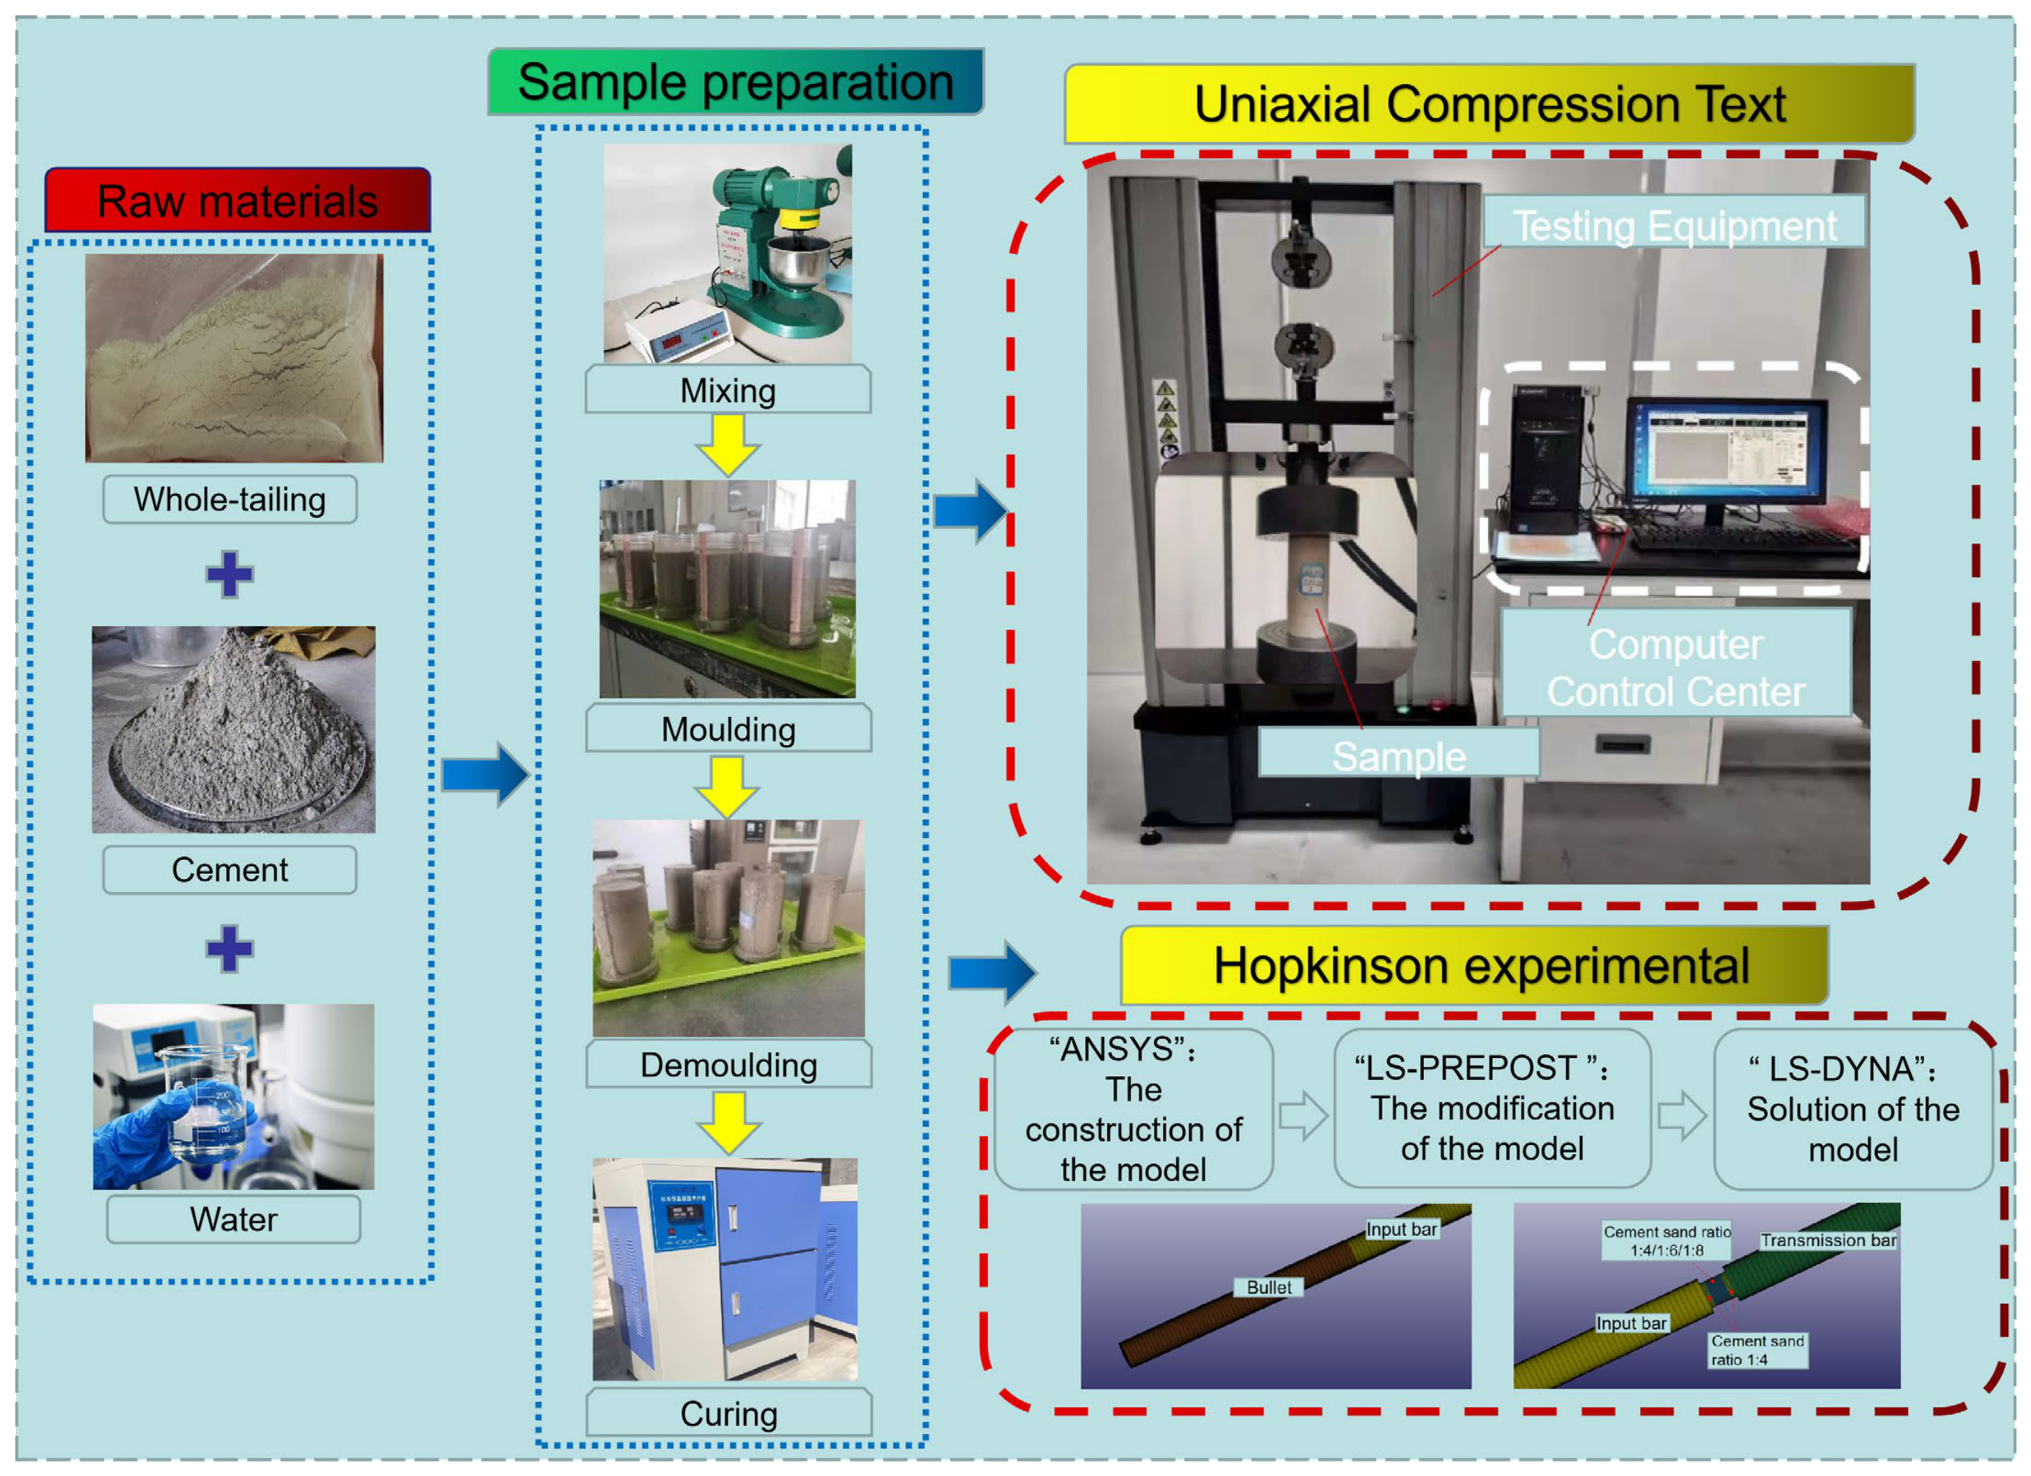
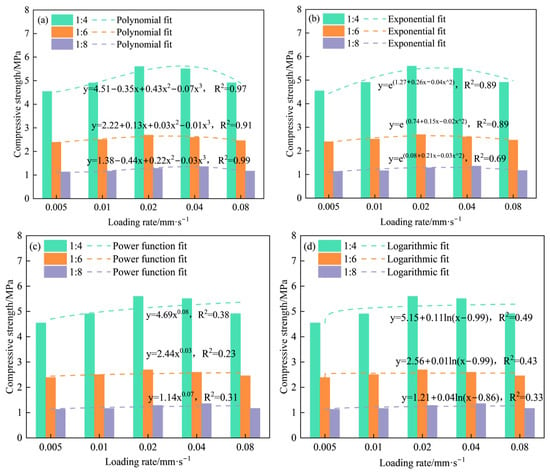
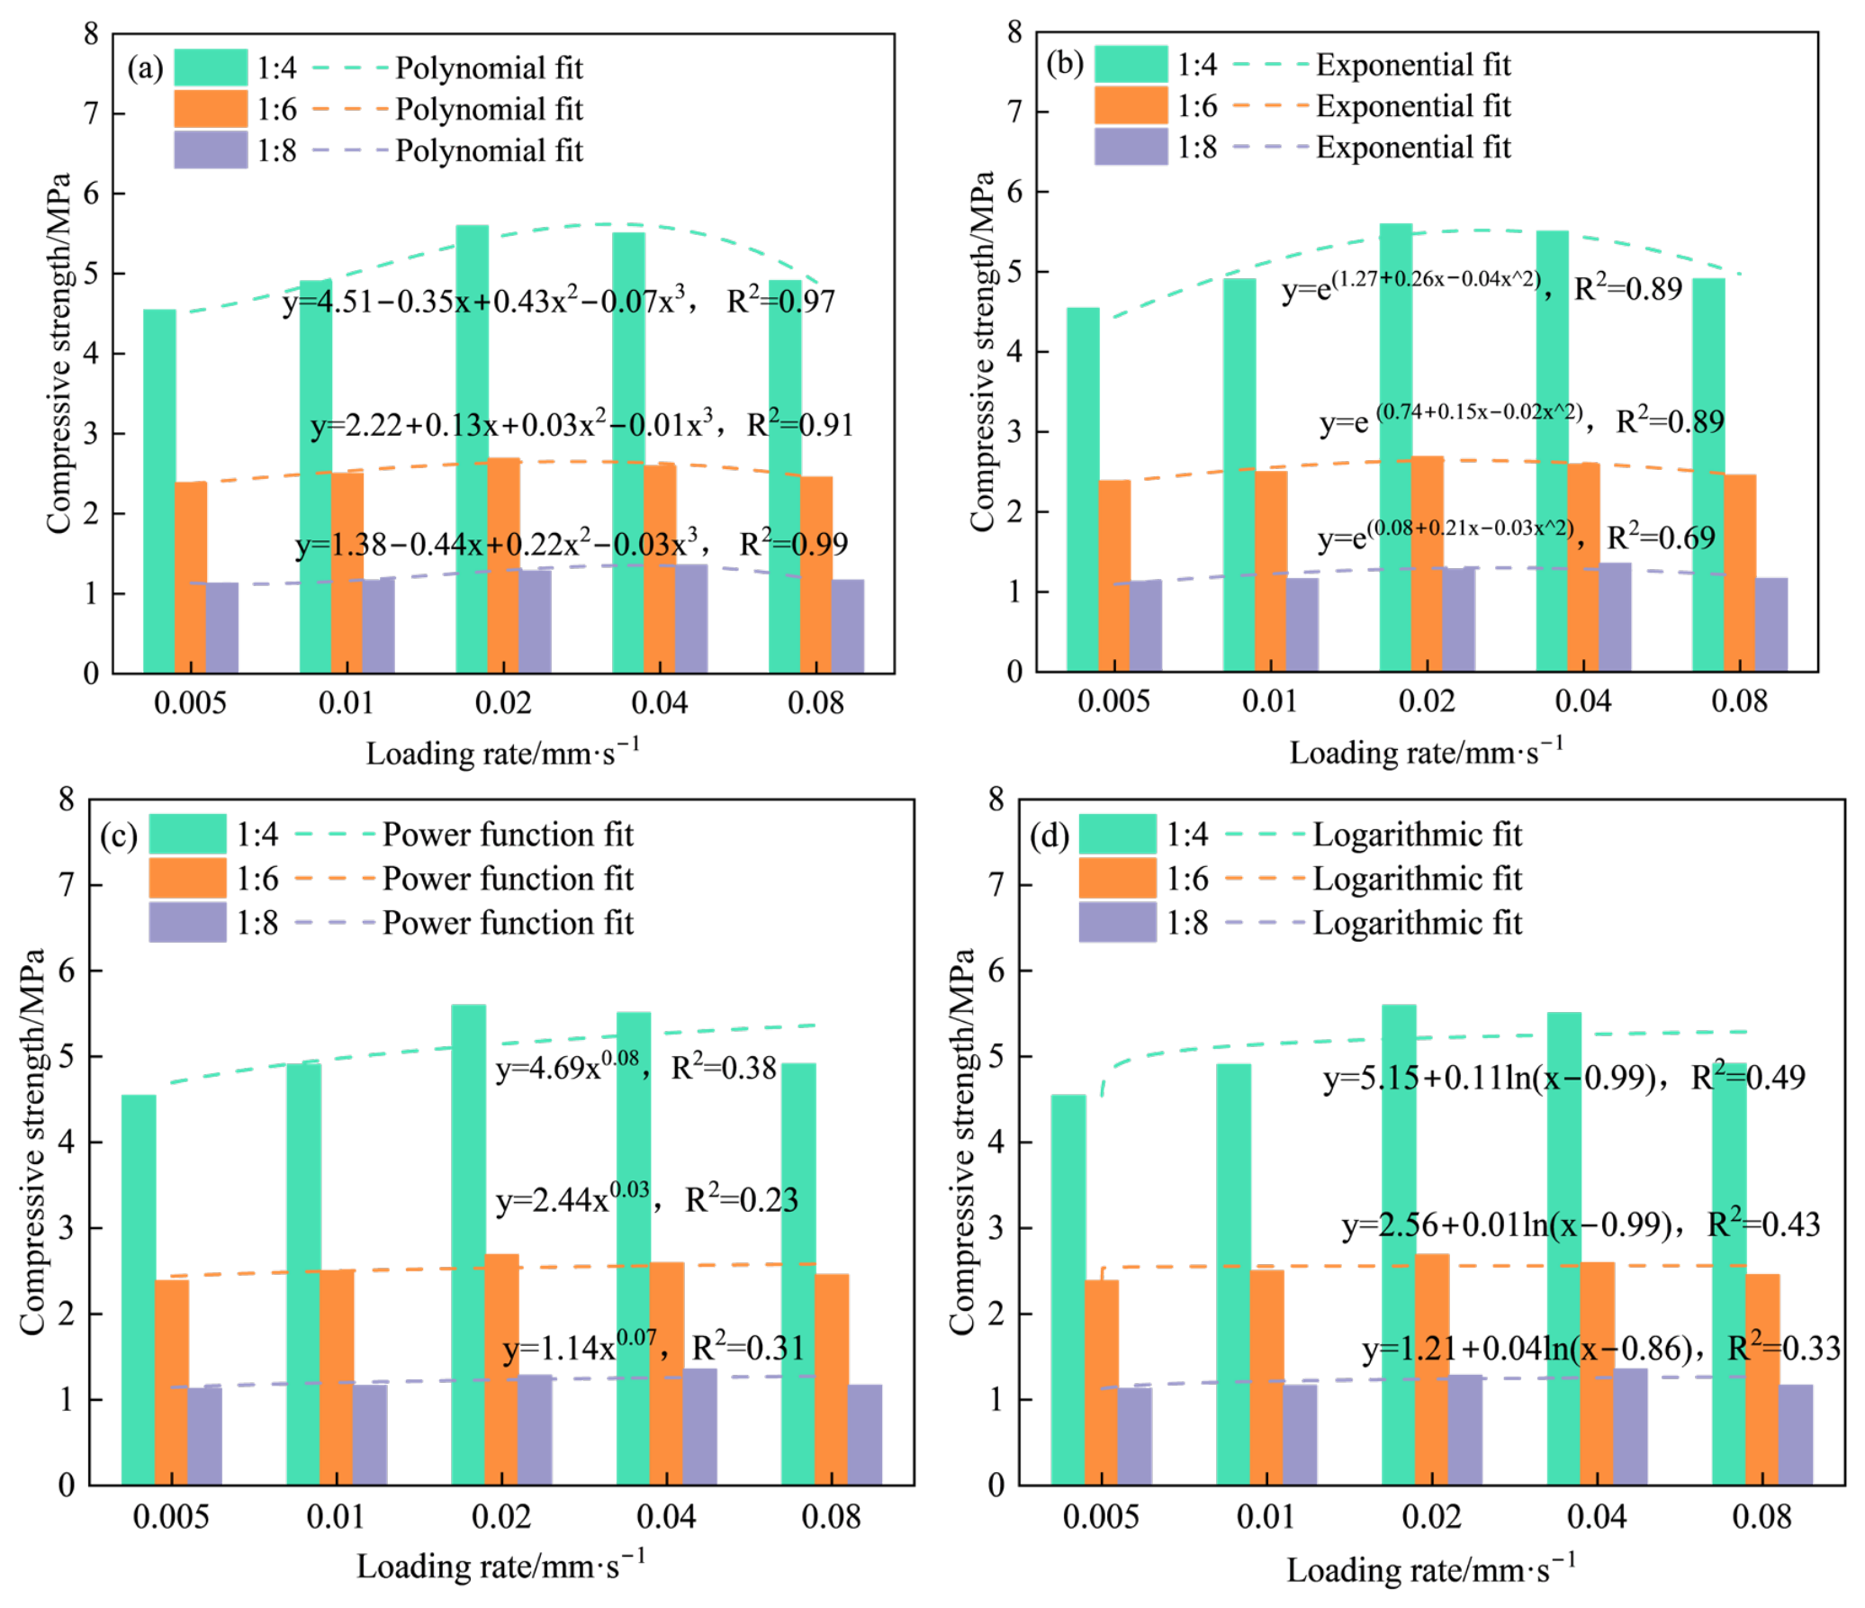
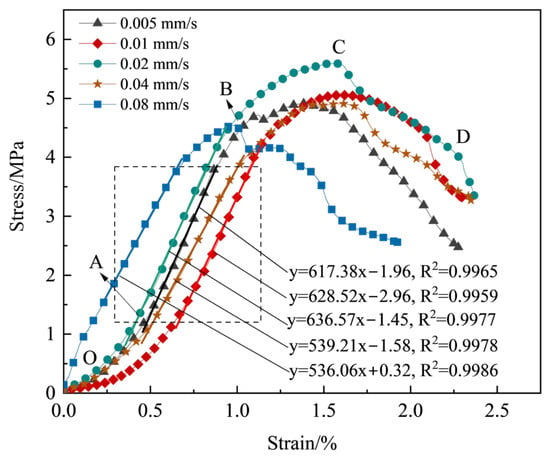
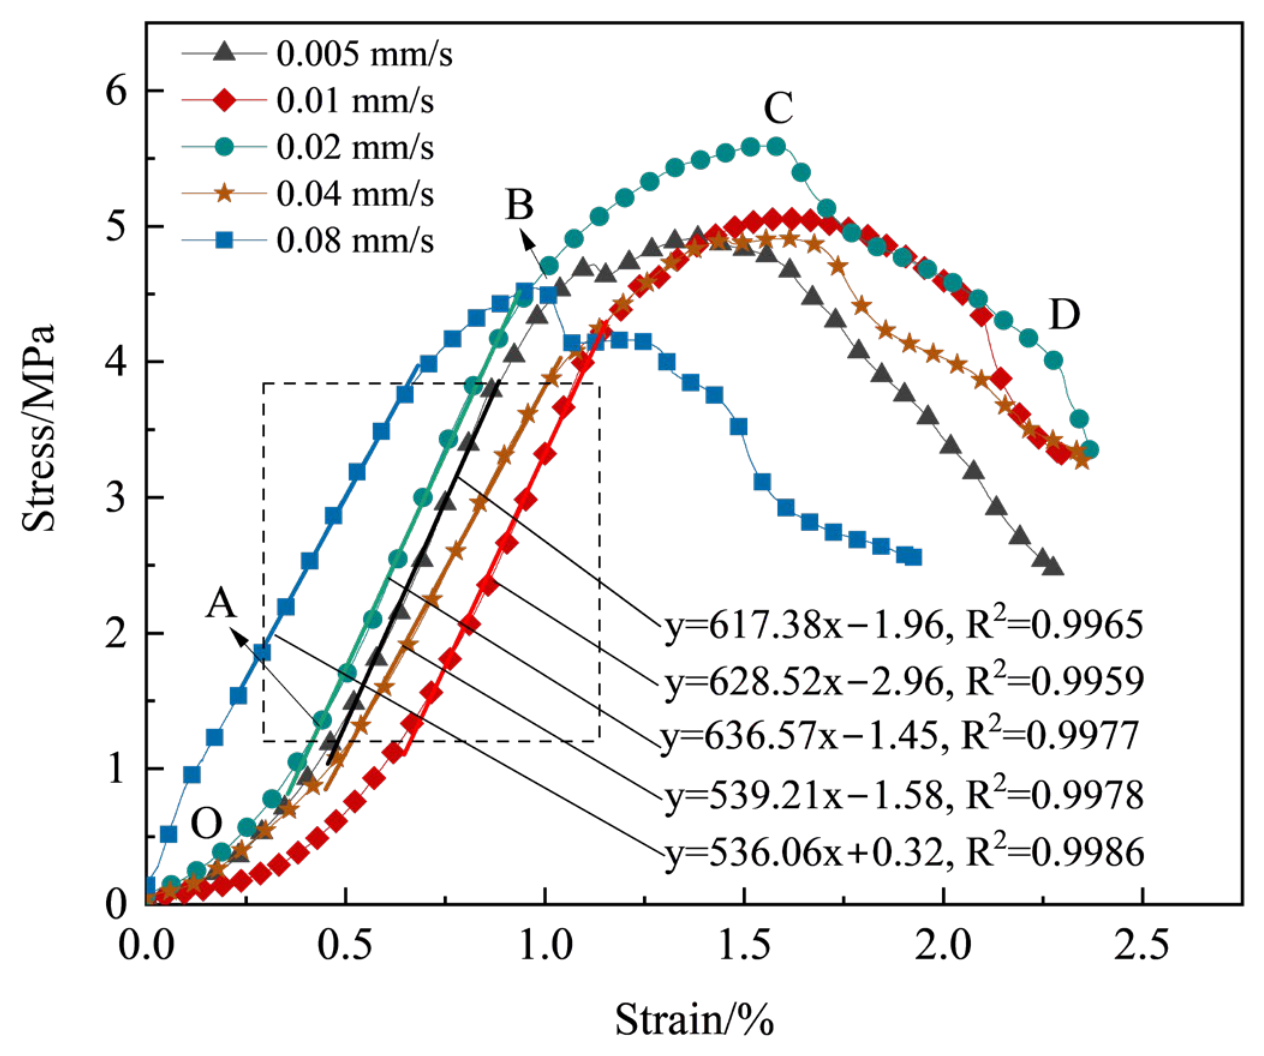
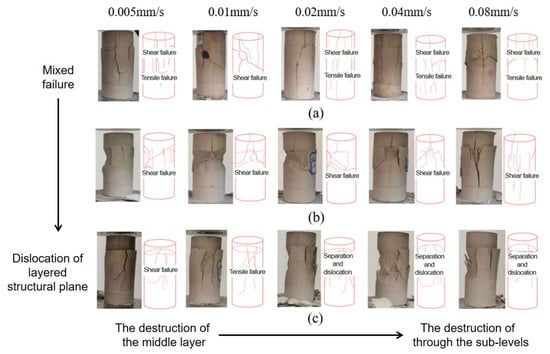
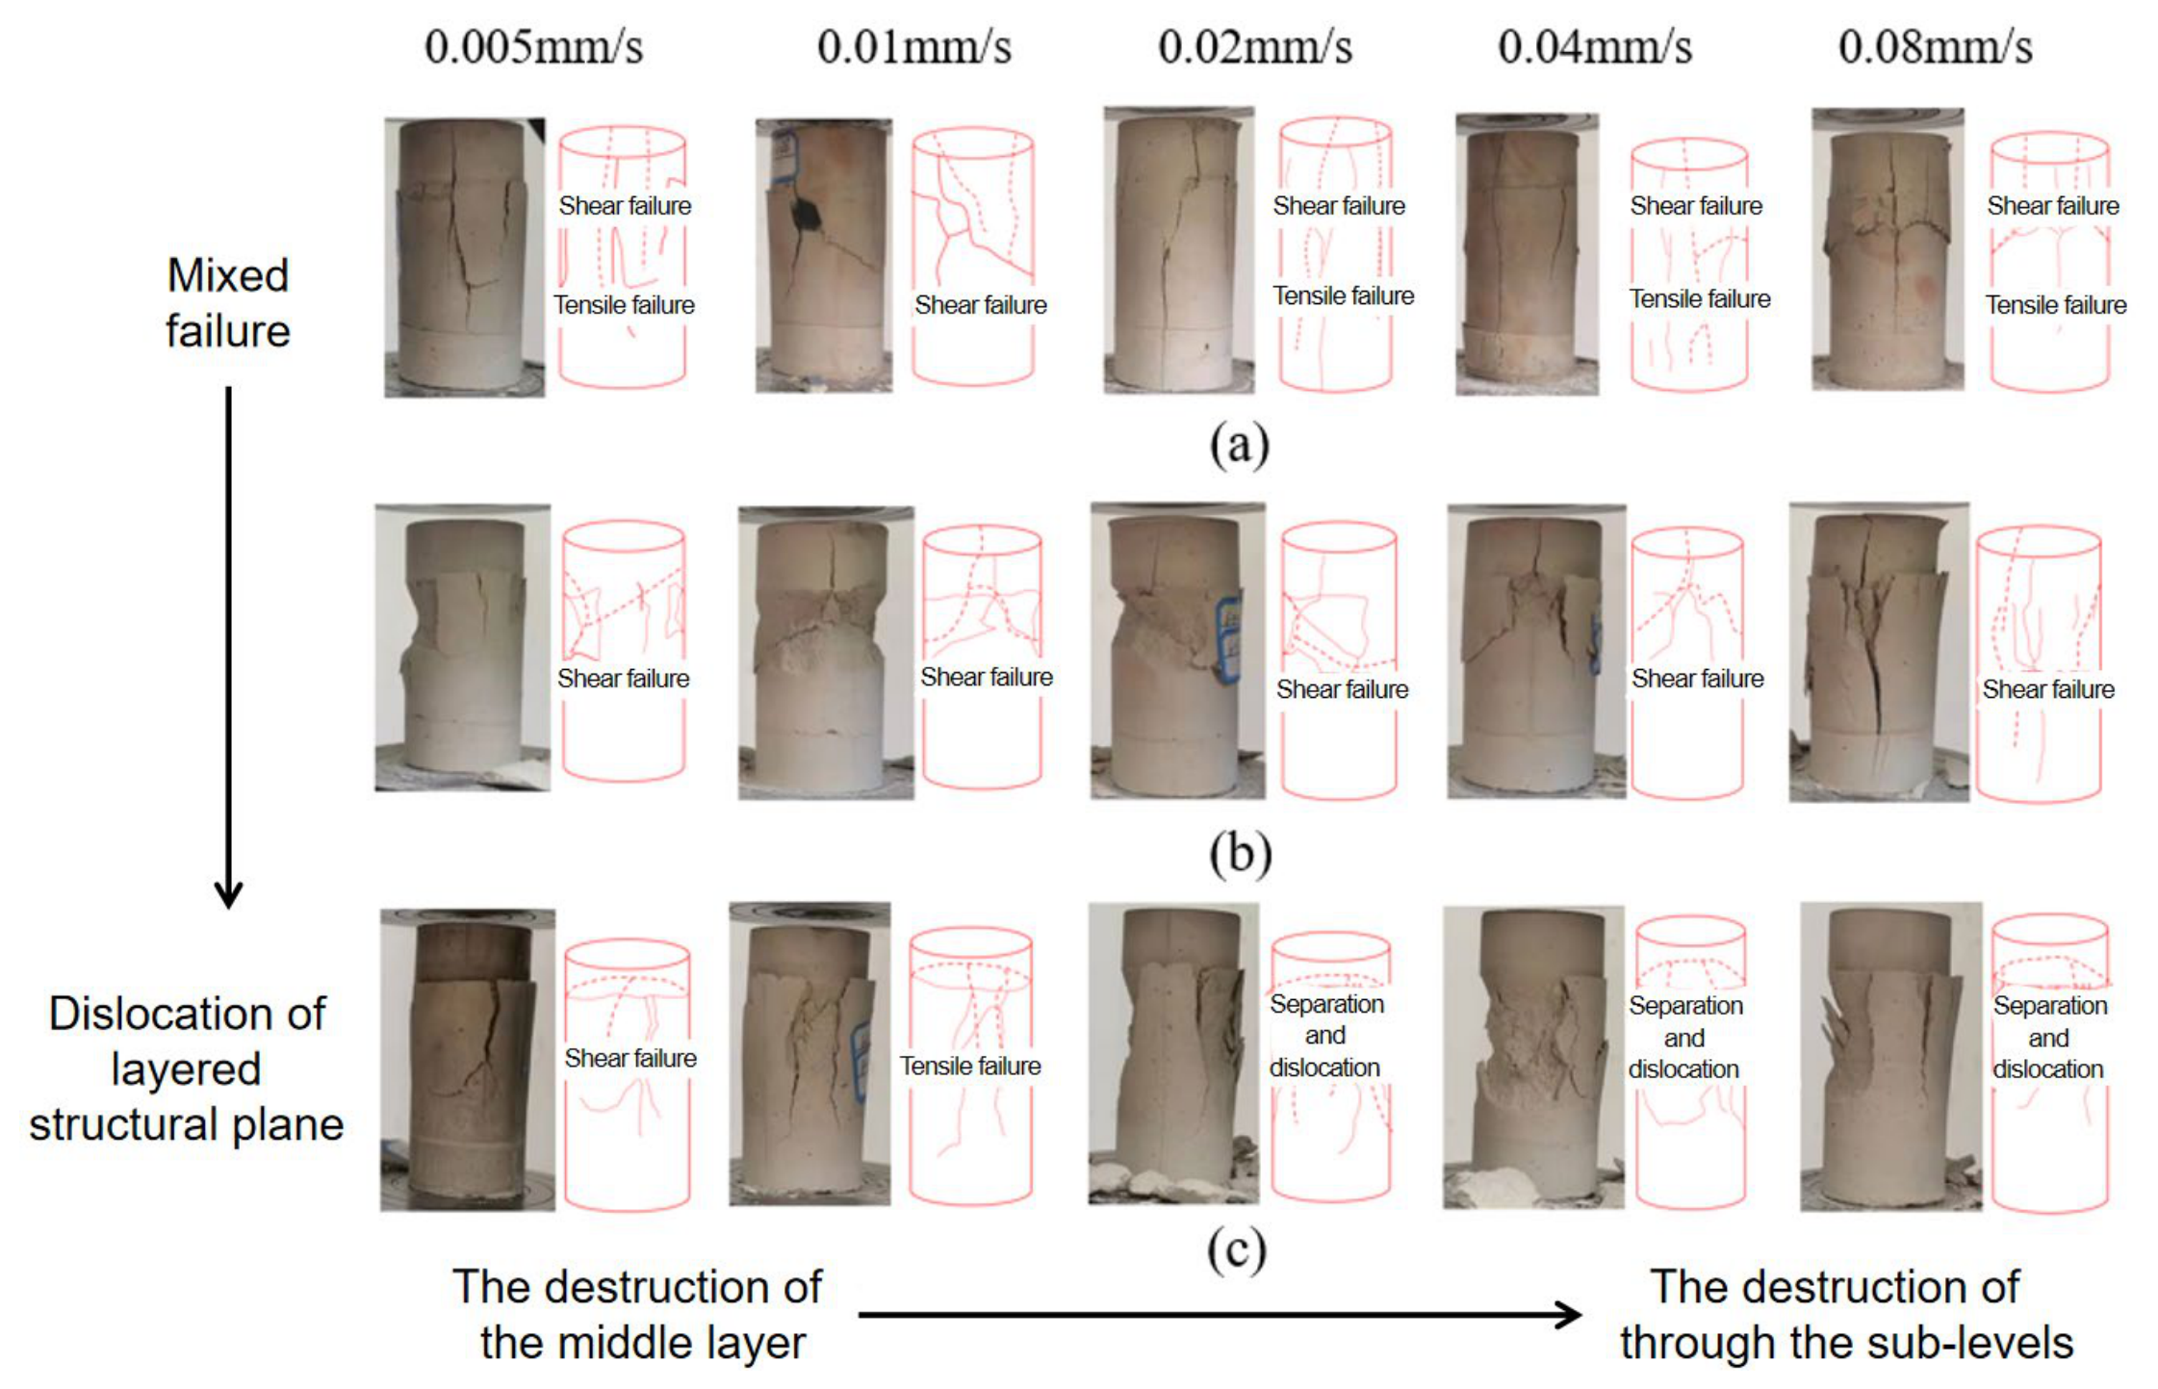
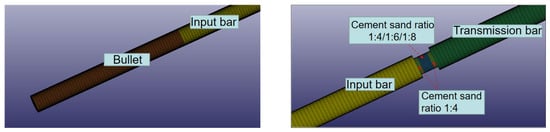
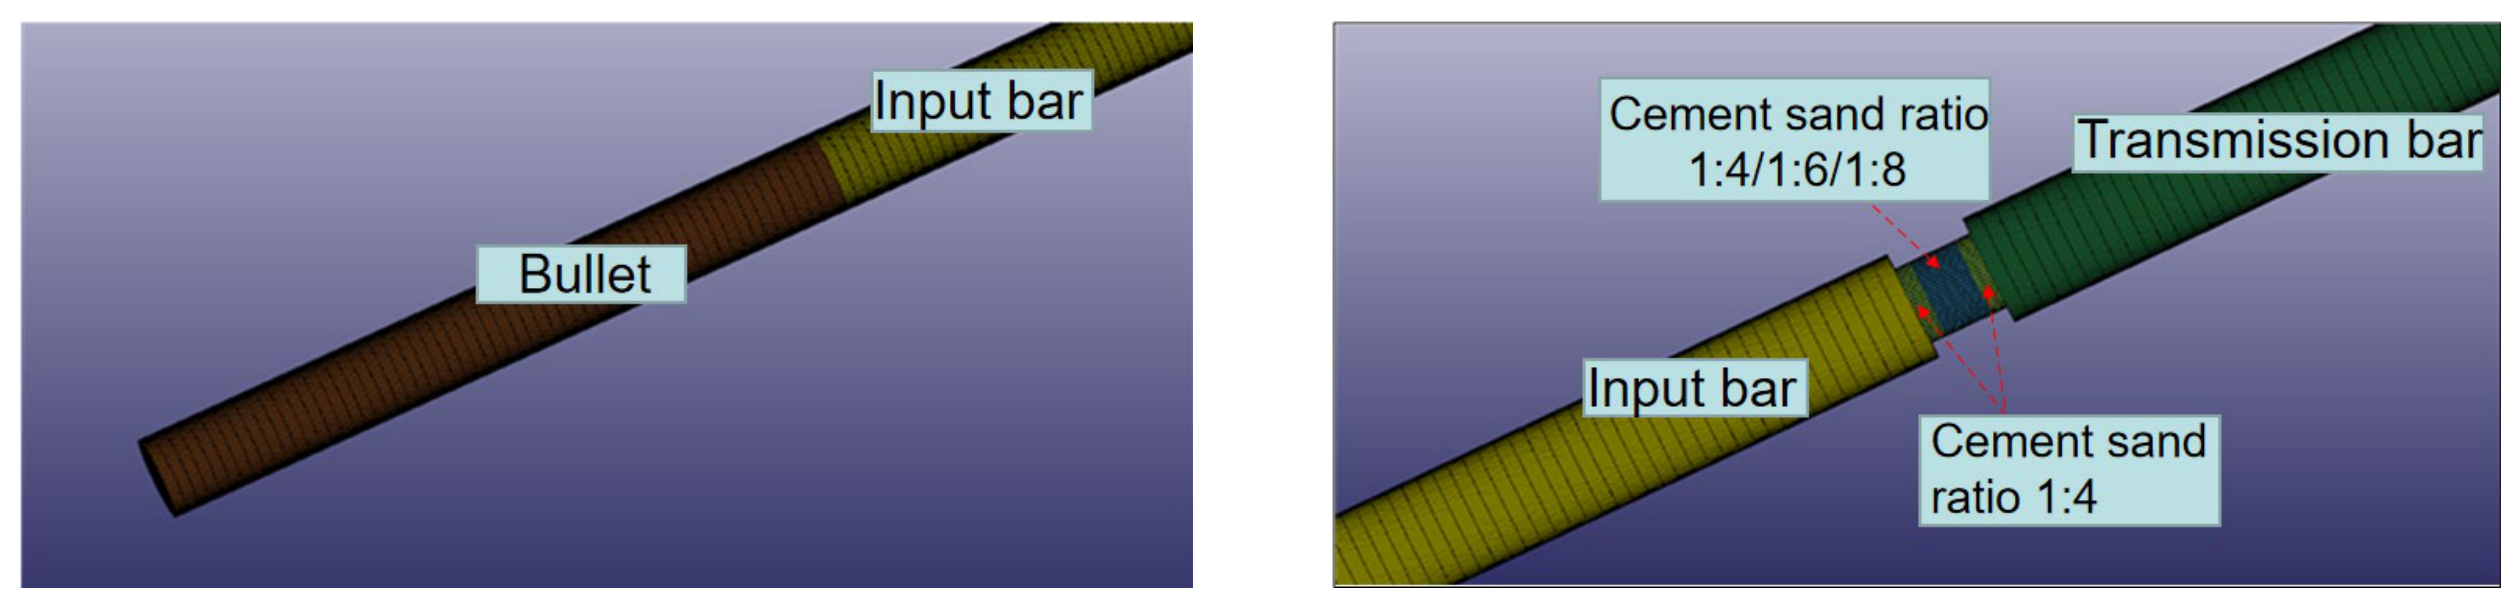
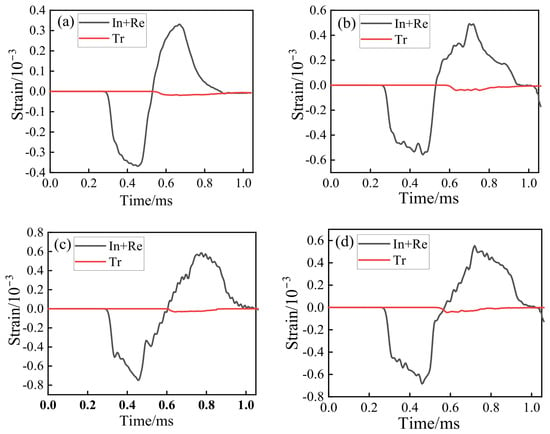
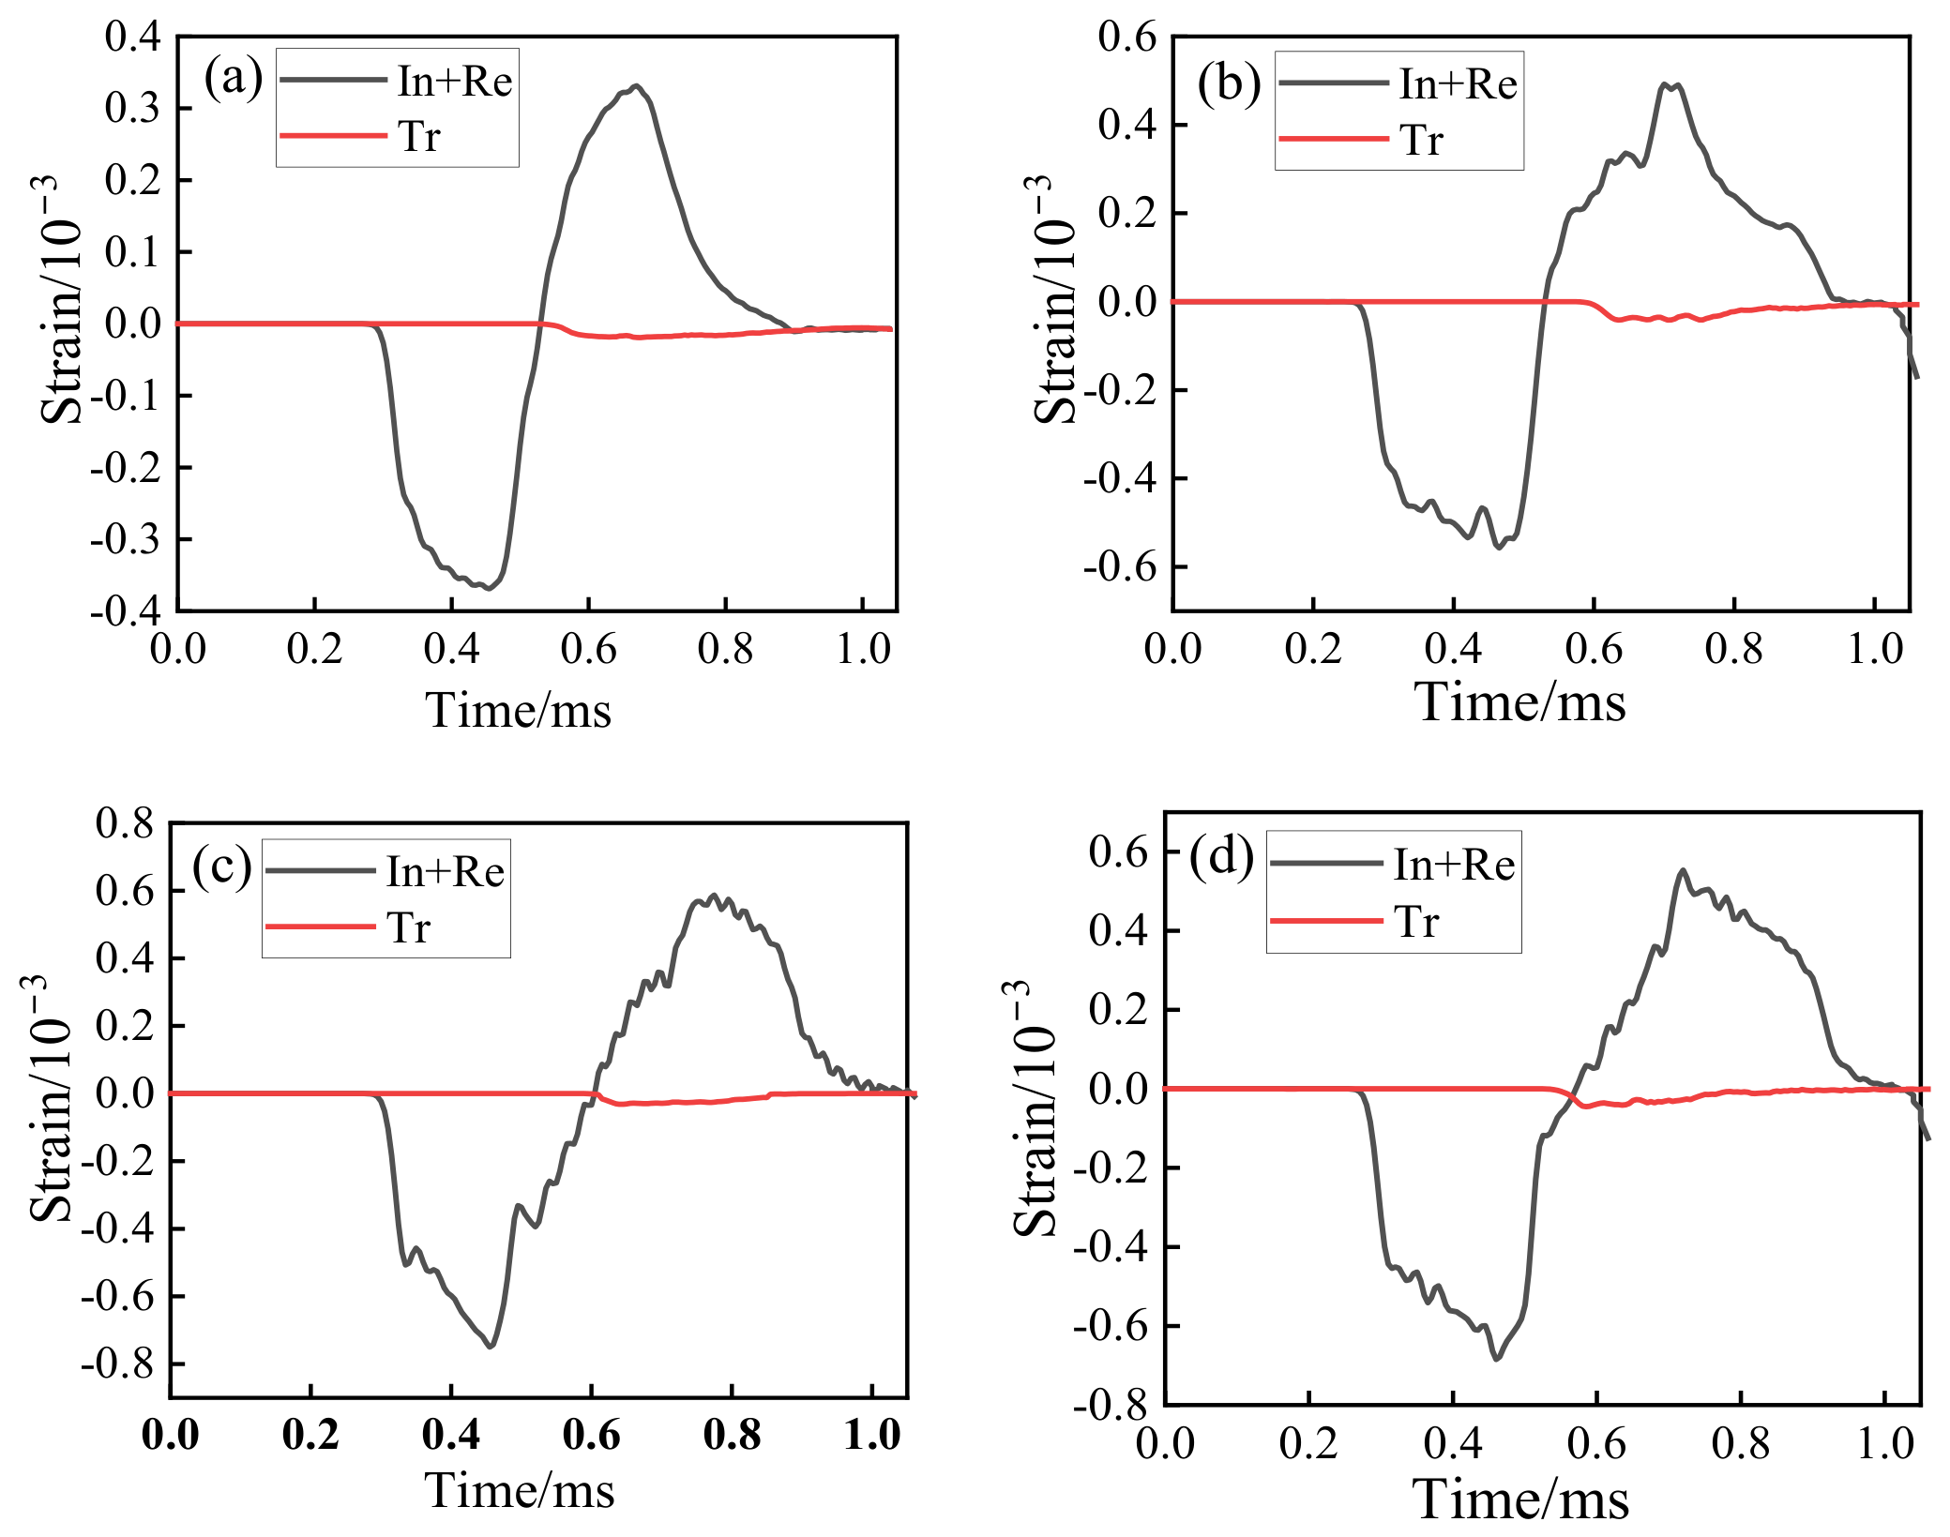
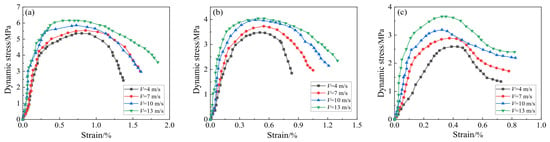
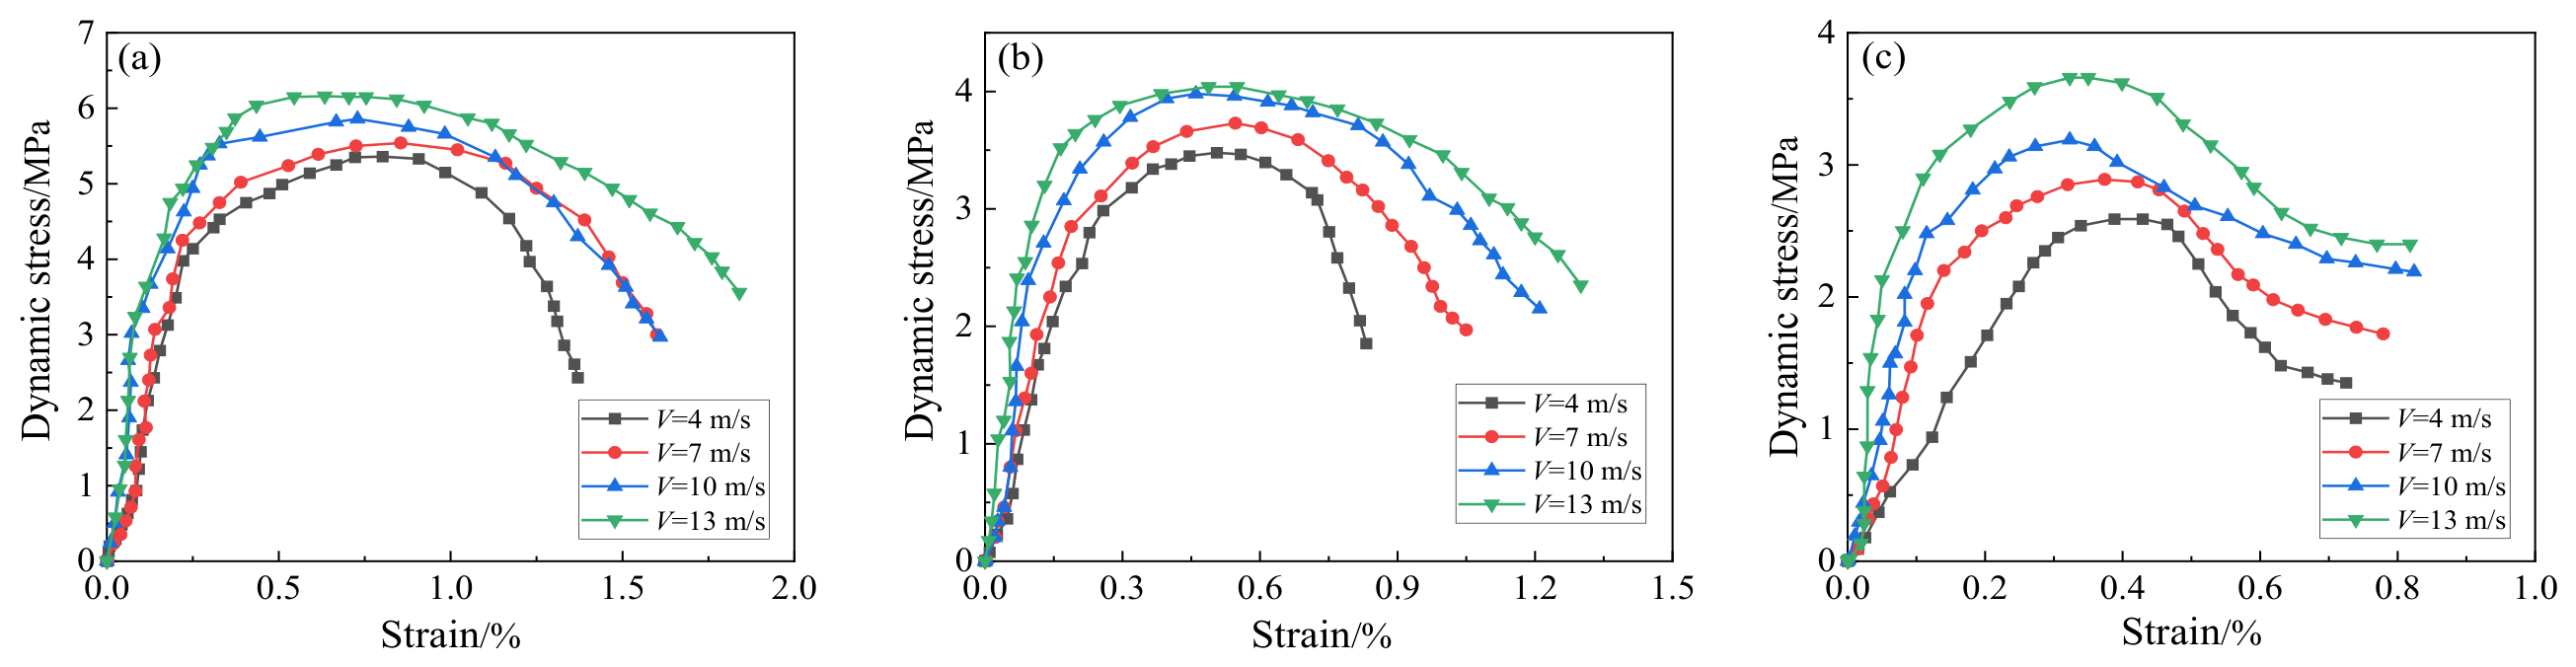
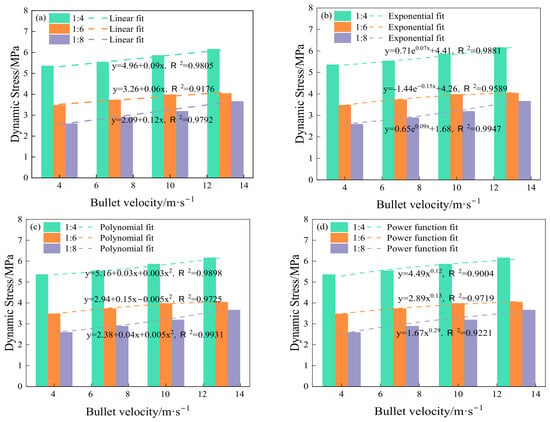
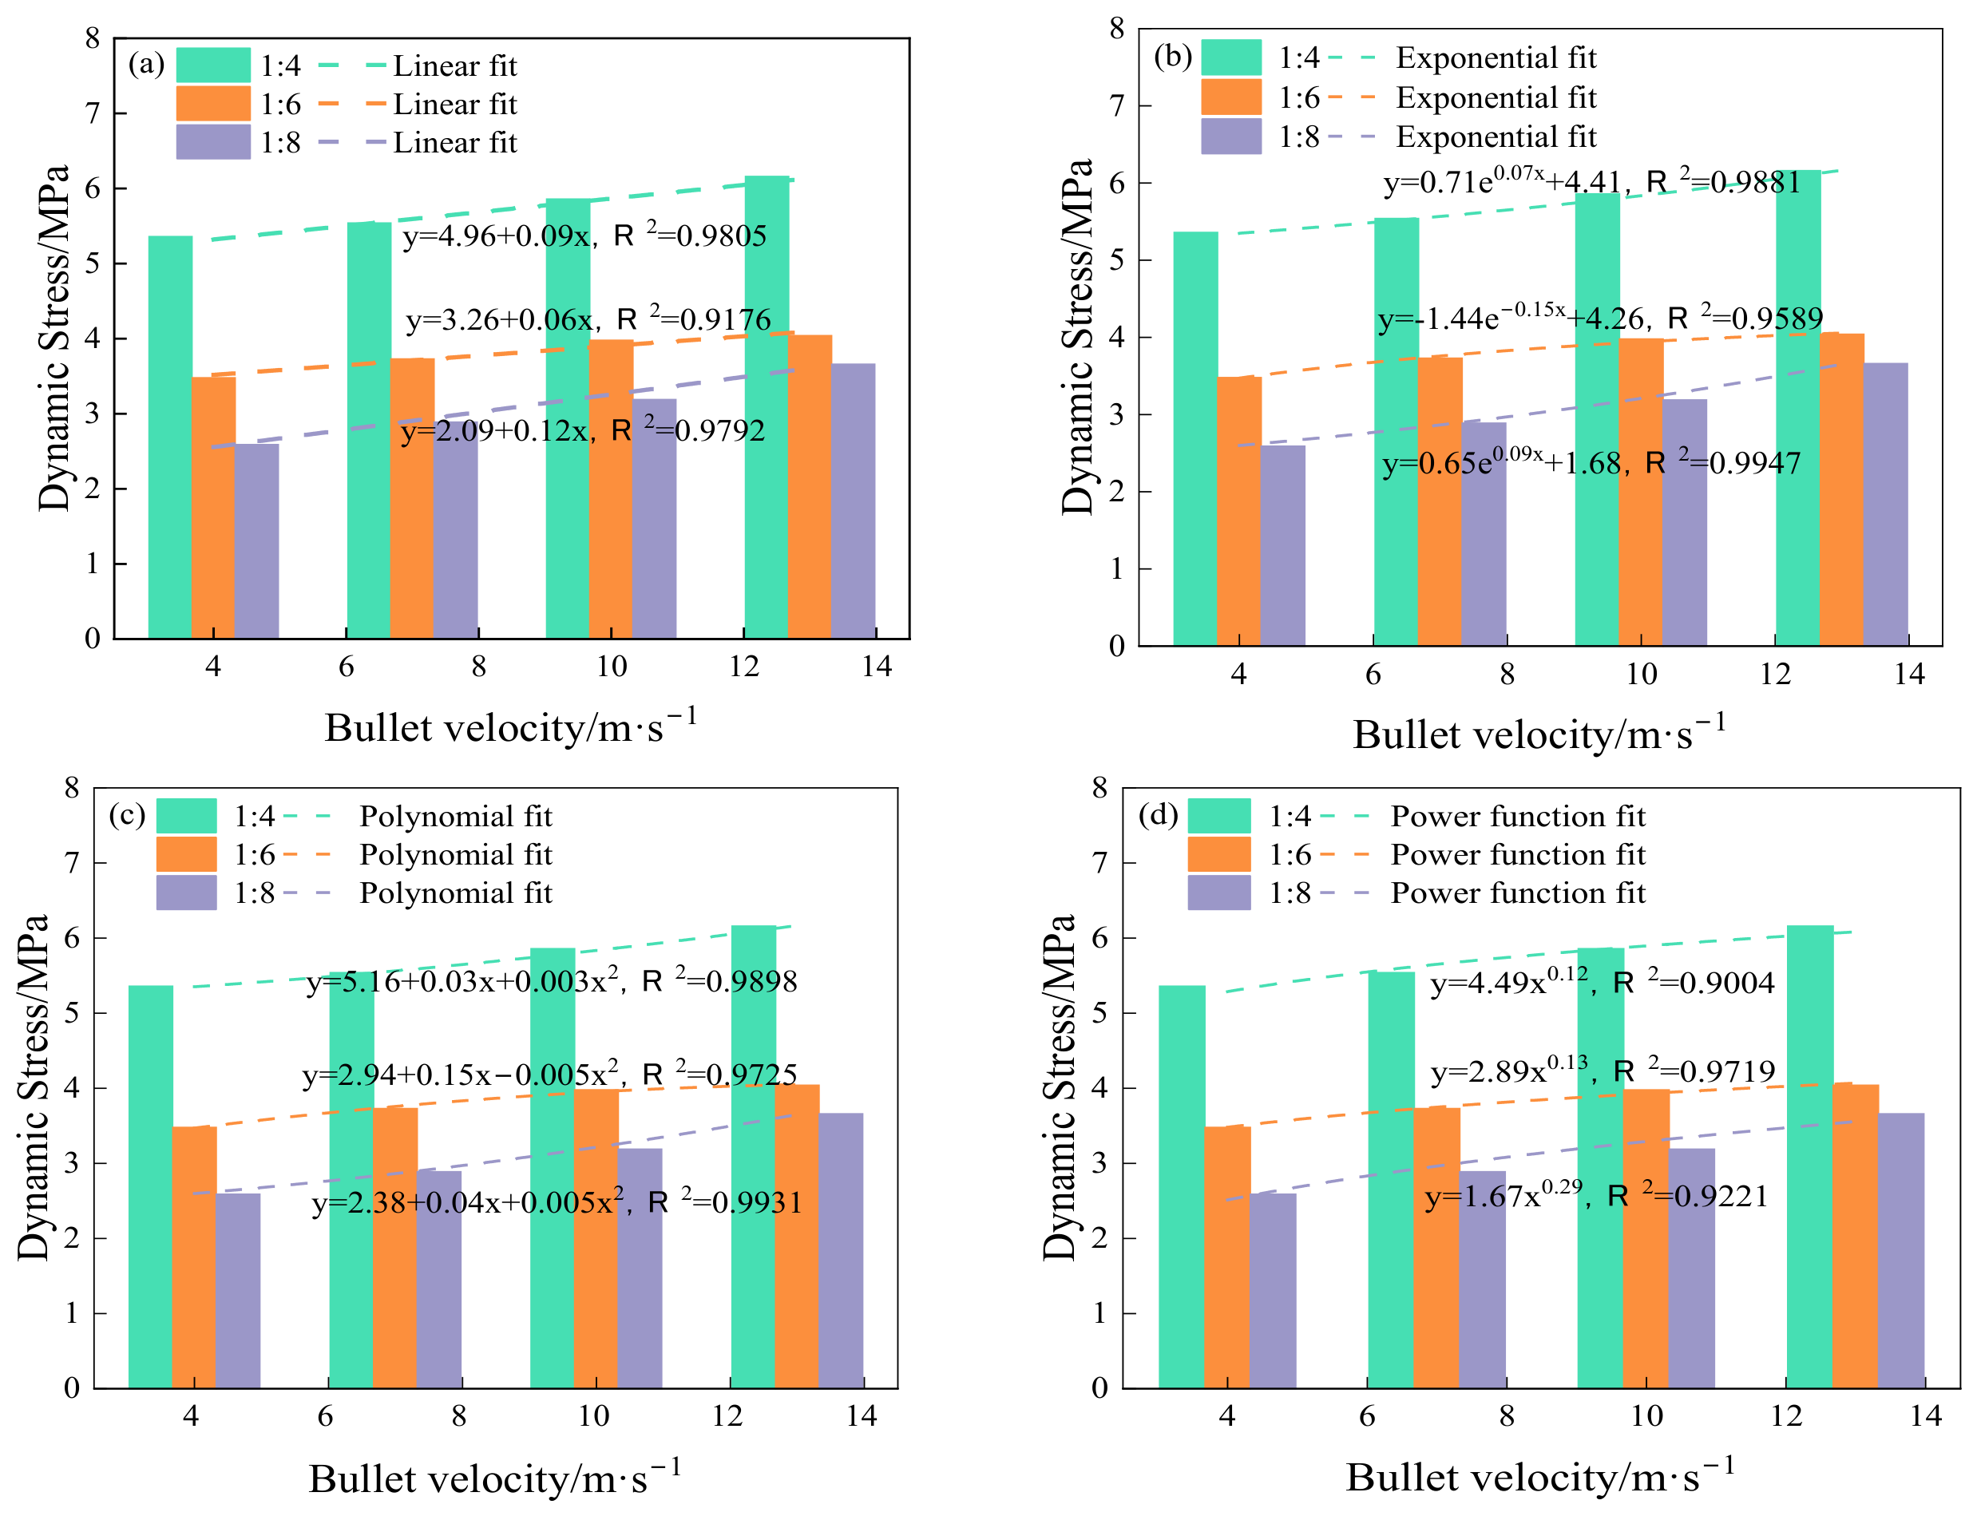
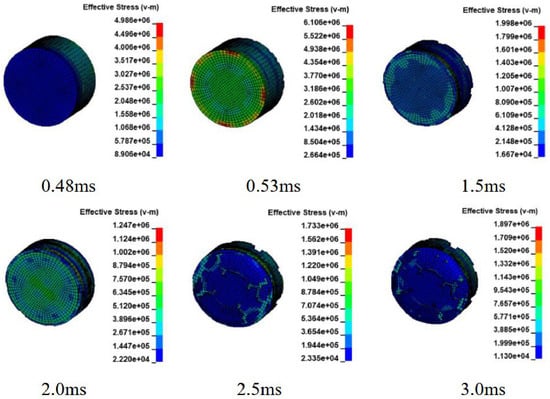
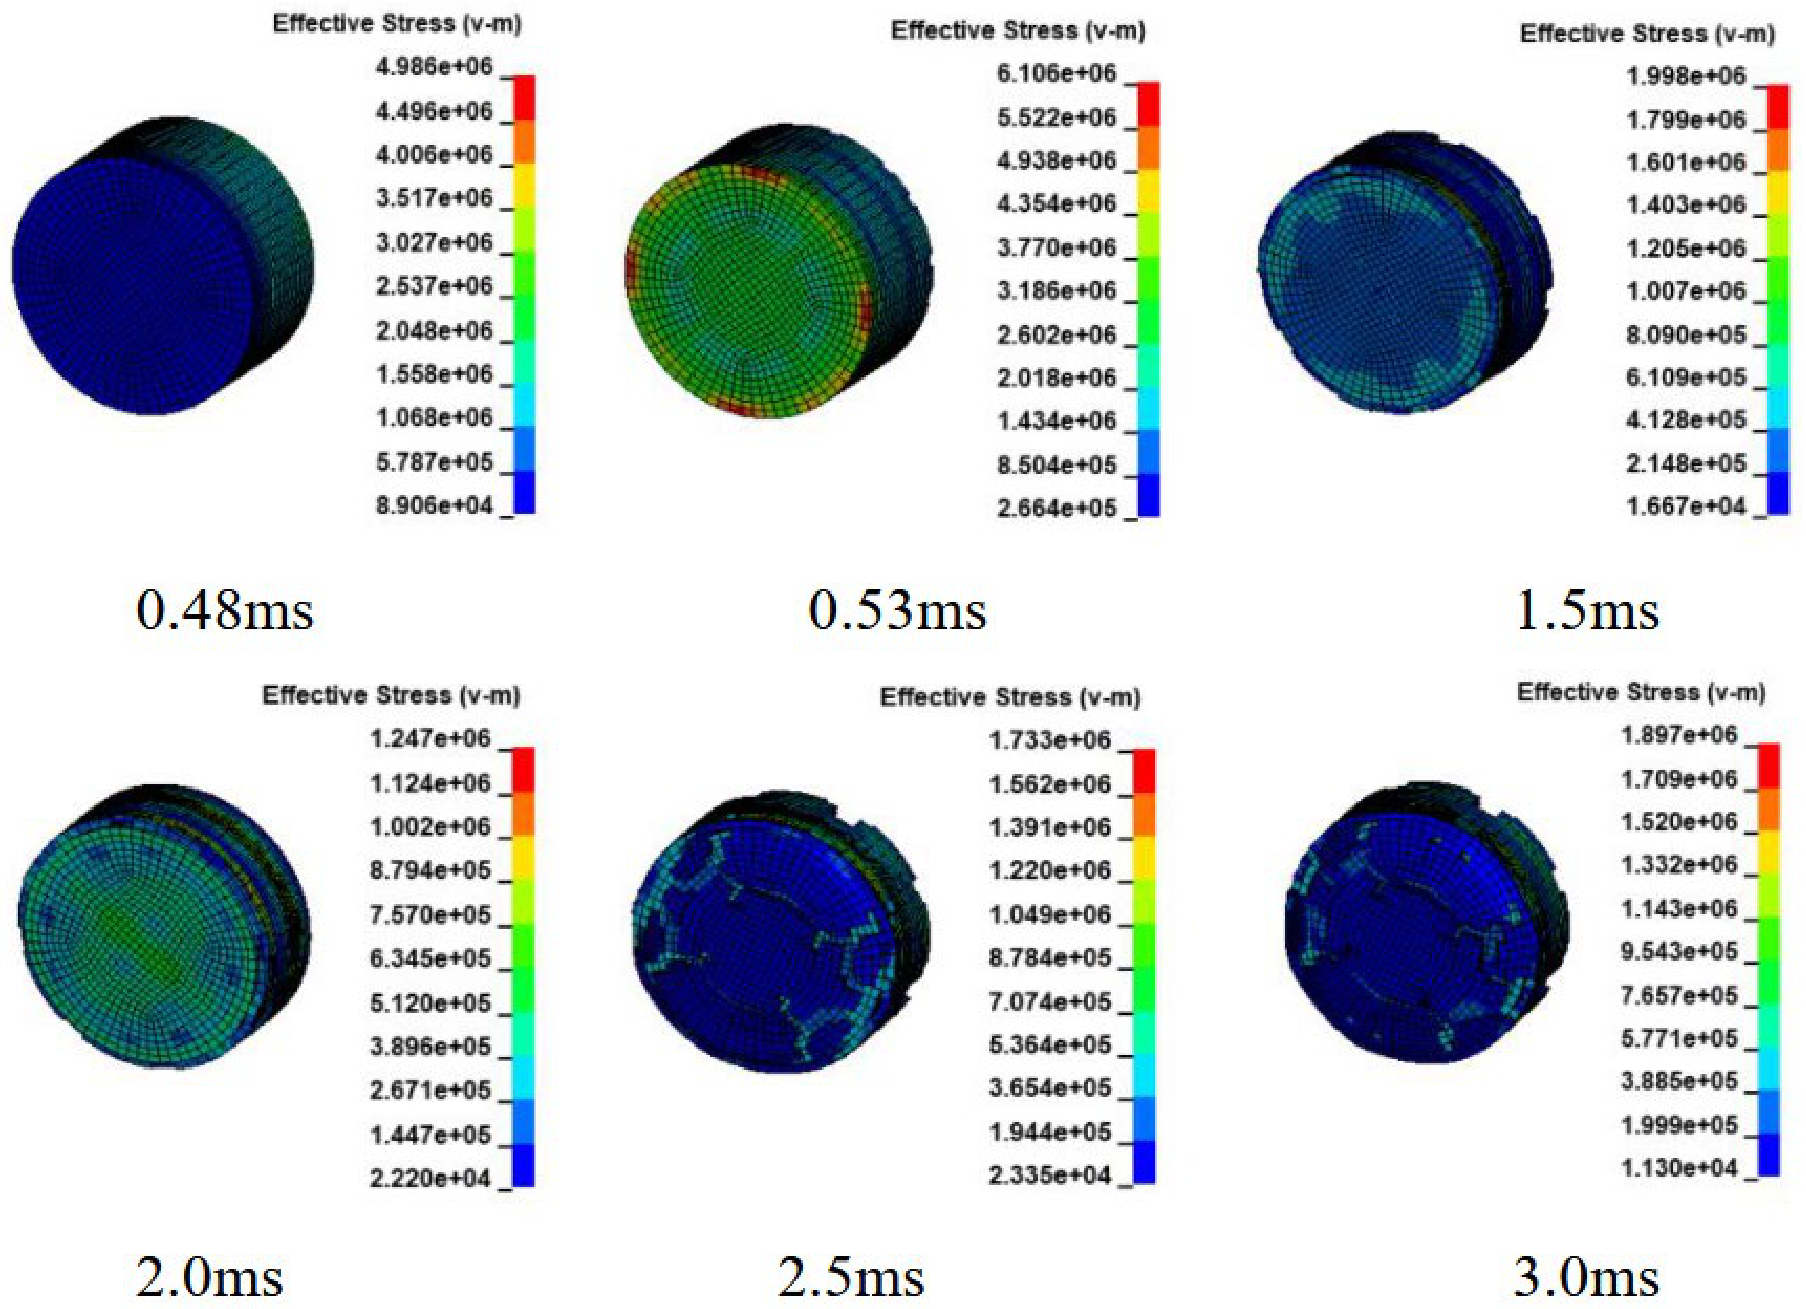
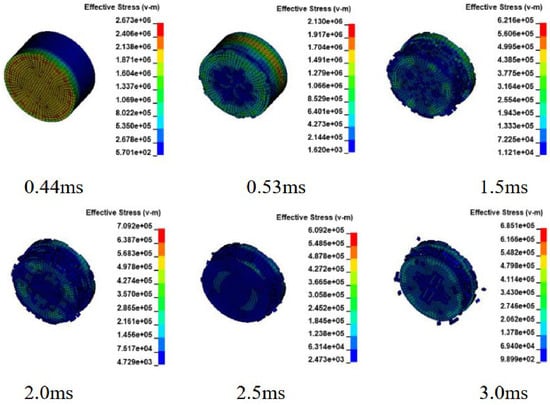
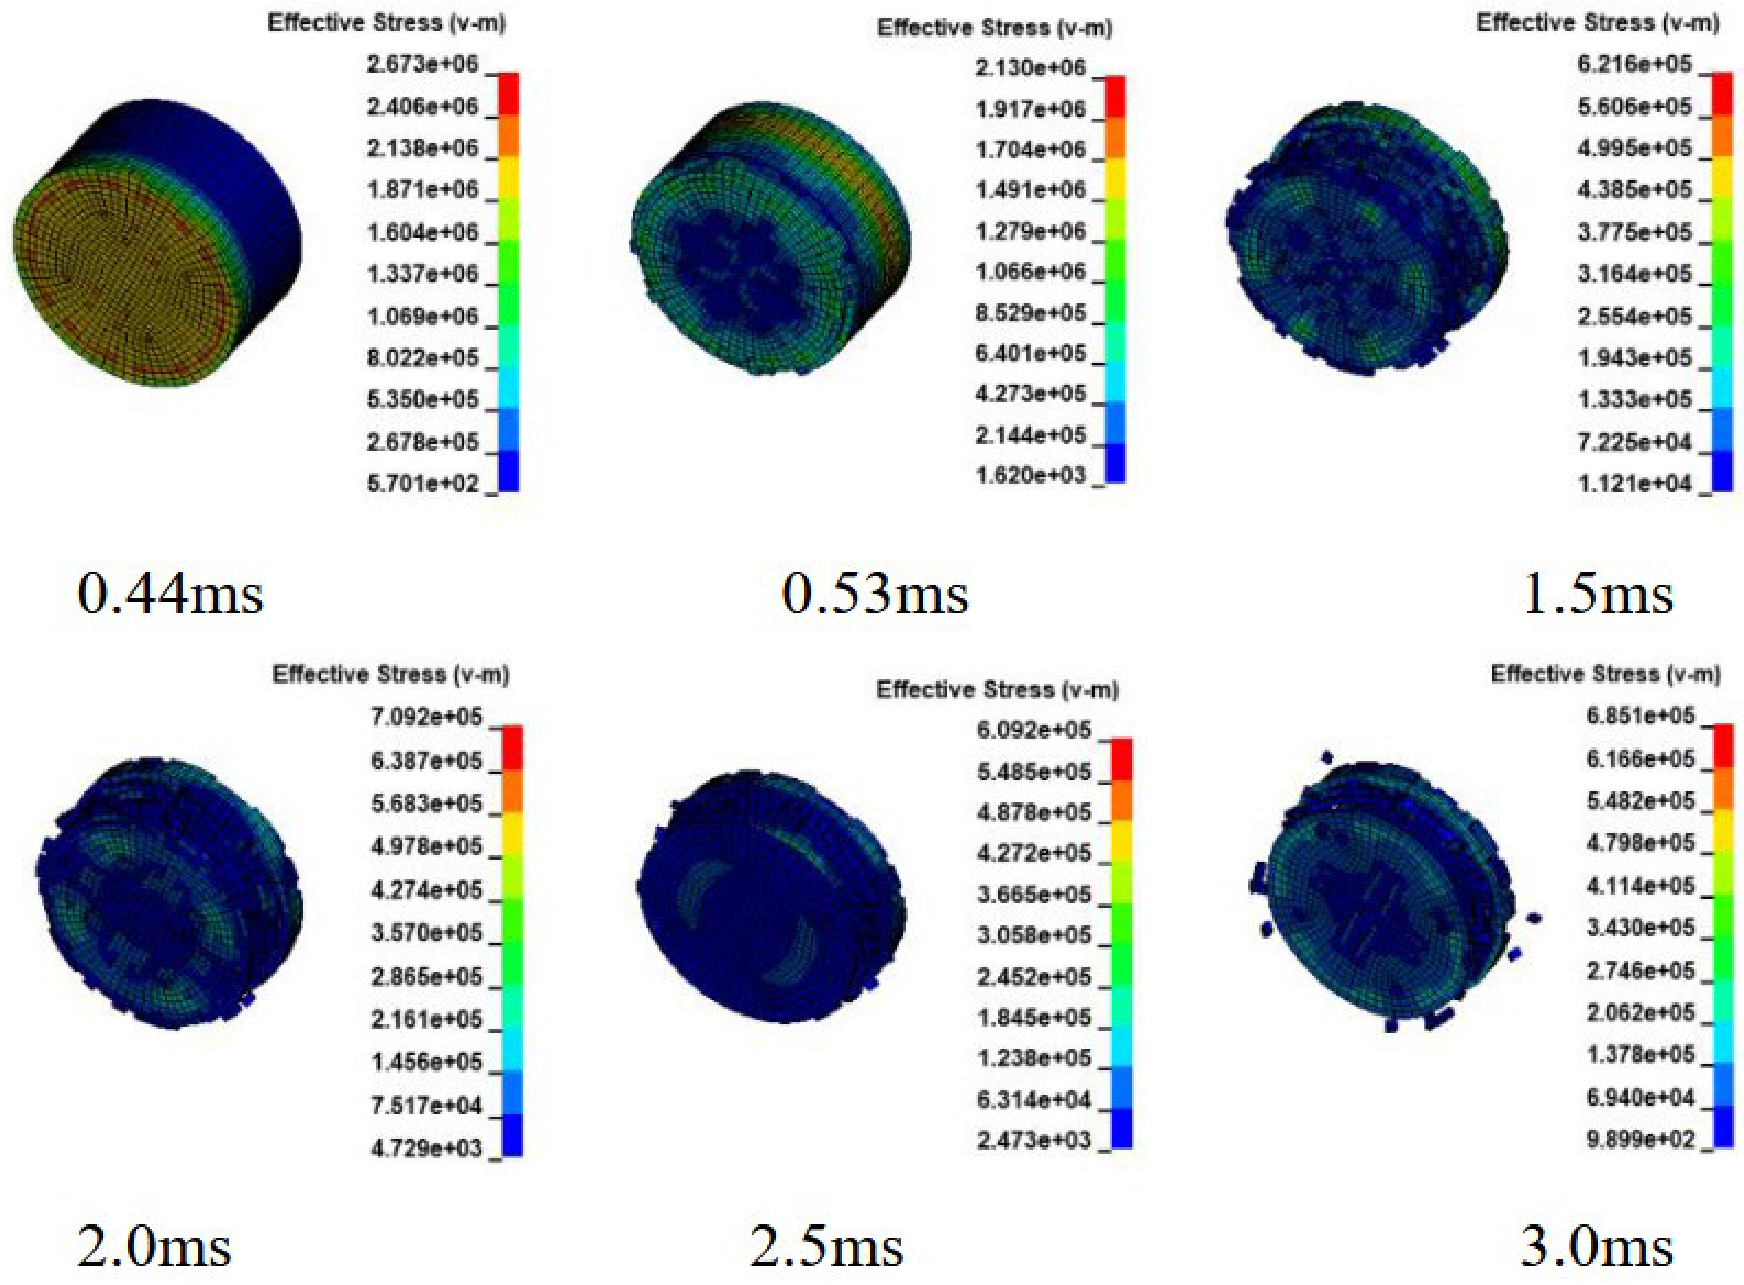
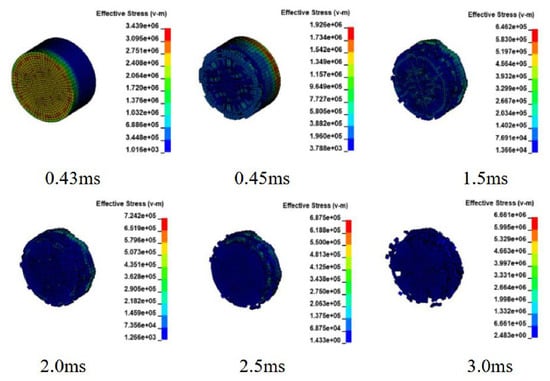
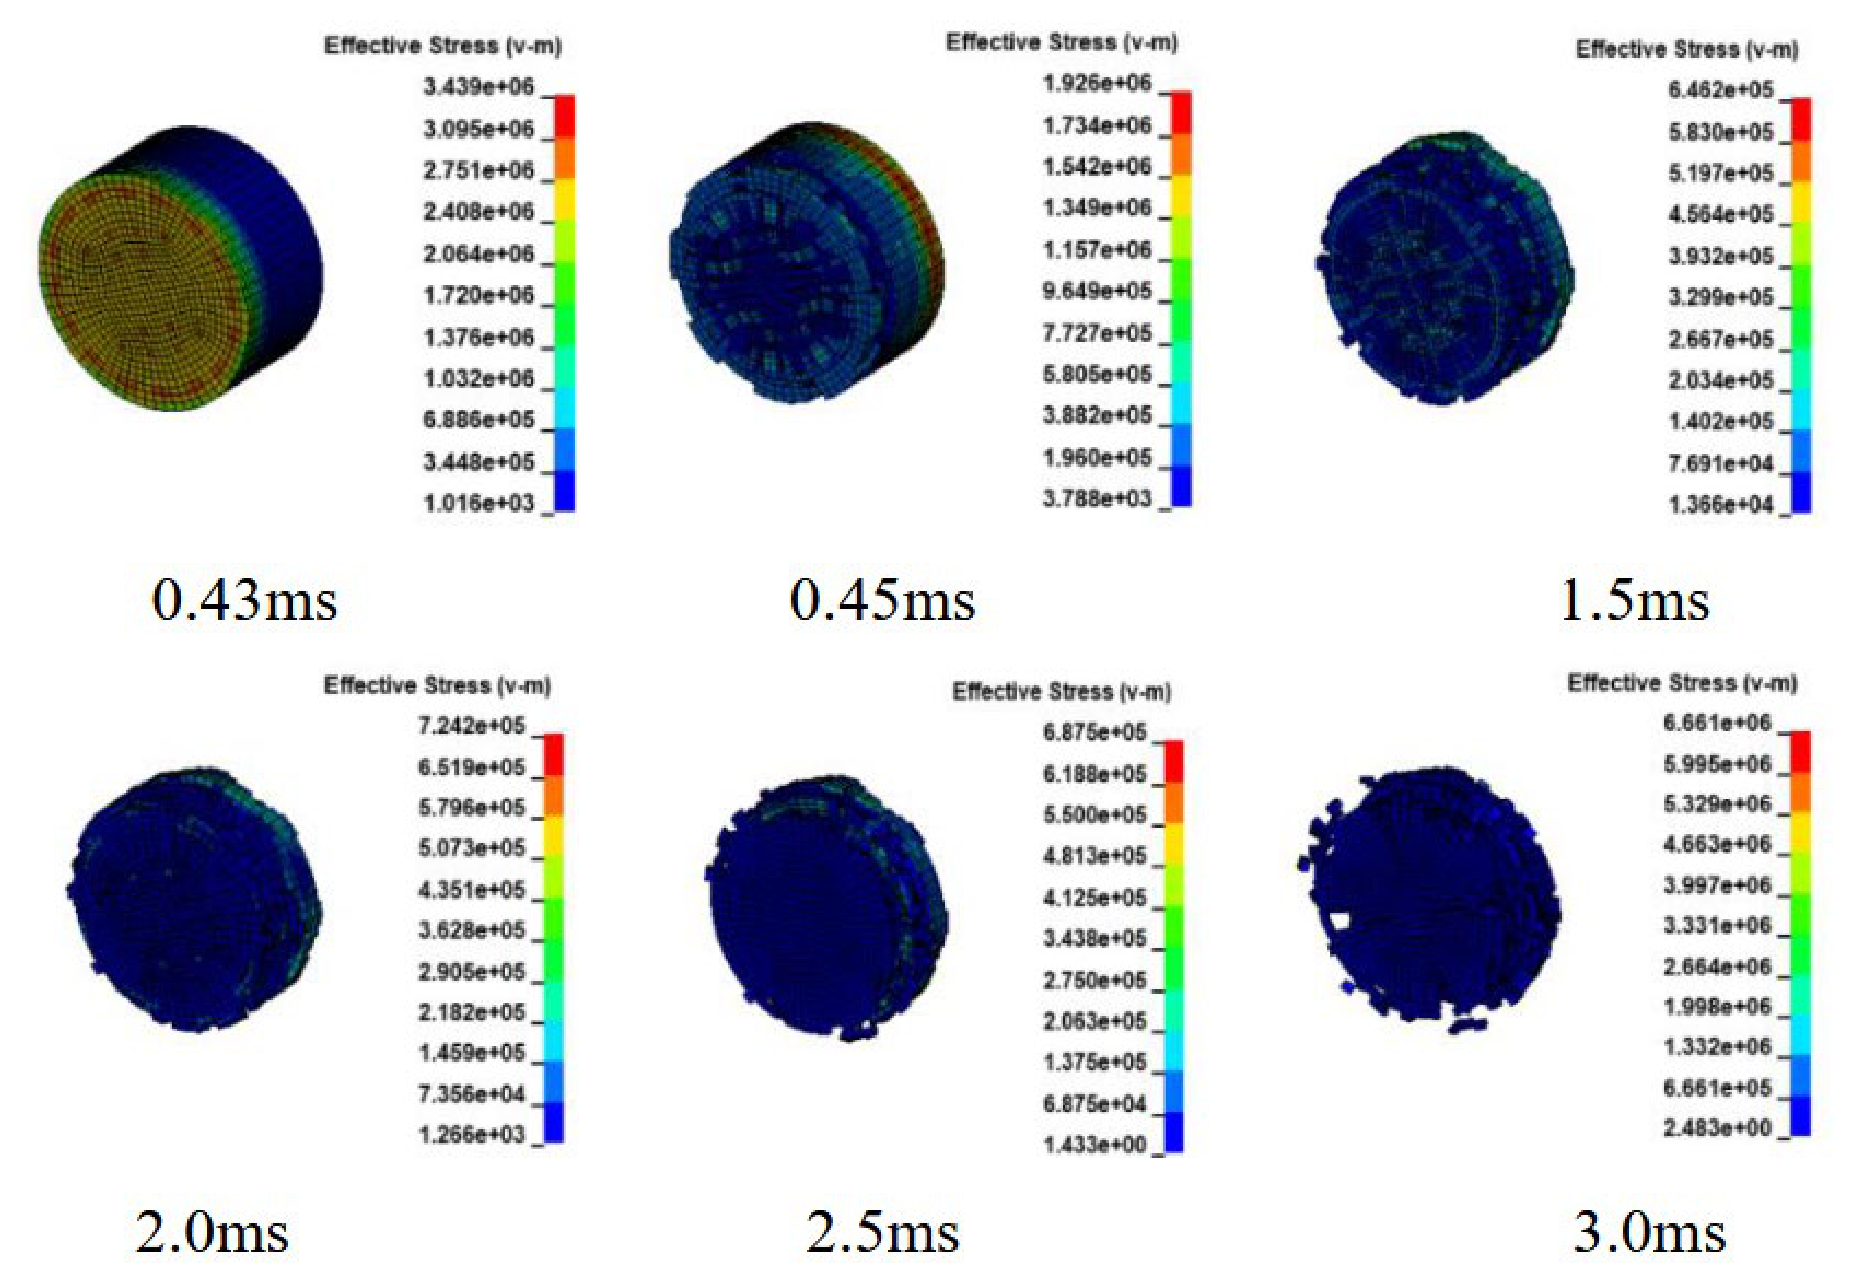
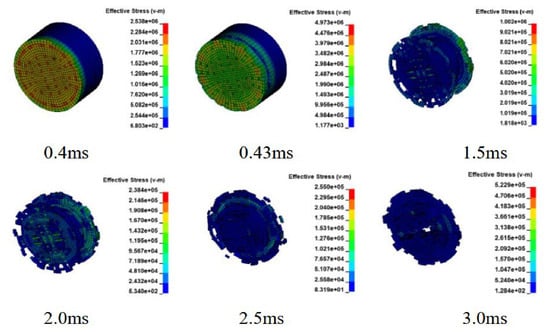
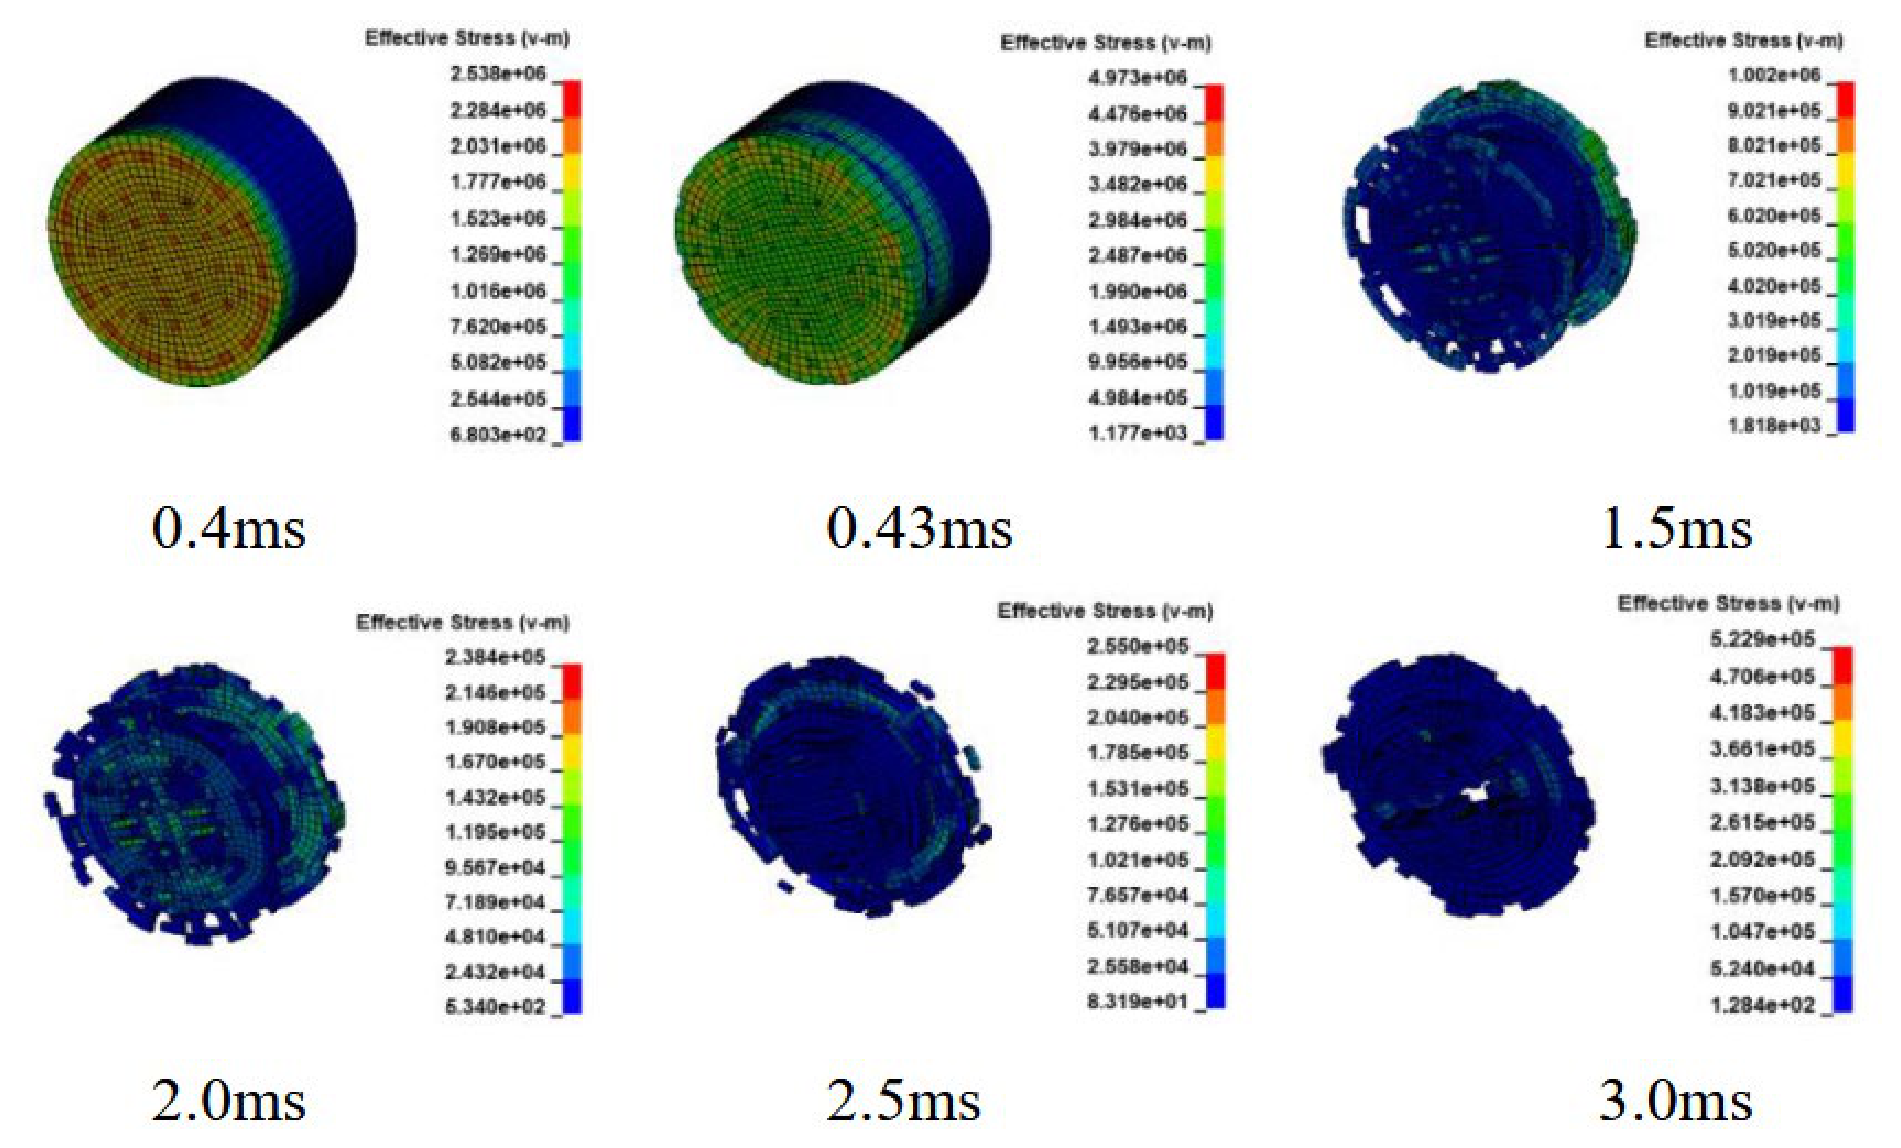
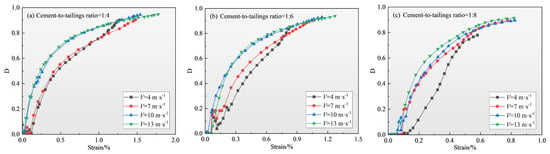
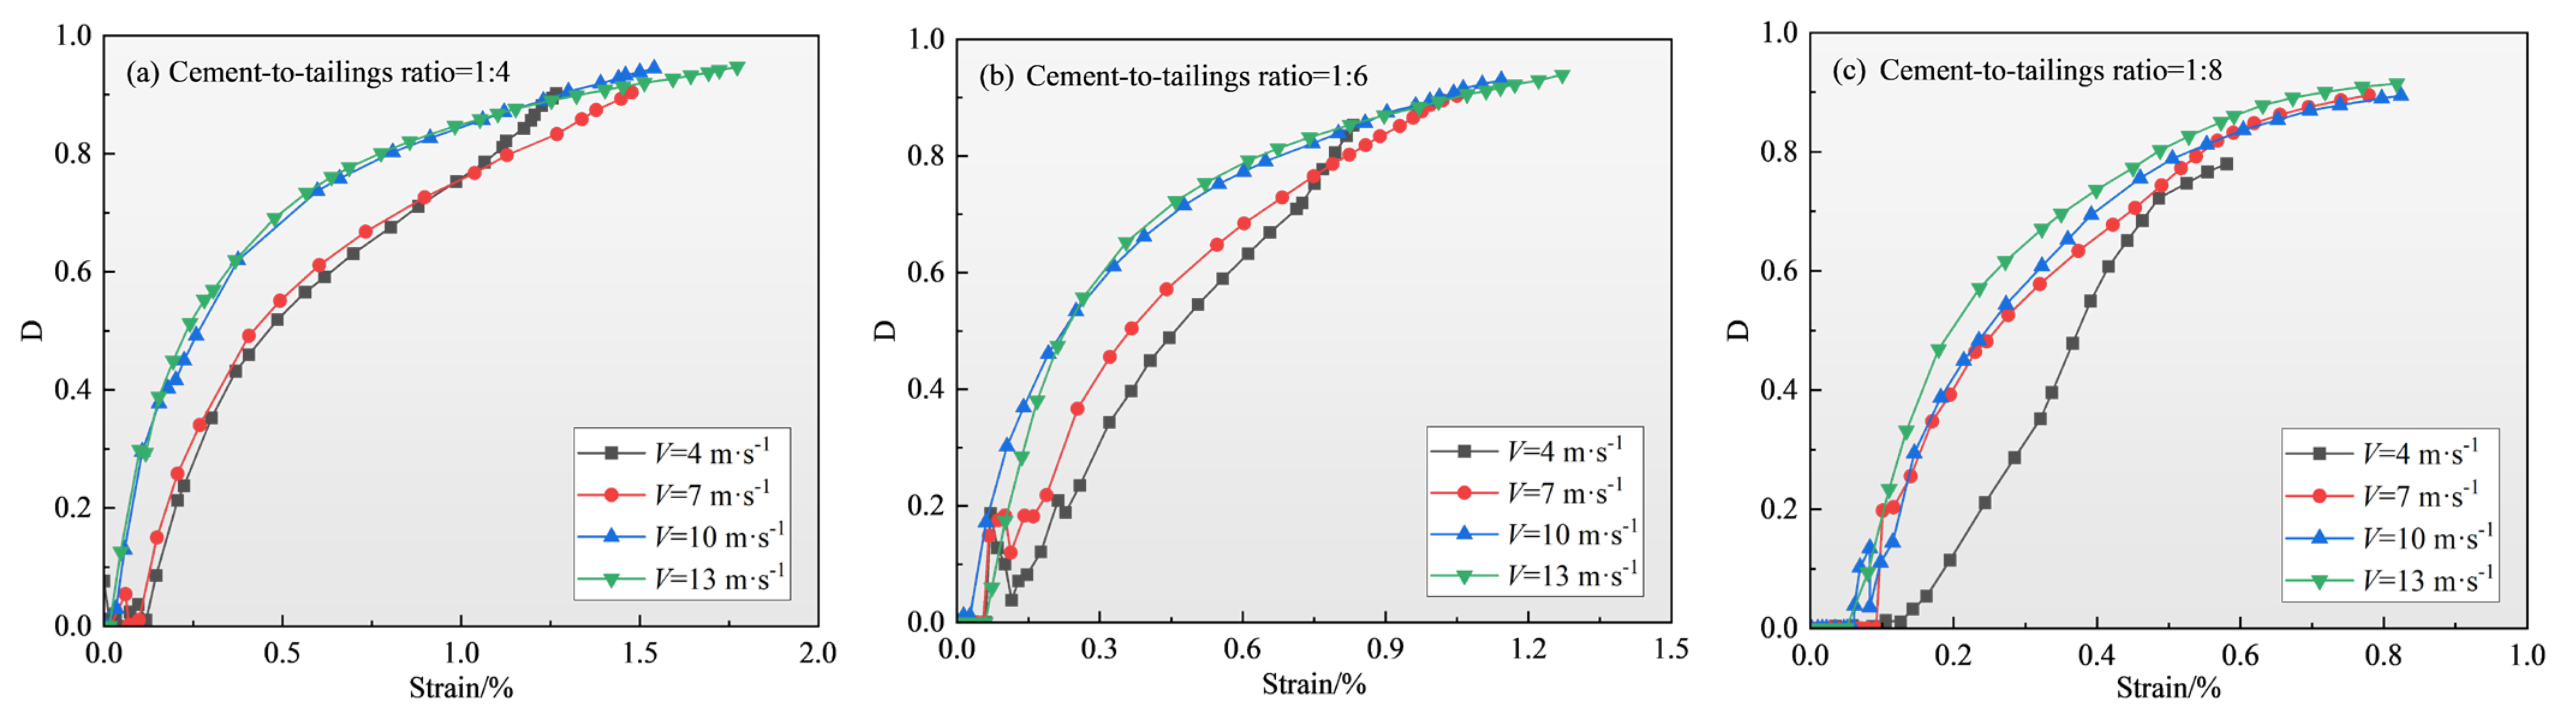
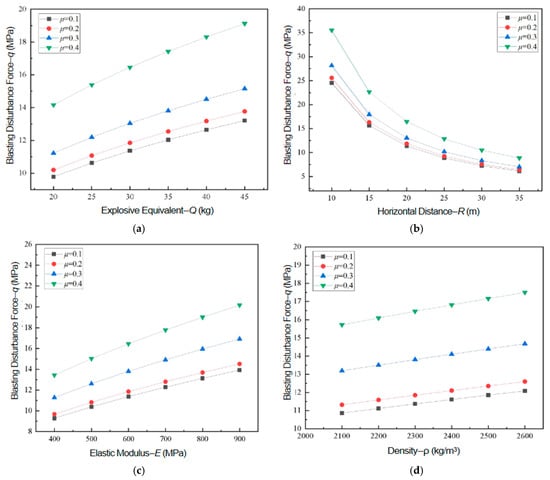
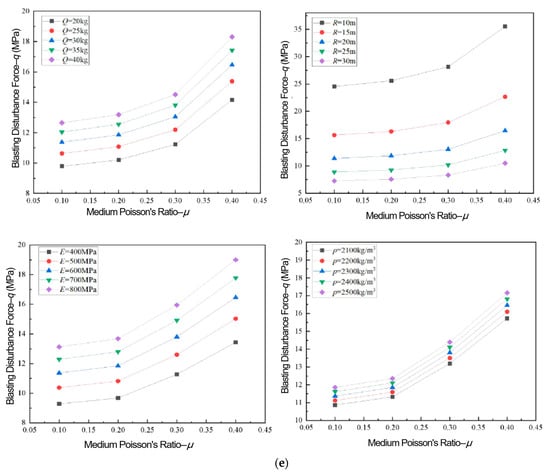
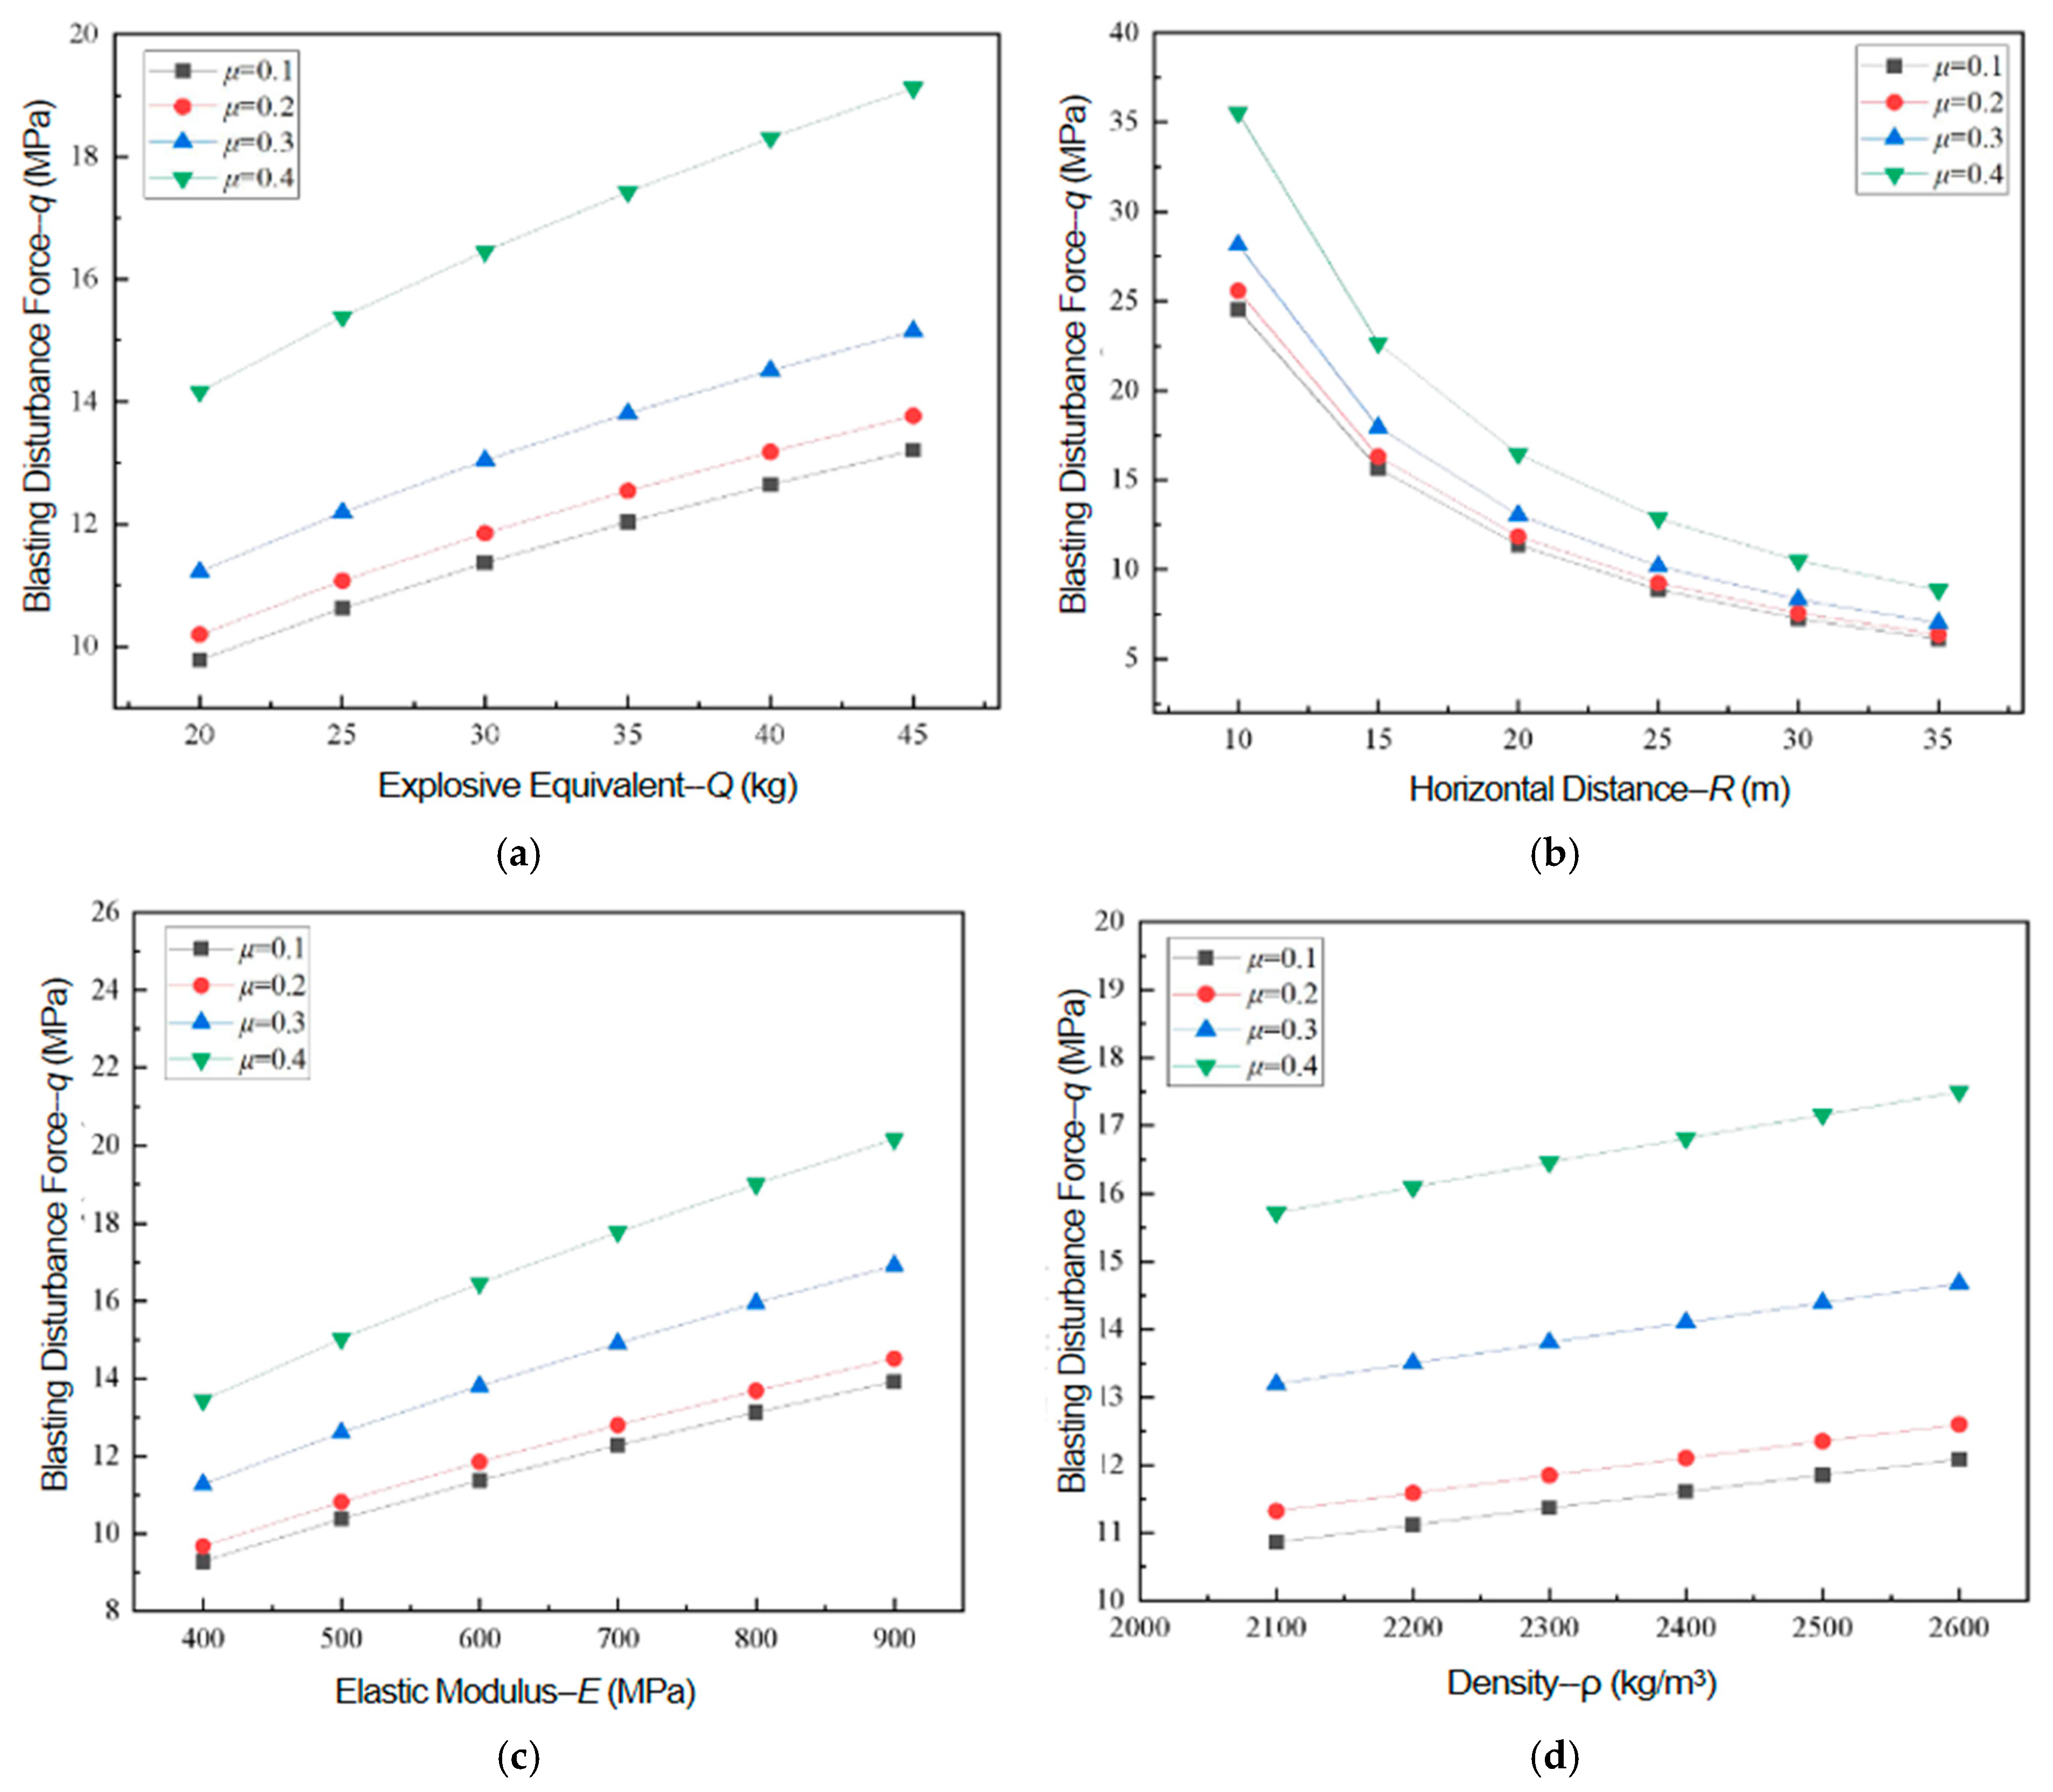
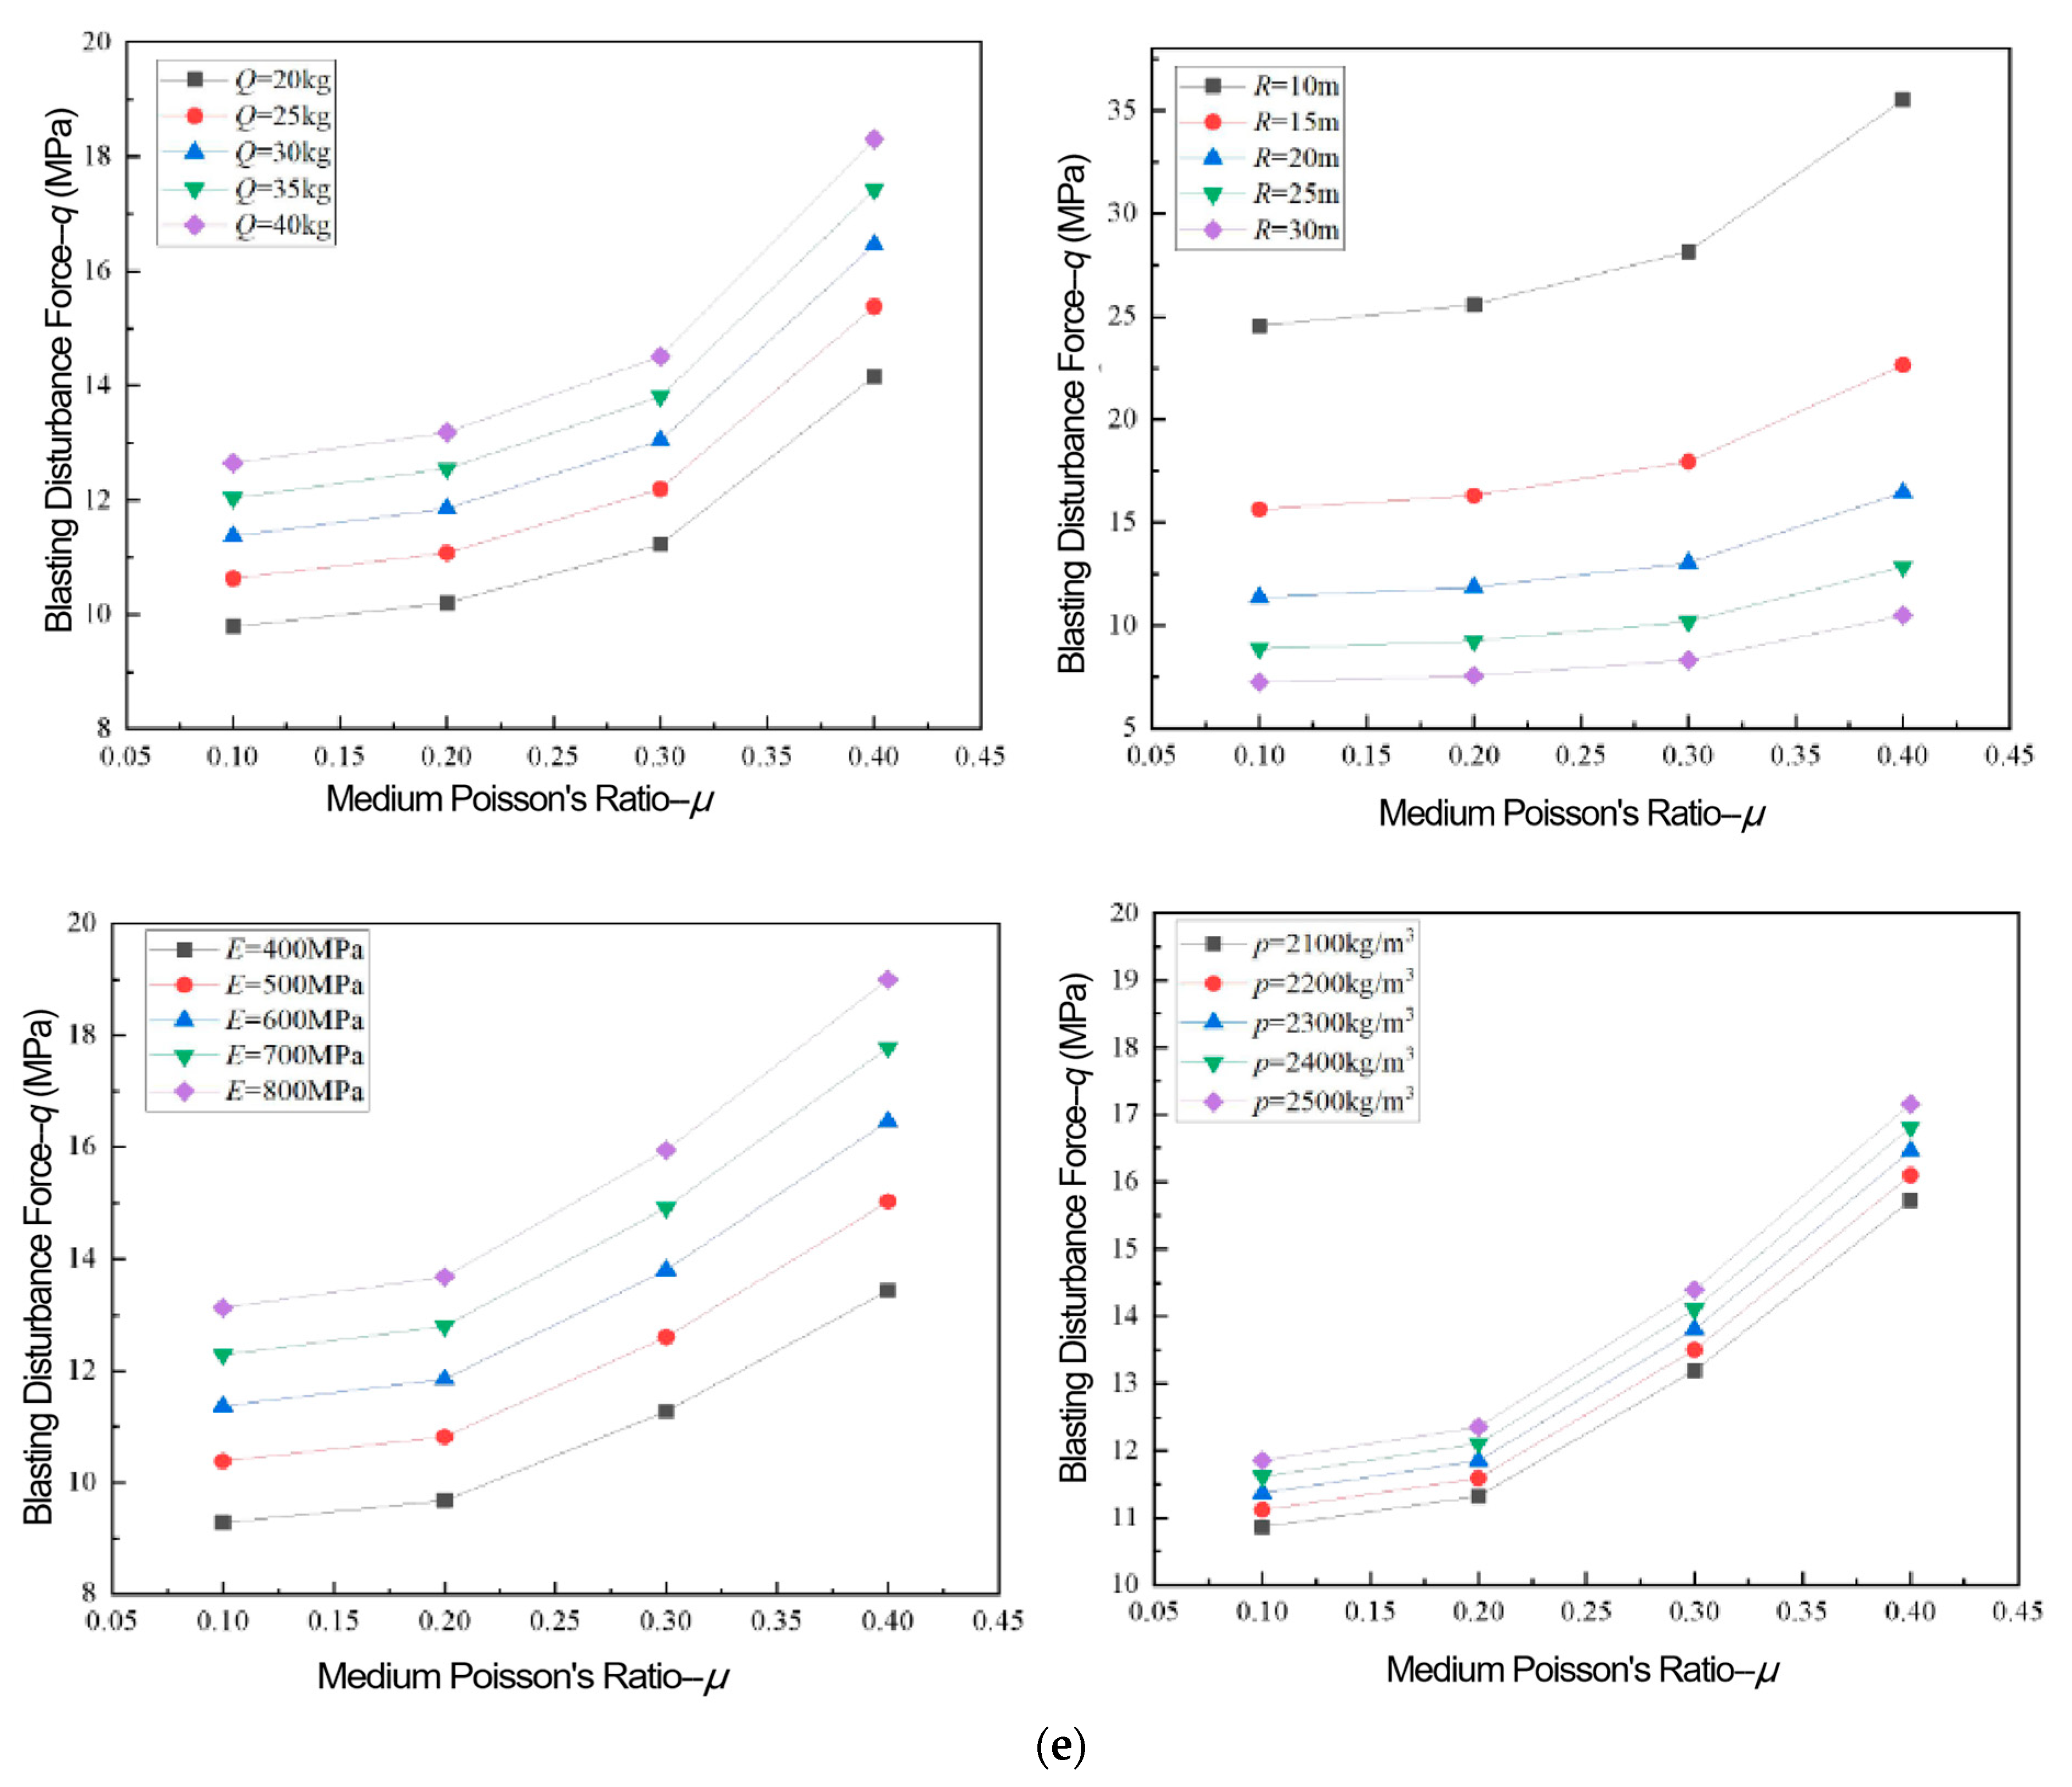
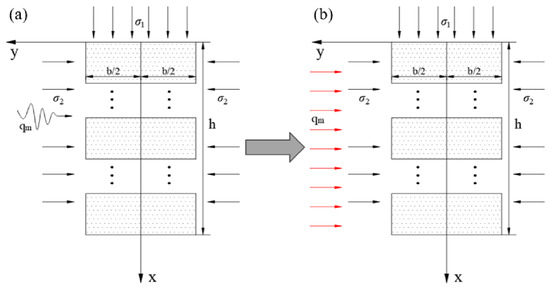
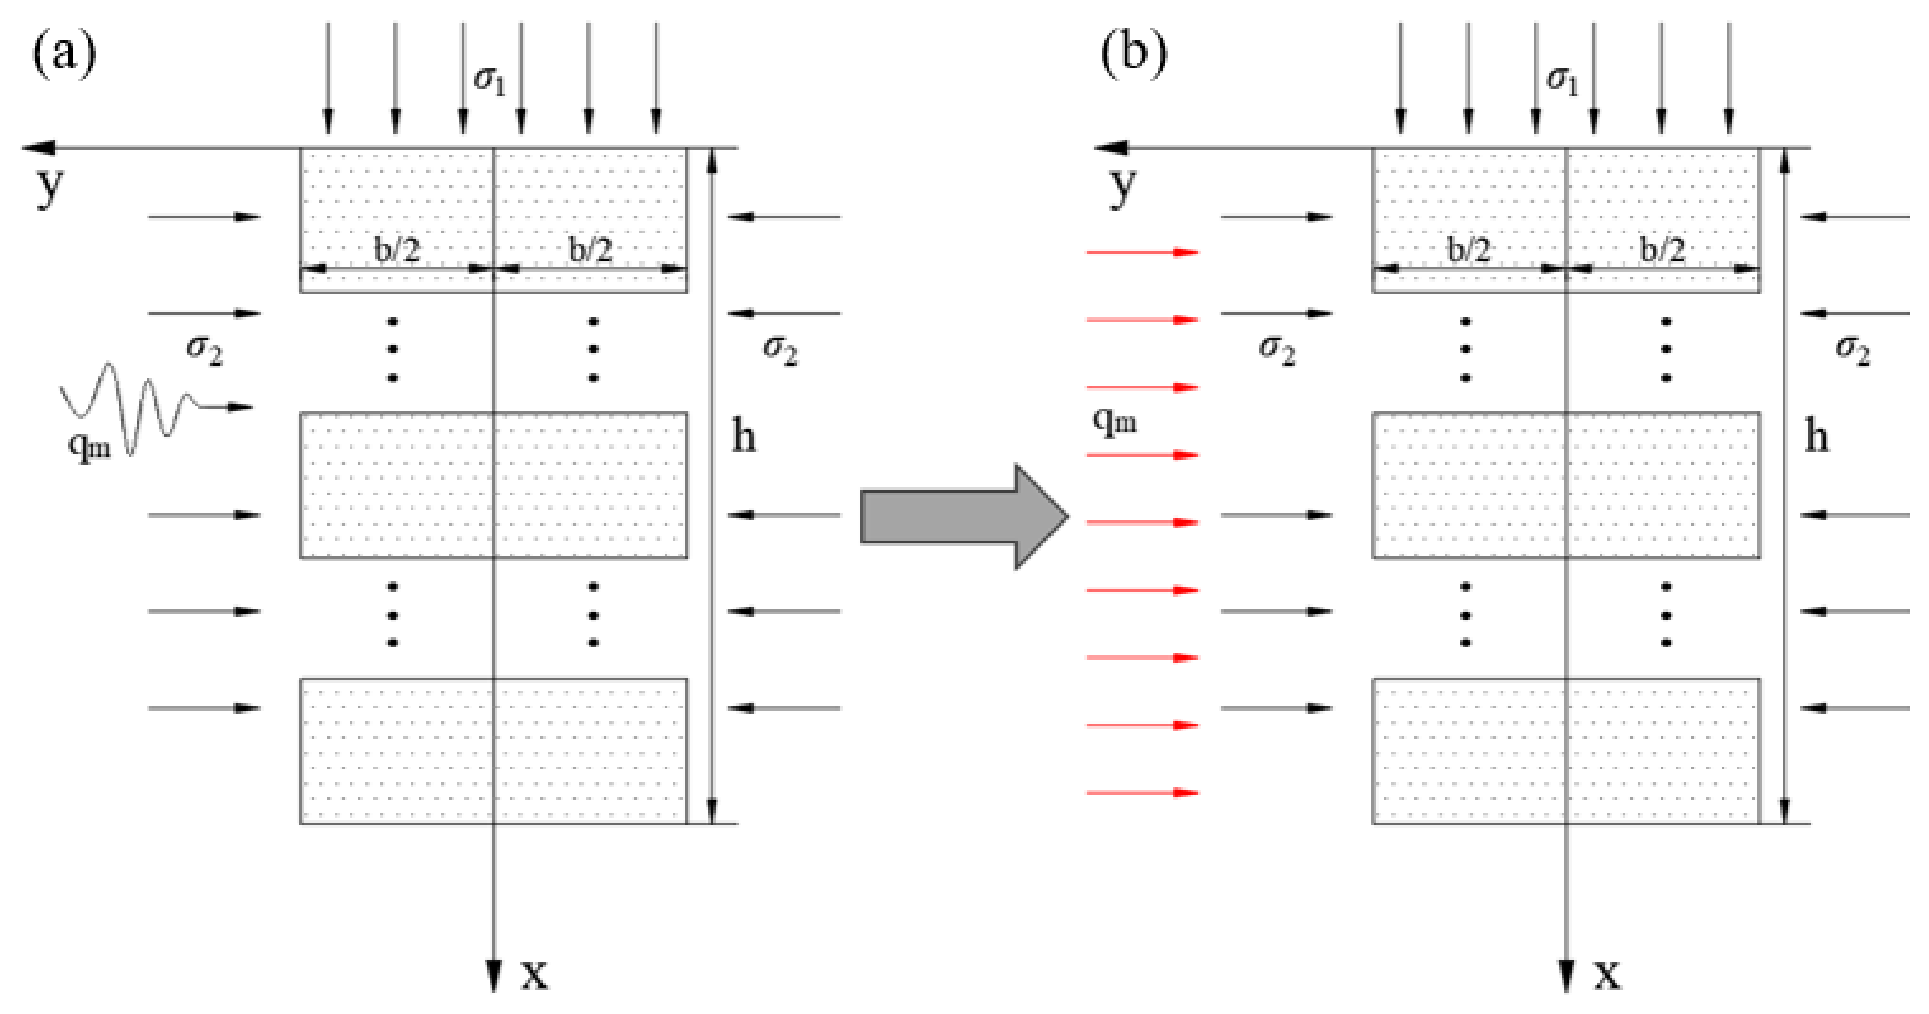
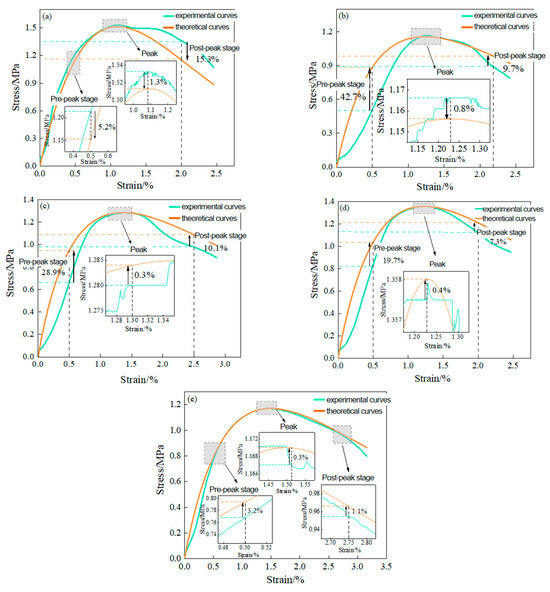
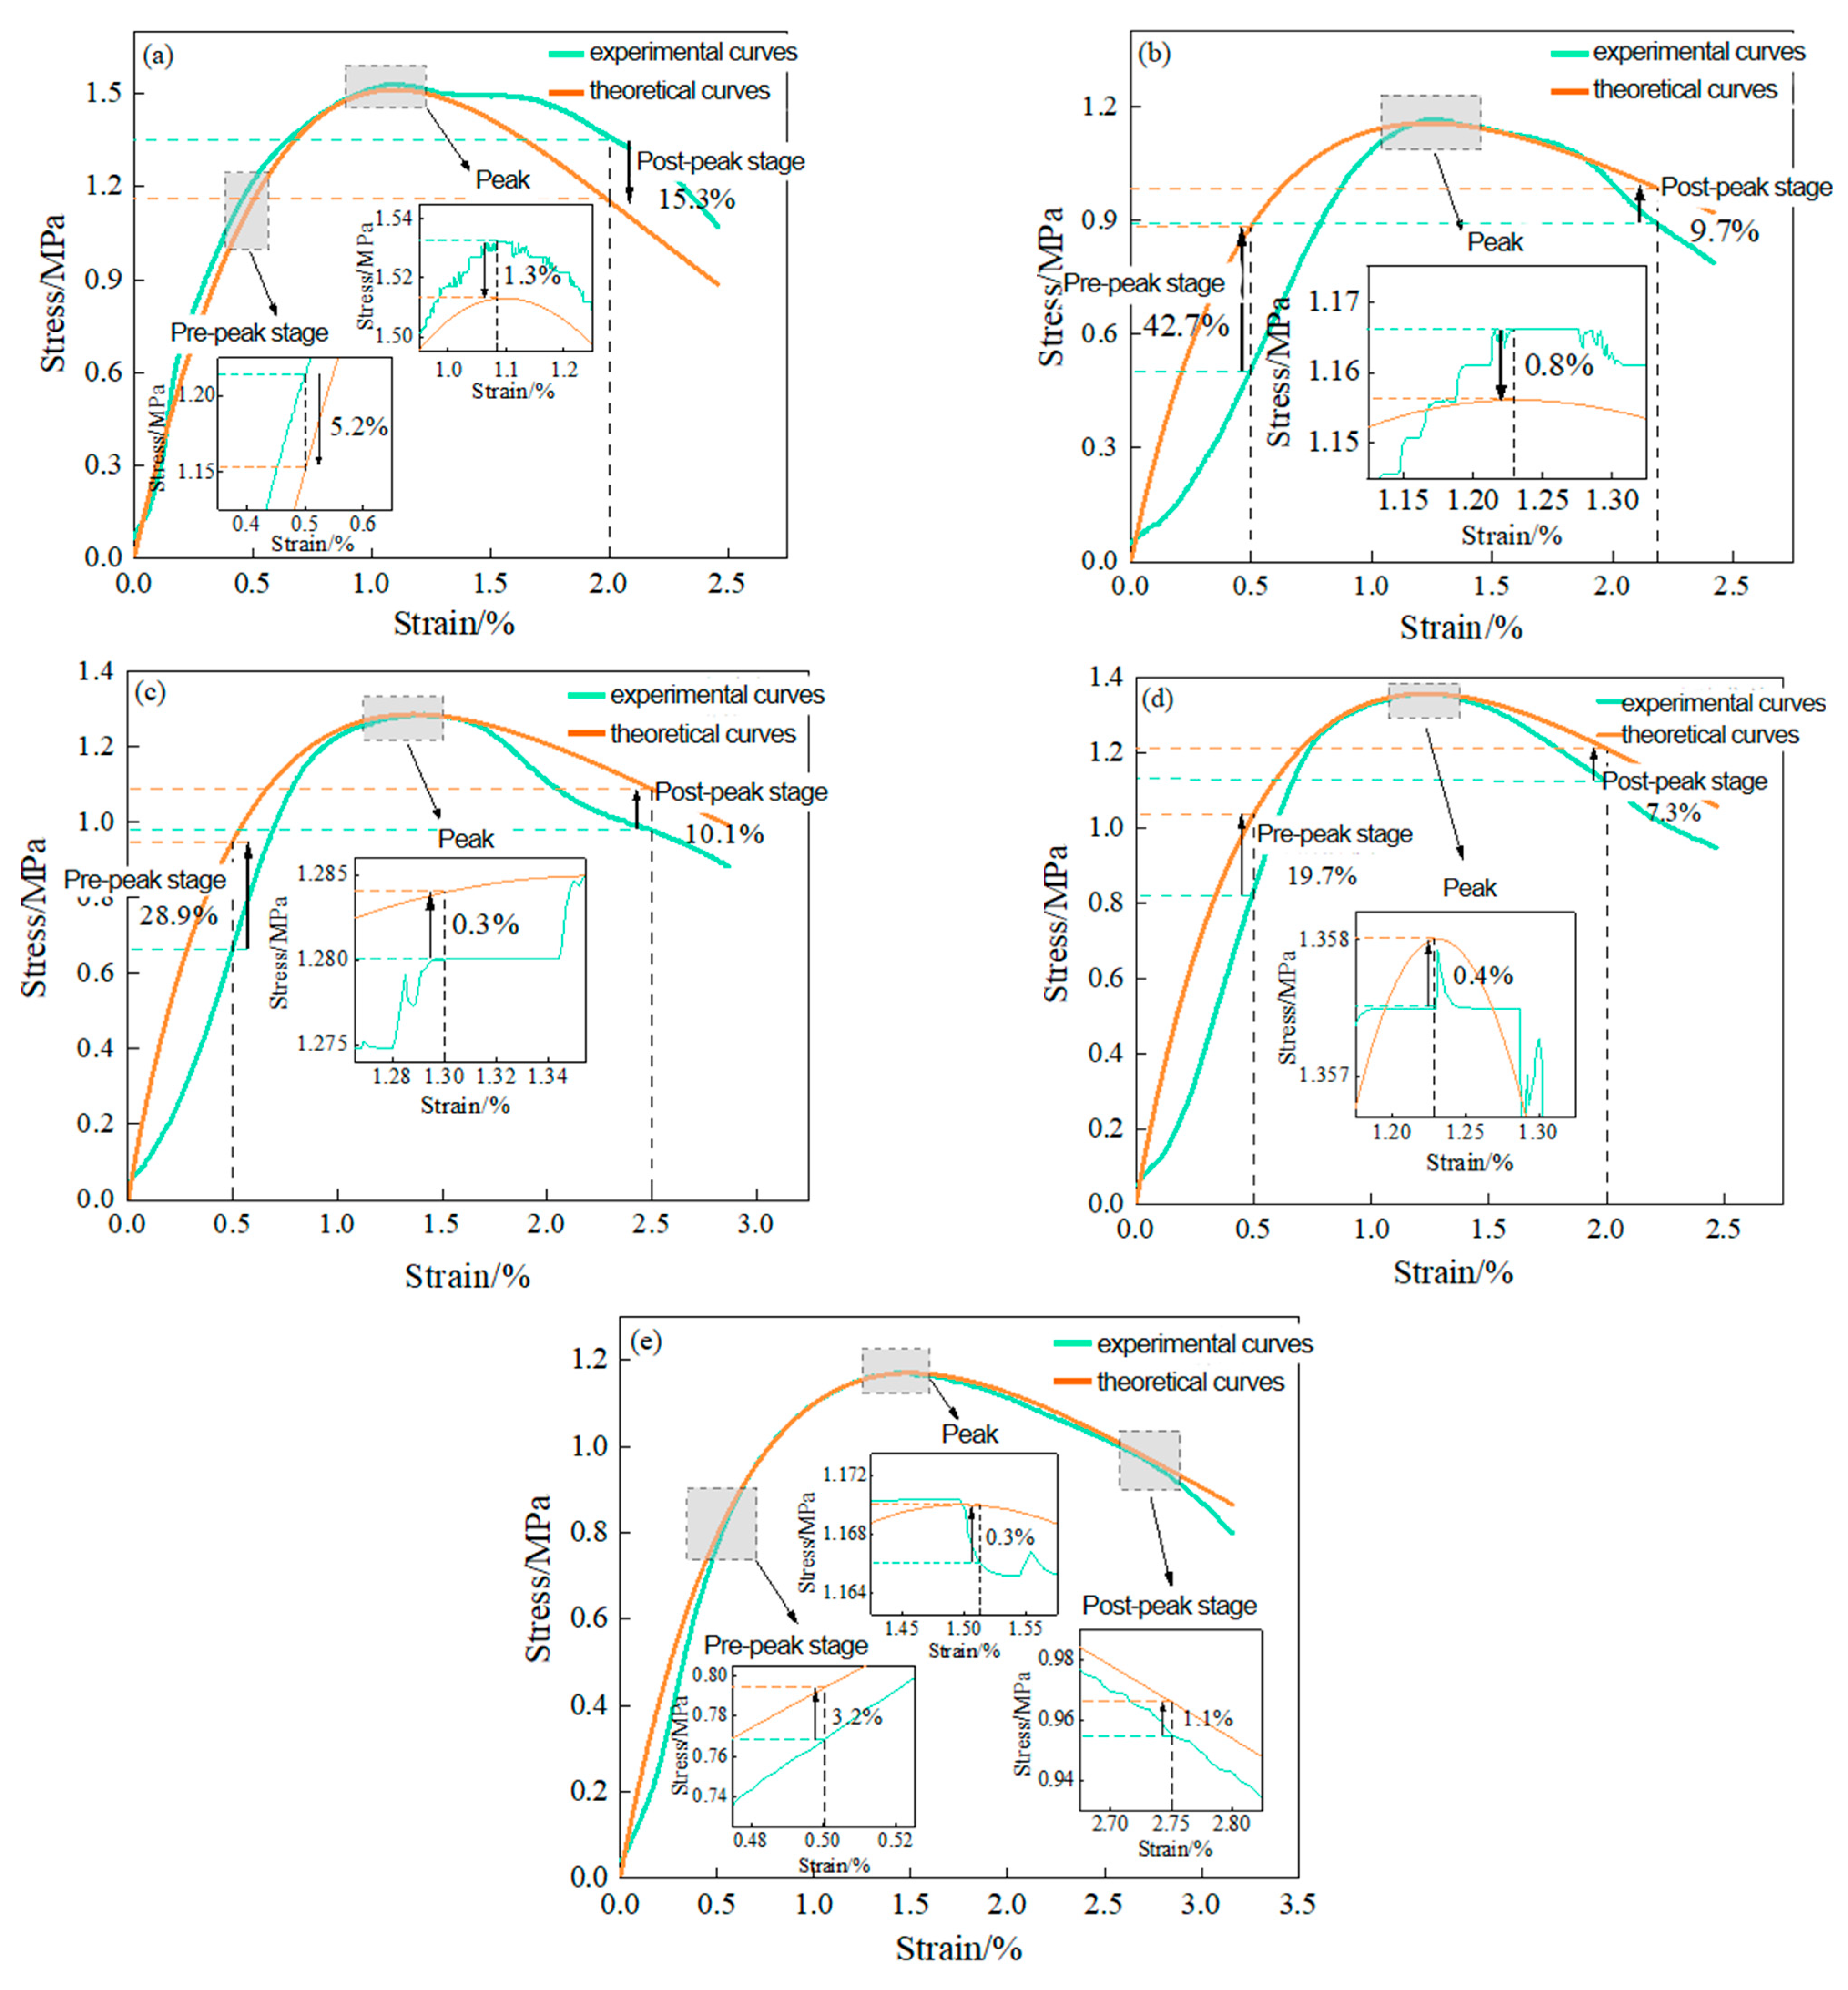
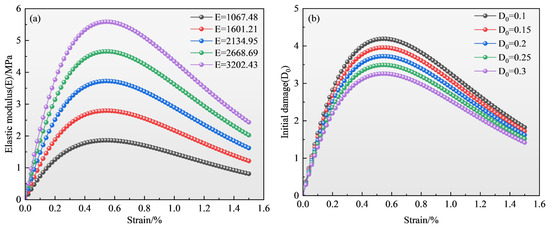
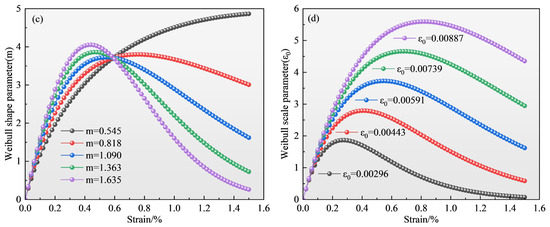
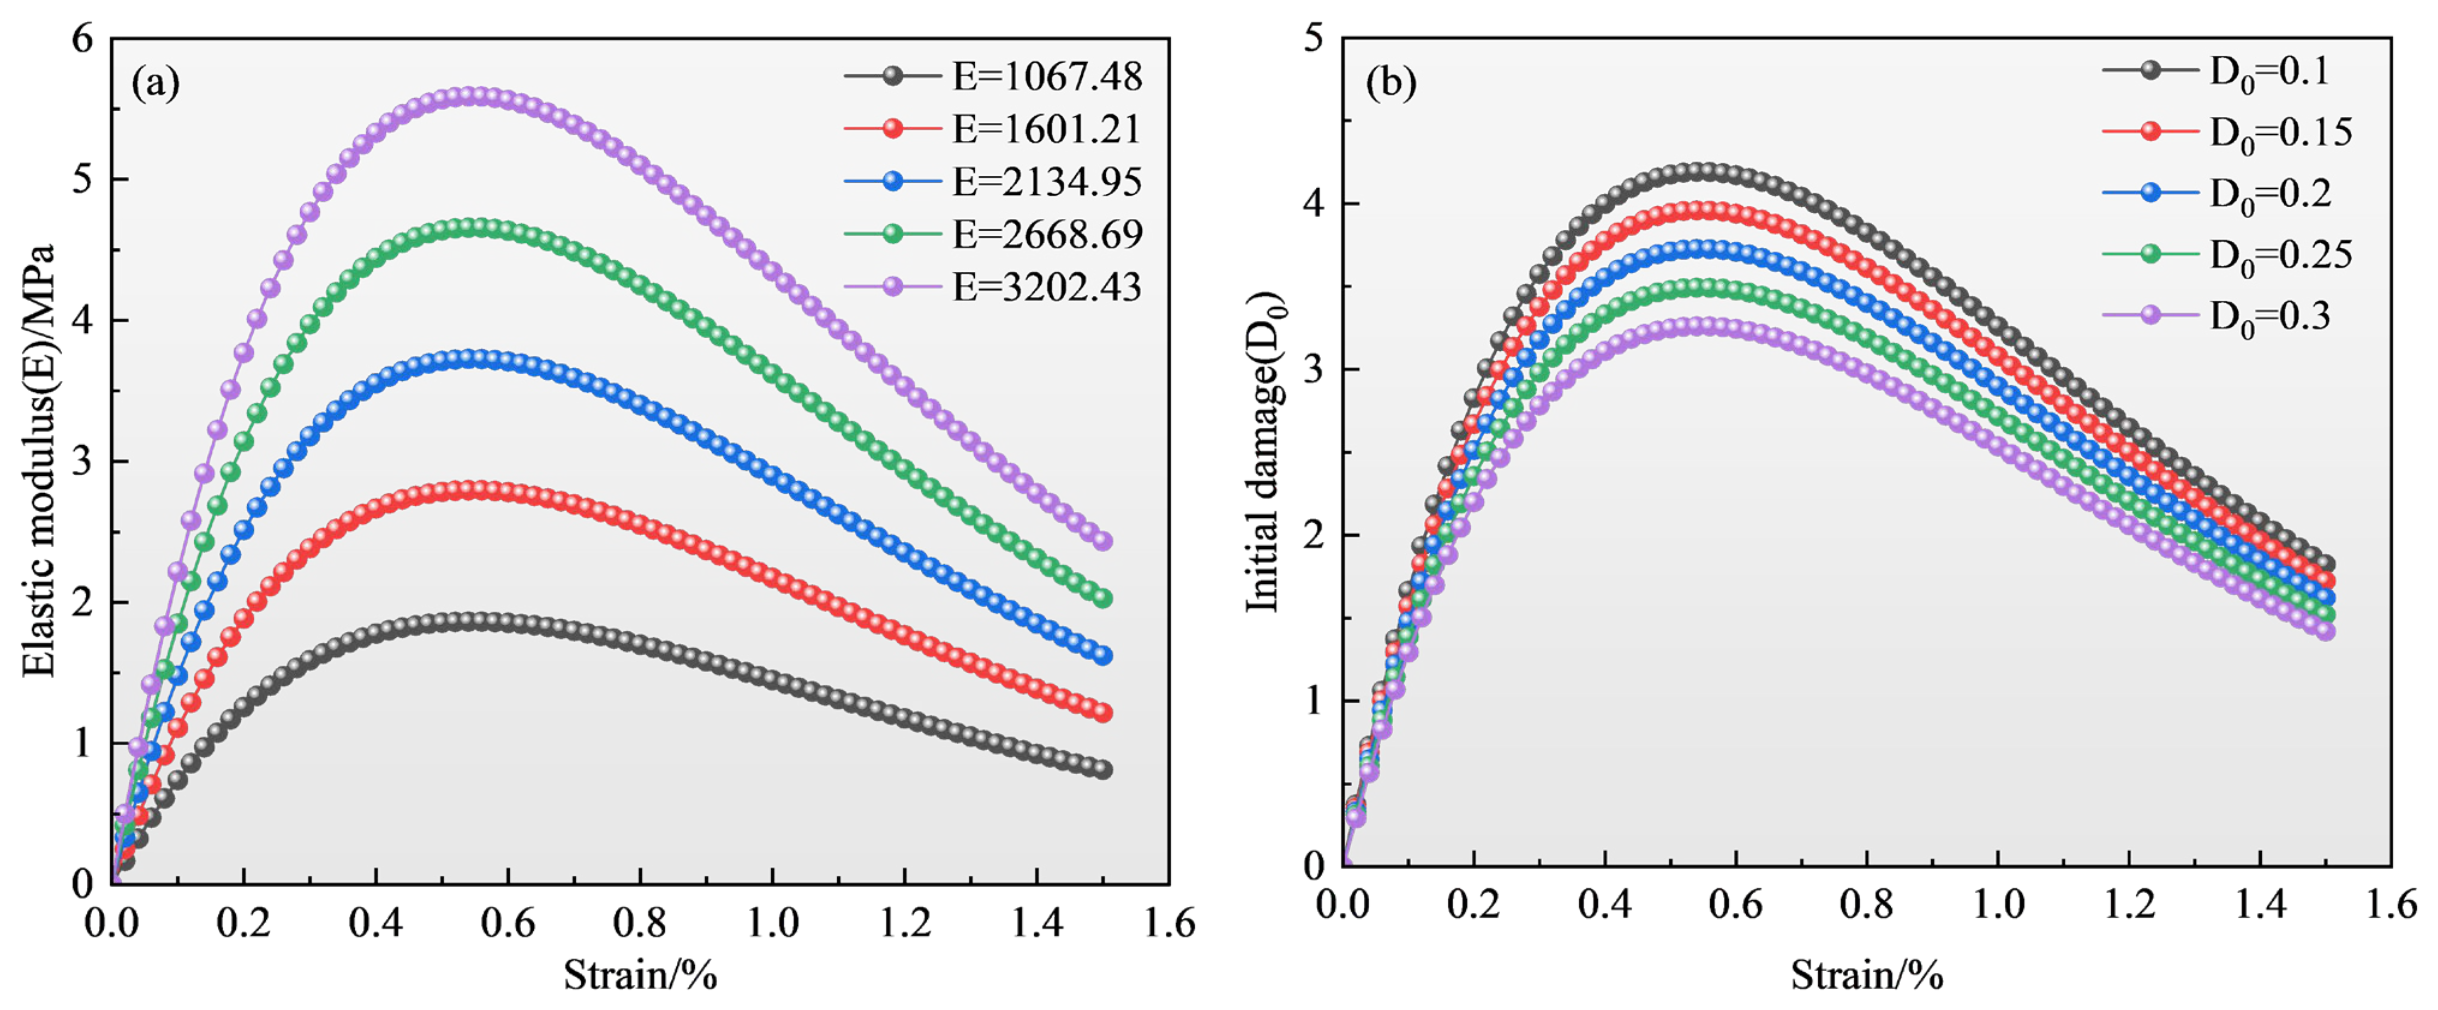
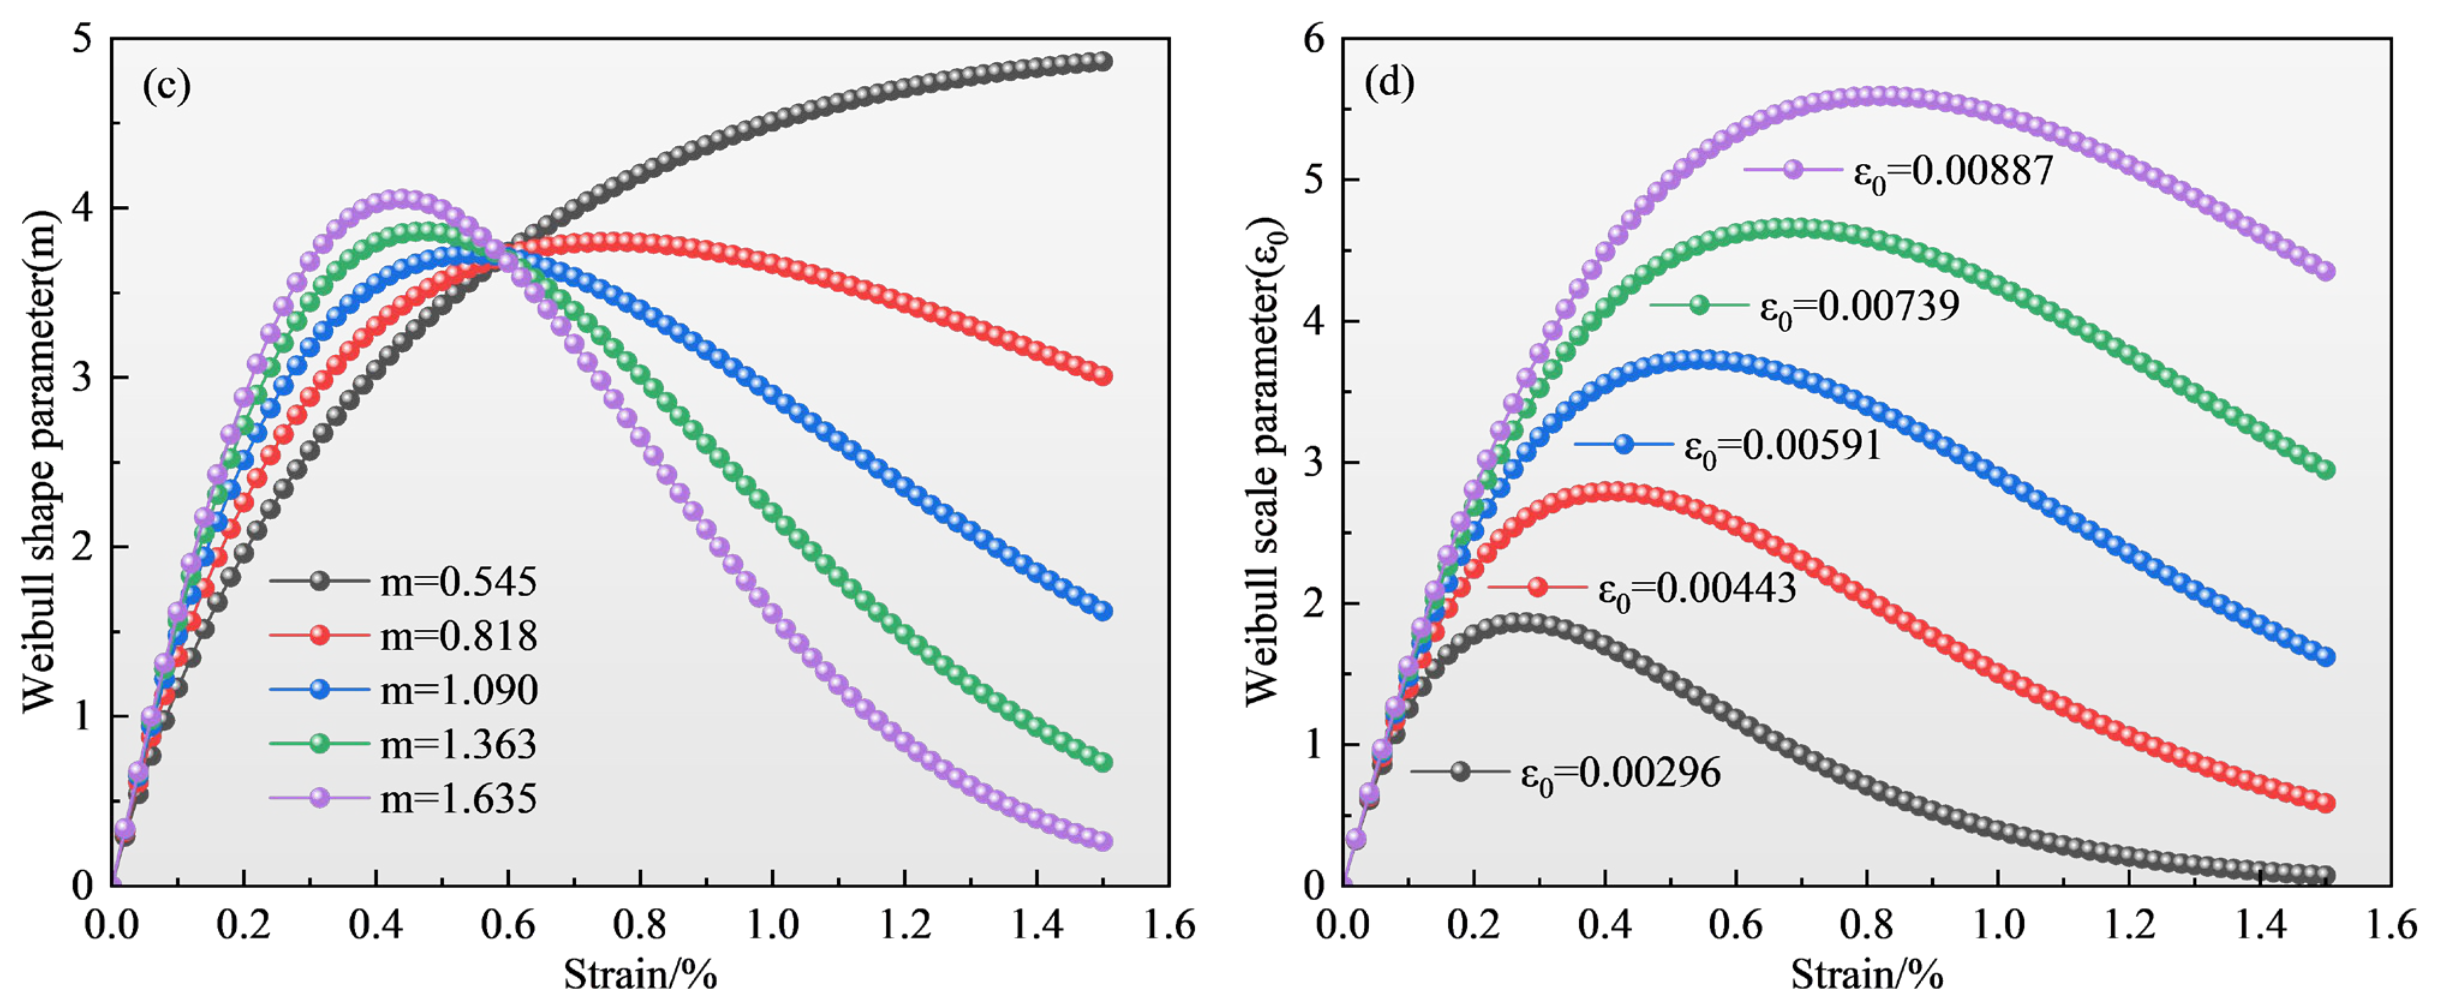

Disclaimer/Publisher’s Note: The statements, opinions and data contained in all publications are solely those of the individual author(s) and contributor(s) and not of MDPI and/or the editor(s). MDPI and/or the editor(s) disclaim responsibility for any injury to people or property resulting from any ideas, methods, instructions or products referred to in the content. |
© 2026 by the authors. Licensee MDPI, Basel, Switzerland. This article is an open access article distributed under the terms and conditions of the Creative Commons Attribution (CC BY) license.