


Abstract
Ultra-deep dolomite formations exhibit pronounced mechanical heterogeneity governed by mineral composition, inter-particle cementation, and observation scale, complicating their mechanical characterization. Because intact downhole cores are difficult to obtain, a mesoscopic numerical framework that reproduces and classifies such behavior is needed. A two-dimensional mesoscopic model of Cambrian ultra-deep dolomite from the Tarim Basin was developed using the combined finite–discrete element method, incorporating mineral composition from X-ray diffraction and scanning electron microscopy with energy-dispersive spectroscopy. A Weibull-distribution discretization scheme was introduced to represent matrix and cementation heterogeneity separately. Sensitivity analyses examined three factor groups: mineral composition and spatial distribution, matrix and cementation shape parameters, and mesh size as the observation scale. Accordingly, a three-level graded characterization framework was proposed, in which the compositional level governs strength magnitude; the structural level governs the elastic modulus, pre-peak nonlinearity and failure mode; and the scale level governs response representativeness and convergence. Quantitative grading indicators and threshold ranges were extracted for each level. Triaxial validation against laboratory experiments at confining pressures of 0 to 220 MPa confirmed strength and stress–strain response consistent with the proposed grading. The model and framework offer a transferable methodological reference for the mesoscopic mechanical evaluation of ultra-deep heterogeneous dolomite.
1. Introduction
Ultra-deep dolomite formations with burial depths greater than 6000 m have become important targets for petroleum scientific drilling and production engineering [1]. Such formations are typically characterized by high in situ stress, high pore pressure and strong rock heterogeneity [2,3,4]. Current understanding of rock mechanical behavior at these depths remains limited, and the mechanical parameters and failure descriptors required for drilling and stimulation design are still scarce. This deficit contributes to low rock-breaking efficiency, frequent wellbore instability and insufficient stimulation pressure, which collectively restrict the safe and efficient development of ultra-deep oil and gas resources [5,6,7].
The mechanical evaluation of ultra-deep dolomite is complicated by the multi-source heterogeneity of the host rock. The coexistence of varying mineral composition, multiscale pores, natural fracture networks and complex cementation textures gives rise to pronounced anisotropy in both elastic response and failure behavior [8,9,10]. For the Cambrian subsalt dolomite of the Tarim Basin, Yin et al. [11] demonstrated that integrating mechanical and petrophysical indicators into a reservoir-quality classification framework provides a practical pathway for differentiating reservoir-section behavior and guiding acid-fracturing design. Such a field-scale practice illustrates the value of organizing heterogeneous mechanical descriptors into a graded framework, yet the upstream basis at the mesoscopic scale remains underdeveloped.
Numerical simulation has become a powerful tool for investigating the mechanical behavior of heterogeneous rocks [12,13,14]. The combined finite–discrete element method (FDEM), which integrates the advantages of continuum and discontinuum approaches, has been increasingly applied to capture crack initiation, propagation and coalescence in rocks [15,16,17,18]. To incorporate mesoscopic heterogeneity into the FDEM, the Voronoi-based grain model captures polygonal mineral particles but suffers from boundary identification difficulty and limited engineering-scale applicability [19]. The Weibull-based random parameter assignment scheme, advanced by Deng et al. [20,21], offers a statistically efficient alternative. In its original form, this scheme assigns a single Weibull index to every mesoscopic property. Matrix stiffness and cement strength therefore cannot be represented as two independent sources of heterogeneity. Recent FDEM heterogeneity studies, however, have largely addressed individual factors in isolation, such as the sensitivity to fracture energies [22], the influence of heterogeneity on the fracture process zone [23], or the effect of a single mineral phase [24]. A unified framework that systematically organizes mineralogical, structural and scale-related heterogeneity into a transferable grading template, with quantitative behavioral thresholds for each level, is still lacking and constitutes the central motivation of the present study.
The main novelty of this work is the reorganization of mineralogical, structural and scale-related heterogeneity into a single hierarchical framework with explicit, figure-traceable thresholds, rather than treating these factors as parallel, isolated effects. The resulting grading template, transferable to other mineralogically heterogeneous deep rocks, constitutes the principal methodological contribution of the present study. Table 1 contrasts the present framework with representative DEM and FDEM heterogeneity studies.
Table 1.
Comparison of the present framework with representative DEM and FDEM heterogeneity studies.
2. Methodology
2.1. Combined Finite–Discrete Element Method
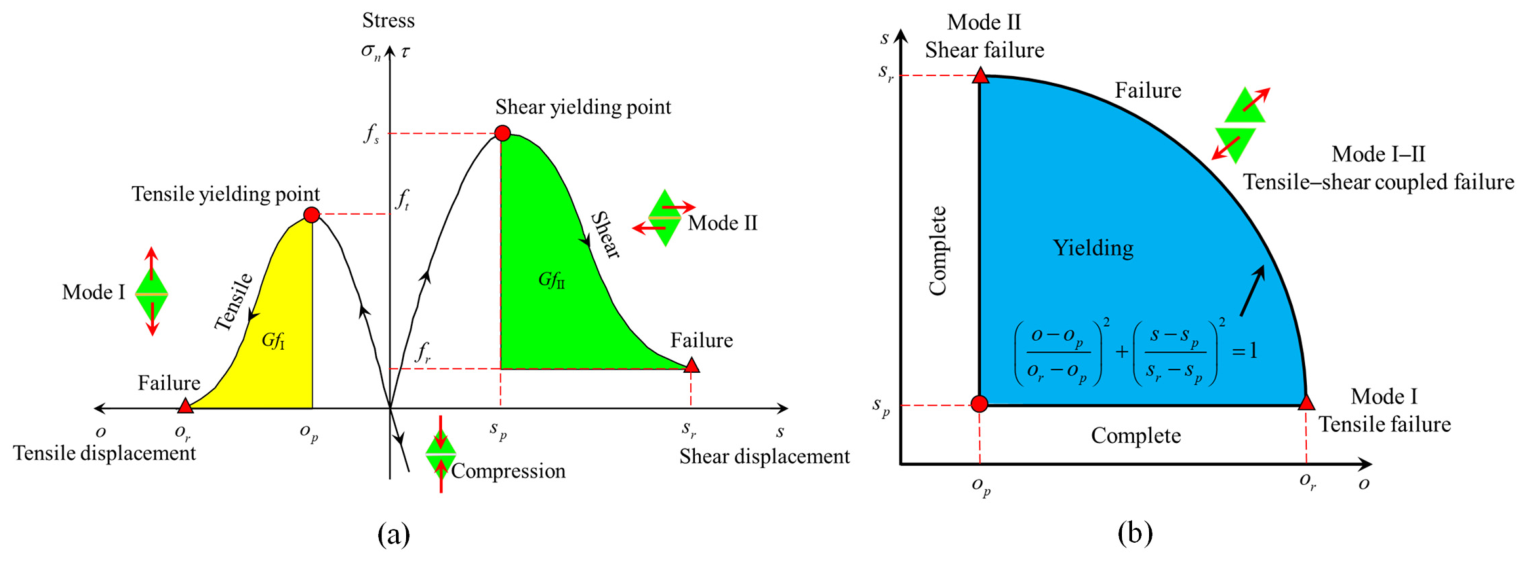
The combined finite–discrete element method (FDEM), originally proposed by Munjiza [15,25] and implemented in the Y-Geo code with the Y-GUI preprocessor (Grasselli’s Geomechanics Group, University of Toronto, Toronto, ON, Canada; source code available at https://geogroup.utoronto.ca/software/, accessed on 24 April 2026) by Mahabadi et al. [16,26], integrates the continuum description of intact material with the discontinuum description of fracturing. Initially thicknessless quadrilateral cohesive elements are inserted between adjacent triangular finite elements (Figure 1), and the transition from continuum to discontinuum is realized through the deformation and failure of these cohesive elements. Three failure modes are distinguished according to the local normal stress and the relative displacement of the crack edges: tensile failure (Mode I), shear failure (Mode II) and mixed tensile–shear failure (Mode I–II). Each mode is governed by a strain-hardening stage before the peak and a strain-softening stage after it. At each stage, the normal stress transmitted by a cohesive element is given by Equation (1), and the corresponding shear stress by Equation (2). For the tension–shear and compression–shear states, the post-peak shear stress is modeled with a continuous pre-peak to post-peak transition and a residual shear stress. The complete derivation of the cohesive constitutive model follows Munjiza [15], Mahabadi et al. [16] and Lisjak et al. [27]. Each cohesive-element failure is additionally recorded as one acoustic emission (AE) event, providing a discrete record of microcracking activity during loading. The AE recorded here is therefore a cumulative count of these failures. It is an event count only, and does not represent the released energy or the magnitude of each event.
Figure 1.
Constitutive relationship and failure criterion of FDEM cohesive elements: (a) Mode I tensile failure (left) and Mode II shear failure (right); (b) Mode I–II tensile–shear coupled failure. Yellow and green shaded areas in (a), fracture energy dissipated under Mode I (GfI) and Mode II (GfII) failure, respectively; blue shaded area in (b), fracture energy dissipated under the coupled Mode I–II failure envelope.
2.2. Heterogeneous Properties of Ultra-Deep Dolomite
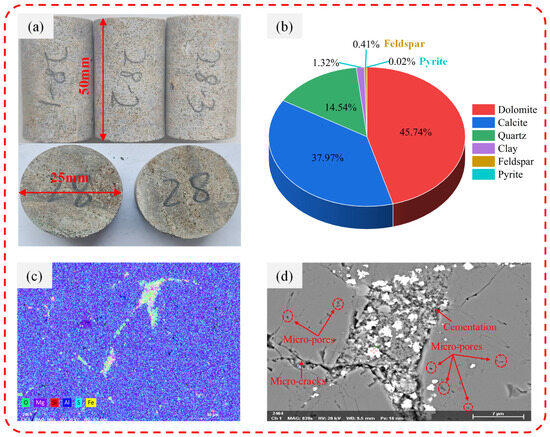
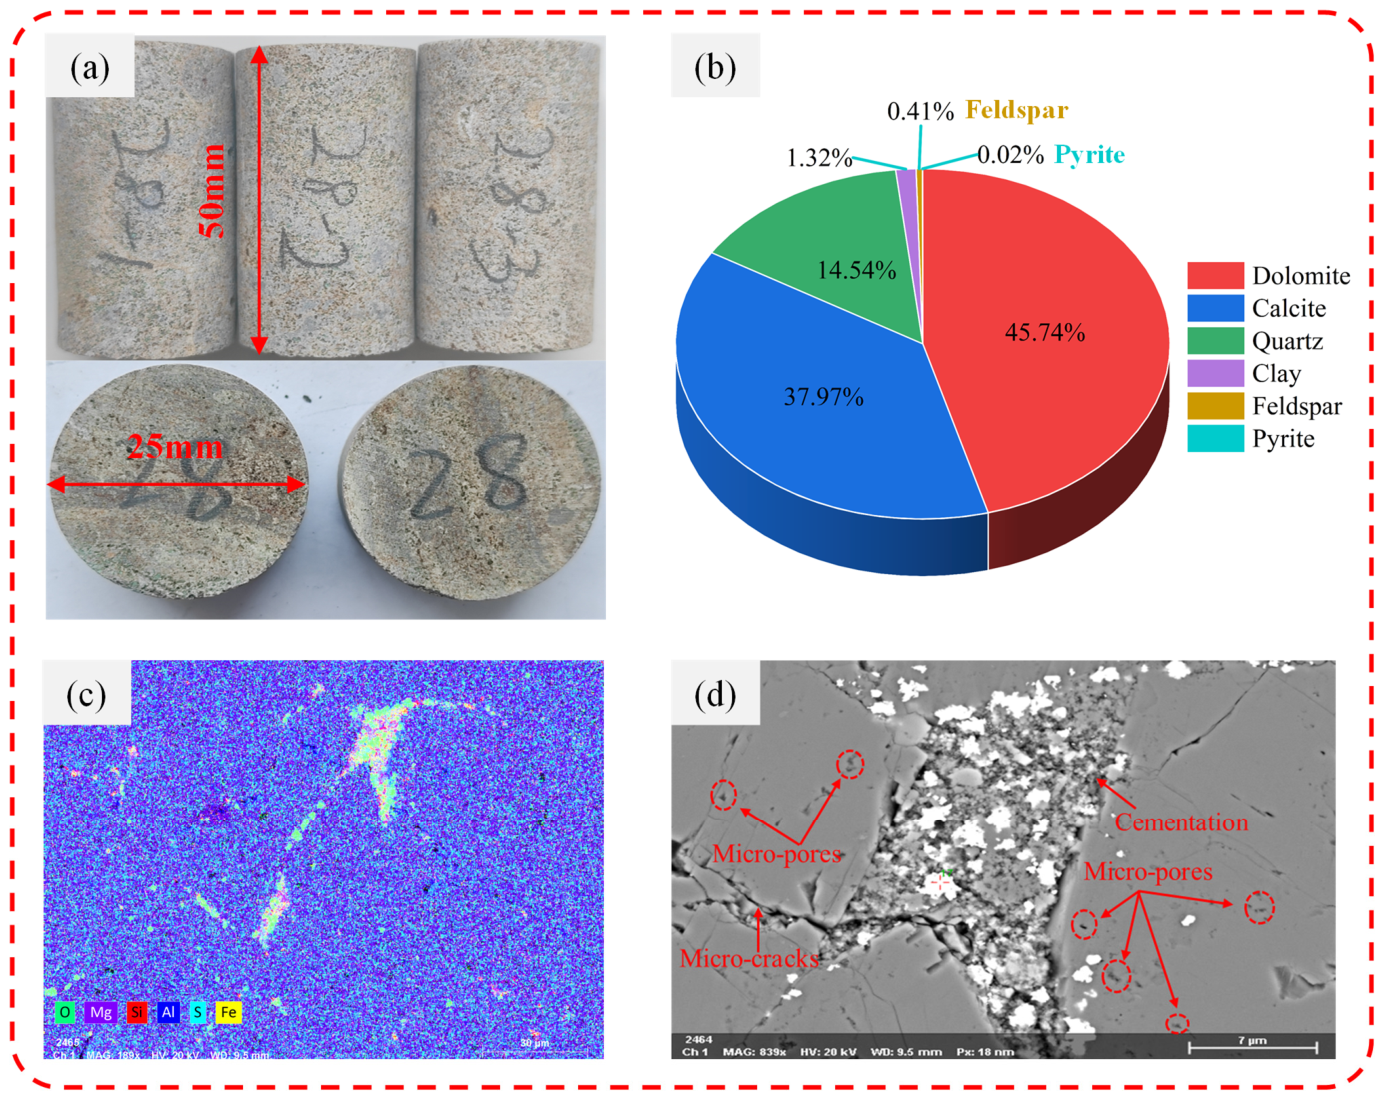
The dolomite studied here was sampled from the Cambrian section at 8715 to 8720 m in the Tarim Basin, where the wellbore rock mass is poorly stable and complex drilling accidents occur frequently. X-ray diffraction on the cores gives a mineral composition of 45.74% dolomite, 37.97% calcite, 14.54% quartz, 1.32% clay minerals, 0.41% feldspar and 0.02% pyrite, so dolomite, calcite and quartz are the three dominant minerals (Figure 2b). Pronounced differences in density and acoustic velocity among the recovered blocks confirm that heterogeneity is an intrinsic characteristic of this rock. Scanning electron microscopy with energy-dispersive spectroscopy (Figure 2c,d) reveals a densely packed yet heterogeneous microstructure. Closely embedded dolomite crystals build a stable stress-transfer skeleton, whereas microcracks, pores and localized secondary mineral filling are unevenly distributed between regions. This dense but heterogeneous fabric provides an efficient load-bearing system and implies a complex mechanical response.
Figure 2.
Mineral composition and microstructure of the heterogeneous dolomite specimens: (a) specimens; (b) mineral composition (pyrite accounts for 0.02%); (c) energy-dispersive spectroscopy mapping; (d) scanning electron microscopy image.
3. Mesoscopic Heterogeneous Dolomite Model
3.1. Model Construction
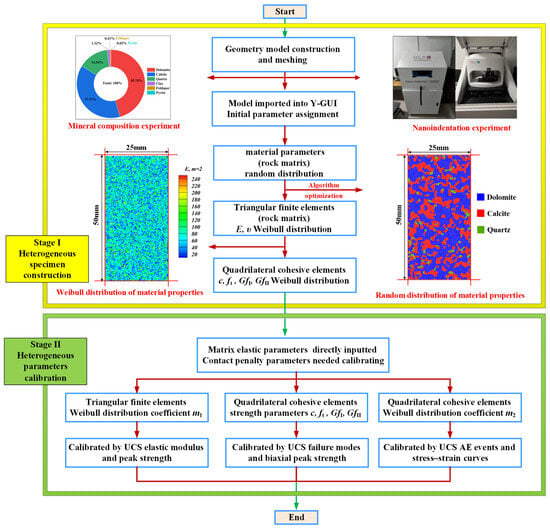
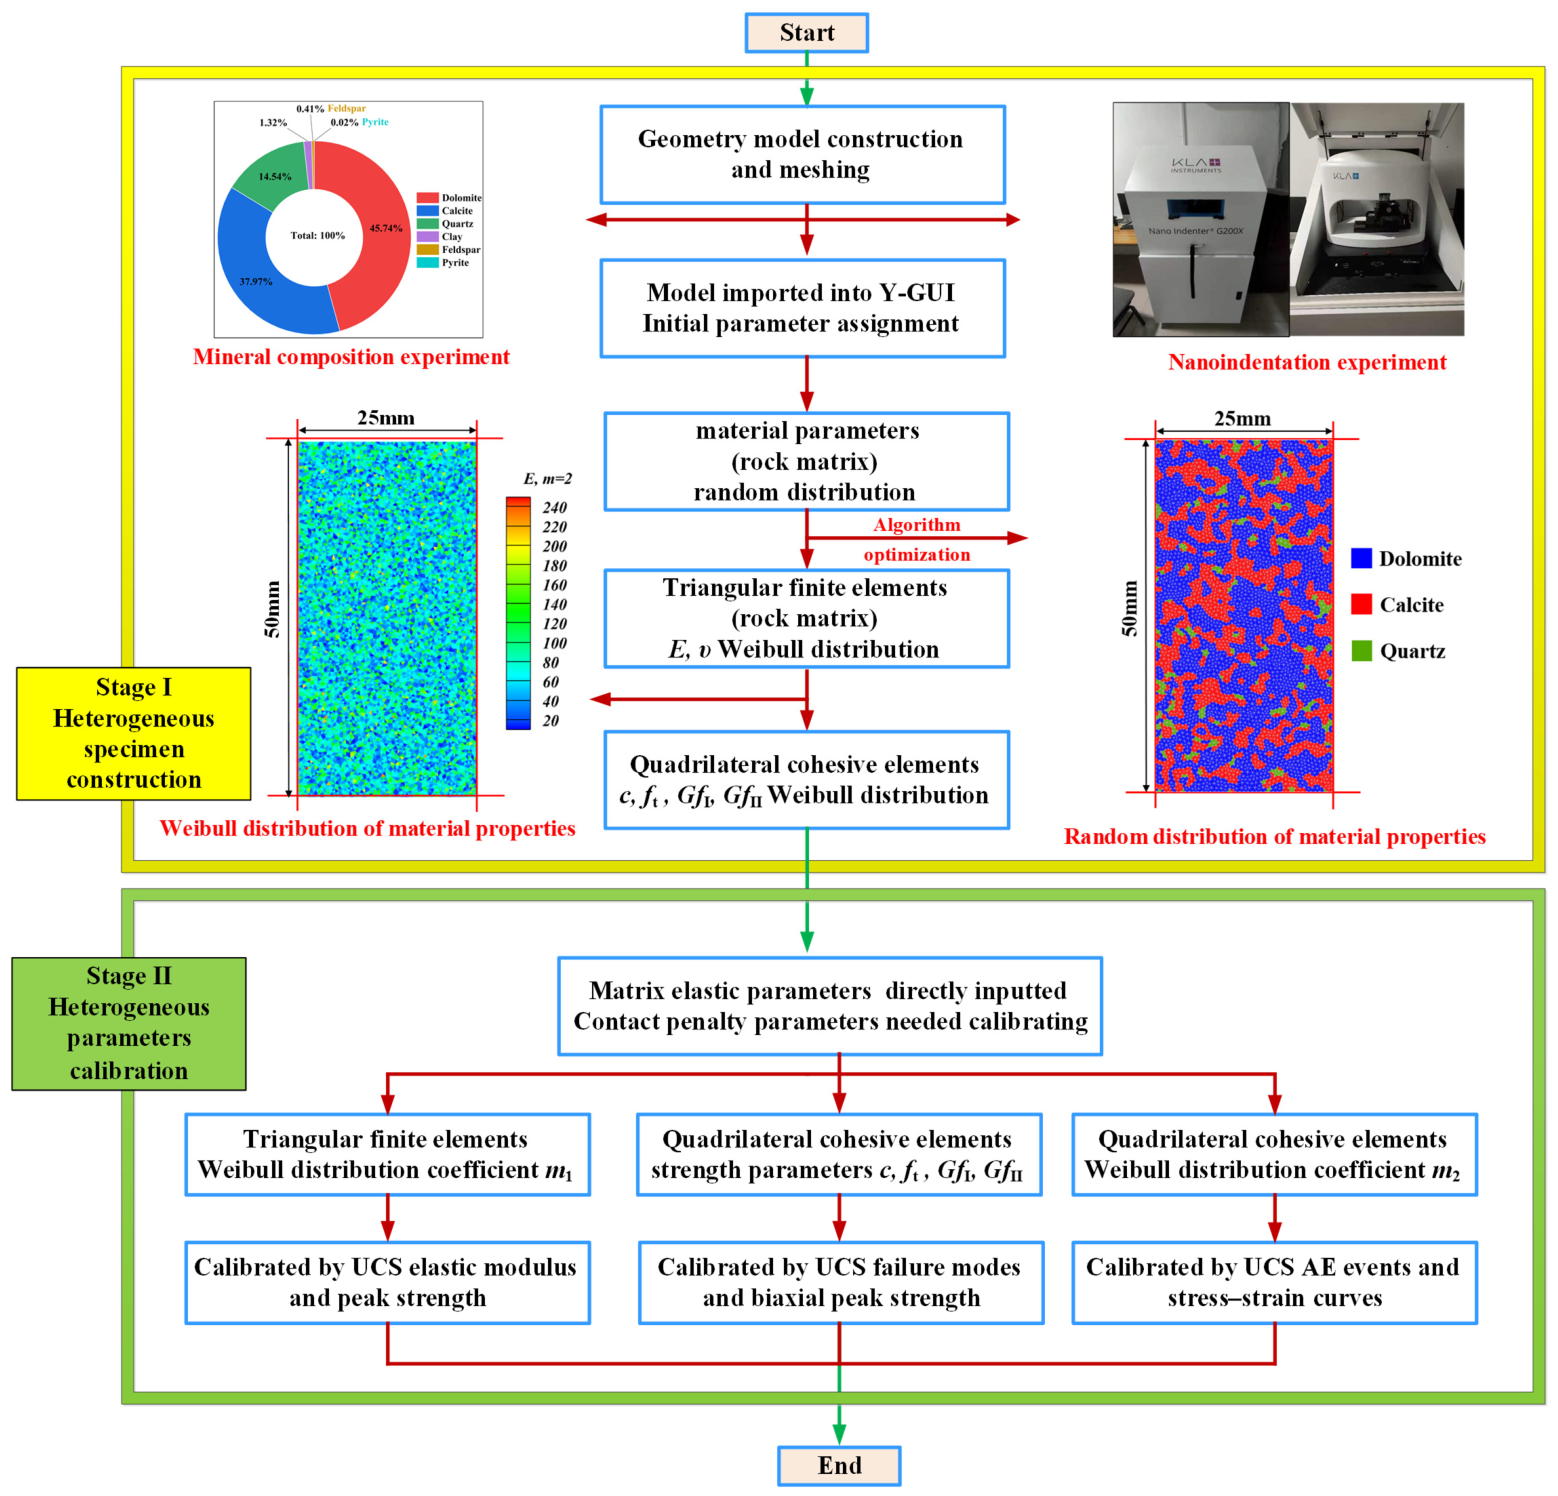
The mesoscopic model is built in five steps (Figure 3). The dominant mineral composition is first obtained from the mineral-composition experiments, and the elastic modulus and Poisson ratio of the dominant minerals are measured by nanoindentation. A two-dimensional geometric model of the specimen is then constructed in Y-GUI, and the basic properties of the triangular finite elements are randomly assigned from the experimental parameters. An element–property optimization algorithm removes malformed grains so that the mineral distribution approaches the mineral-identification image. To represent heterogeneity within a single mineral, the elastic modulus is assigned following a two-parameter Weibull distribution. The cumulative distribution function used to draw the modulus value of each element is given by Equation (3), in which the expected modulus and the homogeneity index m appear, and a larger m corresponds to a more homogeneous specimen. Two independent indices are used, because heterogeneity arises from two distinct sources. The matrix index m1 governs the dispersion of the matrix–particle properties, such as the elastic modulus and Poisson’s ratio. The cementation index m2 governs the dispersion of the cohesive-element strength parameters, such as the tensile strength, the cohesion, and the Mode I and Mode II fracture energy. Because cementation between mineral grains is weak and randomly distributed, and deep dolomite exhibits complex physical and mechanical characteristics under in situ conditions [28], this dual Weibull scheme, following Deng et al. [20,21], captures the resulting mesoscopic heterogeneity. Assigning two indices instead of one is what distinguishes this scheme from earlier single-index Weibull–FDEM models.
Figure 3.
Construction and parameter-calibration flowchart of the heterogeneous dolomite numerical model.
3.2. Model Parameters and Macroscopic Response Under Uniaxial Compression
The model parameters are summarized in Table 2. The elastic properties of the three dominant minerals—their elastic modulus E and Poisson’s ratio ν—were measured by nanoindentation. Each mineral was also assigned its own density ρ, so these three properties are mineral-specific. The strength parameters were treated differently. Cohesion c, tensile strength ft, friction angle φ, and the Mode I and Mode II fracture energies were not measured directly. They were applied uniformly to all phases and calibrated against the laboratory data. The calibration target was the measured uniaxial compressive strength and the corresponding stress–strain curve. This procedure follows the standard FDEM calibration of Tatone and Grasselli [29]. This uniform treatment is reasonable, because local failure is controlled by the weak inter-granular cement rather than by the mineral grains. The dispersion of this cement strength is represented through the Weibull index m2.
Table 2.
Parameters for the FDEM numerical simulation.
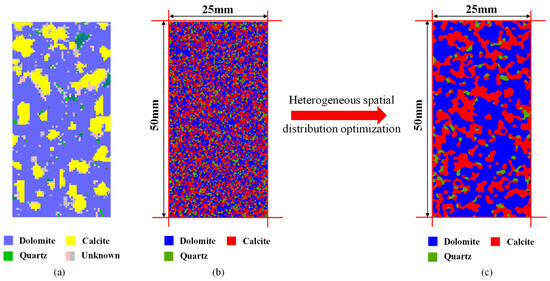
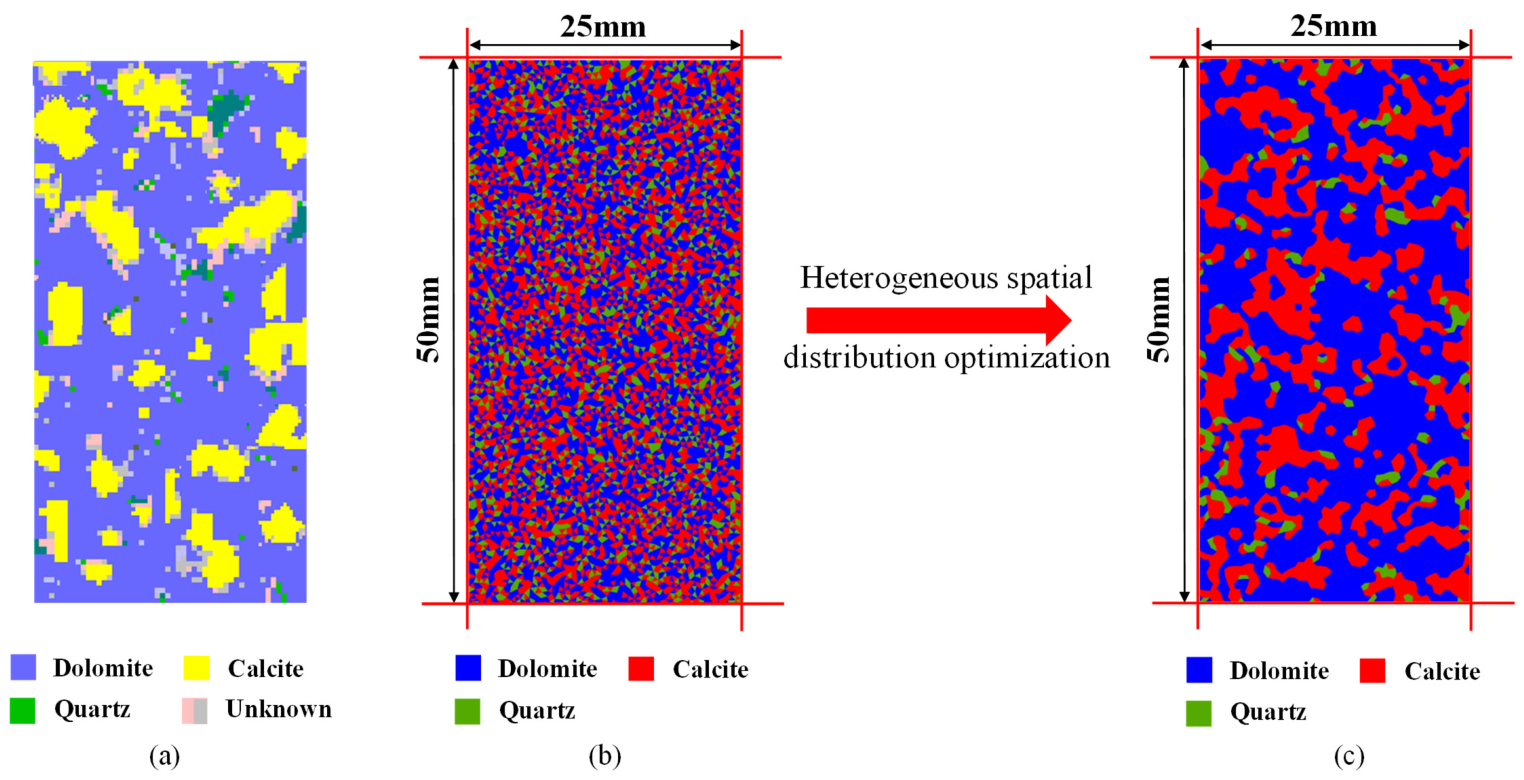
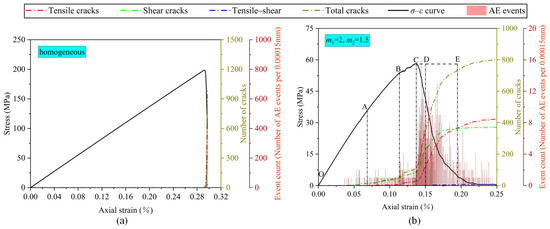
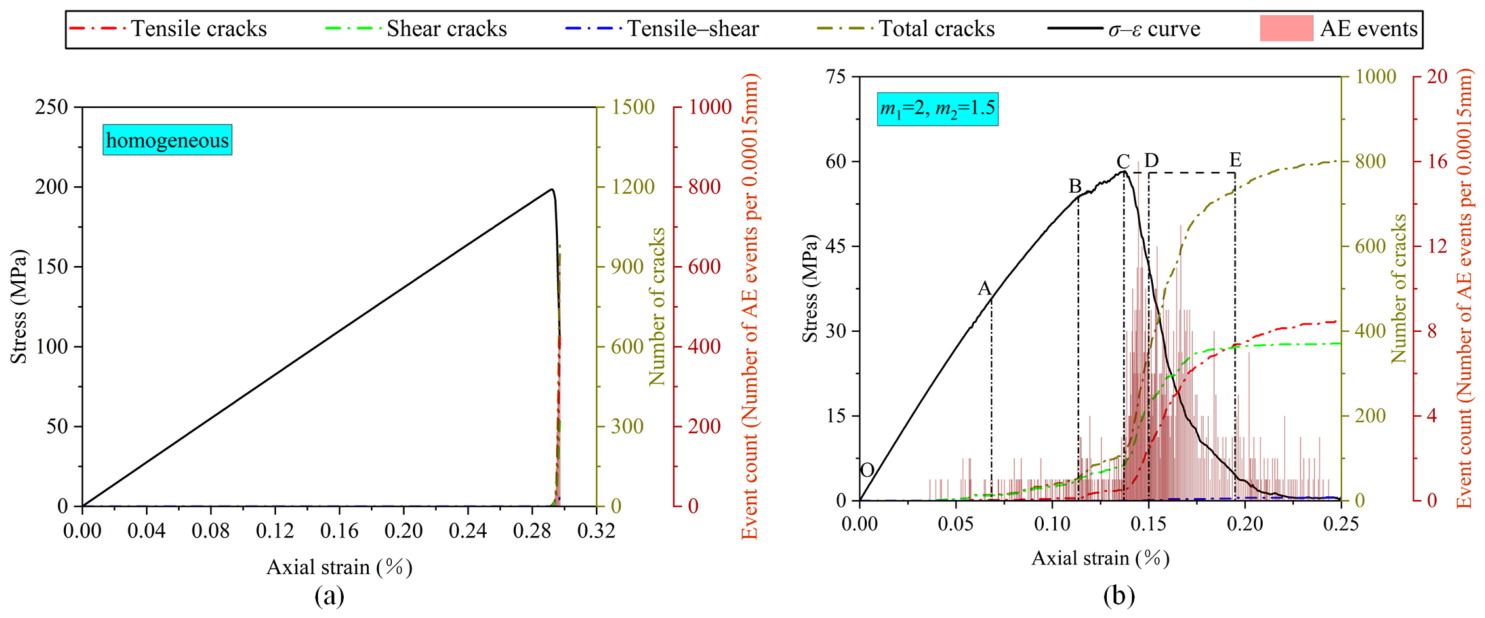
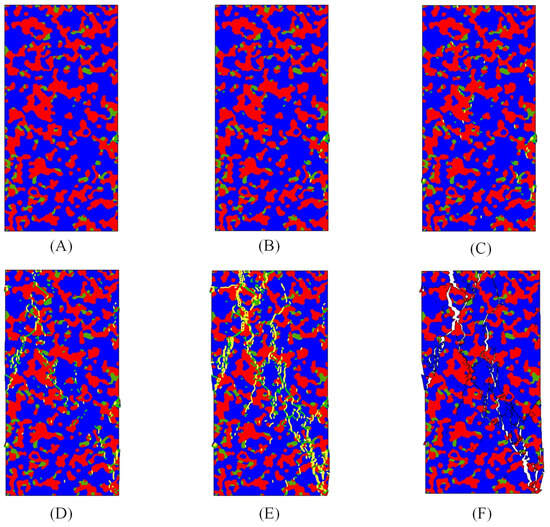
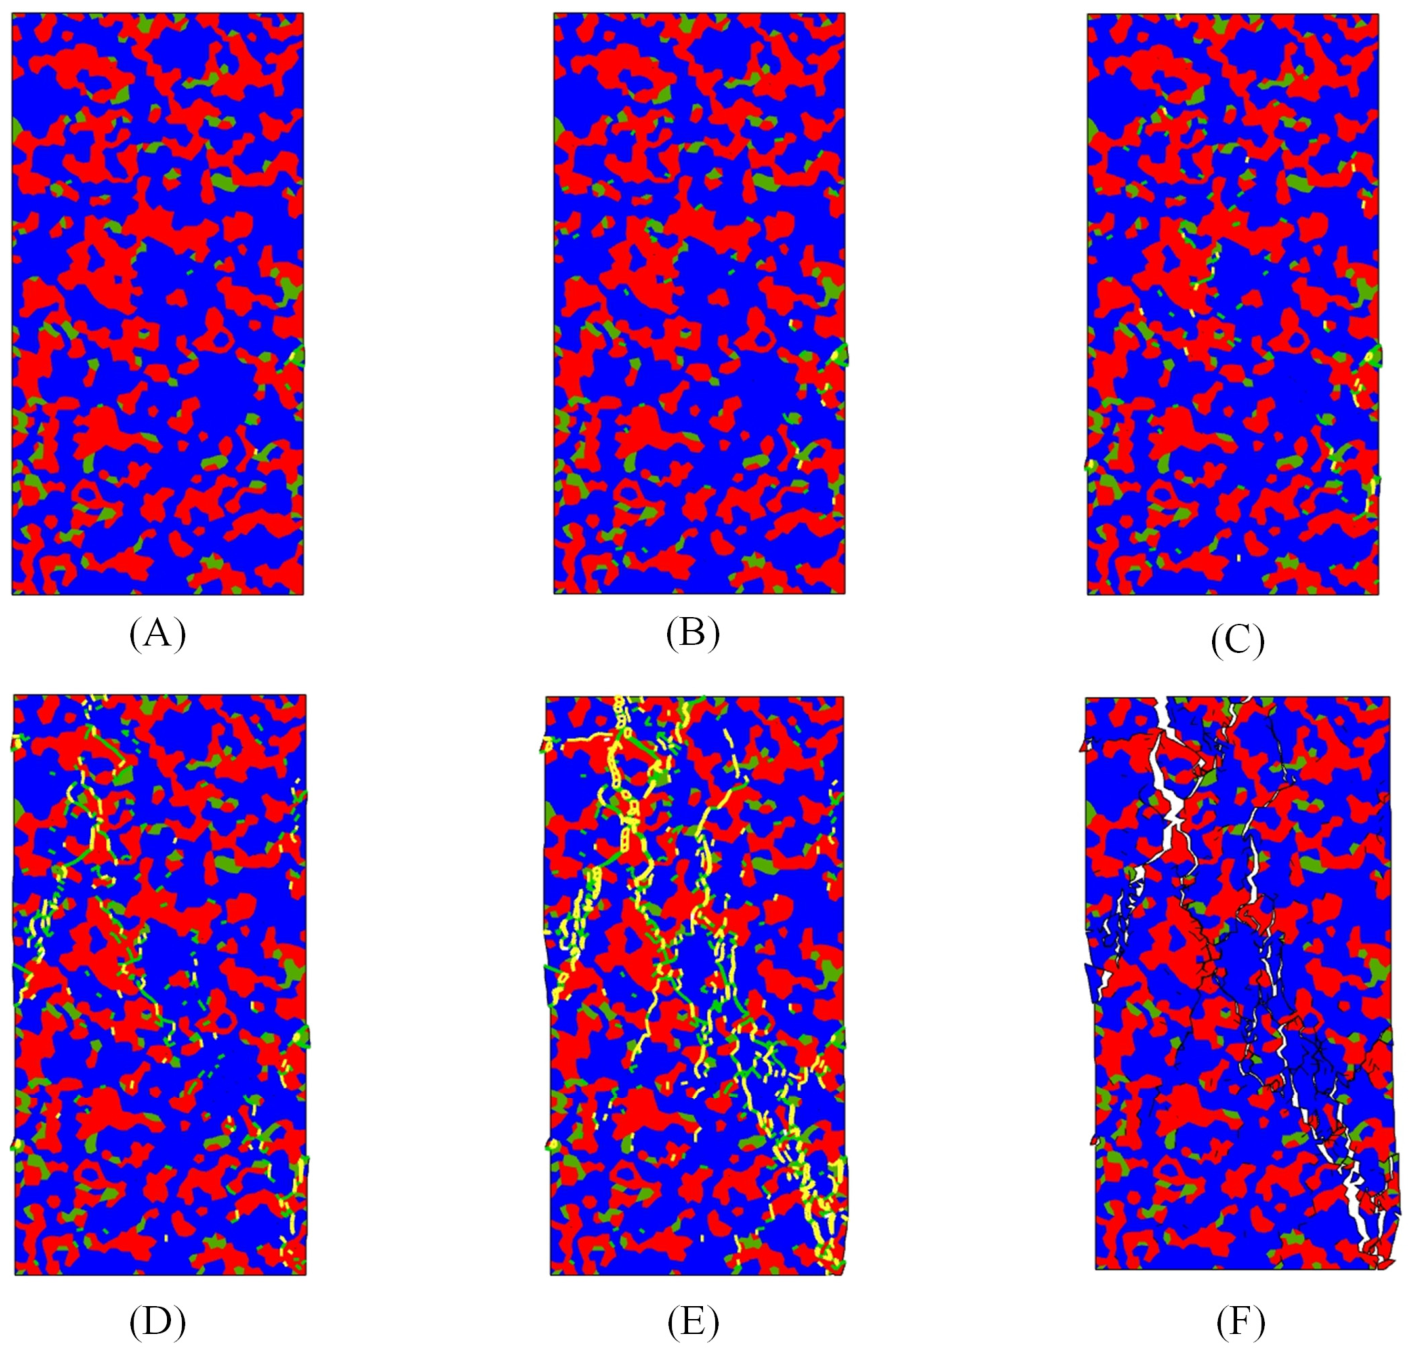
The mineral-identification map, the randomly distributed model and the optimized model are compared in Figure 4. The optimized specimen is highly similar to the identification map and satisfies the randomness requirements of mineral spatial distribution, size and shape, qualifying as a numerical specimen of ultra-deep heterogeneous dolomite. Figure 5 compares the stress–strain curves and AE responses of homogeneous and heterogeneous specimens under uniaxial compression. The homogeneous specimen shows a linear pre-peak slope, an essentially constant elastic modulus, a rapid linear post-peak drop, and AE concentrated near the peak. This response does not reproduce the pronounced pre-peak nonlinearity commonly observed in ultra-deep rocks. The heterogeneous specimen develops pronounced pre-peak nonlinearity, because the higher dispersion of cohesive-element properties promotes local microcracking. Its peak strength, peak strain and elastic modulus are lower. The AE initiates at about 30% of the peak load and surges at the post-peak stress drop. Figure 6 shows the damage evolution of the heterogeneous specimen. In the initial stage, only a few discretely distributed tensile cracks appear. As loading increases, the number and length of the tensile cracks grow, and shear and tensile–shear cracks emerge. Near the peak, the tensile-dominated damage forms several band-like clusters. After the peak, the cracks coalesce into steep through-going macroscopic fractures. Macroscopic failure is thus reproduced as a progressive accumulation of non-uniform microcracks, indicating that the heterogeneous model captures the mechanical behavior of ultra-deep dolomite. A quantitative comparison of the simulated and experimental responses is presented separately as the triaxial validation in Section 5.
Figure 4.
Ultra-deep heterogeneous dolomite numerical model: (a) mineral-identification map; (b) random distribution of dominant minerals; (c) optimized distribution of dominant minerals.
Figure 5.
Uniaxial-compression stress–strain curves and acoustic-emission (AE) responses: (a) homogeneous model; (b) heterogeneous model (m1 = 2, m2 = 1.5). Black solid curve, stress–strain response (left axis, MPa); dash–dot curves, cumulative tensile (red), shear (green), tensile–shear (blue) and total (olive) crack counts (inner right axis); pink bars, AE events (outer right axis). Points O–E in (b) mark successive loading stages, with O denoting the origin (zero stress and strain) prior to the onset of loading.
Figure 6.
Damage development of the heterogeneous specimen under uniaxial compression, over the mineral distribution. In stages (A–E) the microcracks are colored by type (yellow, tensile; green, shear; white, tensile–shear); (F) is the final macroscopic failure surface.
Building on this model, the following section systematically examines how mineral composition, matrix and cementation heterogeneity, and the representative observation scale govern the macroscopic mechanical behavior, and organizes them into a three-level graded characterization framework.
4. Three-Level Graded Characterization Framework
The sensitivity behavior of the established model is organized below into three hierarchical levels. The compositional level (Section 4.1) sets the strength magnitude, the structural level (Section 4.2) sets the stiffness, nonlinearity and failure mode of the response, and the scale level (Section 4.3) sets the numerical resolution at which the first two are represented. Their integration and underlying mechanisms are presented in Section 4.4.
4.1. Compositional Level
The compositional level constitutes the base of the proposed grading framework. It captures how the volume fractions of the constituent minerals govern the macroscopic strength magnitude of the heterogeneous dolomite specimen. The mineral identification in Section 2.2, together with the model-construction procedure in Section 3.1, provides the foundation for this level.
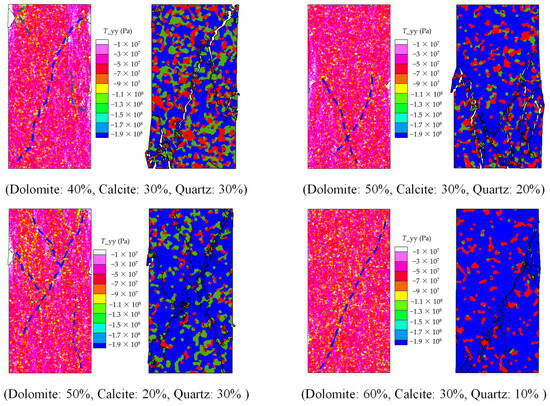
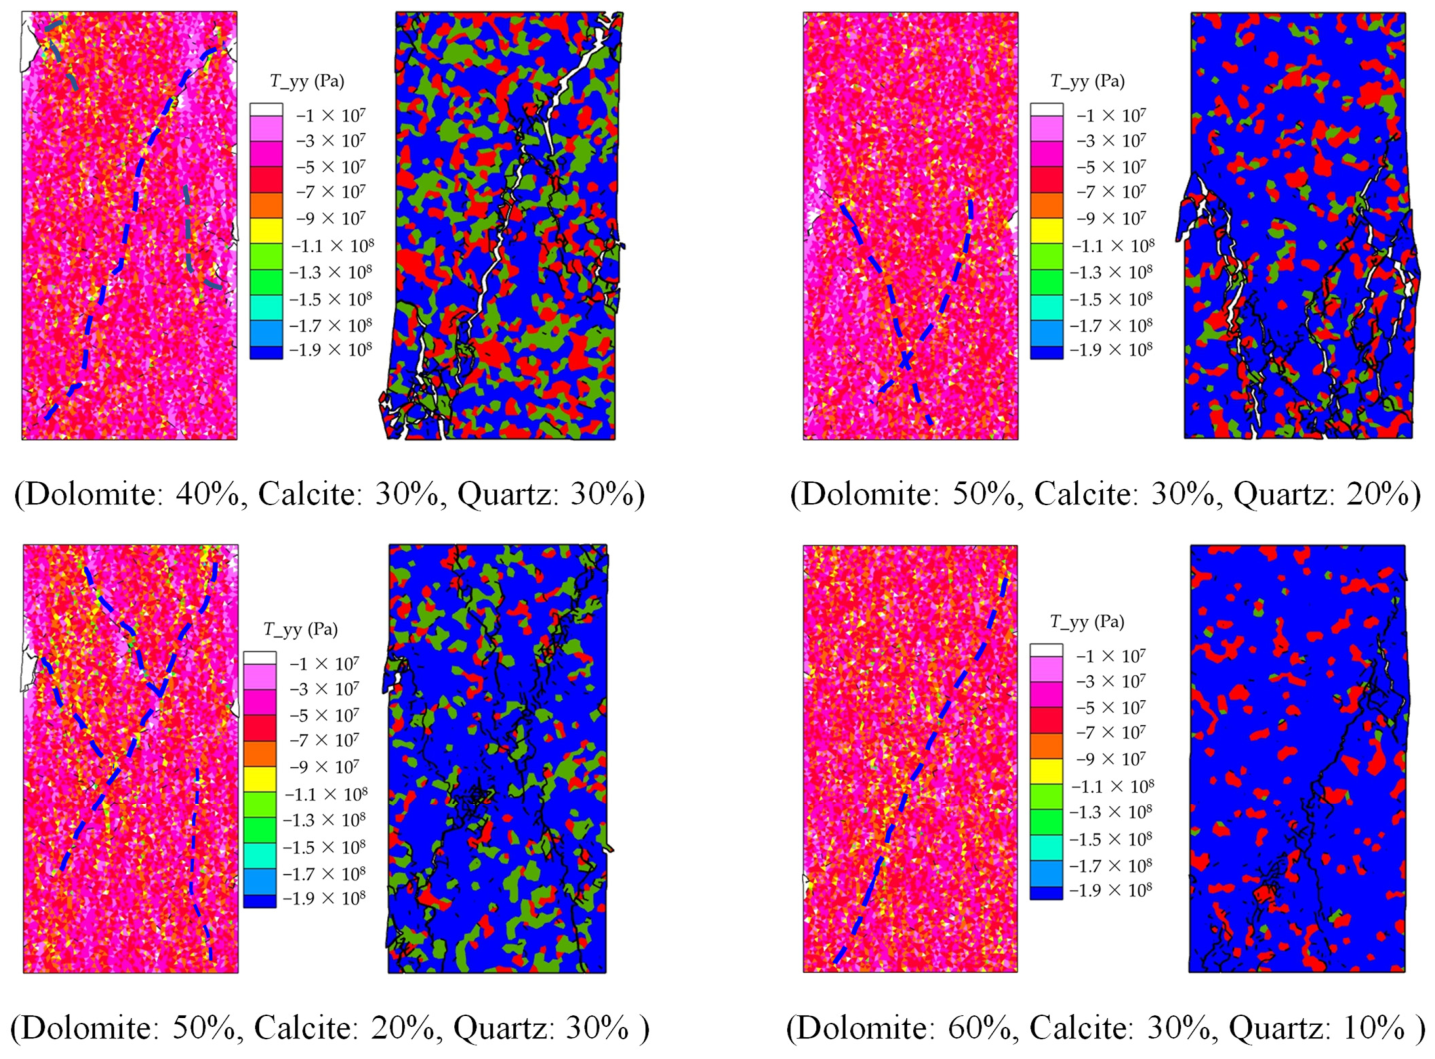
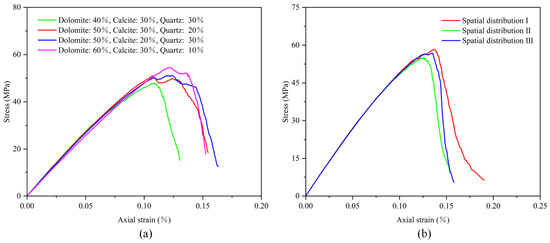
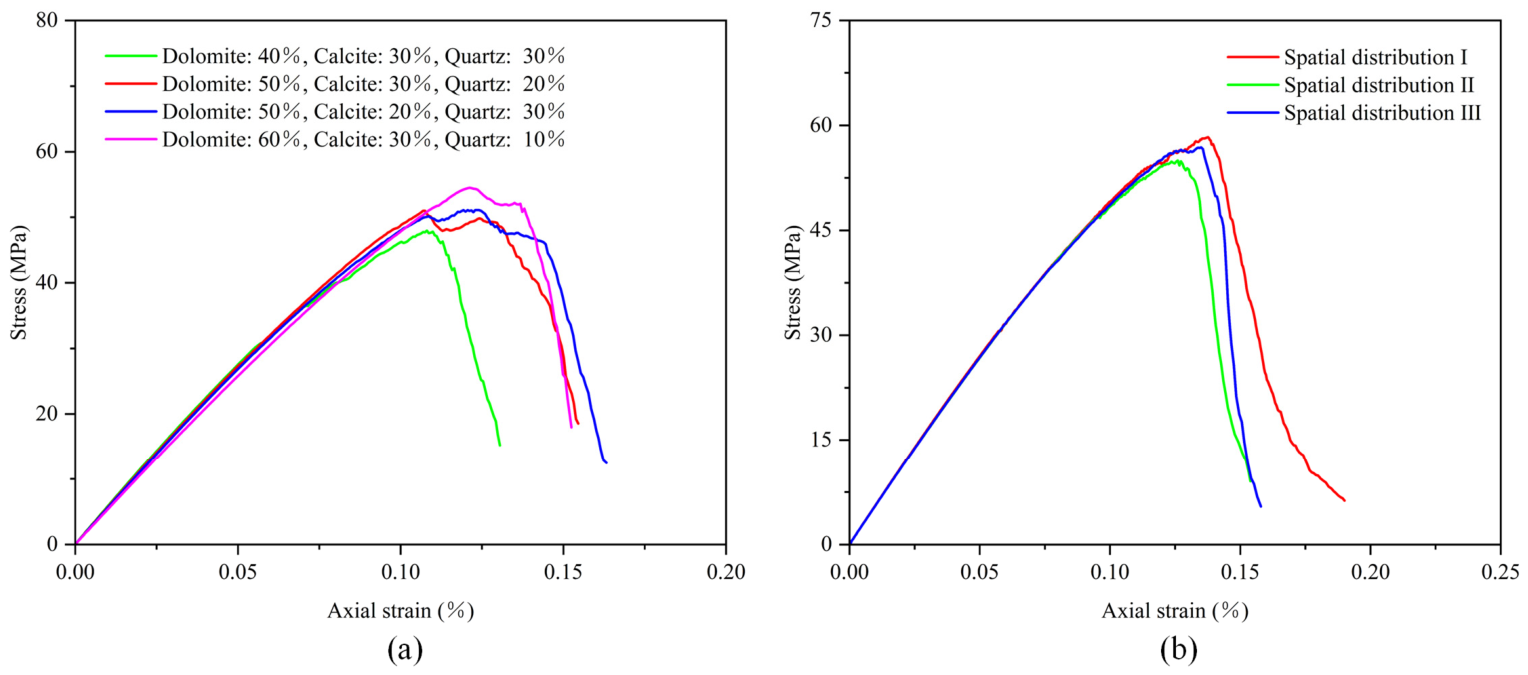
Four representative compositions with a dolomite content ranging from 40% to 60%, bracketing the measured value, were investigated. Figure 7 presents the vertical stress fields and failure morphologies under uniaxial compression for the four compositions. The load is preferentially carried by the stiffer dolomite and quartz grains, which have higher elastic moduli, while the softer calcite carries a smaller share of the load. Figure 8a further shows that the peak strength increases monotonically as dolomite content rises from 40% to 60%. The compositional control of macroscopic strength magnitude is therefore robust over the investigated range.
Figure 7.
Vertical-stress (T_yy) fields (left of each panel) and the corresponding final failure morphologies (right) under uniaxial compression for four compositions, labeled below as (dolomite %, calcite %, quartz %). Color scale, vertical stress in Pa (compression negative); dashed line, the macroscopic failure surface.
Figure 8.
Uniaxial-compression stress–strain curves (stress in MPa versus axial strain in %): (a) four mineral compositions, each labeled by (dolomite %, calcite %, quartz %); (b) three spatial realizations (I, II, III) of the reference composition generated with different random seeds.
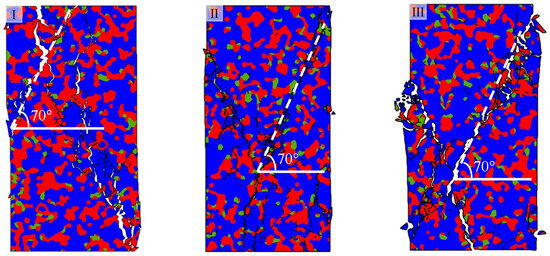
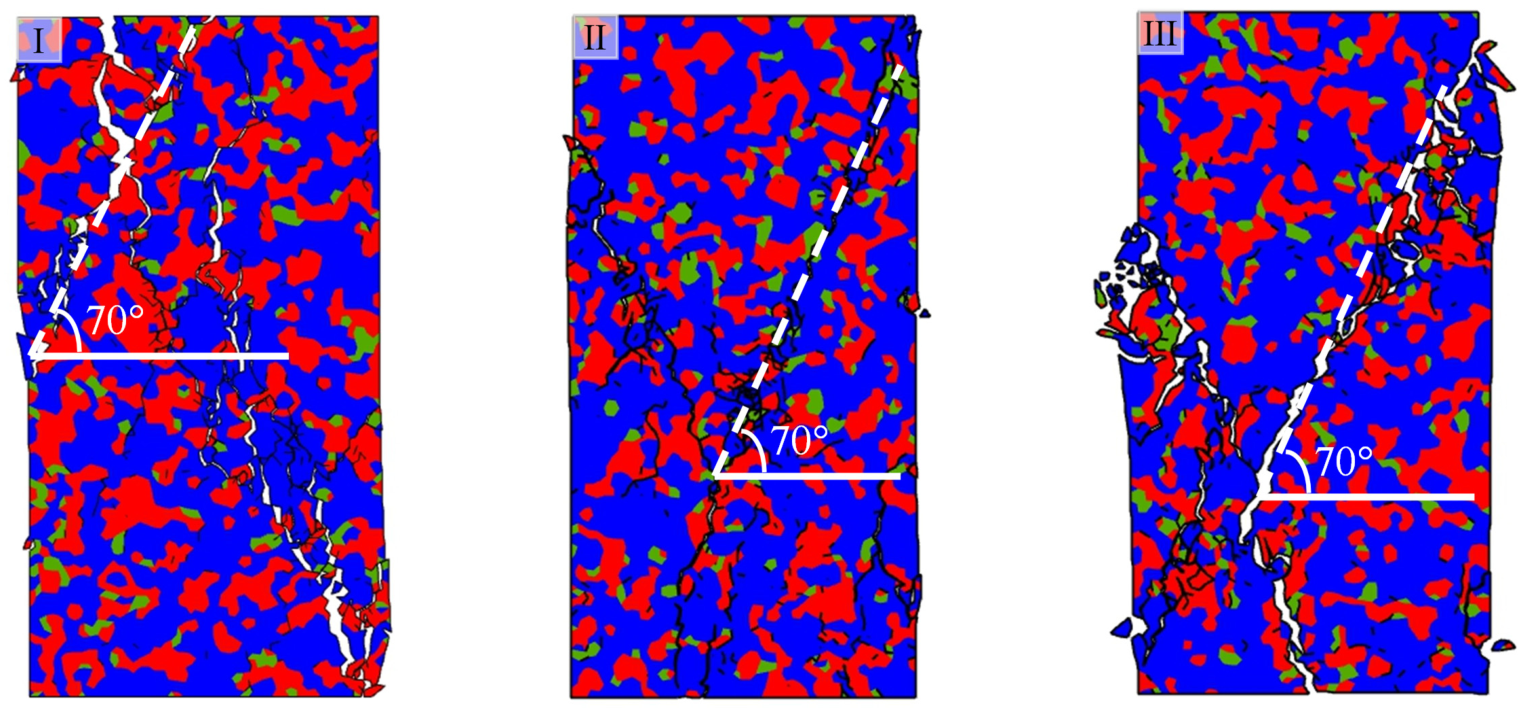
A complementary test examined whether mineral spatial layout, at fixed composition, perturbs the macroscopic response. Three independent realizations of the reference composition were generated by varying the random seed of the spatial-assignment algorithm. As shown in Figure 8b and Figure 9, the three realizations yield nearly coincident stress–strain curves and comparable failure morphologies, with peak strengths stabilizing around 58 MPa. The macroscopic response is therefore statistically insensitive to local spatial layout, indicating that the compositional level can be reliably parameterized by the bulk mineral content alone.
Figure 9.
Final failure morphologies under uniaxial compression for the three spatial realizations (I–III) of Figure 8b. Blue, dolomite; red, calcite; green, quartz; the white dashed line marks the main failure surface, inclined at about 70° in every case.
In summary, the compositional level reflects the volume-fraction control of the load-bearing skeleton. Dolomite content acts as the primary compositional indicator, and the macroscopic strength magnitude scales with this indicator robustly against random spatial perturbations. The mechanistic basis is elaborated in Section 4.4.3.
4.2. Structural Level
The structural level builds upon the compositional base and captures how the statistical distribution of mesoscopic mechanical properties, at a given composition, governs the dispersion and nonlinearity of the macroscopic response. Following the Weibull-based discretization in Section 3.1, two independent shape parameters are assigned. The matrix parameter m1 controls the distribution of the matrix–particle properties, such as the elastic modulus and Poisson’s ratio. The cementation parameter m2 controls the distribution of the cohesive-element strength parameters, such as the tensile strength, the cohesion, and the Mode I and Mode II fracture energy.
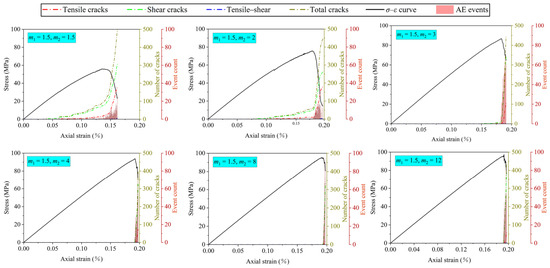
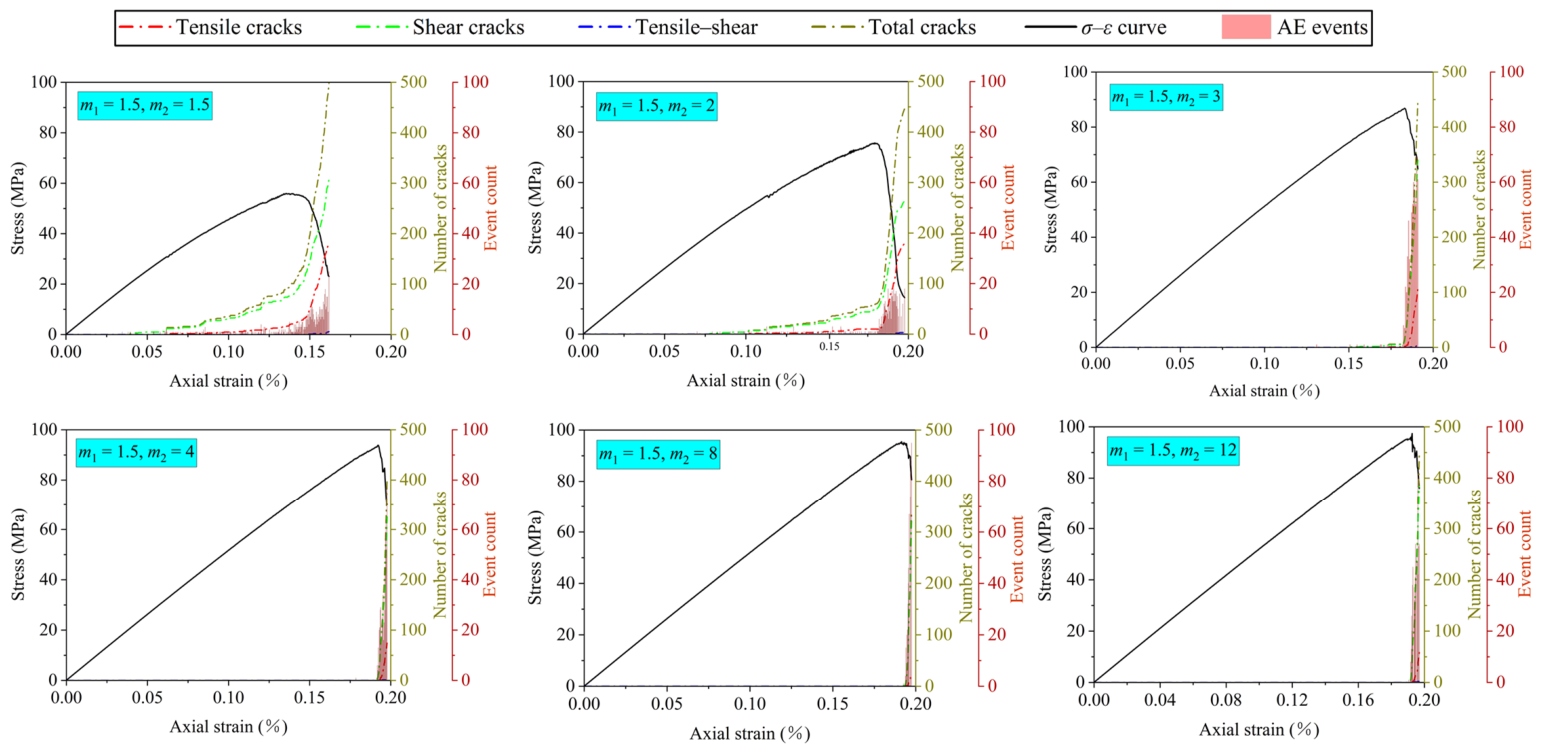
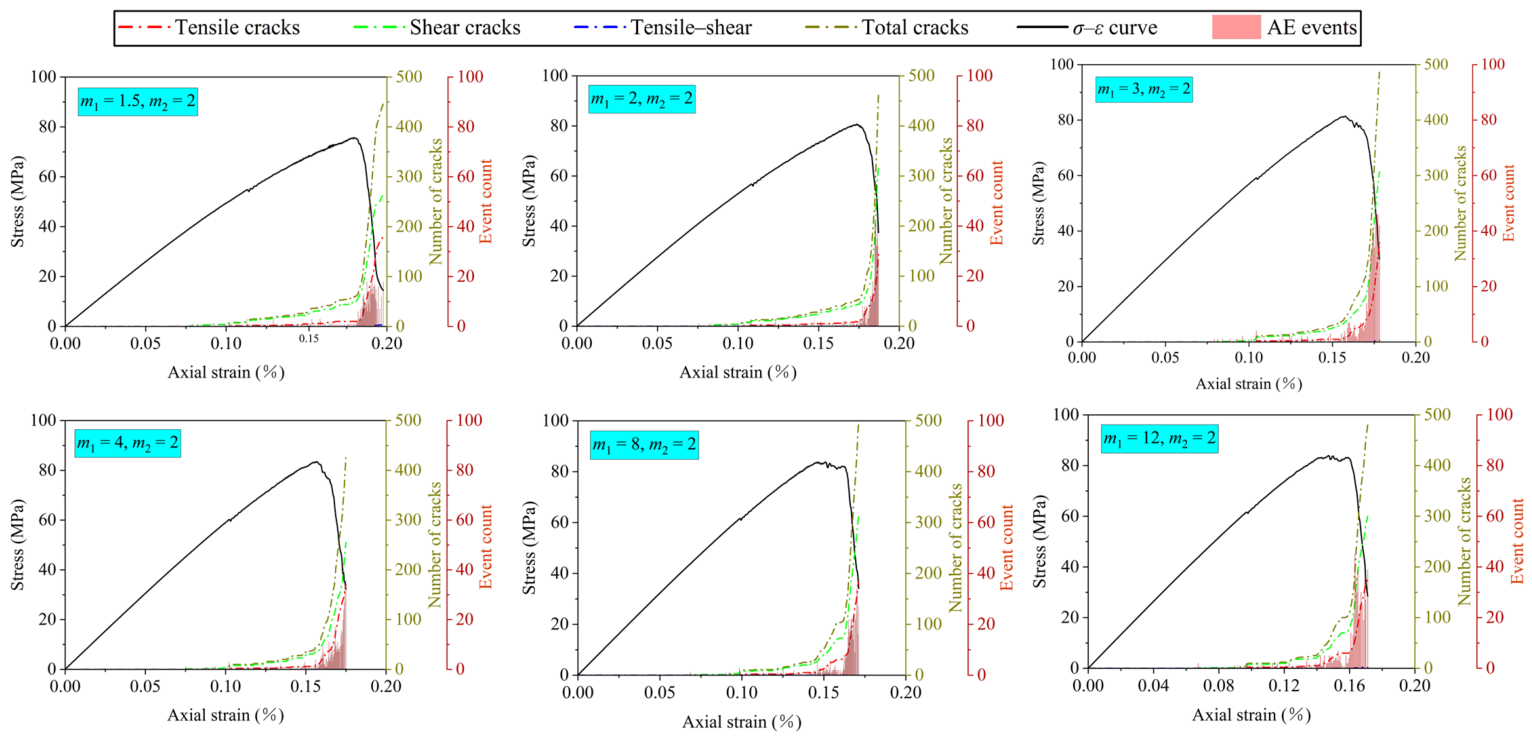
A two-dimensional sensitivity scan was performed with m1 and m2 each taking six values, namely 1.5, 2.0, 3.0, 4.0, 8.0 and 12.0, generating a six-by-six matrix of simulations. These six values were chosen to sample the response efficiently. The spacing is finer at low m, where the response changes most rapidly. It is coarser at high m, where the distribution approaches homogeneity and the differences become small. Each (m1, m2) point in the matrix is a single stochastic realization. Figure 8b and Figure 9 already show that the macroscopic response is robust to the random seed. Repeated realizations were therefore not required. Figure 10 shows the stress–strain curves and AE responses for fixed m1 with varying m2. As m2 decreases, the pre-peak nonlinearity becomes more pronounced, the post-peak stress drop more gradual, and the AE onset earlier. Figure 11 shows the complementary scan with fixed m2 and varying m1:m1 exerts a modest influence on peak strength and strain but a comparatively weaker influence on the overall curve shape.
Figure 10.
Uniaxial-compression stress–strain curves and AE responses for fixed m1 = 1.5 and six values of m2 (1.5, 2, 3, 4, 8, 12), one per panel; curves, axes and colors as in Figure 5 (black, stress–strain; dash–dot, crack counts; pink bars, AE events).
Figure 11.
Uniaxial-compression stress–strain curves and AE responses for fixed m2 = 2 and six values of m1 (1.5, 2, 3, 4, 8, 12), one per panel; curves, axes and colors as in Figure 5.
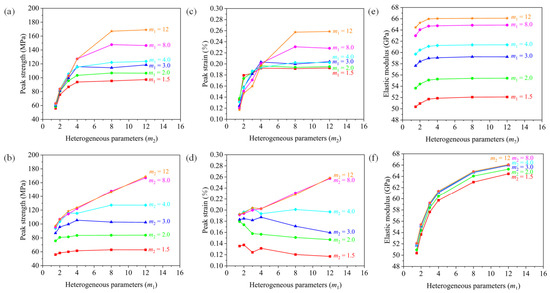
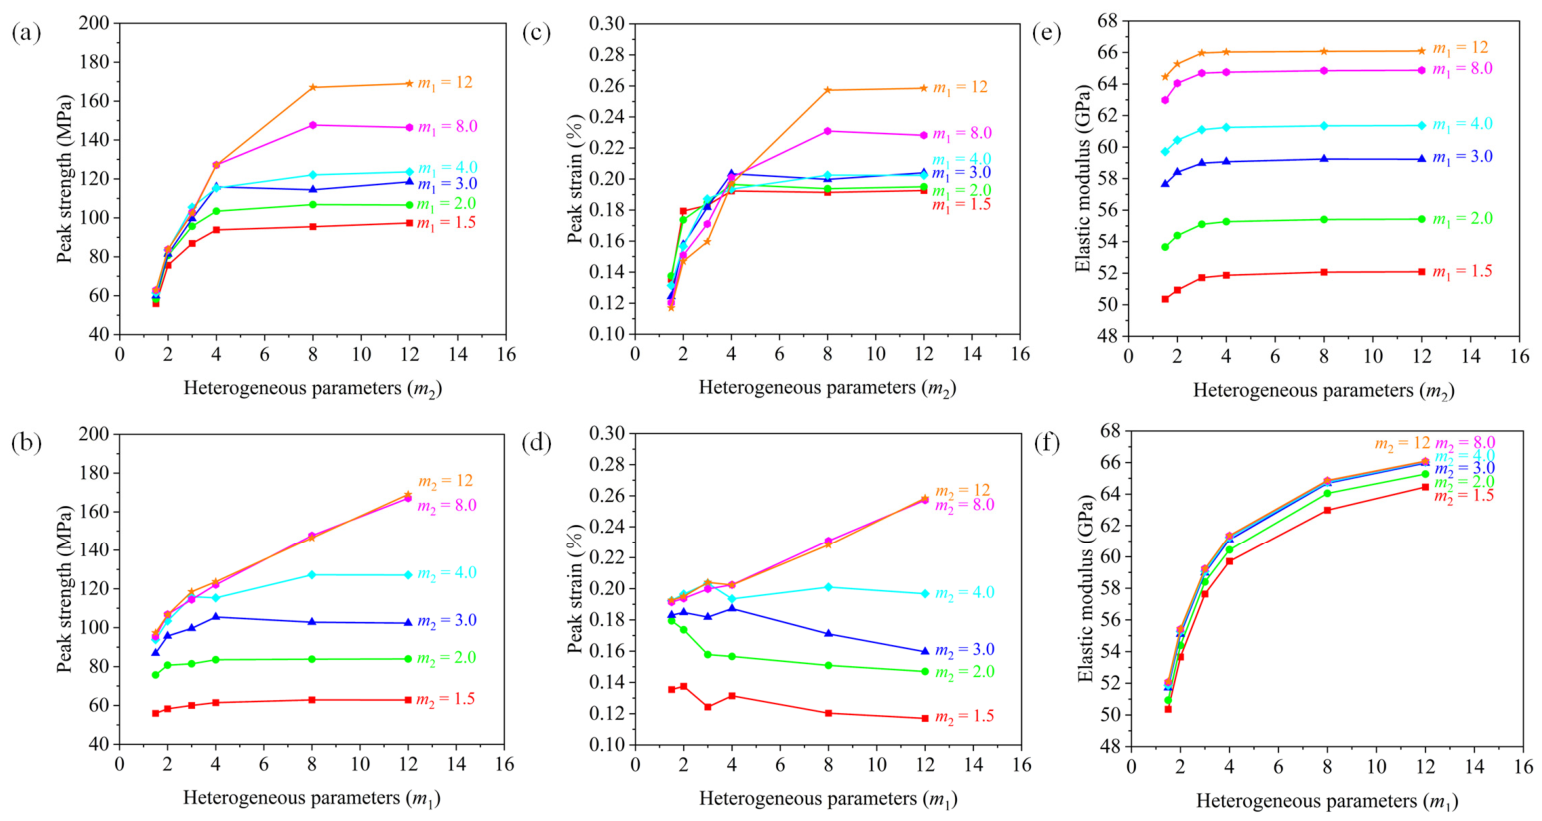
Figure 12 summarizes the evolution of the three macroscopic parameters across the full m1–m2 matrix. Three observations are central. First, the influence of each parameter saturates. Once m1 or m2 exceeds about 4, further increase produces only marginal change in peak strength, peak strain and elastic modulus. The macroscopic response thus becomes weakly dependent on the shape parameter beyond this value, and the saturation is consistently located near m = 4. Second, the elastic modulus is governed almost entirely by m1 and is essentially insensitive to m2. The modulus curves obtained at different m2 collapse onto a single m1-controlled trend (Figure 12e,f), so matrix–particle heterogeneity controls the overall stiffness. The other macroscopic features behave differently. The pre-peak nonlinearity, the AE onset, the failure mode, and the magnitude and dispersion of peak strength and peak strain are governed mainly by m2 (Figure 12a,c). In other words, cementation-strength heterogeneity controls microcrack initiation, the load-bearing magnitude and the local instability of the skeleton. Third, m1 and m2 act jointly rather than independently. The influence of m1 on peak strength and peak strain is conditional: it stays weak at small m2 and becomes appreciable only when m2 is large (Figure 12b,d). When the cementation is strongly heterogeneous, the response is governed by the weakest cohesive elements and is largely insensitive to the matrix. When the cementation is more uniform, the matrix heterogeneity controlled by m1 governs the peak strength and strain.
Figure 12.
Evolution of the macroscopic parameters over the 6 × 6 (m1, m2) matrix: (a,b) peak strength, (c,d) peak strain, (e,f) elastic modulus, plotted versus m2 (left column, each curve a fixed m1) and versus m1 (right column, each curve a fixed m2). Legend values are 1.5, 2, 3, 4, 8 and 12.
The saturation threshold m = 4 is therefore adopted as the behavioral threshold of the structural level. Its statistical interpretation, rooted in the skewness transition of the Weibull distribution near m = 3.6, is presented in Section 4.4.3. The differentiated yet jointly acting control of m1 and m2 reflects the complex internal heterogeneity of ultra-deep dolomite and is treated as an intrinsic feature of the structural level rather than a separately parameterized interaction term.
4.3. Scale Level
The scale level constitutes the representational prerequisite of the framework. It captures how the chosen mesh size influences the model capacity to resolve the compositional and structural heterogeneity established at the first two levels. Unlike the previous two levels, which describe intrinsic rock properties, the scale level concerns the numerical resolution at which those properties are sampled.
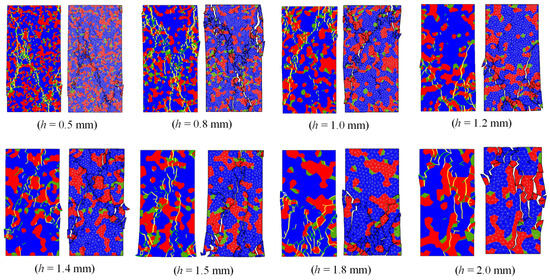
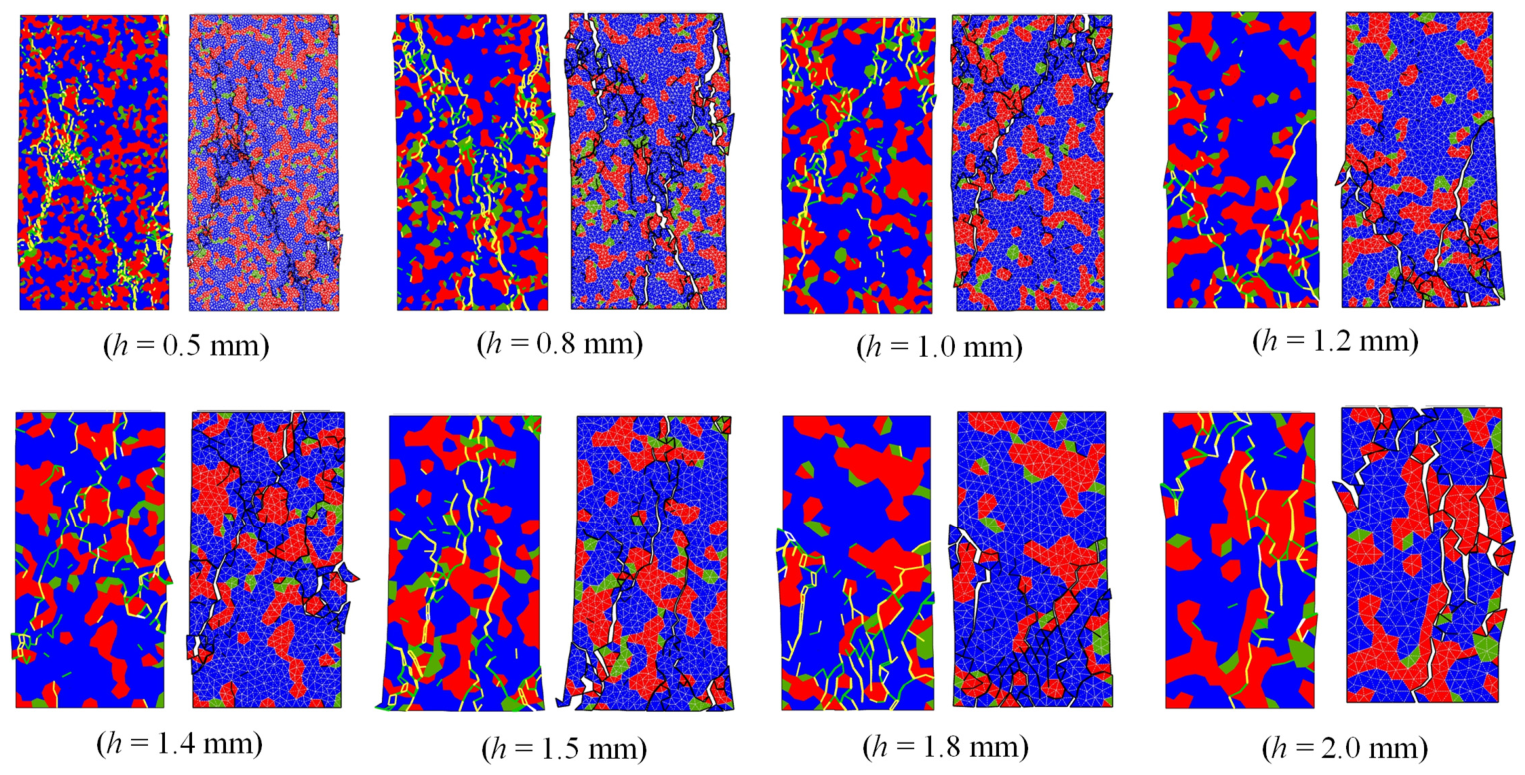
A series of uniaxial-compression simulations was performed with mesh sizes of 0.5, 0.6, 0.8, 1.0, 1.2, 1.4, 1.5, 1.6, 1.8 and 2.0 mm, all other parameters identical to those of the reference case in Table 2. Figure 13 compares the microcrack distributions and failure morphologies at eight representative mesh sizes (of the ten simulated). For a mesh size not exceeding 1.2 mm, a well-defined penetrating main failure surface develops with concentrated microcracks. As the mesh size increases beyond 1.2 mm, the failure morphology becomes progressively dispersed, the main failure surface is no longer clearly identifiable, and microcracks distribute over a larger volume in a weakly localized manner. The coarser meshes therefore underestimate stress concentrations at the high-to-low-modulus interfaces and fail to reproduce the dominant failure mechanism.
Figure 13.
Failure morphologies at eight mesh sizes h (0.5, 0.8, 1.0, 1.2, 1.4, 1.5, 1.8 and 2.0 mm), selected from the ten simulated (Table 3). In each panel the left image shows the microcracks colored by type (yellow, tensile; green, shear; white, tensile–shear) and the right image the macroscopic failure surface.
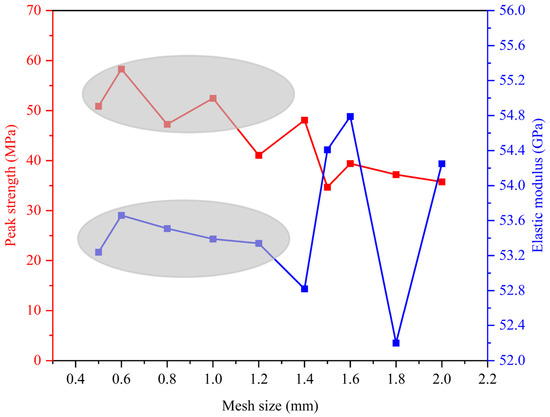
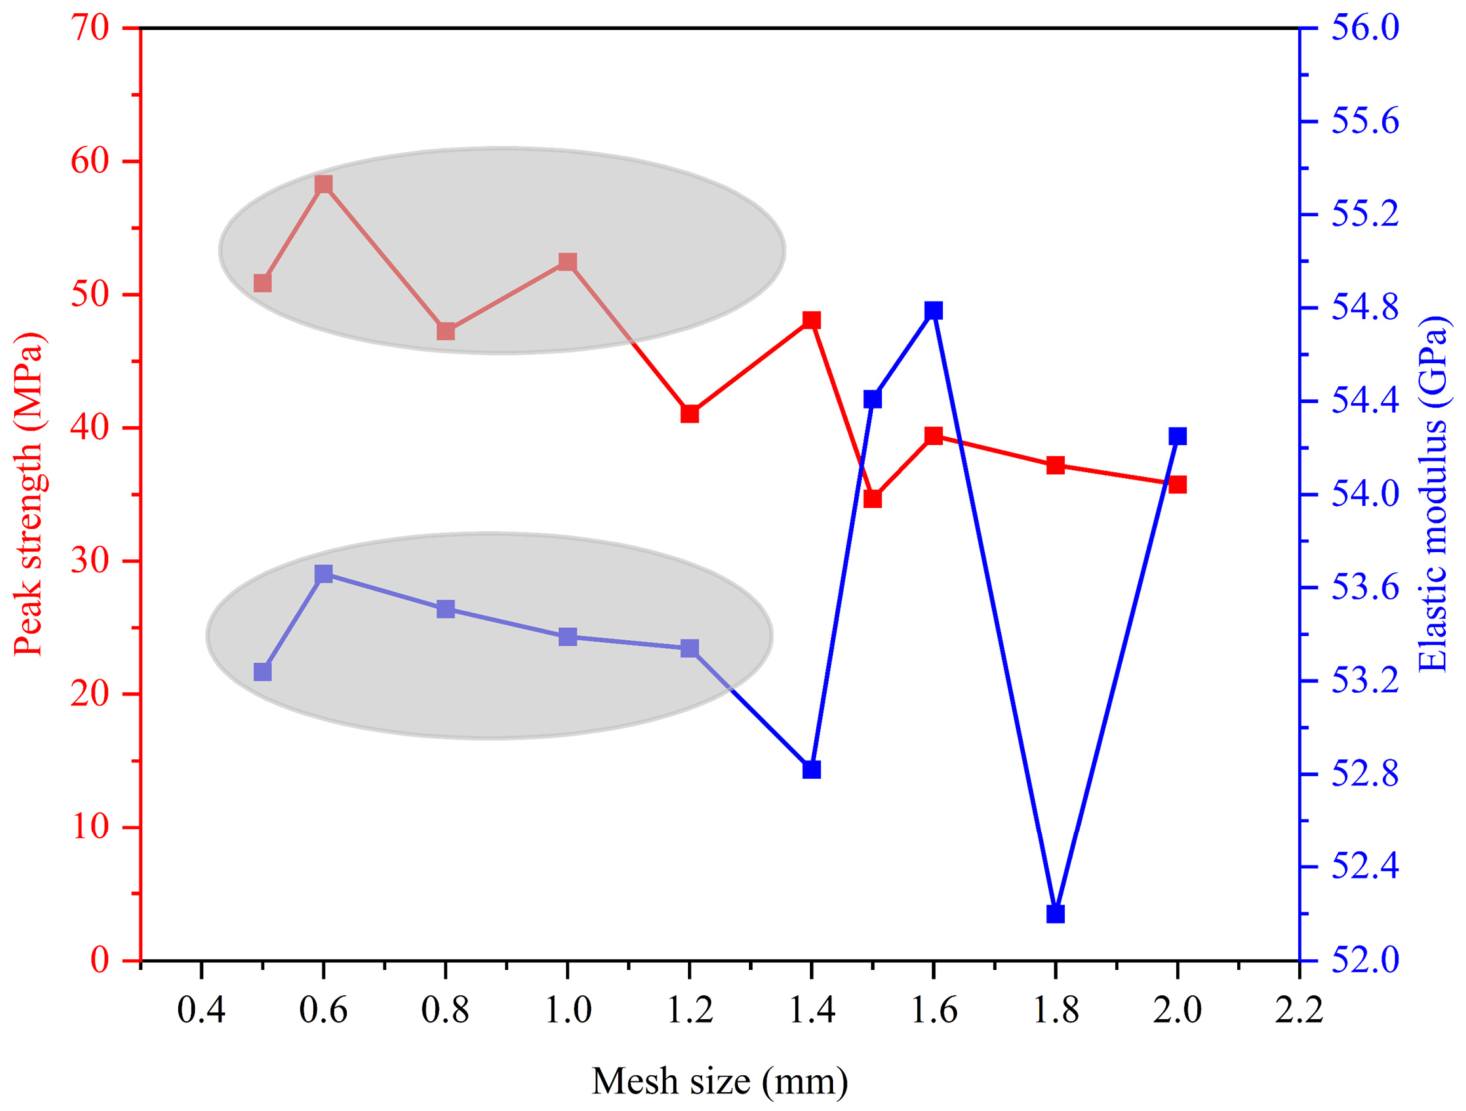
Figure 14 confirms this quantitatively: both peak strength and elastic modulus stabilize for a mesh size not exceeding 1.2 mm, with relative variations below 5%, while further refinement yields only marginal change at sharply rising computational cost. Table 3 reports the element count, the number of time steps required to reach peak stress, and the corresponding wall-clock time for each mesh size. The element count increases monotonically and steeply as the mesh is refined, rising by more than an order of magnitude from 808 at 2.0 mm to 13,224 at 0.5 mm. The wall-clock time follows the same overall trend but is additionally modulated by the number of time steps needed to reach peak stress, which is governed by the mechanical response rather than by mesh resolution alone. Since the results have already converged at 1.2 mm, refining the mesh further only increases the computational cost without a corresponding improvement in accuracy; a mesh size of 1.2 mm therefore offers the best balance between resolution and cost. The behavioral threshold of the scale level is therefore set at a mesh size not exceeding 1.2 mm. This threshold ensures the mesh resolves the mineral-domain topology at the mesoscopic scale, and acts as the prerequisite for the compositional and structural levels to be reliably captured: any sensitivity analysis at coarser resolution would be confounded by resolution-related artifacts.
Figure 14.
Convergence of macroscopic parameters with mesh size: peak strength (red squares, left axis, MPa) and elastic modulus (blue squares, right axis, GPa) versus mesh size h (mm). The gray shaded ovals mark the converged region (h ≤ 1.2 mm).
Table 3.
Element count, time steps to peak stress, and wall-clock time for each mesh size.
4.4. Integrated Grading Framework and Mechanisms
4.4.1. Hierarchical Relationship Among the Three Levels
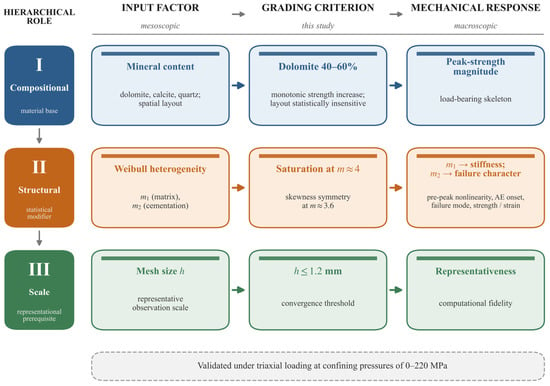
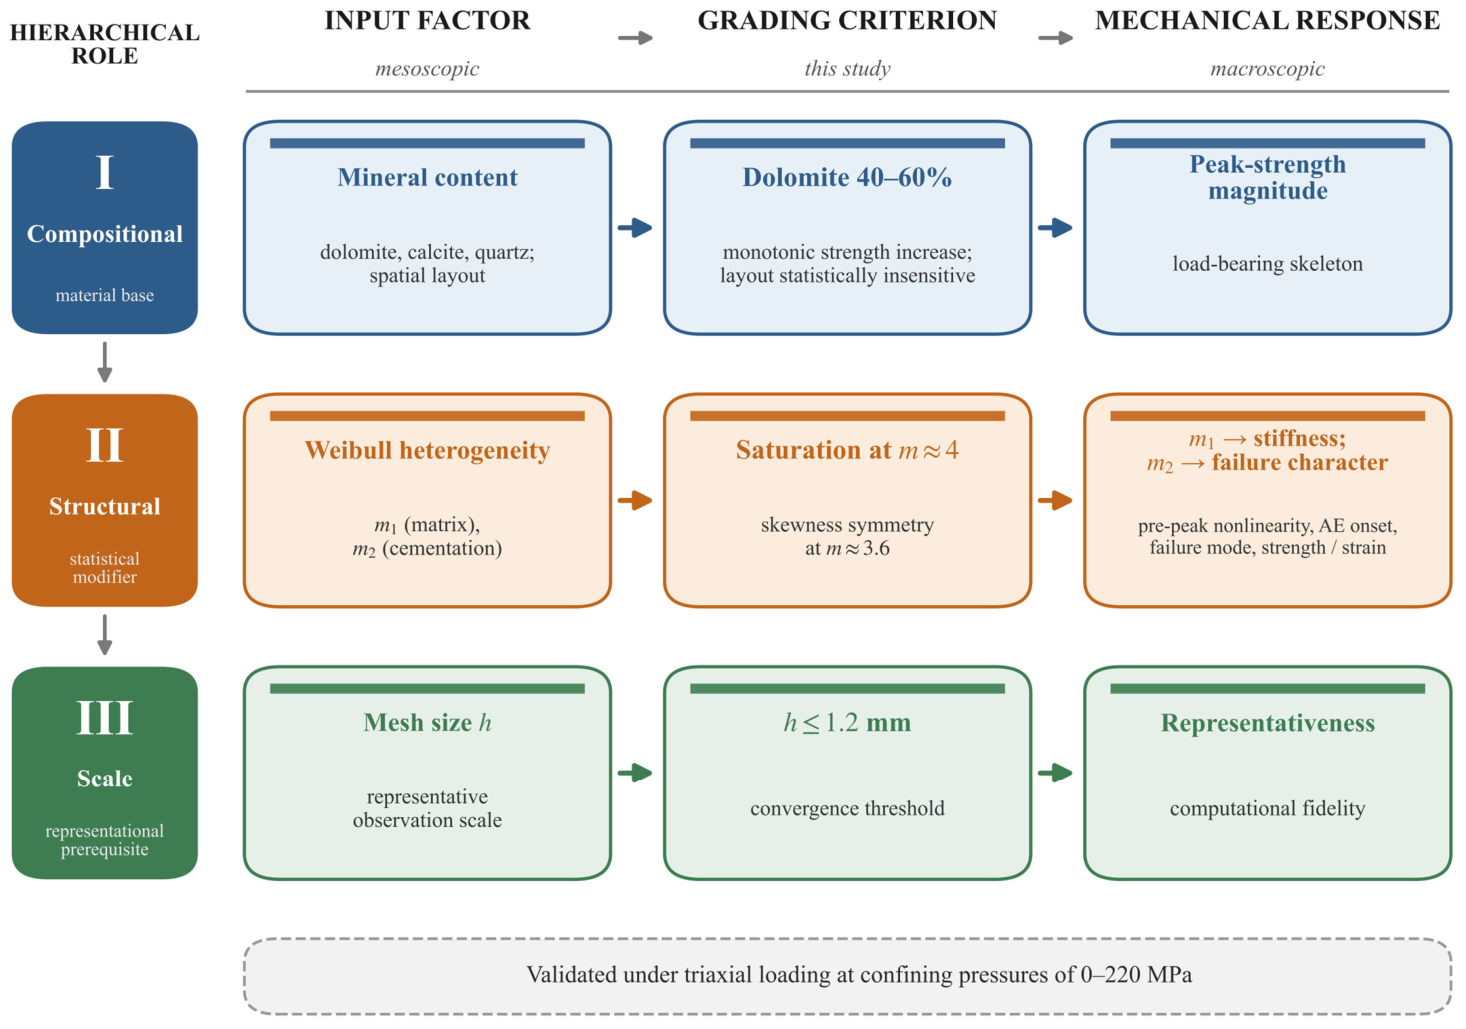
The three levels established in Section 4.1, Section 4.2 and Section 4.3 are not parallel sensitivity factors but possess an intrinsic hierarchy, which is the central methodological contribution of the proposed framework (Figure 15). The compositional level forms the base of the hierarchy. Mineral composition is the material substrate and sets the magnitude of the load-bearing capacity. Without a defined composition, neither the heterogeneity of the mesoscopic properties nor the resolution of their representation can be meaningfully discussed. The structural level acts as a modifier on the compositional base. At a fixed composition and fixed mean properties, the Weibull-distributed heterogeneity of matrix and cementation governs the elastic modulus, the pre-peak nonlinearity, the failure mode and the dispersion of the macroscopic response. Through the weak-link behavior of the more heterogeneous cohesive elements, it also modulates the peak strength and strain about the level set by the compositional baseline. The scale level serves as the representational prerequisite for the other two: the mesh size governs whether the lower levels are resolved at sufficient numerical fidelity. This three-tier architecture, comprising a material base, a statistical modifier and a representational prerequisite, distinguishes the present framework from the conventional treatment of mesoscopic heterogeneity as a set of parallel sensitivity factors.
Figure 15.
Schematic of the three-level graded characterization framework. Rows are the three levels (I Compositional, II Structural, III Scale); columns read left to right as input factor, grading criterion and macroscopic response. The compositional level is based on Figure 7, Figure 8 and Figure 9; the structural level, on Figure 10, Figure 11 and Figure 12; and the scale level, on Figure 13 and Figure 14. The dashed banner denotes triaxial validation at confining pressures of 0–220 MPa, presented in Section 5. The statistical basis of the structural-level threshold is further detailed in Figure 16 (Section 4.4.2).
4.4.2. Quantitative Grading Indicators and Thresholds
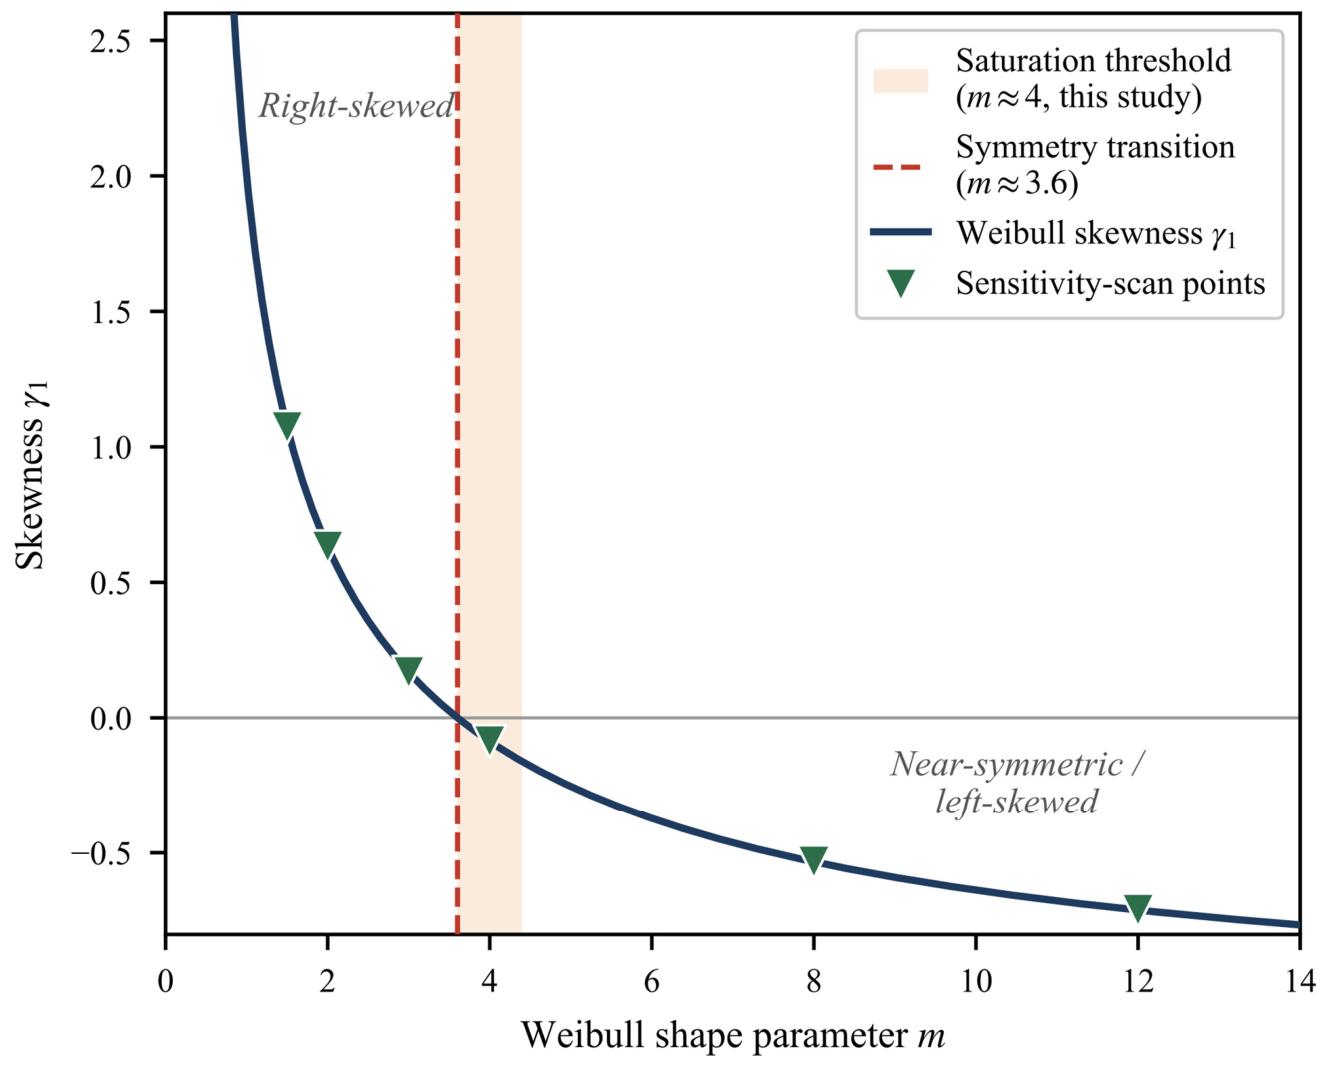
The quantitative grading indicators and behavioral thresholds derived from the three sensitivity analyses are consolidated in Table 4. Each row lists one controlling factor, its investigated range or behavioral threshold, the macroscopic indicator it governs, the underlying physical basis, and the source figures. Two features are worth emphasizing. First, all behavioral thresholds are directly traceable to the source figures. The compositional range of 40% to 60% dolomite reflects the actual scan in Figure 7 and Figure 8a. The saturation threshold m = 4 corresponds to the converged region in Figure 12. The convergence threshold of 1.2 mm is read directly from Figure 14. No threshold is extrapolated beyond the simulated range. Second, the physical-basis column anchors each threshold to a material property, a statistical structure or a numerical-resolution requirement, so the thresholds acquire mechanistic meaning beyond their numerical values, as elaborated in Section 4.4.3. The Weibull-skewness mechanism underlying the structural-level threshold is plotted in Figure 16, which marks the symmetry transition at m = 3.6 and locates the simulation-based threshold m = 4 within the statistically symmetric regime. Through the joint use of Table 4 and Figure 15 and Figure 16, the framework offers a transparent and reproducible grading template for the mesoscopic mechanical evaluation of ultra-deep heterogeneous dolomite.
Table 4.
Quantitative grading indicators, behavioral thresholds and source figures of the proposed three-level graded characterization framework for ultra-deep heterogeneous dolomite.
Figure 16.
Skewness of the two-parameter Weibull distribution versus the shape parameter m (blue curve). Red dashed line, symmetry transition (m ≈ 3.6); orange band, the saturation threshold adopted here (m ≈ 4); green triangles, the six shape-parameter values used in the sensitivity scan.
4.4.3. Mechanistic Interpretation of the Grading Thresholds
The hierarchical structure reflects three independent physical mechanisms. The compositional level expresses the volume-fraction control of the load-bearing skeleton. As listed in Table 2, dolomite and quartz have elastic moduli of 96.7 GPa and 99.3 GPa, whereas calcite is markedly softer at 69 GPa. A larger combined fraction of the two stiffer phases therefore enlarges the specimen volume that carries the principal compressive load, consistent with the monotonic strength increase in Figure 8a. The vertical stress fields in Figure 7 further show the load concentrating within the connected network of high-modulus grains.
The structural-level threshold m = 4 has a clear statistical interpretation: for a two-parameter Weibull distribution, the skewness transitions from positive, that is, right-skewed and dominated by sub-mean values, to nearly zero as m approaches 3.6. This transition is not fitted to the simulation data. It marks the exact zero-skewness point of the two-parameter Weibull distribution, which follows analytically from the closed-form skewness expression. Below this transition, a substantial fraction of cohesive elements carry sub-mean strength and act as preferential nucleation sites for microcracks. This produces the pronounced pre-peak nonlinearity and early AE onset in Figure 10, consistent with the microcrack-controlled stress–strain behavior of brittle materials [30]. Once m exceeds about 4, the distribution is sufficiently symmetric that the cohesive-element population is statistically homogeneous at the mesoscale, microcrack initiation approaches spatial uniformity, and further increase in m yields diminishing influence. The simulation-based threshold m = 4 in Figure 12 is therefore consistent with the underlying statistical structure of the Weibull-distributed properties rather than an empirical artifact.
The scale-level convergence threshold of 1.2 mm comes from one requirement: the mesh must resolve the compositional and structural heterogeneity at a representative mesoscale. The chosen size is small relative to the characteristic mineral-grain dimension, which provides enough elements to discretize the mineral-domain topology. Coarser meshes blur this topology and underestimate the local stress concentrations. This is seen as the dispersed, weakly localized failure for mesh sizes above 1.2 mm in Figure 13. The convergence of peak strength and modulus in Figure 14 corroborates the threshold. It is consistent with the principle that the representative element size should match, and not fall below, the characteristic heterogeneity length of the material.
4.4.4. Generalizability of the Framework
The three-tier architecture, comprising a compositional base, a structural modifier and a scale prerequisite, is designed to be transferable beyond the present case. Although established for Cambrian ultra-deep dolomite, the architecture itself is expected to remain valid for a broad class of mineralogically heterogeneous deep rocks, including other carbonates, tight sandstones and igneous rocks. Application to a new lithology requires only that the quantitative thresholds of each level be re-determined against the corresponding mineral composition, heterogeneity statistics and grain scale. The hierarchical logic itself remains unchanged: composition sets the baseline strength magnitude; structure governs the stiffness, nonlinearity and failure mode while modulating the strength and strain; and scale sets the resolution.
The framework also has practical engineering value. At the compositional level, mineral logs can rank the strength of different reservoir sections. At the structural level, the degree of heterogeneity links to pre-peak nonlinearity and failure mode. This helps predict brittle failure around the wellbore. The scale level sets the mesh resolution needed for reliable geomechanical models. Together, the three levels can support wellbore-stability analysis and acid-fracturing design in ultra-deep dolomite reservoirs.
5. Validation Under Triaxial Loading
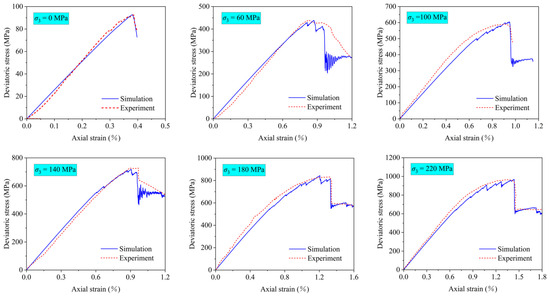
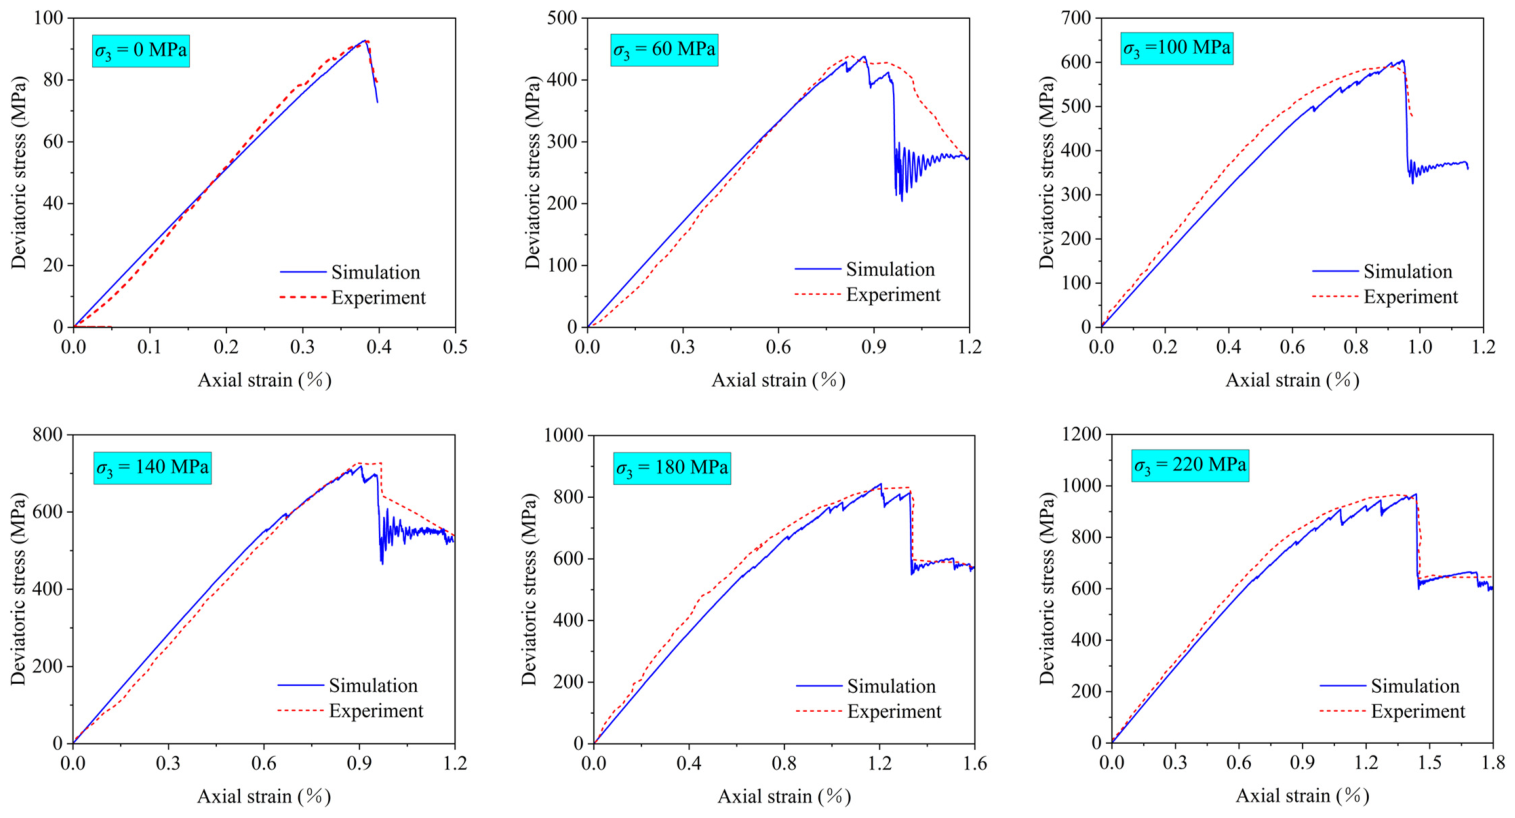
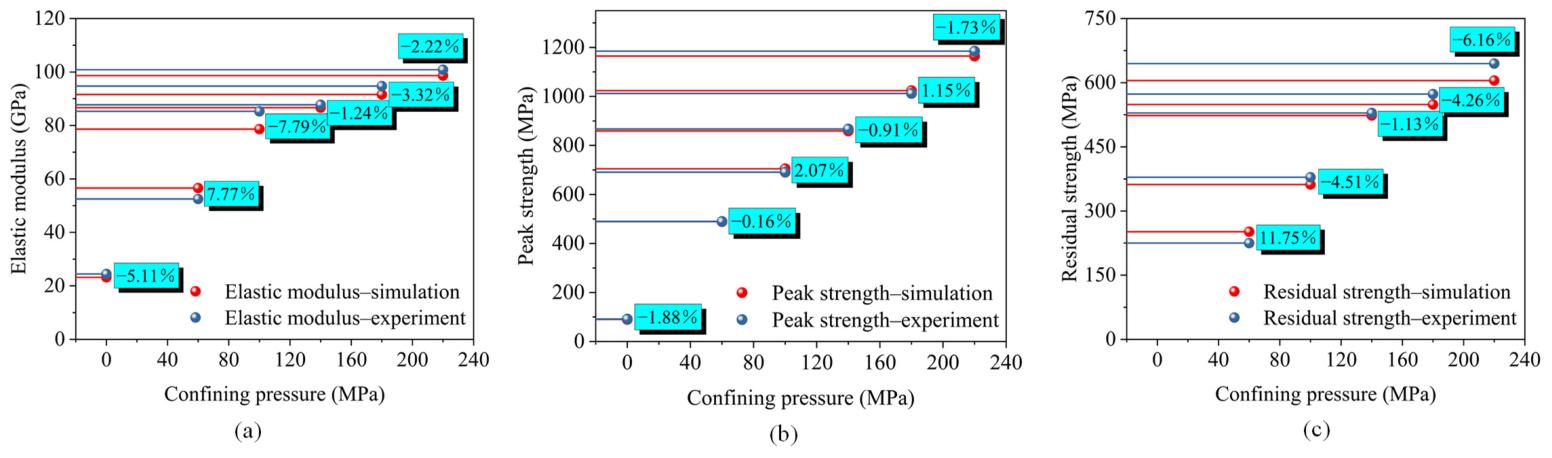
This section validates the mesoscopic model under triaxial loading and verifies that the three-level grading established under uniaxial compression remains consistent in the high-confining-pressure regime relevant to ultra-deep formations. Numerical simulations and laboratory experiments were conducted at six confining pressures, namely 0, 60, 100, 140, 180 and 220 MPa. The model parameters established in Section 3 (Table 2) were adopted, with other inputs set as per Tatone and Grasselli [29]. Figure 17 compares the stress–strain curves from simulation and experiment across the six confining pressures, showing good agreement over the full range. To quantify this agreement, Table 5 lists the experimental and simulated peak strength at each confining pressure. The relative error stays within 3 percent across the range. The coefficient of determination is R2 = 0.9989, which confirms close agreement. Figure 18 compares the elastic modulus, peak strength and residual strength versus confining pressure: all three increase nonlinearly with confining pressure, with the strengthening most pronounced between 0 and 100 MPa and tending to saturate above about 100 MPa. The residual strength in Figure 18c is defined as the stabilized post-peak stress. This is the roughly constant stress that the curve maintains after the main stress drop. The model established under uniaxial compression therefore reproduces the experimental response across the full 220 MPa range. Its internal consistency is maintained at every pressure. The compositional-level ordering of peak strength is preserved. The structural-level saturation threshold m = 4 still delimits the regime in which heterogeneity governs the pre-peak nonlinearity and the failure mode. The scale-level convergence threshold is set by the mineral-domain topology rather than the loading condition, so it too is preserved. The framework is thus applicable across the loading conditions relevant to ultra-deep dolomite formations.
Figure 17.
Comparison of simulated (blue solid) and experimental (red dotted) stress–strain curves of the heterogeneous dolomite at six confining pressures (0, 60, 100, 140, 180 and 220 MPa), one per panel. Vertical axis, deviatoric stress (MPa); horizontal axis, axial strain (%).
Table 5.
Comparison of experimental and simulated peak strength values at each confining pressure.
Figure 18.
Simulated (red circles) versus experimental (blue circles) (a) elastic modulus, (b) peak strength and (c) residual strength versus confining pressure (0–220 MPa). The percentage beside each pair is the relative error; residual strength is the stabilized post-peak stress.
6. Limitations
This study is a two-dimensional mesoscopic modeling investigation, and several limitations should be acknowledged; each indicates a direction for future work.
- (1)
- Two-dimensional modeling. The framework is established under plane two-dimensional conditions, which resolve the in-plane mineral-domain topology but do not represent out-of-plane microstructural heterogeneity. Three-dimensional extension may shift the scale-level convergence threshold and modify the relative roles of the structural-level parameters.
- (2)
- Compositional coverage. The compositional level was characterized within a dolomite-content range of 40% to 60%, bracketing the measured composition. Whether the monotonic strength dependence holds beyond this range, and whether additional sub-levels are required for clay-rich, silica-rich or evaporitic end-members, requires a broader sample library.
- (3)
- Dry, room-temperature conditions. All simulations and the corresponding experiments were performed under dry conditions at room temperature. The weakening effect of pore fluid, the temperature-dependent transition toward ductility, and chemo-mechanical interactions in deep-formation environments are therefore not represented, so the present results may underestimate these effects in situ.
- (4)
- Resolution of the parameter scan. The structural-level thresholds were obtained from a six-point sensitivity scan of the two Weibull shape parameters, and the model was established for a single dolomite lithology. Finer scans near the m = 4 transition and extension to additional lithologies would further constrain the quantitative thresholds, although the underlying Weibull-skewness mechanism is expected to remain valid.
7. Conclusions
Based on the combined finite–discrete element method, a two-dimensional mesoscopic numerical model for Cambrian ultra-deep dolomite from the Tarim Basin was developed. By incorporating X-ray diffraction and scanning electron microscopy with energy-dispersive spectroscopy characterization and a Weibull-distribution discretization scheme for the heterogeneity of both matrix particles and inter-particle cementation, a three-level graded characterization framework was proposed and validated. The main conclusions are as follows.
- (1)
- A dual Weibull discretization scheme for matrix and cementation heterogeneity was established. The two independent shape parameters m1 and m2 exert differentiated and coupled control on the macroscopic response. m1 governs the elastic modulus, essentially independently of m2. m2 governs the pre-peak nonlinearity, the AE onset, the failure mode, and the magnitude and dispersion of peak strength and peak strain. The influence of m1 on peak strength and strain is conditional, becoming appreciable only when m2 is large. This differentiated yet coupled control reflects the complex internal heterogeneity of ultra-deep dolomite, which cannot be captured by a single-parameter discretization.
- (2)
- A three-level graded characterization framework was proposed. It comprises a compositional level that sets the baseline strength magnitude; a structural level that governs the elastic modulus, pre-peak nonlinearity and failure mode; and a scale level that controls the representativeness of the mesoscopic response. Quantitative grading indicators and behavioral thresholds were derived directly from the sensitivity analyses. These are the monotonic strength dependence on dolomite content within 40% to 60%, the saturation of structural-level influence at m = 4, and convergence at a mesh size not exceeding 1.2 mm. The structural-level threshold is supported by the statistical skewness transition of the two-parameter Weibull distribution.
- (3)
- The framework was further validated under triaxial loading. Simulations and experiments at 0 to 220 MPa show good agreement in stress–strain response, with the elastic modulus, peak strength and residual strength all increasing nonlinearly and saturating above about 100 MPa. The three-level grading remains internally consistent throughout the loading range, confirming the applicability of the framework to ultra-deep formation conditions.
The proposed framework provides a transferable methodological reference for the mesoscopic mechanical evaluation of ultra-deep heterogeneous dolomite and similar mineralogically heterogeneous deep rocks. Re-determination of the thresholds for new lithologies and extension to three-dimensional and multi-physics conditions are envisaged as natural directions for future work.
Author Contributions
Conceptualization, H.L. and Y.L.; methodology, H.L.; software, H.L.; validation, H.L., Y.Y. and Y.X.; formal analysis, H.L. and H.W.; investigation, A.S., H.W. and D.Y.; resources, A.S., Y.L. and D.Y.; data curation, H.L., Y.Y. and D.Y.; writing—original draft preparation, H.L.; writing—review and editing, Y.L. and Y.X.; visualization, H.L. and Y.Y.; supervision, Y.X.; project administration, A.S. and Y.X.; funding acquisition, Y.L. and Y.X. All authors have read and agreed to the published version of the manuscript.
Funding
This research was funded by the Key Program of the Joint Fund of the National Natural Science Foundation of China (grant number U24B2029) and the Research Project of PetroChina Tarim Oilfield Company (contract number 671023115007). The APC was funded by the National Natural Science Foundation of China.
Data Availability Statement
The data that support the findings of this study are available from the corresponding author upon reasonable request.
Acknowledgments
The authors sincerely thank PetroChina Tarim Oilfield Company for providing the rock samples and field data, and the journal editors and anonymous reviewers for their constructive comments and valuable suggestions.
Conflicts of Interest
Aisheng Sun, Hongyu Wu and Da Yin are employees of PetroChina Tarim Oilfield Company. The paper reflects the views of the scientists and not the company. The remaining authors declare no conflicts of interest.
References
- Trippetta, F.; Ruggieri, R.; Motra, H.B. Temperature and pressure effects on the mechanical behavior of porous carbonates saturated by viscous fluids. Int. J. Rock Mech. Min. Sci. 2024, 183, 105938. [Google Scholar] [CrossRef] [Scilit]
- Lu, Y.; Jin, Y.; Xia, Y.; Zhu, J. Dynamic analysis model of wellbore instability in deep tight sandstone: Effect of intrinsic frequency and high stress. Mech. Eng. 2023, 45, 1033–1043. (In Chinese) [Google Scholar] [CrossRef]
- Wu, X.; Wan, F.; Chen, Z.; Han, L.; Li, Z. Drilling and completion technologies for deep carbonate rocks in the Sichuan Basin: Practices and prospects. Nat. Gas Ind. B 2020, 7, 547–556. [Google Scholar] [CrossRef] [Scilit]
- Zhou, X.; Lü, X.; Quan, H.; Qian, W.; Mu, X.; Chen, K.; Wang, Z.; Bai, Z. Influence factors and an evaluation method about breakthrough pressure of carbonate rocks: An experimental study on the Ordovician of carbonate rock from the Kalpin area, Tarim Basin, China. Mar. Pet. Geol. 2019, 104, 313–330. [Google Scholar] [CrossRef] [Scilit]
- Jin, Y.; Bo, K.; Zhang, Y.; Lu, Y. Research progress on chemo-mechanical coupling wellbore stability in deep hard brittle shale. Pet. Drill. Tech. 2023, 51, 159–169. (In Chinese) [Google Scholar] [CrossRef]
- Gholami, R.; Rasouli, V.; Aadnoy, B.; Mohammadnejad, M. Geomechanical and numerical studies of casing damages in a reservoir with solid production. Rock Mech. Rock Eng. 2016, 49, 1441–1460. [Google Scholar] [CrossRef] [Scilit]
- Lu, Y.; Chen, M.; Yuan, J.; Jin, Y.; Teng, X. Borehole instability mechanism of a deviated well in anisotropic formations. Acta Pet. Sin. 2013, 34, 563–568. (In Chinese) [Google Scholar] [CrossRef]
- Zhao, L.; Ma, J.; Li, K.; Zhu, J.; Gao, Z.; He, Z.; Geng, J. Seismic rock physics characteristics and modeling of ultra-deep carbonate reservoirs. Chin. J. Geophys. 2023, 66, 16–33. (In Chinese) [Google Scholar] [CrossRef]
- Weger, R.J.; Eberli, G.P.; Baechle, G.T.; Massaferro, J.L.; Sun, Y.-F. Quantification of pore structure and its effect on sonic velocity and permeability in carbonates. AAPG Bull. 2009, 93, 1297–1317. [Google Scholar] [CrossRef] [Scilit]
- Eberli, G.P.; Baechle, G.T.; Anselmetti, F.S.; Incze, M.L. Factors controlling elastic properties in carbonate sediments and rocks. Lead. Edge 2003, 22, 654–660. [Google Scholar] [CrossRef] [Scilit]
- Yin, G.; Zhang, H.; Xin, Y.; Zhang, W.; Wu, X.; Liang, J.; Lai, S. Ultra-deep dolomite reservoir quality classification and its effect on acid-fracturing based on natural fracture activity analysis: A case study of the Cambrian subsalt reservoir in northern uplift of Tarim Basin. Front. Earth Sci. 2022, 10, 904064. [Google Scholar] [CrossRef] [Scilit]
- Wang, X.; Xie, Y.; Lai, J.; Qiu, J. Characterization of rupture and failure of weakly cemented sandstone under uniaxial and triaxial compression: An experimental and DEM study. Powder Technol. 2024, 446, 120175. [Google Scholar] [CrossRef] [Scilit]
- Manouchehrian, A.; Cai, M. Influence of material heterogeneity on failure intensity in unstable rock failure. Comput. Geotech. 2016, 71, 237–246. [Google Scholar] [CrossRef] [Scilit]
- Lan, H.; Martin, C.D.; Hu, B. Effect of heterogeneity of brittle rock on micromechanical extensile behavior during compression loading. J. Geophys. Res. Solid Earth 2010, 115, B01202. [Google Scholar] [CrossRef] [Scilit]
- Munjiza, A. The Combined Finite-Discrete Element Method; John Wiley & Sons: Chichester, UK, 2004; pp. 94–102. [Google Scholar]
- Mahabadi, O.K.; Lisjak, A.; Munjiza, A.; Grasselli, G. Y-Geo: New combined finite-discrete element numerical code for geomechanical applications. Int. J. Geomech. 2012, 12, 676–688. [Google Scholar] [CrossRef] [Scilit]
- Liu, Y.; Weng, L.; Chu, Z. Numerical investigation of rock dynamic fragmentation during rockslides using a coupled 3D FEM-DEM method. J. Mt. Sci. 2022, 19, 1051–1069. [Google Scholar] [CrossRef] [Scilit]
- Aboayanah, K.R.; Abdelaziz, A.; Haile, B.F.; Zhao, Q.; Grasselli, G. Evaluation of damage stress thresholds and mechanical properties of granite: New insights from digital image correlation and GB-FDEM. Rock Mech. Rock Eng. 2024, 57, 4679–4706. [Google Scholar] [CrossRef] [Scilit] [PubMed]
- Qiu, S.; Zhang, S.; Jiang, Q.; Li, S.; Zhang, H.; Wang, Q. Investigation of stress-induced progressive failure of mine pillars using a Voronoi grain-based breakable block model. Int. J. Min. Sci. Technol. 2024, 34, 713–729. [Google Scholar] [CrossRef] [Scilit]
- Deng, P.; Liu, Q.; Lu, H. FDEM numerical study on the mechanical characteristics and failure behavior of heterogeneous rock based on the Weibull distribution of mechanical parameters. Comput. Geotech. 2023, 154, 105138. [Google Scholar] [CrossRef] [Scilit]
- Deng, P.; Liu, Q.; Lu, H.; Wu, Y. Mechanical properties and failure behavior of heterogeneous granite: Insights from a new Weibull-based FDEM numerical model. Eng. Anal. Bound. Elem. 2024, 168, 105924. [Google Scholar] [CrossRef] [Scilit]
- Deng, P.; Liu, Q.; Huang, X.; Bo, Y.; Liu, Q.; Li, W. Sensitivity analysis of fracture energies for the combined finite-discrete element method (FDEM). Eng. Fract. Mech. 2021, 251, 107793. [Google Scholar] [CrossRef] [Scilit]
- Chen, H.; Niu, J.; Zhai, M. Characteristics of the fracture process zone for reservoir rock with various heterogeneity. Energies 2022, 15, 8332. [Google Scholar] [CrossRef] [Scilit]
- Ali, S.; Yan, C.; Wang, T.; Zheng, Y.; Han, D.; Ke, W. Evaluating the impact of calcite and heterogeneity on the mechanical behavior of coal: A numerical study with grain-based finite-discrete element method. Eng. Fract. Mech. 2024, 297, 109880. [Google Scholar] [CrossRef] [Scilit]
- Munjiza, A.; Owen, D.R.J.; Bicanic, N. A combined finite-discrete element method in transient dynamics of fracturing solids. Eng. Comput. 1995, 12, 145–174. [Google Scholar] [CrossRef] [Scilit]
- Mahabadi, O.K.; Grasselli, G.; Munjiza, A. Y-GUI: A graphical user interface and pre-processor for the combined finite-discrete element code, Y2D, incorporating material heterogeneity. Comput. Geosci. 2010, 36, 241–252. [Google Scholar] [CrossRef] [Scilit]
- Lisjak, A.; Liu, Q.; Zhao, Q.; Mahabadi, O.K.; Grasselli, G. Numerical simulation of acoustic emission in brittle rocks by two-dimensional finite-discrete element analysis. Geophys. J. Int. 2013, 195, 423–443. [Google Scholar] [CrossRef] [Scilit]
- Li, C.; Pan, S.; Wang, H.; Deng, J.; Zhao, J.; Li, Z.; Zhang, Y. Rock physical characteristics of deep dolomite under complex geological conditions: A case study of 4th Member of Sinian Dengying Formation in the Sichuan Basin, China. Pet. Sci. 2024, 21, 2370–2382. [Google Scholar] [CrossRef] [Scilit]
- Tatone, B.S.A.; Grasselli, G. A calibration procedure for two-dimensional laboratory-scale hybrid finite-discrete element simulations. Int. J. Rock Mech. Min. Sci. 2015, 75, 56–72. [Google Scholar] [CrossRef] [Scilit]
- Evans, R.H.; Marathe, M.S. Microcracking and stress-strain curves for concrete in tension. Matér. Constr. 1968, 1, 61–64. [Google Scholar] [CrossRef] [Scilit]

Disclaimer/Publisher’s Note: The statements, opinions and data contained in all publications are solely those of the individual author(s) and contributor(s) and not of MDPI and/or the editor(s). MDPI and/or the editor(s) disclaim responsibility for any injury to people or property resulting from any ideas, methods, instructions or products referred to in the content. |
© 2026 by the authors. Licensee MDPI, Basel, Switzerland. This article is an open access article distributed under the terms and conditions of the Creative Commons Attribution (CC BY) license.