


Abstract
Traditionally, waste rock generated in underground mines is transported to the surface and stored in waste rock piles. This practice requires substantial energy consumption and incurs additional operational costs. In Canada, an alternative approach involves directly dumping waste rock into stopes being filled with paste backfill. This method eliminates the need to transport waste rock to the surface and avoid the crushing of large rock blocks into smaller particles, as well as the use of specialized equipment for mechanically mixing the two materials. Consequently, both energy consumption and greenhouse gas emissions are reduced. Furthermore, binder consumption decreases because a portion of the cemented paste backfill is replaced by uncemented waste rock. Despite these advantages, no practical tool is currently available to assist backfill engineers in determining the appropriate amount of waste rock to be dumped. As a result, excessive quantities of waste rock may be added to the paste backfill, leading to inadequate mixing between the two materials. When exposed during the excavation of an adjacent stope, the resulting fill mass may become unstable and fail, causing undesirable consequences. To address this issue, a series of laboratory experiments were conducted to evaluate the effect of several factors, including the solids content and thickness of the paste backfill, the dumping height, the maximum particle size of the waste rock, and the stope dimensions, on the maximum allowed mass of waste rock. Based on the experimental results, an empirical equation was developed to estimate the maximum allowed waste rock mass that can be dumped without causing non-mixing between waste rock and paste backfill. The predictive capability of the proposed equation was successfully validated using additional independent experimental data.
1. Introduction
Underground mining activities generate large quantities of solid waste materials, mainly in the form of waste rock and tailings [1,2,3,4,5]. Tailings consist of water and fine particles produced during the milling process and are typically stored in impoundments, where they settle and consolidate [4,6,7,8]. Tailing impoundments may pose significant geotechnical risks, including seismic-induced liquefaction and potential structural failure [6,7,9,10]. Environmental impacts, such as land disturbance, acid mine drainage, and contaminated neutral drainage, are also major concerns associated with surface disposal of mine waste [11,12,13,14]. The use of mine waste as backfill material for underground stopes can increase ore recovery while reducing the environmental footprint of mining operations [15,16,17,18].
Traditionally, waste rock generated underground is transported to the surface and stored in waste rock piles [11,19,20,21]. This practice requires substantial energy for hauling and handling, significant labor resources, additional operational costs, and results in increased greenhouse gas emissions [22].
An increasingly adopted approach in Canadian underground mines is the direct dumping of waste rock into stopes being filled with paste backfill. This method substantially reduces energy consumption, operational costs, and greenhouse gas emissions because it eliminates the need to crush large waste rock blocks into smaller particles, mechanically mix waste rock with paste backfill, and transport waste rock from underground workings to surface disposal facilities. In addition, binder consumption can be reduced because a portion of the cemented paste backfill is effectively replaced by uncemented waste rock [22,23,24]. Moreover, a well mixed combination of waste rock and cemented paste backfill may exhibit higher mechanical strength than either material individually [25,26,27].
Despite these advantages, dumping waste rock onto cemented paste backfill in stopes may also involve significant risks. When an excessive quantity of waste rock is dumped onto the cemented paste backfill, insufficient mixing between the two materials may occur. Consequently, the fill mass may collapse upon side exposure during the excavation of neighboring stopes, resulting in undesirable consequences such as ore dilution or loss, equipment damage, and in some cases, personal injury or death. Therefore, waste rock dumping operations onto cemented paste backfill in stopes must be properly managed. This requires the development of a reliable tool to guide the waste rock dumping operations.
Over the past few decades, numerous studies have been devoted to underground backfilling using a single backfill (e.g., [15,16,17,28,29,30,31]). In contrast, limited attention has been given to the concept of natural mixing, in which waste rock is directly dumped onto paste backfill without mechanical blending. Several studies have examined mechanically mixed materials, such as graded waste rock combined with tailings slurry or cemented paste backfill [25,26,27,32,33,34,35]. In these cases, waste rock typically needs to be crushed, well graded, and mechanically mixed with tailings or cemented backfill to produce a uniform and controlled composite material. Dedicated equipment is required for these operations. Increased energy consumption, operational costs, and greenhouse gas emissions represent additional non-negligible limitations of such mechanical mixing processes.
Recently, Zhang and coworkers [23,24,36,37] investigated the natural mixing behavior between dumped waste rock and paste backfill. Their results demonstrated that the degree of mixing can be enhanced by increasing the falling height and maximum particle size of the waste rock and by reducing the solids content of the paste backfill [36]. However, an important knowledge gap remains, as no studies have provided a practical and quantitative tool for estimating the amount of waste rock that can be safely dumped onto paste backfill in a stope without causing substantial non-mixing between the two materials.
To address this gap, a series of laboratory tests were conducted to evaluate the effects of various factors, including the solids content and thickness of the paste backfill, the falling height and maximum particle size of the waste rock, and the stope dimensions, on the maximum allowable mass of waste rock. An empirical equation is proposed to estimate the maximum allowable waste rock mass that can be dumped without causing substantial non-mixing between the waste rock and paste backfill. The equation and its associated empirical constants were developed using a set of experimental results. The predictive capability of the proposed model was subsequently validated using new and independent experimental data.
2. Small-Scale Laboratory Tests
2.1. Materials
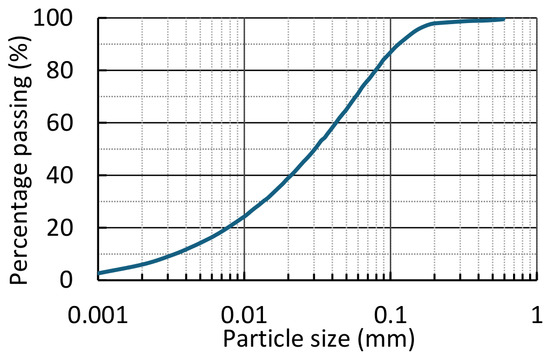
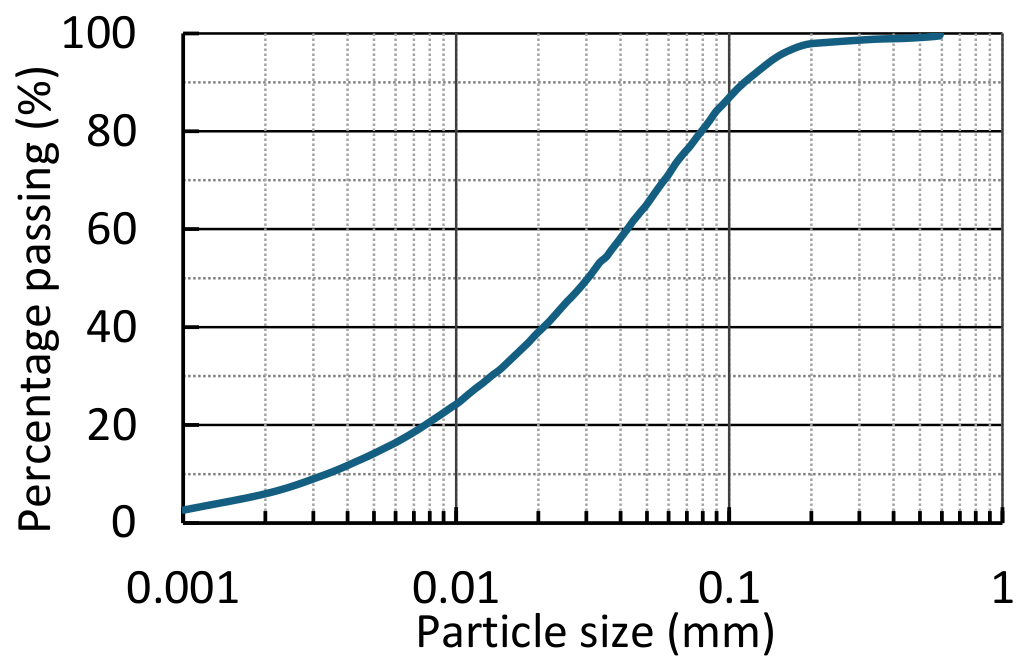
The tailings used in this study for paste backfill preparation were collected from an underground mine (hereafter referred to as Mine A) located in Quebec, Canada. The tailings are non-sulfidic, with a specific gravity of 2.77 and a dry density of approximately 1 550 kg·m−3. Their particle size distribution (PSD) curve is presented in Figure 1. The maximum particle size (dmax) is approximately 0.6 mm, and about 75% of the particles are finer than 80 µm.
Figure 1.
Particle size distribution of the tailings used in the small-scale tests.
Waste rock was obtained from an open pit mine (hereafter referred to as Mine B), also in Quebec, Canada. The waste rock samples were prepared by applying a double-scalping technique to the original material [23,24,38,39]. Particles larger than 10 mm and smaller than 1 mm were removed. The oversized particles were excluded to facilitate cutting of hardened mixture samples during post-test analyses. The fine particles were removed to ensure that all waste rock particles within the waste rock–paste backfill mixtures could be readily distinguished from the paste backfill by visual inspection.
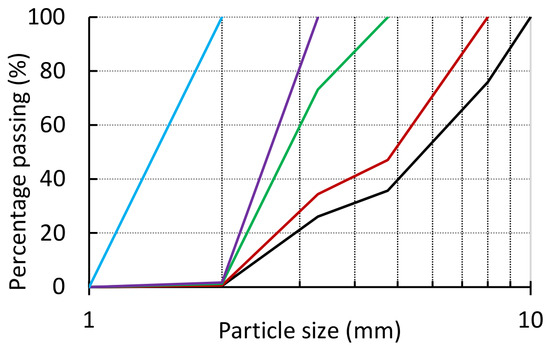
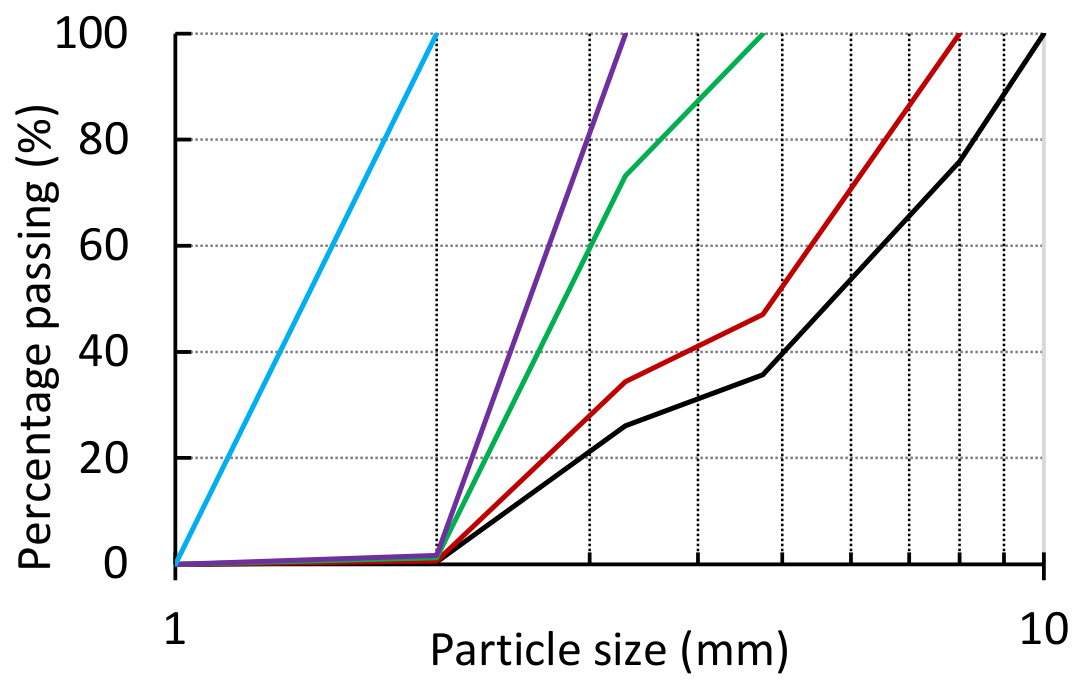
Five waste rock samples with maximum particle sizes () of 2 mm, 3.35 mm, 4.75 mm, 8 mm, and 10 mm were prepared using the double-scalping technique and tested. Their PSD curves are presented in Figure 2.
Figure 2.
PSDs of waste rock samples with dmax values of 2 mm (blue line), 3.35 mm (purple line), 4.75 mm (green line), 8 mm (red line), and 10 mm (black line), prepared using the double-scalping technique and used to investigate the effect of maximum particle size on the maximum allowable mass of waste rock.
2.2. Experimental Setup
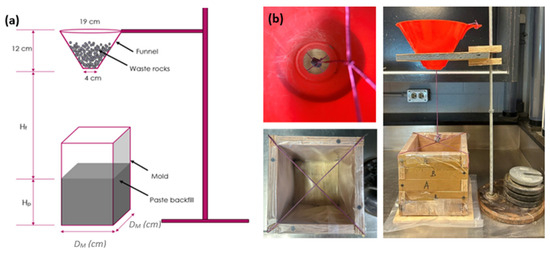
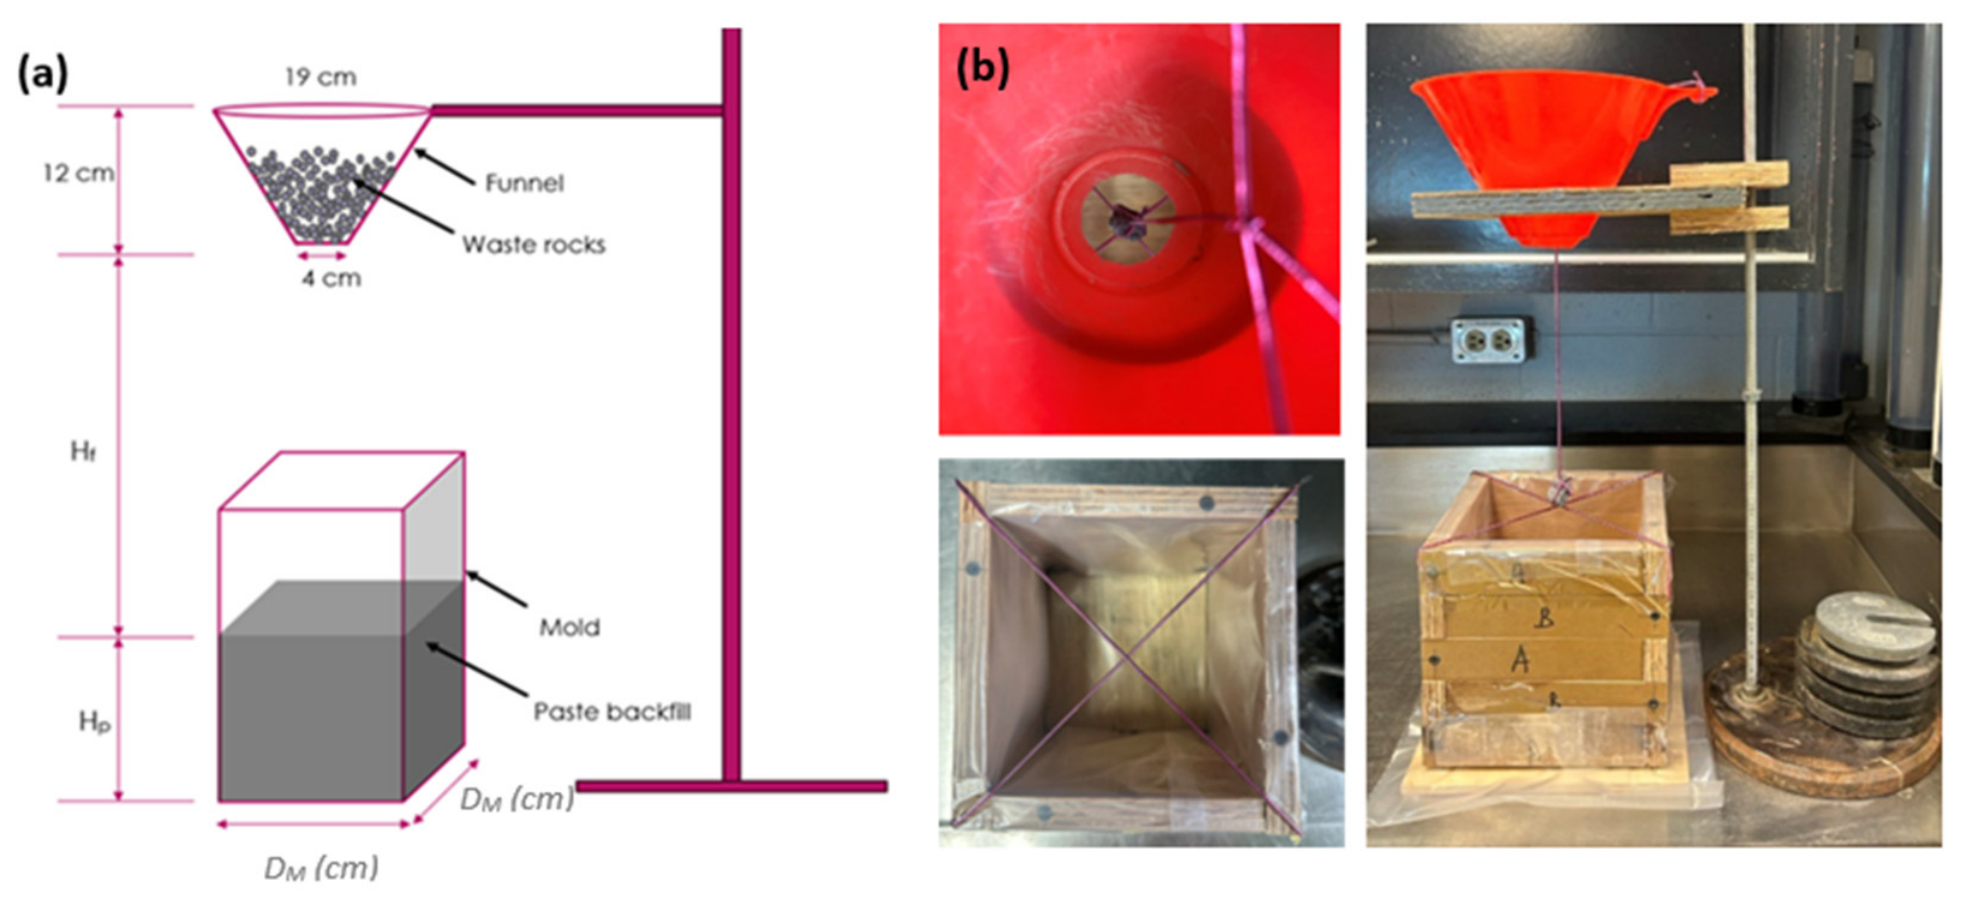
Figure 3 illustrates the small-scale experimental setup used in this study after several improvements were implemented (details are provided in Appendix A). Figure 3a presents a schematic representation of the system, while Figure 3b shows a photograph of the physical model.
Figure 3.
Small-scale physical model used to investigate the natural mixing of waste rocks dumped onto paste backfill: (a) a schematic presentation of the experimental setup; (b) a photograph of the physical model.
A mold with internal dimensions of 15 cm × DM × DM was used to represent a simplified mine stope at the laboratory scale. A funnel with a top diameter of 19 cm, a bottom outlet diameter of 4.0 cm, and a height of 12 cm was positioned vertically and centered above the mold. The parameter represents the thickness of the paste backfill layer placed in the mold. The waste rock falling height, denoted as (cm), is defined as the vertical distance between the funnel outlet and the surface of the paste backfill.
2.3. Test Procedure
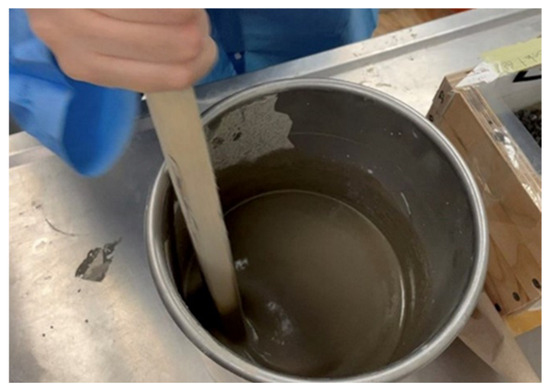
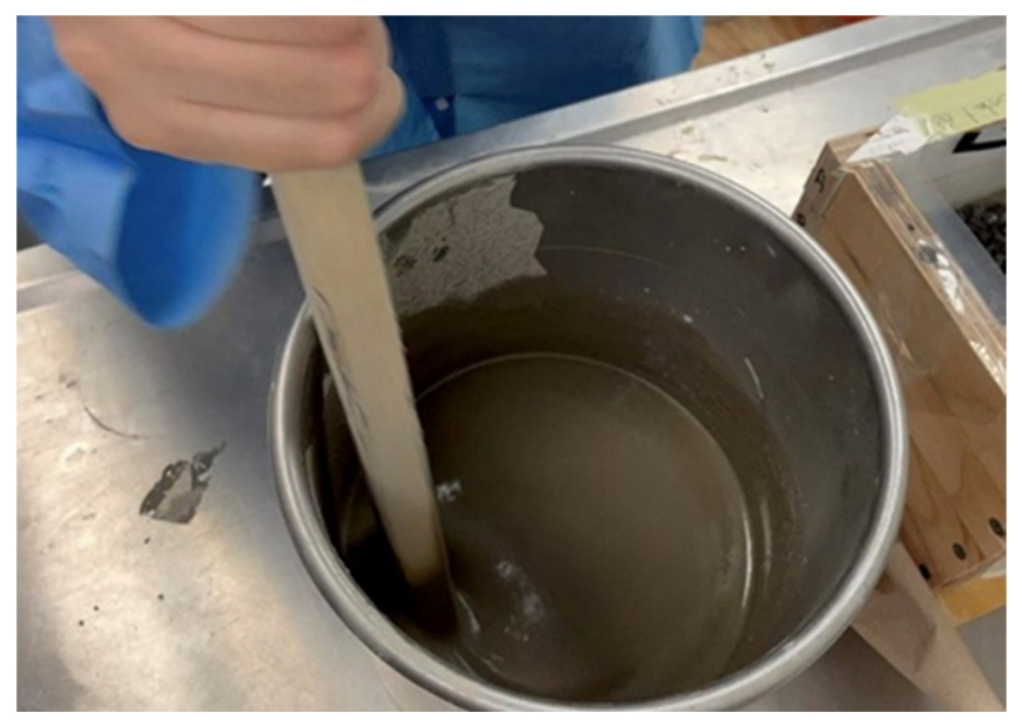
Prior to testing, the tailings were oven-dried for 24 h and then allowed to cool to room temperature. This step was necessary to prevent unintended water evaporation during sample preparation and to ensure accurate control of the solids content. The dried tailings were manually mixed with water to prepare paste backfill with the desired solids content by mass (), as shown in Figure 4. Mechanical mixing was initially evaluated but not adopted because it resulted in incomplete homogenization, with a portion of the tailings remaining at the bottom of the mixing container. Manual mixing produced a more uniform mixture.
Figure 4.
Manual preparation of paste backfill by mixing tailings and water.
The paste backfill was mixed for a minimum of 15 min at room temperature to ensure consistency among the tests. For each experiment, paste backfill with a specified solids content () was poured into the mold of width DM to a predetermined thickness (). To prevent tailings sedimentation and to maintain mixture homogeneity, the paste backfill was continuously mixed until it was poured into the mold.
The funnel was then positioned at a specified falling height () above the paste backfill surface. A predetermined mass of waste rock () with a specified maximum particle size () was weighed and placed into the funnel. Waste rock was gradually dumped onto the paste backfill surface until waste rock particles were observed to remain on the paste backfill surface without penetrating into the material.
The remaining waste rock in the funnel () was then measured. The paste backfill–waste rock samples were left in the mold to cure under natural laboratory conditions for 7 to 10 days. After the curing period, the waste rock remaining on the surface of the paste backfill () was carefully collected and weighed. The mass of waste rock that had penetrated into the paste backfill but remained unmixed () was also removed and weighed.
The hardened samples were subsequently cut vertically through their centerline to examine the internal structure and evaluate the quality of mixing. The maximum allowable mass of waste rock that successfully mixed with the paste backfill was calculated as follows:
To evaluate the individual influence of each parameter, a controlled experimental strategy was adopted. In each test series, only one parameter was varied while all other parameters were maintained at predetermined values. This one-factor-at-a-time approach allowed the independent effect of each parameter on the maximum allowable waste rock mass to be assessed. The overall experimental program is summarized in Table 1.
Table 1.
A summary of the experimental program used to investigate the factors affecting the maximum allowable waste rock mass.
2.4. Test Results
2.4.1. Effect of Solids Content of Paste Backfill, Cw
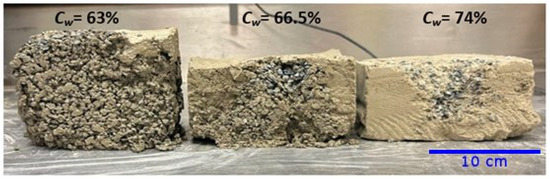
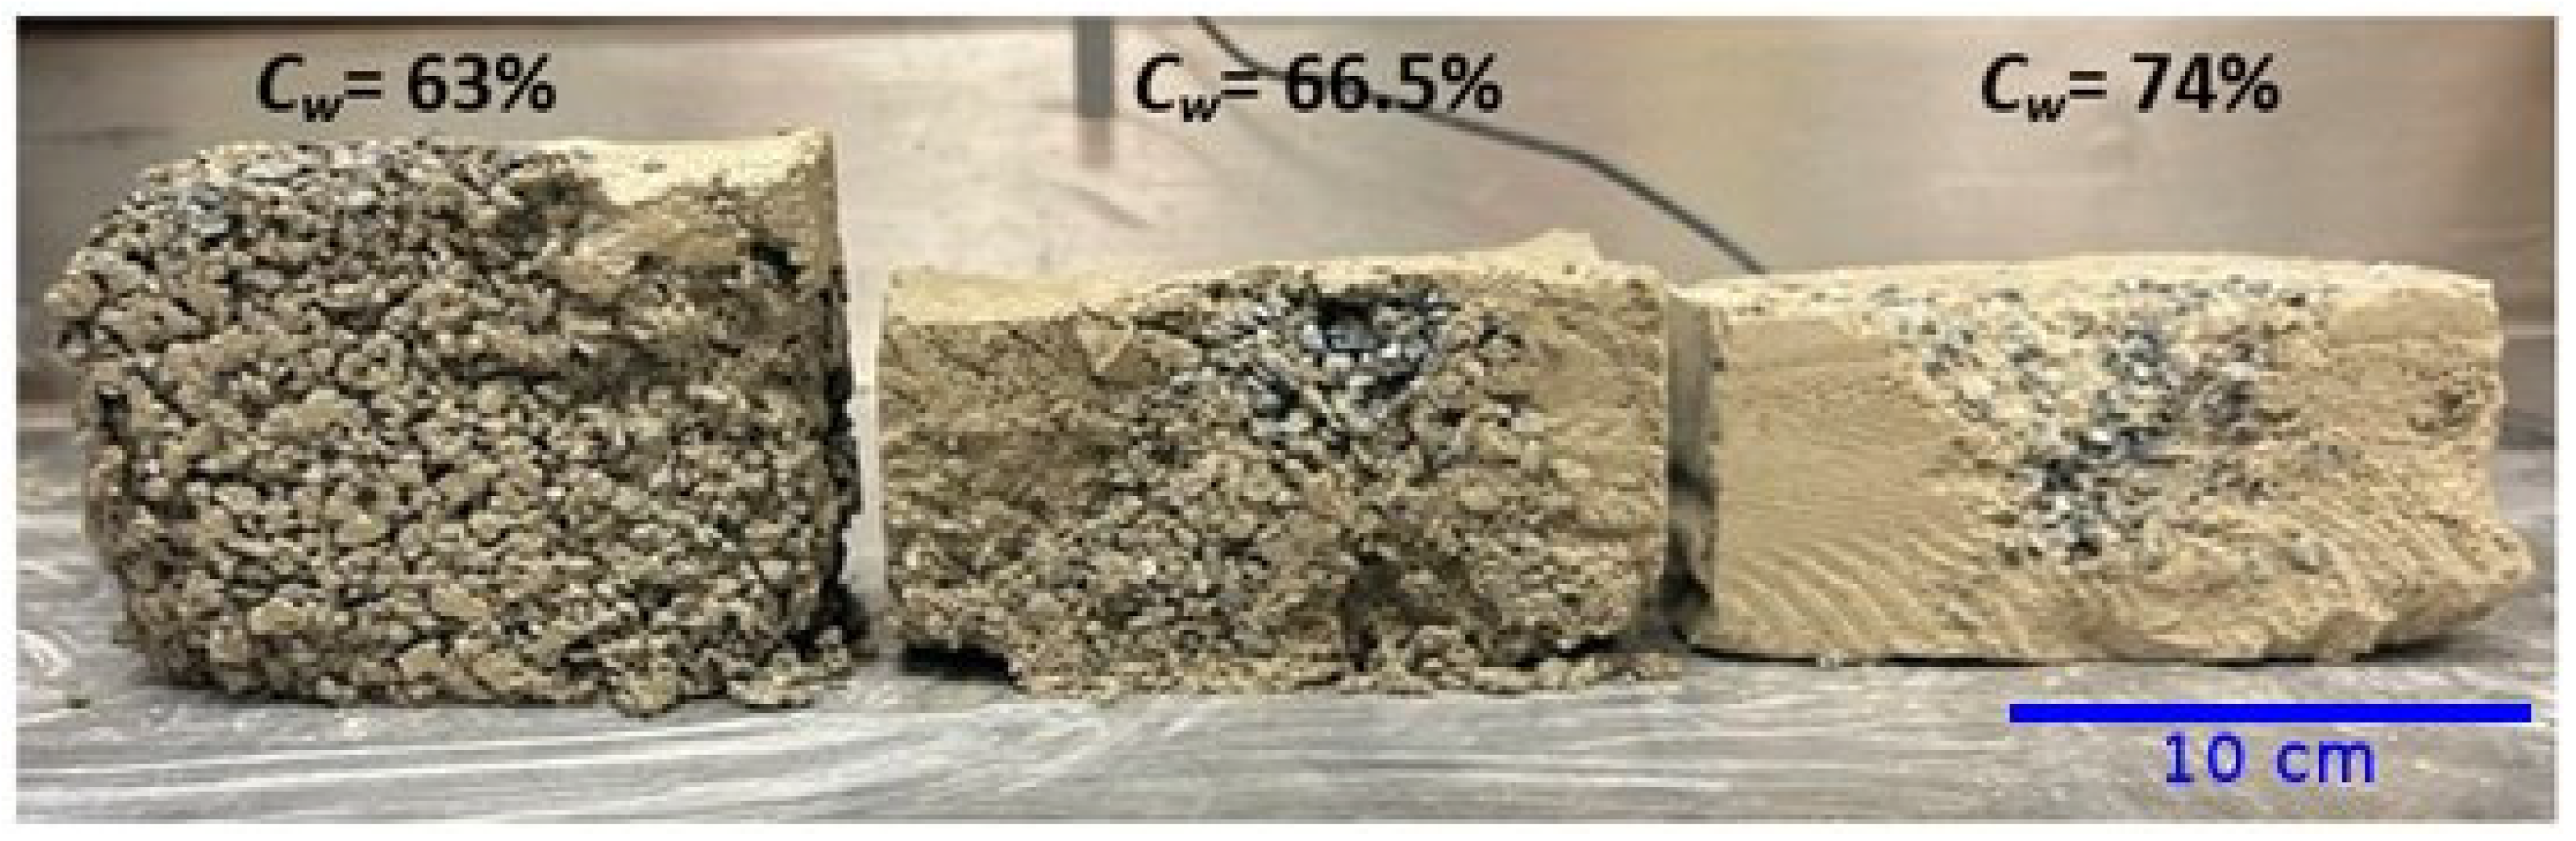
Figure 5 illustrates the distribution of waste rock within paste backfill of different solids contents along a vertical center section. At a solids content of 63%, waste rock occupies a large volume throughout most of the sample. In contrast, at a solids content of 74%, the waste rock is mainly concentrated in a V-shaped zone. These observations indicate that a lower solids content facilitates natural mixing, allowing a larger volume of waste rock to be dumped into the paste backfill without substantial non-mixing between the two materials.
Figure 5.
The internal texture structure of waste rock–paste backfill mixtures obtained with paste backfill solids contents of 63%, 66.5%, and 74% (from left to right); the experimental conditions correspond to Case 1 in Table 1.
For the sample with a solids content of 63%, the paste backfill exhibited a relatively fluid behavior, allowing waste rock particles to penetrate deeply into the material. The waste rock reached the bottom of the mold and extended to the side walls, producing a dense internal texture structure resembling that of concrete with a relatively uniform particle distribution. Strictly speaking, at such a low solids content, the uncemented paste backfill would be more appropriately classified as thickened tailings rather than paste backfill. Similar considerations may apply to mixture with solids content up to approximately 66.5%.
The distinction between thickened tailings and paste backfill remains a subject of discussion. According to commonly cited criteria in mining backfill handbooks [35,40], paste backfill should not exhibit bleeding upon deposition. However, as noted by Zheng and Li [41], complete elimination of bleeding is only possible when the backfill is unsaturated. Consequently, additional water is generally required to ensure adequate flowability during transportation. For this reason, materials that do not fully satisfy the traditional no-bleeding criterion are still widely referred to as paste backfill in the mining industry.
When the solids content increased to 66.5%, the paste backfill became more viscous and resistant to particle penetration. Under these conditions, the maximum allowable waste rock mass decreased to 1000 g. Although the waste rock particles still penetrated to the bottom of the mold, some regions remained free of waste rock particles.
At the highest solids content of 74%, the paste backfill exhibited the greatest consistency and strongly resisted particle penetration. Most of the waste rock remained near the surface, and only a limited quantity was able to penetrate into the paste backfill. As a result, the maximum allowable waste rock mass decreased to only 69 g.
These observations are consistent with the findings reported by Zhang and Li [36], who showed that the degree of natural mixing between dumped waste rock and paste backfill decreases as the solids content of the paste backfill increases. Their study demonstrated that lower solids contents promote deeper particle penetration and greater mixing efficiency, whereas higher solids contents restrict waste rock penetration. The present results therefore confirm the critical role of paste backfill solids content in controlling the natural mixing behavior between waste rock and paste backfill.
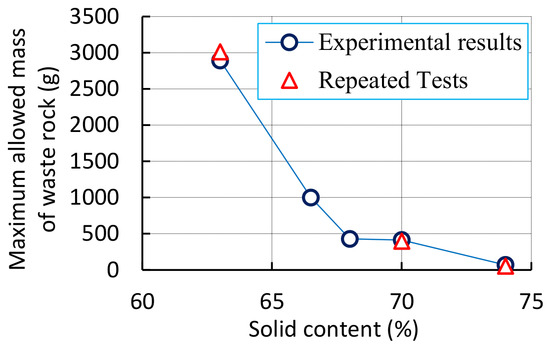
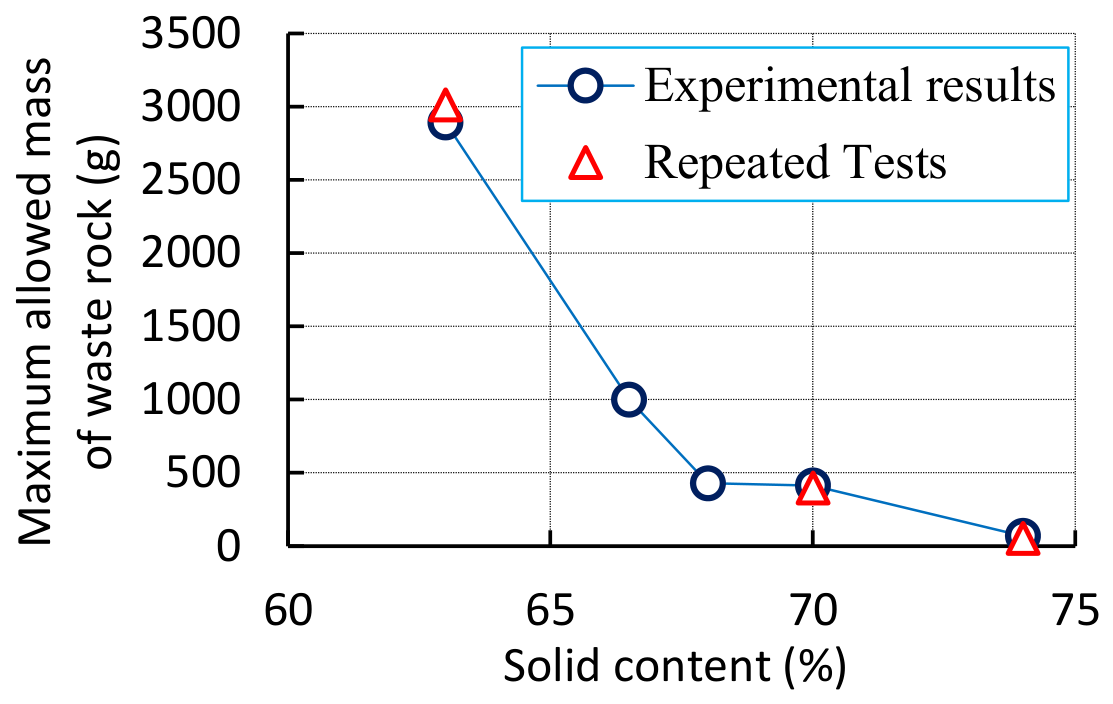
Figure 6 shows the variation in the maximum allowable waste rock mass as a function of paste backfill solids content. The maximum allowable waste rock mass decreases markedly with increasing solids content. When the solids content increased from 63% to 74%, the maximum allowable waste rock mass decreased from 2891.8 g to 69 g. The repeated tests (orange markers) follow the same curve trend as the primary tests, confirming the repeatability and reliability of the experimental results (the rationale for the repeated tests is provided in Appendix B).
Figure 6.
The variation in the maximum allowable waste rock mass as a function of paste backfill solids content; the experimental conditions correspond to Case 1 in Table 1.
The trend can be explained by the rheological behavior of paste backfill. Increasing the solids content generally increases both the yield stress and viscosity of the material, thereby reducing the ability of waste rock particles to penetrate into the paste backfill. At lower solids contents, the paste backfill behaves more like a fluid, allowing waste rock particles to sink more easily and mix with the surrounding material. In contrast, at higher solids contents, the paste backfill behaves as a stiffer material that resists particle penetration and limits the degree of mixing between the two materials.
2.4.2. Effect of Paste Backfill Thickness Hp
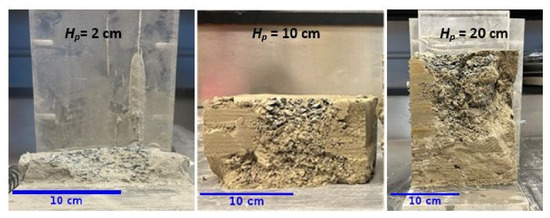
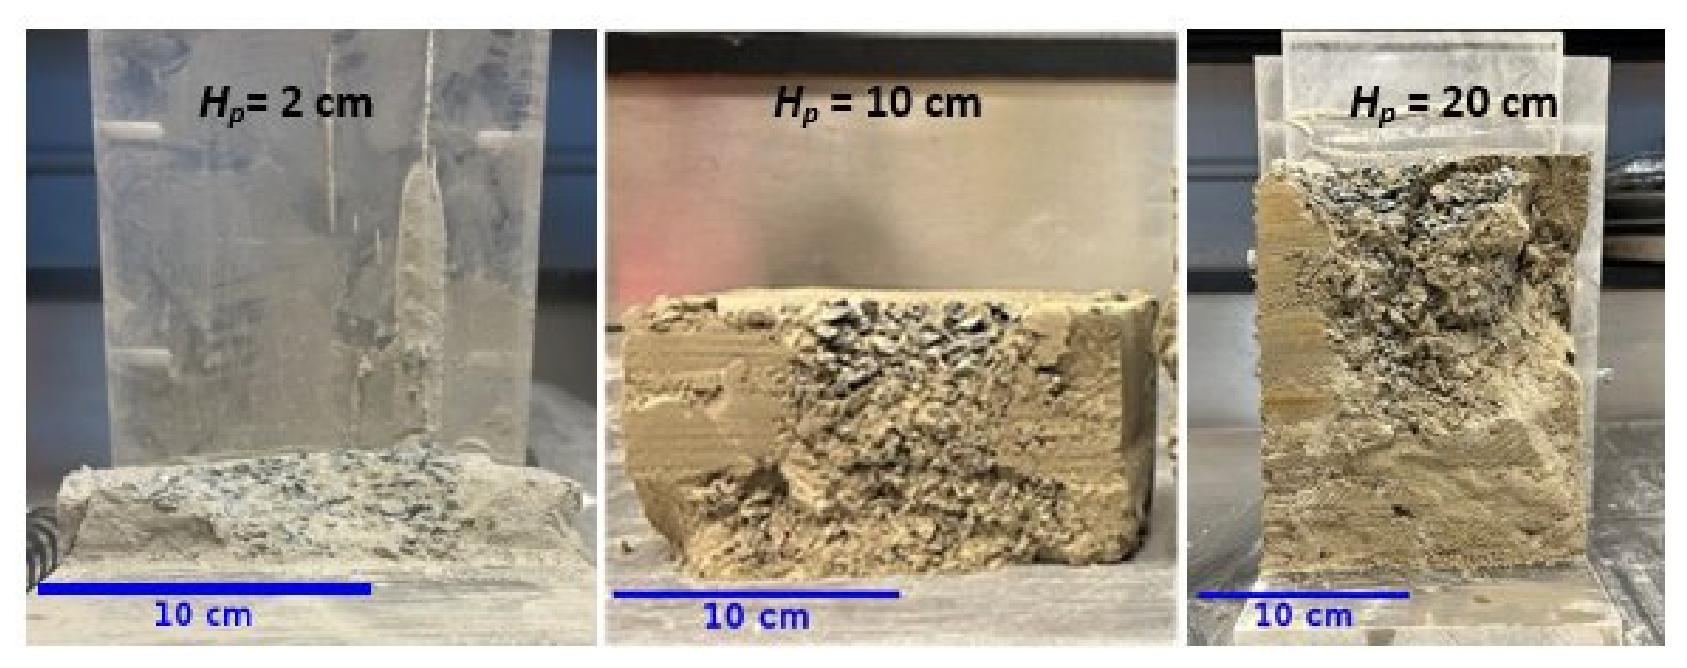
Figure 7 illustrates the internal texture structure of the waste rock–paste backfill samples observed along a vertical central section for paste backfill thickness () of 2 cm, 10 cm, and 20 cm, respectively.
Figure 7.
The internal texture structure of waste rock–paste backfill samples observed along a vertical central section for paste backfill thickness (Hp) of 2 cm, 10 cm, and 20 cm (from left to right), respectively; the experimental conditions correspond to Case 2 in Table 1.
For the sample with a paste backfill thickness of 2 cm, the available space for waste rock penetration was very limited. Under this condition, the waste rock particles rapidly reached the bottom of the mold, which restricted further penetration into the paste backfill. As a result, the maximum allowable waste rock mass was relatively low.
When the paste backfill thickness increased to 10 cm, a larger volume became available for waste rock penetration. The waste rock particles were able to sink deeper into the paste backfill and reach the bottom of the mold, resulting in a higher maximum allowable waste rock mass.
A further increase in paste backfill thickness to 20 cm provided an even greater space for particle penetration, allowing more waste rock particles to enter the paste backfill. However, owing to the relatively high solids content of the paste backfill (), the material exhibited a relatively stiff consistency. Consequently, the waste rock particles did not reach the bottom of the mold and were mainly distributed within the upper and middle portions of the paste backfill layer.
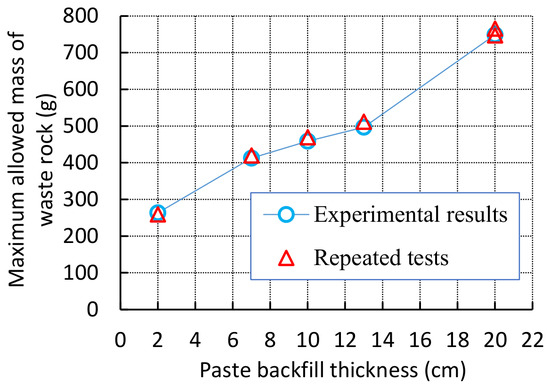
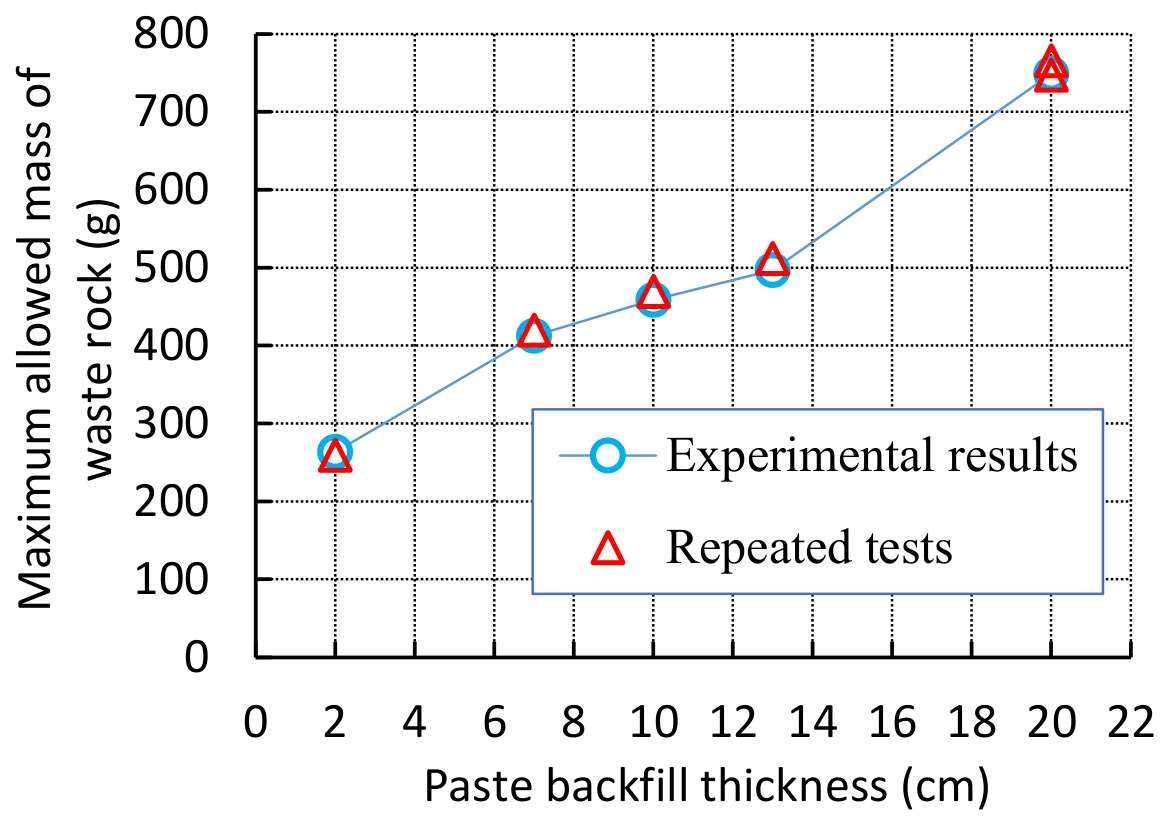
Figure 8 shows the variation in the maximum allowable waste rock mass as a function of paste backfill thickness. The maximum allowable waste rock mass increases with increasing paste backfill thickness. This trend is expected because a thicker paste backfill layer provides a longer penetration path for waste rock particles driven by their kinetic energy before reaching the bottom of the mold. As a result, a larger quantity of waste rock can penetrate into the paste backfill and become mixed with it.
Figure 8.
The variation in the maximum allowable waste rock mass as function of paste backfill thickness; the experimental conditions correspond to Case 2 in Table 1.
2.4.3. Effect of Maximum Particle Size (Dmax) of Waste Rock
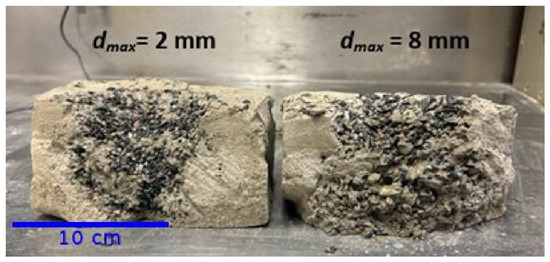
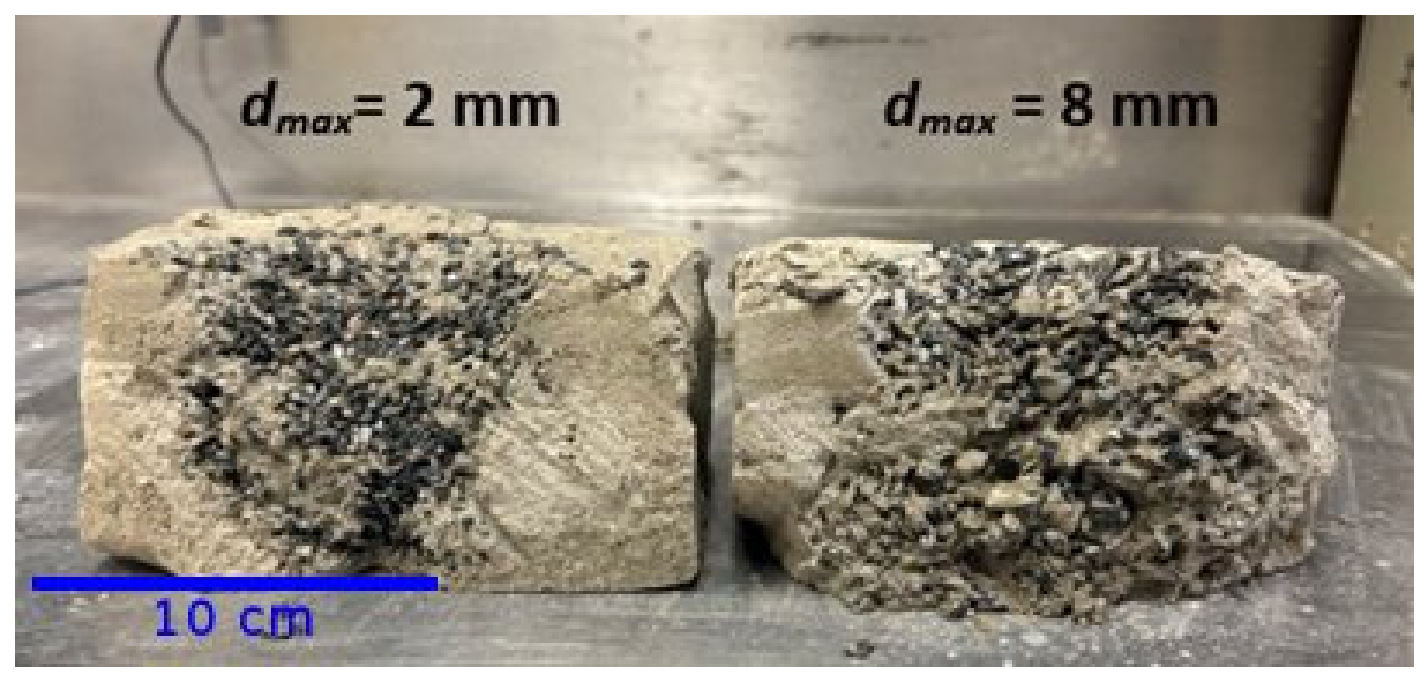
Figure 9 illustrates the internal texture structure of waste rock–paste backfill samples observed along a vertical central section. For the sample containing waste rock with a maximum particle size (dmax) of 2 mm, the particles mainly accumulated in a cone-shaped zone directly beneath the dumping point. In contrast, for the sample containing waste rock with a maximum particle size of 8 mm, the particles penetrated much deeper into the paste backfill and extended toward the bottom of the mold, occupying most of the lower portion of the sample. In both cases, some regions near the side walls remained free of waste rock particles.
Figure 9.
The internal texture structure of waste rock–paste backfill samples containing waste rock with maximum particle sizes (dmax) of 2 mm (left) and 8 mm (right); the experimental condition correspond to Case 3 in Table 1.
These observations are consistent with the findings reported by Zhang and Li [32], who showed that larger waste rock particles penetrate deeper into paste backfill and enhance the degree of natural mixing between the two materials.
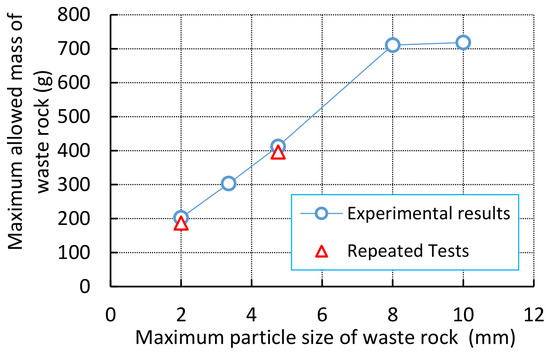
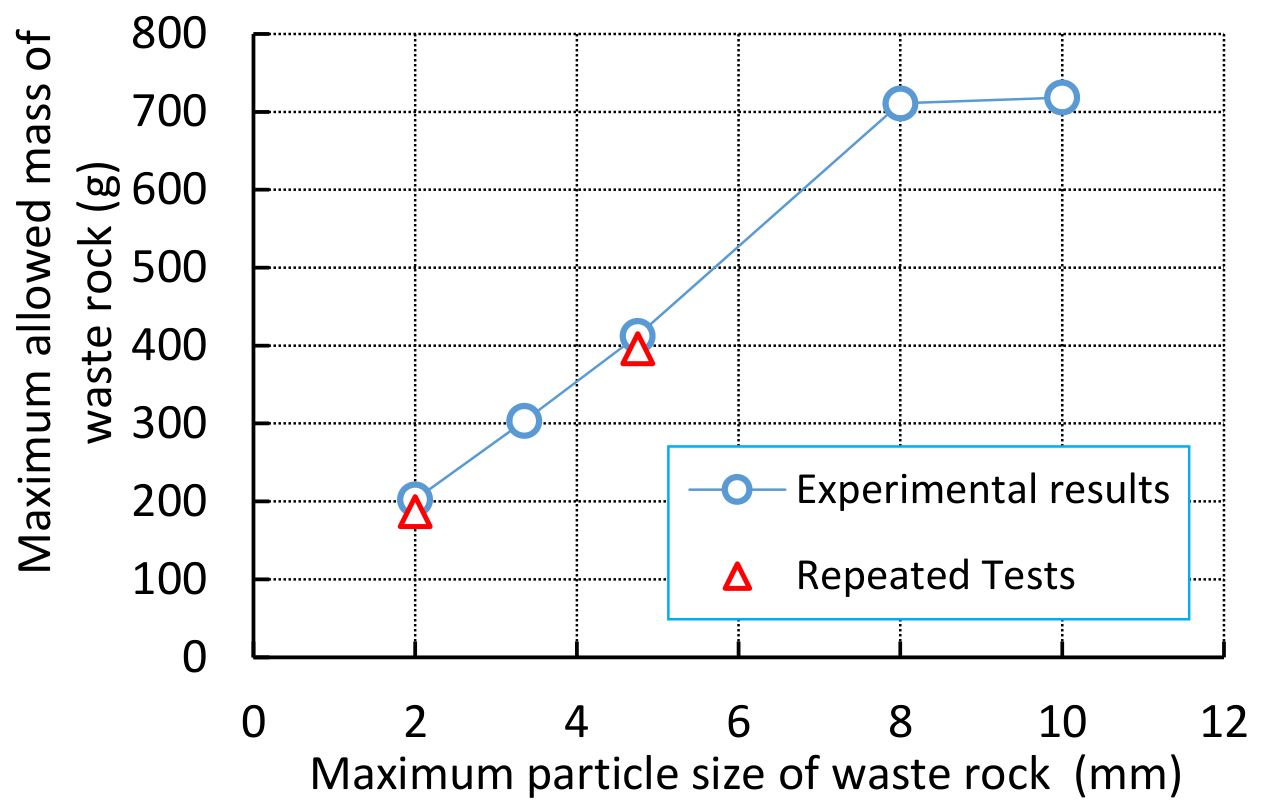
Figure 10 shows the variation in the maximum allowable waste rock mass as a function of the maximum particle size of the waste rock. As the maximum particle size increased from 2 mm to 8 mm, the maximum allowable waste rock mass increased from approximately 202.5 g to about 711 g. The repeated tests (orange markers) follow the same trend as the primary tests, demonstrating the good repeatability and reliability of the experimental results.
Figure 10.
The variation in the maximum allowable waste rock mass as a function of the maximum particle size of waste rock; the experimental conditions correspond to Case 3 in Table 1.
This trend can be explained by the kinetic energy of falling waste rock particles. Larger particles possess greater mass and therefore higher kinetic energy upon impact with the paste backfill surface. The increased kinetic energy enables the particles to overcome the resistance of the paste backfill more effectively and penetrate deeper into the material, thereby increasing the quantity of waste rock that can mix with the paste backfill. However, when the maximum particle size increased from 8 mm to 10 mm, the maximum allowable waste rock mass increased only slightly, from approximately 711 g to 718.4 g. This result suggests that beyond a certain particle size, the influence of maximum particle size on the maximum allowable waste rock mass becomes relatively limited.
To better understand the nearly constant maximum allowable waste rock mass observed when the maximum particle size increased beyond 8 mm, it is useful to consider the truncated cone-shaped distribution of waste rock shown in Figure 9. This geometry was formed by the accumulation of dumped waste rock particles, similar to that observed in angle-of-repose tests. Using the same waste rock material as that employed in the present study, Zhang et al. [34] showed that the angle of repose is essentially independent of the maximum particle size, provided that the quantity of waste rock is sufficiently large. Since the base dimension of the stope model remained constant, the volume of the truncated cone-shaped waste rock zone changed only slightly with increasing maximum particle size. Consequently, the nearly constant maximum allowable waste rock mass observed for particle sizes greater than 8 mm can be reasonable explained.
2.4.4. Effect of Falling Height of Waste Rock, Hf
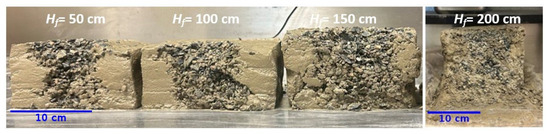
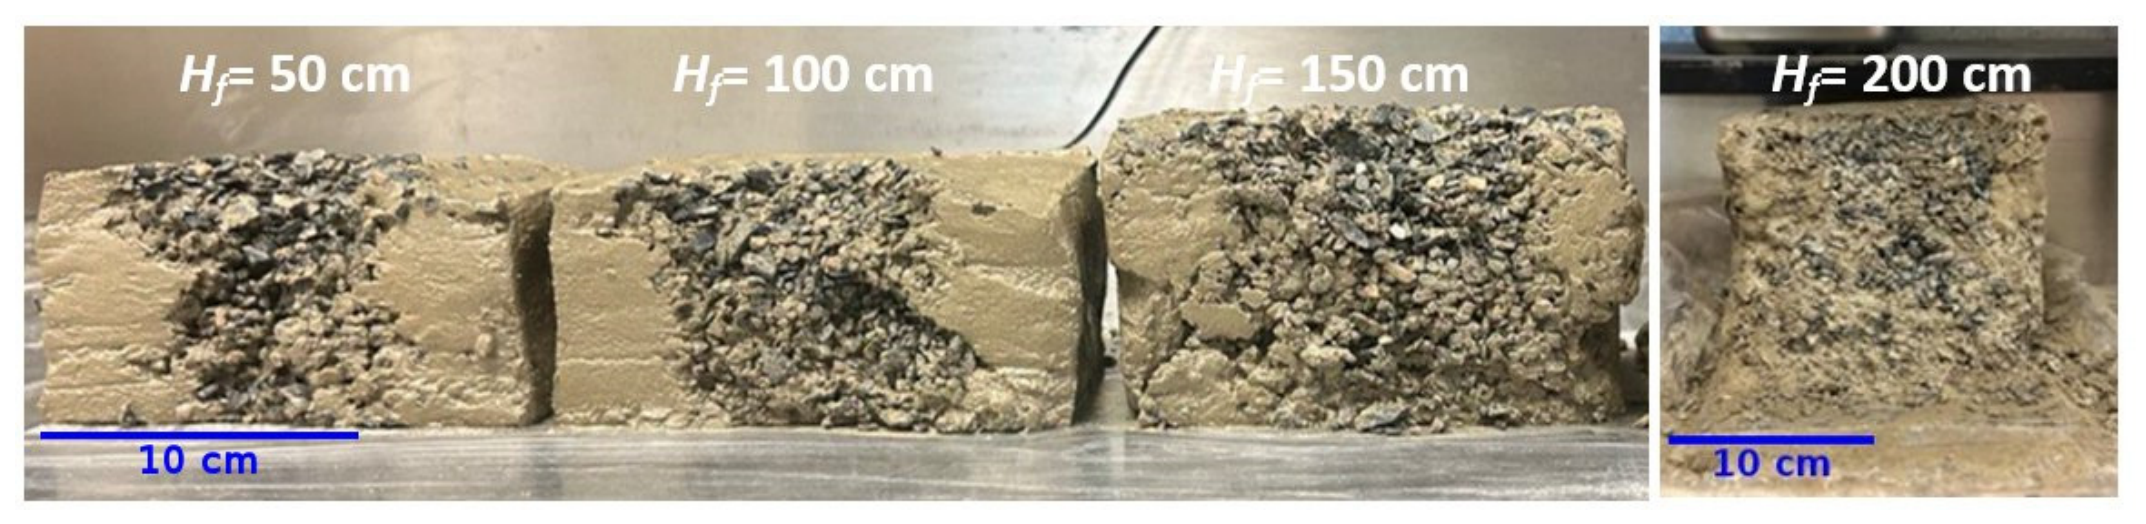
Figure 11 illustrates the internal texture structure of waste rock-paste backfill samples observed along a vertical central section for different waste rock falling heights. At a falling height of 50 cm, the waste rock particles mainly penetrated vertically toward the bottom of the mold but did not reach the side walls. A similar penetration pattern was observed at a falling height of 100 cm, where the particles remained concentrated within a relatively localized zone beneath the dumping point.
Figure 11.
The internal texture structure of waste rock–paste backfill samples observed along a vertical central section for waste rock falling heights of 50 cm, 100 cm, 150 cm, and 200 cm (from left to right), respectively; the experimental conditions correspond to Case 4 in Table 1.
When the falling height increased to 150 cm, the waste rock particles penetrated deeper into the paste backfill and spread closer to the mold walls compared with the samples prepared at lower falling heights. At the highest falling height of 200 cm, the particles reached the mold walls and occupied a much larger area within the paste backfill. Nevertheless, some regions of the sample remained free of waste rock particles.
As the quantity of waste rock penetrating into the paste backfill increases, a larger volume of the paste backfill becomes occupied by waste rock particles, resulting in a thicker mixed zone between the waste rock and the paste backfill.
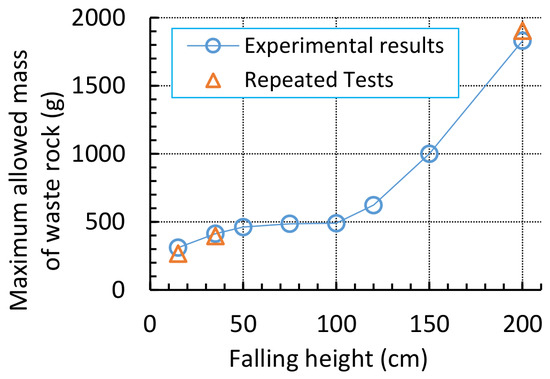
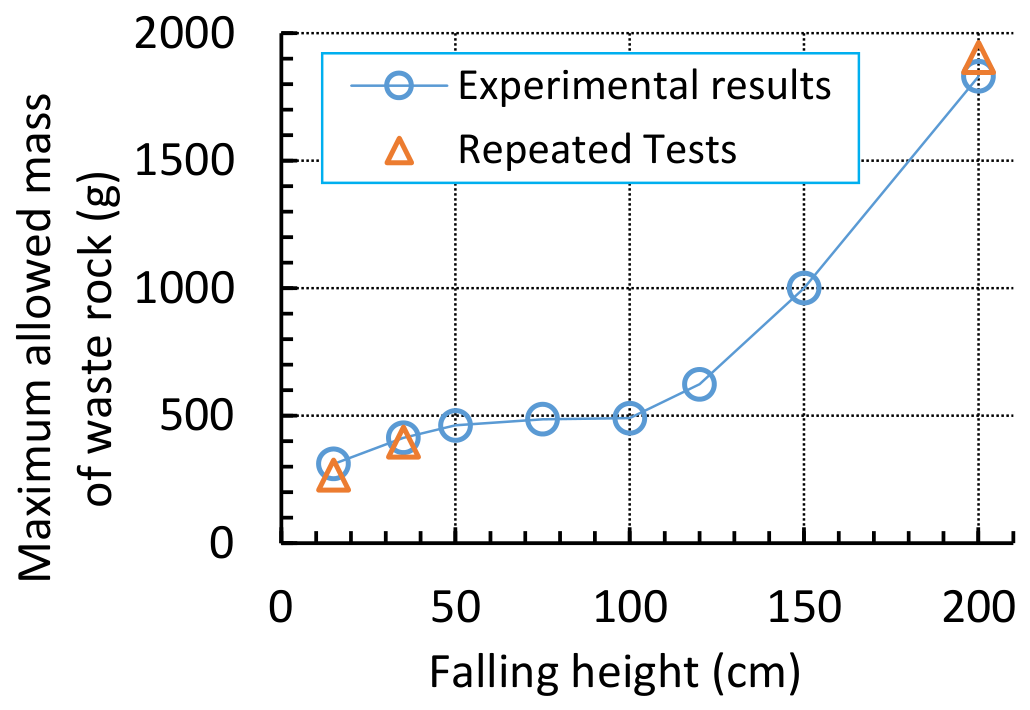
Figure 12 shows the variation in the maximum allowable waste rock mass as a function of waste rock falling height. In general, the maximum allowable waste rock mass increases with increasing falling height, which is consistent with the observations reported by Zhang and Li [32].
Figure 12.
The variation in the maximum allowable waste rock mass as a function of waste rock falling height; the experimental conditions correspond to Case 4 in Table 1.
More specifically, the maximum allowable waste rock mass initially increased and then tended to remain nearly constant as the falling height increased from 15 cm to 100 cm. This behavior can be explained by the increase in the kinetic energy of the falling waste rock particles. At relatively small falling heights, increasing the falling height increases the impact velocity and kinetic energy of the particles, thereby promoting deeper penetration into the paste backfill and allowing a larger quantity of waste rock to become mixed with the paste backfill.
As the falling height continues to increase, the falling velocity gradually approaches its terminal value because the drag force acting on the particles increases with velocity. Once the drag force becomes comparable to the gravitational force, further increases in falling height result in only limited increases in particle velocity and kinetic energy. Consequently, the maximum allowable waste rock mass tends to stabilize.
However, a marked increase in the maximum allowable waste rock mass was observed when the falling height exceeded approximately 100 cm. The reliability of this trend is confirmed by the repeated tests, represented by the orange markers in Figure 12. Examination of the internal structure shown in Figure 11 indicates that, for falling heights of 100 cm or less, the waste rock particles were mainly concentrated near the center of the paste backfill surface. In contrast, for falling heights of 150 cm and above, the particles spread over a much larger area before penetrating into the paste backfill.
Therefore, the additional increase in the maximum allowable waste rock mass observed at falling heights greater than 100 cm can be partly attributed to the increase in the waste rock receiving area on the surface of the paste backfill. A larger receiving area allows a greater quantity of waste rock to penetrate into the paste backfill without causing substation non-mixing. The influence of the receiving area on the maximum allowable waste rock mass is further discussed in Section 5.
2.4.5. Effect of Stope Dimensions DM
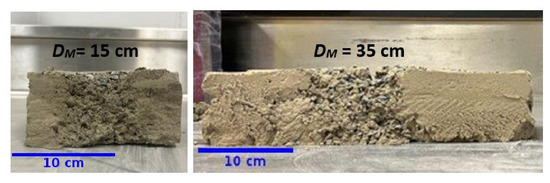
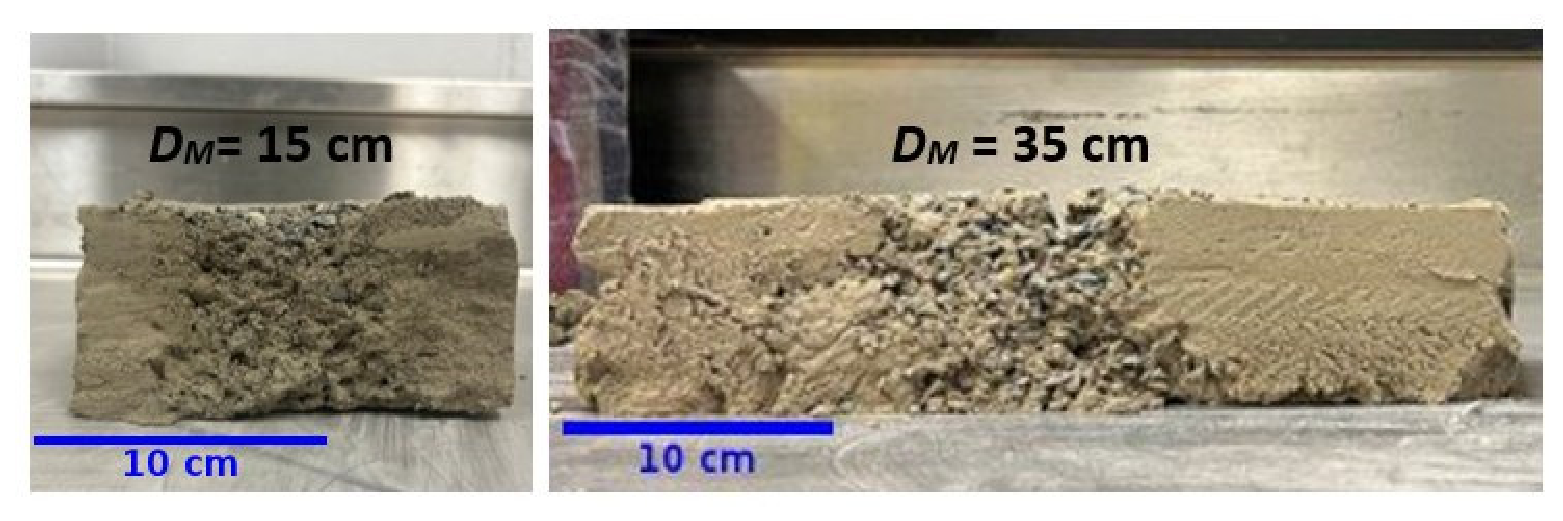
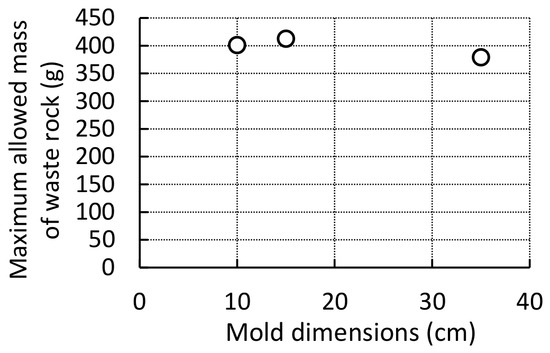
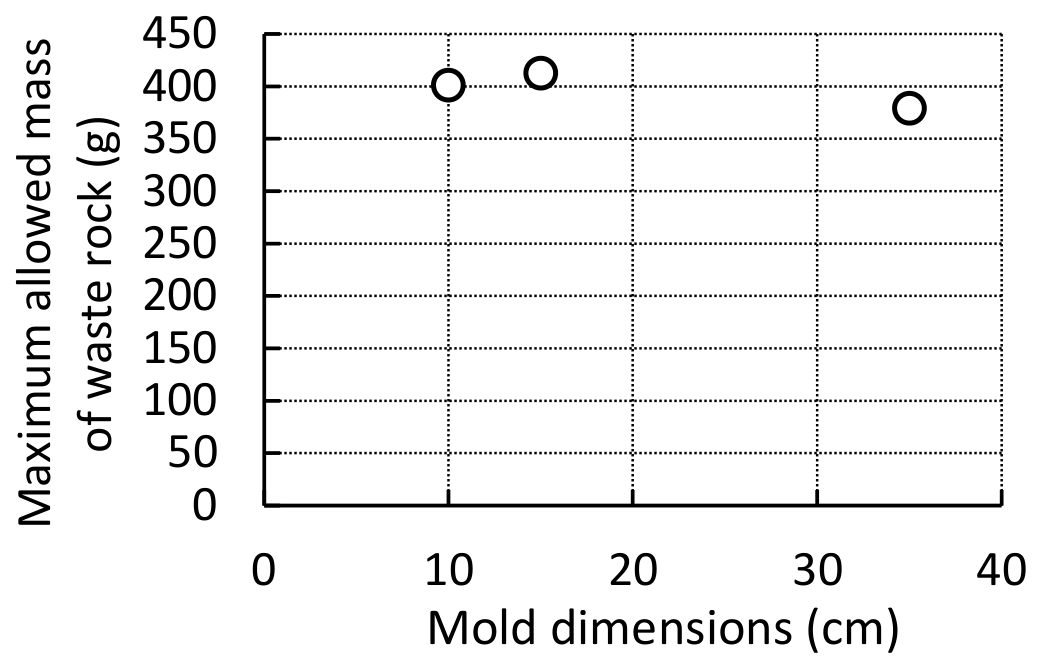
Figure 13 illustrates the internal texture structure of waste rock–paste backfill samples observed along a vertical central section for different stope dimensions. The waste rock distributions in samples with mold dimensions of 15 cm and 35 cm exhibit very similar patterns. In both cases, most of the waste rock particles penetrated downward toward the bottom of the mold and did not reach the side walls. Consequently, increasing the mold dimensions had little influence on the waste rock penetration and distribution with the paste backfill. Since the waste rock particles did not reach the mold boundaries, the effect of stope dimensions on the mixing behavior remained limited under the rested conditions.
Figure 13.
The internal texture structures of waste rock–paste backfill samples observed along a vertical central section for different stope dimensions; the experimental conditions correspond to Case 5 in Table 1.
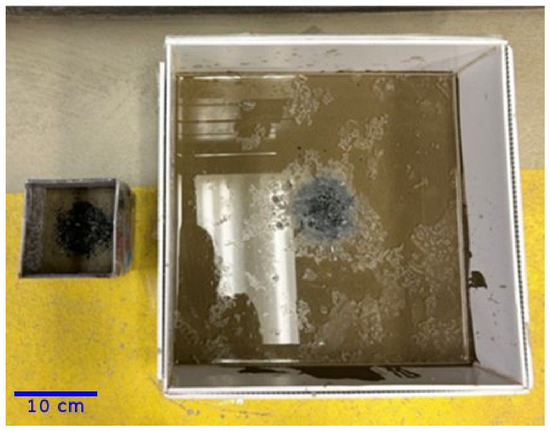
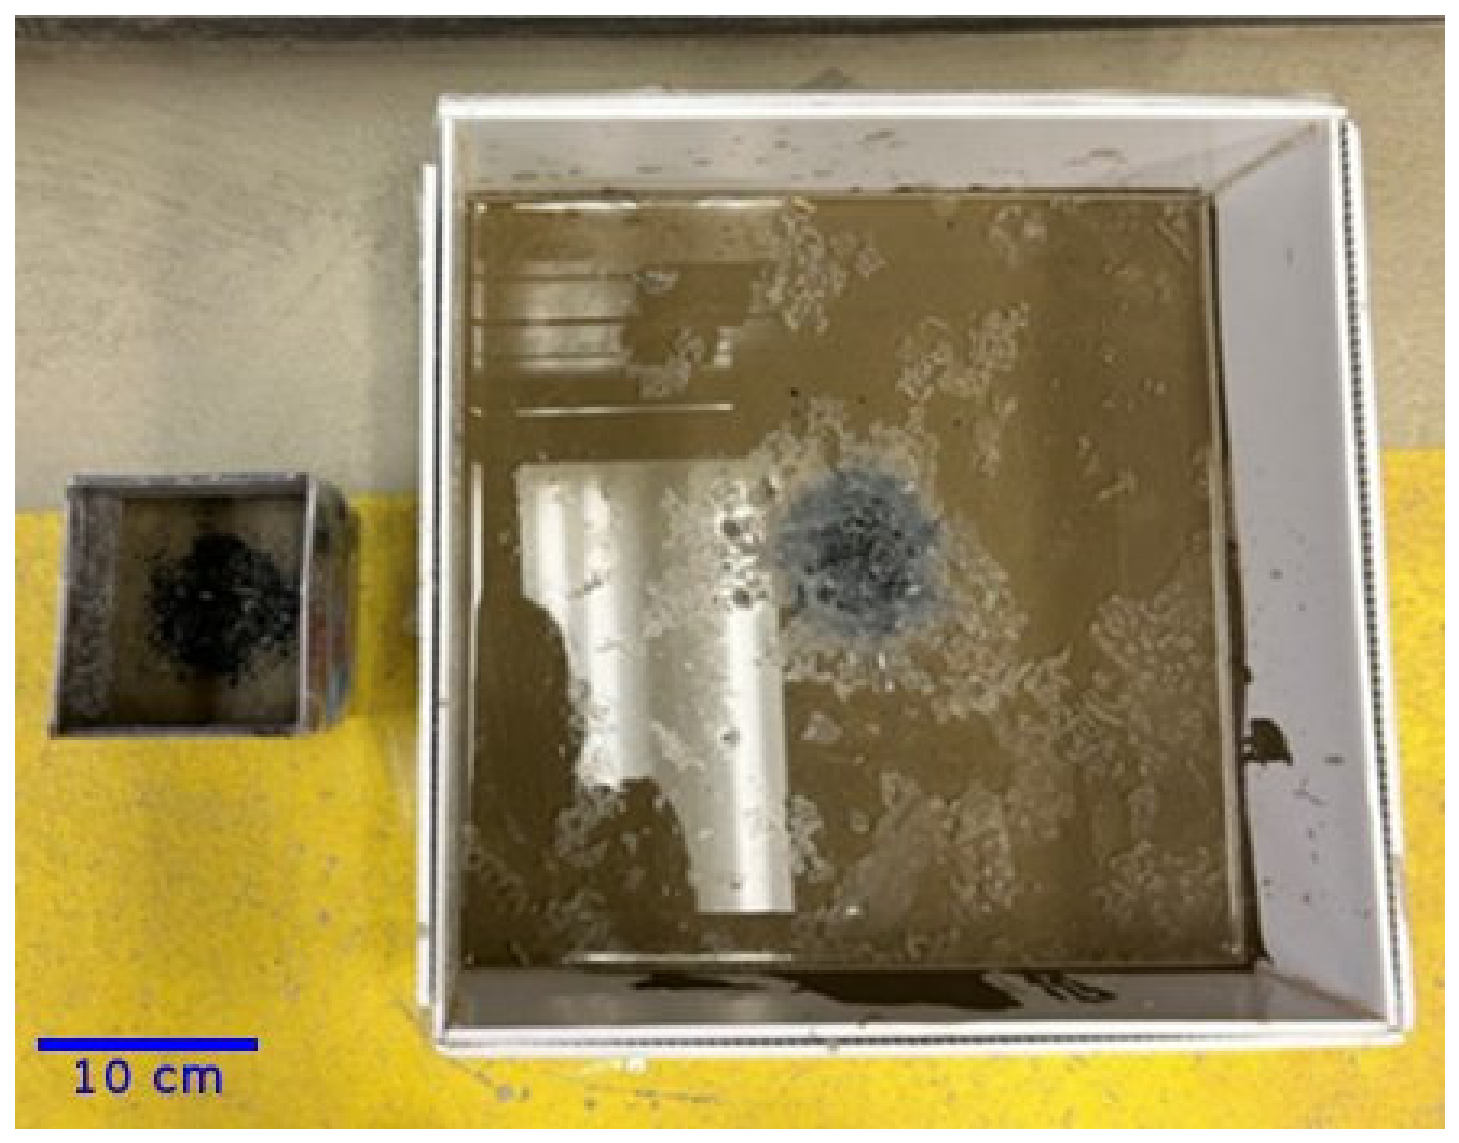
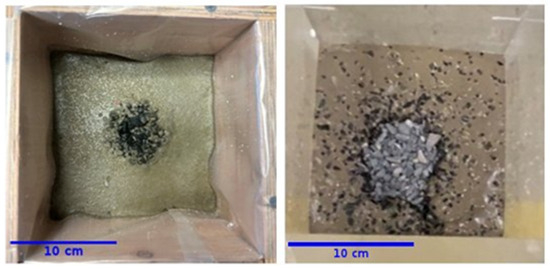
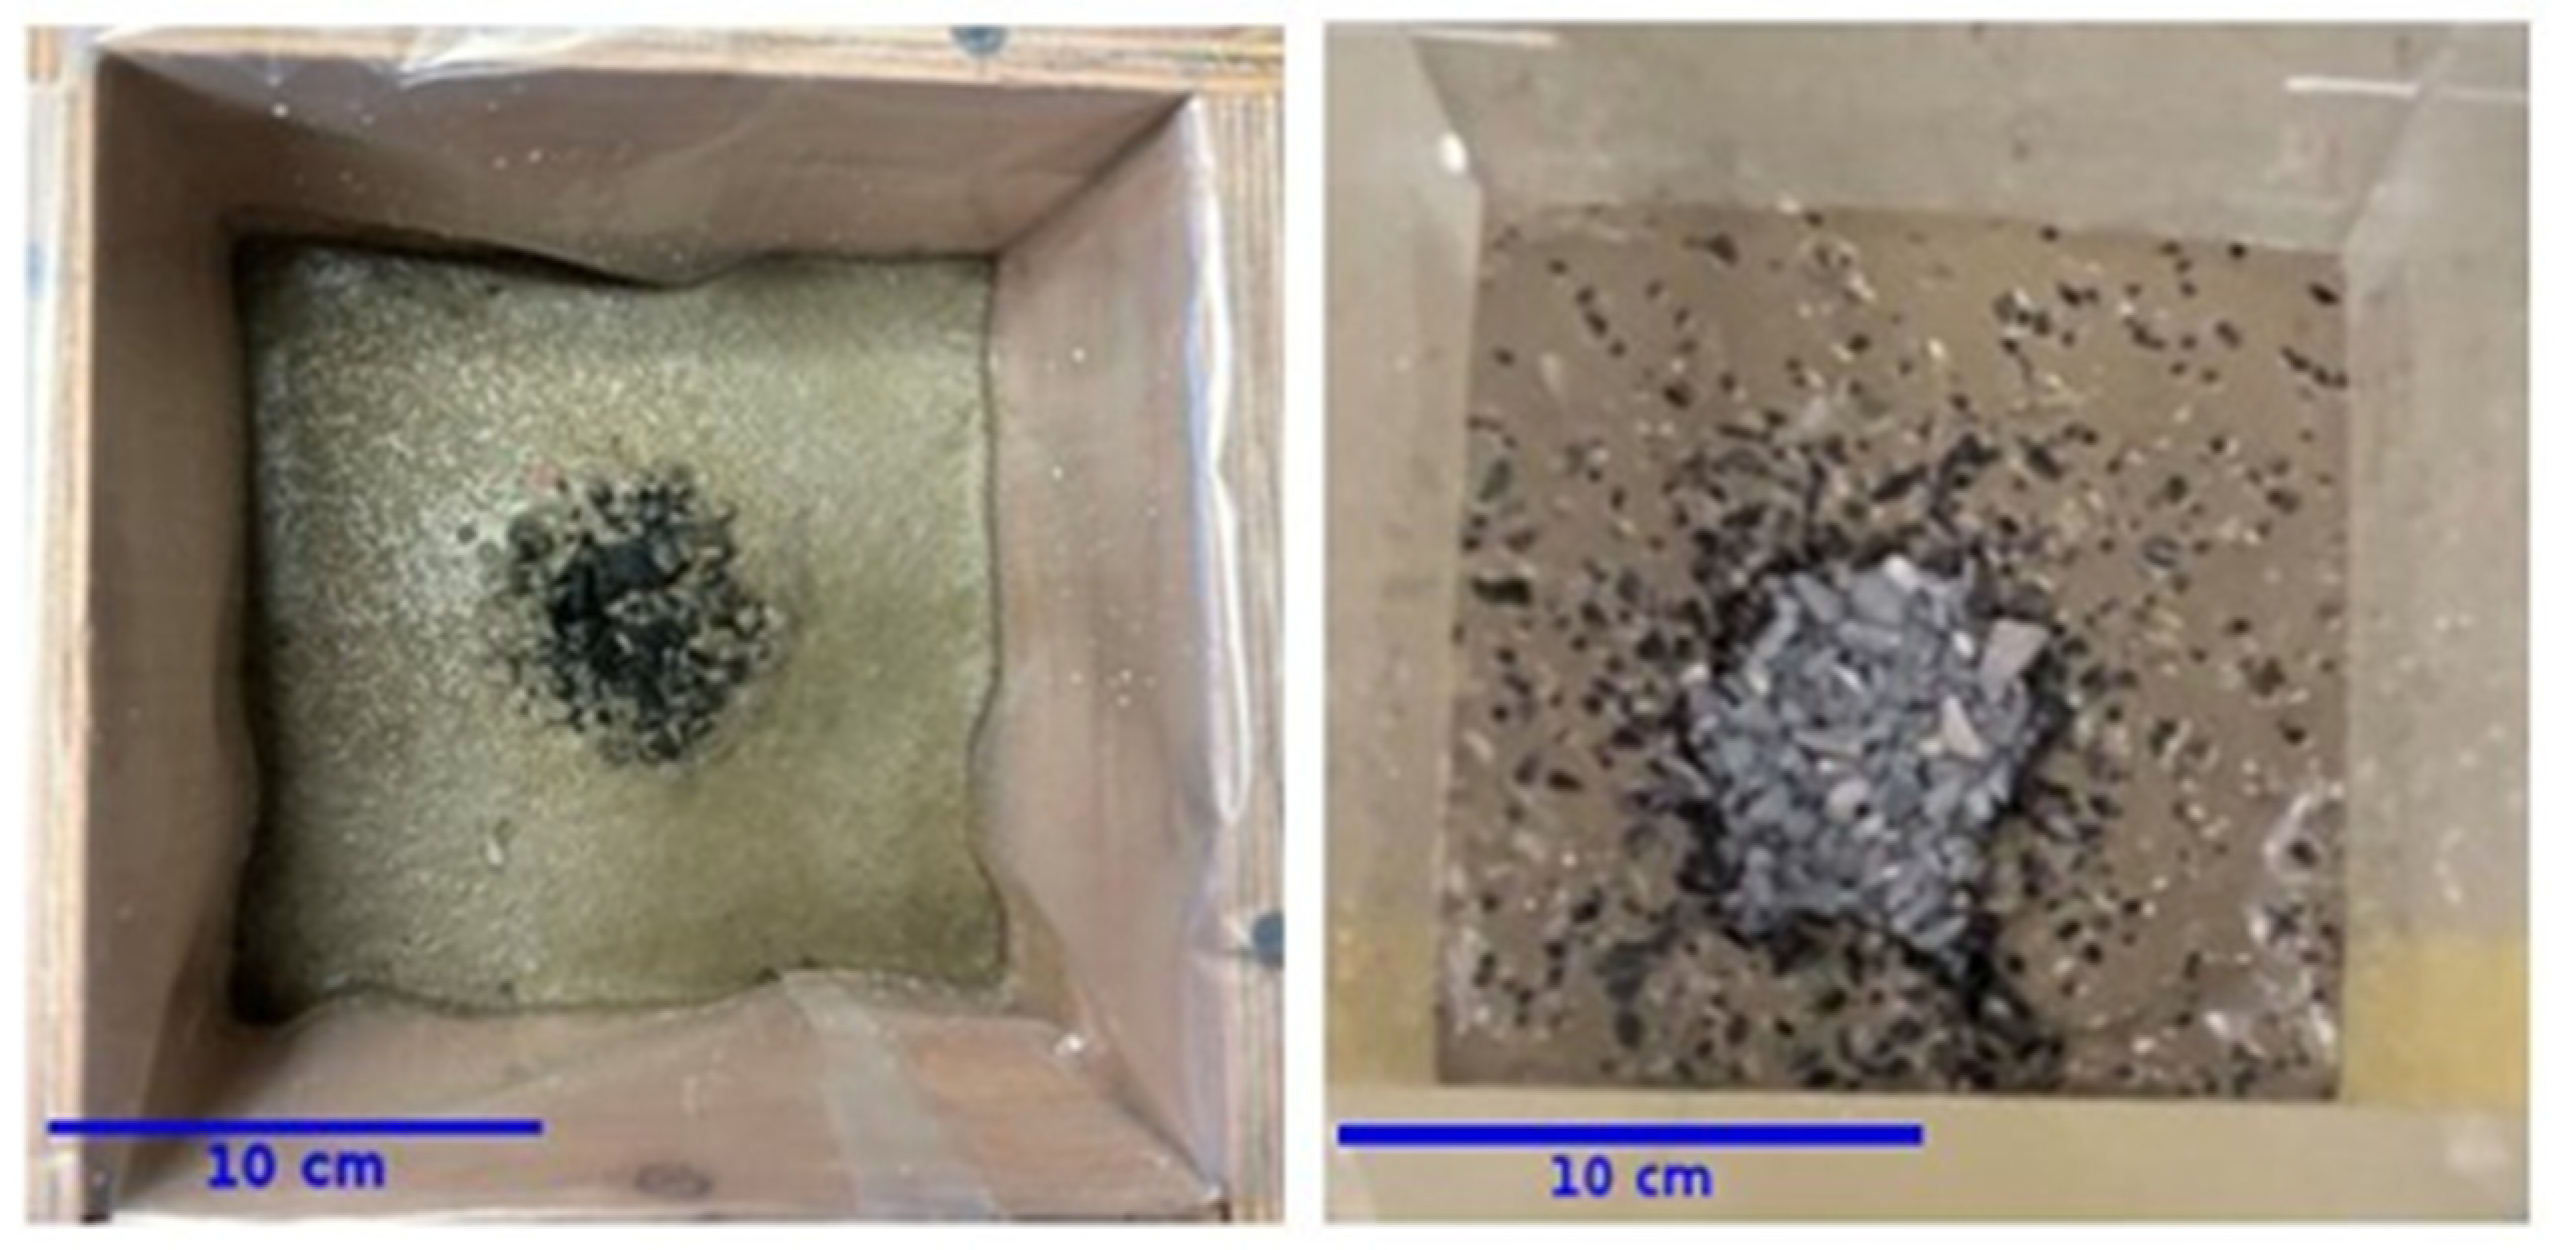
Figure 14 shows the variation in the maximum allowable waste rock mass as a function of mold dimension. Despite the substantial increase in the volume of the paste backfill associated with the larger mold cross-section area, the maximum allowable waste rock mass remained nearly constant. This result indicates that the quantity of waste rock that can penetrate into and mix with the paste backfill is not significantly affected by the stope width within the tested range. This observation can be explained by the nearly constant waste rock receiving area obtained for different mold dimensions, as illustrated in Figure 15, as well as by the similar internal waste rock distributions observed in Figure 13. Since the waste rock penetration zone occupied only a limited portion of the mold cross-section, increasing the mold dimensions did not significantly alter the extent of waste rock penetration or the resulting maximum allowable waste rock mass.
Figure 14.
The variation in the maximum allowable waste rock mass as a function of mold dimension; the experimental conditions correspond to Case 5 in Table 1.
Figure 15.
Top-view photograph of waste rock–paste backfill samples observed with mold dimensions of 10 cm (left) and 35 cm (right); experimental conditions correspond to Case 5 in Table 1.
3. Proposed Solution
Based on the experimental results presented in Section 2, an empirical equation was developed to estimate the maximum amount of waste rock that can naturally mix with paste backfill:
where Mc is the maximum allowed waste rock mass (g), Cw is the solids content of the paste backfill (–), Hp is the paste backfill thickness (cm), Hf is the waste rock falling height (cm), and dmax is the maximum particle size of the waste rock (mm). The coefficients a, b, c, d, e, f, and g are empirical constants determined through a curve-fitting procedure using the experimental data presented in Section 2:
a = 1,345,996.74, b = −30.4, c = 0.0098, d = 41.88, e = −4.97, f = 137.22, and g = 668.15.
Equation (2), together with the above constants, constitutes the proposed solution for estimating the maximum allowable waste rock mass that can be dumped onto paste backfill without causing substantial non-mixture between the two materials.
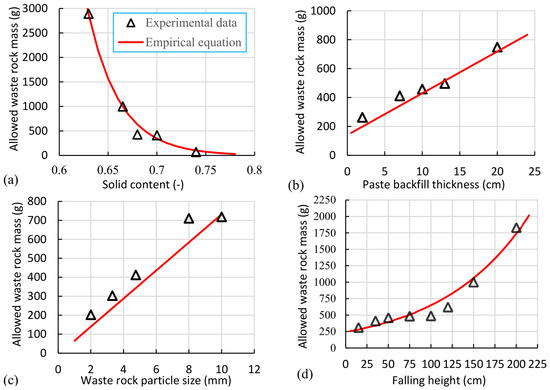
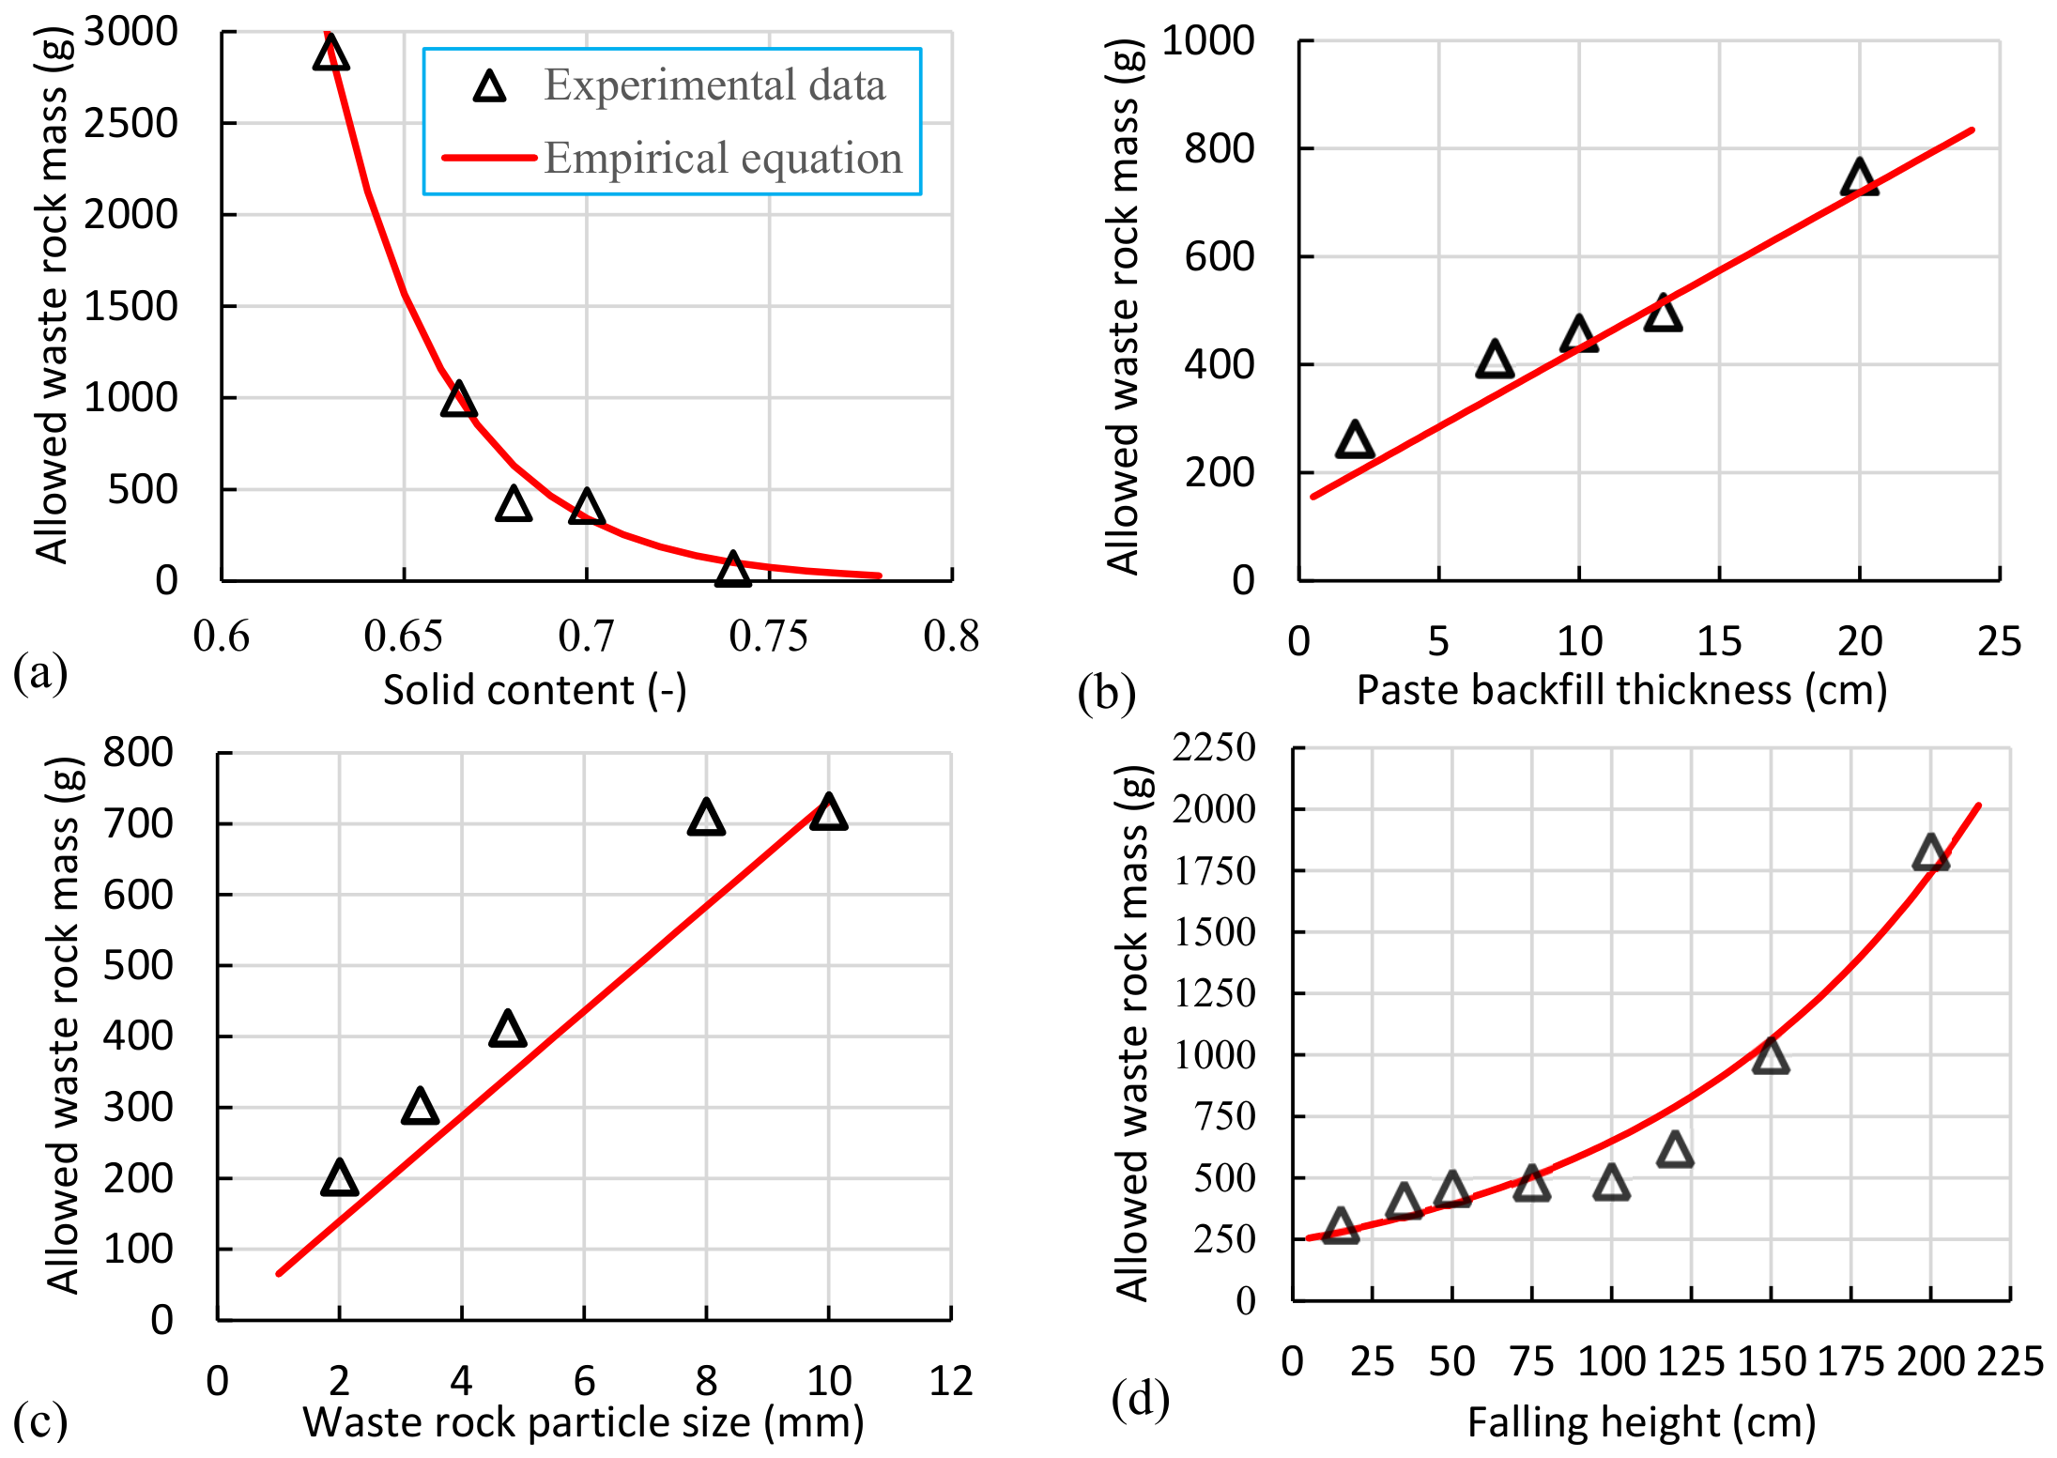
Figure 16 compared the measured and calculated values of the maximum allowable waste rock mass as a function of paste backfill solids content (Figure 16a), paste backfill thickness (Figure 16b), maximum particle size of the waste rock (Figure 16c), and waste rock falling height (Figure 16d). The calculated values were obtained using the proposed solution (Equation (2) with a = 1,345,996.74, b = −30.4, c = 0.0098, d = 41.88, e = −4.97, f = 137.22, and g = 668.15). Overall, the proposed solution provides a good representation of the experimental data and successfully captures the influence of the investigated parameters on the maximum allowable waste rock mass.
Figure 16.
Comparison between measured and calculated values of the maximum allowable waste rock mass as a function of (a) paste backfill solids content, (b) paste backfill thickness, (c) maximum particle size of the waste rock, and (d) waste rock falling height. The calculated values were obtained using the proposed solution (Equation (2)).
Although the agreement between the proposed solution and the laboratory data is satisfactory, its predictive capability cannot be assessed solely using the data employed for model development. Independent experimental results are therefore required to evaluate the predictive performance of the proposed solution.
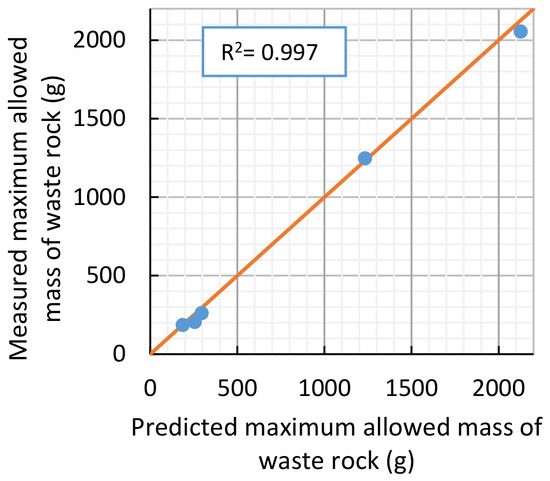
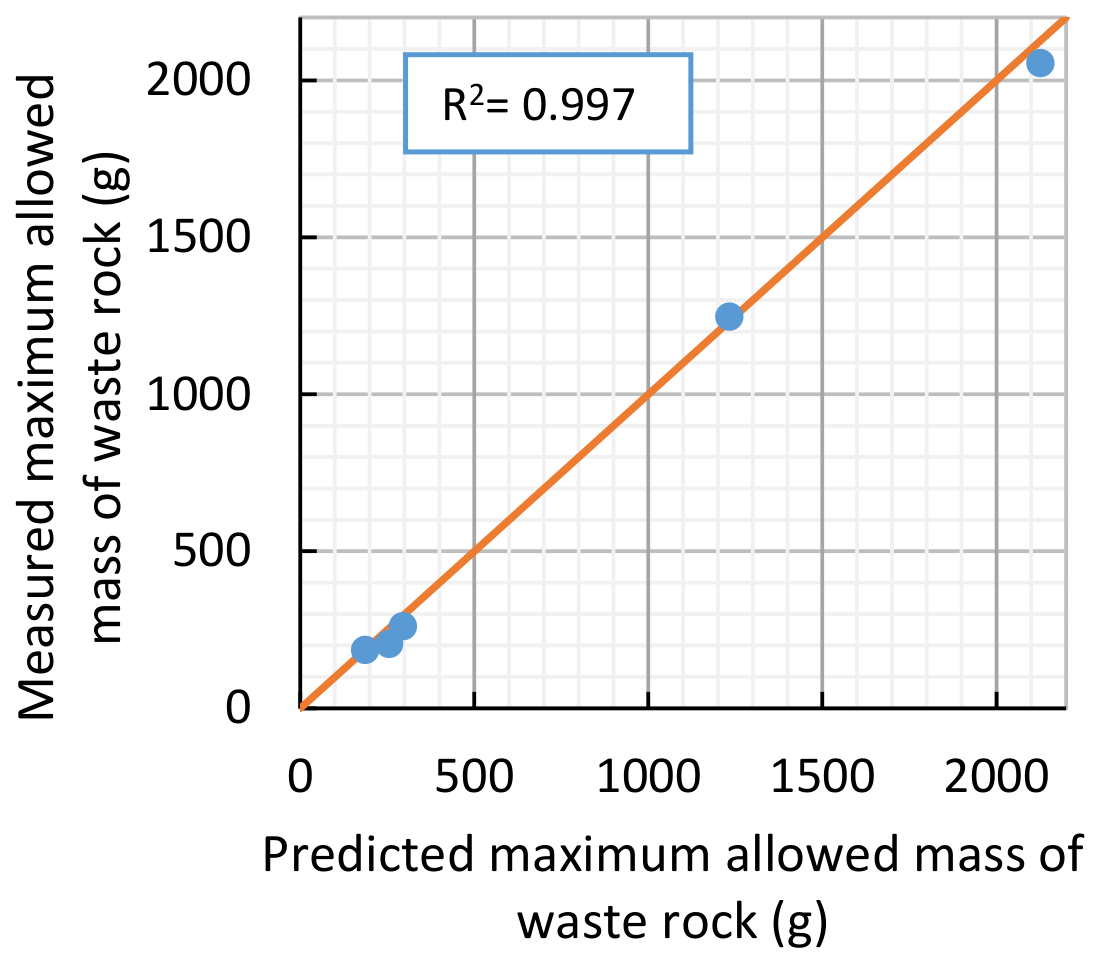
Table 2 presents a series of additional laboratory tests conducted using waste rock with a maximum particle size (dmax) of 4.75 mm. The comparison between the predicted and measured values of the maximum allowable waste rock mass is shown in Figure 17. The predictive performance of the proposed solution was evaluated using the coefficient of determination (R2), defined as follows:
Table 2.
Additional laboratory tests used to evaluate the predictive performance of the proposed solution (waste rock with dmax = 4.75 mm).
Figure 17.
Comparison between the predicted and measured values of the maximum allowable waste rock mass obtained from the additional laboratory tests.
The predicted values show excellent agreement with the measured experimental results, yielding an R2 value of 0.997. This result demonstrates the strong predictive capability of the proposed solution within the range of conditions investigated in this study.
4. Large-Scale Tests
During the small-scale tests, tailings and waste rock available in our laboratory from other research projects were used. The waste rock samples were prepared using the double-scalping technique, in which both undersized fine particles and oversized coarse particles were removed. Consequently, the waste rock used in the small-scale tests may not be fully representative of waste rock generated underground in mining operations.
To evaluate the applicability and predictive capability of the proposed solution (Equation (2) with a = 1,345,996.74, b = −30.4, c = 0.0098, d =41.88, e = −4.97, f = 137.22, and g = 668.15) under conditions more representative of field practice, additional large-scale tests were conducted using both tailings and waste rock supplied by an underground mine.
4.1. Test Materials
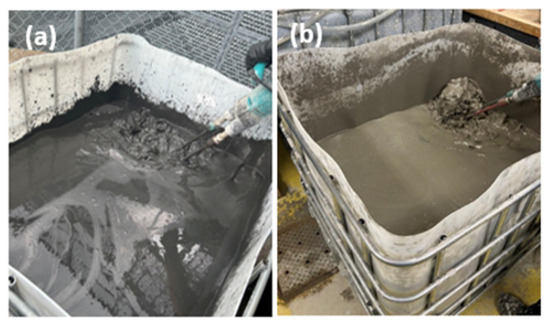
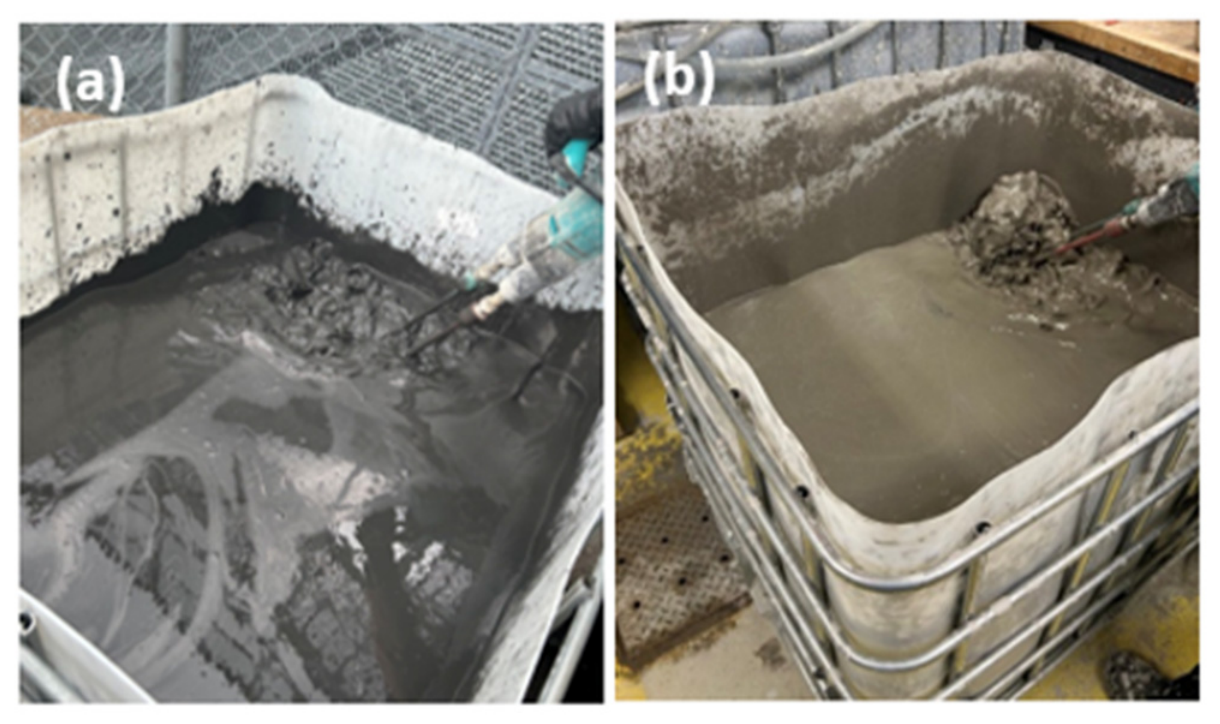
The paste backfill was prepared using a mixture of 75% non-sulfidic tailings and 25% sulfidic tailings obtained from Mine A, an underground mine located in Quebec, Canada. Figure 18 shows the two types of tailings delivered from the mine and stored in separate containers.
Figure 18.
Photographs of the (a) sulfidic tailings and (b) non-sulfidic tailings used to prepare the paste backfill for the large-scale tests.
To ensure homogeneity, each type of tailings was first mixed separately to obtain a uniform material. The solids content of each tailings batch was then adjusted so that both materials had the same solids content. Subsequently, the two tailings were blended to produce a paste backfill containing 25% sulfidic tailings (Figure 18a) and 75% non-sulfidic tailings (Figure 18b), representative of the backfill used at Mine A.
Before each test, the final tailings mixture was blended for approximately 30 min prior to placement in the mold to ensure material uniformity. This extended mixing period was necessary because the large-scale tests required a relatively large volume of paste backfill, and the tailings stored in a paste-like state may have undergone partial sedimentation and consolidation before testing.
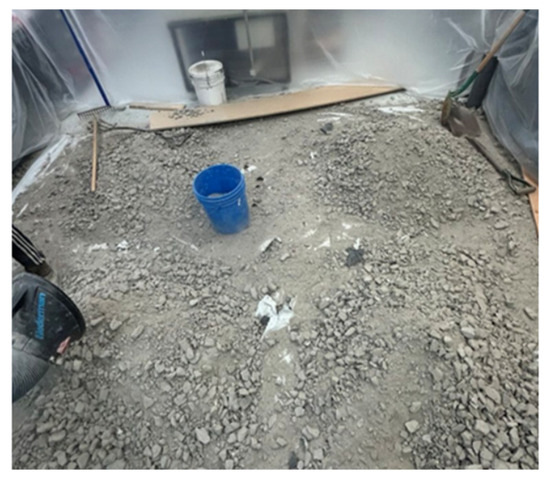
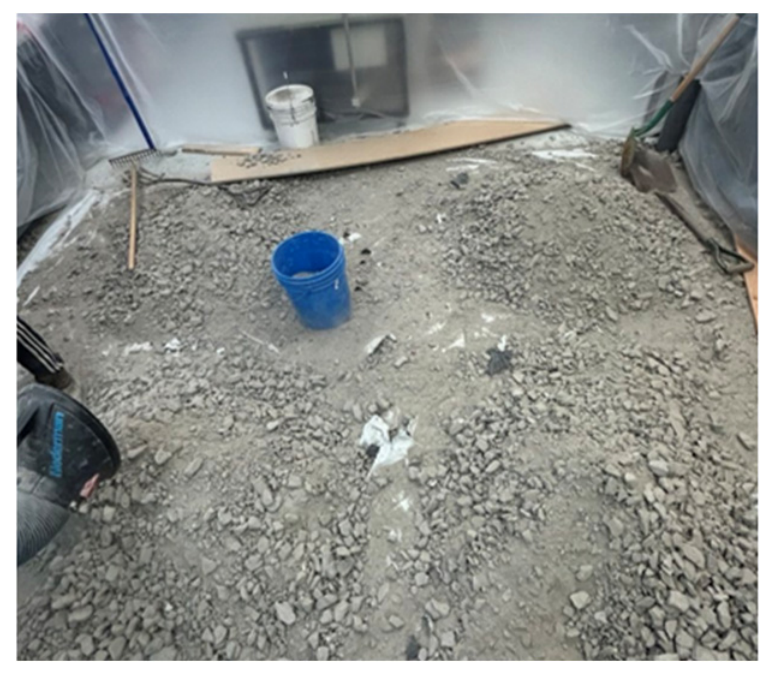
The waste rock was also supplied by Mine A and delivered in several barrels. Since the particle size distribution could vary among barrels, all waste rock was first thoroughly mixed together. As illustrated in Figure 19, the combined material was then quartered, that is, divided into four equal portions. This procedure ensured that the final waste rock sample used for testing had a representative and uniform particle size distribution.
Figure 19.
The waste rock supplied by Mine A and prepared for the large-scale tests using the quartering method.
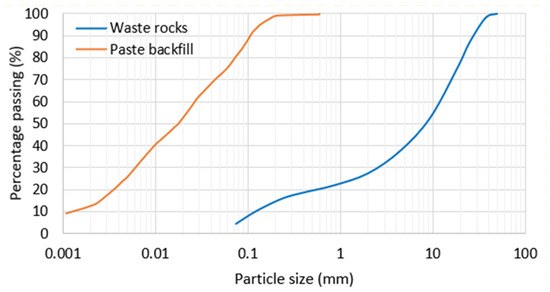
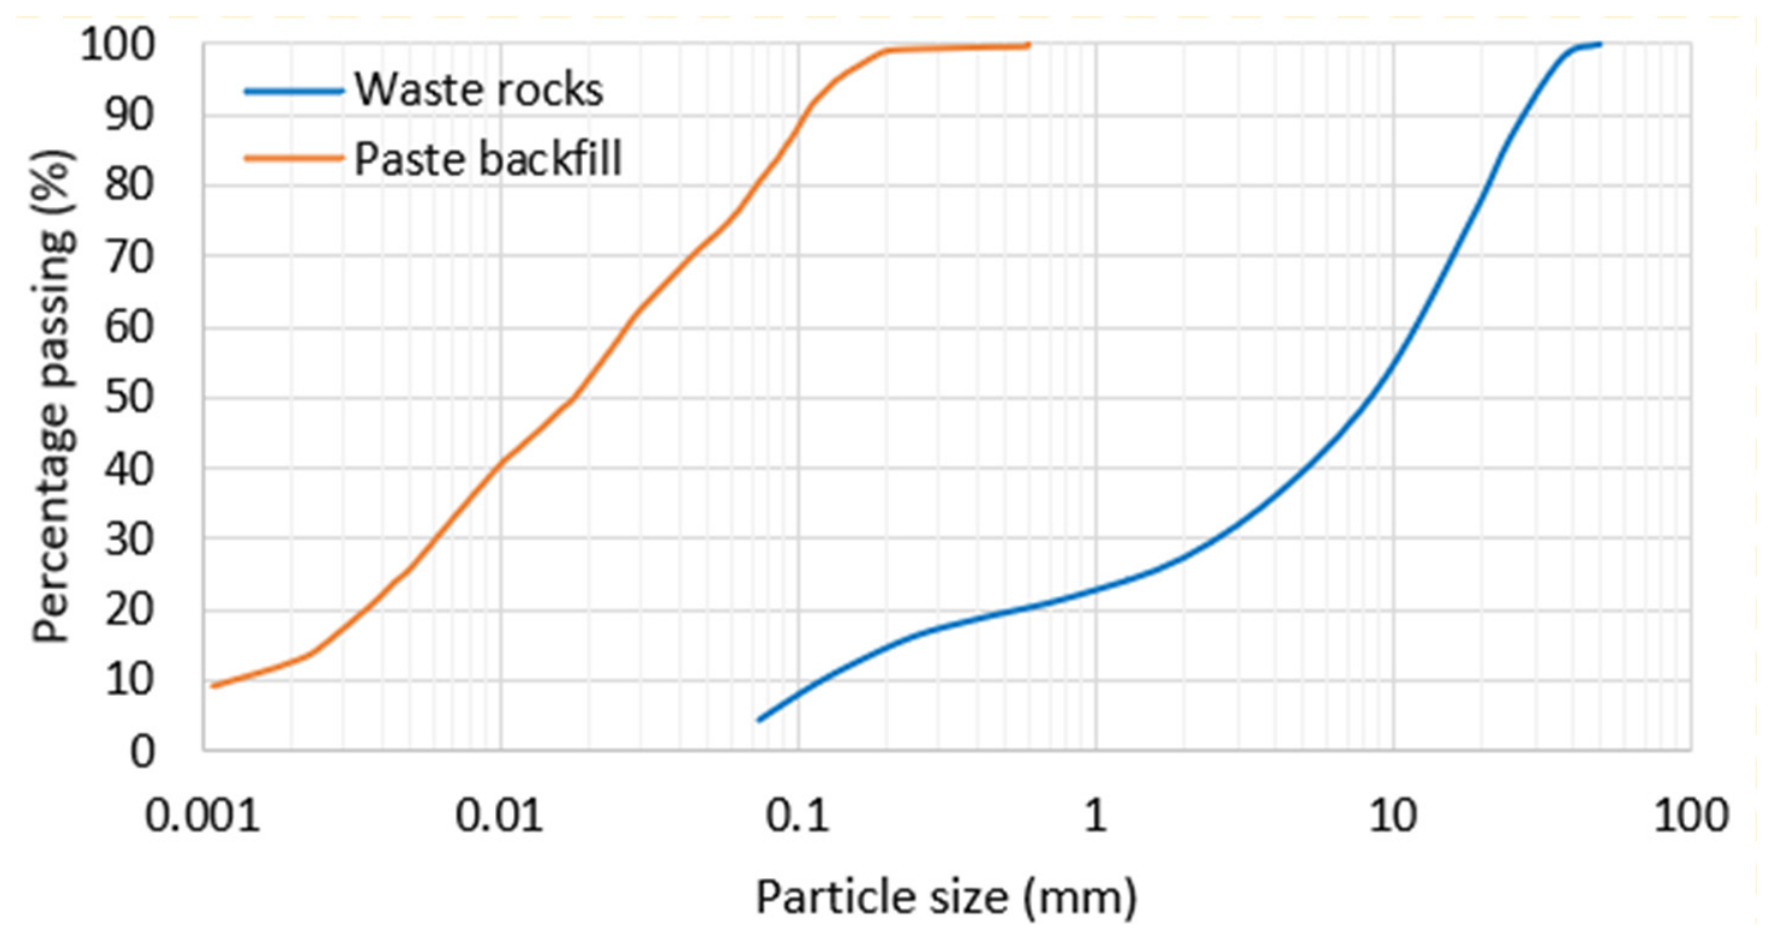
A sieve analysis was subsequently performed to determine the PSD. Figure 20 presents the PSD curves of both the waste rock and the paste backfill used in the large scale-tests. The maximum particle size of the waste rock was 50 mm.
Figure 20.
PDS curves of the waste rocks and paste backfill used for the large-scale tests.
Unlike the small-scale tests, the fine fraction of the waste rock was retained in the large-scale tests to better represent the gradation of underground-generated waste rock under field conditions. This choice was important because removing fine particles may alter both the PSD and the mechanical property of the waste rock. Such changes may influence the spreading of waste rock on the paste backfill surface, particle penetration depth, and the resulting mixing pattern between waste rock and paste backfill. Retaining the fine particles therefore allowed the laboratory conditions to better reflect field conditions.
Compared with the paste backfill used in the small-scale tests, the paste backfill prepared from the mixture of non-sulfidic and sulfidic tailings had the same maximum particle size but contained a substantially greater proportion of fine particles.
4.2. Test Setup
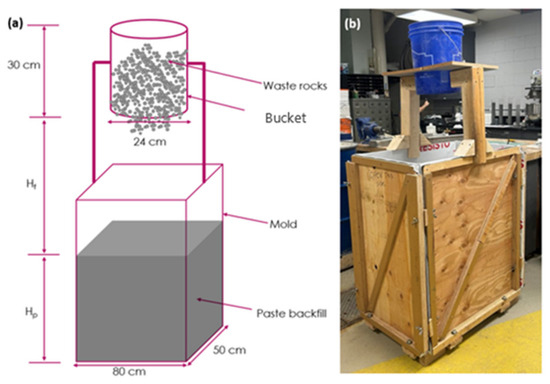
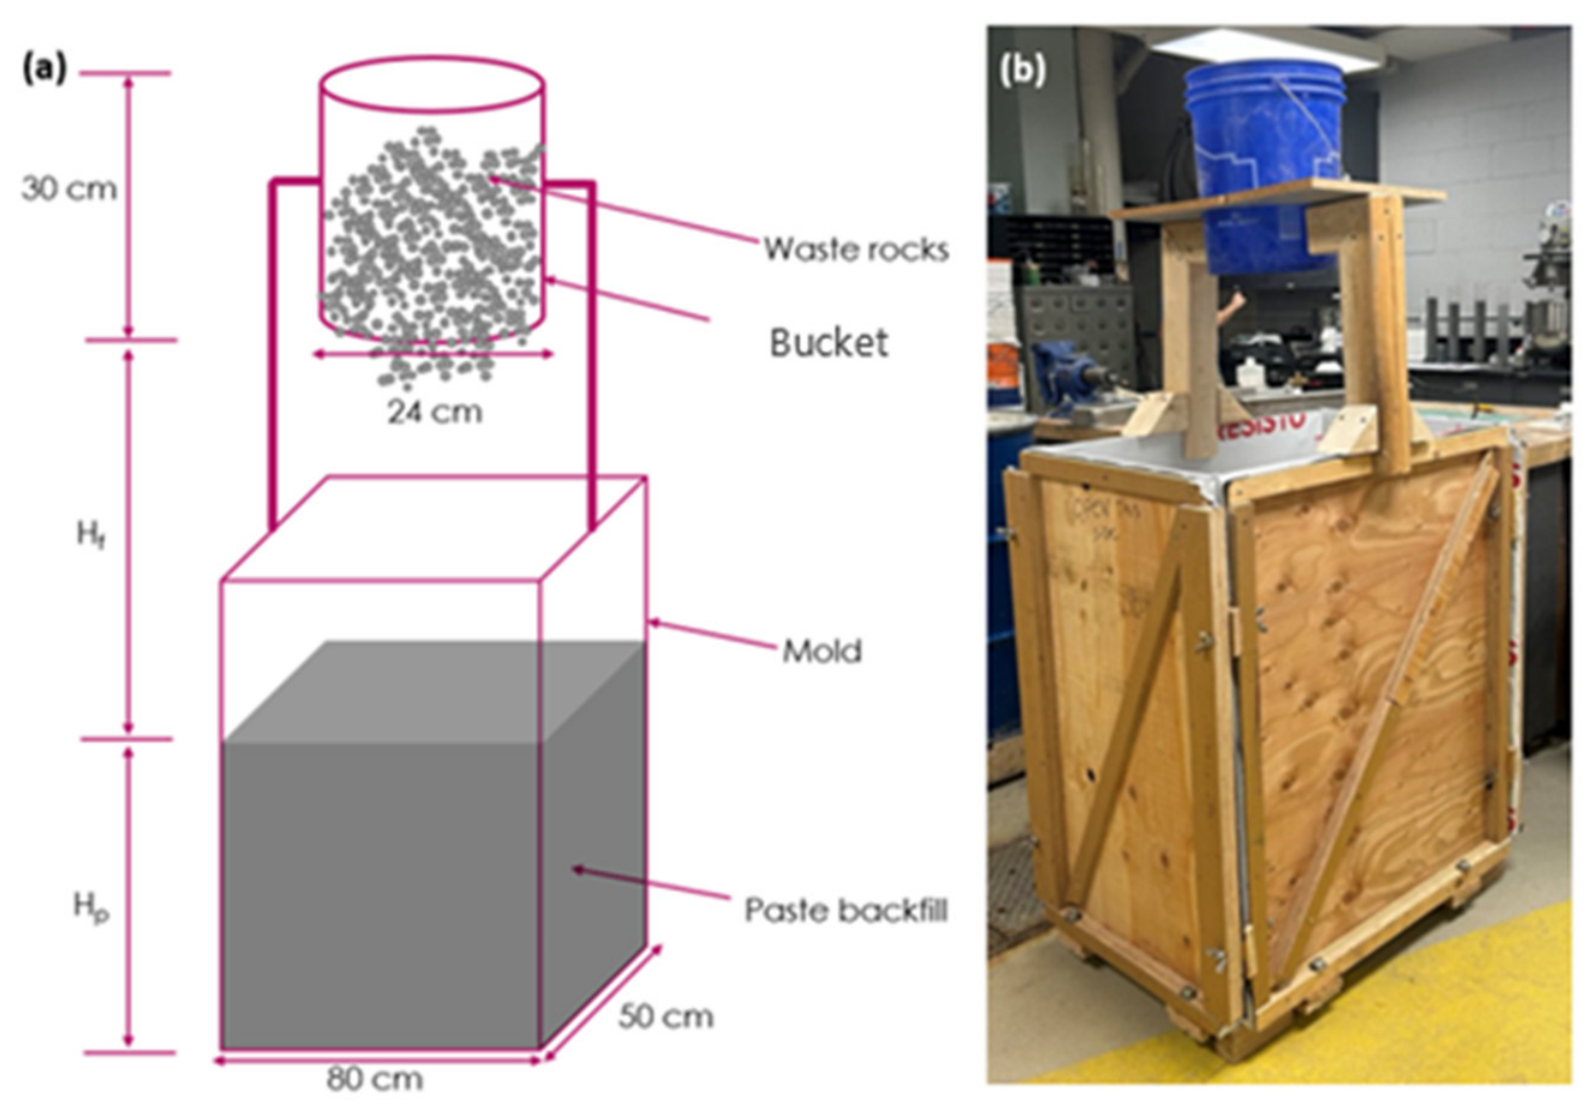
Figure 21 illustrates the large-scale experimental setup. Figure 21a presents a schematic representation of the system, while Figure 21b shows a photograph of the physical model.
Figure 21.
The large-scale physical model used to investigate the natural mixing of waste rock dumped onto the paste backfill: (a) a schematic presentation of the experimental setup; (b) a photograph of the physical model.
A rectangular mold with internal dimensions of 80 cm × 50 cm × 100 cm (length × width × height) was used to simulate a mine stope at a larger scale. The mold was constructed from reinforced wooden panels to ensure structural stability. A drainage system consisting of several holes located at the bottom of the mold and covered with a geotextile filter layer was incorporated to allow excess water to drain during testing, thereby facilitating sample curing and drying.
A bucket with a base diameter of 24 cm and a height of 30 cm was positioned above the mold to allow controlled dumping of waste rock. The bucket was supported by two rigid vertical supports fixed to the mold frame. This large-scale setup made it possible to evaluate the scalability of the observations from the small-scale tests.
4.3. Test Procedure
The same experimental procedure used in the small-scale tests was adopted for the large-scale tests. The primary difference was the curing period required before exposing the waste rock–paste backfill mass. A longer curing time was necessary because the larger samples required more time to develop sufficient strength for safe exposure and examination. Table 3 summarizes the large-scale test program conducted using waste rock with a maximum particle size (dmax) of 50 mm.
Table 3.
Large-scale experimental program using waste rock with maximum particle size (dmax) of 50 mm.
4.4. Test Results
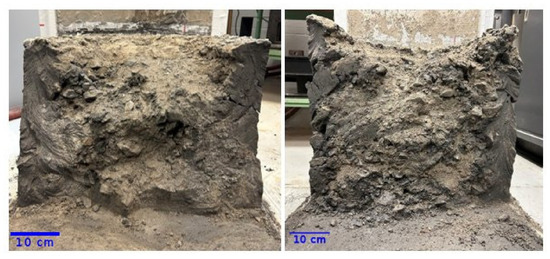
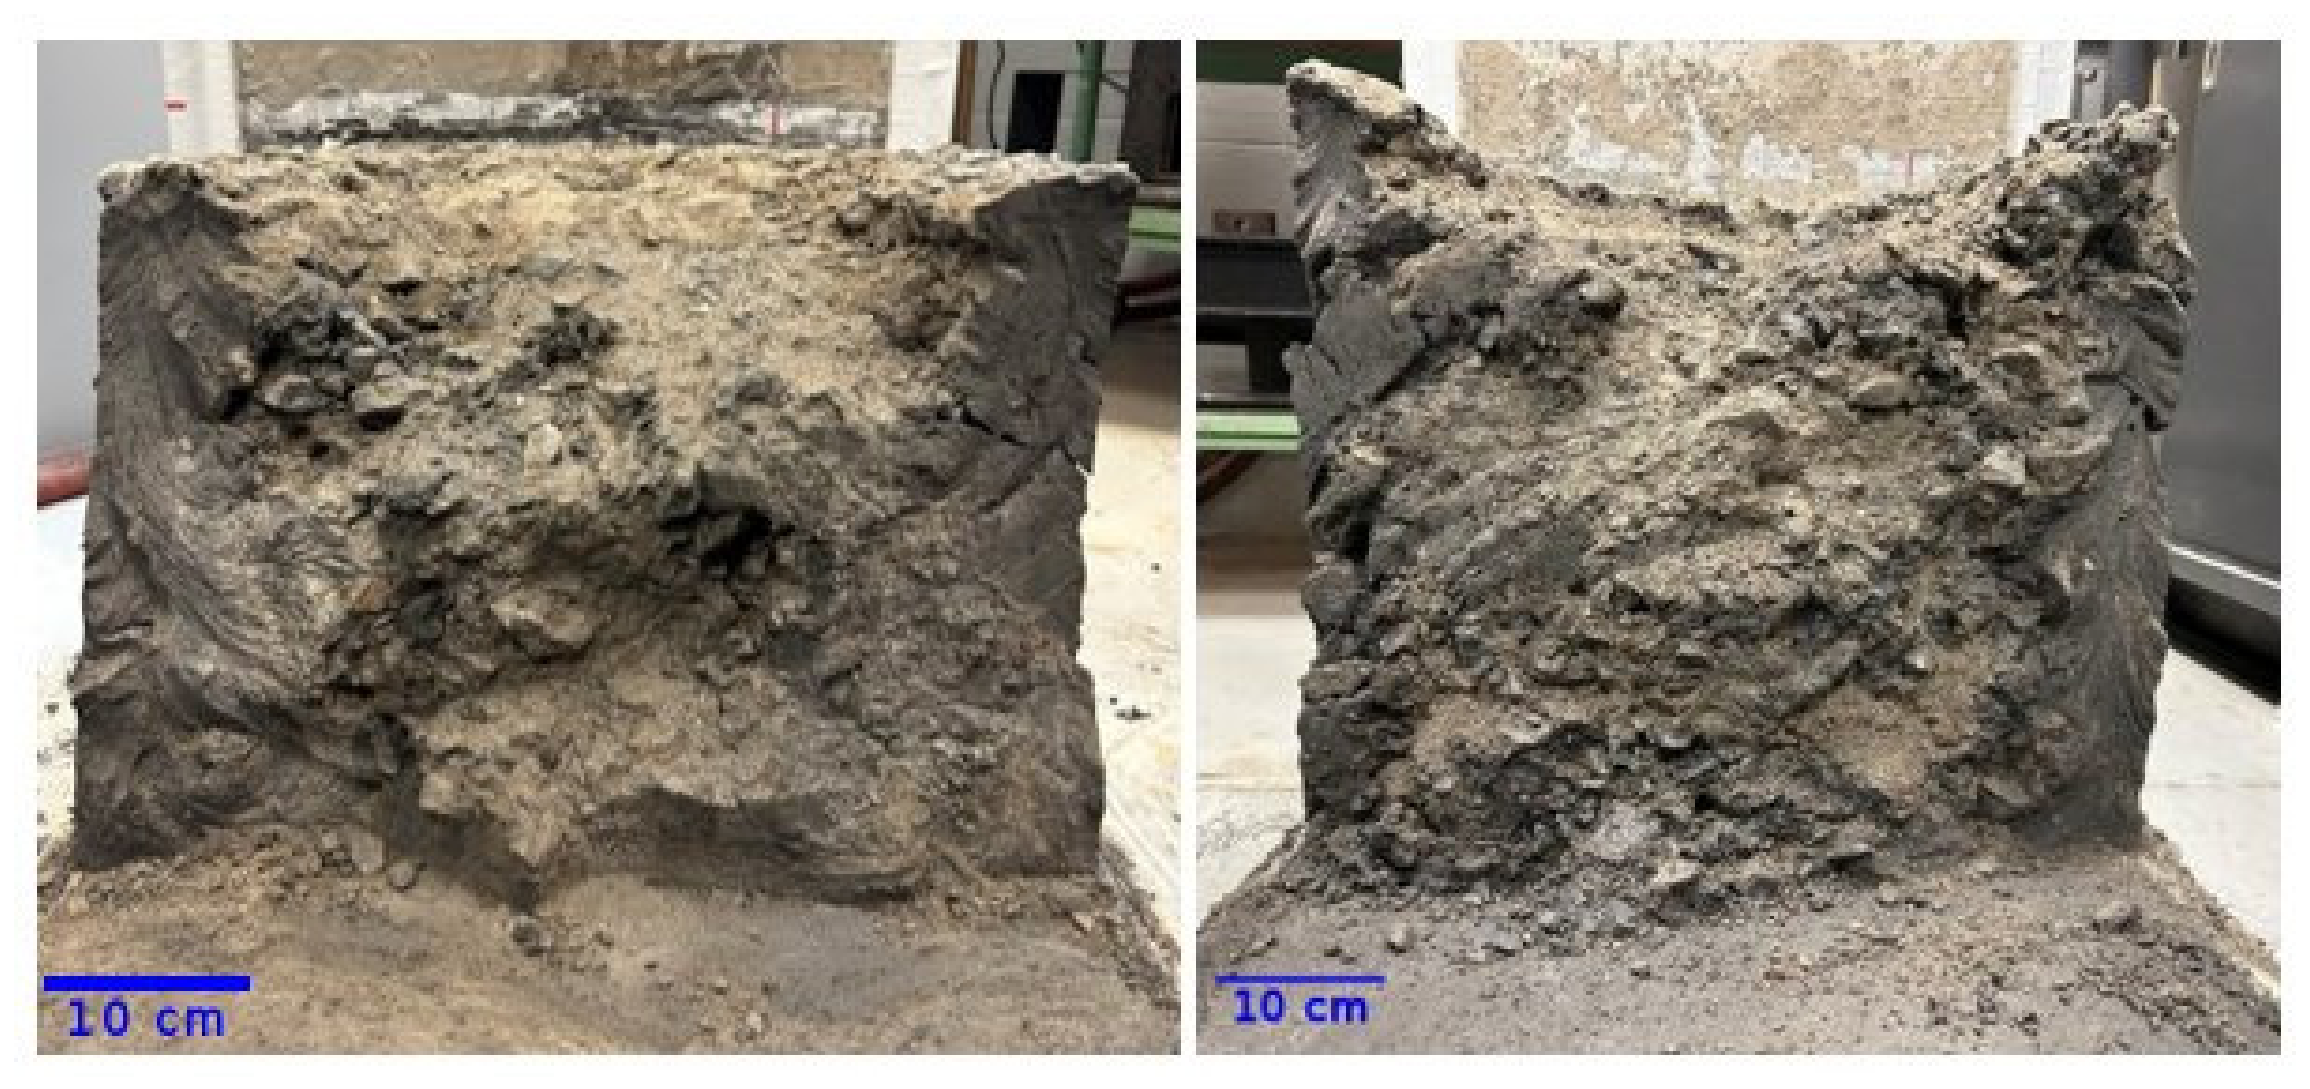
Figure 22 presents the internal texture structure of the large-scale samples after 30 days of curing, when the samples had become sufficiently hard and dry for sectioning and examination.
Figure 22.
The internal texture structure of the large-scale test samples after sectioning through the center: Test 1 (left) and Test 2 (right).
For Test 1 (Table 3), the waste rock penetrated into the paste backfill in a V-shaped pattern, reaching the bottom of the mold but not extending to the side walls. For Test 2 (Table 3), the waste rock penetrated more extensively, reaching the bottom of the mold and partially contacting the side walls.
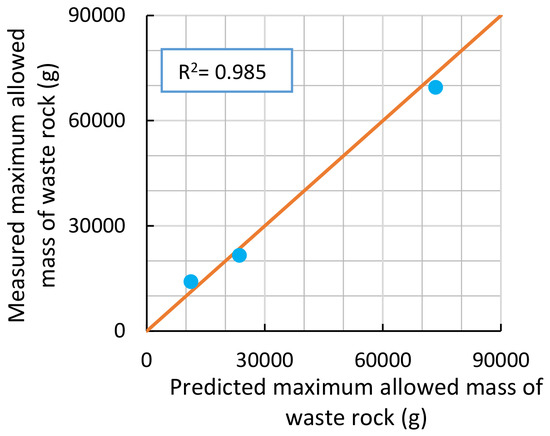
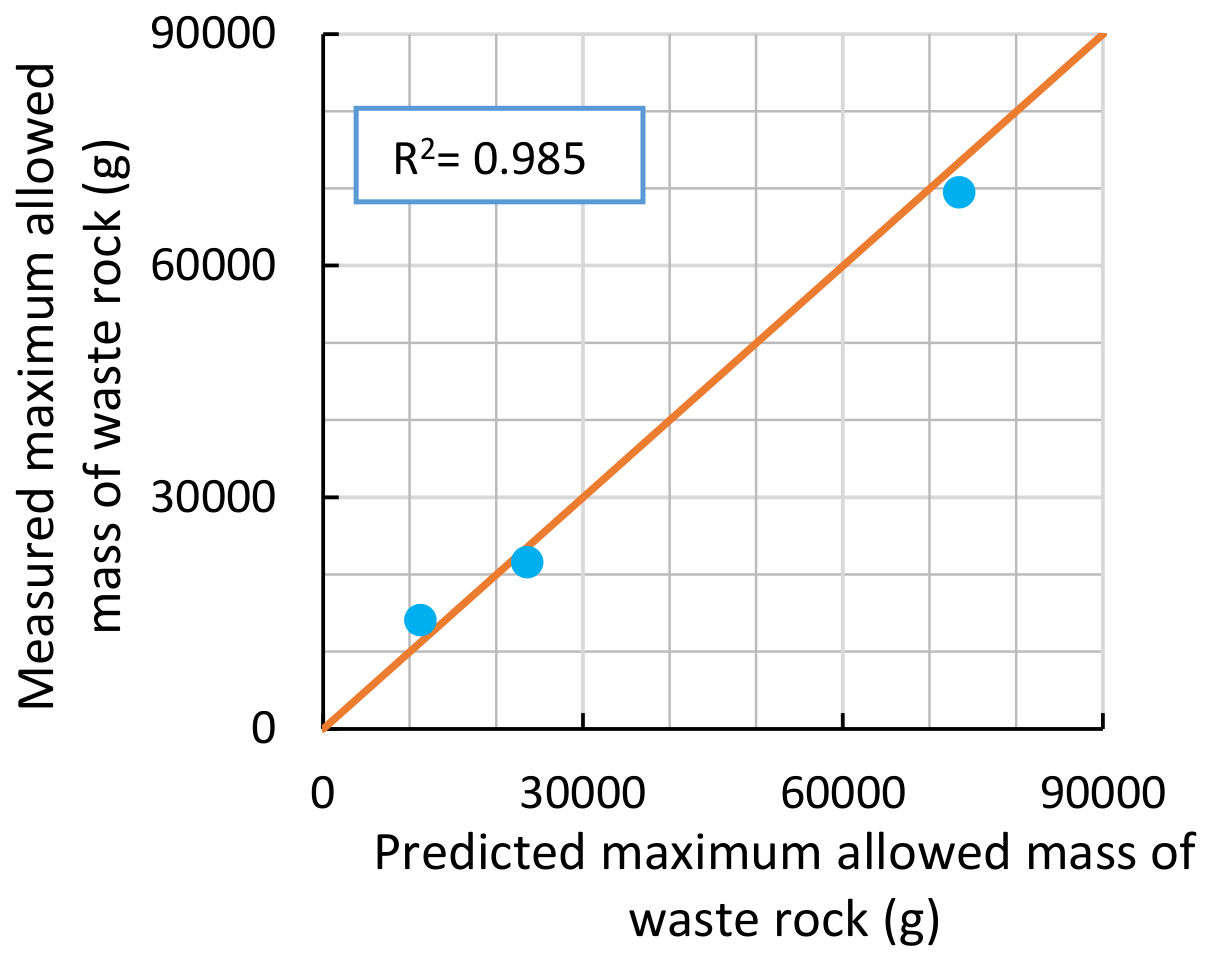
Figure 23 compares the measured values of the maximum allowable waste rock mass with those predicted using the proposed solution (Equation (2) with a = 1,345,996.74, b = −30.4, c = 0.0098, d = 41.88, e = −4.97, f = 137.22, and g = 668.15). The strong agreement between measured and predicted values, reflected by an R2 value of 0.985, further demonstrates the ability of the proposed solution to estimate the maximum allowable waste rock mass that can be dumped onto paste backfill without causing substantial non-mixing between the two materials.
Figure 23.
Comparison between the predicted and measured values of the maximum allowable waste rock mass obtained from the large-scale tests.
5. Discussions
In this study, the natural mixing behavior between dumped waste rock and paste backfill was investigated through a series of laboratory experiments. The results showed that the maximum allowable waste rock mass is influenced by the solids content and thickness of the paste backfill, as well as by the maximum particle size and falling height of the waste rock. In contrast, it was found to be relatively insensitive to variation in the horizontal cross-sectional dimensions of the stope. Based on these key parameters, an empirical solution containing several fitting coefficients was developed to estimate the maximum allowable waste rock mass that can naturally mix with paste backfill.
The validity and predictive capability of the proposed solution were evaluated using additional independent experimental data obtained from both small-scale and large-scale tests. The results demonstrated that the proposed solution can be used to estimate the maximum allowable waste rock mass that may be dumped into a stope being filled with paste backfill without causing substantial non-mixing between the two materials.
Despite these promising results, several limitations of the present study should be acknowledged.
For example, the experimental results showed that the receiving area of waste rock particles on the paste backfill surface can significantly influence the maximum allowable waste rock mass. This effect was particularly evident in Case 4, which examined the influence of waste rock falling height. As the falling height increased beyond 100 cm, the receiving area of the waste rock particles on the paste backfill surface increased substantially, leading to a marked increase in the maximum allowable waste rock mass.
At a falling height of 15 cm, the waste rock particles landed within a relatively small and concentrated area near the center of the mold. In contrast, at a falling height of 150 cm, the particles were distributed more widely and randomly across the paste backfill surface, resulting in a much larger receiving area. Consequently, a greater quantity of waste rock was able to penetrate into the paste backfill through a larger cross-sectional region, thereby increasing the maximum allowable waste rock mass (Figure 24).
Figure 24.
Top-view photographs of samples formed with waste rock falling heights of 15 cm (left) and 150 cm (right); the experimental conditions correspond to Case 4 in Table 1. The difference in color between the two samples is due to the time at which the photographs were taken. The photograph on the right was taken immediately after the dumping operation, whereas the photograph on the left was taken four days later.
The effect of receiving area parameter has been implicitly incorporated into the proposed solution (Equation (2) with a = 1,345,996.74, b = −30.4, c = 0.0098, d = 41.88, e = −4.97, f = 137.22, and g = 668.15) as long as waste rock is dumped from a single location. When spreading equipment, such as a slinger truck, is used to increase the receiving area, the maximum allowable waste rock mass can be expected to increase significantly. Further research is therefore required to explicitly incorporate the receiving area into the proposed equation.
In the present study, the experimental procedure was simplified to represent a controlled single-point dumping condition. The paste backfill was first placed in the mold, after which waste rock was incrementally dumped at a single location on the paste backfill surface. This configuration represents only a single-stage, single-point dumping scenario onto a static paste backfill layer. However, field backfilling operations may involve more complex placement sequences. For example, waste rock may first be placed into the stope, following by the pouring of paste backfill, allowing the paste backfill to flow through waste rock mass. Additional studies are required to investigate the mixing behavior between in-place waste rock and poured pulp paste backfill under such conditions. The proposed solution cannot be applied to these situations. Further work is needed to estimated the maximum allowed thickness of waste rock or to evaluate the degree of mixing between waste rock and paste backfill.
In underground stopes, paste backfill and waste rock may be placed in several stages (multiple lifts). Part of the unmixed waste rock remaining on the surface after one dumping stage may subsequently be covered by a new layer of paste backfill. In addition, waste rock may be dumped from several locations or spread over the paste backfill surface using equipment such as conveyors or slinger-projectors. These placement methods increase the receiving area and may allow a larger quantity of waste rock to penetrate into and mix with the paste backfill. In general, as reported by Kazemi [42], the maximum allowable waste rock mass increases almost linearly with the receiving area. Additional research is therefore required to evaluate the effects of multi-stage dumping, multi-point placement, and equipment-assisted spreading, and to incorporate these effects into the proposed empirical solution.
Nevertheless, the proposed solution can be adapted to multiple-lift operations by updating the thickness of the paste backfill layer and the waste rock falling height for each lift. Similarly, the solution may be applied multiple dumping locations, provided that the dumping points are sufficiently far apart. Further investigation is required to determine the minimum spacing between dumping locations that would allow the total maximum allowable waste rock mass to be estimated by summing the contributions from individual dumping points.
The experiments conducted in this study were limited to the case where a uniform paste backfill layer was placed in the stope and rapidly followed by waste rock dumping. In practice, however, a stope is rarely filled instantaneously. Self-weight consolidation and cementation may occur during paste backfill placement. Consequently, the solids content of the in-place paste backfill may increase before waste rock is dumped. It is therefore important to use the solids content of the paste backfill at the time of waste rock dumping rather than its initial solids content. Otherwise, application of the proposed solution may overestimate the maximum allowable waste rock mass, leading to a non-conservative design.
The results also showed that mold width did not directly affect the maximum allowable waste rock mass under the tested conditions. In these experiments, the selected combinations of solids content, falling height, paste backfill thickness, and waste rock particle size produced a relatively limited penetration zone, and the waste rock particles did not reach the mold side walls. Consequently, the direct influence of the mold boundaries on the mixing behavior was negligible. However, mold width may still exert an indirect influence on the mixing behavior through its interaction with other parameters. For example, lower solids content, greater falling height, larger paste backfill thickness, or larger waste rock particles may increase both the penetration depth and lateral spreading of waste rock. Under such conditions, the waste rock may reach the side walls, and the mold boundaries may then influence the final mixing pattern. For this reason, mold width is not included as a direct parameter in the proposed empirical solution. Nevertheless, its potential influence should be further investigated through additional tests covering a wide range of experimental conditions.
Because of the above-mentioned limitations, the proposed solution should not be used to evaluate the maximum allowable waste rock mass solely on the basis of ratio between the total quantity of in-place paste backfill and dumped waste rock. A significant portion of the paste backfill may not participate in the mixing process, particularly in stopes with large horizontal cross-sectional area. Consequently, using the total quantity of in-place paste backfill may lead to an overestimation of the maximum allowable waste rock mass.
The large-scale validation tests were designed to evaluate whether the proposed empirical solution could provide reliable predictions under conditions that differed from those of the small-scale tests and more closely resembled field conditions. Accordingly, the large-scale tests involved greater paste backfill thickness, larger waste rock particle sizes, and broader PSDs. The paste backfill was prepared using a mixture of non-sulfidic and sulfidic tailings containing a higher proportion of fine particles than the tailings used in the small-scale tests. Both the waste rock and paste backfill were representative of those encountered under actual field condition at the mine site. Despite the encouraging results, additional validation tests using tailings and waste rock from various mining operations are recommended to further assess the general applicability of the proposed solution across a broader range of conditions.
In this study, uncemented paste backfill was used to facilitate sample cutting after drying and to allow visual observation of the internal distribution of waste rock particles. However, cemented paste backfill is commonly used in underground mining operations, particularly in primary stopes. The presence of binder may influence the rheological and mechanical properties of the paste backfill, including yield stress, viscosity, stiffness, bonding behavior, and early-age strength development, which may in turn affect waste rock penetration and mixing behavior. Nevertheless, before significant cementation and strength development occur, the proposed empirical solution may still provide a preliminary estimate of the maximum allowable waste rock mass for early-age cemented paste backfill. Additional experimental studies using cemented paste backfill are required to evaluate the effects of binder content, curing time, and paste rheology on the mixing process and to validate, calibrate, or improve the proposed solution.
Although the large-scale tests extended the range of experimental conditions investigated, the dimensions of the experimental setup remained considerably smaller than those of actual underground mine stopes, which typically extend several to tens of meters in both vertical and horizontal directions. Consequently, larger-scale laboratory and field trials are required to further assess the applicability of the proposed solution under real mining conditions.
Another limitation of this study is the lack of a quantitative assessment of mixing quality. While the maximum allowable waste rock mass was evaluated, the spatial distribution and homogeneity of the resulting mixture were not systematically quantified. Future research is therefore needed and is currently underway to develop method for assessing the quality of mixing between dumped waste rock and in paste backfill.
6. Conclusions
In this study, the natural mixing between dumped waste rock and paste backfill was evaluated through a series of small- and large-scale laboratory tests. An empirical solution was proposed to estimate the maximum allowable waste rock mass that can naturally mix with paste backfill without causing substantial non-mixing between the two materials.
The results showed that increasing the solids content of the paste backfill decreases the maximum allowable waste rock mass, whereas increasing the paste backfill thickness increases the maximum allowable waste rock mass. In contrast, the horizontal dimensions of the mold did not significantly affect the maximum allowable waste rock mass under the tested conditions. The results also demonstrated that the maximum allowable waste rock mass increases with increasing waste rock falling height and maximum particle size.
The experimental data were used to calibrate the empirical coefficients of the proposed solution. The applicability and predictive capability of the proposed solution, together with the calibrated coefficients, were successfully validated using new and independent small-scale and large-scale experimental data. The proposed solution can therefore be used to estimate the maximum allowable mass of waste rock that can be dumped onto paste backfill without causing substantial non-mixing between the two materials.
Further studies are required to explicitly account for the effect of the waste rock receiving area and to evaluate, calibrate, and validate the proposed solution under full-scale field conditions.
Author Contributions
P.K.; conceptualization, methodology, experimental tests, investigation, data curation, formal analysis, validation, visualization, writing—original draft. L.L.; conceptualization, methodology, resources, funding acquisition, project administration, supervision, review & editing. All authors have read and agreed to the published version of the manuscript.
Funding
Natural Sciences and Engineering Research Council of Canada: RGPIN-2024–06859; Natural Sciences and Engineering Research Council of Canada: ALLRP 580767–22) and ALLRP 580767–22).
Data Availability Statement
The original contributions presented in this study are included in the article. Further inquiries can be directed to the corresponding author.
Acknowledgments
The authors acknowledge the financial support of the Natural Sciences and Engineering Research Council of Canada (RGPIN-2024–06859 and ALLRP 580767–22). The authors also acknowledge the financial and in-kind supports of the industrial partners of the Research Institute on Mines and the Environment (RIME) UQAT–Polytechnique (http://rime-irme.ca, accessed on 17 June 2026). The three anonymous reviewers are gratefully acknowledged for their insightful and constructive comments, which help improve the quality of the manuscript. ChatGPT (OpenAI) was used to assist with language editing and grammar correction.
Conflicts of Interest
The authors declare no conflicts of interest.
Appendix A. Quality Control and Improved Procedure
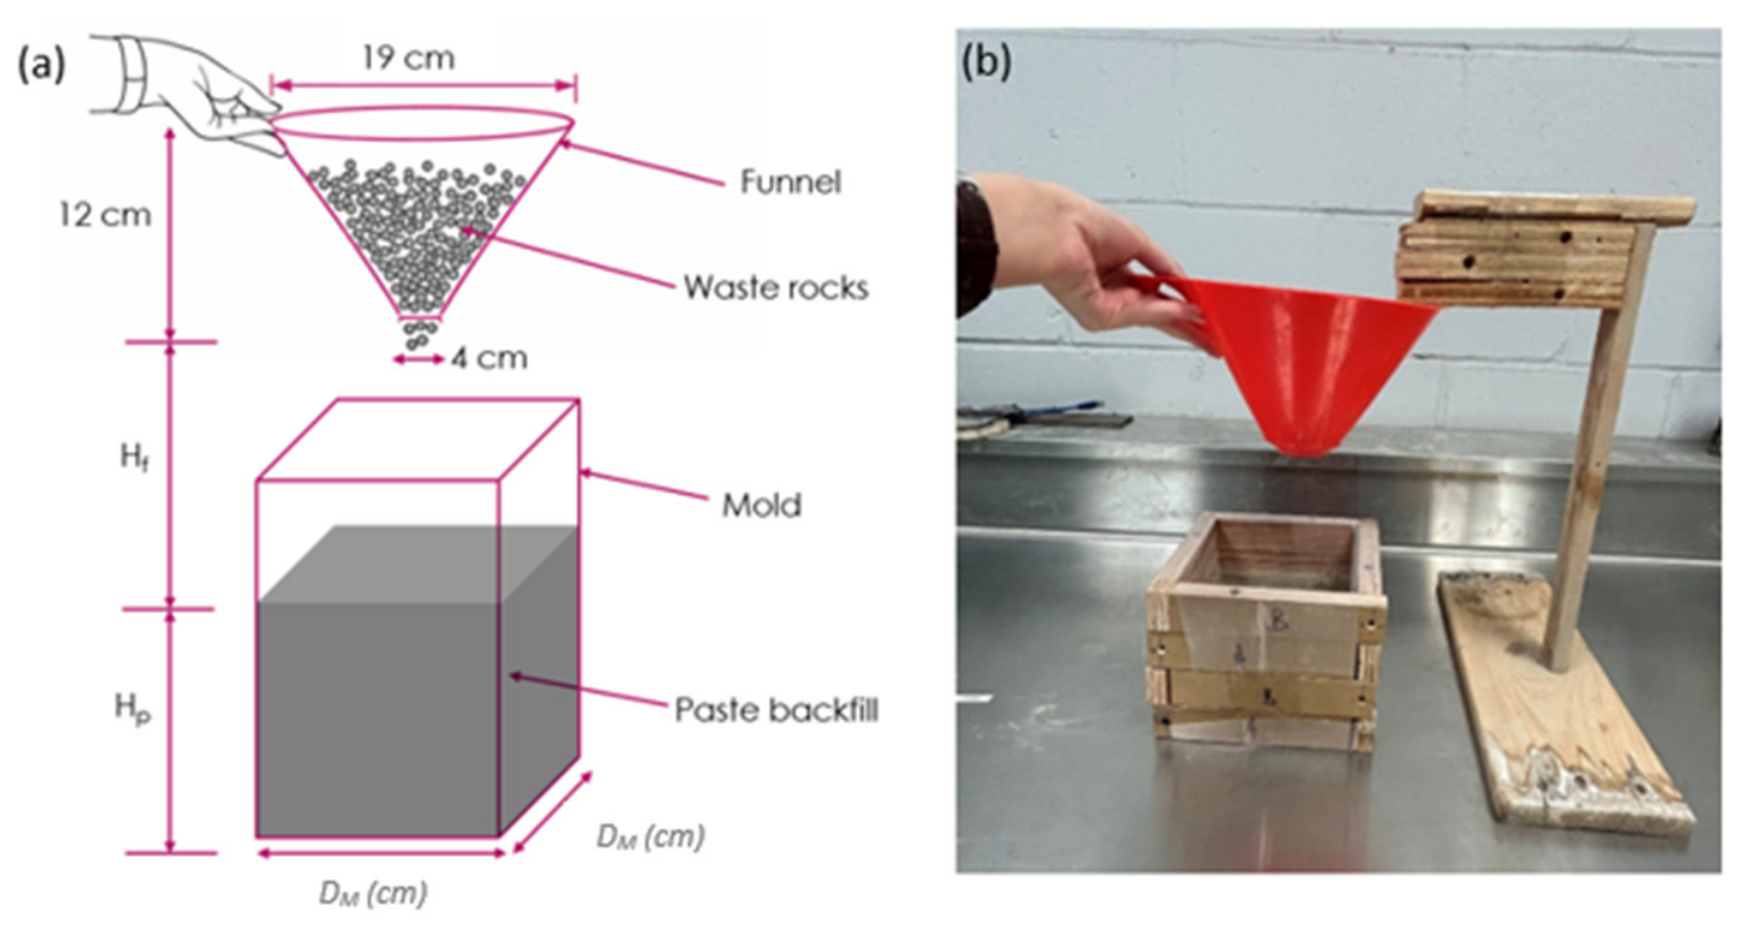
Figure A1 illustrates the initial small-scale physical model used to investigate the natural mixing of waste rock dumped onto paste backfill. Figure A1a presents a schematic representation of the experimental setup, while Figure A1b presents a photograph of the laboratory model.
Figure A1.
The initial small-scale physical model used to study the natural mixing of waste rocks dumped onto paste backfill: (a) a schematic presentation; (b) a photograph.
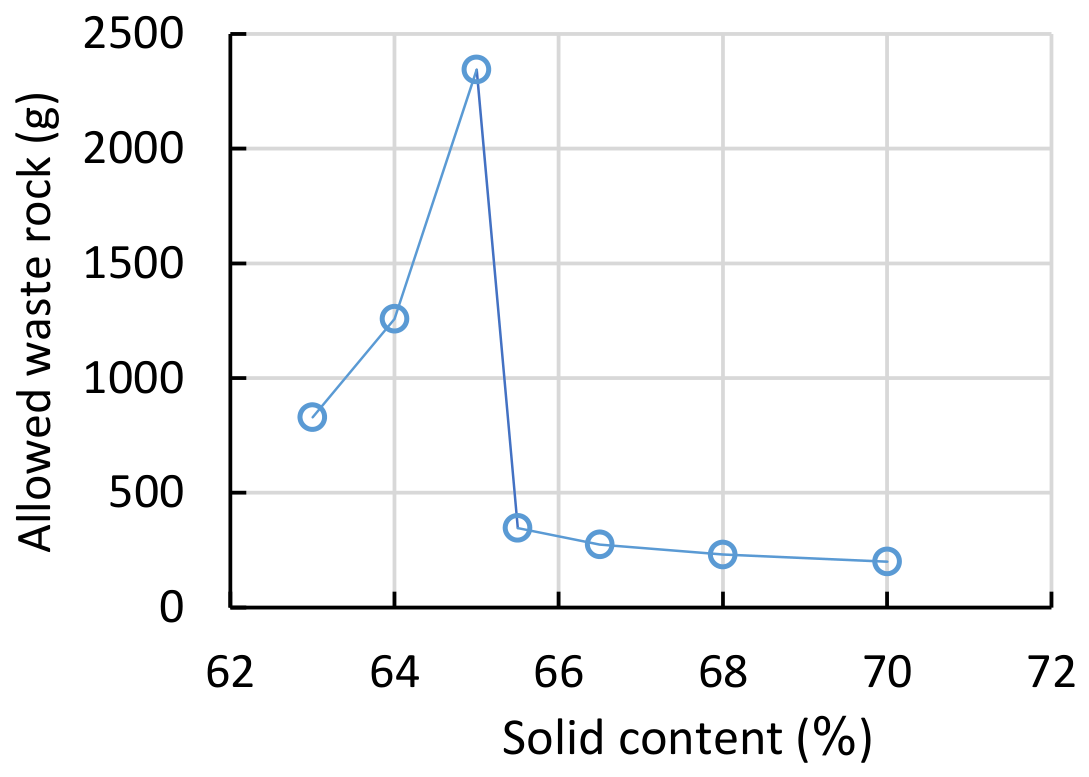
A series of preliminary experiments were conducted using this physical model to investigate the influence of paste backfill solids content on the maximum allowable waste rock mass. Figure A2 shows the variation in the maximum allowable waste rock mass as a function of paste backfill solids content. The results did not exhibit a consistent trend. As the solids content increased, the maximum allowable waste rock mass initially increased and then decreased sharply following a relatively small increase in solids content. Such behavior was not physically reasonable and suggested the presence of experimental uncertainties.
Figure A2.
Relationship between paste backfill solids content and maximum allowable waste rock mass obtained from preliminary tests.
This irregular behavior was attributed to limitations of the initial experimental setup. At the beginning of the study, the funnel used to pour the waste rock was not fixed to the support frame and was held manually during the testing (Figure A1). Consequently, small hand movements could occur, resulting in variations in either the waste rock falling height or the pouring location. These variations affected the test conditions and reduced the reliability of the results.
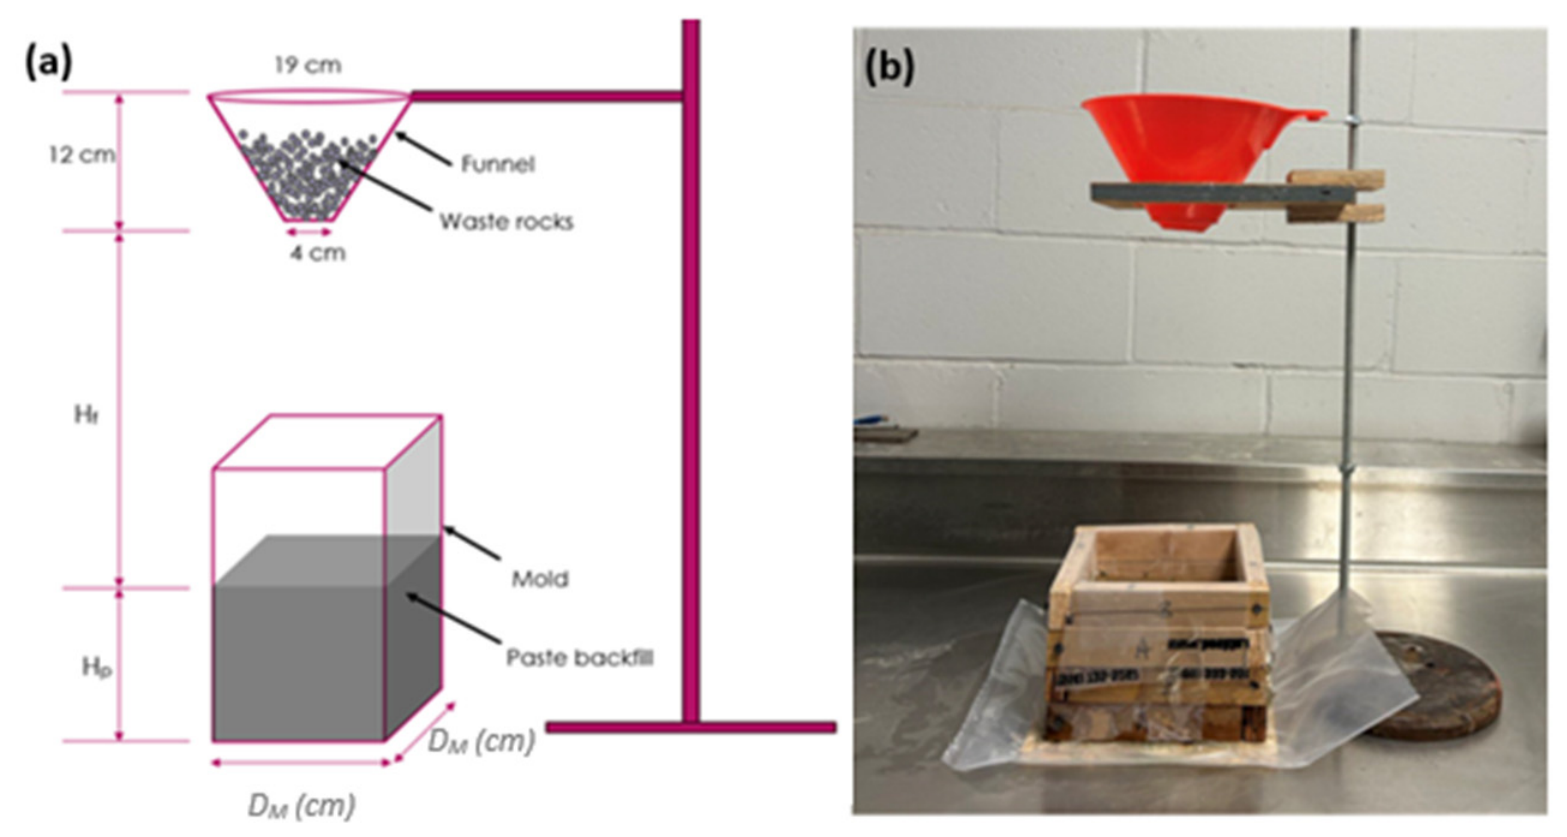
To reduce this source of error, the experimental setup was improved by rigidly fixing the funnel to the support frame. This modification ensured that the funnel position remained stable throughout each test and that the waste rock falling height remained constant. The improved setup is shown in Figure A3, including a schematic representation (Figure A3a) and a photograph of the laboratory model (Figure A3b). Following this modification, the experiments were repeated under controlled conditions.
Figure A3.
Improved experimental setup with funnel rigidly fixed to support frame: (a) schematic representation; (b) laboratory photograph.
Following this improvement, the results exhibited a clearer trend, with the maximum allowable waste rock mass decreasing as the paste backfill solids content increased. However, the repeatability of the results remained limited, as repeated tests conducted under identical conditions produced different values (Figure A4). Further investigation revealed that this variability was mainly caused by inconsistencies in the pouring location. In some tests, the waste rock was not poured exactly at the center of the mold, resulting in non-uniform waste rock distribution within the paste backfill (Figure A5).
Figure A4.
The relationship between paste backfill solids content and maximum allowable waste rock mass after the first improvement in the experimental setup, showing the variability observed in repeated tests conducted under identical conditions.
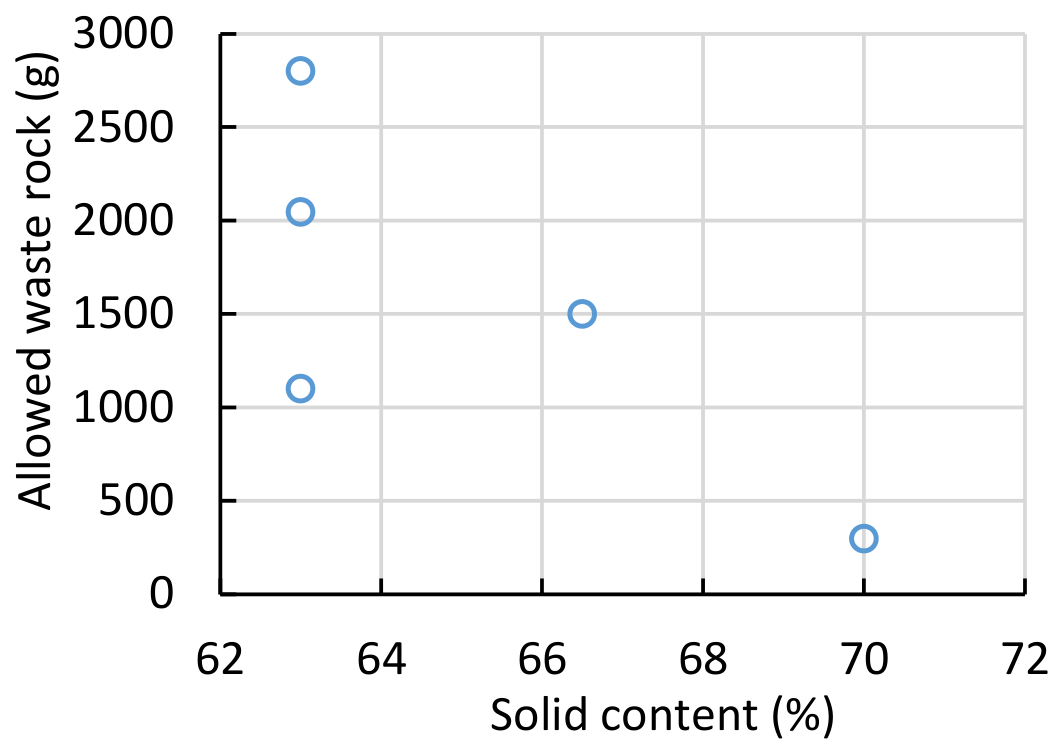
Figure A5.
Top-view photographs illustrating centered and off-centered waste rock pouring.
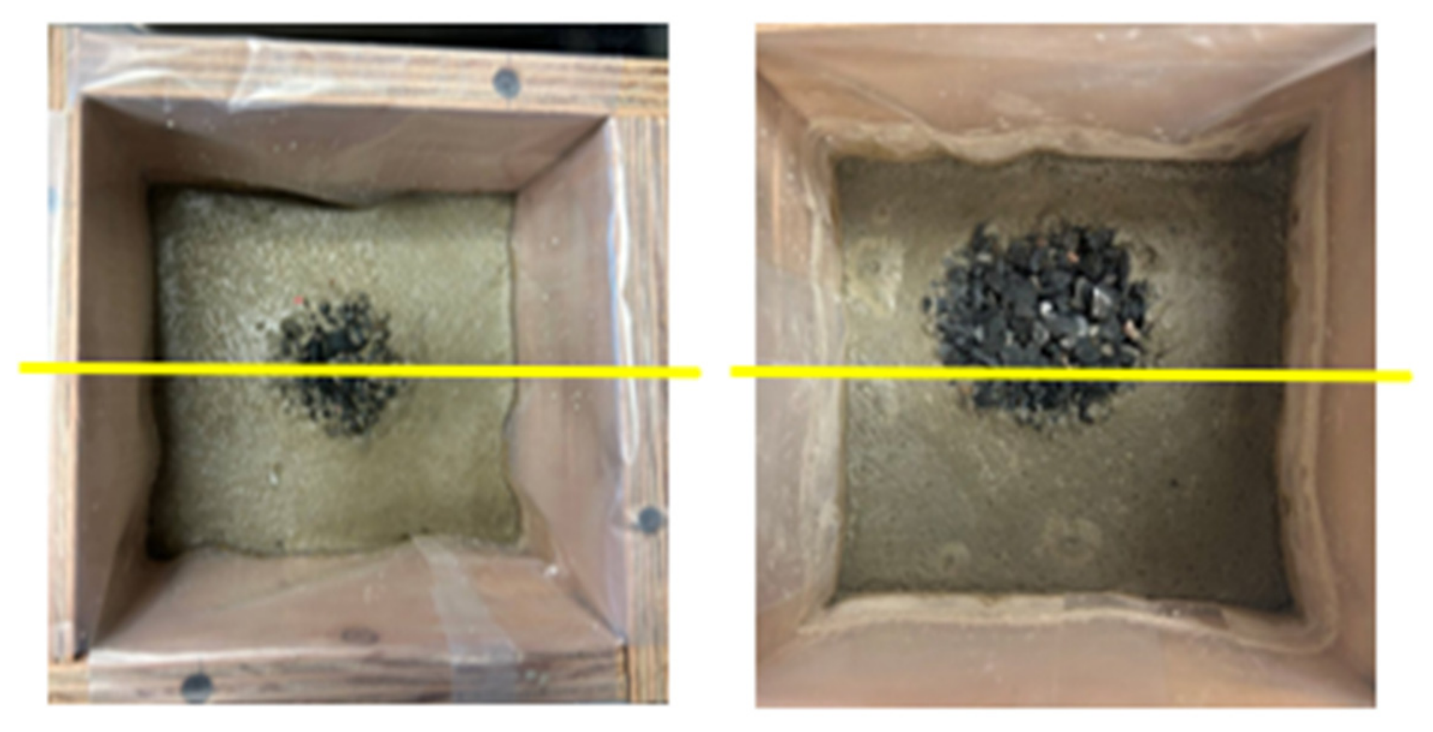
To address this issue, a second improvement was introduced. The exact center of the mold was clearly marked, and the funnel was carefully aligned with this point before each test. This ensured that the waste rock was consistently poured at the center of the mold in all experiments (see Figure 3b). By controlling both the waste rock falling height and the pouring location, the experimental conditions were further stabilized, allowing a more reliable evaluation of the influence of paste backfill solids content on the maximum allowed waste rock mass.
It should be noted that all experimental results presented in this study were obtained using this final improved procedure.
Appendix B. Verification of Experimental Repeatability
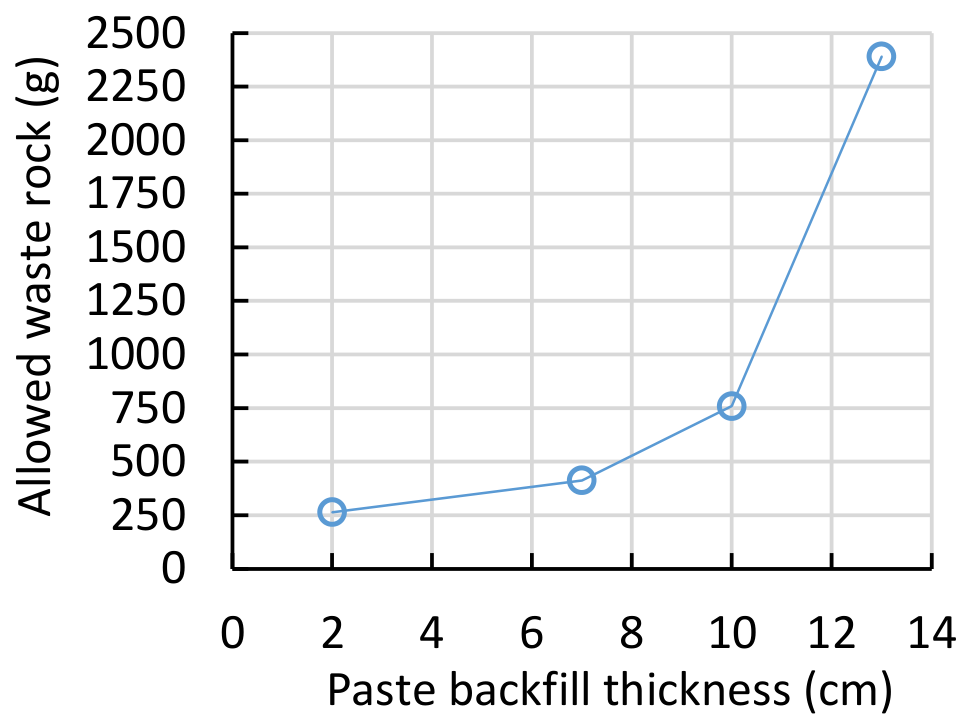
Figure A6 presents the preliminary results obtained for the influence of paste backfill thickness on the maximum allowable waste rock mass. A sudden increase in the maximum allowable waste rock mass was observed at a paste backfill thickness of 13 cm. This behavior was unexpected because the paste backfill, with a solids content of 70%, did not exhibit highly fluid behavior.
To verify the reliability of these observations and eliminate the possibility of experimental errors, all data points in the paste backfill thickness series were repeated two additional times under the same controlled conditions. As shown in Figure 8, all experimental results were successfully reproduced except for the test conducted at a paste backfill thickness of 13 cm.
Figure A6.
The relationship between paste backfill thickness and maximum allowable waste rock mass observed from preliminary tests; experimental conditions correspond to Case 2 in Table 1.
To further assess the repeatability and reliability of the experimental program, a total of 14 additional repetition tests were conducted at arbitrarily selected testing conditions. These repeated tests are presented in Figure 6, Figure 8, Figure 10 and Figure 12 and demonstrate the overall consistency and repeatability of the experimental results.
References
- Lottermoser, B.G. Introduction to Mine Wastes, in Mine Wastes: Characterization, Treatment and Environmental Impacts; Springer: Berlin/Heidelberg, Germany, 2010; pp. 1–41. [Google Scholar]
- Manaviparast, H.R.; Miranda, T.; Pereira, E.; Cristelo, N. A comprehensive review on mine tailings as a raw material in the alkali activation process. Appl. Sci. 2024, 14, 5127. [Google Scholar] [CrossRef] [Scilit]
- Iqbal, A.; Mashaan, N.S.; Paraskeva, T. Mining waste in asphalt pavements: A critical review of waste rock and tailings applications. J. Compos. Sci. 2025, 9, 402. [Google Scholar] [CrossRef] [Scilit]
- Vick, S.G. Planning, Design, and Analysis of Tailings Dams; BiTech Publishers Ltd.: Hammersmith Way Richmond, BC, Canada, 1990. [Google Scholar]
- James, M.; Aubertin, M.; Bussière, B. On the use of waste rock inclusions to improve the performance of tailings impoundments. In Proceedings of the 18th International Conference Soil Mechanics and Geotechnical Engineering, Paris, France, 2–6 September 2013. [Google Scholar]
- Azam, S.; Li, Q. Tailings dam failures: A review of the last one hundred years. Geotech. News 2010, 28, 50–54. [Google Scholar]
- Rico, M.; Benito, G.; Salgueiro, A.; Díez-Herrero, A.; Pereira, H. Reported tailings dam failures: A review of the European incidents in the worldwide context. J. Hazard. Mater. 2008, 152, 846–852. [Google Scholar] [PubMed]
- Aubertin, M.; Bussière, B.; Bernier, L.; Chapuis, R.; Julien, M.; Belem, T.; Simon, R.; Mbonimpa, M.; Benzaazoua, M.; Li, L. La gestion des rejets miniers dans un contexte de développement durable et de protection de l’environnement. Congrès Annu. Société Can. Génie Civ. 2002, 5–8. [Google Scholar] [CrossRef] [Scilit]
- Martin, T.; McRoberts, E. Some considerations in the stability analysis of upstream tailings dams. In Proceedings of the Sixth International Conference on Tailings and Mine Waste; AA Balkema Rotterdam: Amsterdam, The Netherlands, 1999. [Google Scholar]
- Lyu, Z.; Chai, J.; Xu, Z.; Qin, Y.; Cao, J. A comprehensive review on reasons for tailings dam failures based on case history. Adv. Civ. Eng. 2019, 2019, 4159306. [Google Scholar] [CrossRef] [Scilit]
- Bernd, G.; Bernd, G. Mine Wastes, Characterization, Treatment and Environmental Impacts; Springer: Berlin, Germany, 2007. [Google Scholar]
- Blowes, D.; Ptacek, C.; Jambor, J.; Weisener, C.; Paktunc, D.; Gould, W.; Johnson, D. The geochemistry of acid mine drainage. Environ. Geochem. 2003, 9, 149–204. [Google Scholar] [CrossRef] [Scilit]
- Johnson, D.B.; Hallberg, K.B. Acid mine drainage remediation options: A review. Sci. Total Environ. 2005, 338, 3–14. [Google Scholar] [CrossRef] [Scilit] [PubMed]
- Nordstrom, D.K.; Alpers, C. Geochemistry of Acid Mine Waters. In The Environmental Geochemistry of Mineral Deposits; Society for Economic Geologists: Littleton, CO, USA, 1997; pp. 133–160. [Google Scholar]
- Fan, C.; Li, L.; Yang, X.; Liu, G.; Guo, L.; Tang, J. Analytical solution for determining wall closure associated with stope excavation underneath sill mat constructed by cemented backfill. J. Rock Mech. Geotech. Eng. 2025, 17, 983–995. [Google Scholar]
- Yang, P.Y.; Li, L. Investigation of the short-term stress distribution in stopes and drifts backfilled with cemented paste backfill. Int. J. Min. Sci. Technol. 2015, 25, 721–728. [Google Scholar] [CrossRef] [Scilit]
- Fan, C.; Li, L.; Liu, G.; Yang, X.; Guo, L.; Tang, J. Analytical solution for estimating the minimum required strength of sill mat by considering failure due to rock wall closure. J. Rock Mech. Geotech. Eng. 2025, 17, 996–1007. [Google Scholar] [CrossRef] [Scilit]
- Ma, Q.; Liu, G.; Yang, X.; Guo, L.; Fourie, A. Stability of base-exposed backfill roof considering interfaces between adjacent drifts in underhand drift-and-fill mining. J. Rock Mech. Geotech. Eng. 2026, 18, 214–229. [Google Scholar]
- Aubertin, M.; Bussière, B.; Bernier, L. Environnement et Gestion des Rejets Miniers; Presses Internationales Polytechnique: Montréal, QC, Canada, 2002. [Google Scholar]
- James, M.; Aubertin, M. The use of waste rock inclusions to improve the seismic stability of tailings impoundments. In Proceedings of the GeoCongress 2012: State of the Art and Practice in Geotechnical Engineering, Oakland, CA, USA, 25–29 March 2012; pp. 4166–4175. [Google Scholar]
- Tatiya, R.R. Surface and Underground Excavations: Methods, Techniques and Equipment; CRC Press: Boca Raton, FL, USA, 2005. [Google Scholar]
- Lee, C.; Gu, F. Co-disposal of waste rock with backfill. In UMT 2017: Proceedings of the First International Conference on Underground Mining Technology; Australian Centre for Geomechanics: Crawley, WA, Canada, 2017. [Google Scholar]
- Zhang, Y.; Li, L.; Ouellet, S.; Gélinas, L.-P. Numerical and experimental studies of the natural mixing behavior between an uncemented paste backfill and dumped waste rock in stopes from laboratory toward field conditions. Part I: Calibration and validation of a numerical model. Deep. Resour. Eng. 2026, 3, 100232. [Google Scholar] [CrossRef] [Scilit]
- Zhang, Y.; Li, L.; Gélinas, L.-P.; Ouellet, S. Numerical and experimental studies of the natural mixing behavior between an uncemented paste backfill and dumped waste rock in stopes from laboratory toward field conditions. Part II: Application and prediction of the validated and calibrated numerical model. Deep. Resour. Eng. 2026, 100236, in press. [Google Scholar]
- Qiu, H.; Zhang, F.; Liu, L.; Hou, D.; Tu, B. Influencing factors on strength of waste rock tailing cemented backfill. Geofluids 2020, 2020, 8847623. [Google Scholar] [CrossRef] [Scilit]
- Qiu, H.; Zhang, F.; Sun, W.; Liu, L.; Zhao, Y.; Huan, C. Experimental study on strength and permeability characteristics of cemented rock-tailings backfill. Front. Earth Sci. 2022, 10, 802818. [Google Scholar] [CrossRef] [Scilit]
- Hane, I.; Belem, T.; Benzaazoua, M.; Maqsoud, A. Laboratory characterization of cemented tailings paste containing crushed waste rocks for improved compressive strength development. Geotech. Geol. Eng. 2017, 35, 645–662. [Google Scholar]
- Liu, G.; Li, L.; Yao, M.; Landry, D.; Malek, F.; Yang, X.; Guo, L. An investigation of the uniaxial compressive strength of a cemented hydraulic backfill made of alluvial sand. Minerals 2017, 7, 4. [Google Scholar] [CrossRef] [Scilit]
- Yang, P.; Li, L.; Aubertin, M.; Brochu-Baekelmans, M.; Ouellet, S. Stability analyses of waste rock barricades designed to retain paste backfill. Int. J. Geomech. 2017, 17, 04016079. [Google Scholar] [CrossRef] [Scilit]
- Qin, J.; Zheng, J.; Li, L. Experimental study of the shrinkage behavior of cemented paste backfill. J. Rock Mech. Geotech. Eng. 2021, 13, 545–554. [Google Scholar] [CrossRef] [Scilit]
- Dalcé, J.B.; Li, L.; Yang, P. Experimental study of uniaxial compressive strength (UCS) distribution of hydraulic backfill associated with segregation. Minerals 2019, 9, 147. [Google Scholar] [CrossRef] [Scilit]
- Lee, C.; Gillot, P. Case study–a high strength paste aggregate backfill at Randgold’s Loulo mine in Mali. In Mine Fill 2014: Proceedings of the Eleventh International Symposium on Mining with Backfill; Australian Centre for Geomechanics: Crawley, WA, Canada, 2014. [Google Scholar]
- Sun, W.; Wang, H.; Hou, K. Control of waste rock-tailings paste backfill for active mining subsidence areas. J. Clean. Prod. 2018, 171, 567–579. [Google Scholar] [CrossRef] [Scilit]
- Kuganathan, K.; Sheppard, I. A non-segregating’Rocky Paste Fill’(RPF) produced by co-disposal of cemented de-slimed tailings slurry and graded rockfill. In Proceedings of the Minefill 2001: 7 th International Symposium on Mining with Backfill, Seattle, WA, USA, 17–19 September 2001. [Google Scholar]
- Potvin, Y.; Thomas, E.; Fourie, A. Handbook on Mine Fill; Australian Centre for Geomechanics: Crawley, WA, Canada, 2005; p. 179. [Google Scholar]
- Zhang, Y.; Li, L. Experimental study on the natural mixing behaviour of waste rocks poured in a paste backfill. Int. J. Min. Reclam. Environ. 2023, 37, 953–977. [Google Scholar] [CrossRef] [Scilit]
- Zhang, Y. Investigation of the Natural Mixing Behavior of Dumped Waste Rock and Paste Backfill; Ecole Polytechnique: Montreal, QC, Canada, 2024. [Google Scholar]
- Deiminiat, A.; Li, L. Experimental study on the reliability of scaling down techniques used in direct shear tests to determine the shear strength of rockfill and waste rocks. CivilEng 2022, 3, 35–50. [Google Scholar] [CrossRef] [Scilit]
- Zhang, Y.; Li, L. Optimization of discrete element method model to obtain stable and reliable numerical results of mechanical response of granular materials. Minerals 2024, 14, 758. [Google Scholar] [CrossRef] [Scilit]
- Hassani, F.P.; Archibald, J.F. Mine Backfill; Canadian Institute of Mining, Metallurgy and Petroleum: Montreal, QC, Canada, 1998. [Google Scholar]
- Zheng, J.; Li, L. Experimental study of the “short-term” pressures of uncemented paste backfill with different solid contents for barricade design. J. Clean. Prod. 2020, 275, 123068. [Google Scholar] [CrossRef] [Scilit]
- Kazemi, P. Empirical Solution to Estimate the Maximum Allowed Mass of Dumped Waste Rock to Avoid Significant Poor Mixture Between Dumped Waste Rock and Paste Backfill in Stopes. Master’s Thesis, Ecole Polytechnique de Montéal, Montreal, QC, Canada, 2026. [Google Scholar]

Disclaimer/Publisher’s Note: The statements, opinions and data contained in all publications are solely those of the individual author(s) and contributor(s) and not of MDPI and/or the editor(s). MDPI and/or the editor(s) disclaim responsibility for any injury to people or property resulting from any ideas, methods, instructions or products referred to in the content. |
© 2026 by the authors. Licensee MDPI, Basel, Switzerland. This article is an open access article distributed under the terms and conditions of the Creative Commons Attribution (CC BY) license.