


Abstract
The Neoproterozoic Wadi Mahasin metavolcanics (WMVs) in the Central Eastern Desert, Egypt, were remapped using Landsat-8 and Sentinel-2 imagery and verified by field observations, and their petrogenesis was evaluated using petrography, whole-rock geochemistry, and Pb isotopes. The image processing techniques of decorrelation stretch (DS), band ratios (BR), principal component analysis (PCA), and Minimum Noise Fraction (MNF) were applied to three remotely sensed datasets from Landsat-8, Sentinel-2B, and Planet to produce an updated geologic map of the study area. Moreover, two robust supervised classification techniques, maximum likelihood (MLC) and the support vector machine (SVM), enhanced geological contacts, structural elements, and produced classified images by 95.68% and 96%, respectively. The WMV suite comprises metadacite and metarhyolite with SiO2 contents of 61.8–66.5 and 77.8–79.8 wt.%, respectively, and belongs to a subalkaline calc–alkaline series with a transitional medium- to high-K character at the felsic end. Primitive mantle-normalized patterns show enrichment in LILEs (Rb, U, K, and Pb) and depletion in Nb, Ta, Ti, and P, consistent with subduction-related felsic magmatism. Chondrite-normalized REE patterns are characterized by enriched LREEs, flat to weakly fractionated HREEs ((Gd/Yb)N ≈ 1.5), and negative Eu anomalies (Eu/Eu* = 0.30–0.81). The flat HREE segment suggests melting of a garnet-free source, most plausibly a plagioclase–amphibole-bearing crustal assemblage. Eu/Eu* correlates positively with Sr for the suite as a whole, indicating plagioclase control during differentiation. Metarhyolite samples form a tightly clustered evolved group, whereas metadacites show broader scatter that mainly reflects differentiation. Pb isotopes and crust-like trace-element ratios (high Y/Nb, low Ce/Pb, and low Nb/U) indicate strong crustal involvement. Although assimilation–fractional crystallization from a mantle-derived parent magma cannot be excluded completely, the available isotopic data do not define a simple mantle-to-crust differentiation trend, and the uniformly evolved major- and trace-element signatures favor direct partial melting of felsic continental crust, followed by limited fractional crystallization. The WMV suite is, therefore, interpreted as a mature continental-arc felsic assemblage within the Arabian–Nubian Shield.
1. Introduction
The northwest region of the Arabian–Nubian Shield (ANS) comprises the Neoproterozoic complexes discovered in the Sinai and Eastern Desert (ED) [1,2,3,4]. The East African (900–530 Ma) Orogen caused ANS development. The ANS is a mixture of granitic intrusions, metasedimentary assemblages, arc-related metavolcanic rocks, and low-grade metamorphosed ophiolite complexes [5,6]. Numerous ANS terranes comprise Tonian/Cryogenian volcanic rocks, which have undergone sporadic metamorphism to greenschist facies. An understanding of the development of Neoproterozoic subduction region magmatism can be attained by examining arc volcanic rocks found in various ANS regions. Furthermore, the arc volcanic rocks of the ANS have the potential to host Cu deposits and banded iron, plus other potential significant critical resources [7,8].
The arc maturity regime involves an understanding of the various stages of ongoing growth of intra-oceanic arcs [9]. Tholeiitic (mafic) basalts are the hallmark of the early immature arc stage, whereas calc-alkaline to shoshonitic felsic lavas are hallmarks of the mature later stage [10]. Throughout the Neoproterozoic Egyptian Shield, the volcanic rocks make up significant geological units and cover large areas. There are two main volcanic phase categories represented: Neoproterozoic and Phanerozoic volcanic rocks. The Dokhan volcanics and metavolcanic rocks (older and younger, respectively) are the main volcanic episodes that make up the first category [7,11]. By contrast, the Phanerozoic volcanic rocks are the products of minor volcanic activity and include the Natash volcanic rocks [12]. The metavolcanic rocks (metamorphosed) are extensively dispersed in the Central and Southern Desert, which comprises the older (ascribed to ophiolitic sequence) and younger sequences (medium-K calc–alkaline rocks that originate within the arc regime) with a mafic to felsic range. Conversely, the unmetamorphosed Dokhan Volcanics (615–560 Ma) are widely distributed in the North Eastern Desert and Sinai, are typically rhyolitic to andesitic, have medium-high K affinities, and commonly contain welded tuffs [11,13,14].
Said [15] shed light on the genesis of the gold mineralization in the gold-bearing quartz veins cutting across the island arc metavolcanic rocks of the Wadi Mahasin area. They proposed that the development of gold resources in the Wadi Mahasin area involved the intrusion of syenogranites and quartz–feldspar dike in the arc rocks and nearby serpentinites, accompanied by a convection flow system at their contacts, leading to leaching, mobilizing, and redeposition into quartz veins.
Remote sensing in geological studies has been a vital method to obtain data to complement geological mapping [16]. The identification and enhancement of geological contacts is a cornerstone of this geological mapping. Satellite images are considered to be the most helpful and efficient technique for discriminating rock unit varieties in desert environments. In context, these images contain valuable information on the spectral characteristics of these rock units. Satellite images have the advantage of being multi-sensor and multi-scale with high spatial resolution, particularly in vast and remote areas.
Arnous [17] suggested that remote sensing is the most significant modern technology used to produce litho-structural maps and mineral detection. Sabins [18] suggested that the greatest benefit of remote sensing is when it is used in the detection of lithological differences between rock units and alteration zones mapping. In addition, remote sensing algorithms have been improved to recognize different lithological units. These techniques offer different approaches based on spectral characteristics (e.g., band ratios) and statistical analysis (e.g., principal component analysis). The integration of the results of these different techniques has become a more cost-effective method for geological mapping than the conventional methods. The accuracy of the produced geologic maps can be enhanced when the complexity and spectral features of variable rock units have been taken into consideration. The geological mapping using remotely sensed data in the Nubian Egyptian Shield has been paid attention to by many authors [19,20,21].
In the current study, the crystalline rocks from the research area were refined using image processing from the Landsat-8 OLI/TIRS and Sentinel 2A, with a focus on the metavolcanic rock units. Previous geological maps (Figure 1) of the study area were reviewed [20,22], and a new geological map was created depending on remote sensing data interpretation, which was verified by ground truthing and petrology. Therefore, multisensor remote sensing data were integrated with field observations, petrography, whole-rock geochemistry, and Pb isotopes to refine the lithological map of the Wadi Mahasin metavolcanics and to constrain their petrogenesis. The objectives are to: (i) improve the geological mapping of the WMV rocks, (ii) define their petrochemical and tectonomagmatic affinities, (iii) evaluate the relative roles of crustal melting, fractional crystallization, and possible AFC overprinting, and (iv) place the Wadi Mahasin suite within the evolution of Neoproterozoic arc magmatism in the Arabian–Nubian Shield.
Figure 1.
(a) Location of Wadi Mahasin map and (b) geologic map of Mahasin area (after [23]).
2. Materials and Methodology
2.1. Remotely Sensed Data
One of our approaches used in this study was refining the previous geological map with emphasis on the metavolcanic rocks. To achieve this aim, two optical remote sensing datasets were processed: Landsat-8 OLI/TIRS and Sentinel-2B. Landsat-8 carries two optical sensors: the Operational Land Imager (OLI) and Thermal Infra-Red Sensor (TIRS). The spectral ranges of the OLI are offered on 9 channels possessing the visible–near-infrared (VNIR) and short-wave-infrared (SWIR) ranges and with a resolution of 30 m for bands of (1–7 and 9), and 15 m for the panchromatic band 8. The TIRS sensor contains two thermal bands (10 and 11) with a resolution of 100 m (https://www.usgs.gov/landsat-missions/landsat-8, accessed: 2 December 2025). The Sentinel-2B sensor was in orbit in June 2015 and provides spectral data in 13 bands, which cover ranges of VNIR, TIR, and SWIR. The spatial resolution of Sentinel-2B data is offered in three classes. Band-1 has 60 m spatial resolution, whereas the VNIR bands of 2, 3, 4, 8, and 8A have a 10 m spatial resolution. The two SWIR bands (11 and 12) have 20 m spatial resolution (https://www.earthdata.nasa.gov/data/instruments/sentinel-2-msi, accessed: 2 December 2025).
The implementation of geological mapping is predicated on the choice of suitable and effective reference remotely sensed data. Ideally, if the reference data are sufficient in spatial resolution, the produced maps can be highly accurate and detect small-scale rock units. The present study area is considered a relatively small area, and the two sensors, Landsat-8 and Sentinel-2B, are classified as moderate spatial resolution images regarding geological mapping. Therefore, the present study used high-resolution remotely sensed data from Planet satellite with ~3 m resolution to enhance the spatial resolution of the two aforementioned sensors to create a detailed lithological map (Figure 1). Moreover, this adopted approach can help in detecting structural elements and their kinematic indicators in the study area. Fortunately, the Planet satellite images at this spatial resolution allow for the mapping of larger clear-cut areas and significantly increase the ability to detect small-scale rock exposures. Planet satellites are operated by Planet Labs and are considered a high-resolution Earth observation satellite constellation. It is composed of hundreds of small cubesats called “Dove”. The system was launched in 2014 and comprises over 130 active satellites orbiting at about 475 km altitude in sun-synchronous orbits. Each satellite holds a multispectral optical sensor, capturing red, green, blue, and near-infrared bands. In 2021, they replaced Dove with the SuperDoves satellite, which introduced four additional spectral bands: green I, red edge, yellow, and coastal blue (https://docs.planet.com/data/imagery/planetscope, accessed: 2 December 2025). Moreover, this adopted approach can help in detecting structural elements and their kinematic indicators in the study area. The Planet satellite system is a group of over 200 satellites. Planet satellite sensors record four bands of visible (R-G-B) and NIR spectral region ranges from 0.455 to 0.860 µm.
In the preprocessing stage, the three datasets were subjected to computational procedures such as data preparation (for lithologic units) and feature extraction (for the structural elements). The results of these preprocessing corrections were used to obtain pure pixels and spectral signatures comparable to specific rock unit varieties [24]. The datasets were geometrically corrected to zone 36 of the Universal Transverse Mercator (UTM), using the datum from WGS84, and they are cloud-free. Landsat-8 and Sentinel-2B scenes were adjusted radiometrically utilizing the ENVI 5.3 algorithm, which is necessary for converting the images from digital number (DN) to reflectance data. This step is important to improve the datasets, which in turn give an accurate geologic map of the study area. The Landsat-8 and Sentinel-2B data were atmospherically corrected using Fast Line-of-Sight Atmospheric Analysis of Spectral Hyper cubes (FLAASH) [25], but the Planet scenes were subjected to simple crosstalk correction. After that, the basic procedures of layer-stacking of each satellite band and subsetting to determine the precise field of study were performed on the three datasets. Finally, a Gram–Schmidt pan-sharpening improvement function was utilized to enhance the spatial resolution of Landsat-8 (30 m) and Sentinel-2B (10 m) using the 3 m spatial resolution of Planet images.
To construct the geologic map, the discrimination of lithological contacts and extraction of the structural elements required us to enhance the datasets used by one of the methods for processing images. The techniques performed included false color combination (FCC), decorrelation stretch (DS), band ratios (BR), principal component analysis (PCA), Minimum Noise Fraction (MNF), and supervised classification. These techniques successfully converted the spectral characteristics of the different rock units to colorful images that are easier to interpret.
2.2. Field Work and Petrography
Twenty-four specimens were collected from the volcanic rocks of the Wadi Mahasin (WMVs), of which eighteen representative samples were prepared as thin sections to examine their mineralogy and textural relationships under a polarizing microscope.
2.3. Bulk Rock Analysis
Chemical analysis was performed on fifteen samples at ALS Geochemistry in North Vancouver, Canada. After lithium metaborate fusion, major element concentrations were determined by ICP-OES, whereas trace elements (Cs, Ba, Cr, Sr, Ta, Ga, V, Hf, Zr, Nb, U, Rb, Th, Y, and REE) were measured using ICP-MS (method ME-MS81). Other trace and major elements were analyzed using an ultra-trace four-acid digestion, after which a blending of ICP-OES and ICP-MS analysis was conducted. A number of approved reference materials were utilized for tracking the accuracy of the data: OREAS-101b, 920, 47, 45e, and 14p, and AMIS0167, 0085, 0304.
2.4. Analysis of Lead Isotopes
Lead (Pb) isotopic compositions were determined at ALS Geochemistry (North Vancouver, BC, Canada) using a quadrupole Inductively Coupled Plasma Mass Spectrometer (ICP-MS, manufactured by Agilent Technologies, Santa Clara, CA, USA), following the ALS method MS61L-PbIS. Finely pulverized whole-rock samples were subjected to an ultra-trace level four-acid digestion, using a mixture of nitric, perchloric, and hydrofluoric acids (HNO3-HClO4-HF). The samples were evaporated to incipient dryness and then reconstituted in hydrochloric acid (HCl) to ensure the complete dissolution of silicate matrix and refractory minerals. Following digestion, the sample solutions were introduced into the ICP-MS to measure the abundances of 206Pb, 207Pb, 208Pb, and 204Pb isotopes. Instrumental mass bias and signal drift were strictly monitored and corrected utilizing internal standardization and standard-sample bracketing protocols. Analytical quality, accuracy, and reproducibility were verified through the concurrent analysis of procedural blanks and replicate analyses of certified reference materials (CRMs) and internal rock standards, including OREAS-920, OREAS-47, and OREAS-45e. Procedural blanks yielded negligible Pb concentrations, indicating an uncontaminated background. Replicate analyses of the standards indicate that the analytical precision (2σ relative standard deviation) is better than 0.5% for the measured 206Pb/204Pb, 207Pb/204Pb, and 208Pb/204Pb ratios.
3. Field Observations
The eastern segment of the ANS (the greatest part of Earth’s continental crust) in the Arabian and the western flank of Egypt have remarkable Precambrian occurrences due to uplift induced by the Red Sea rifting [26]. The ANS achieved tectonic stability at around 540 Ma. An essential history of the tectonic events that characterized multiple phases can be found in the Neoproterozoic ANS crust, including ophiolitic-subducted arc terranes, continental collision, and post-collisional evolution. The Dokhan Volcanics, pink granites, and Hammamat sediments delineate the final stage of the evolution of the ANS [6,7,27,28,29,30,31,32]. The study covers about 82.28 km2 and is accessible through a 5 km paved road to the south of Qift-Qusier and an asphaltic road to the south of Gabal Duwi (Figure 1). It is located at the entrance of Wadi Karim at the intersection with Wadi Mahasin in the Egyptian Central Desert (Figure 2). The WM region, the subject of this work, is situated in Egypt’s Central Desert. Field observations reveal post-tectonic dikes, syenogranite, metavolcanics, metavolcaniclastic, and serpentinites rock. About 70% of the current area is made up of the arc metavolcanic and metavolcaniclastic rocks (Figure 1). The metavolcanic rocks are comprised of a variety of weakly metamorphosed felsic rocks and form noticeable hills with moderate relief. Felsic metavolcanic rocks are massive, fractured, and weathered along fault planes (Figure 2 and Figure 3). The arc metavolcanic and their metavolcaniclastic rocks, as well as granitic rocks, are intruded by mafic and felsic dikes. In the study area, dikes are commonly observed cutting granitic rocks in a variety of directions, but primarily vertical. Metadacite and metarhyolite are representative lithologies. In the southwestern portion of the research region, syenogranite is primarily found as low hilly blocks; in the southern portion, syenogranite intrudes the arc metavolcanic rocks. This coarse-grained, pinkish-colored rock exhibits elliptical weathering forms.
Figure 2.
Field observations: (A) a general view of the Mahasin metavolcanics (WMVs); (B) quartz–feldspar porphyries intruded in the WMVs; (C) the Mahasin metavolcanics at the intersection of W. Kariem and W. Mahasin; (D) a close view of the basic Mahasin metavolcanics; (E) intercalation of acidic and basic metavolcanic rocks; (F) syenogranite (Gr) intruded in serpentinites (Sp) at the south of W. Mahasin; (G) fractured metarhyolite; and (H) acidic dikes intruded in metarhyolite.
Figure 3.
Field observations: (A) foliated metarhyolite and metadacite; (B) the highly sheared metavolcanics at W. Mahasin; (C) the slightly foliated metavolcanics at W. Kareim; (D) the sinistral strike–slip fault and jointed metavolcanics at W. Mahasin; (E) the jointed metavolcanics at W. Kareim; and (F) a general view of the W. Kareim major fault.
Although absolute geochronological data for the Wadi Mahasin volcanics (WMVs) were not obtained in this study, regional stratigraphic correlations and previous radiometric dating of equivalent island arc metavolcanic assemblages in the Central Eastern Desert constrain their emplacement to the Neoproterozoic Era, specifically during the Cryogenian to early Ediacaran periods (620–585 Ma; [33]). The WMVs represent a well-preserved segment of the juvenile ANS crust, and field relationships indicate that the felsic units (metadacites and metarhyolites) were extruded contemporaneously as part of a continuous, subduction-related volcanic episode.
4. Results
4.1. Petrography
The main representatives of the WMV rocks that were gathered are metarhyolite and metadacite. These volcanic rocks are all porphyritic, with between 20 and 66% of the total rock mass composed of phenocrysts. Metadacite is grayish green with a fine-grained groundmass. It mostly consists of relic phenocrysts of biotite, plagioclase, and quartz. Iron oxides are accessory minerals. I suggest revising it to: secondary alteration minerals include kaolinite, chlorite, epidote (Figure 4a,b), and carbonates (Figure 4c). Plagioclase composition ranges from andesine to oligoclase (An18–An31). Plagioclase makes up around 33% of the rocks and appears as fine-grained laths that can reach lengths of 0.25 mm and widths of 0.18 mm. Plagioclase centers and peripheries show epidote, and they are zoned and fully saussuritized (Figure 4a,b). Quartz is colorless and is rounded to subrounded. Quartz rarely exhibits wavy extinction as a result of deformation. Metarhyolites contain small platy K-feldspar phenocrysts (porphyroblastic texture), in addition to phenocrysts of quartz and plagioclase in a fine-grained felsic matrix. Quartz is found in the matrix as fine grains that are elongated to equant. A wavy extinction is seen in some crystals.
Figure 4.
WMV photomicrographs: (a,b) the extensive epitodized porphyroblastic plagioclase (Pl) with a strongly turbid surface, metadacite; (c) the microveinlet of carbonate minerals (Cb) filling the fracture; (d,e) phenocrysts of plagioclase and quartz (Qz), metarhyolite; and (f) the disseminated magnetite (Mag) in metarhyolite.
4.2. Litho-Structural Mapping Based on Remotely Sensed Data
4.2.1. Lithological Discrimination
Image processing algorithms like FCC, PCA DS, BR, and MNF were applied on the three datasets using ENVI v. 5.3 and ArcGIS 10.7 software. The produced image data highlights the lithology and structural elements of the Wadi Mahasin metavolcanic rocks, which have been paid particular attention to as the main target rock unit during the interpretation process of the produced images. The color image from FCC can be produced by displaying three bands in the RGB channels. FCC is a simple and straightforward method, and it is effective when the selected bands contain the spectral features of the cropped rocks. Due to the many bands in each satellite image, the potential triplet band combinations have a wide range of possibilities. Therefore, the current study adopted the Optimum Index Factor (OIF) function to rank and order the possible combinations from high values in decreasing order. OIF value reflects the power of a certain combination to present the spectral characteristics of rock materials in sharp and clear images. The determined OIF values for the three datasets, using the Ilwis software (v. 3.3), reflect that the band combination of bands 7–5–3 in RGB from Landsat-8, bands 11–2–8 in RGB from Sentinel-2, and bands 3–2–1 in RGB from Planet (Figure 5A, B and C, respectively) attain the highest values of OIF. From the visual inspection of the three FCCs, the brown shades and textural characteristics of the Wadi Mahasin metavolcanic rocks can be differentiated from dark blue pixels of serpentinite (Sp) and light brown pixels of syenogranite (Gr) (Figure 5A–C). The DS process helps in decreasing the cross-correlation between spectral bands without affecting the quality of the pixels’ brightness. Three specific bands of 7–5–3 from Landsat-8 and 12–6–2 from Sentinel-2 were chosen for decorrelation, and colorful images were produced (Figure 5D and E, respectively). The two images successfully enhanced the lithological units, even small-scale ones. The Wadi Mahasin metavolcanic rocks are presented as reddish violet patches in the two images, where they are easily differentiated from the bluish cyan pixels of serpentinite and dull cream of syenogranite (Figure 5D,E). The distinctive bright green of the N-S quartz–feldspar porphyries enhances the sinestral movement of the NW strike–slip fault (Figure 5D,E).
Figure 5.
The discrimination lithology of: (A) the FCC band composite of 7–5–3 in RGB from Landsat-8; (B) the FCC band composite of 11–8–2 in RGB from Sentinel-2; (C) the FCC band composite of 3–2–1 in RGB from Planet; (D) the decorrelation stretch of bands 7–5–3 from Landsat-8; (E) the decorrelation stretch of bands 12–6–2 from Sentinel-2; and (F) the band ratio of 6/7-4/2-6/5 × 4/5 in RGB from Landst-8. Note: Sp: Serpentinite, WMV: Mahasin metavolcanics, Gr: Syenogranites, Qfp: Quartz-feldspar porphyries, Phs: Phanerozoic succession, Wd: Wadi deposits.
The recognition of rock exposures for geological mapping can be effectively performed by using the band ratio technique, where dividing the reflectance of pixels in one spectral band by the comparable value in another spectral band can produce grey and/or color images that discriminate between minerals/rock types [18]. Many earlier researchers have adopted BR for lithological recognition, especially for the metavolcanic rocks in the Eastern Desert of Egypt [19,34].
In the present study, we adopted the band ratios 6/7-4/2-6/5 × 4/5 in RGB for Landsat-8 (Figure 5F), 6/7-6/5-4/2 in RGB for Landsat-8 (Figure 6A), and 4/6-4/2-6/7 in RGB for Landsat-8 (Figure 6B); these provide enhanced isolation of the different rocks. The band ratios of 6/7-4/2-6/5 × 4/5 in RGB for Landsat-8 discriminated the WMVs in blue with shades of light violet. Serpentinites are light to dark brown, where the quartz–feldspar porphyries appear as whitish violet (Figure 6F). The band ratio of 6/7-6/5-4/2 from Landsat-8, which is known as the Chica–Olma band ratio (Figure 6A), offered an excellent differentiation of the WMV rocks. Where the WMV rocks appear as diagnostic dark to grass green representing the mafic and felsic metavolcanic rocks, serpentinites have dark brown pixels, and the quartz–feldspar porphyries appear as bright yellow (Figure 6A). The band ratio of 4/6-4/2-6/7 in RGB from Landsat-8 (Figure 6B) highlighted the WMV rocks as red-stained by patches of blue and dull green, the serpentinites as bright purple pixels, and quartz-feldspar porphyries as cyan pixels (Figure 6B).
Figure 6.
The lithological discrimination of (A) band ratio of 6/7-6/5-4/2 in RGB from Landsat-8, (B) band ratio of 4/6-4/2-6/7 in RGB r4om Landst-8; (C) PCA-432 in RGB from Landsat-8, (D) PCA-543 in RGB from Sentinel-2; (E) MNF-421 in RGB from Landsat-8; and (F) MNF-321 in RGB from Sentinel-2. For abbreviations, see Figure 5.
The PCA is a mathematical algorithm introduced by Pearson [35]. It is extensively used in lithological mapping to reduce the number of associated spectral bands into a smaller number of uncorrelated spectral bands termed principal components [36]. It allows eliminating the noise and redundancy in the dataset, and allows only spectral information with the greatest variance and the smallest correlation. In accordance with the produced eigenvector table associated with the produced principal components, it can select the best PC bands to generate the PCA false color composite image in RGB. In the current work, the PCA-432 from Landsat-8 and PCA-543 from Sentinel-2 (Figure 6B,C) were considered as the most informative principal components. The PCA-432 from Landsat-8 highlighted the WMVs as a bright green color, serpentinites as dark brown, and quartz–feldspar porphyries as a whitish–violet color. Where PCA-543 from Sentinel-2 offers the WMVs as a bluish–red color, serpentinites as light to dark blue, and N-S quartz–feldspar porphyries exposure as a bright green color.
The MNF is an algorithm to confirm that spectral data is inherently dimensional, separate out noise from the data, and reduce the amount of computing power required for further processing [37]. This process accomplishes higher signal-to-noise ratios than the PCA technique for signal-dependent noise. In the current study, MNF-4-2-1 in RGB from Landsat-8 and MNF-3-2-1 from Sentinel-2 datasets were generated (Figure 6E,F). Figure 6E shows distinctive discrimination of rock units, where the WMV rocks appear as light to bright cyan in accordance with the felsic and mafic metavolcanic rocks. The serpentinites are shown as dark brown, and the quartz–feldspar porphyries are bright purple. The WMV rocks are highlighted as cyanic purple in MNF-3-2-1 from Sentinel-2, whereas the serpentinites are dark violet and the quartz–feldspar porphyries are orange (Figure 6E). It is obvious that the two MNF images successfully detected the offset of rock blocks of the sinistral and dextral NNW and NW strike–slip faults due to the shift in the tonal variations.
Supervised classification: A lot of data regarding the types of surfaces seen in the study area and input from an image analyst are needed for supervised classification. Maps or fieldwork may be used to gather this data, where different surface classifications are identified and subsequently input into software as regions of interest (ROI). It is also possible to do supervised classification by gathering end members or obtaining a distinct spectrum for every segment of rock. A number of supervised classifications were tested, including those that utilized maximum likelihood and Mahalanobis distance.
Two supervised classification techniques were utilized in the current investigation: the maximum likelihood classification (MLC) and the support vector machine (SVM). The two techniques are widely accepted for lithological mapping of the basement rocks in the Eastern Desert of Egypt using Landsat-8 data [19,38,39]. The maximum likelihood classification (MLC): The MLC discriminates the exposed rock varieties in accordance with their maximum similarities of the provided training classes assigned by the analyst for each single rock type [40].
The SVM is an extremely advanced algorithm for machine learning used for classifying the different rocks depending on the spatial extent of the similar varieties to the prepared ones in the training classes file [41]. The classes in the training pixels file were assigned depending on the data on the previous maps (at scales 1:250,000 and 1:100,000) and fieldwork. The location and shape of the test areas were carefully drawn away from lithological boundaries and were adequate for the rock unit size. In accordance with the rock varieties in the current research, six training areas for the lithological units were delineated with an acceptable degree of separability. The chosen training areas are assigned as serpentinite, Mahasin metavolcanics, syenogranite, quartz–feldspar porphyries, Phanerozoic succession, and Wadi deposits.
Importantly, the degree of the training class’s separability was performed using the Jeffries–Matusita (J-M) function presented in ENVI. This algorithm connects every class pair with one another, according to scale from 0 to 2, where 0 means low separability and 2 means high separability. Specifically, the high separability is expected to produce an accurate lithologic map, whereas the classes of low separability values should be reclassified to avoid high spectral similarities and misclassification. Attention was paid to the Mahasin metavolcanics and their degree of separability in relation to the other rock units. The results obtained showed that the WMVs have a high degree of separability from the other five classes, which range from 1.9 to 2.0. The J-M values for metavolcanics against four rock units of serpentinite, syenogranite, quartz–feldspar porphyries, and Wadi deposits were 1.9, but with the Phanerozoic succession, attained 2. Figure 7A,B show the resultant discriminated WMV map using the MLC and SVM, respectively. The accuracy assessment of the two obtained classified maps is ascertained through the use of stratified random sampling, which is implemented in ENVI. This method correlates between the sample grid representing the locations of rock units in the produced maps and their corresponding locations in the field and/or previous geologic maps. Table 1 presents the confusion matrix and accuracy of the two classified maps. In addition, the Kappa coefficient also measures and attains values from zero to one, where a zero value means very low accuracy, and a value of one means high accuracy. The general precision of the categorized map generated using the MLC algorithm (Figure 7A) was 95.68%, with a 0.95 Kappa coefficient, whereas the general precision of the categorized map generated using the SVM algorithm (Figure 7B) was 96.00%, with a 0.95 Kappa coefficient. The MLC results indicated that the user accuracies of all classes ranged between 88.93% for the quartz–feldspar porphyries and 100.00% for the Phanerozoic succession. Whereas producer accuracies ranged from 91.59% for serpentinite to 100.00% for the Phanerozoic succession, the SVM results showed that the user accuracy for each class varied from 93.12% for metavolcanics to 100.00% for the Phanerozoic succession. In contrast, producer accuracy varied from 93.46% for syenogranite to 100.00% for the Phanerozoic succession. The high accuracy and Kappa values attained using both the supervised classification techniques (MLC and SVM) provided the effectiveness of the two algorithms in the discrimination of the different WMV rocks (Figure 7A,B). Moreover, all the producer and user accessories of the different rocks were over 91%. The two classified techniques successfully delineate the Mahasin metavolcanics and enhance their sharp contacts with other rock units of serpentinite, syenogranite, and quartz–feldspar porphyries. The MWVs cover about 34.12 km2 and represent about 41.46% of the total area.
Figure 7.
The resultant supervised classified maps of (A) the MCL algorithm and (B) the SVM algorithm.
Table 1.
The confusion matrix of the supervised classification algorithms (MLC and SVM).
4.2.2. Structural-Based Landsat-8 Mapping
The fracture/fault elements can be recognized and retrieved from the data collected by remote sensing with the help of software, and then verified in the field. The principal component PC1 from Landsat-8 contains the key details of linear structures in this research study. Therefore, the present study used this component to help in identifying the primary linear and structural characteristics. The PC1 was filtered by the Lee filter included in the ENVI software to enhance the linear structures. It was then subjected to the LINE algorithm function included in the PCI Geomatica software, v. 2016 to produce the linear structures and faults in this research study. The surface linear structures extracted using the LINE algorithm depended on default values of: filter radius (RADI) = 10, edge gradient threshold (GTHR) = 50, curve length threshold (LTHR) = 30, line fitting threshold (FTHR) = 3, angular difference threshold (ATHR) = 15, and connecting distance threshold (DTHR) = 20. Subsequently, the extracted linear structural map was required to create the azimuth-frequency graphs using the Rockworks program 16. Moreover, the automatic extraction of the structural elements was confirmed using measurements of foliation and jointing, and the faults were recorded in the field. The outlined faults and linear structures are grouped and presented in Figure 1 and Figure 8A,B. The present study paid attention to and presented the major fractures and faults, and excluded minor fractures/faults for clarification.
Figure 8.
The extracted major fractures/faults draped over the MNF 432 (A), and the SRTM 30 m DEM (B). The azimuth-frequency diagram is presented in (C).
The discovered structural features are surrounded by rocks and disintegrate in main streams due to the existence of Wadi deposits and weathered substances. The WMV rocks are affected greatly by the intersection and distribution of the fracture network. Moreover, the geomorphological guides (straightness of stream, sharp bend, and straightness of the mountain facets) and the offset of rock blocks enhance the movement of major faults. The number of outlined major fractures/faults is about 35 characteristics with an overall length of 62.45 km, and varies between 0.28 km and 6.72 km in length, with a mean of 1.8 km. The extracted and detected faults were draped over the color image of MNF 432 to follow the rock tonal variation and enhance the strike–slip faults movement (Figure 8A). Further, they were draped over the Digital Elevation Model (DEM) (with 30 m resolution) to enhance the topographical indicators. An inset azimuth frequency diagram was constructed to represent the dominant linear structures’ directions (Figure 8B). Figure 8C shows that the fractures/faults predominant trends in the WMV area are NW-SE, N-S, and NNW-SSE, in decreasing order.
In the research area, the exposed basement rocks are classified as medium- to low-grade metamorphic rocks. The processed remotely sensed data presented in Figure 5, Figure 6 and Figure 7 successfully enhance the metavolcanic rocks and serpentinite foliations. These rocks encounter slightly developed foliations strikes in the NNW-SSE and NW-SE, and their dips range from 22° to 42° to the northeast. Well-developed foliations are noticed in the processed images in the southwestern part of the study area around Wadi Abu Habban. The field investigation detected a NW-SE asymmetrical anticlinal fold in the WMVs. The WMVs and quartz–feldspar porphyries are affected by NW-sinistral strike–slip faults, where the serpentinite rocks are affected by the NNW–dextral strike–slip faults. The serpentinite rocks are thrust over the Mahasin metavolcanic rocks (Figure 6A,B).
The results of remote sensing were verified by collecting fieldwork ground control points, which are presented in Figure 9, and petrographical and geochemical investigations. The two produced classified maps (Figure 7A,B), using the other aforementioned image processing techniques, help in enhancing previous geologic maps, and the updated final MWV geologic map is shown in Figure 9.
Figure 9.
The detailed geologic map, based on remote sensing analysis and confirmed by fieldwork and petrological data.
4.3. Petrochemistry
4.3.1. Classification and Lava Variations
The WMV rocks form two internally coherent compositional clusters corresponding to metadacite and metarhyolite (Supplementary Table S1), rather than a broad diffuse cloud. This bimodality and the restricted internal spread of many metarhyolite parameters indicate derivation from a comparatively homogeneous evolved melt batch, whereas the greater scatter in metadacite chiefly reflects moderate differentiation, variable plagioclase control, and some superimposed alteration [33,42,43]. On the Zr/TiO2 vs. SiO2 binary diagram of Winchester and Floyd [44], the WMV rocks plot in the rhyolite and rhyodacite/dacite fields (Figure 10a). For the WM volcanic rocks, our interpretation is based on trace elements that are less impacted by alteration and metamorphism, such as Ti, Y, Nb, and Zr (Figure 10b; [44]). The WMV rocks overlap the rhyolite and dacite domains in the TAS binary diagram of Le Bas [45] for additional classification (Figure 10c). The examined rocks are similar to those of the back-arc basin [46].
Figure 10.
The petrochemistry of Wadi Mahasin: (a) the Zr/TiO2-SiO2 diagram [44]; (b) the Nb/Y–Zr/TiO2 diagram [44]; (c) SiO2-Na2O+K2O [45]; (d) Fe2O3*–ALK–MgO [47]; and (e) K2O–SiO2 [48]. The older metavolcanics (OMVs), Dokhan Volcanics (DVs), and YMVs fields are from [7,11,13] for comparison, and (f) the Zr-Sr-Ba diagram [49].
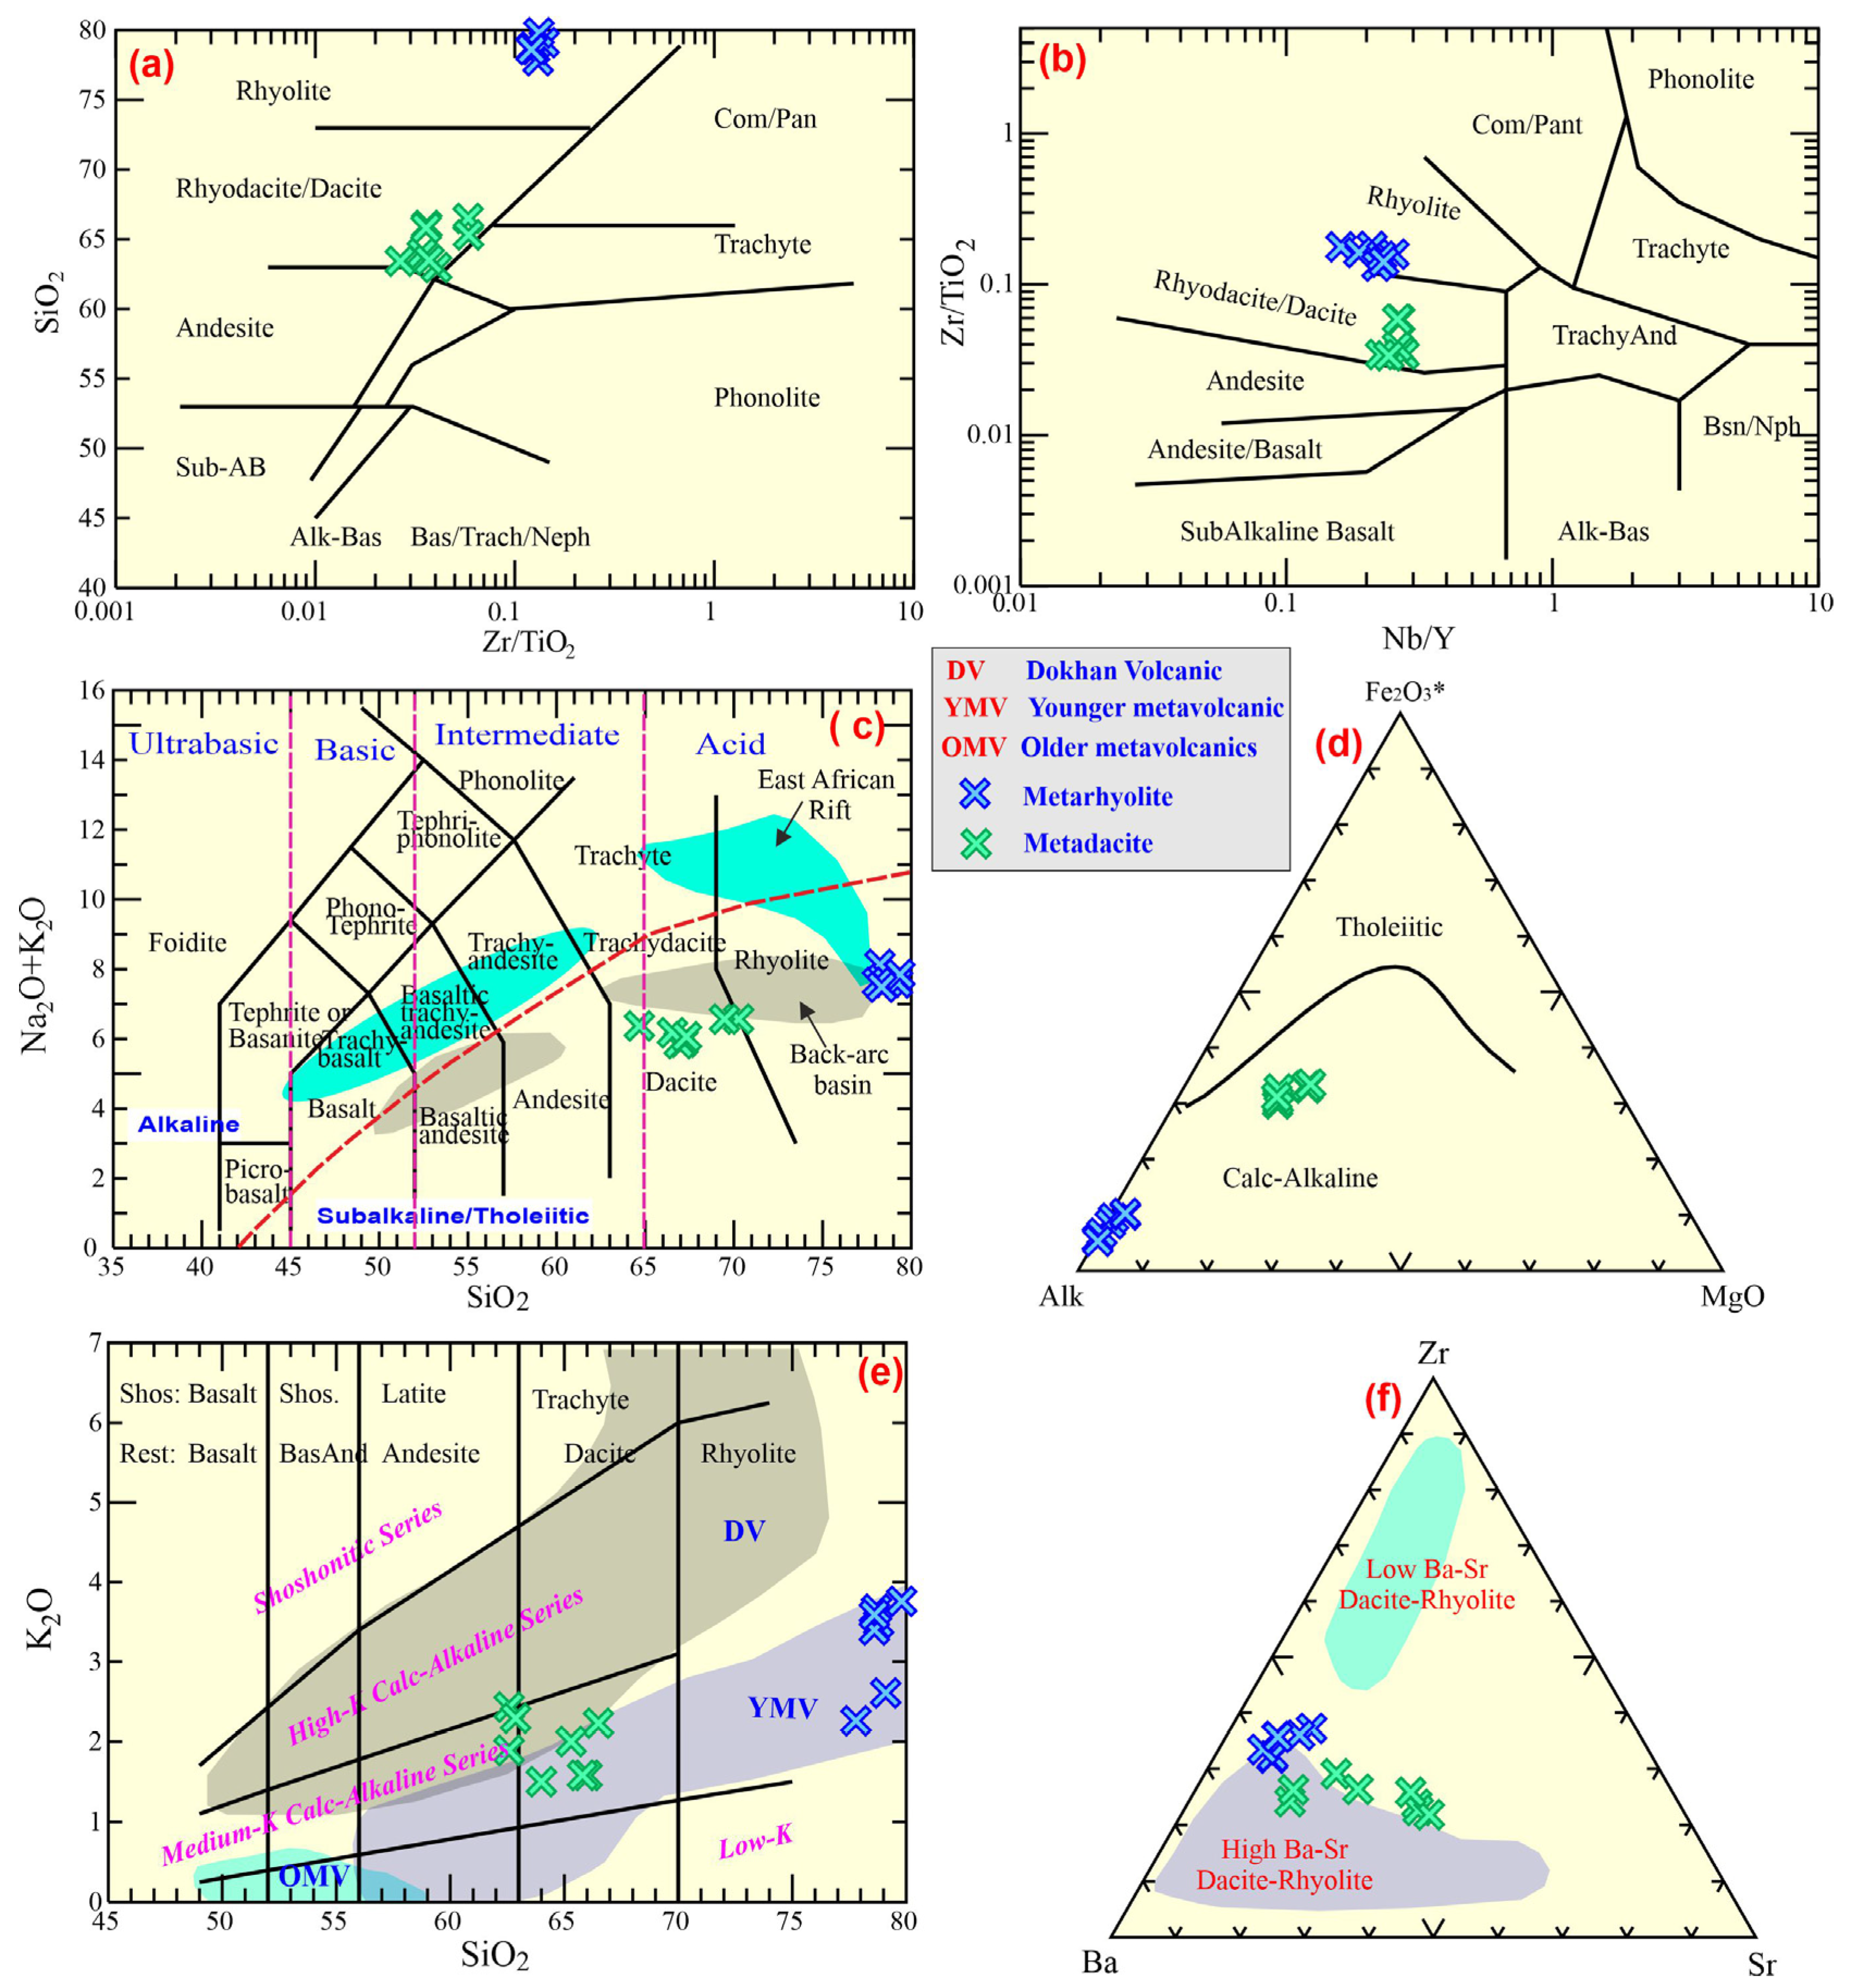
The sub-alkaline nature of the rocks under examination is supported by Le Bas [45]. The Irvine and Baragar [47] diagram further identifies their alkalinity (calc–alkaline) (Figure 10d), which is corroborated by the fact that the agpaitic index for the metadacites ranges between 0.81 and 0.95, with a mean value of 0.86 relative to dacite (avg. 0.58), indicating that the rocks under study are not alkaline.
Generally, the older metavolcanic rocks are typically recognizable as low-K basalts. The younger metavolcanics, such as the WMV rocks under examination here, contain a variety of SiO2, much like the Dokhan volcanics (which are typically medium-K to high-K), but they are low- to medium-K. The SiO2-K2O diagram, which Le Bas [45] utilized to demonstrate this, reveals that the WMV rocks lie within the younger metavolcanics, within the medium-K calc–alkaline field (Figure 10e).
4.3.2. Petrochemical Features
The major-element data show limited within-group dispersion but strong between-group separation. Metarhyolite samples are chemically very restricted and only weakly altered, as indicated by low LOI values near 1 wt.%. Metadacites display a broader compositional spread and higher LOI values, consistent with modest differentiation accompanied by variable secondary alteration. In the K2O-SiO2 space, the suite is best described as mainly medium-K calc–alkaline, but several metarhyolite samples plot on or slightly above the upper boundary of the medium-K field and extend into the high-K field; the WMV suite, therefore, has a transitional medium- to high-K character at the felsic end.
The WM metarhyolite has high SiO2 contents (77.8–79.8 wt.%) and total alkalis of 7.51–8.09 wt.%, but it is poor in Al2O3, CaO, MgO, and Fe2O3. Metadacite occupies a distinct lower-silica field (61.8–66.5 wt.% SiO2) and contains distinctly higher Sr, CaO, MgO, and Fe2O3. This bimodal distribution suggests that the analyzed samples represent two discrete felsic magma groups or strongly separated stages of differentiation rather than a densely sampled continuous liquid line of descent.
The trace and REE analytical results, along with the distinctive parameters that correspond to them, for the WMV samples are shown in Supplementary Table S1. On the Zr-Ba-Sr ternary diagram (Figure 10f), the WMV samples typically fall in/close to the high Ba-Sr rhyolite–dacite field, demonstrating that these rocks are typical samples of high Ba-Sr metarhyolite/dacite. The metadacite samples display Sr enrichment with a mean value of 249.4 ppm, suggesting that they are less fractionated with abundant plagioclase. Nonetheless, a small Sr depletion in the samples suggests that feldspar underwent crystal fractionation in the source prior to magmatic generation. It is evident that every WMV sample has a uniform distribution on the standardized primitive mantle spider diagram (Figure 11a). Both semi-volatile elements (Pb) and large ionic lithophile elements (LILEs) (Rb, U, and K) are markedly enriched in the WMV rocks. The WMV rocks are, however, deficient in HFSEs, including Ti, Nb, Ta, and P, due to the segregation of iron oxide minerals, feldspar, and apatite. Such trace elemental compositions imply that the magma may have a crustal derivation (calc–alkaline of subduction-related) [49].
Figure 11.
(a) Standardized trace diagram [50]; (b) standardized REEs diagram [50]. Fields of Moganshan rhyolites [49], Hamama rhyolites [51], and Atshan [51] dacites are utilized for comparison; (c) Ce-Ce/Pb diagram. OIB and MORB [50]; upper continental crust (UCC; [52]); and Bulk Continental Crust (BCC; [53]); (d) Nb/U–Ce/Pb diagram [54]; (e) (206Pb/204Pb)-(207Pb/204Pb) diagram [49]; (f) (208Pb/204Pb)-(207Pb/204Pb) diagram; and (g) Eu/Eu*–Sr binary diagram.
Compared to the WM metadacite samples, the metarhyolite samples have high ∑REE values with an average of 181 ppm, ∑LREE values with an average of 150.6 ppm, and ∑HREE values with an average of 30.3 ppm. The range of ∑LREEs/∑HREEs is between 4.33 and 5.34 (avg. 4.97) for the WM metarhyolite, and from 4.34 to 5.72 (avg. 5.2) for the WM metadacite (Figure 11b). Compared to the ∑LREEs of the WMV samples, the ∑HREEs fractionation is less pronounced, where they exhibit significantly enriched LREEs relative to HREEs. They are similar to rhyolite from the Moganshan Basin [49] (Figure 10b), which is clearly displayed in the standardized fractionation patterns [50].
All the WMV samples display the same fractionation patterns for the rare earth elements. Additionally, both the WMV rock types have the same pattern and slope, with the metarhyolite having slightly elevated REEs relative to the metadacites. The REE curves display a right-sloping pattern as a result of the enhancement of LREEs relative to HREEs (Figure 11b). Furthermore, the HREEs are not clearly fractionated, whereas the LREEs exhibit considerable fractionation.
Eu/Eu* correlates positively with Sr (Figure 11g) when the WMV dataset is considered as a whole (r = 0.66) because the Sr-poor metarhyolites also show the strongest negative Eu anomalies, whereas metadacites are relatively Sr-rich and less Eu-depleted. Within each lithology, however, the correlation is weak, indicating that the overall trend mainly records inter-group differentiation rather than a perfectly continuous single fractionation path. This relation is compatible with progressive plagioclase removal during evolution from metadacitic to rhyolitic compositions.
Harker systematics show decreases in Al2O3, Fe2O3, CaO, MgO, TiO2, Sr, and Cu, with increasing SiO2, which is interpreted to be a function of crustal fractionation (Figure 12). Both rock types exhibit similar patterns with respect to the total alkalis, Rb, Zr, W, and ∑REEs.
Figure 12.
Harker binary diagrams between silica and others, including Al2O3, Fe2O3, CaO, MgO, TiO2, Alk, Zn, Sr, Cu, Rb, W, and ∑REEs.
5. Discussion
5.1. Analysis of Remote Sensing Data
This work establishes the power of remote sensing data in discriminating lithological units and structural elements. Several techniques were adopted to accomplish this objective. The triplet band combination of bands 7–5–3 in RGB from Landsat-8 and bands of 11–8–2 in RGB from Sentinel-2 were adopted (Figure 5A,B). The two combinations gave a general overview and excellent differentiation between the exposed rocks in the research region, where the application of decorrelation stretches on the bands of 7–5–3 from Landsat-8, and 12–6–2 from Sentinel-2 (Figure 6D,E) showed high efficiency in distinguishing the different rocks. E.g., the WMV rocks are readily discriminated with warm colors and sharp contacts with other rock units. Serpentinites, metavolcanic rocks, and quartz–feldspar porphyries are efficiently separated with good contacts in the Landsat-8 band ratio combinations of 6/7-4/2-6/5 × 4/5, 6/7-6/5-4/2, and 4/6-4/2-6/7 (Figure 5F and Figure 6A,B, respectively).
Moreover, excellent discrimination is observed in the PCA and MNF images. The two computational techniques presented sharp contacts of serpentinites in PCA-432 from Landsat-8 and PCA-543 from Sentinel-2 (Figure 6C,D), quartz–feldspar porphyries with distinctive color in MNF-421 from Landsat-8 (Figure 6E), and metavolcanic rocks in MNF-321 from Sentinel-2 (Figure 5F). Remarkable mapping of the exposed rock units was provided by using the adopted two supervised classification techniques, the MLC and SVM, with 95.68% and 96%, respectively (Figure 5A,B). Importantly, the integration of all these techniques presented an accurate lithologic map of all the rock units. The correlation between the produced geologic map and the previous geologic maps of [20,22] showed differences between them. The lithological contacts of the exposed rocks are enhanced, and the previous unmappable rock exposures are presented herein in the new geologic map. The resultant accurate geologic map is ascribed to the application of images of high spatial resolution, which reached up to 3 m, and comprehensive fieldwork. The Mahasin metavolcanic rocks are recorded as felsic and mafic rocks intruded by quartz–feldspar porphyries and syenogranite and are in thrust contact with serpentinite.
Structurally, the WMV is situated in the central Egyptian Desert, which was affected by high-strain shear zones. The study area is characterized by NW-SE structural characteristics that predominate and extend to the North of the Eastern Desert and are truncated southward by the E-W structural faults. The detected NNW-SSE and NW-SE faults extend several kilometers across the exposed rocks and symbolize the main crustal borders that separate the various structural regions.
Fritz [26] described the NW-SE regional structural trend as part of the Najd fault system, characterized by left-lateral movement [55]. Kusky and Matsah [56] suggested that movement across the Najd shear zone, which is primarily sinistral along faults that trend from northwest to southeast, although there are some parts that record local dextral movement across its NNE-SSW trending faults. The structural analysis of the study area recorded two strike–slip shear zones, a sinistral NW-SE trend, and a dextral NNW-SSE trend. The first one is enhanced by the left-lateral movement of quartz-feldspar porphyries, and the second one is enhanced by the right-lateral movement of serpentinites. A large-scale anticline fold was recorded in the metavolcanic rocks, and serpentinites are thrust over granite. The thrust faults have NW-SSE and NE-SW orientations.
5.2. Radiogenic Pb Isotope Fingerprint
Only 204Pb, one of the four stable isotopes of lead, is non-radiogenic. Three intricate decay chains from uranium (U) and thorium (Th) result in the other lead isotopes. However, when geological periods of millions of years are involved, the intermediate members of each series can usually be disregarded due to their comparatively short lifespans [57].
These samples have relatively consistent Pb isotopic values, according to the estimated results for Pb isotopic compositions of the WMV rocks (Supplementary Table S1). It is notable that both WMV rocks have similar variations in 206Pb/204Pb ratios from 19.31 to 20.89 (avg. 20.05) for metarhyolite, and from 19.00 to 20.11 (avg. 19.36) for metadacite (Figure 11e,f). The same results are obtained for 207Pb/204Pb for metarhyolite (15.84–16.83; avg. 16.23) and 15.72 to 16.44 (avg. 15.99) for metadacite. These values are close to the volcanic rocks of the mature arc (206Pb/204Pb = 18.0–19.5 and 207Pb/204Pb = 15.5–15.7 [58,59]. Additionally, the 208Pb/204Pb is (37.67–39.85; avg. 38.8) for metarhyolite and is (35.00–36.44; avg. 35.49) for metadacite. This demonstrates that the magma was linked to crustal materials, as discussed below.
The Pb isotope compositions provide an independent but relatively low-resolution test of source character. The analyzed samples plot at 206Pb/204Pb = 19.00–20.89 and 207Pb/204Pb = 15.73–16.83, values that are uniformly shifted toward crust-influenced compositions. Metarhyolite is generally more radiogenic and Pb-rich than metadacite, consistent with stronger crustal inheritance or interaction in the more evolved melts.
5.3. Features of Magma Source
The petrochemical data offer some constraints on the magma sources during their evolution. The WMV samples have a notable LILE enrichment (U, Rb, and K) and relative enrichment in LREEs, certainly for La (avg. 30.27 and 18.26 ppm for metarhyolite and metadacite, respectively) and Ce (avg. 69.11 and 40.85 ppm for metarhyolite and metadacite, respectively). Furthermore, the WMV samples are HFSE deficient (Nb, Ta, P, and Ti), including Sr and some HREEs (especially Tm and Lu), with noticeable negative Eu anomalies. These trace and REE properties imply that the calc–alkaline magma might have been generated from anatexis of continental crust [49,60].
Additionally, the Mg# of the WMV rocks is low, ranging from 0.03 to 0.17 (avg. 0.09) in metarhyolite and from 0.29 to 0.34 in metadacite, consistent with a continental crustal magma origin rather than mantle. Other ratios can be utilized to deduce the source of these rocks, such as Y/Nb, Nb/U, and Ce/Pb. The WMV rocks have Y/Nb values above 1.2 (avg. 5 and 3.8 for metarhyolite and dacite, respectively), pointing to a continental crustal source [61,62]. The Ce/Pb (1.58–14.3, with a mean value of 6.95 for metarhyolite, and 3.73–9.83 with a mean value of 5.61 for metadacite) values are much lower than those of the OIB (Ce/Pb = 25 [63]) and primitive mantle (Ce/Pb = 9 [54]), but they fall within the continental crust (Figure 11c) (Ce/Pb = 4 [63]) and close to the crustal Moganshan rhyolites (avg. Ce/Pb = 3.10) [49], Hamama and Atshan felsic rocks (avg. 2.66) [51]. The Nb/U values for the WM (3.29–3.58, with a mean value of 3.46 for metarhyolite, and 3.52–5.26, with a mean value of 4.29 for metadacite) are much less than those of the OIB (Nb/U = 47 [63]) and primitive mantle (Nb/U = 30 [54]), but they are similar to those of upper continental crust (Nb/U = 10 [63]) (Figure 11d) and the crustally derived Moganshan rhyolites (avg. Nb/U = 3.13) [49,58], suggesting that these samples are originated from partial melting of continental crust.
On the binary isotopic diagram (206Pb/204Pb)-(207Pb/204Pb) by Wang [49] (Figure 11e), the average value of the WMV rock points falls close to the upper continental crust. On the (206Pb/204Pb)-(208Pb/204Pb) diagram (Figure 11f), the U, Th, and Pb richness in the source is indicated by the average value of the WM metarhyolite, which dropped above the northern hemisphere Pb reference line, whereas the average of the metadacite plot is below the line. The mean 207Pb/204Pb value is >15.997 for the WMV rocks. Additionally, the 206Pb/204Pb is <18.768 for the mantle source, >18.82 for lower crust origin, and >18.823 for upper crust origin, according to Sainlot [64]. The WMV rocks have mean 206Pb/204Pb values 20.057 for WM metarhyolite and 19.368 for the WM metadacite, pointing to the upper crust.
An alternative explanation is AFC involving a mantle-derived parental magma and crustal assimilation. We, therefore, reassessed the suite from that perspective using the available Pb isotope data. However, the key source-sensitive ratios show only weak covariance with differentiation: 206Pb/204Pb versus SiO2 gives r = 0.42 (n = 8), and 207Pb/204Pb versus SiO2 gives r = 0.24. This weak isotopic–silica relation, together with the large silica gap between metadacite and metarhyolite and the absence of any preserved primitive samples, does not support a simple single-lineage AFC trend as the dominant first-order process. Taken together, the data favor partial melting of felsic to intermediate continental crust that had already been modified in a subduction environment, followed by limited crystal fractionation and local crustal interaction during ascent and emplacement [65,66]. In this interpretation, metadacite represents the less evolved member of the suite, whereas metarhyolite corresponds to a more differentiated and compositionally homogeneous melt batch [49,58].
5.4. Fractionation and Magma Separation
The WMV suite records fractional crystallization superimposed on a dominantly crust-derived magma system. The transition from metadacite to metarhyolite is accompanied by declining Mg#, CaO, Fe2O3, and Sr, whereas alkalis, Zr, W, and ∑REEs are maintained or enriched, supporting progressive evolution toward a felsic residual melt.
On Harker diagrams, the whole-suite trends are clear, but within-group dispersion is small, especially in metarhyolite, implying that much of the differentiation occurred before or during segregation of the rhyolitic melt batch rather than during prolonged in situ evolution after emplacement.
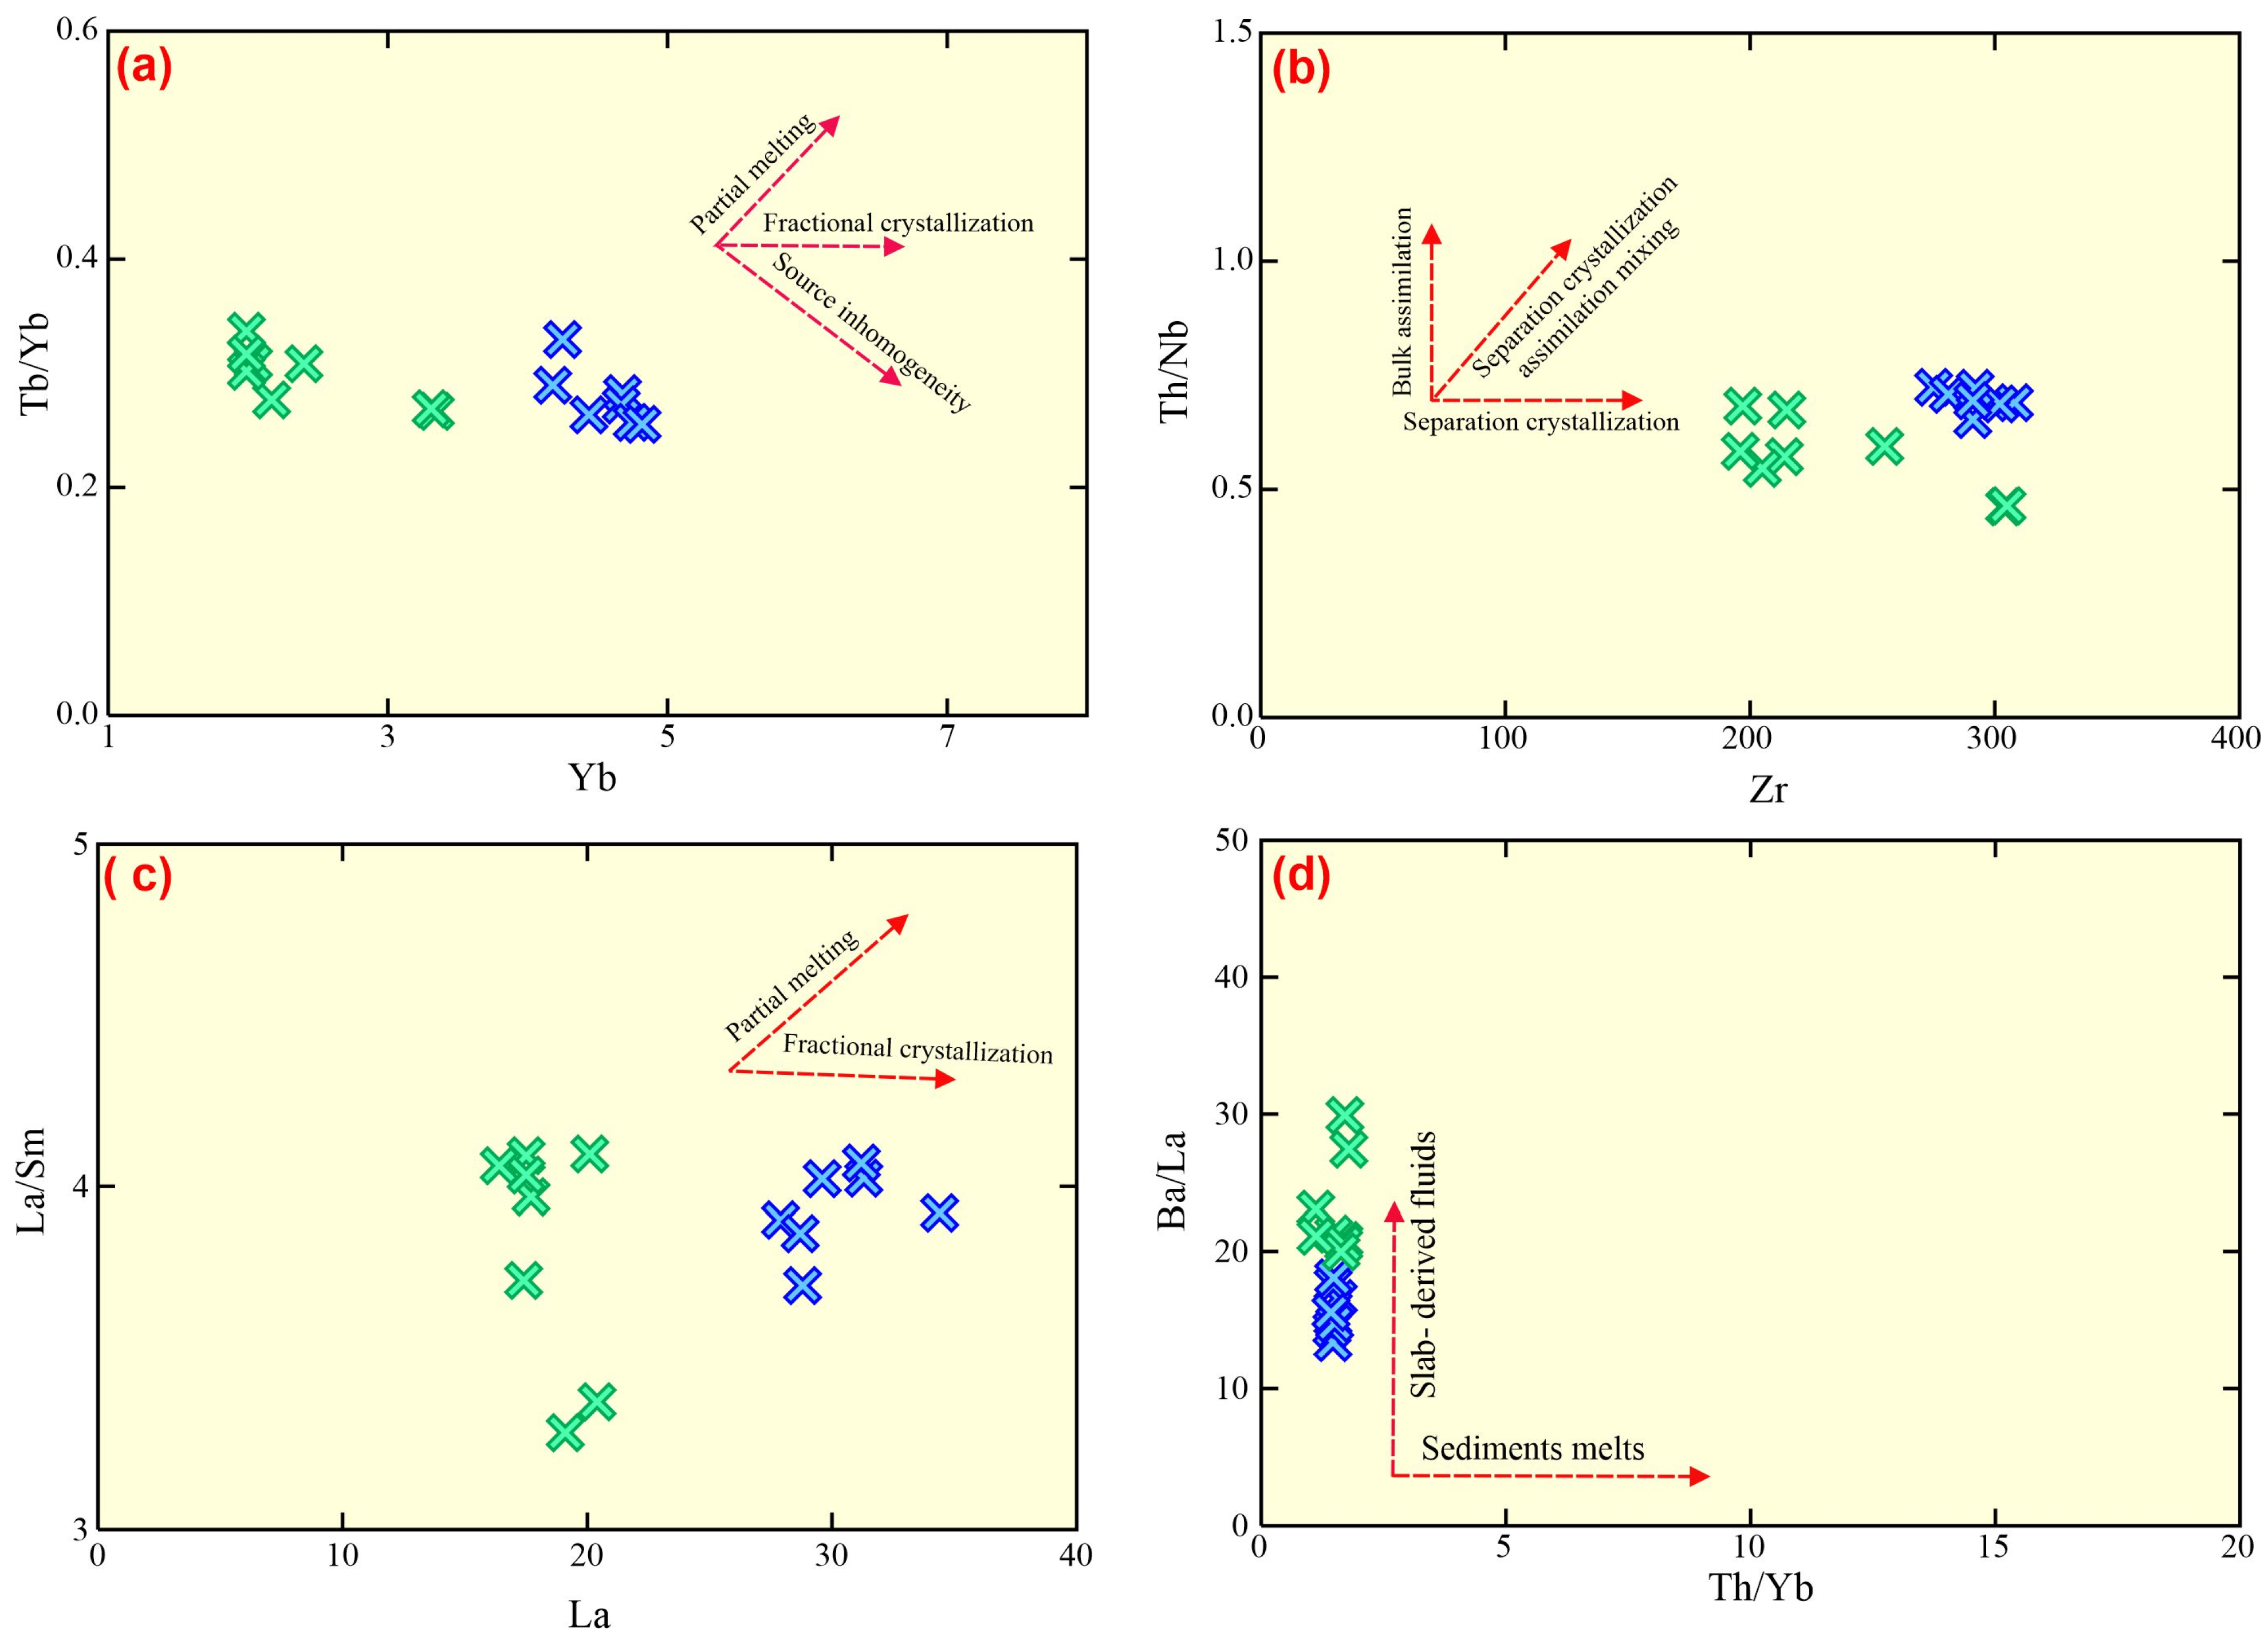
Similar Yb-Tb/Yb, Zr-Th/Nb, and La-La/Sm trends indicate that metadacite and metarhyolite are genetically related. The progressive depletion in Sr and the development of more negative Eu anomalies toward the rhyolitic end member are consistent with plagioclase-dominated fractionation. Because the HREE segment remains nearly flat, the fractionating assemblage was probably dominated by plagioclase ± amphibole rather than garnet-bearing residues.
The change from metadacite to metarhyolite, which is demonstrated by the progressive negative abundance groups between silica and Al2O3, TiO2, Fe2O3, CaO, MgO, Zn, Sr, and Cu, is interpreted here to be a function of crustal fractionation (Figure 12). Both rock types exhibit similar patterns with respect to the total alkalis, Rb, Zr, W, and ∑REEs. Additionally, the normalized primitive diagram showcases strong Ti, Nb, Ta, and P negative anomalies in these rocks, consistent with crystal fractionation. There are other lines of evidence for why these rocks experience varying degrees of fractional crystallization, including low and fluctuating Mg# (0.04–0.35), and low Cr (57.3–161 ppm) and Ni (32.2–94 ppm) contents.
On the Yb-Tb/Yb (Figure 13a), Zr-Th/Nb (Figure 13b), and La/Sm versus La (Figure 13c) diagrams, the samples display similar fractionation trends and features, confirming that the crustal rocks partially melted to generate the magma producing an intermediate (iron and magnesian) magma, which underwent segregation crystallization to form dacitic (moderate MgO and FeO) magma, followed by strong differentiation during evolution forming metarhyolite (deficient in FeO and MgO) magma.
The elevated LREEs and LILEs demonstrate the function of metasomatic activity throughout subduction compared to HREEs and HFSEs (e.g., Nb, P, and Ta). Aqueous fluxes from slabs/sediments make up the majority of the metasomatic ingredients [9,67]. Each sample has a comparatively consistent Th/Yb (1.12–1.79) value in both WMV rocks. but is variable in Ba/La (avg. 15.74 and 23 for metarhyolite and dacite, respectively) values, suggesting that their petrogenesis was significantly influenced by incorporation of aqueous fluids originating from subducted slabs (Figure 13d).
The integration of our geochemical and isotopic data confirms that the studied meta-dacites and metarhyolites are intimately related and represent the products of the same magmatic event. A co-genetic relationship is strongly supported by the continuous and progressive variation trends observed in the Harker variation diagrams (e.g., systematic depletion in Fe2O3, MgO, and CaO, and enrichment in alkalis, with increasing SiO2; Figure 12). Additionally, the parallel to sub-parallel chondrite-normalized REE patterns (Figure 11a,b) and the uniform radiogenic Pb isotopic signatures across both rock types preclude diverse parental sources. Instead, these geochemical signatures indicate that the metadacites and metarhyolites evolved via fractional crystallization from a common, compositionally uniform parental magma within the WMV complex.
Figure 13.
(a) Yb–Th/Yb diagram; (b) Th/Nb–Zr diagram of Wang [49], (c) La–La/Sm [68], and (d) Th/Yb–Ba/La diagram [69]. Symbols as shown in Figure 12.
5.5. Tectonic Environment
The WMV samples have relative enrichment in LREEs, and considerable enrichment in LILEs (U, Rb, and K). Furthermore, the mantle-normalized diagram shows moderately negative Eu anomalies in both rock types, and an extensive depletion in the HFSEs (Nb, Ta, P, and Ti). The negative Eu and positive Pb anomalies are the features of rocks developed in a subduction regime [51]. Additionally, these geochemical characteristics indicate that they originated in a volcanic arc environment [70,71].
Numerous tectonic differentiation diagrams can also be used to establish the tectonic context of the WMV rocks. Instead of transitional and tholeiitic affinity, all of the WMV rocks have a calc–alkaline affinity (Figure 14a), as shown by the volcanic discrimination of Ross and Bédard [72]. Certain immobile trace elements, like Y, Ti, Zr, and Nb, are commonly used to differentiate between different volcanic conditions because of their stability against metamorphism and alteration. The WMV samples straddle the calc–alkaline arc field, using a ternary Th-Zr117-Nb/16 (Figure 14b) diagram [73]. Additionally, the WMV eruptions took place in a continental setting as opposed to an oceanic one, according to the P2O5-K2O-TiO2 (Figure 14c) diagram of Pearce [70]. Instead of being in a within-plate and transition zone, these rocks span the volcanic arc, according to the Nb-SiO2 (Figure 14d) of Pearce and Gale [74]. Furthermore, the volcanic arc environment is also deduced by several volcanic diagrams, such as those of Pearce [75] (Figure 14e) and Hollocher [76] (Figure 14f).
Figure 14.
(a) Zr/Y-Th/Yb diagram [72]; (b) Zr/117-Th-Nb/16 diagram of [73]; (c) TiO2 -P2O5-K2O [70]; (d) Nb-SiO2 [74]; (e) Nb/Yb-Th/Yb diagram [77]; and (f) La/Yb-Th/Nb diagram [76]. Symbols as shown in Figure 12.
The WMVs possess a high content of ∑REEs but are similar to the felsic members of Hamama rhyolites, Atshan dacite rocks [51], and rhyolites formed in the Moganshan Basin [49]. These rocks are similar to those developed in the back-arc basin of Shinjo and Kato [46]. The WMV (rhyolite and dacite) rocks differ from East African Rift’s felsic rocks, which are primarily made up of trachyte and high-K calc–alkaline rhyolite. They contain lower ΣREEs (avg. 142) and considerably lower (La/Yb)N ratios (avg. 4.93) than East African Rift felsic members. Furthermore, the WMV rocks have a negative Nb anomaly with low Nb/Th (1.38–2.16) and Nb/Zr (0.07–0.7) ratios contrasting East African Rift felsic rocks. An understanding of the development of the Neoproterozoic subduction region can be attained by examining such WMV rocks, which are widely exposed in the ANS.
6. Conclusions
The Wadi Mahasin metavolcanics (WMVs) comprise felsic metadacite and metarhyolite that were remapped successfully using multisensor remotely sensed datasets from Landsat-8, Sentinel-2, and Planet. The revised geological map improves lithological boundaries, but the petrogenetic significance of the suite is defined principally by the geochemical and isotopic dataset. The accuracy of the classified maps produced by the MLC and SVM techniques attained 95.68% and 96%, respectively. The produced lithologic and structural maps were verified by field and petrographic observations. The structural features affected in the study area, such as strike–slip shear zones, thrusts, and folds, were successfully detected.
The WMV suite is calc–alkaline, with a transitional medium- to high-K character at the felsic end. Metarhyolite forms a tightly clustered compositional group, whereas metadacite shows broader scatter, especially in K2O, Sr, and LOI, indicating modest differentiation together with some secondary modification. Primitive mantle-normalized patterns show enrichment in LILEs and depletion in Nb, Ta, Ti, and P, consistent with subduction-related felsic magmatism. Chondrite-normalized REE patterns are marked by enriched LREEs, flat to weakly fractionated HREEs ((Gd/Yb)N ≈ 1.5), and negative Eu anomalies. The flat HREE segment indicates melting of a garnet-free source, most plausibly an amphibole ± plagioclase-bearing crustal assemblage, whereas the Eu anomaly and the whole-suite Eu/Eu*–Sr relation are compatible with plagioclase control during differentiation. Pb isotopes and crust-like Ce/Pb, Nb/U, and Y/Nb ratios require substantial crustal involvement. Although AFC from an unseen mantle-derived parent cannot be excluded completely, the available Pb isotope dataset does not define a simple mantle-to-crust differentiation trend, and all analyzed samples have evolved and exhibit crust-like signatures. The most parsimonious interpretation is, therefore, the partial melting of felsic continental crust metasomatized in a subduction environment, followed by limited fractional crystallization, and emplacement in a mature continental-arc setting within the Arabian–Nubian Shield.
Supplementary Materials
The following supporting information can be downloaded at: https://www.mdpi.com/article/10.3390/min16050545/s1, Table S1: Compleate chemical analysis of W. Mahasin volcanics and led isotpos.
Author Contributions
Conceptualization, E.S.R.L. and M.S.; data curation, E.S.R.L. and S.Z.K.; funding acquisition B.A.E.-B.; investigation, E.S.R.L., M.S. and S.Z.K.; methodology, M.L. and E.S.R.L.; project administration, M.S. and E.S.R.L.; software, E.S.R.L. and S.Z.K.; supervision, E.S.R.L., M.L., M.S., I.V.S. and T.A.; validation, T.A., B.A.E.-B., E.S.R.L. and M.S.; visualization, E.S.R.L. and M.S.; writing—original draft E.S.R.L. and S.Z.K.; writing—review and editing, E.S.R.L., M. L, B.A.E.-B., M.S., I.V.S. and T.A. All authors have read and agreed to the published version of the manuscript.
Funding
This work was supported and funded by the Deanship of Scientific Research at Imam Mohammad Ibn Saud Islamic University (IMSIU) (grant number IMSIU-DDRSP2602).
Data Availability Statement
The linked authors can provide the data regarding this study upon request.
Conflicts of Interest
There are no conflicts of interest.
References
- Saleh, G.M.; Kamh, S.Z.; Abdalla, F.; Kilias, A.; Lasheen, E.S.R. A New Occurrence of Rift-Related Damtjernite (Ultramafic) Lamprophyre, Gebel Anweiyib Area, Arabian Nubian Shield: Insights from Bulk Rock Geochemistry and Remote Sensing Data Analysis. Phys. Chem. Earth Parts ABC 2024, 133, 103530. [Google Scholar] [CrossRef] [Scilit]
- Saleh, G.M.; El-Badry, B.A.; Sami, M.; Alhazani, T.; Amer, O.T.; Sanislav, I.V.; Lasheen, E.S.R. Mineralization and Radioactive Potential of Magal Gebreel Rocks, South Eastern Desert, Egypt: Health Risk Evaluation. Nucl. Eng. Technol. 2026, 58, 104165. [Google Scholar] [CrossRef] [Scilit]
- Lasheen, E.S.R.; Saleh, G.M.; El-Tohamy, A.; Khaleal, F.M.; Sami, M.; Sanislav, I.V.; Abdalla, F. Mineral Chemistry and Whole-Rock Analysis of Magnesian and Ferroan Granitic Suites of Magal Gebreel, South Eastern Desert: Clues for Neoproterozoic Syn- and Post-Collisional Felsic Magmatism. Minerals 2025, 15, 751. [Google Scholar] [CrossRef] [Scilit]
- Khaleal, F.M.; Lentz, D.R.; Kamh, S.Z.; Saleh, G.M.; Abdalla, F.; Lasheen, E.S.R. Remote Sensing Analysis and Geodynamic Setting of Magmatic Spessartine-Almandine-Bearing Leucogranites, Um Addebaa Area, Southeastern Desert, Egypt: Bulk Rock and Mineral Chemistry. Phys. Chem. Earth Parts ABC 2024, 136, 103749. [Google Scholar] [CrossRef] [Scilit]
- Johnson, P.R.; Andresen, A.; Collins, A.S.; Fowler, A.R.; Fritz, H.; Ghebreab, W.; Kusky, T.; Stern, R.J. Late Cryogenian–Ediacaran History of the Arabian–Nubian Shield: A Review of Depositional, Plutonic, Structural, and Tectonic Events in the Closing Stages of the Northern East African Orogen. J. Afr. Earth Sci. 2011, 61, 167–232. [Google Scholar] [CrossRef] [Scilit]
- Lasheen, E.S.R.; Abart, R.; Ahmed, M.S.; Abdelfadil, K.M.; Farahat, E.; Sami, M. Petrological Constraints of the Ediacaran Magmatic Intrusions, Homrit Mukpid Area, Southeastern Desert, Egypt: Bulk Rock Geochemistry and Mineralogy. J. Afr. Earth Sci. 2025, 225, 105567. [Google Scholar] [CrossRef] [Scilit]
- Lasheen, E.S.R.; Sami, M.; Hegazy, A.A.; Arman, H.; Sanislav, I.V.; Ahmed, M.S.; Rashwan, M.A. Petrological Characteristics and Physico-Mechanical Properties of Dokhan Volcanics for Decorative Stones and Building Material Applications. Buildings 2024, 14, 3418. [Google Scholar] [CrossRef] [Scilit]
- Sami, M.; Faisal, M.; Leybourne, M.; Sanislav, I.V.; Ahmed, M.S.; Lasheen, E.S.R. Unravelling the Genesis and Depositional Setting of Neoproterozoic Banded Iron Formation from Central Eastern Desert, Egypt. Front. Earth Sci. 2024, 12, 1359617. [Google Scholar] [CrossRef] [Scilit]
- Sami, M.; Azer, M.; Abdel-Karim, A.-A. Postcollisional Ferani Volcanics from North Arabian–Nubian Shield (South Sinai, Egypt): Petrogenesis and Implication for Ediacaran (607–593 Ma) Geodynamic Evolution. J. Geol. 2022, 130, 475–498. [Google Scholar] [CrossRef] [Scilit]
- Faisal, M.; Yang, X.; Khalifa, I.H.; Amuda, A.K.; Sun, C. Geochronology and Geochemistry of Neoproterozoic Hamamid Metavolcanics Hosting Largest Volcanogenic Massive Sulfide Deposits in Eastern Desert of Egypt: Implications for Petrogenesis and Tectonic Evolution. Precambrian Res. 2020, 344, 105751. [Google Scholar] [CrossRef] [Scilit]
- Eliwa, H.A.; Kimura, J.-I.; Itaya, T. Late Neoproterozoic Dokhan Volcanics, North Eastern Desert, Egypt: Geochemistry and Petrogenesis. Precambrian Res. 2006, 151, 31–52. [Google Scholar] [CrossRef] [Scilit]
- Surour, A.A.; Madani, A.A.; El-Sharkawi, M.A. Mineralogical and Geochemical Characterization of the Wadi Natash Volcanic Field (WNVF), Egypt: Alkaline Magmatism in a Late Cretaceous Continental Rift System. Acta Geochim. 2024, 43, 1169–1191. [Google Scholar] [CrossRef] [Scilit]
- Moghazi, A.M. Geochemistry and Petrogenesis of a High-K Calc-Alkaline Dokhan Volcanic Suite, South Safaga Area, Egypt: The Role of Late Neoproterozoic Crustal Extension. Precambrian Res. 2003, 125, 161–178. [Google Scholar] [CrossRef] [Scilit]
- Wilde, S.A.; Youssef, K. Significance of SHRIMP U-Pb Dating of the Imperial Porphyry and Associated Dokhan Volcanics, Gebel Dokhan, North Eastern Desert, Egypt. J. Afr. Earth Sci. 2000, 31, 403–413. [Google Scholar] [CrossRef] [Scilit]
- Said, A.; Zaghlol, K.; El Shimi, K. Gold Bearing-Quartz Veins in Island Arc Metavolcanics, Case Study: Wadi Mahasin, West Qusier, Central Eastern Desert, Egypt. Annals Geol. Surv. Egypt 2015, XXXII, 177–188. [Google Scholar]
- Pereira, J.; Pereira, A.J.S.C.; Gil, A.; Mantas, V.M. Lithology Mapping with Satellite Images, Fieldwork-Based Spectral Data, and Machine Learning Algorithms: The Case Study of Beiras Group (Central Portugal). CATENA 2023, 220, 106653. [Google Scholar] [CrossRef] [Scilit]
- Arnous, M.O.; ElMowafy, A.A.; Azzaz, S.A.; Omar, A.E.; Abdel Hafeez, W.M. Exploration Radioactive Mineralization Using Mappable Data Integration Approach: Example from Wadi Dahab Area, Southeastern Sinai, Egypt. Arab. J. Geosci. 2021, 14, 599. [Google Scholar] [CrossRef] [Scilit]
- Sabins, F.F. Remote Sensing for Mineral Exploration. Ore Geol. Rev. 1999, 14, 157–183. [Google Scholar] [CrossRef] [Scilit]
- Abd El-Wahed, M.; Kamh, S.; Abu Anbar, M.; Zoheir, B.; Hamdy, M.; Abdeldayem, A.; Lebda, E.M.; Attia, M. Multisensor Satellite Data and Field Studies for Unravelling the Structural Evolution and Gold Metallogeny of the Gerf Ophiolitic Nappe, Eastern Desert, Egypt. Remote Sens. 2023, 15, 1974. [Google Scholar] [CrossRef] [Scilit]
- Ghoneim, S.M.; Salem, S.M.; El-Wahid, K.H.A.; Anwar, M.; Hegab, M.A.E.-R.; Soliman, N.M.; Ali, H.F. Application of Remote Sensing Techniques to Identify Iron Ore Deposits in the Central Eastern Desert, Egypt: A Case Study at Wadi Karim and Gabal El-Hadid Areas. Arab. J. Geosci. 2022, 15, 1596. [Google Scholar] [CrossRef] [Scilit]
- Hamimi, Z.; Hagag, W.; Fritz, H.; Baggazi, H.; Kamh, S. The Tectonic Map and Structural Provinces of the Late Neoproterozoic Egyptian Nubian Shield: Implications for Crustal Growth of the Arabian–Nubian Shield (East African Orogen). Front. Earth Sci. 2022, 10, 921521. [Google Scholar] [CrossRef] [Scilit]
- Ghoneim, S.M.; Ali, H.F.; Abdelrahman, K.; Fnais, M.S.; Lala, A.M.S. Integrating Remote Sensing and Geophysical Data for Mapping Potential Gold Mineralization Localities at Abu Marawat Area, Central Eastern Desert, Egypt. Sci. Rep. 2024, 14, 18273. [Google Scholar] [CrossRef] [Scilit]
- Ghoneim, S.M.; Hamimi, Z.; Abdelrahman, K.; Khalifa, M.A.; Shabban, M.; Abdelmaksoud, A.S. Machine Learning and Remote Sensing-Based Lithological Mapping of the Duwi Shear-Belt Area, Central Eastern Desert, Egypt. Sci. Rep. 2024, 14, 17010. [Google Scholar] [CrossRef] [Scilit] [PubMed]
- Chrysoulakis, N.; Abrams, M.; Feidas, H.; Arai, K. Comparison of Atmospheric Correction Methods Using ASTER Data for the Area of Crete, Greece. Int. J. Remote Sens. 2010, 31, 6347–6385. [Google Scholar] [CrossRef] [Scilit]
- Cooley, T.; Anderson, G.P.; Felde, G.W.; Hoke, M.L.; Ratkowski, A.J.; Chetwynd, J.H.; Gardner, J.A.; Adler-Golden, S.M.; Matthew, M.W.; Berk, A.; et al. FLAASH, a MODTRAN4-Based Atmospheric Correction Algorithm, Its Application and Validation. In Proceedings of the IEEE International Geoscience and Remote Sensing Symposium; IEEE: Toronto, ON, Canada, 2002; Volume 3, pp. 1414–1418. [Google Scholar]
- Fritz, H.; Abdelsalam, M.; Ali, K.A.; Bingen, B.; Collins, A.S.; Fowler, A.R.; Ghebreab, W.; Hauzenberger, C.A.; Johnson, P.R.; Kusky, T.M.; et al. Orogen Styles in the East African Orogen: A Review of the Neoproterozoic to Cambrian Tectonic Evolution. J. Afr. Earth Sci. 2013, 86, 65–106. [Google Scholar] [CrossRef] [Scilit]
- Awad, H.A.M.; Zakaly, H.M.H.; Nastavkin, A.V.; El-Taher, A. Radiological Implication of the Granitoid Rocks and Their Associated Jasperoid Veins, El-Missikat Area, Central Eastern Desert, Egypt. Int. J. Environ. Anal. Chem. 2020, 102, 8181–8194. [Google Scholar] [CrossRef] [Scilit]
- El Dabe, M. New Occurrence of Polymetals Mineralized Pegmatites in the Older Granitoids, Wadi El Sheih Area, Central Eastern Desert, Egypt. Al-Azhar Bull. Sci. 2017, 28, 25–41. [Google Scholar] [CrossRef] [Scilit]
- Fahmy, W.; El-Desoky, H.M.; Elyaseer, M.H.; Ayonta Kenne, P.; Shirazi, A.; Hezarkhani, A.; Shirazy, A.; El-Awny, H.; Abdel-Rahman, A.M.; Khalil, A.E.; et al. Remote Sensing, Petrological and Geochemical Data for Lithological Mapping in Wadi Kid, Southeast Sinai, Egypt. Minerals 2023, 13, 1160. [Google Scholar] [CrossRef] [Scilit]
- Fangary, I.H.; Orabi, A.M.; Tolba, A.S.; Abd Elghany, M.K.; Mohamed, L.A.E. Geology and Geochemistry of Neoproterozoic Basement Rocks at Um Had Area, Central Eastern Desert, Egypt. Al-Azhar Bull. Sci. 2024, 35, 9. [Google Scholar] [CrossRef] [Scilit]
- Gaafar, M.; Ali, K. Geophysical and Geochemical Signature of Rare Metal Granites, Central Eastern Desert, Egypt: Implications for Tectonic Environment. Al-Azhar Bull. Sci. 2015, 26, 15–32. [Google Scholar] [CrossRef] [Scilit]
- Hassaan, M.M.; Omar, S.A.; Khalil, A.E.; Shahin, T.M.; El-Naggar, I.M.; Sayyed, M.I.; Hanfi, M.Y. Prognostic Exploration of U-F-Au-Mo-W Younger Granites for Geochemical Pathfinders, Genetic Affiliations, and Tectonic Setting in El-Erediya-El-Missikat Province, Eastern Desert, Egypt. Minerals 2022, 12, 518. [Google Scholar] [CrossRef] [Scilit]
- Gamaleldien, H.; Sami, M.; Ma, J.; Abu Anbar, M.; Zafar, T.; Murphy, J.B.; Evans, N.J. Crustal Evolution and Stabilization of the Arabian-Nubian Shield: Constraints from Whole-Rock Sr Nd and Zircon U-Pb-Hf-O Isotopes of Bimodal Volcanics. Chem. Geol. 2026, 703, 123246. [Google Scholar] [CrossRef] [Scilit]
- Zoheir, B.; Emam, A.; Abdel-Wahed, M.; Soliman, N. Multispectral and Radar Data for the Setting of Gold Mineralization in the South Eastern Desert, Egypt. Remote Sens. 2019, 11, 1450. [Google Scholar] [CrossRef] [Scilit]
- Pearson, K. LIII. On Lines and Planes of Closest Fit to Systems of Points in Space. Lond. Edinb. Dublin Philos. Mag. J. Sci. 1901, 2, 559–572. [Google Scholar] [CrossRef] [Scilit]
- Gabr, S.; Ghulam, A.; Kusky, T. Detecting Areas of High-Potential Gold Mineralization Using ASTER Data. Ore Geol. Rev. 2010, 38, 59–69. [Google Scholar] [CrossRef] [Scilit]
- Boardman, J.W.; Kruse, F.A. Automated Spectral Analysis: A Geological Example Using AVIRIS Data, North Grapevine Mountains, Nevada. In Proceedings of the ERIM Tenth Thematic Conference on Geologic Remote Sensing, San Antonio, TX, USA, 9–12 May 1994; pp. 407–418. [Google Scholar]
- Lasheen, E.S.R.; El-Badry, B.A.; Kamh, S.Z.; Sami, M.; AbdelAll, N.; Sanislav, I.V.; Hasan, S.S.; Saleh, G.M. Multispectral Remote Sensing and Radiometric Data for Delineating Radioelement-Enriched Zones and Their Health Hazards in Um Domi Area, South Eastern Desert, Egypt. J. Radiat. Res. Appl. Sci. 2025, 18, 102007. [Google Scholar] [CrossRef] [Scilit]
- Lasheen, E.S.R.; Semary, H.E.; Kamh, S.Z.; Saleh, G.M. Advanced Remote Sensing Techniques for Mapping Lithological Units and Radioactive Alteration in the Southern Eastern Desert, Egypt: Petrological and Radiological Hazards Determination. Adv. Space Res. 2026, 77, 5818–5836. [Google Scholar] [CrossRef] [Scilit]
- Scott, A.J.; Symons, M.J. Clustering Methods Based on Likelihood Ratio Criteria. Biometrics 1971, 27, 387. [Google Scholar] [CrossRef] [Scilit]
- Vapnik, V.N. The Nature of Statistical Learning Theory; Springer: New York, NY, USA, 2000. [Google Scholar]
- Bachmann, O. On the Origin of Crystal-Poor Rhyolites: Extracted from Batholithic Crystal Mushes. J. Petrol. 2004, 45, 1565–1582. [Google Scholar] [CrossRef] [Scilit]
- Rollinson, H.R. Using Geochemical Data: Evaluation, Presentation, Interpretation; Geochemistry Series; Longman Scientific & Technical: Harlow, UK; Wiley & Sons: New York, NY, USA, 1993. [Google Scholar]
- Winchester, J.A.; Floyd, P.A. Geochemical Discrimination of Different Magma Series and Their Differentiation Products Using Immobile Elements. Chem. Geol. 1977, 20, 325–343. [Google Scholar] [CrossRef] [Scilit]
- Le Bas, M.J.L.; Maitre, R.W.L.; Streckeisen, A.; Zanettin, B. IUGS Subcommission on the Systematics of Igneous Rocks. A Chemical Classification of Volcanic Rocks Based on the Total Alkali-Silica Diagram. J. Petrol. 1986, 27, 745–750. [Google Scholar] [CrossRef] [Scilit]
- Shinjo, R.; Kato, Y. Geochemical Constraints on the Origin of Bimodal Magmatism at the Okinawa Trough, an Incipient Back-Arc Basin. Lithos 2000, 54, 117–137. [Google Scholar] [CrossRef] [Scilit]
- Irvine, T.N.; Baragar, W.R.A. A Guide to the Chemical Classification of the Common Volcanic Rocks. Can. J. Earth Sci. 1971, 8, 523–548. [Google Scholar] [CrossRef] [Scilit]
- Le Maitre, R.W. A Classification of Igneous Rocks and Glossary of Terms; Cambridge University Press: Cambridge, UK, 1989. [Google Scholar]
- Wang, X.; Zhang, W.; Cheng, S.; Wang, B.; Tang, Y.; Li, W. Geological Characteristics of Early Cretaceous Volcanic Rocks and Analysis of Metallogenic Potential of Uranium Mineralization in Moganshan Basin, Northern Zhejiang Province, China. Front. Earth Sci. 2024, 12, 1399836. [Google Scholar] [CrossRef] [Scilit]
- Sun, S.-S.; McDonough, W.F. Chemical and Isotopic Systematics of Oceanic Basalts: Implications for Mantle Composition and Processes. Geol. Soc. Lond. Spec. Publ. 1989, 42, 313–345. [Google Scholar] [CrossRef] [Scilit]
- Abdel-Karim, A.-A.M.; Ali, S.; El-Awady, A.; Elwan, W.; Khedr, M.Z.; Tamura, A. Mineral and Bulk–Rock Chemistry of Shadli Bimodal Metavolcanics from Eastern Desert of Egypt: Implication for Tectonomagmatic Setting and Neoproterozoic Continental Growth in the Arabian–Nubian Shield. Lithos 2019, 338–339, 204–217. [Google Scholar] [CrossRef] [Scilit]
- Taylor, S.R.; McLennan, S.M. The Continental Crust: Its Composition and Evolution; Blackwell Scientific Publications: Oxford, UK, 1985. [Google Scholar]
- Rudnick, R.L.; Fountain, D.M. Nature and Composition of the Continental Crust: A Lower Crustal Perspective. Rev. Geophys. 1995, 33, 267–309. [Google Scholar] [CrossRef] [Scilit]
- Hofmann, A.W.; Jochum, K.P.; Seufert, M.; White, W.M. Nb and Pb in Oceanic Basalts: New Constraints on Mantle Evolution. Earth Planet. Sci. Lett. 1986, 79, 33–45. [Google Scholar] [CrossRef] [Scilit]
- Younes, A.; McClay, K. Development of Accommodation Zones in the Gulf of Suez-Red Sea Rift, Egypt. Bulletin 2002, 86, 1003–1026. [Google Scholar] [CrossRef] [Scilit]
- Kusky, T.M.; Matsah, M.I. Neoproterozoic Dextral Faulting on the Najd Fault System, Saudi Arabia, Preceded Sinistral Faulting and Escape Tectonics Related to Closure of the Mozambique Ocean. Geol. Soc. Lond. Spec. Publ. 2003, 206, 327–361. [Google Scholar] [CrossRef] [Scilit]
- Dickin, A.P. Radiogenic Isotope Geology, 2nd ed.; Cambridge University Press: Cambridge, UK, 2005. [Google Scholar]
- Sun, Y.-Z.; Qiu, K.-F.; An, M.-G.; Li, S.-S.; Shang, Z.; Wang, Y. Geochronological and Geochemical Constraints on the Petrogenesis of Lamprophyre from the Giant Weishan REE Deposit in China. Minerals 2022, 12, 706. [Google Scholar] [CrossRef] [Scilit]
- Wan, B.; Zhang, L.; Xiang, P. The Ashele VMS-Type Cu-Zn Deposit in Xinjiang, NW China Formed in a Rifted Arc Setting: VMS Deposit in Rifted Arc Setting. Resour. Geol. 2010, 60, 150–164. [Google Scholar] [CrossRef] [Scilit]
- Hawkesworth, C.J.; Gallagher, K.; Hergt, J.M.; McDermott, F. Mantle and Slab Contributions in ARC Magmas. Annu. Rev. Earth Planet. Sci. 1993, 21, 175–204. [Google Scholar] [CrossRef]
- Eby, G.N. Chemical Subdivision of the A-Type Granitoids:Petrogenetic and Tectonic Implications. Geology 1992, 20, 641. [Google Scholar] [CrossRef] [Scilit]
- Gu, H.; Yang, X.; Nie, Z.; Deng, J.; Duan, L.; Hu, Q.; Abdul Shakoor, M.; Gao, E.; Jasmi Hafiz, A.A. Study of Late-Mesozoic Magmatic Rocks and Their Related Copper-Gold-Polymetallic Deposits in the Guichi Ore-Cluster District, Lower Yangtze River Metallogenic Belt, East China. Int. Geol. Rev. 2018, 60, 1404–1434. [Google Scholar] [CrossRef] [Scilit]
- McDonough, W.F.; Sun, S.-S. The Composition of the Earth. Chem. Geol. 1995, 120, 223–253. [Google Scholar] [CrossRef] [Scilit]
- Sainlot, N.; Vlastélic, I.; Nauret, F.; Moune, S.; Aguilera, F. Sr–Pb Isotopes Signature of Lascar Volcano (Chile): Insight into Contamination of Arc Magmas Ascending through a Thick Continental Crust. J. South Am. Earth Sci. 2020, 101, 102599. [Google Scholar] [CrossRef] [Scilit]
- Patiño Douce, A.E. What Do Experiments Tell Us about the Relative Contributions of Crust and Mantle to the Origin of Granitic Magmas? Geol. Soc. Lond. Spec. Publ. 1999, 168, 55–75. [Google Scholar] [CrossRef] [Scilit]
- Patiño Douce, A.E. Generation of Metaluminous A-Type Granites by Low-Pressure Melting of Calc-Alkaline Granitoids. Geology 1997, 25, 743. [Google Scholar] [CrossRef] [Scilit]
- Hermann, J.; Spandler, C.; Hack, A.; Korsakov, A. Aqueous Fluids and Hydrous Melts in High-Pressure and Ultra-High Pressure Rocks: Implications for Element Transfer in Subduction Zones. Lithos 2006, 92, 399–417. [Google Scholar] [CrossRef] [Scilit]
- Allègre, C.J.; Minster, J.F. Quantitative Models of Trace Element Behavior in Magmatic Processes. Earth Planet. Sci. Lett. 1978, 38, 1–25. [Google Scholar] [CrossRef] [Scilit]
- Woodhead, J.; Eggins, S.; Gamble, J. High Field Strength and Transition Element Systematics in Island Arc and Back-Arc Basin Basalts: Evidence for Multi-Phase Melt Extraction and a Depleted Mantle Wedge. Earth Planet. Sci. Lett. 1993, 114, 491–504. [Google Scholar] [CrossRef] [Scilit]
- Pearce, T.H.; Gorman, B.E.; Birkett, T.C. The TiO2–K2O–P2O5 Diagram: A Method of Discriminating between Oceanic and Non-Oceanic Basalts. Earth Planet. Sci. Lett. 1975, 24, 419–426. [Google Scholar] [CrossRef] [Scilit]
- Wilson, M. (Ed.) Igneous Petrogenesis; Springer Netherlands: Dordrecht, The Netherlands, 1989. [Google Scholar]
- Ross, P.-S.; Bédard, J.H. Magmatic Affinity of Modern and Ancient Subalkaline Volcanic Rocks Determined from Trace-Element Discriminant Diagrams. Can. J. Earth Sci. 2009, 46, 823–839. [Google Scholar] [CrossRef] [Scilit]
- Wood, D.A. The Application of a ThHfTa Diagram to Problems of Tectonomagmatic Classification and to Establishing the Nature of Crustal Contamination of Basaltic Lavas of the British Tertiary Volcanic Province. Earth Planet. Sci. Lett. 1980, 50, 11–30. [Google Scholar] [CrossRef] [Scilit]
- Pearce, J.A.; Gale, G.H. Identification of Ore-Deposition Environment from Trace-Element Geochemistry of Associated Igneous Host Rocks. Geol. Soc. Lond. Spec. Publ. 1977, 7, 14–24. [Google Scholar] [CrossRef] [Scilit]
- Pearce, J.A. Geochemical Fingerprinting of Oceanic Basalts with Applications to Ophiolite Classification and the Search for Archean Oceanic Crust. Lithos 2008, 100, 14–48. [Google Scholar] [CrossRef] [Scilit]
- Hollocher, K.; Robinson, P.; Walsh, E.; Roberts, D. Geochemistry of Amphibolite-Facies Volcanics and Gabbros of the Storen Nappe in Extensions West and Southwest of Trondheim, Western Gneiss Region, Norway: A Key to Correlations and Paleotectonic Settings. Am. J. Sci. 2012, 312, 357–416. [Google Scholar] [CrossRef] [Scilit]
- Pearce, J.A. Geochemical Fingerprinting of the Earth’s Oldest Rocks. Geology 2014, 42, 175–176. [Google Scholar] [CrossRef] [Scilit]
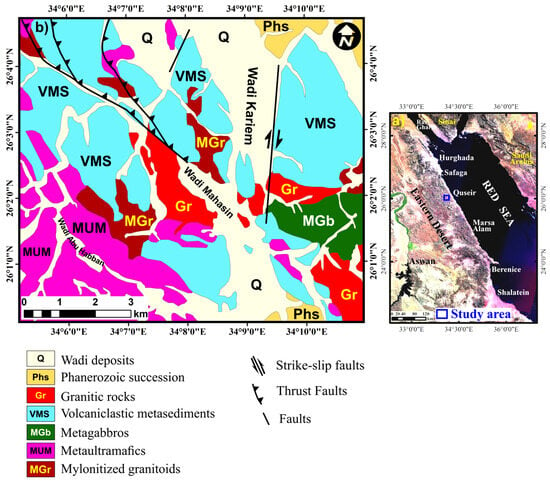
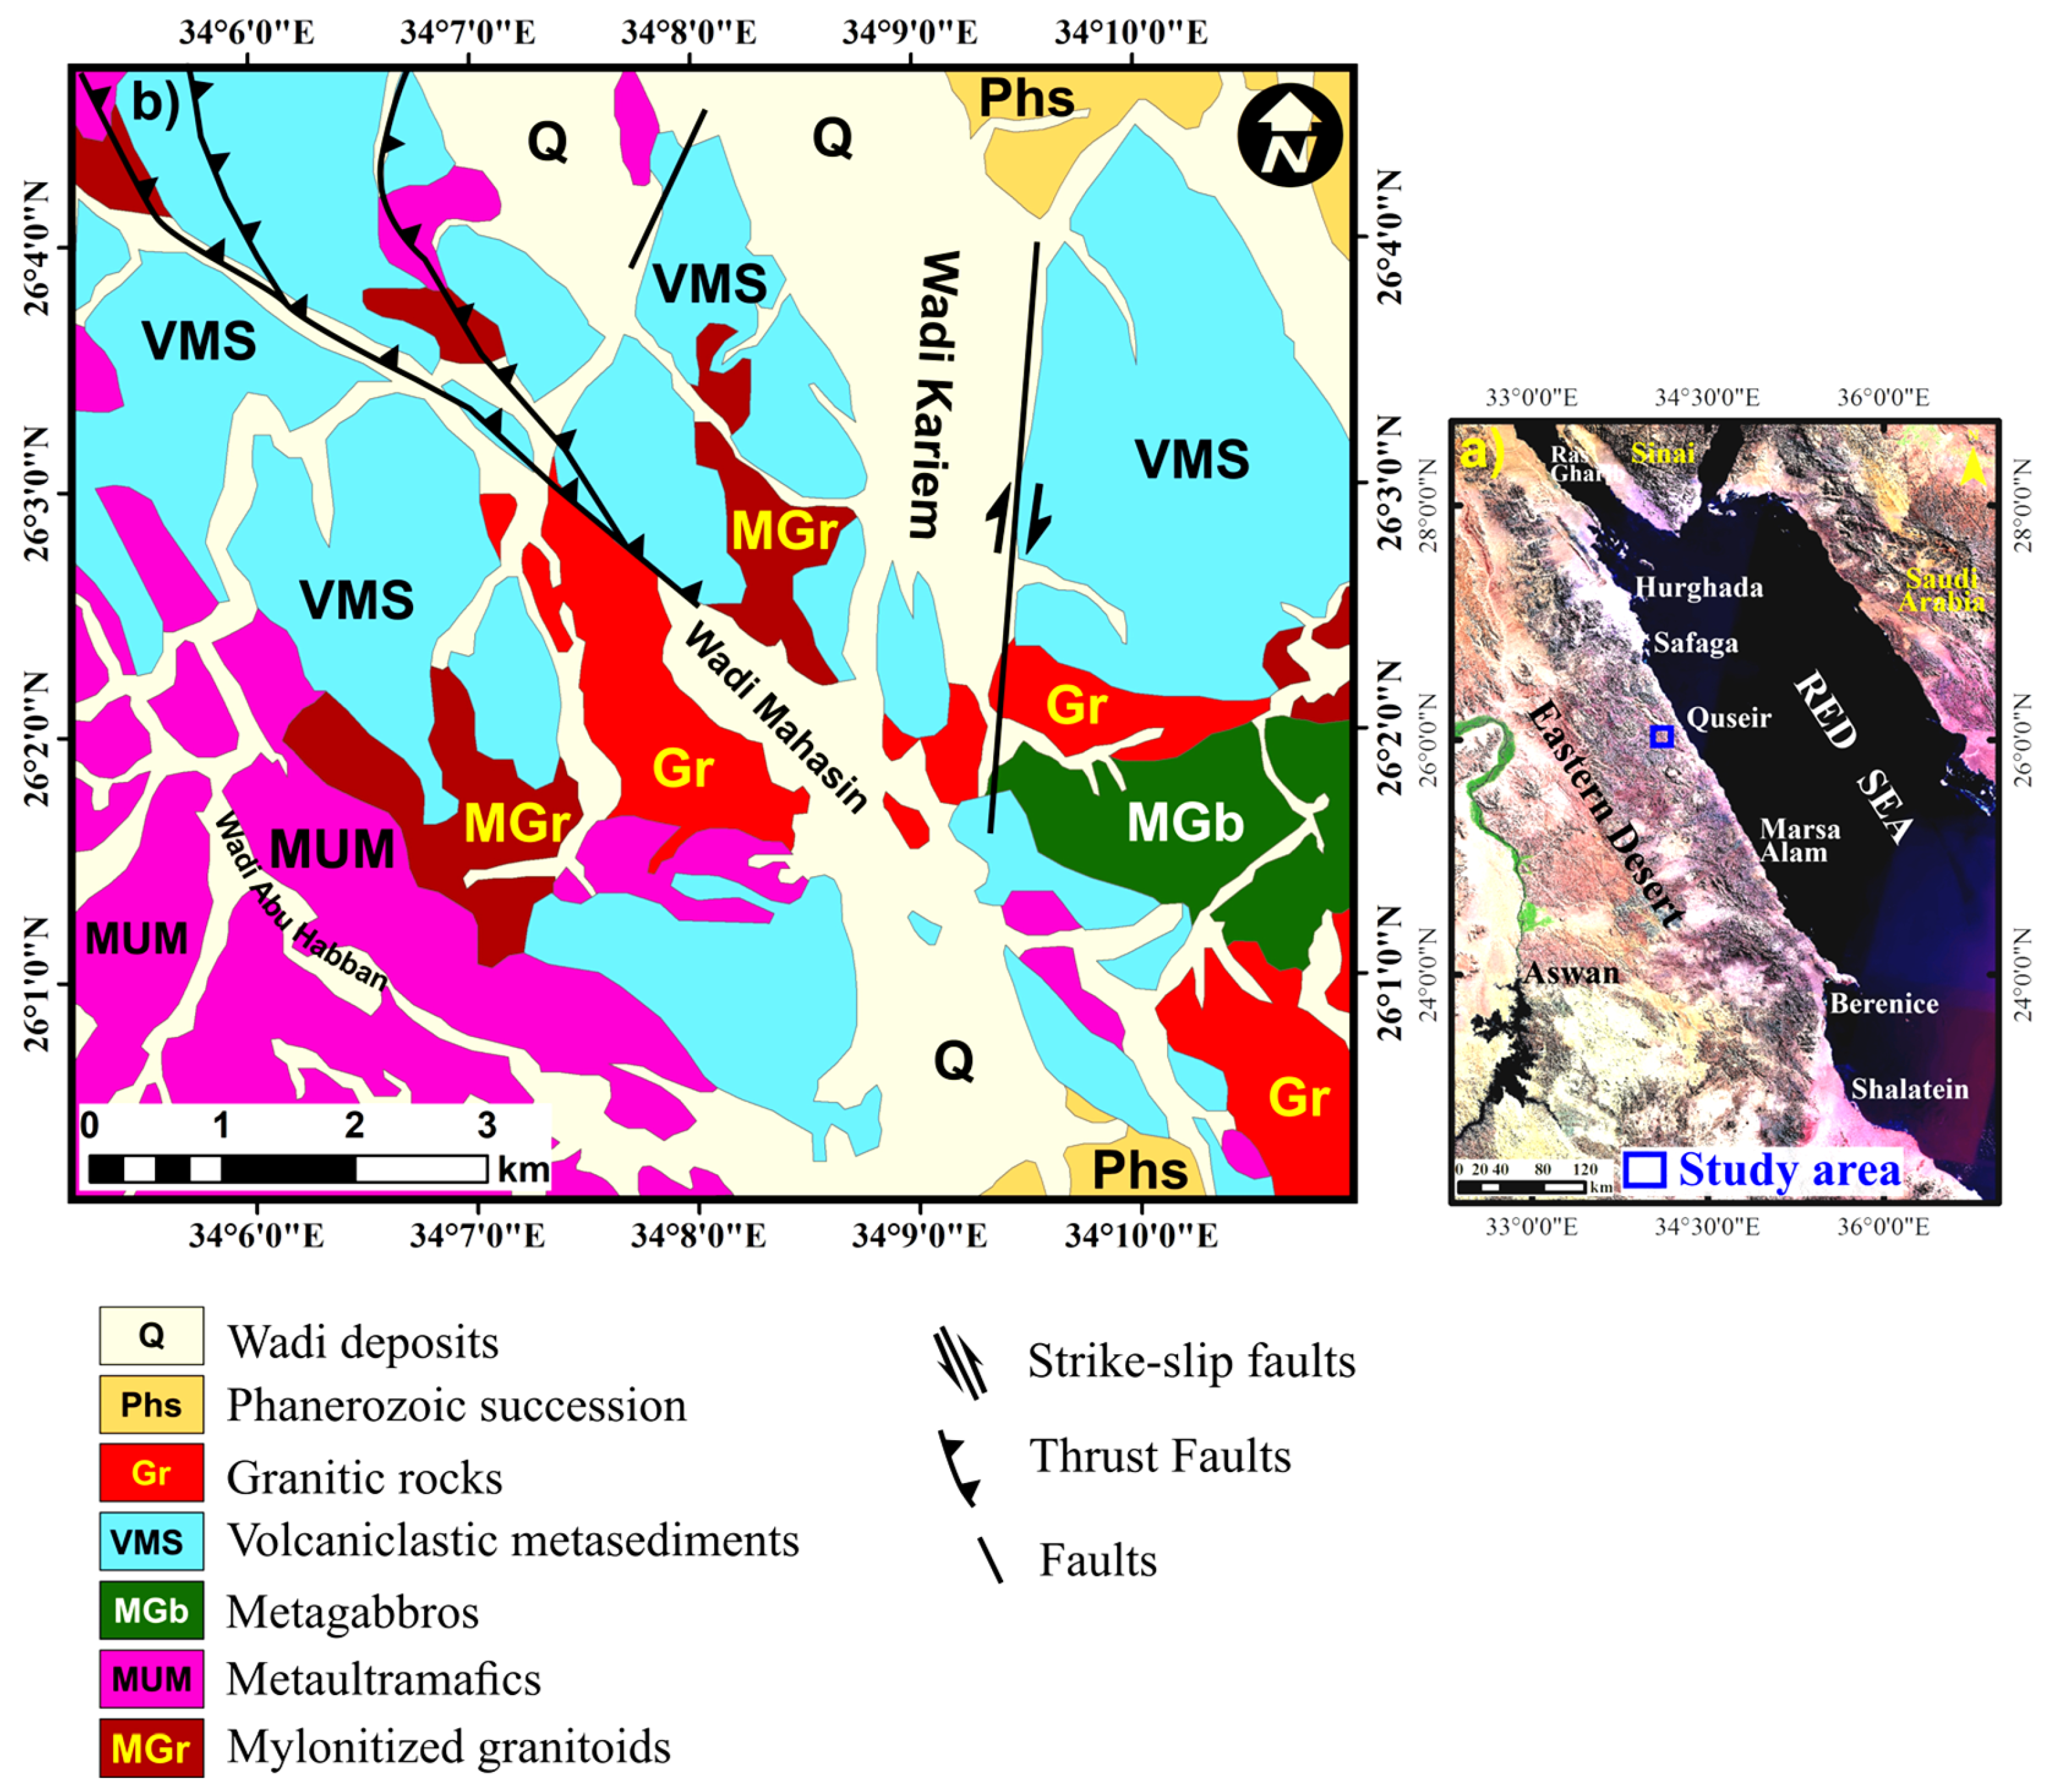
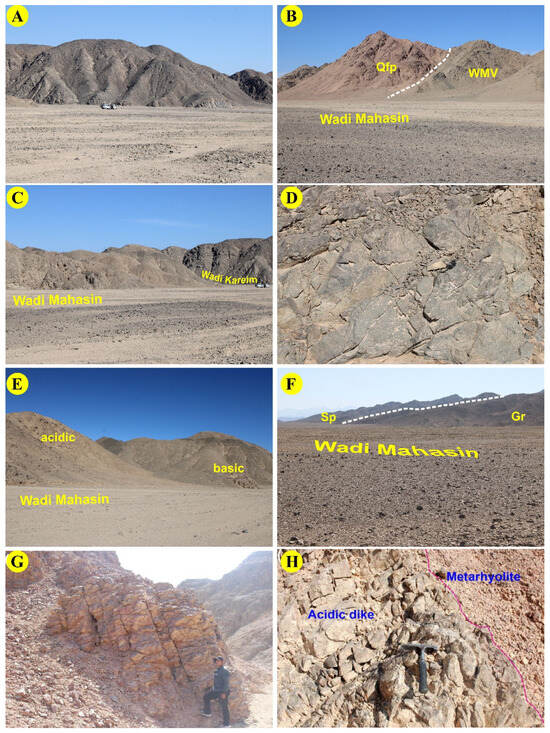
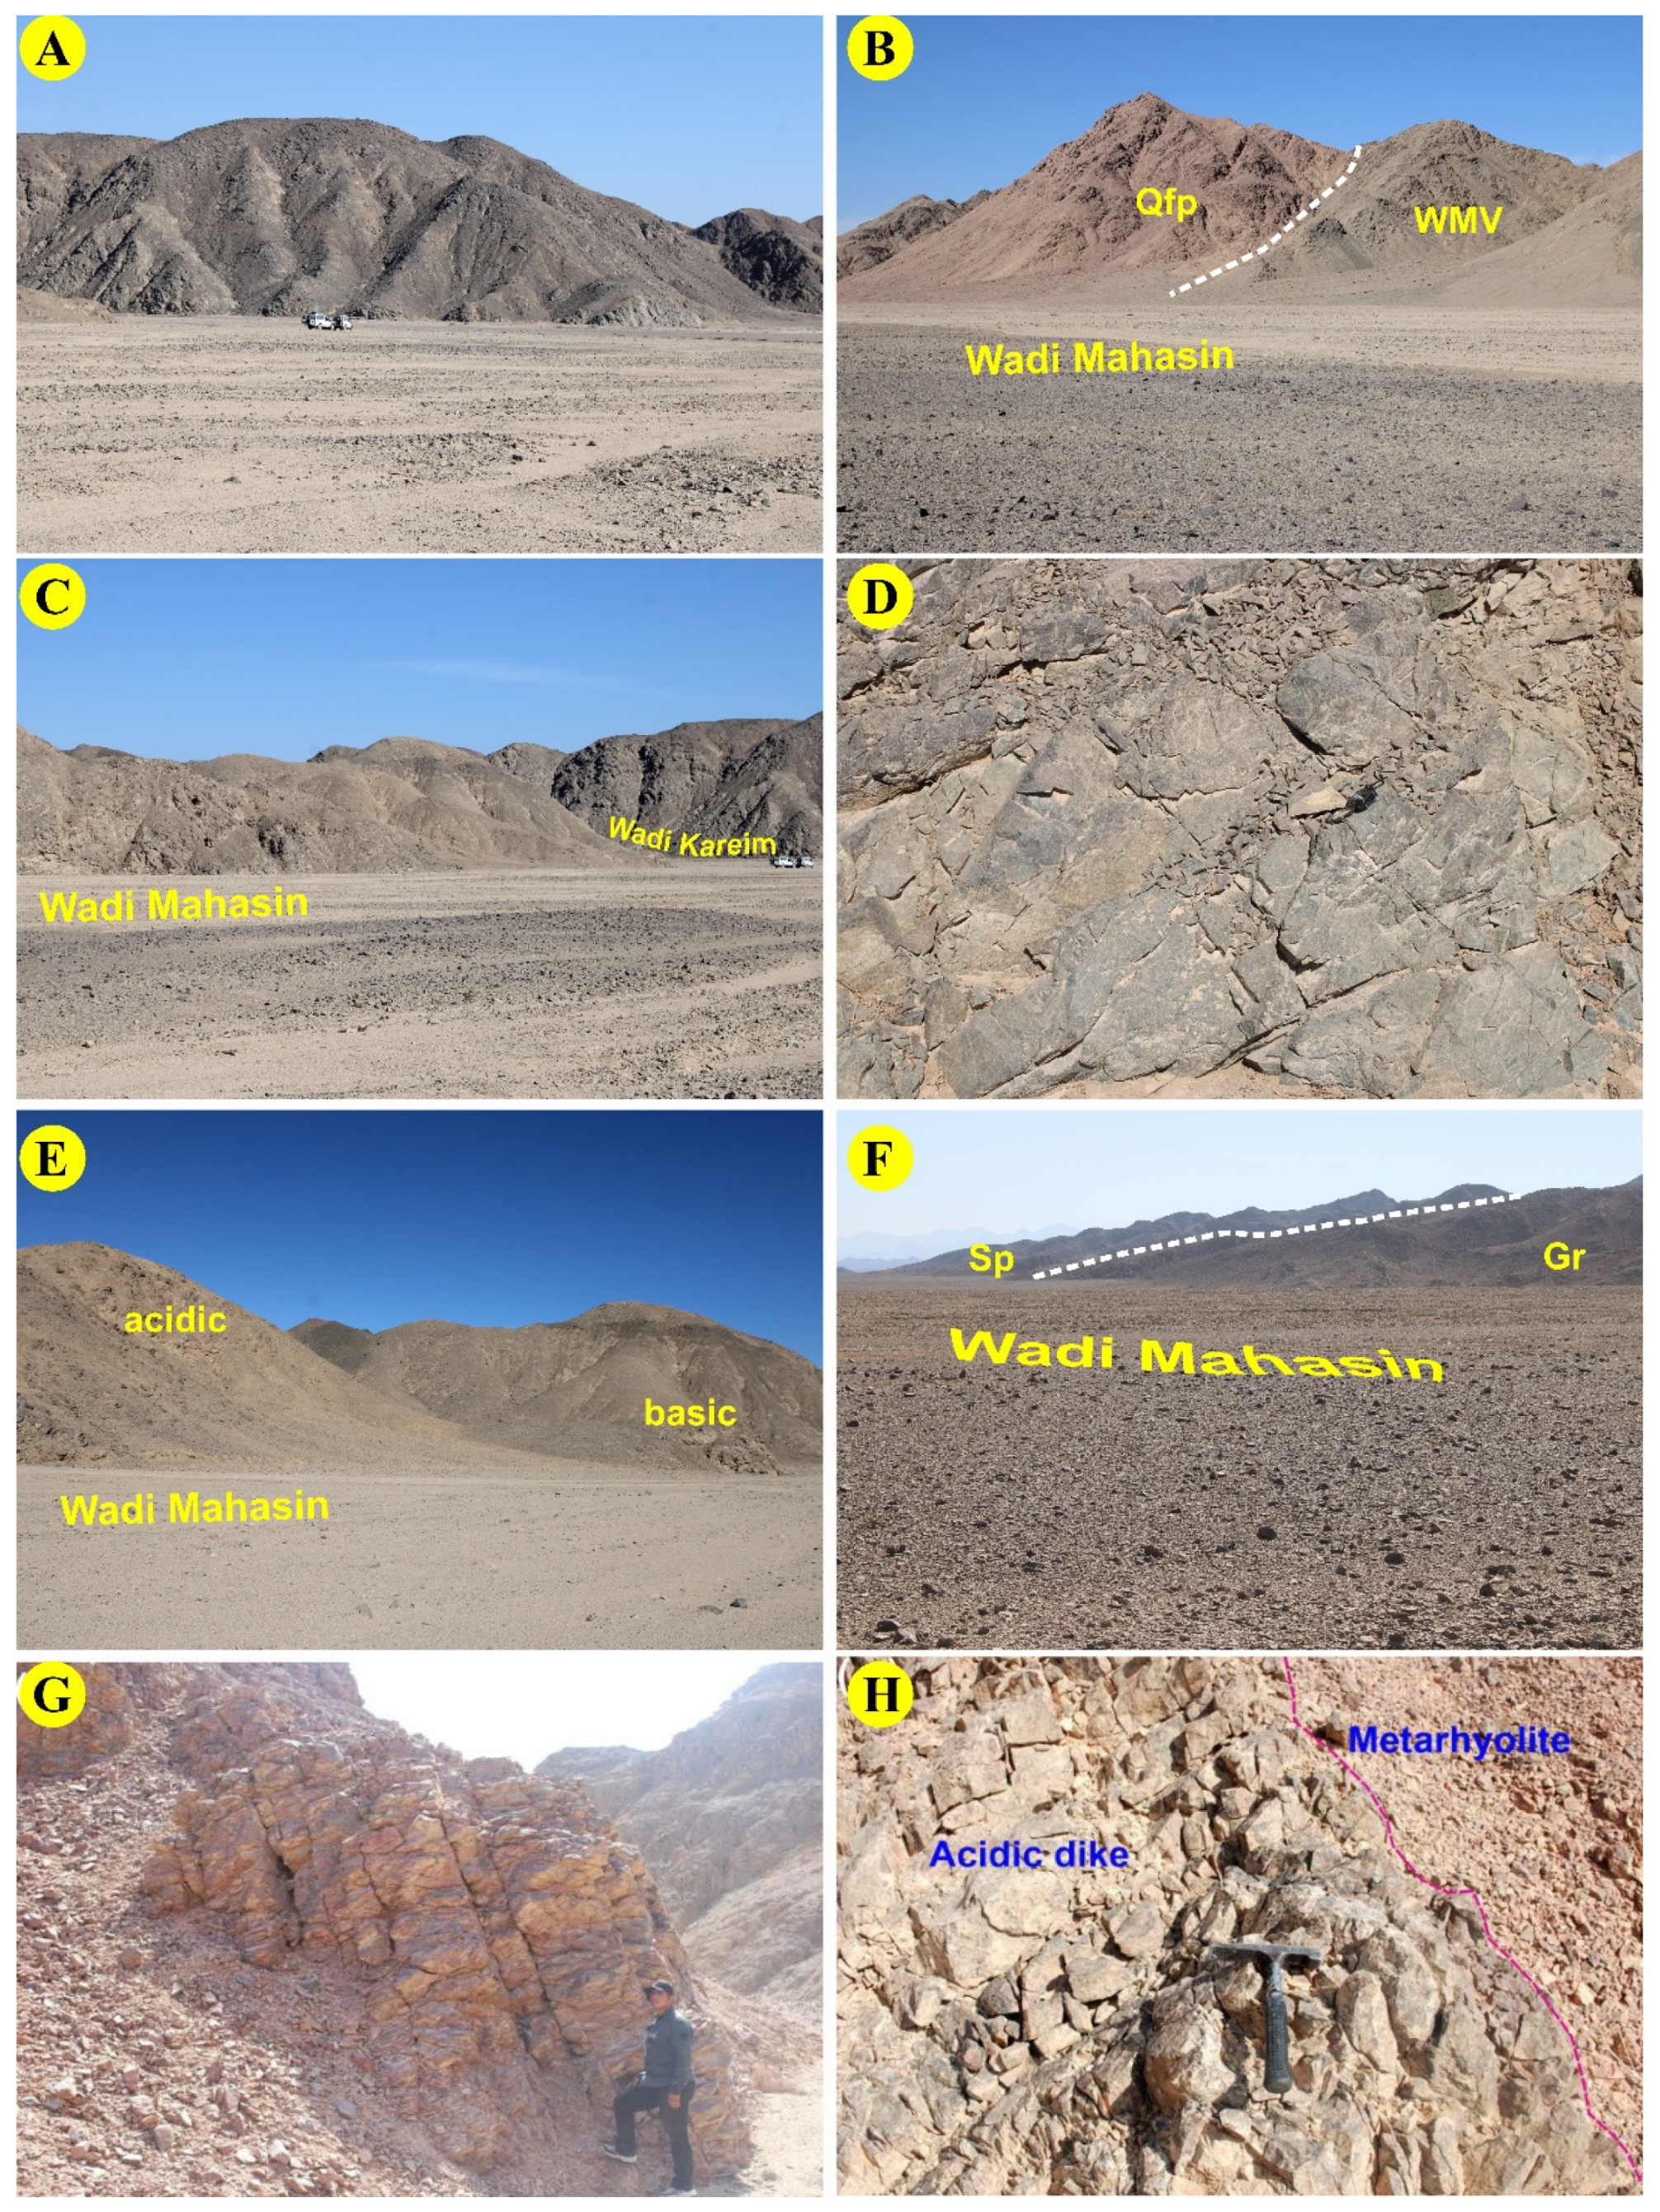
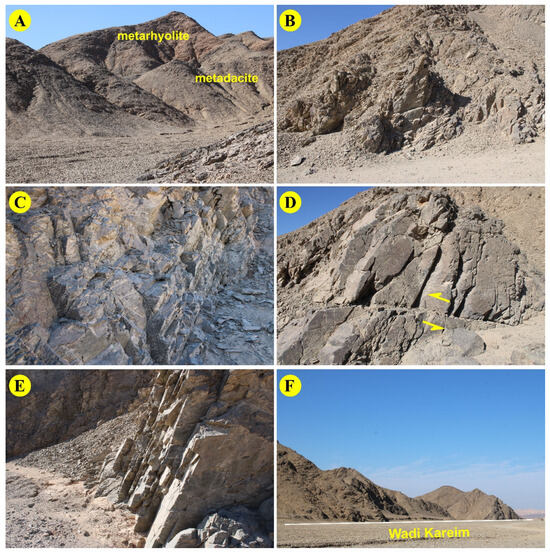
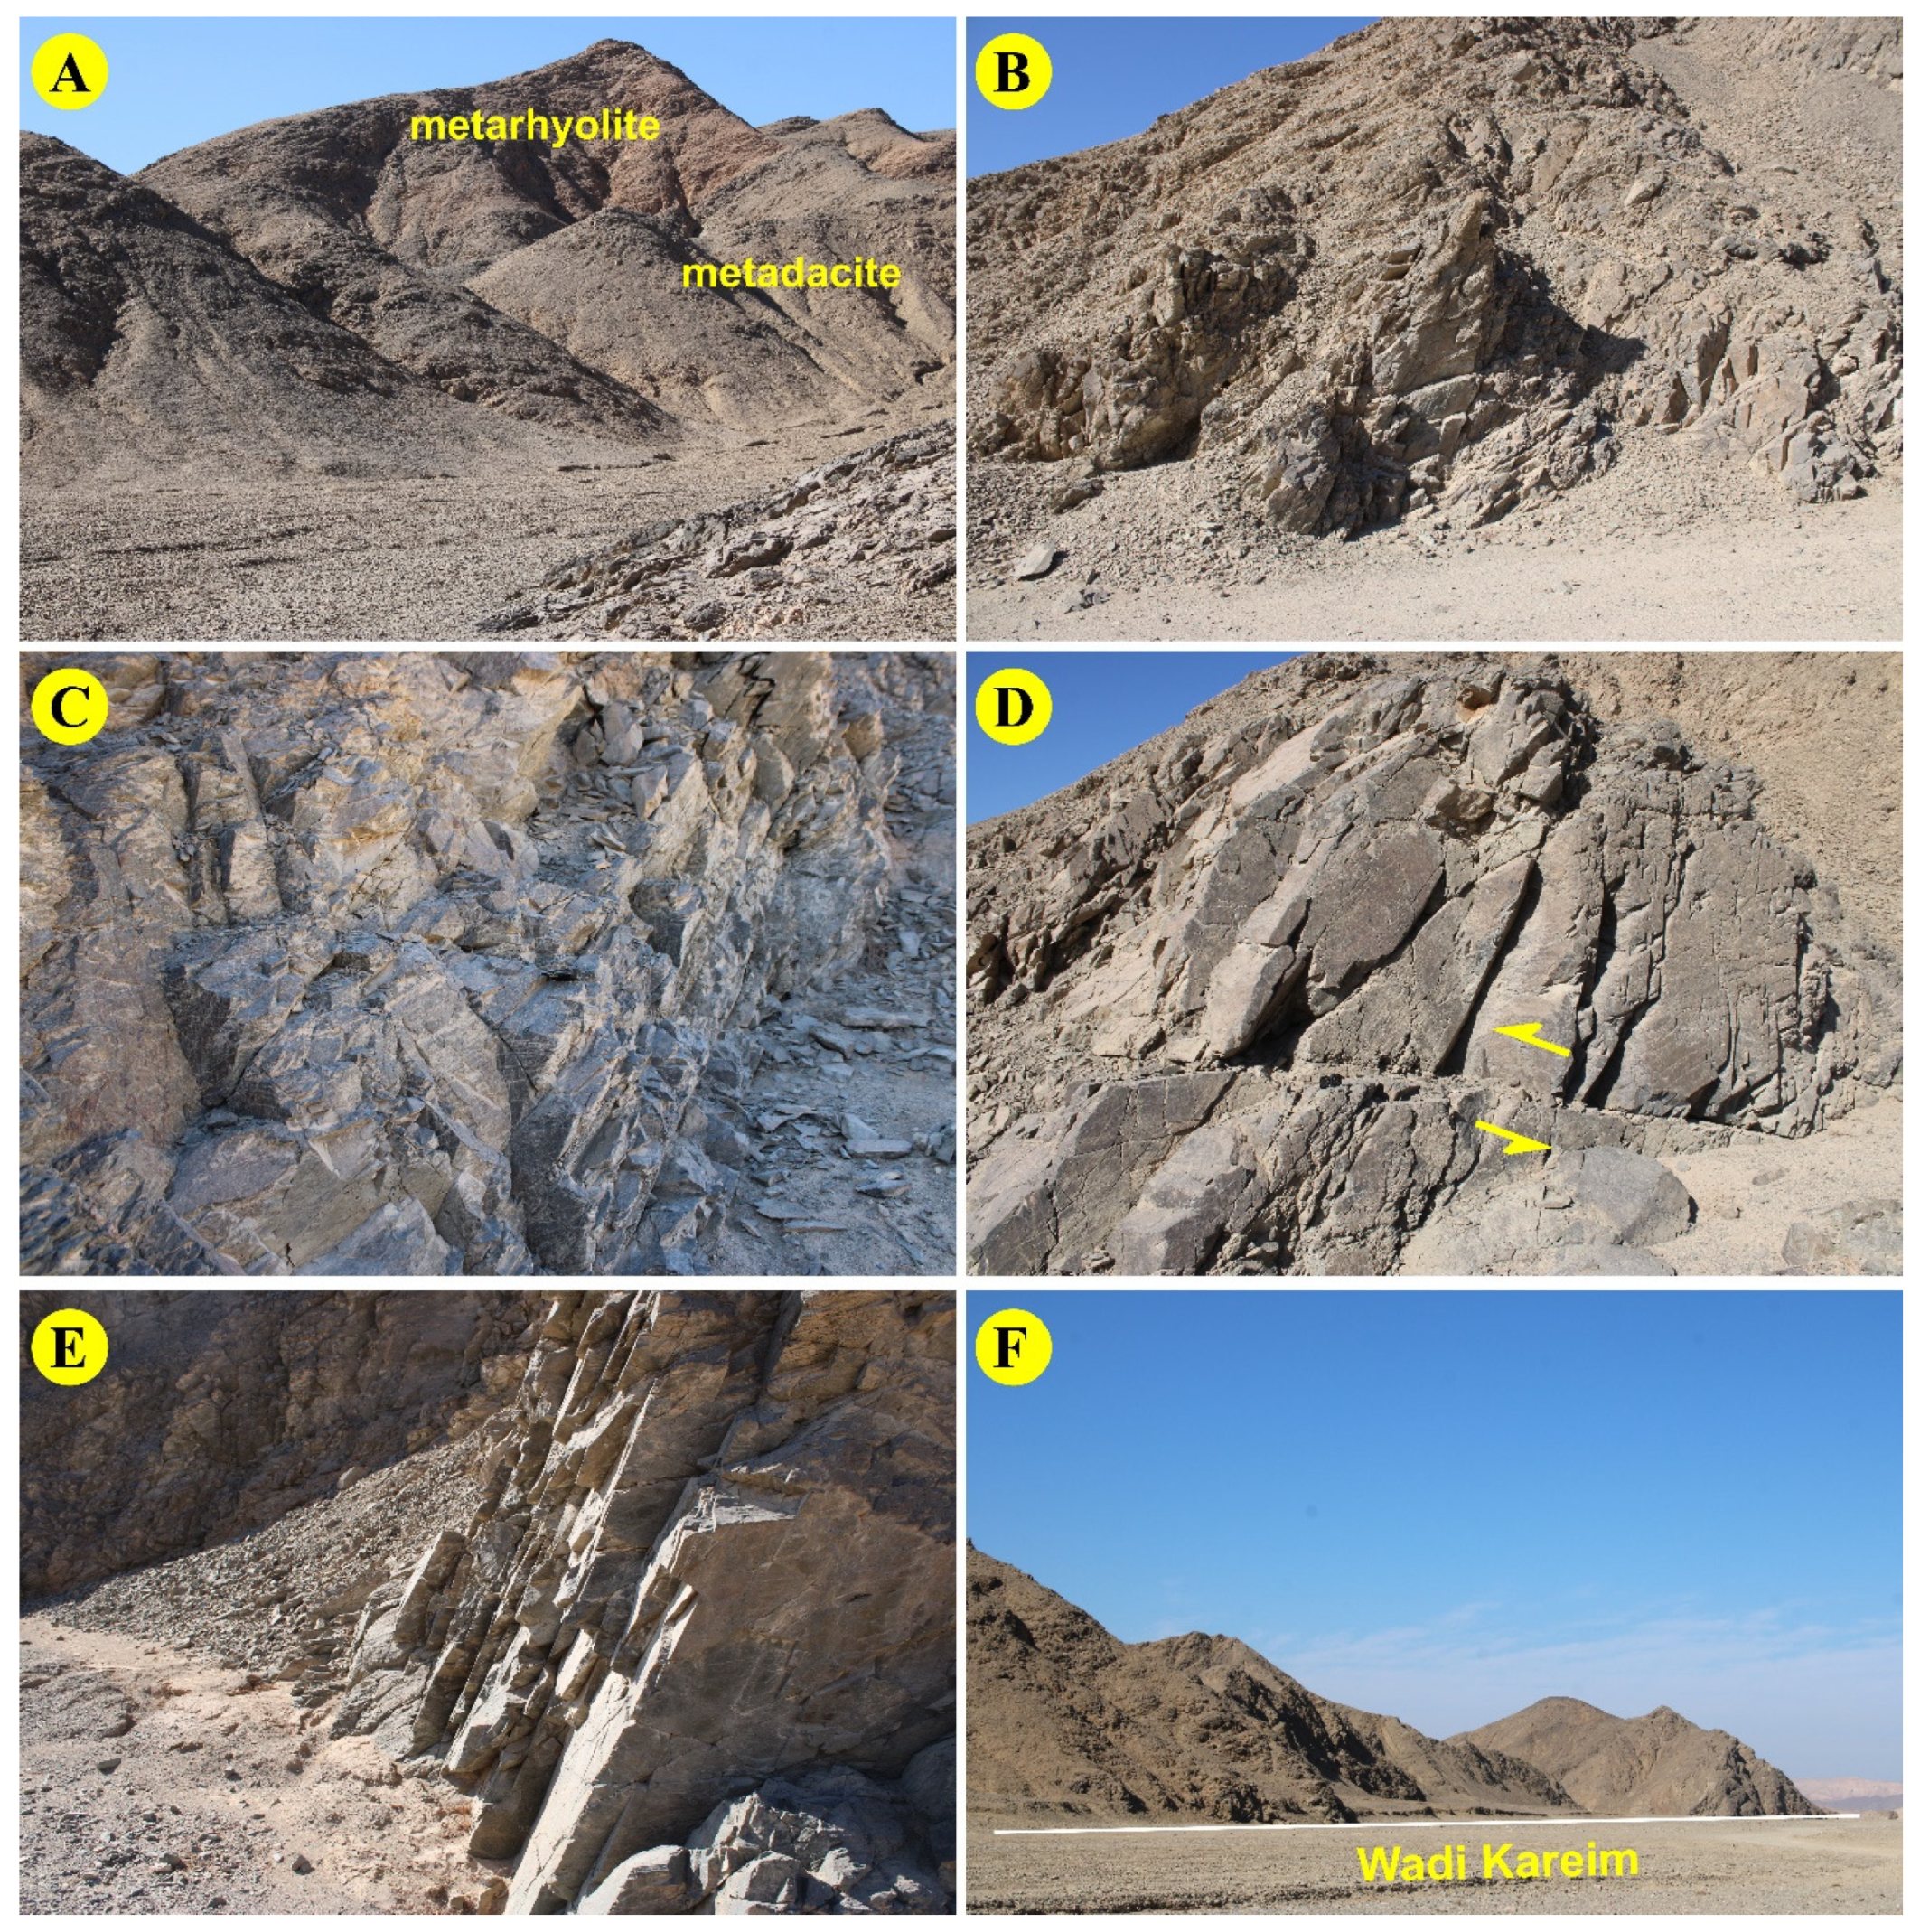
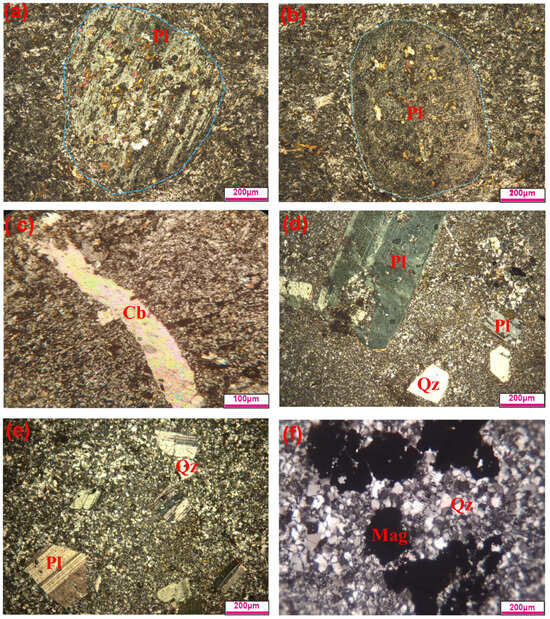
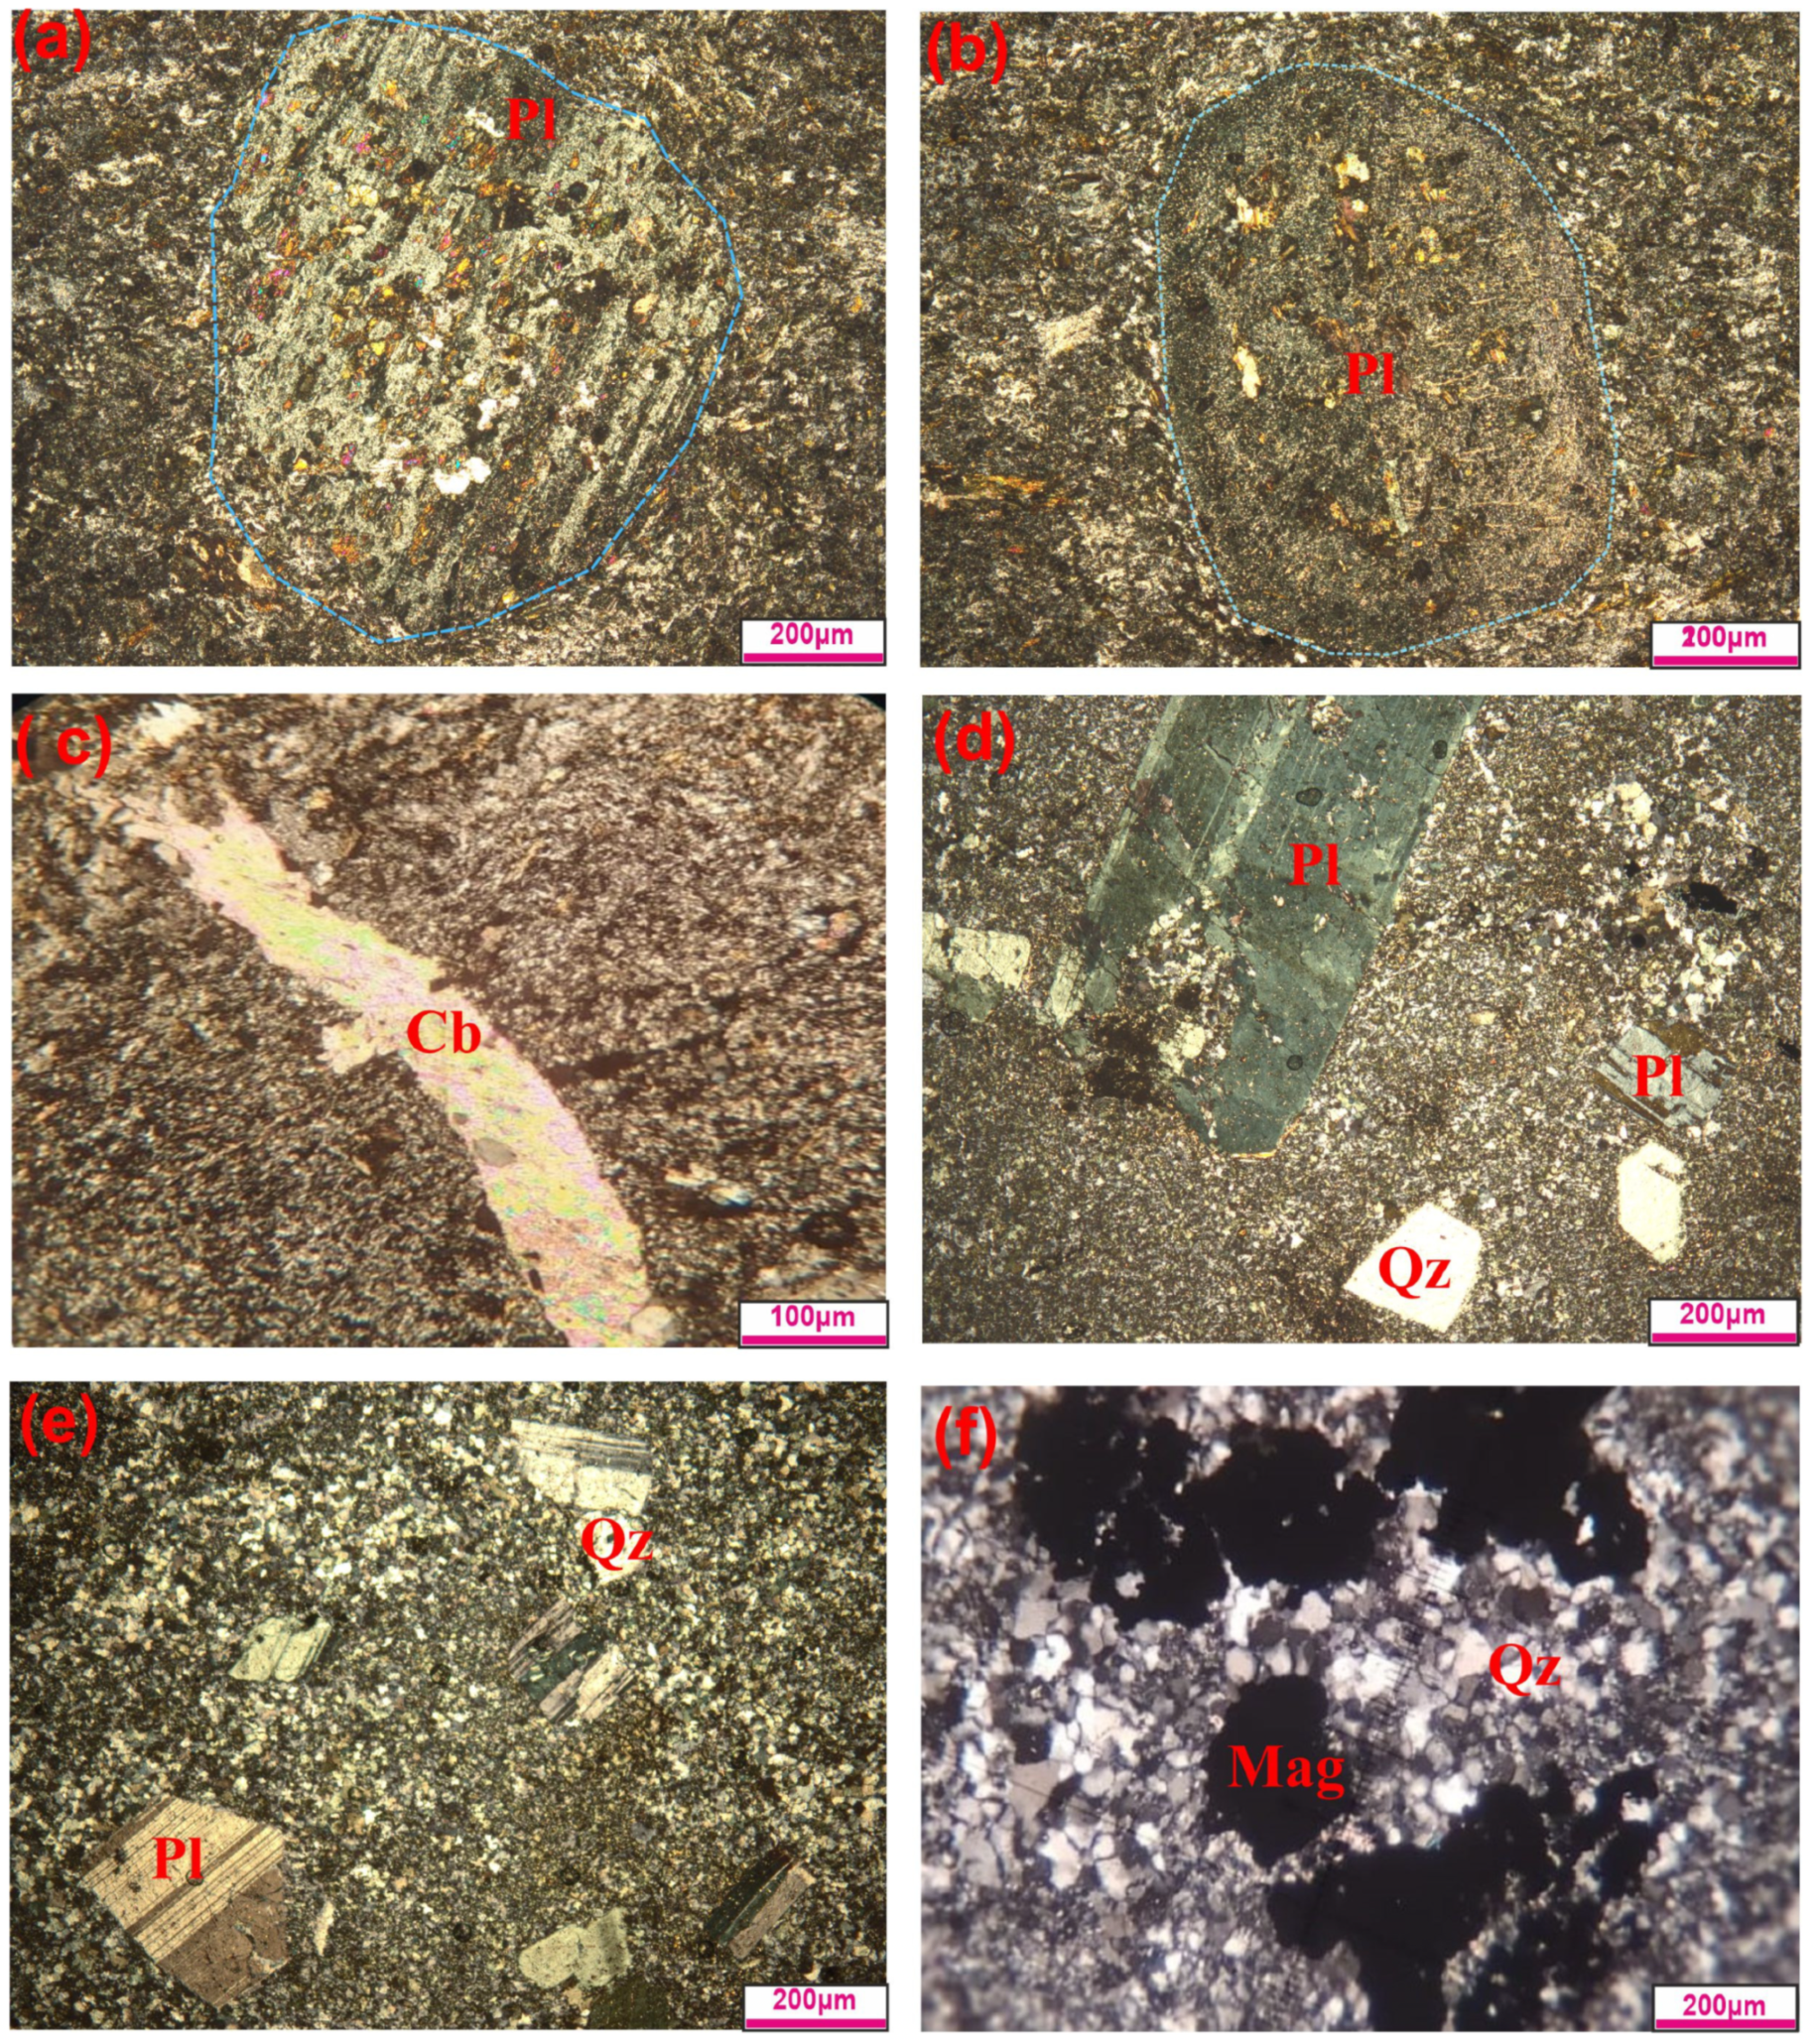
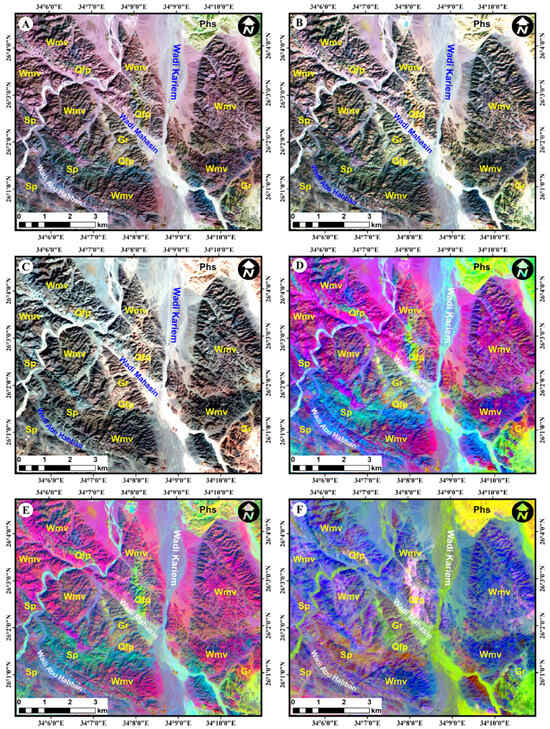
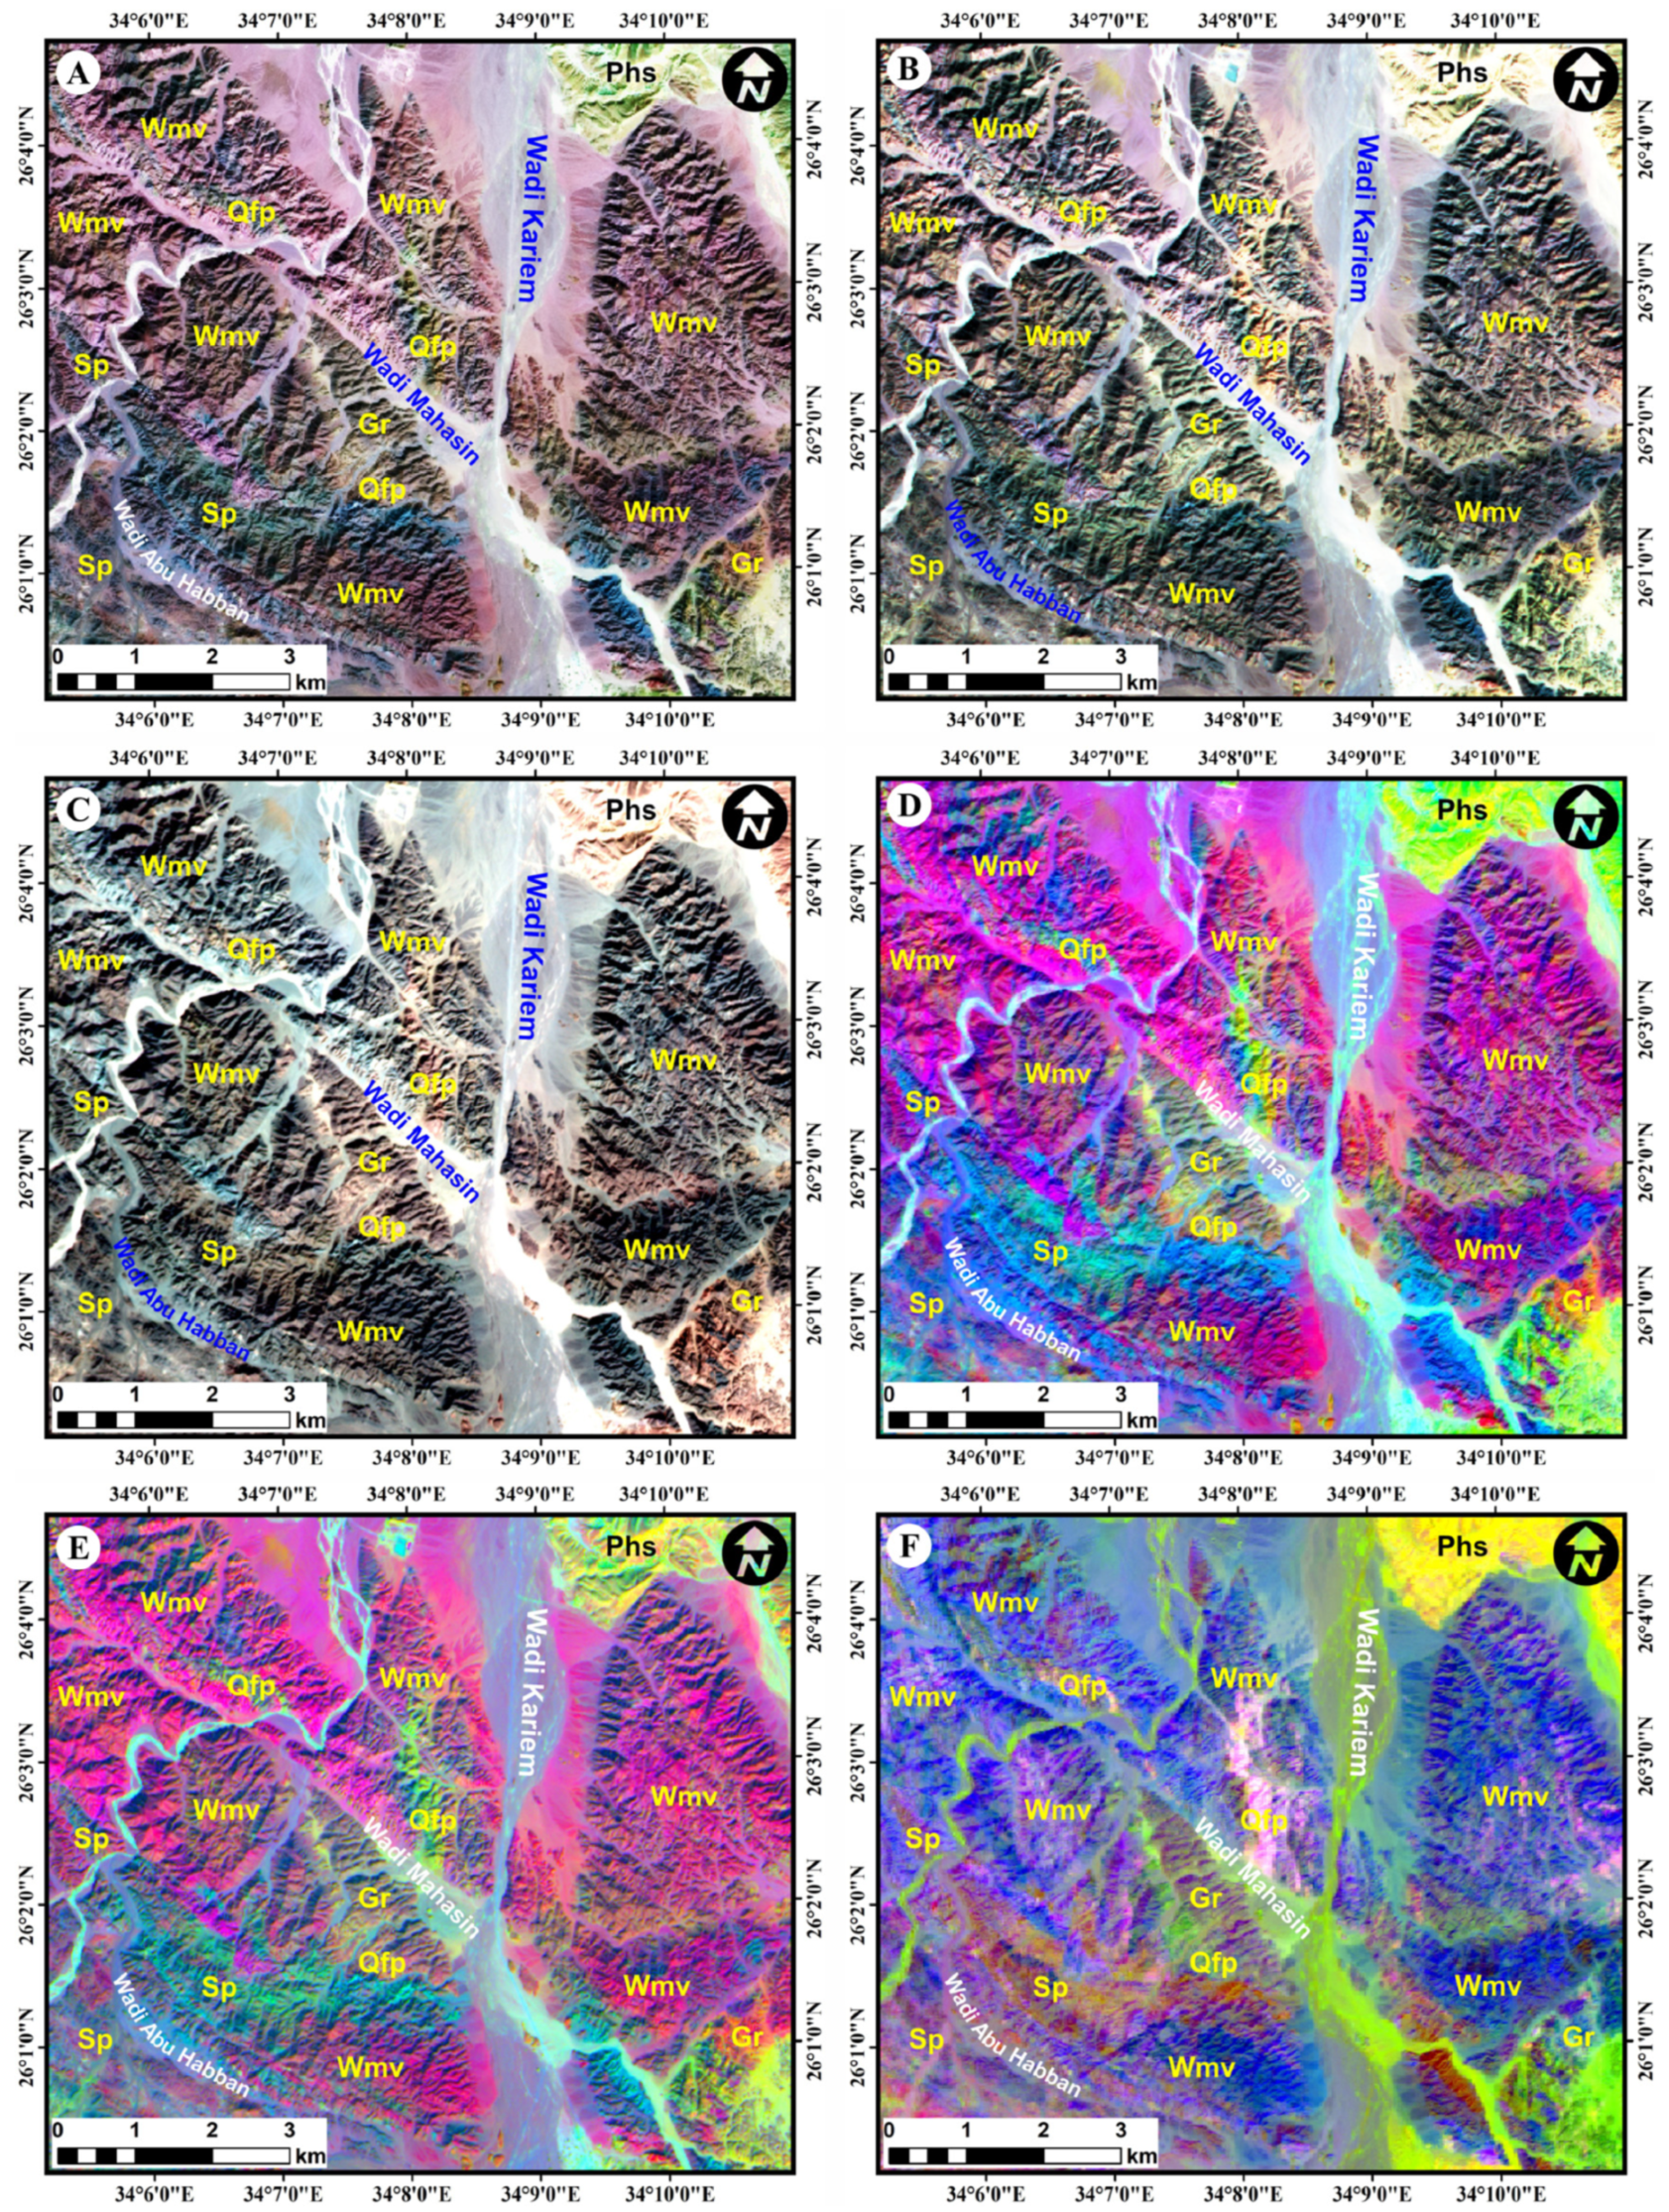
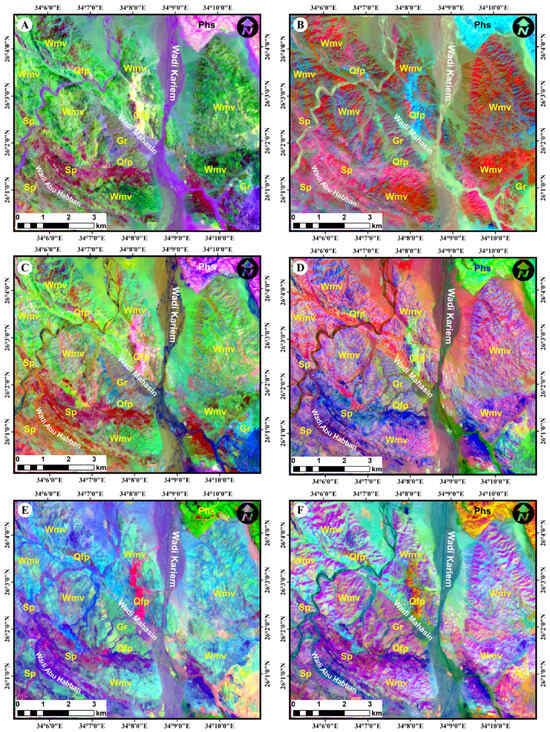
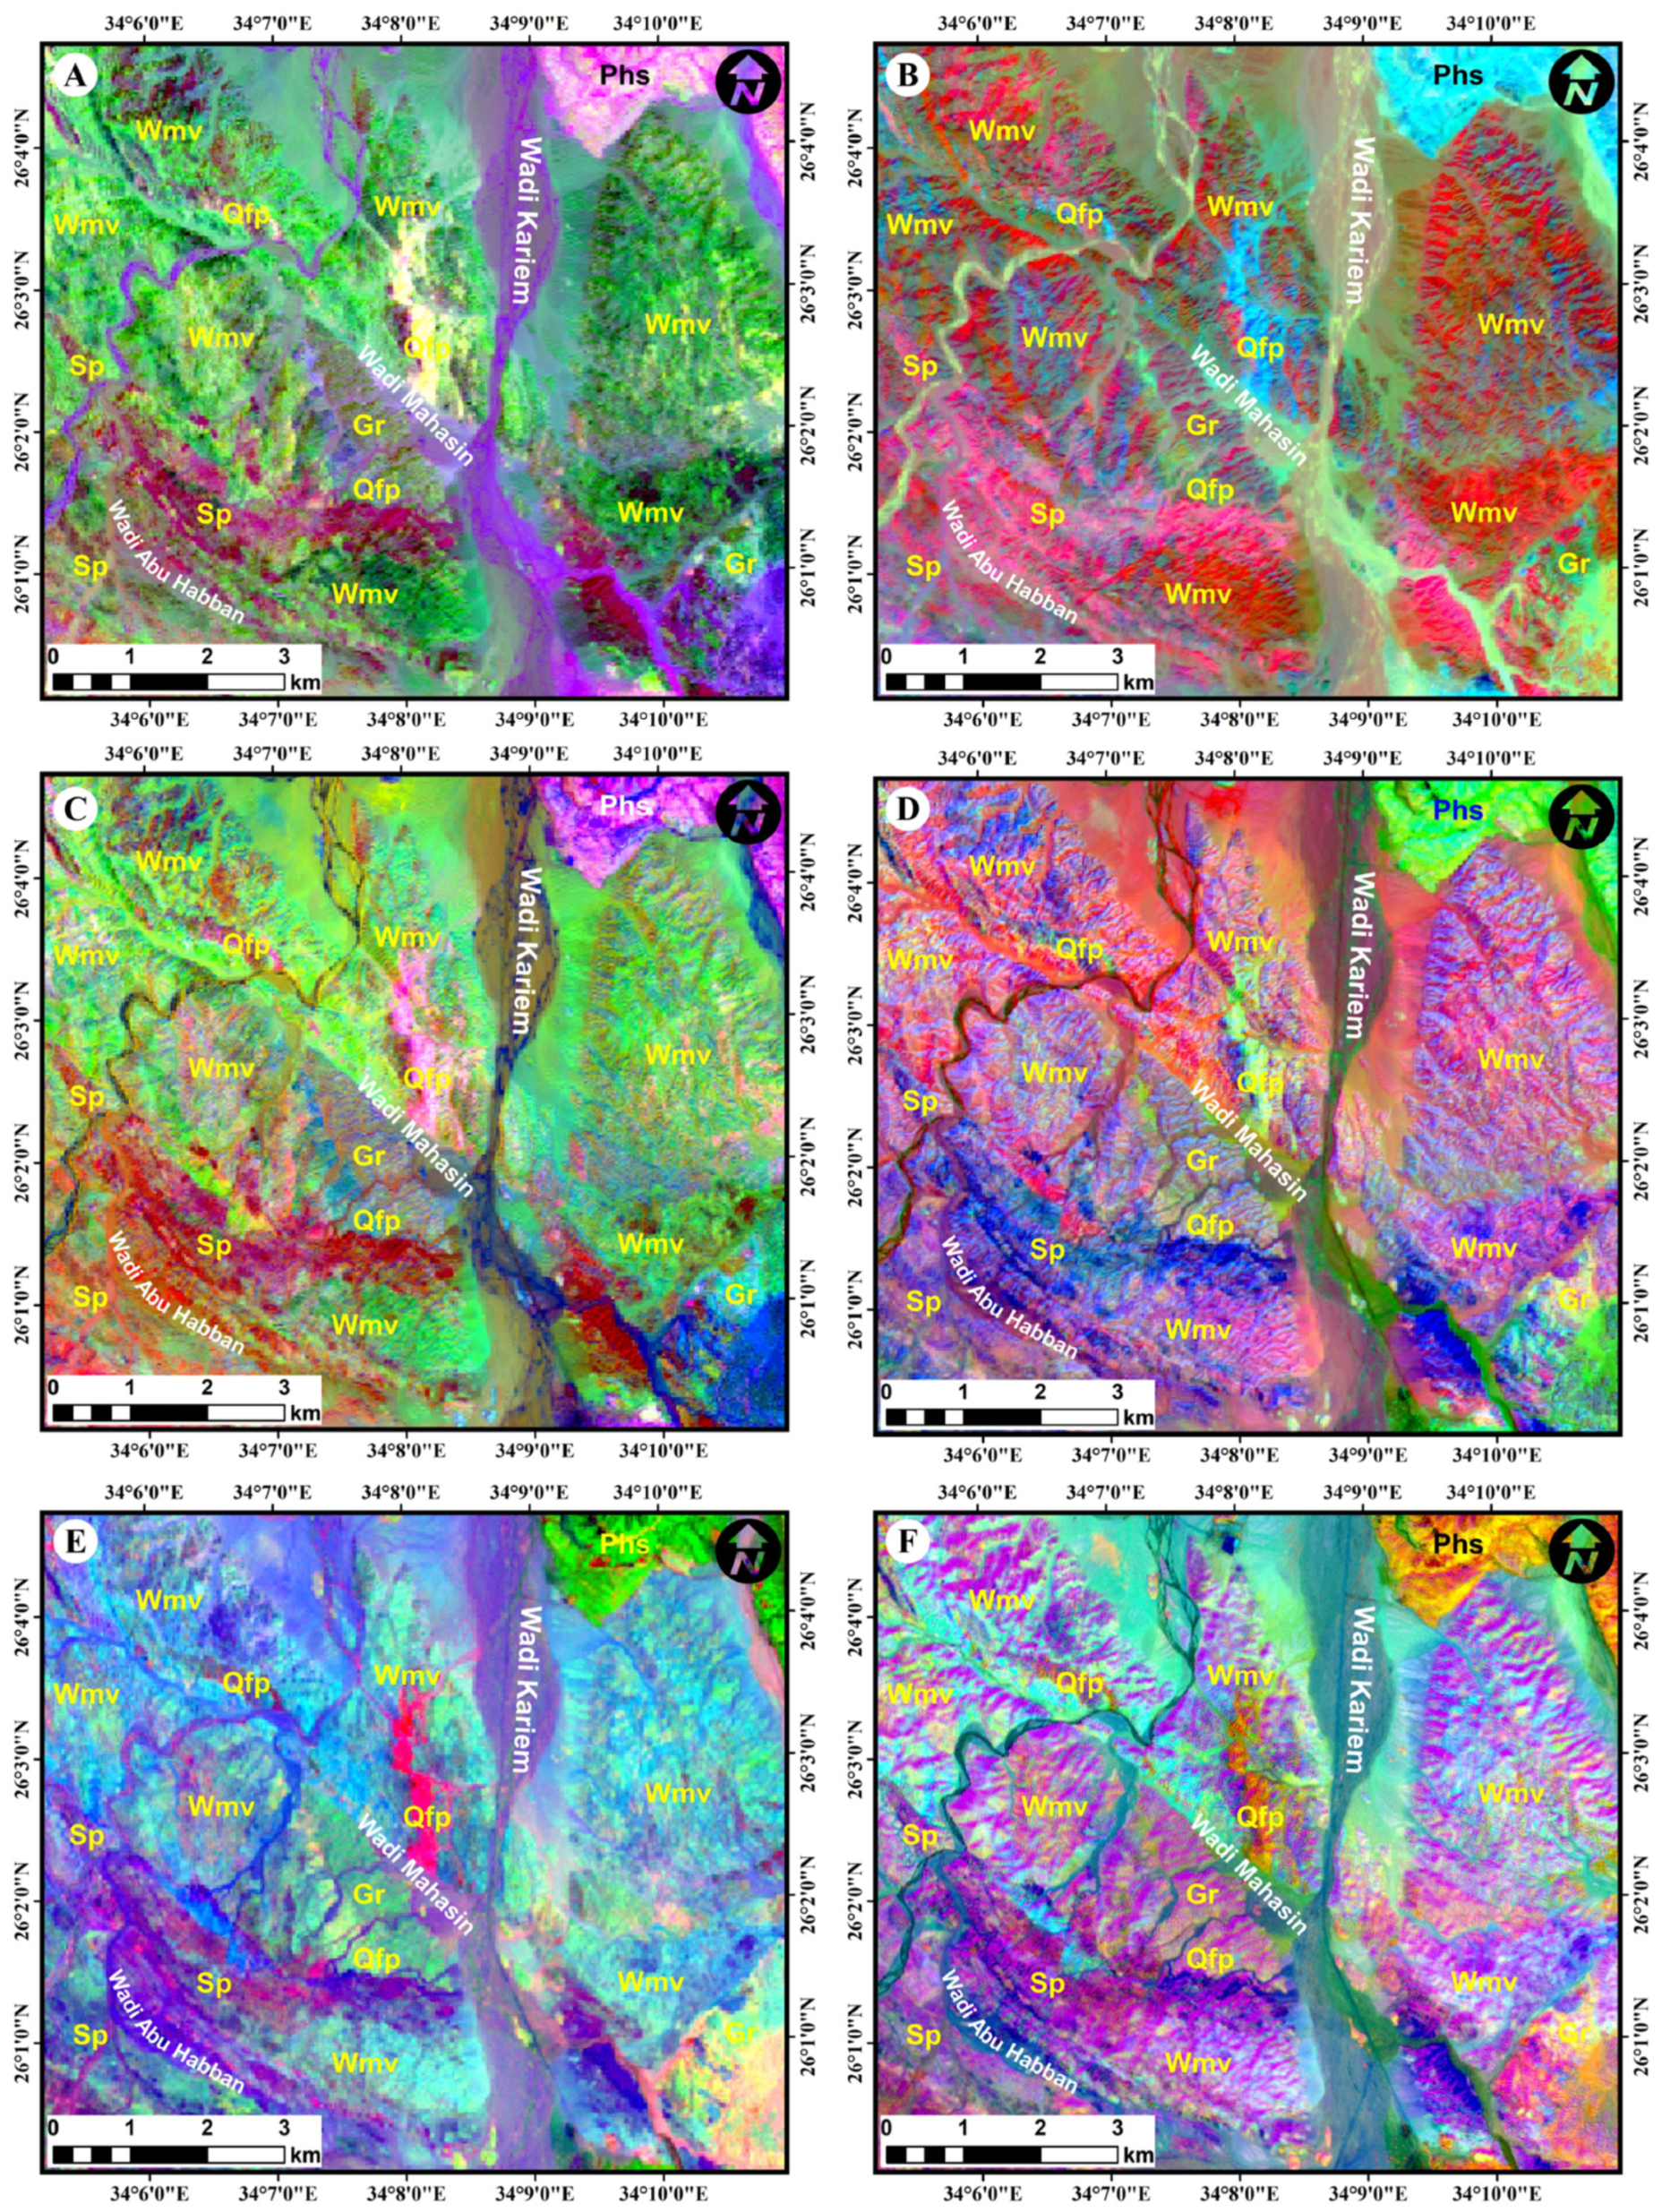
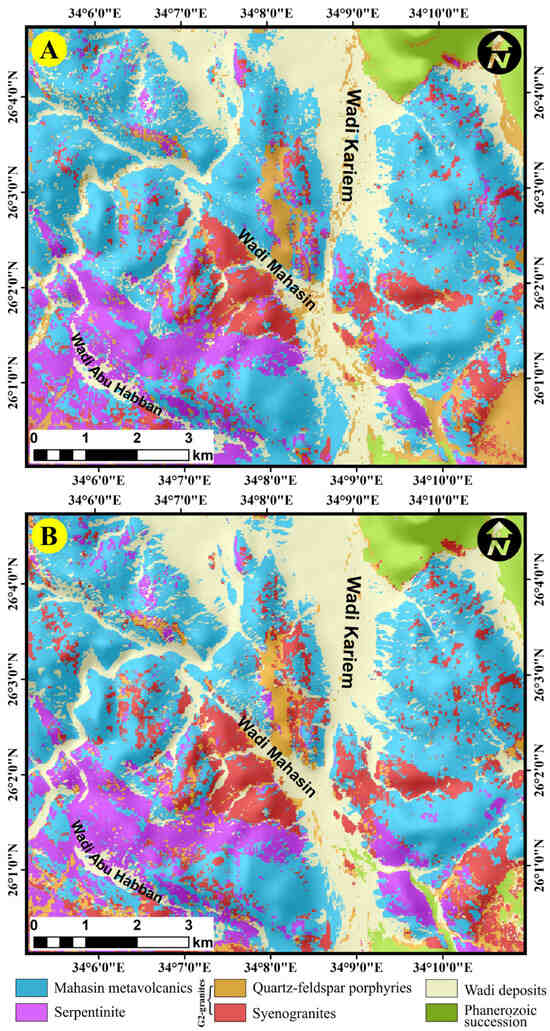
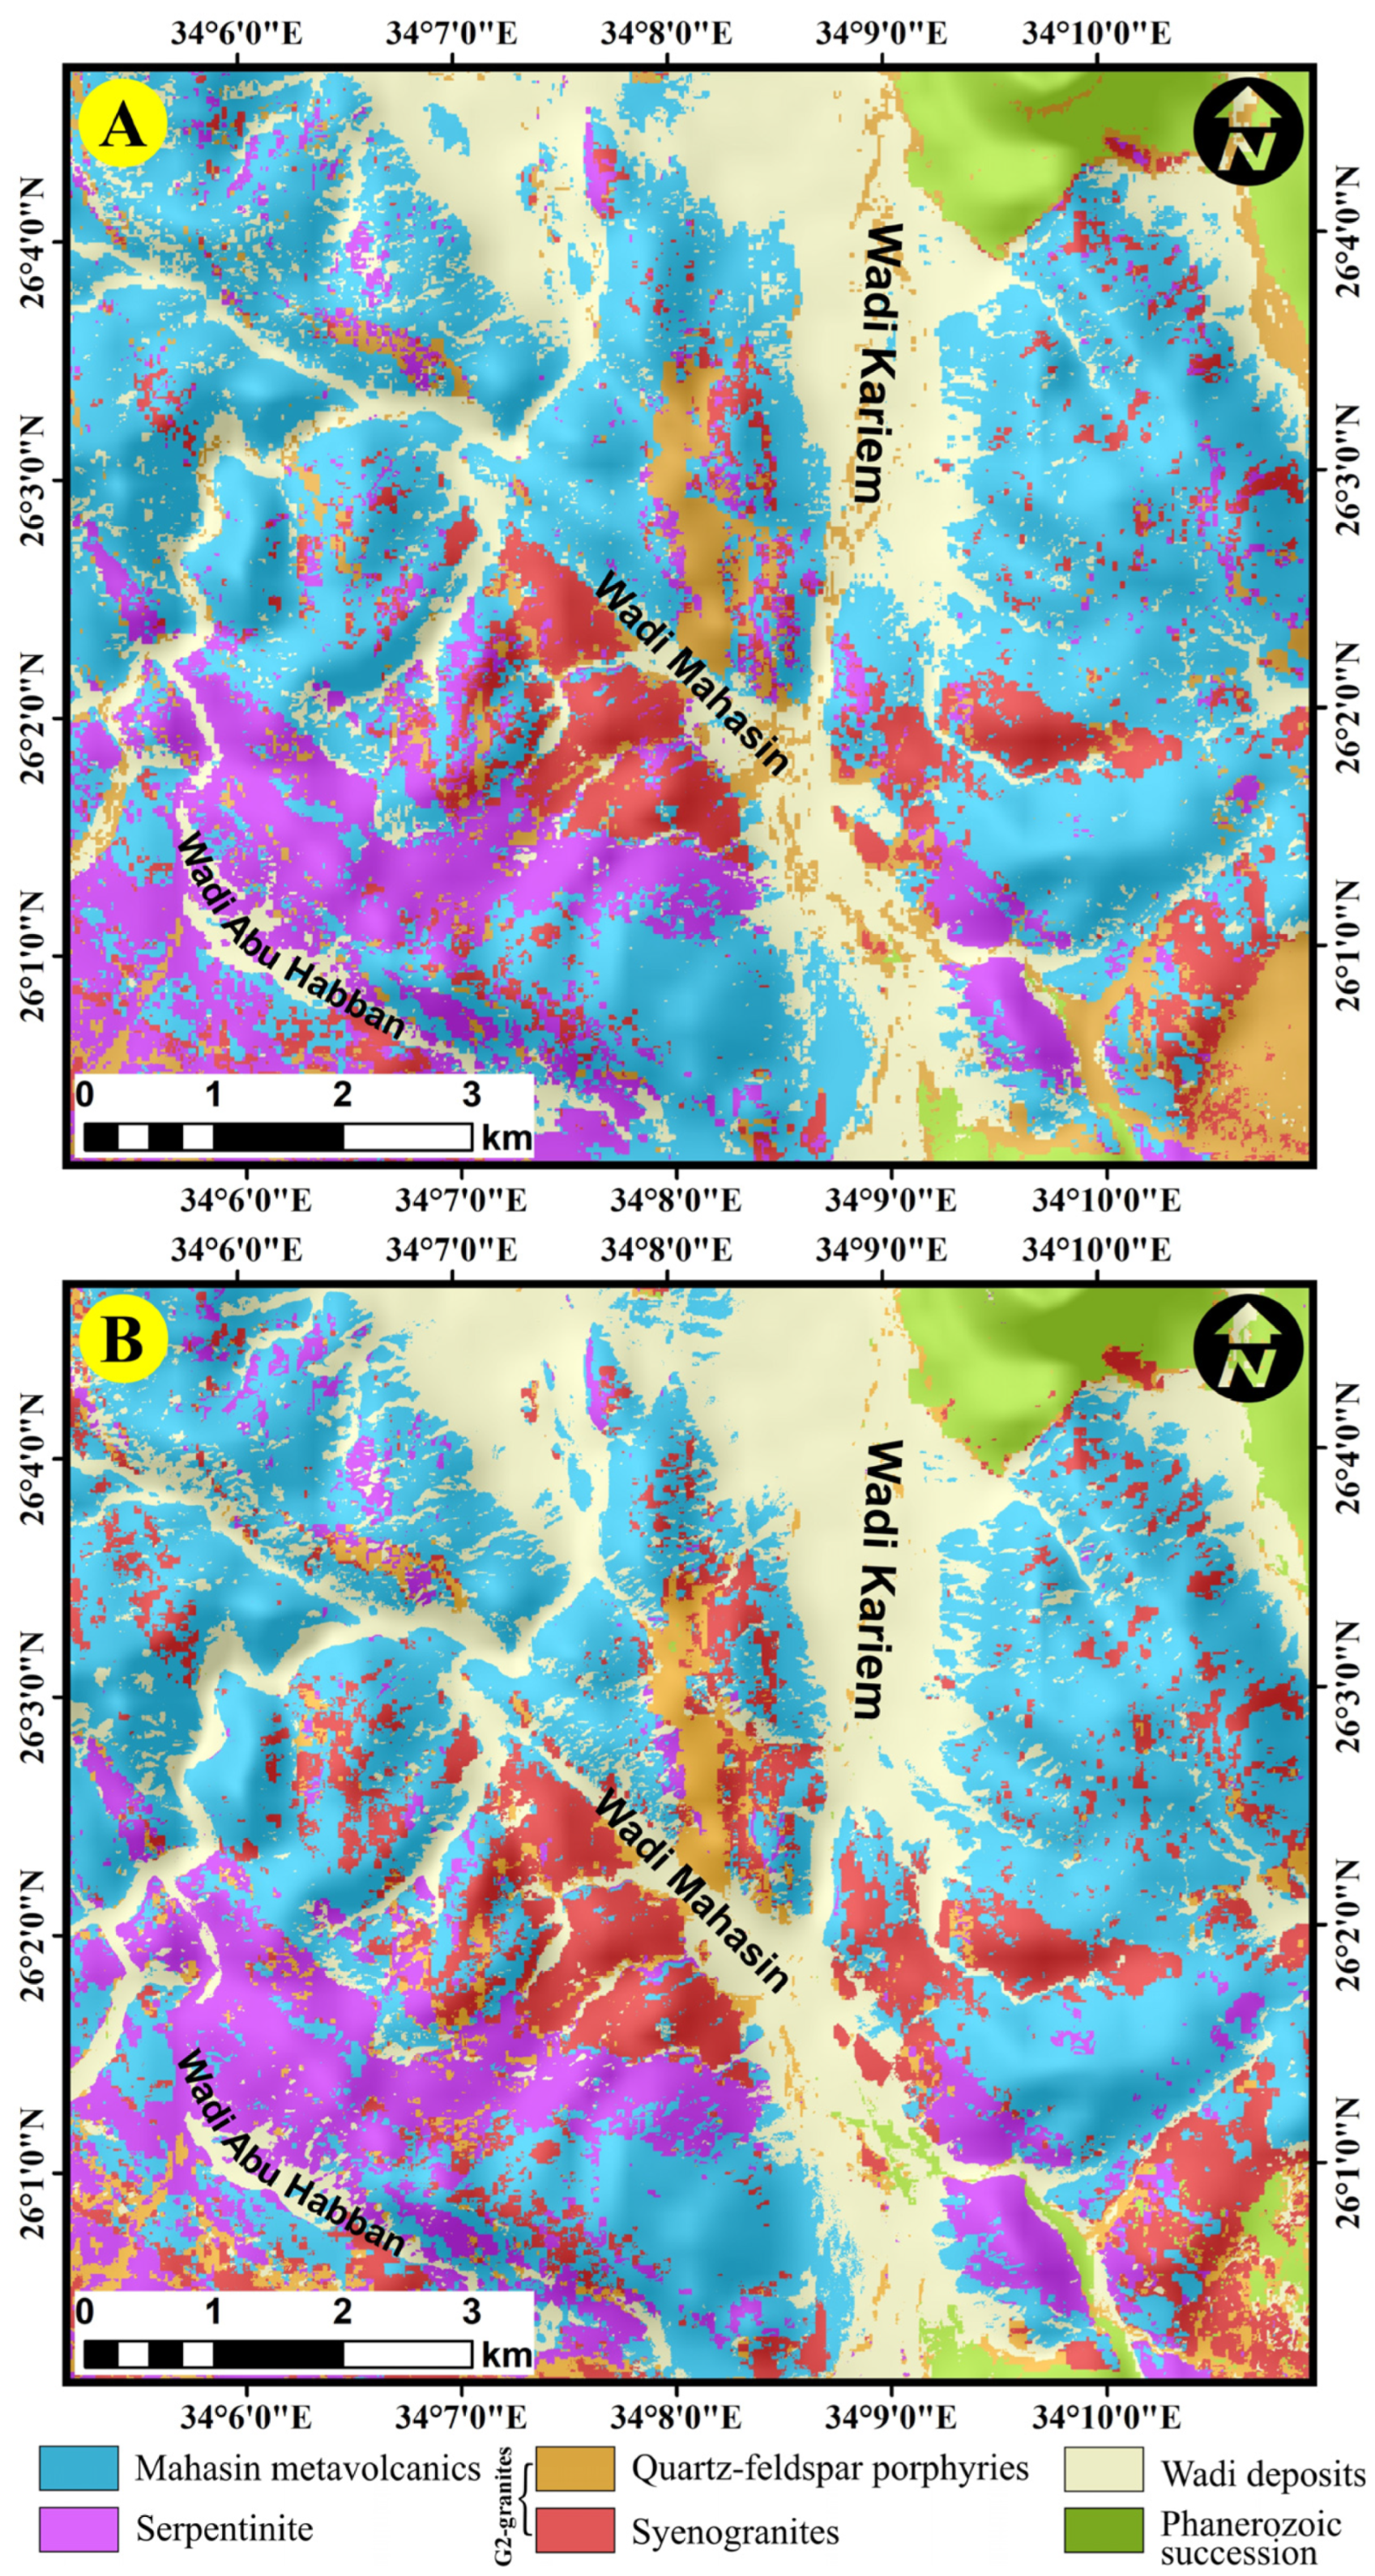
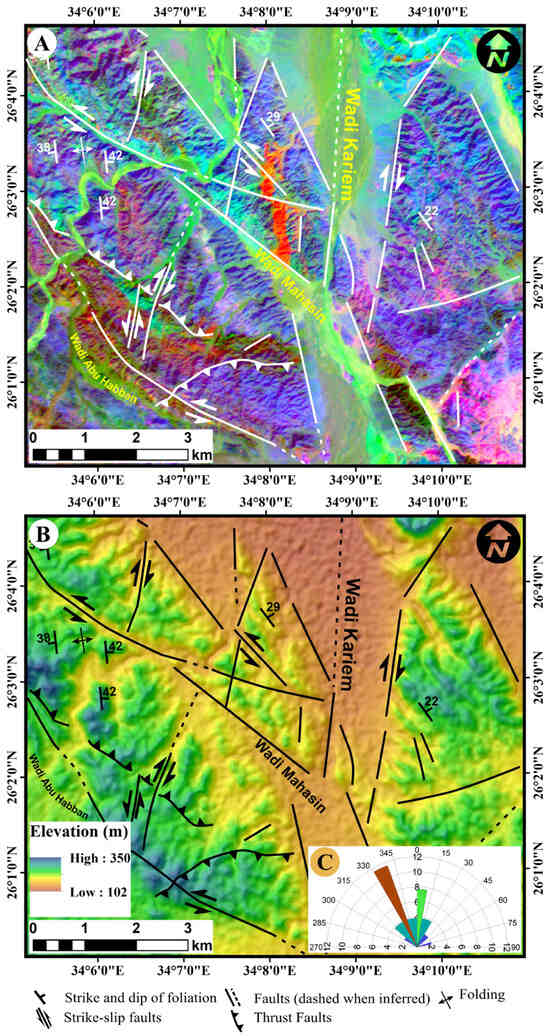
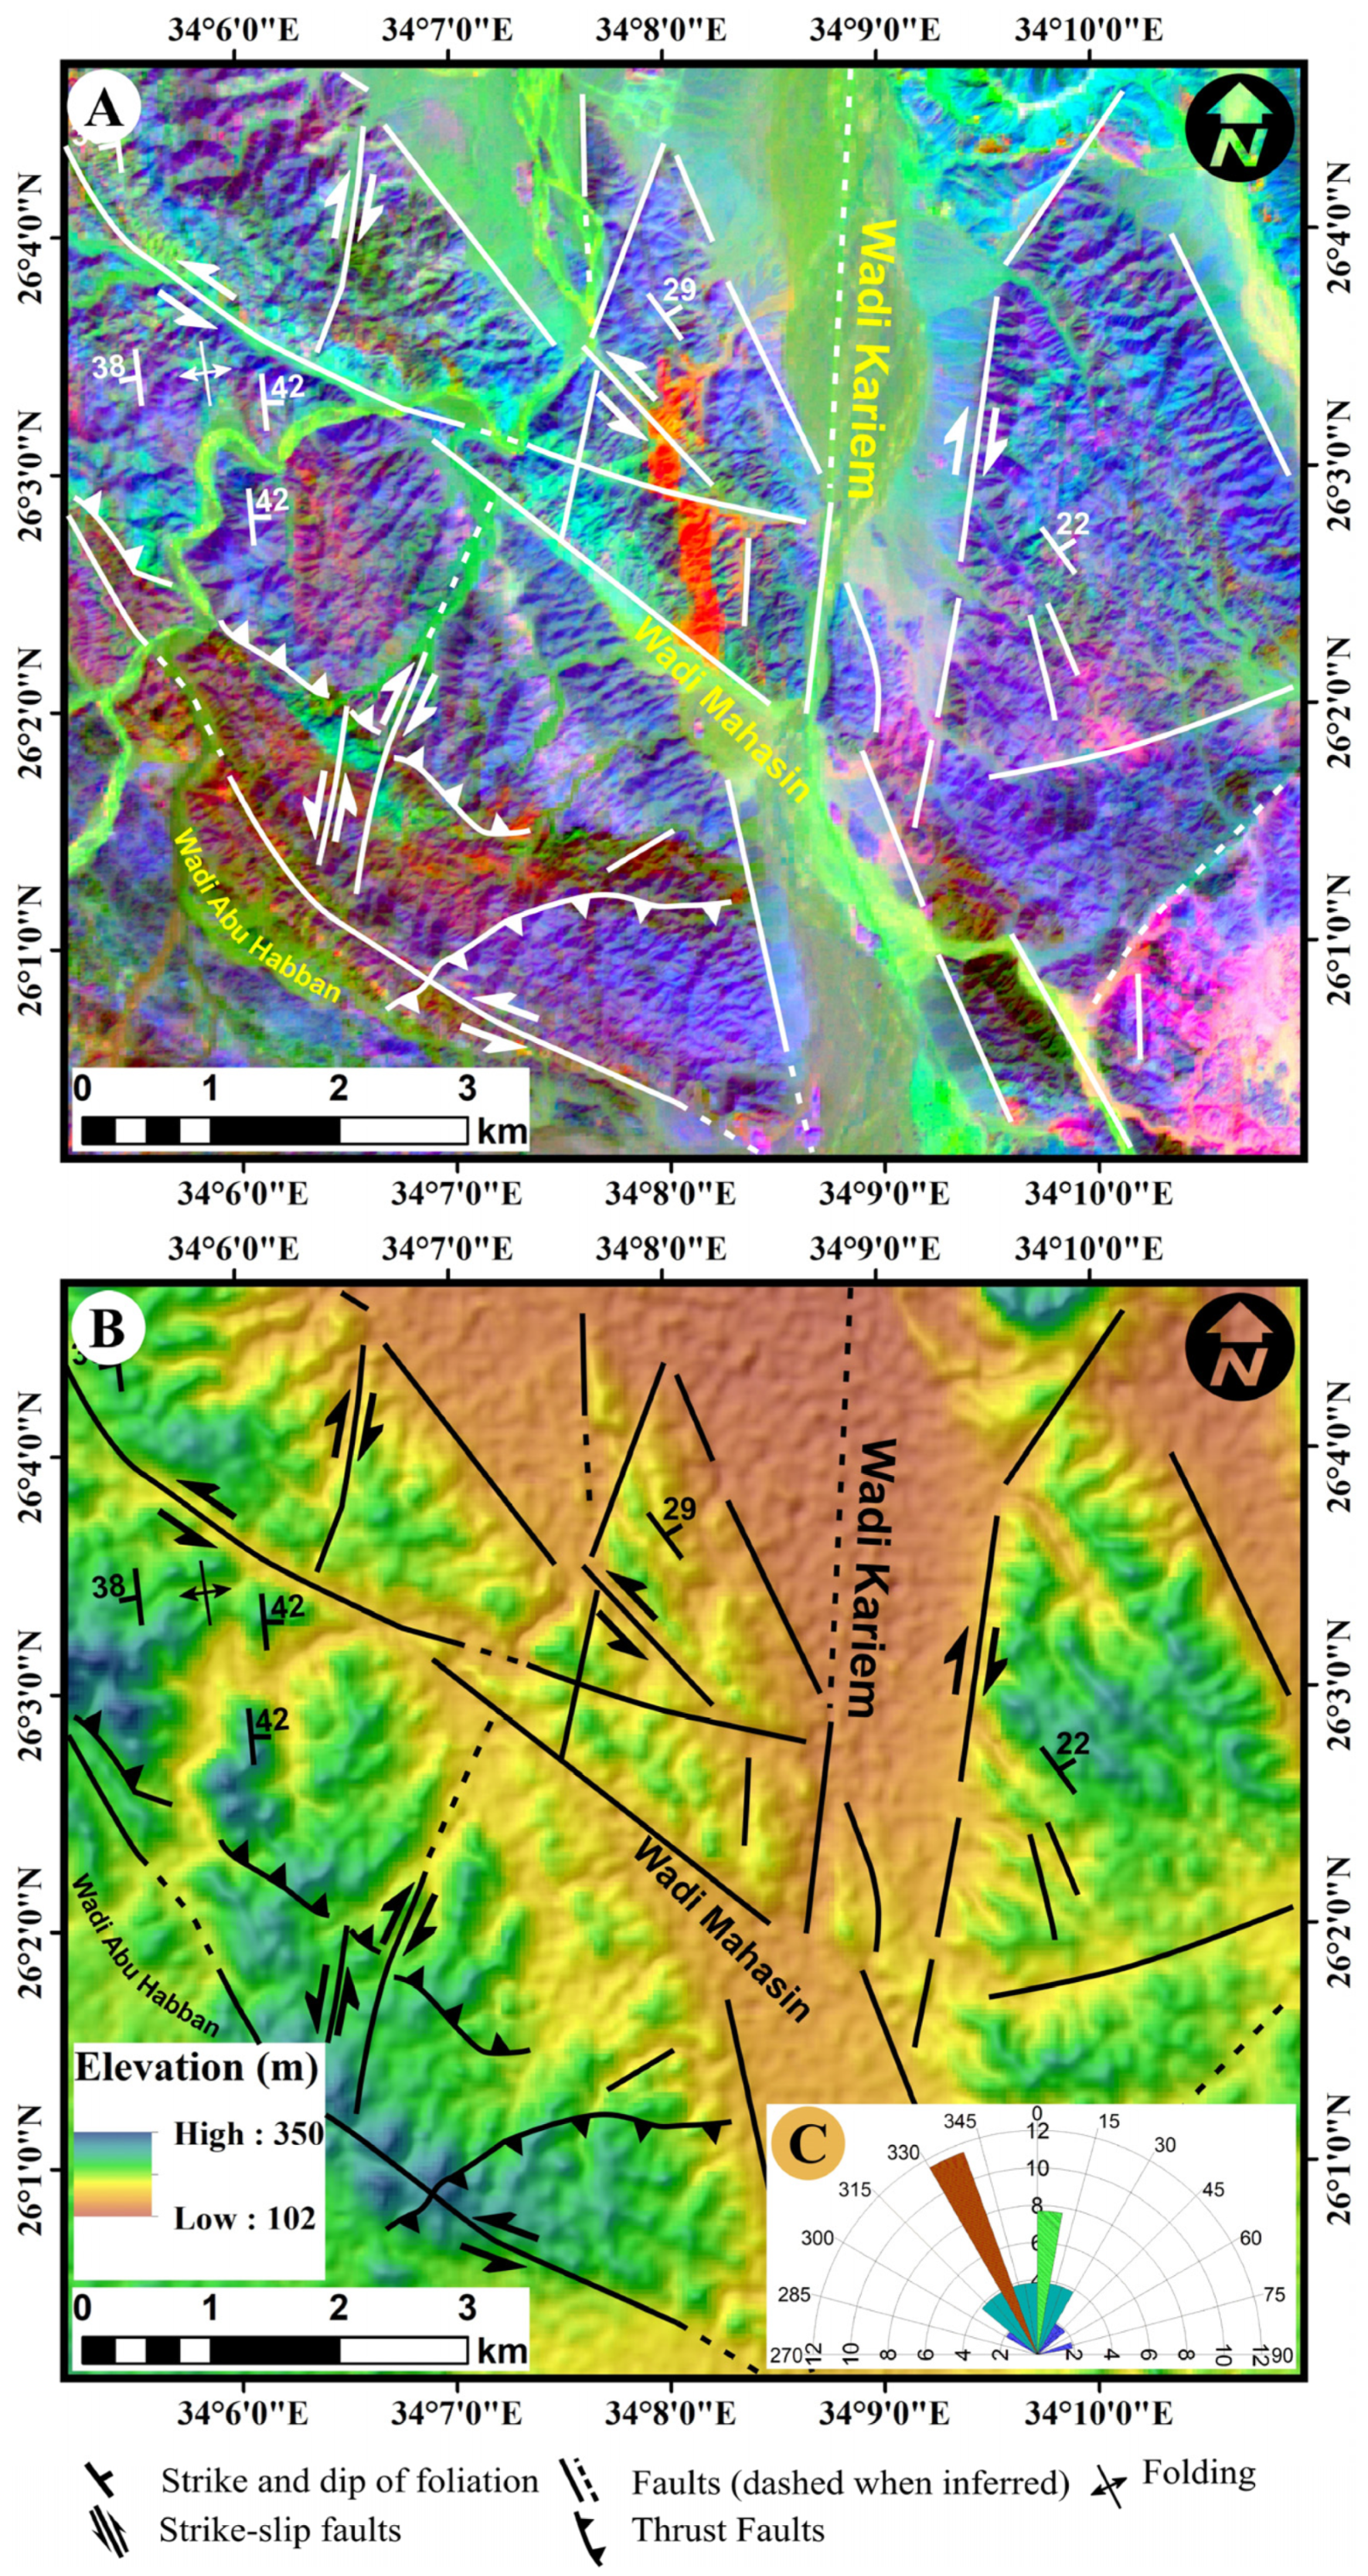
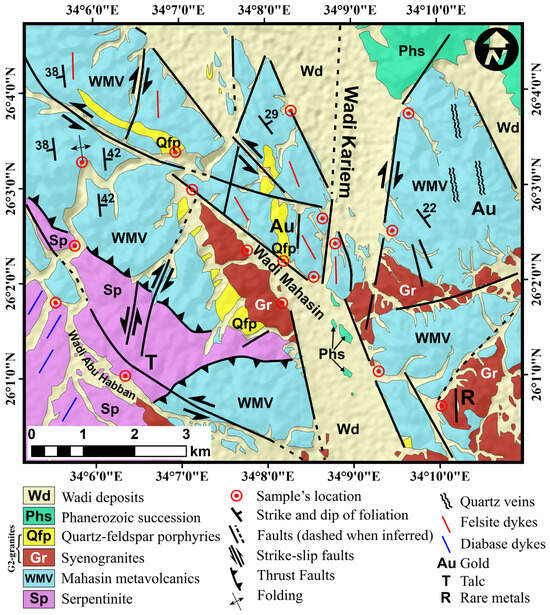
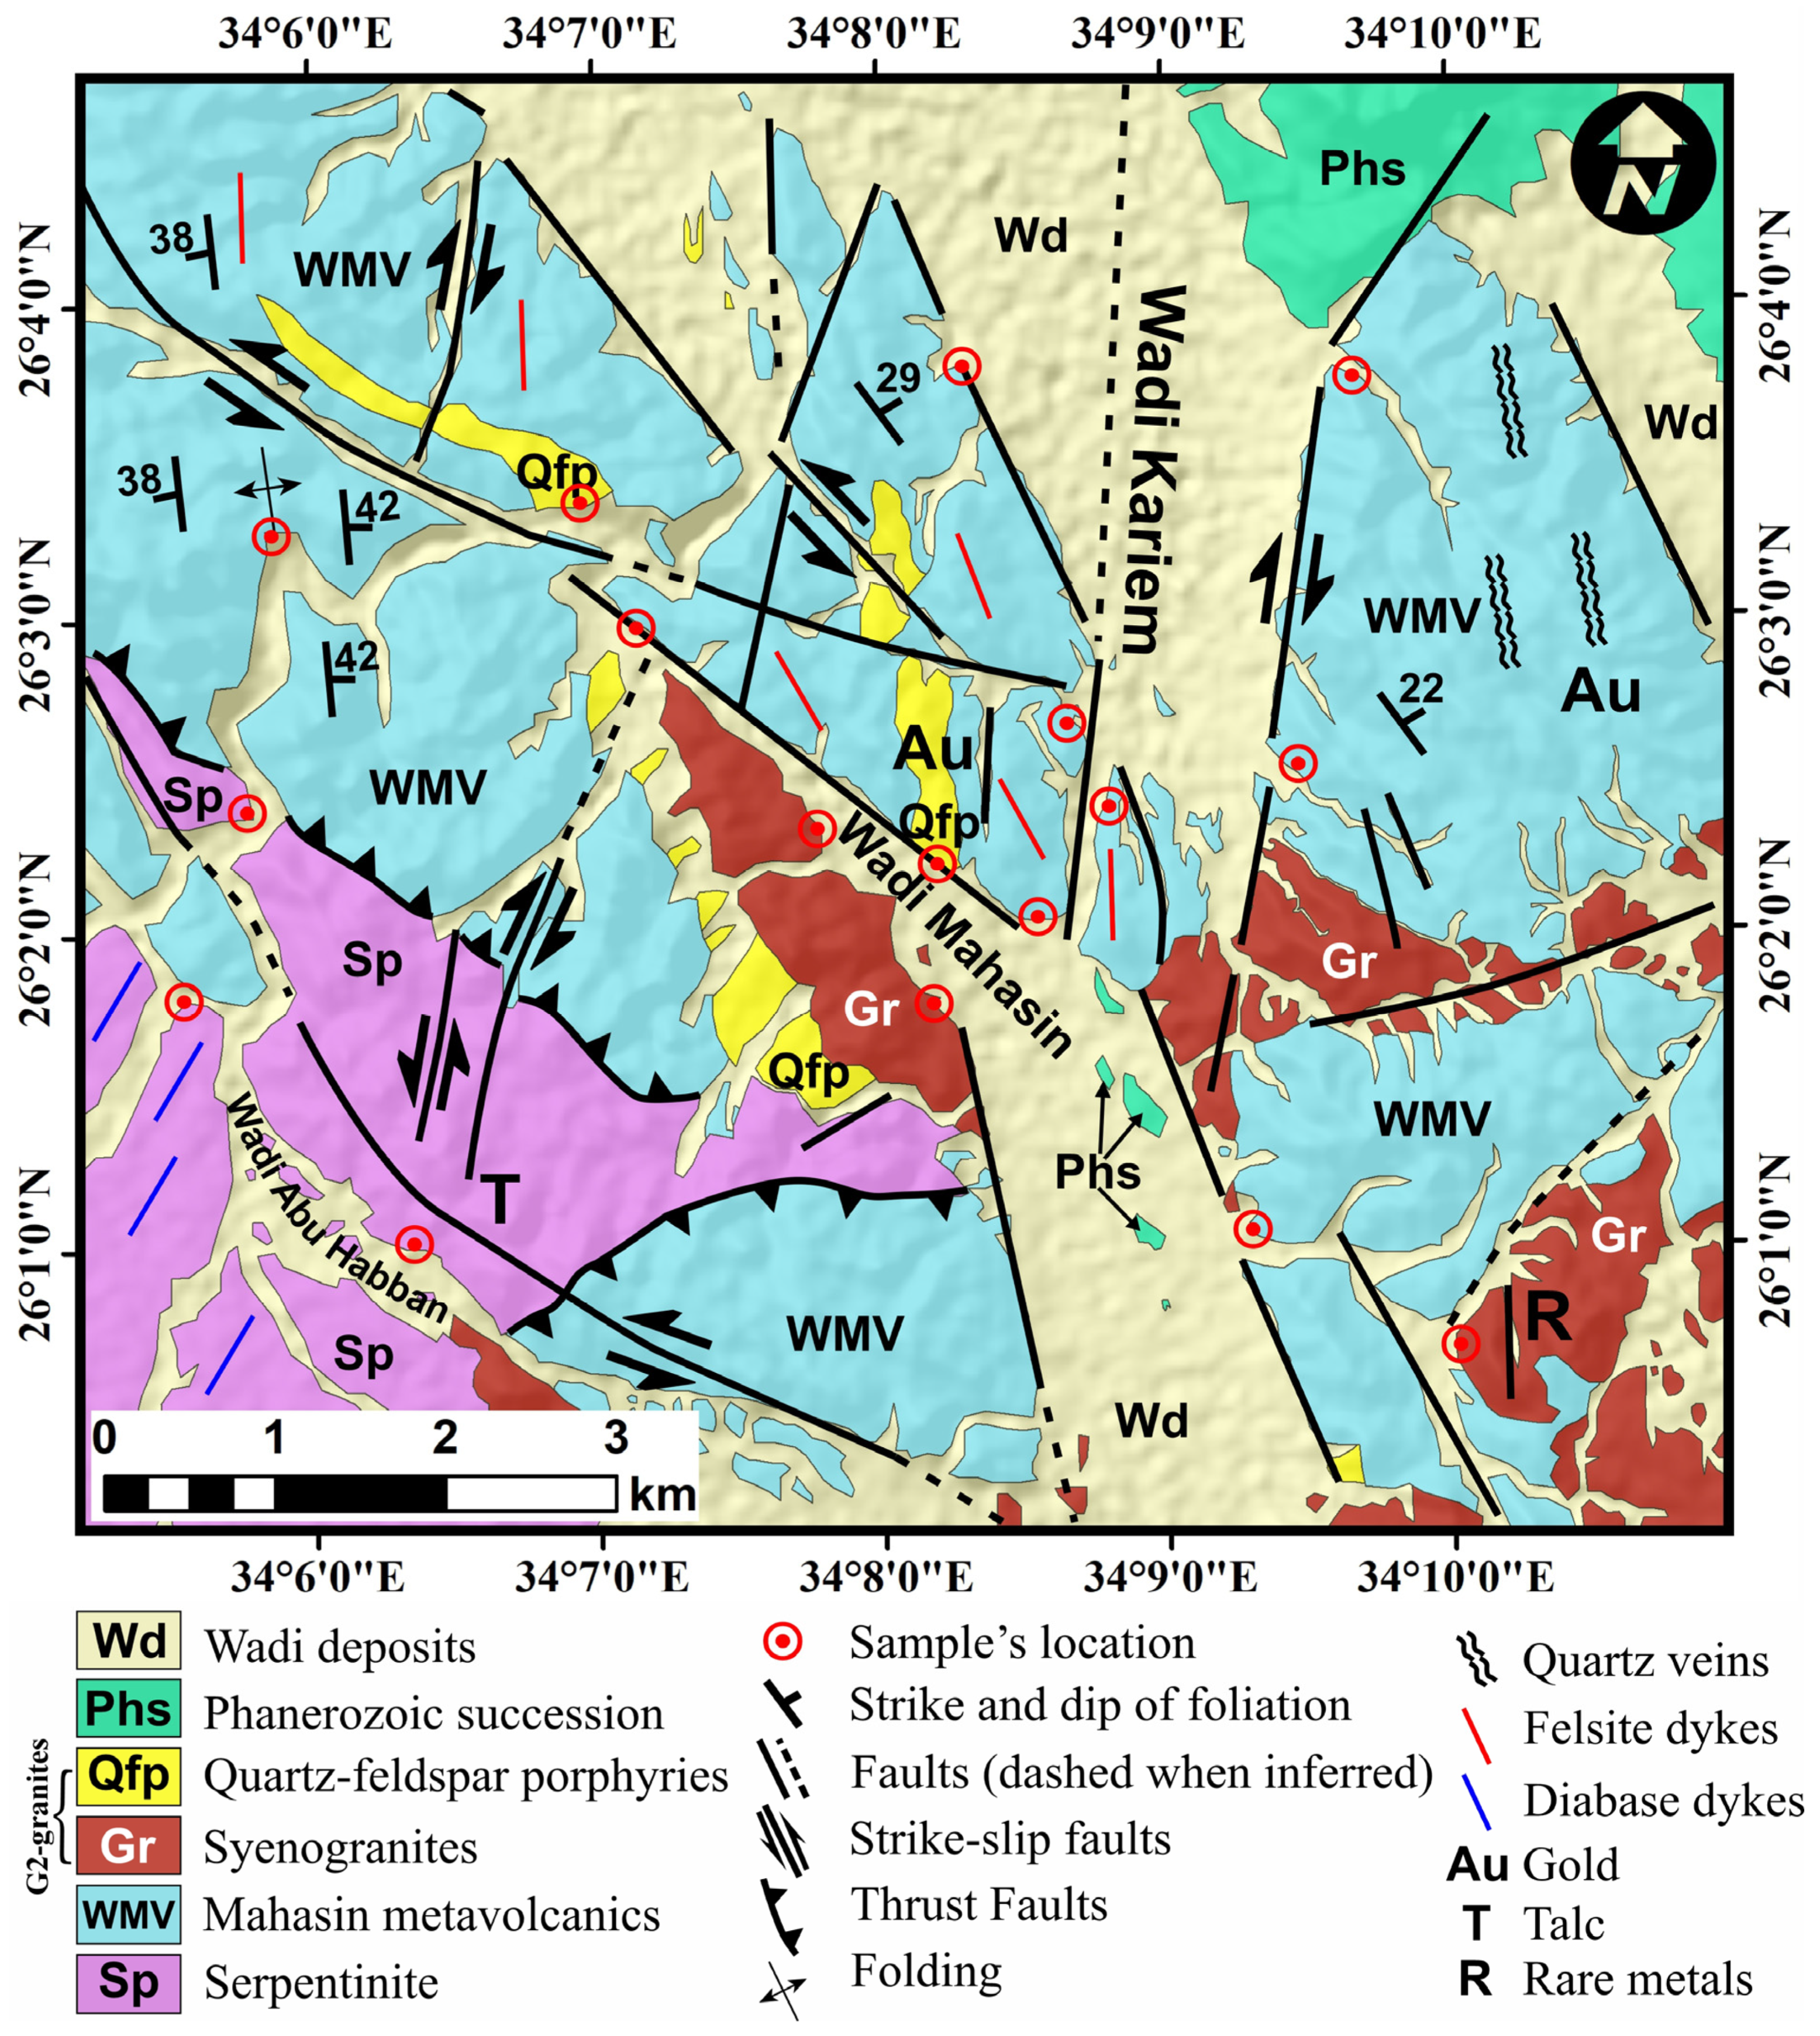
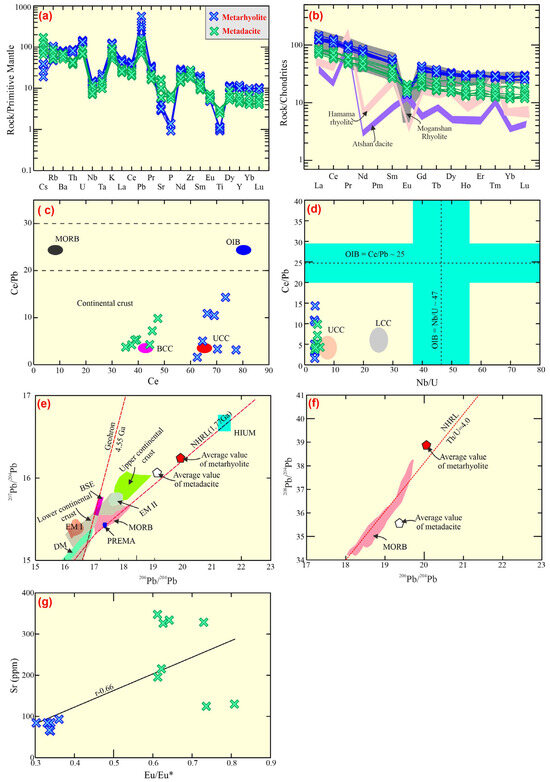
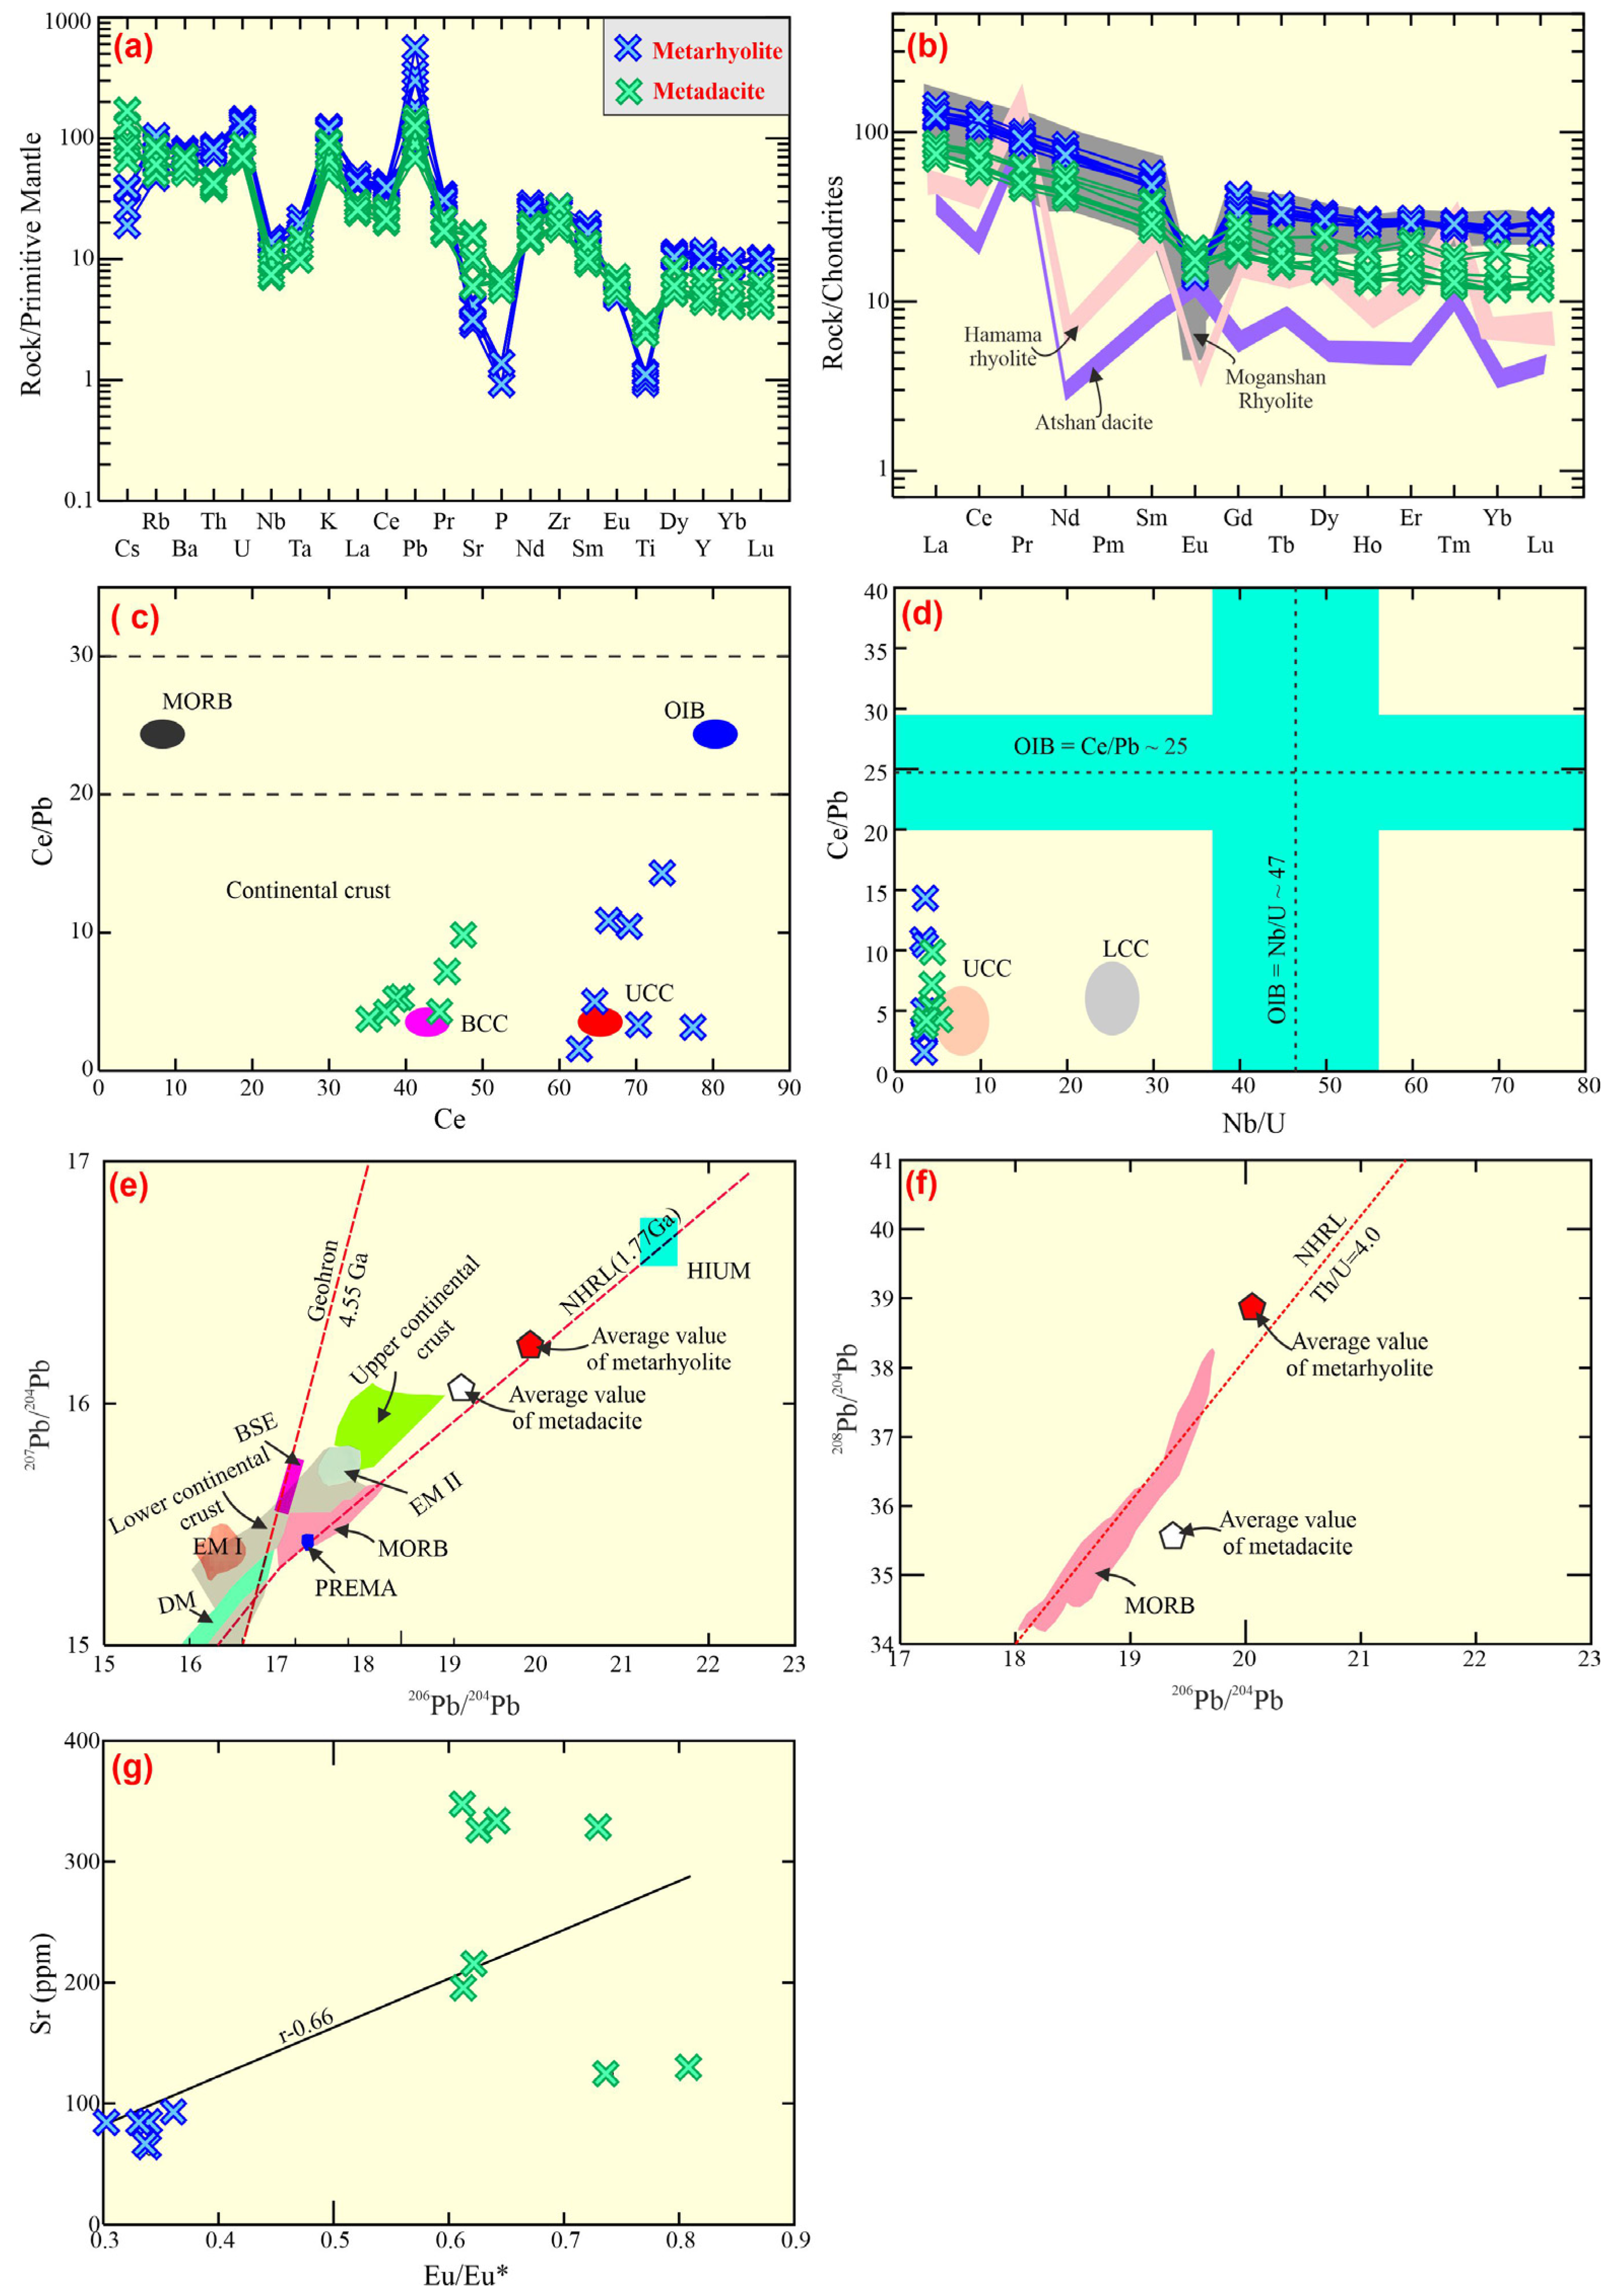
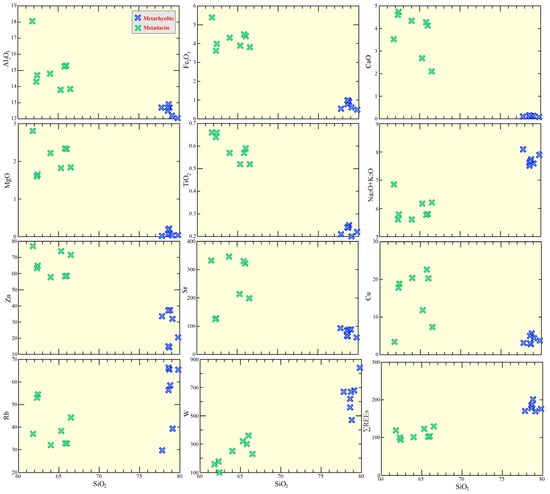
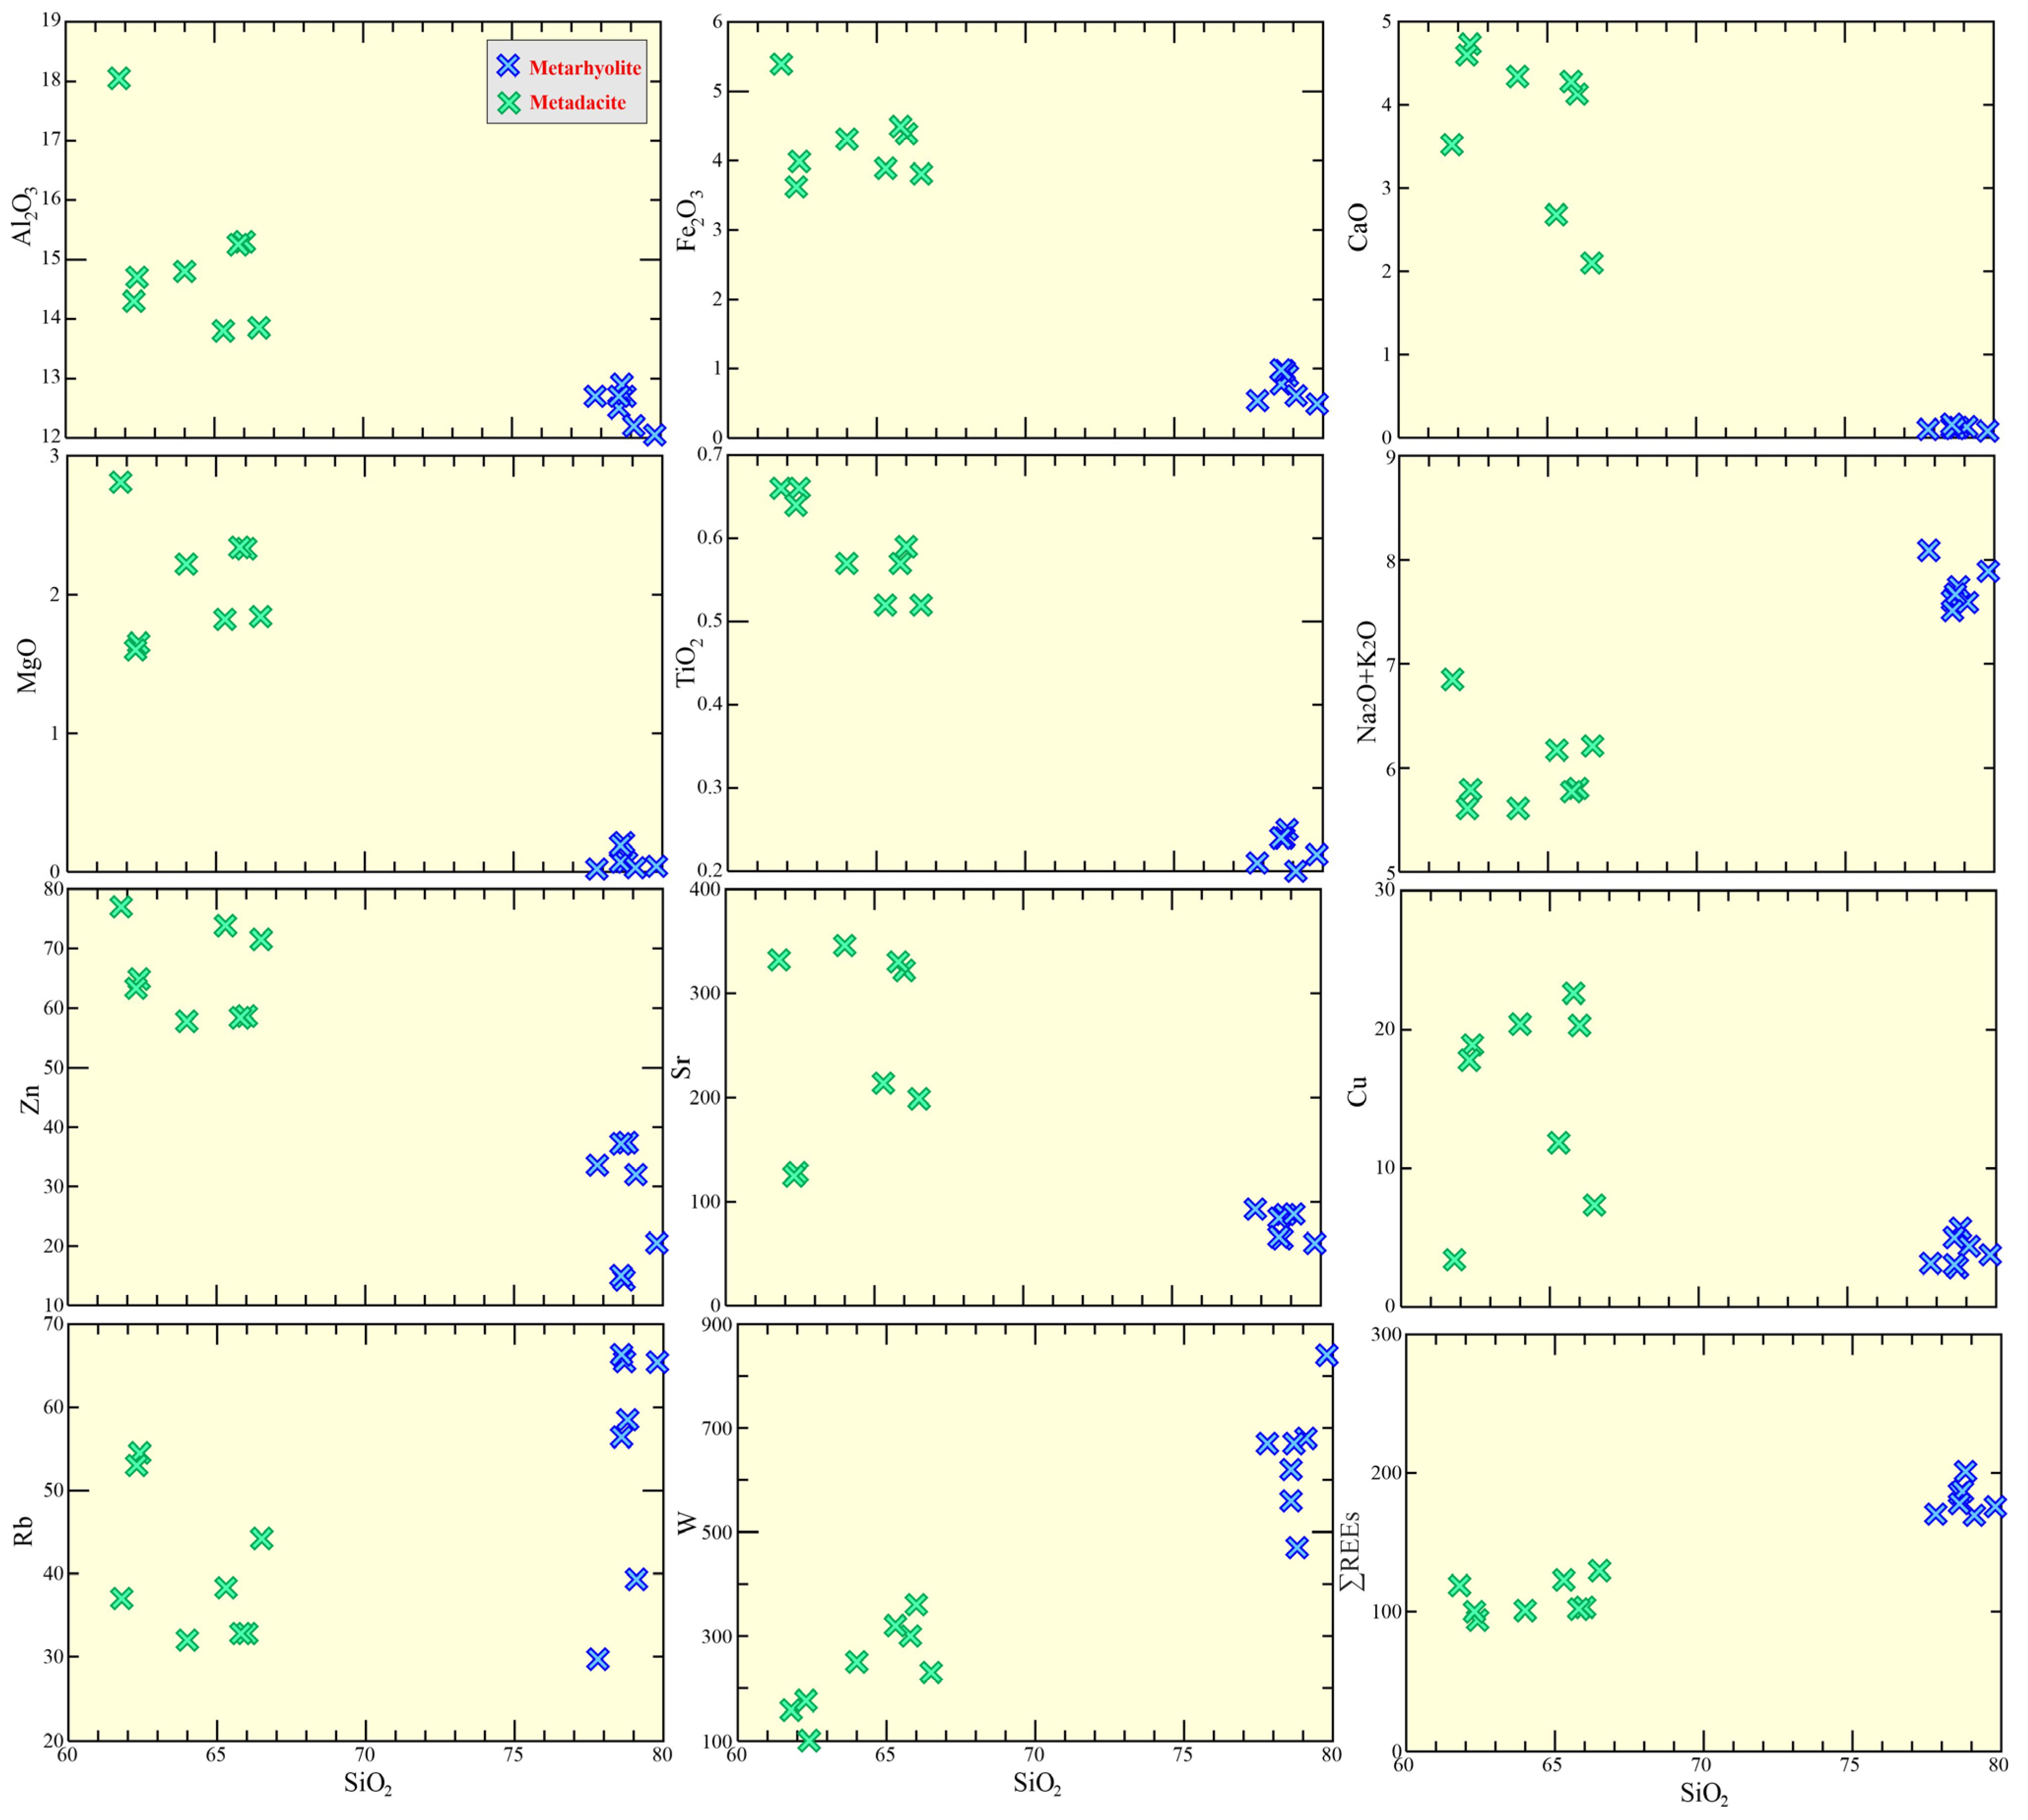
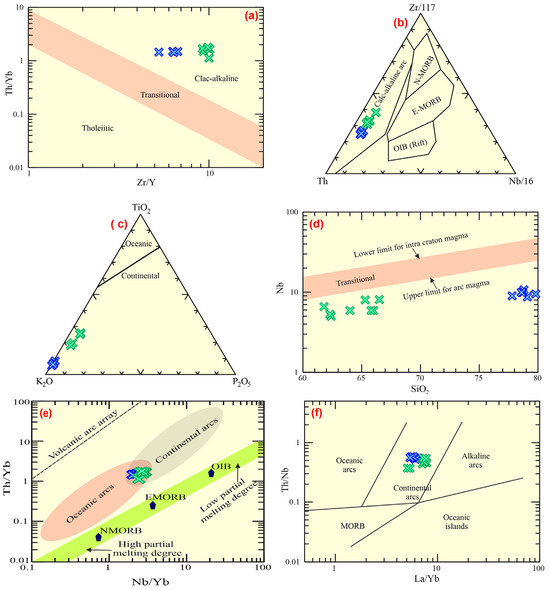
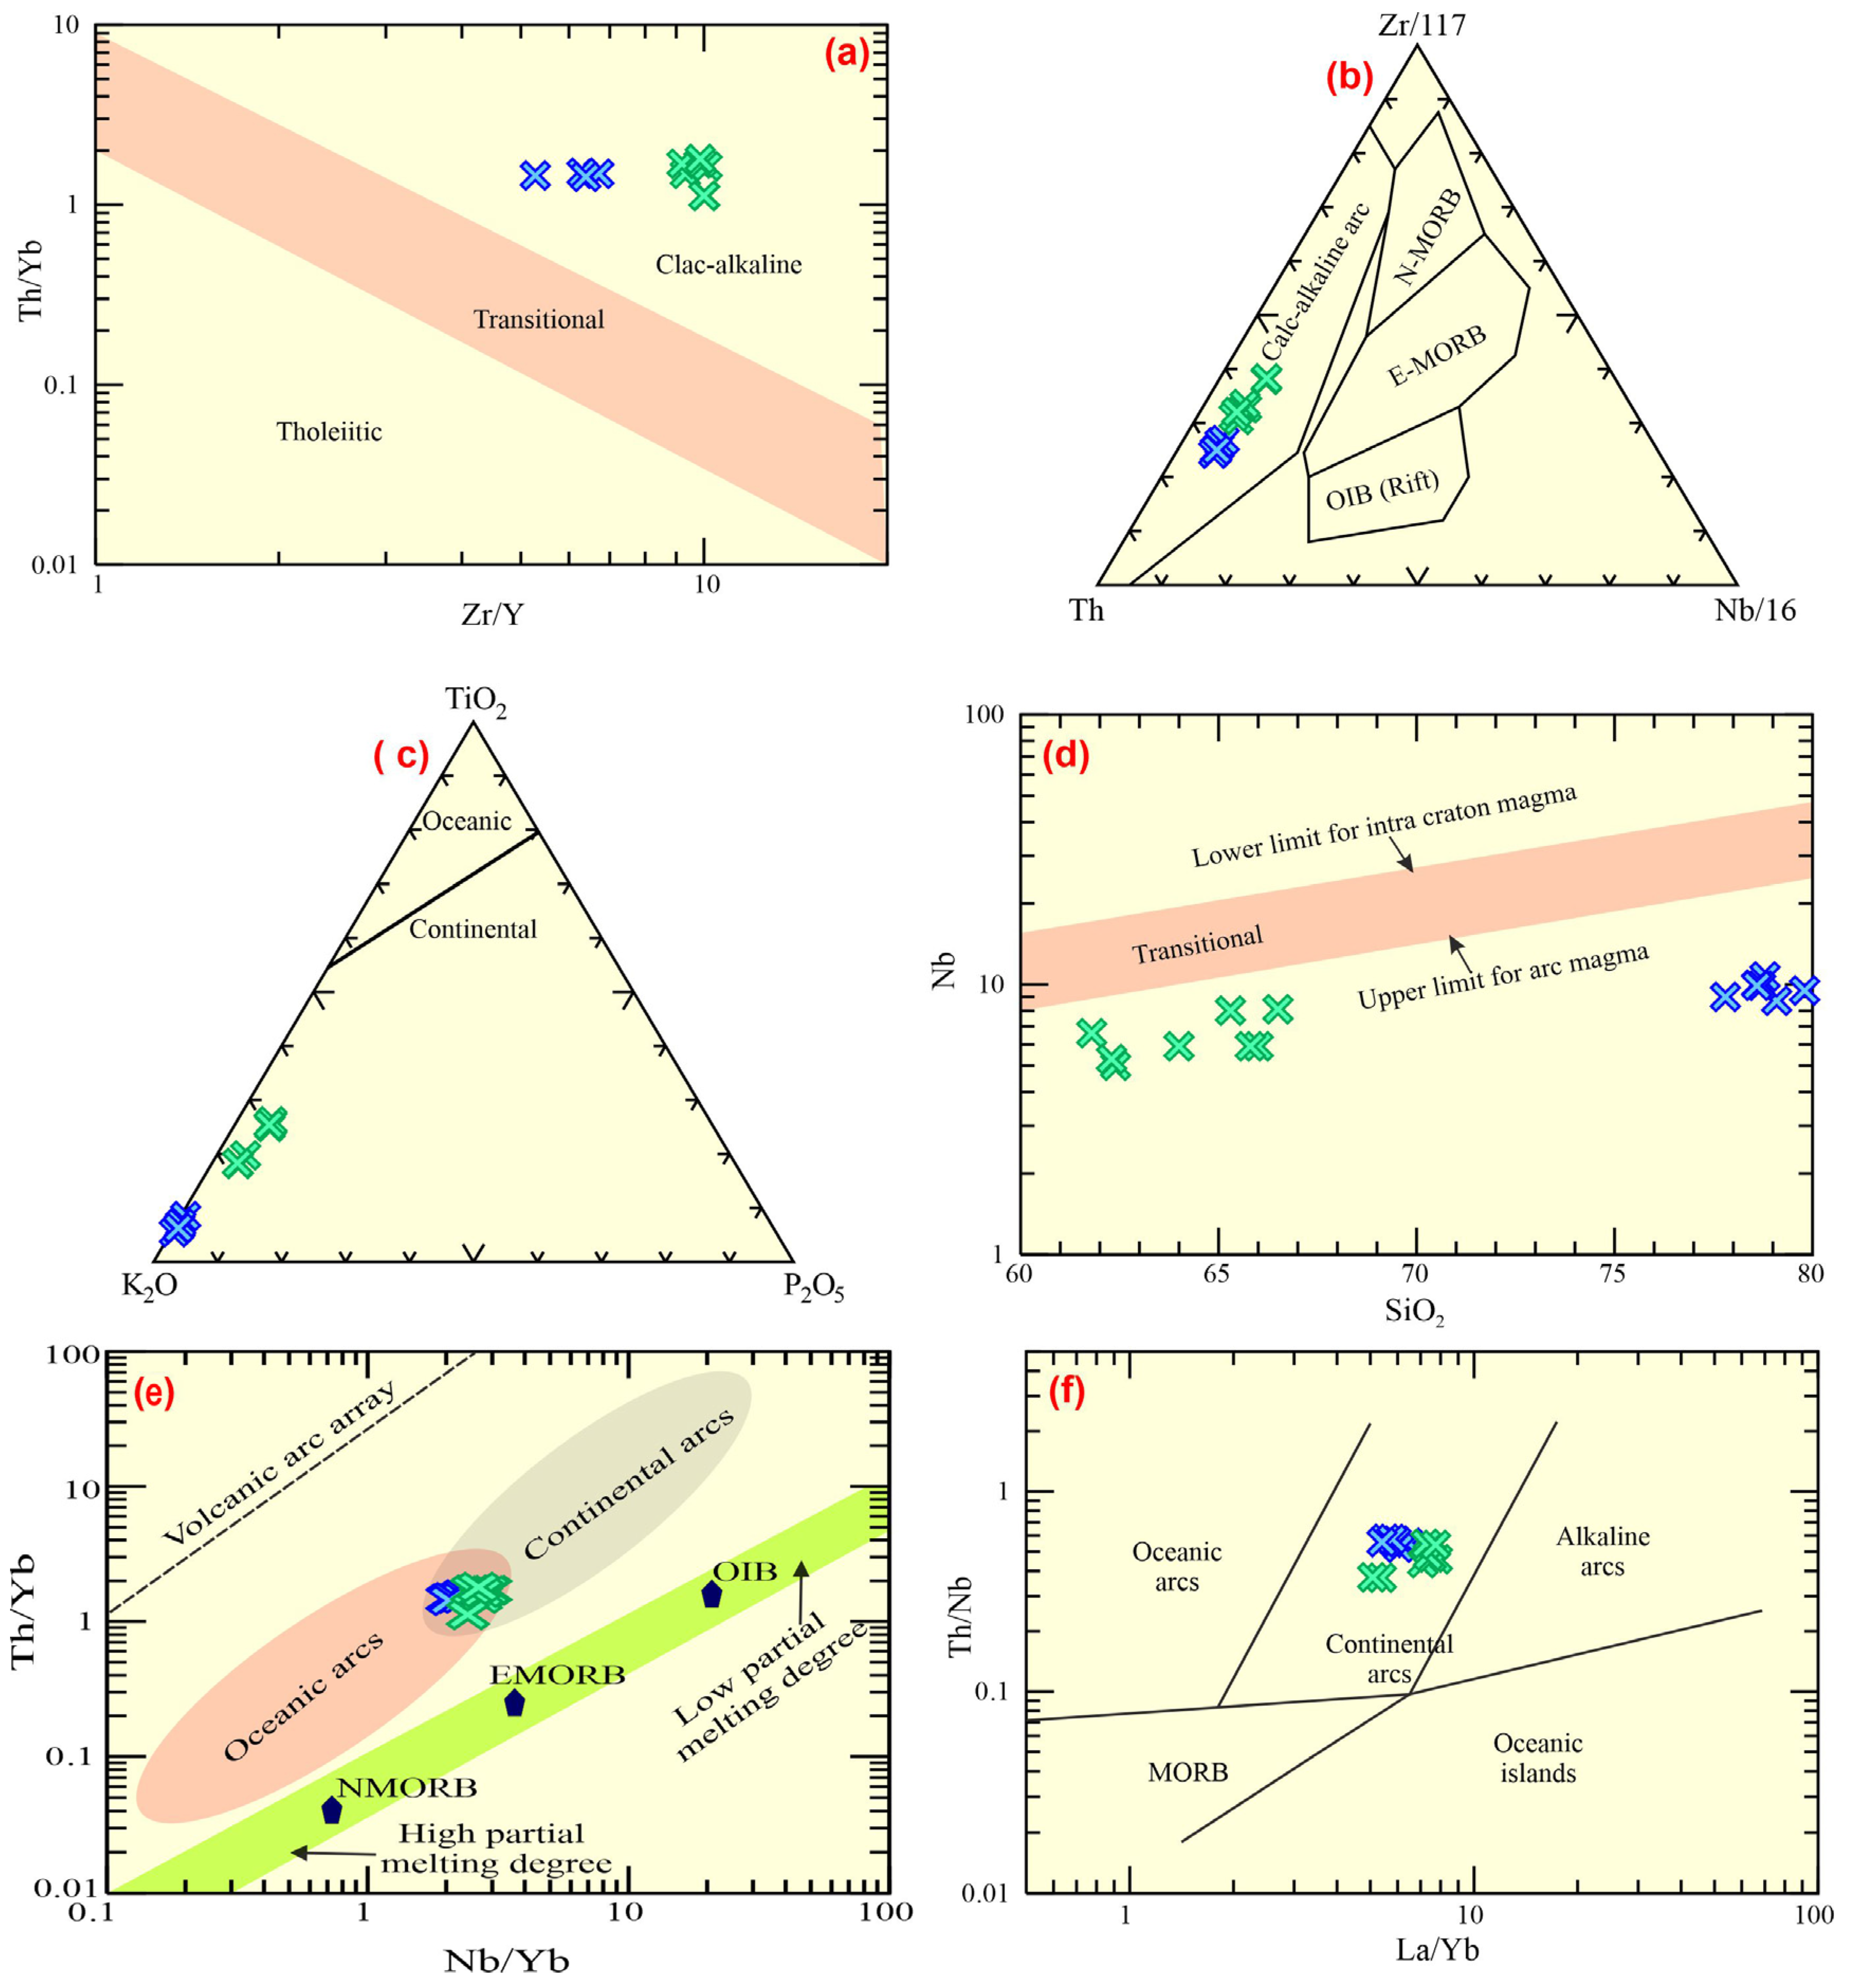

Disclaimer/Publisher’s Note: The statements, opinions and data contained in all publications are solely those of the individual author(s) and contributor(s) and not of MDPI and/or the editor(s). MDPI and/or the editor(s) disclaim responsibility for any injury to people or property resulting from any ideas, methods, instructions or products referred to in the content. |
© 2026 by the authors. Licensee MDPI, Basel, Switzerland. This article is an open access article distributed under the terms and conditions of the Creative Commons Attribution (CC BY) license.