


Abstract
Efficient calibration of discrete element meso-parameters is essential for reliable rock fragmentation modeling. This study focuses on green sandstone, combining uniaxial compression tests with PFC3D simulations to establish an XGBoost–stepwise regression framework for macro–meso-parameter calibration of the parallel bond model. XGBoost was used to identify the dominant meso-parameters governing peak strength, elastic modulus, and Poisson’s ratio, and stepwise regression was applied to construct explicit nonlinear mapping equations. Peak strength is mainly controlled by shear strength τcp and normal strength σcp, while elastic modulus and Poisson’s ratio are primarily influenced by bond modulus Ecp and stiffness ratio kp*. Introducing quadratic and interaction terms improved model fit, with adjusted R2 increasing by 27.5% and 11.2%, respectively. The calibrated parameters reproduced laboratory mechanical indices with errors of 0.09%–3.745% and showed good agreement with the observed shear–brittle failure pattern. Based on the calibrated model, a representative impact-fragmentation simulation further revealed staged conversion of input energy into fracture-related energy during crack initiation, propagation, and through-failure. The proposed framework improves the efficiency and interpretability of PBM parameter calibration and supports DEM-based analysis of rock fragmentation and energy evolution.
1. Introduction
In modern mineral processing flowsheets, crushing plays a crucial role; it is an indispensable core step in achieving the efficient separation of various mineral resources. To ensure that target minerals can be effectively separated from non-target minerals and to meet the particle size requirements for subsequent processing, it is usually necessary to subject various minerals to crushing and liberation treatment [1,2,3]. As a typical quasi-brittle material, rock is the most fundamental and common subject of crushing operations [4,5]. Conventional research methods for rock crushing typically involve laboratory or in situ field testing to obtain macroscopic mechanical parameters such as peak strength, elastic modulus and Poisson’s ratio, thereby characterizing the material’s overall mechanical properties. However, rock fragmentation is not only governed by macroscopic mechanical properties but is also closely related to its internal mesostructure and mesomechanical characteristics. Therefore, elucidating the mechanical response and damage evolution patterns during rock fragmentation at the mesoscale holds significant theoretical and engineering value.
The Discrete Element Modeling (DEM) has several advantages in characterizing inter-particle contact, bonding and crack initiation and propagation in rock, and is therefore widely used in studies of the mesoscale mechanical behavior of rock masses [6,7,8,9,10,11]. Among these, the Particle Flow Code (PFC) is capable of simulating the bonding, friction and fracture processes between particles within rock using particle bonding models, and has become an important numerical tool for studying rock fragmentation and damage evolution [12,13,14,15,16,17]. In recent years, DEM and bonded particle models have also been further applied to process modeling and performance analysis of mining crushing equipment, such as gyratory crushers and offset crushers, indicating that this method holds great potential for application in mineral processing and crushing engineering research [18,19]. Recent DEM studies have further emphasized the importance of particle-scale representation and micromechanical interpretation in numerical modeling. Xu et al. proposed a dual-level particle breakage model for irregular particles in DEM, providing an efficient framework for describing the breakage process of irregular particles [20]. Song et al. developed a DEM model for hollow cylinder torsional shear tests and analyzed the micromechanical responses of shaped particles, including force-chain evolution and shear-band development [21]. Gu et al. applied DEM to simulate and optimize the edge effect in ore minerals roll crushing, further showing the applicability of DEM in mineral crushing process modeling and equipment-performance analysis [22]. These studies show that DEM-based modeling is increasingly used not only to reproduce macroscopic mechanical responses, but also to reveal the underlying particle-scale mechanisms. Accordingly, an efficient and interpretable macro–meso-parameter calibration framework is important for improving the reliability of DEM simulations.
Currently, the calibration of mesoscale parameters is often carried out using the ‘trial-and-error method’, which involves repeatedly adjusting the mesoscale parameters and comparing the results of numerical simulations with macroscopic experimental data until the error between the two meets the required criteria. Although this method can yield satisfactory calibration results, it has significant limitations: on the one hand, the process relies heavily on the researcher’s experience, involves a substantial workload, and is relatively inefficient; on the other hand, the relationship between macroscopic and mesoscopic parameters is typically not a simple linear one, but rather exhibits significant nonlinearity and parameter coupling characteristics, making it difficult to achieve rapid and accurate quantitative expression through traditional empirical methods. Consequently, for rock discrete element models, there is an urgent need to establish a method for calibrating mesoscopic parameters that balances efficiency, accuracy and interpretability. Existing studies have proposed different strategies to improve the calibration efficiency of DEM/BPM microparameters. Chehreghani et al. used response surface methodology together with a central composite design to calibrate bonded-particle models, providing a statistical way to relate microparameters to target responses [23]. Ji et al. employed a differential evolution algorithm to calibrate DEM cohesive granular materials and showed that UCS, direct tensile strength, Young’s modulus, and Poisson’s ratio could be calibrated with high accuracy [24]. Wu et al. proposed a BPM calibration method for ore particles under uniaxial compression by combining Plackett–Burman design, steepest ascent design, Box–Behnken design, and response surface methodology [25]. These studies indicate that the establishment of quantitative relationships between microparameters and macroscopic mechanical responses is essential for improving DEM/PFC calibration efficiency. However, the interpretability of the dominant parameter–response relationship and the rapid inversion of mesoscopic parameters still require further improvement.
Furthermore, the accurate calibration of mesoscale parameters is not only crucial for the reliable reproduction of macroscopic mechanical responses, but also directly affects the credibility of subsequent energy analyses of the fracture process. Existing research has shown that, whether at the atomic/molecular scale or at the mesoscale of fracture simulations, the material failure process is accompanied by the evolution of energy input, accumulation, dissipation and release. Relevant studies have revealed, across different scales, the mesostructural failure mechanisms, anisotropic responses, specific energy consumption, energy distribution and energy utilization efficiency of brittle minerals and mineral-like materials during the fracture process [18,19,26,27]. Consequently, establishing a reliable mapping relationship between macroscopic and mesoscopic parameters not only helps to improve the efficiency of discrete element model parameter calibration, but also provides fundamental parameter support for subsequent analyses of input energy, dissipated energy and fracture energy utilization during the crushing process.
Based on this, this paper takes green sandstone as its subject of study and, focusing on the calibration of mesoscale parameters in the parallel bond model (PBM), proposes a method for mapping macroscopic and mesoscale parameters that combines XGBoost significance screening with stepwise regression modeling. This framework is designed to improve the efficiency and interpretability of PFC3D parameter calibration by first identifying the dominant mesoscopic parameters and then establishing explicit macro–meso mapping relationships. Firstly, a macro–meso-parameter dataset is constructed through numerical experiments, and the XGBoost model is utilized to identify the key meso-parameters corresponding to different macro-responses, thereby achieving parameter dimensionality reduction; subsequently, a stepwise regression method is employed to introduce main effects, quadratic terms and interaction terms, establishing an explicit nonlinear mapping relationship between macro- and micro-parameters; finally, the meso-parameter calibration is completed based on the constructed mapping model, and the results are validated against stress–strain curves, mechanical parameters and failure modes obtained from laboratory tests. On this basis, the calibrated parameter set is further used in a representative impact-fragmentation simulation to analyze the staged relationship among input energy, fracture-related energy and crack development. The research findings provide a reference for the efficient calibration of parameters in numerical simulations of rock fragmentation processes and for subsequent mechanistic studies.
2. Experiments and Discrete Element Models
2.1. Uniaxial Compression Test on Green Sandstone Specimens
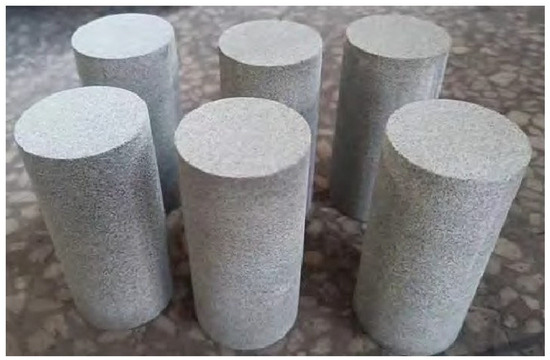
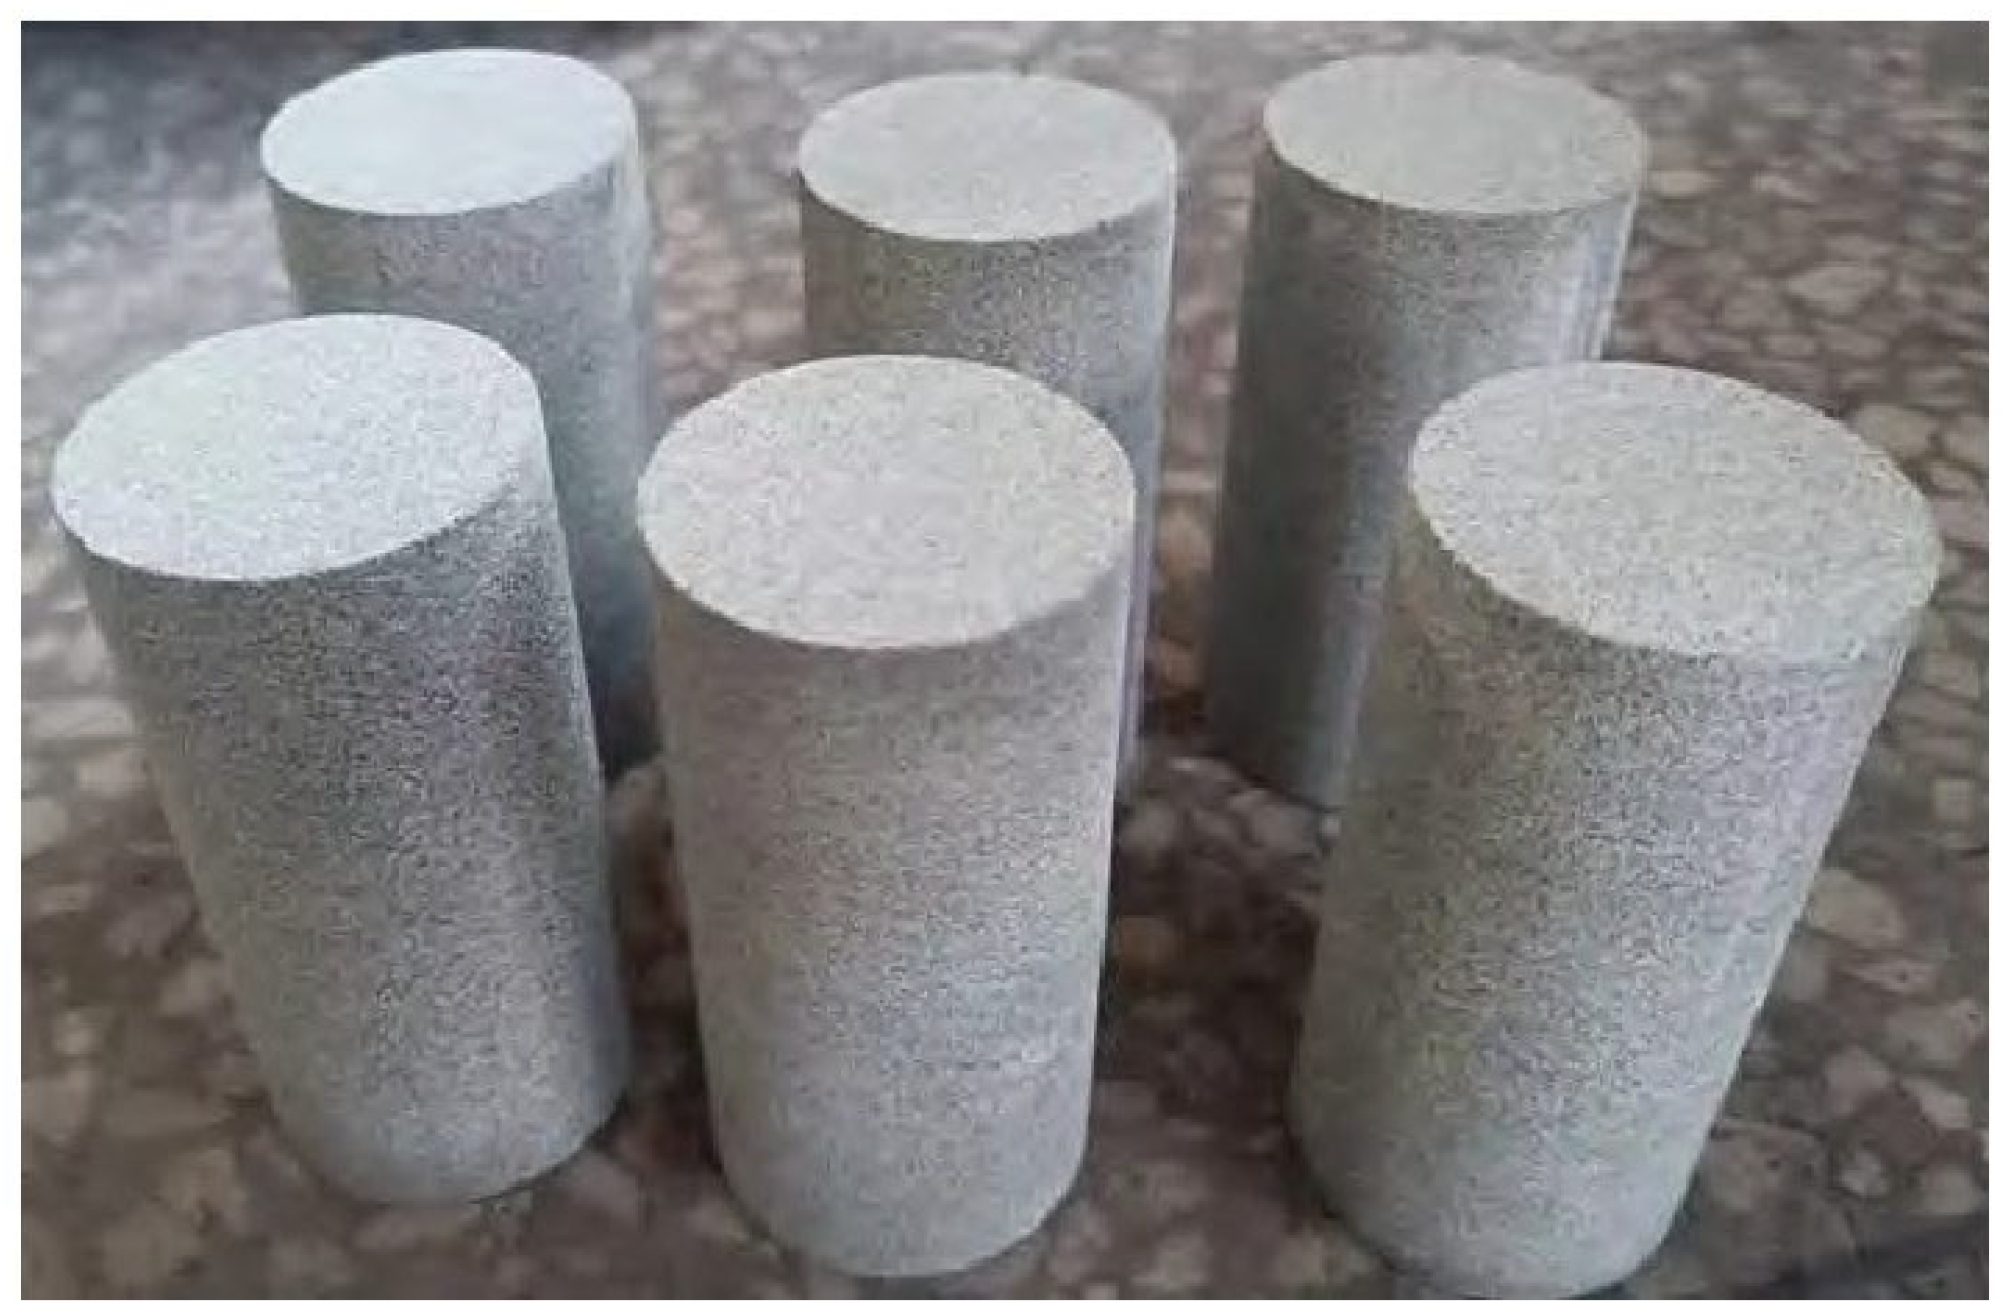
This study focuses on green sandstone, with samples collected from Zigong City, Sichuan Province. This rock consists of sand grains cemented together and is a typical quasi-brittle material. To minimize the impact of heterogeneity in the physical properties of the rock samples on the test results, cores were drilled from a single block of green sandstone along the vertical bedding planes, with holes densely spaced, and processed into standard cylindrical specimens. Subsequently, green sandstone specimens with no obvious joints or fractures on their surfaces were selected from all the specimens for subsequent experimental analysis. The geometric dimensions and basic physical parameters of the test specimens all comply with the relevant specifications. The cylindrical specimens have a diameter of 50.000 mm and a height of 100.000 mm, with an average density of 2294.216 kg·m−3; the parallelism, straightness and perpendicularity are all 0.020 mm. The specimens are shown in Figure 1.
Figure 1.
Green sandstone specimens.
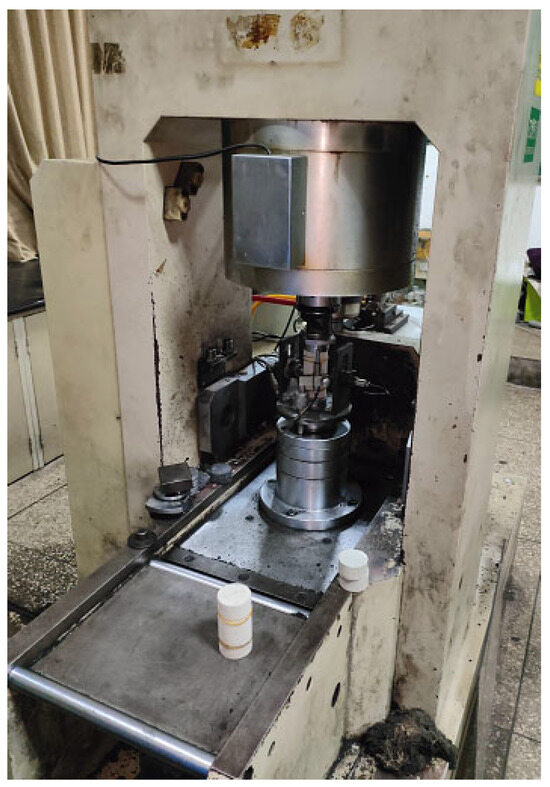
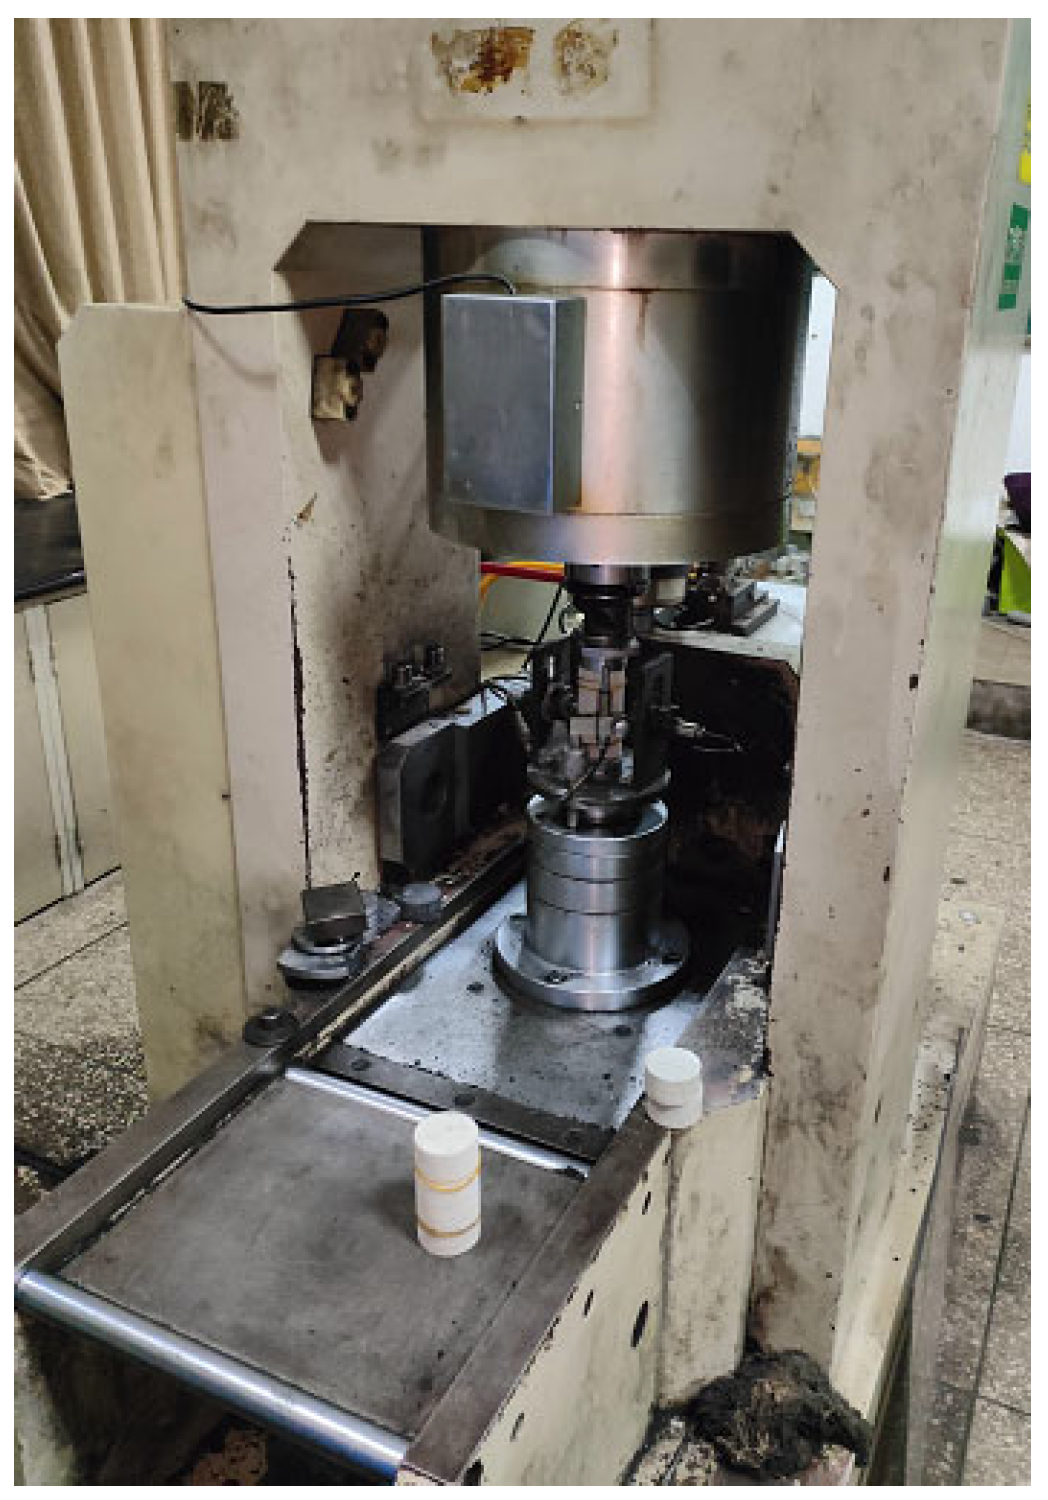
As shown in Figure 2, uniaxial compression tests were conducted using the RMT-150B rock mechanics testing system developed by the Wuhan Institute of Rock and Soil Mechanics, Chinese Academy of Sciences. Macromechanical parameters such as peak strength, elastic modulus and Poisson’s ratio of the green sandstone specimens were obtained through laboratory testing, providing target response values for the subsequent calibration of the discrete element model. The test results indicate that the peak strengths of the three sets of green sandstone specimens were 60.133 MPa, 64.772 MPa and 62.111 MPa, respectively; whilst the elastic moduli were 13.688 GPa, 13.536 GPa and 14.066 GPa; and the Poisson’s ratios were 0.255, 0.249 and 0.267, respectively.
Figure 2.
RMT-150B electro-hydraulic servo test system of rock mechanics.
2.2. Uniaxial Compression Test on Green Sandstone Specimens
This rock consists of mineral grains and the cementing material between them; it is essentially an aggregate of discrete particles with specific strength and structural characteristics. Its macroscopic mechanical behavior is governed by inter-particle interactions. Compared with traditional continuous medium models, the particle flow method offers greater advantages in characterizing the discrete and discontinuous nature of rock materials, as well as the evolution of failure processes; it has therefore become an important simulation tool for studying rock fragmentation processes. In this study, the particle flow code PFC3D was employed to establish a discrete element numerical model of uniaxial compression in green sandstone based on the parallel bonding model (PBM). The PBM is capable of simultaneously modeling the transmission of normal and tangential forces between particles, as well as bonding failure behavior, and is suitable for describing the mesomechanical response and crack propagation processes of quasi-brittle rock materials [28,29].
The mesoscale parameters of the parallel bonding model primarily comprise two categories: particle parameters and parallel bonding parameters; their specific physical meanings and notation are shown in Table 1.
Table 1.
Mesoscopic parameters of parallel bonding model.
As the PBM involves a large number of parameters, including all of them in the calibration process would not only significantly increase computational costs but also heighten the complexity of parameter analysis and inversion. Therefore, to reduce the difficulty of parameter calibration in numerical experiments, and in conjunction with existing research findings [30,31], this paper simplifies certain parameters as follows and makes the following assumptions: (1) λp = 1; (2) Rmax/Rmin = 1.66; (3) ρ = 2294 kgּּ·m−3; (4) Ec, k* and μ are consistent with Ecp, μp, and kp*.
Under the simplified conditions described above, the key mesostructural parameters requiring analysis and calibration include: the parallel bond elastic modulus Ecp, the parallel bond stiffness ratio kp*, the parallel bond normal strength σcp and shear strength τcp, the parallel bond friction angle φp, the friction coefficient μp, the minimum particle size Rmin and the porosity n. The minimum particle size and porosity are particle parameters, while the other parameters are parallel bonding parameters. The selection of these parameters retains the primary control variables influencing the macroscopic mechanical response whilst, to a certain extent, reducing the dimensionality of the parameter space, thereby providing a foundation for subsequent screening of significant parameters and the development of macro–meso mapping models. These eight mesoscopic parameters were used as input variables in the subsequent numerical experimental design. To avoid the extremely high computational cost of a full-factorial design, Latin Hypercube Sampling was adopted to generate representative parameter combinations within the prescribed ranges.
For the meso-parameters to be analyzed, this study conducts numerical experiments at different parameter levels, recording macroscopic mechanical properties such as peak strength σc, elastic modulus E and Poisson’s ratio v for each parameter combination, thereby constructing the sample dataset required for analyzing the relationship between macro- and meso-parameters.
2.3. Numerical Model Construction and Sample Data Generation
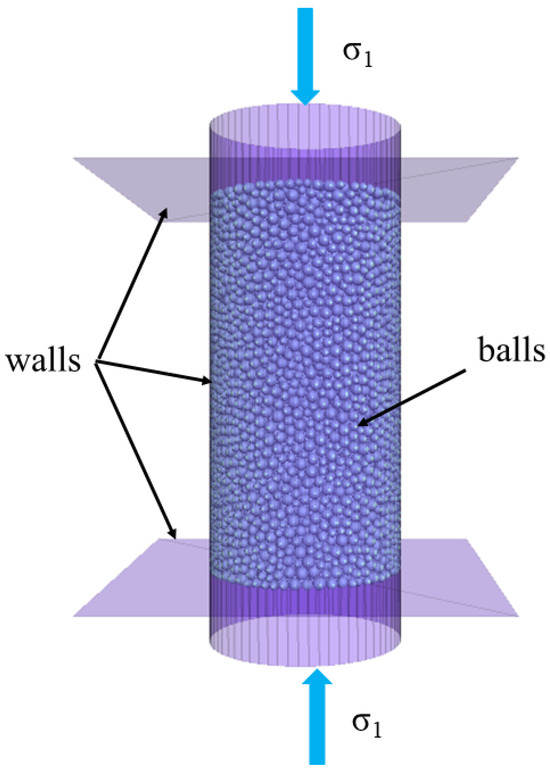
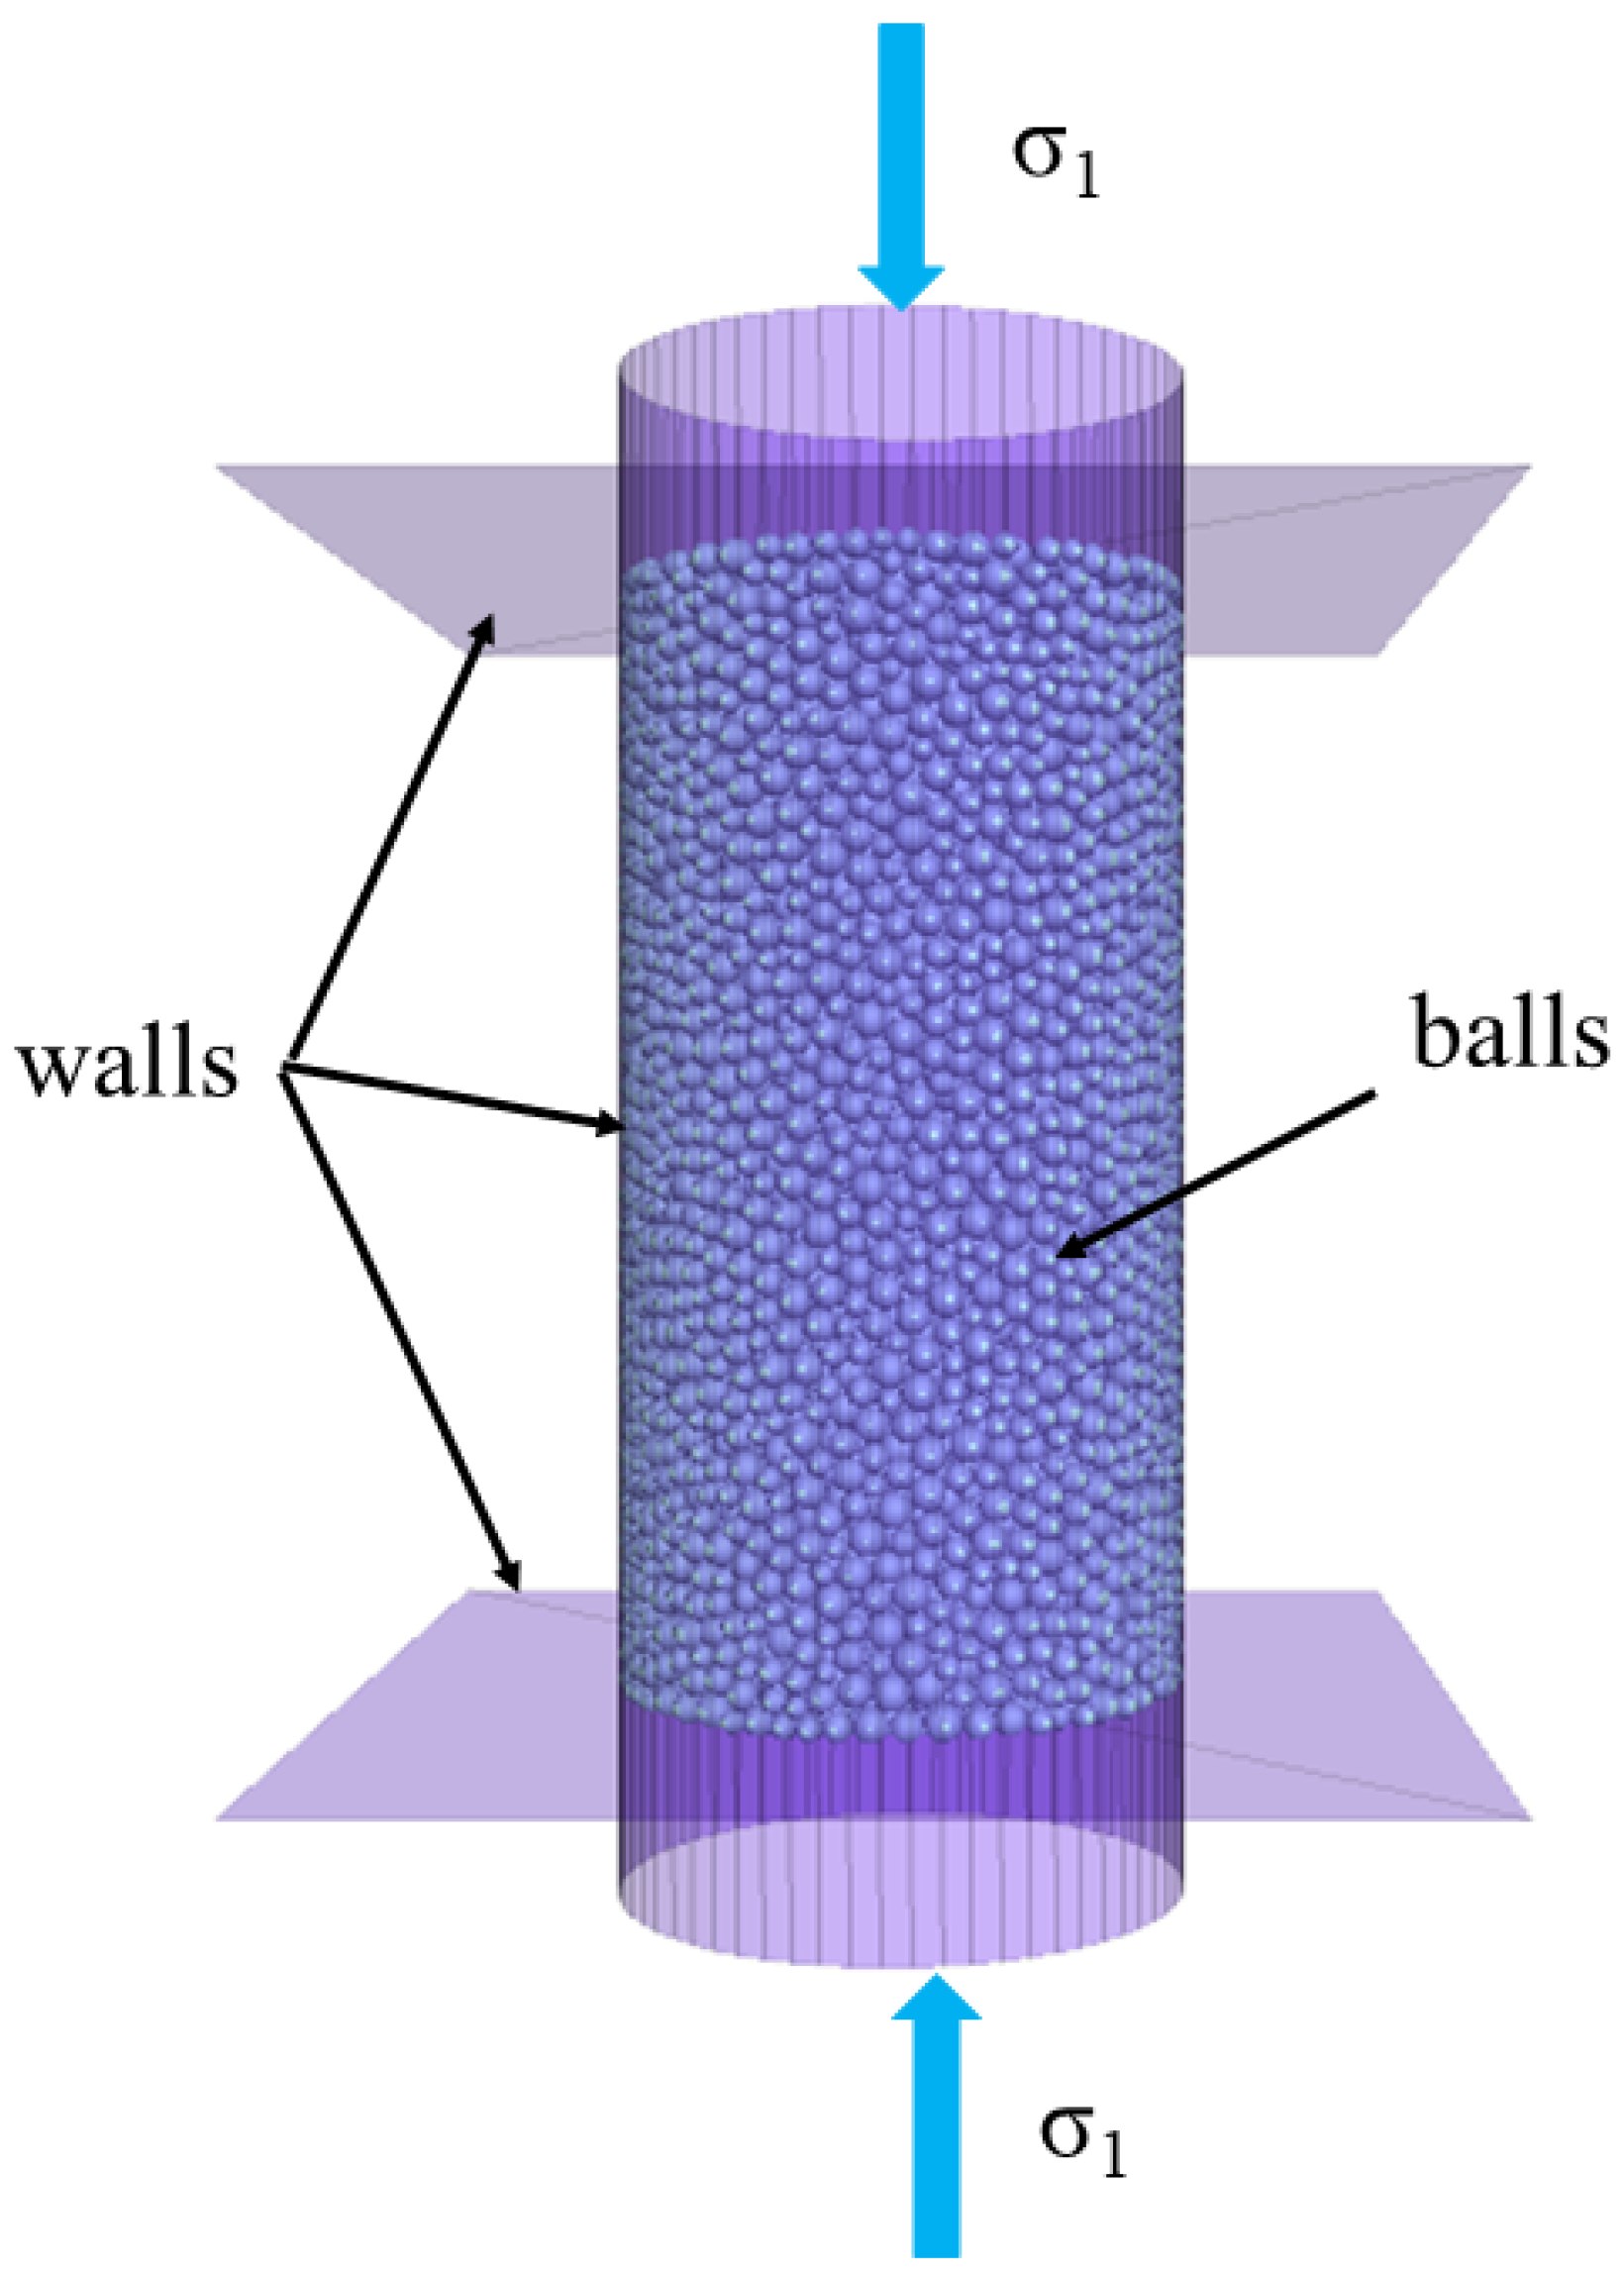
This paper establishes a discrete element numerical model of green sandstone that matches the dimensions of laboratory mechanical tests. The model geometry adopts a cylindrical shape with a diameter of 50 mm and a height of 100 mm, consistent with uniaxial compression specimens. The model boundaries are defined by walls, and particles are randomly generated within the walls according to a particle size ratio of Rmax/Rmin = 1.66. Particle-to-particle bonding is implemented using a parallel viscous contact model.
During loading, the upper and lower walls were designated as loading plates. The loading rate was controlled via step size, causing the upper and lower walls to move slowly toward each other, thereby simulating the quasi-static loading process under uniaxial compression conditions. This loading method effectively replicates the boundary conditions and stress environment corresponding to laboratory uniaxial compression tests within the particle flow framework. As loading progresses, particle contact forces, cohesive failure, and crack propagation continuously evolve, ultimately yielding the numerical specimen’s macroscopic responses, including peak strength, elastic modulus, Poisson’s ratio, and failure mode. The numerical model is shown in Figure 3.
Figure 3.
Numerical model of uniaxial compression of green sandstone.
To establish quantitative relationships between the macroscopic and mesoscopic parameters, this paper conducts numerical experiments on the aforementioned key mesoscopic parameters under various combinations of parameter values. For each set of parameter combinations, uniaxial compression simulations are performed in PFC3D, and the corresponding macroscopic parameters—including peak compressive strength σc, elastic modulus E, and Poisson’s ratio v—are recorded.
To improve the reproducibility of the numerical sample-generation process, the experimental design and parameter ranges are specified as follows. The ranges of the eight mesoscopic parameters were determined according to previous PBM calibration studies, the measured mechanical properties of green sandstone, and preliminary numerical simulations. The adopted ranges were selected to ensure that the generated numerical specimens could produce physically reasonable strength, stiffness, deformation, and failure responses. As shown in Table 2, Rmin was set within 0.6–1.0 mm, n within 0.20–0.36, Ecp within 10–50 GPa, kp* within 1–5, σcp within 10–50 MPa, τcp within 10–50 MPa, φp within 15–55°, and μp within 0.15–0.55.
Table 2.
Sampling ranges of mesoscopic parameters used in the LHS design.
Latin Hypercube Sampling was used to construct the numerical experimental matrix. Compared with a full-factorial design, which would require 58 = 390,625 simulations if five levels were assigned to each of the eight parameters, LHS can provide a more efficient coverage of the high-dimensional parameter space with a limited number of samples. Considering the eight-dimensional parameter space and the computational cost of PFC3D simulations, 150 representative parameter combinations were generated. For each parameter combination, one PFC3D uniaxial compression simulation was conducted, and the corresponding peak compressive strength, elastic modulus, and Poisson’s ratio were extracted to form the macro–meso dataset for subsequent XGBoost screening and stepwise regression modeling.
3. Significant Parameter Screening and Modeling Methods
3.1. Feature Selection Using XGBoost
In this study, peak strength σc, elastic modulus E, and Poisson’s ratio v were selected as the primary macroscopic response indicators for mesoscopic parameter calibration. In DEM/PFC calibration studies, these macroscopic indices are commonly used to constrain the strength and stiffness levels of numerical specimens. Zhao et al. used UCS, Poisson’s ratio, and elastic modulus as the main adjustment targets in PFC rock modeling, and further evaluated the simulation results using stress–strain curves, mechanical parameters, and macroscopic failure forms [32]. Yoon used UCS, Young’s modulus, and Poisson’s ratio as macroscopic response variables for PFC microparameter calibration [33]. Fan et al. also adopted UCS, Young’s modulus, and Poisson’s ratio as reference macroparameters for calibrating a parallel bond model [34]. Jin et al. calibrated DEM microparameters using laboratory macroparameters and further verified the calibrated model through stress–strain curves and failure morphology [35]. Therefore, in the present study, these three scalar indices were used as the main inversion targets, while the stress–strain curve and failure morphology were used for subsequent validation. Since different mesoscale parameters do not influence different macroscopic mechanical parameters to the same extent, calibrating all the mesoscale parameters simultaneously would not only significantly increase the computational workload but also reduce the specificity of parameter analysis and inversion. Therefore, it was necessary to first analyze the sensitivity relationships between macro- and meso-parameters and identify highly significant meso-parameters for different macro-responses to reduce the complexity of subsequent calibration.
To achieve this objective, this paper employs the XGBoost (Extreme Gradient Boosting) model to perform a quantitative analysis of the influence of meso-parameters. XGBoost is an ensemble learning algorithm based on the gradient boosting concept, and its basic prediction function can be expressed as
where is the predicted value for sample i, is the input feature vector, represents the kth regression tree, and K is the total number of trees.
The model was trained by minimizing the regularized loss function:
where represents the loss function for the training samples, and represents the regularization term for the tree’s complexity, which is used to prevent overfitting.
These 150 numerical samples were evaluated using a five-fold cross-validation strategy. In each fold, approximately 80% of the samples were used as the training subset, with the remaining 20% serving as the validation subset. The training subset was used to train the XGBoost model and calculate the relative importance of mesoscale parameters, whilst the validation subset was used to assess the stability of the predictive performance. The aforementioned cross-validation partitioning strategy was applied to the three macroscopic responses: peak strength, modulus of elasticity and Poisson’s ratio. To mitigate the impact of a single random data partition, the final sensitivity ranking was determined by calculating the average of the feature importance values across the five folds and expressing this as a percentage. The parameters with a sensitivity greater than 10% were defined as highly significant parameters and selected as candidate variables for subsequent stepwise regression modeling. This approach simplifies the handling of mesoscale parameters and lays the foundation for establishing a quantitative mapping relationship between macroscale and mesoscale parameters.
3.2. Stepwise Regression Modeling
After completing the screening of significant parameters, this paper further employs a stepwise regression method to establish an explicit mapping relationship between macro- and meso-level parameters. Stepwise regression is a statistical analysis method that combines variable screening with regression modeling; by progressively adding or removing independent variables, it retains the terms from the candidate variables that best explain the dependent variable, thereby constructing a regression model that balances accuracy and parsimony. Compared to simple linear regression, stepwise regression allows for the gradual introduction of quadratic terms and interaction terms while controlling model complexity, thereby capturing the more complex nonlinear relationships between macro- and meso-level parameters.
In the practical implementation, the highly significant mesoscopic parameters identified by XGBoost were used as response-specific candidate variables for stepwise regression. For peak strength, the candidate variables included τcp, σcp, kp* and n; for elastic modulus, Ecp was used as the dominant candidate variable; and for Poisson’s ratio, kp* was used as the dominant candidate variable. During the stepwise selection process, a candidate term was retained only when its regression coefficient was statistically significant at p < 0.05 and the adjusted R2 of the model was improved. If a term became statistically insignificant after the inclusion of other variables, it was removed from the model. In addition, multicollinearity among the retained variables was checked using the variance inflation factor, and terms with serious collinearity were not retained simultaneously. The final regression model was determined by jointly considering statistical significance, adjusted R2, model parsimony, and collinearity.
First, based on the highly significant parameters identified by the XGBoost model, a linear regression model containing only first-order terms was constructed to analyze the main effects of the significant parameters on the overall response. Its general form can be expressed as
In the equation, y represents the macroscopic mechanical parameter, βi represents the regression coefficient, xi represents the significant mesoscale parameter, and ε represents the residual term.
Building on the analysis of main effects, to capture the independent nonlinear effects of significant parameters, we further introduced a squared term. The model can be written as
In the equation, γj is the coefficient of the quadratic term, which characterizes the independent nonlinear influence of the parameter.
Given that different significant parameters often do not act independently when influencing the macro-response but rather exhibit coupling effects, this paper further introduces interaction terms to characterize the combined influence of parameters. The general expression for these terms can be written as
In the equation, δij represents the interaction coefficient, which describes the nonlinear interaction effects between significant parameters. To ensure model stability and statistical significance, only interaction terms satisfying the above selection criteria were retained.
Based on the significant parameters identified by XGBoost, first-order terms, quadratic terms, and pairwise interaction terms were constructed as candidate terms for stepwise regression. The retained terms and final regression models are presented in Section 4.1.
4. Results
4.1. XGBoost Sensitivity Results and Macro–Meso Mapping Relationship
4.1.1. XGBoost Sensitivity Results
The XGBoost sensitivity analysis was conducted to identify the dominant mesoscopic parameters controlling the macroscopic mechanical responses of green sandstone. The normalized sensitivity results are listed in Table 3. The results show that the controlling mesoscopic parameters differ among peak strength, elastic modulus, and Poisson’s ratio, indicating that different macroscopic mechanical responses are governed by different mesoscopic mechanisms.
Table 3.
XGBoost sensitivity ranking of mesoscopic parameters for different macroscopic responses.
For peak strength σc, the bond shear strength τcp, bond normal strength σcp, bond stiffness ratio kp*, and porosity n show relatively high sensitivities. This indicates that the peak strength of the numerical specimen is jointly controlled by the bond strength level, stiffness distribution, and initial structure. For elastic modulus E, Ecp has the highest sensitivity, suggesting that the macroscopic stiffness of the numerical specimen is mainly governed by the bond effective modulus. This is consistent with the mechanical role of Ecp, because it directly controls the normal and shear stiffness of bonded contacts and therefore determines the slope of the elastic stage in the stress–strain curve. For Poisson’s ratio v, the bond stiffness ratio kp* is the most influential parameter, indicating that the lateral deformation response is mainly controlled by the relative relationship between normal and shear contact stiffness.
The quadratic terms and two-way interaction terms are shown in Table 4.
Table 4.
Interaction term and quadratic term.
4.1.2. Main Effects of Significant Parameters
After performing linear regression with highly significant mesostructural parameters as independent variables, the adjusted R-squared values for the peak strength σc, elastic modulus E, and Poisson’s ratio v models were 0.716, 0.822 and 0.856, respectively. The results indicate that when only main effects are considered, all three types of macroscopic responses can be well-fitted, but there are still differences in the fitting accuracy among the various responses. The mathematical form of the regression models is as follows:
Based on the regression analysis, peak strength σc is positively correlated with shear strength τcp and normal strength σcp, while it is negatively correlated with porosity n and stiffness ratio kp*. This indicates that an increase in bond strength parameters enhances the load-bearing capacity of the specimen, whereas a higher stiffness ratio reduces peak strength. The elastic modulus E is positively correlated with the bond modulus Ecp, indicating that the overall stiffness is primarily controlled by the bond modulus. Poisson’s ratio v is positively correlated with the stiffness ratio kp*, suggesting that the transverse deformation characteristics are mainly influenced by the distribution of normal and shear contact stiffness. Overall, the analysis of main effects indicates that the controlling factors for peak strength are relatively complex, whereas the elastic modulus and Poisson’s ratio exhibit more pronounced single-parameter dominance.
4.1.3. Independent Nonlinear Effects
Based on the analysis of main effects, after introducing quadratic terms, the adjusted values of the peak strength σc, elastic modulus, and Poisson’s ratio models increased to 0.726, 0.822, and 0.952, respectively. It can be seen that the fitting accuracy of the peak strength and Poisson’s ratio improved by 1.4% and 11.2%, respectively, compared to the linear model, while the elastic modulus model remained virtually unchanged. The mathematical form of the regression model is as follows:
These results indicate that both peak strength and Poisson’s ratio are subject to a certain degree of independent nonlinear effects; in particular, Poisson’s ratio is highly sensitive to the quadratic term kp*2, suggesting that the relationship between stiffness and transverse deformation is not simply linear. In contrast, the elastic modulus is primarily governed by a single parameter Ecp, and the introduction of the quadratic term does not significantly alter the fit, indicating that its independent nonlinear effects are relatively weak.
Therefore, the sources of nonlinearity in different macroscopic responses differ significantly: peak strength and Poisson’s ratio require consideration of nonlinear terms, whereas the elastic modulus is more closely governed by a single-parameter linear relationship.
4.1.4. Interaction-Induced Nonlinear Effects
Since the significant parameters do not act independently when influencing the macroscopic response, this paper further introduces interaction terms to analyze the coupling effects between parameters. Given that both the elastic modulus E and the Poisson’s ratio v are highly sensitive to individual parameters, and their interaction terms do not significantly improve model accuracy, the analysis of interaction terms is limited to the peak strength σc. The mathematical form of the regression model is as follows:
After introducing significant interaction terms, the adjusted R2 of the peak-strength model increased to 0.913, representing a 27.5% improvement over the linear main-effects model, indicating a marked enhancement in fitting accuracy. This suggests that peak strength is not only influenced by the individual effects of τcp, σcp, kp* and n, but also relies more strongly on the coupled interactions among these parameters.
From the model relationships, it can be seen that peak strength is positively correlated with τcpσcp, while it is negatively correlated with τcpσcp, τcp2 and n2. This indicates that there is a synergistic effect between shear strength and normal strength that enhances load-bearing capacity, whereas the coupling between porosity and shear strength weakens peak strength. The significant improvement in the fitting accuracy of peak strength due to the interaction terms also demonstrates that relying solely on empirical or single-parameter analysis makes it difficult to accurately calibrate strength-related parameters; the combined effects of parameters must be considered.
The results of the above analysis provide a clear basis for the subsequent calibration of mesoscale parameters: while the inversion of elastic modulus and Poisson’s ratio is relatively straightforward, peak strength is influenced by the coupling of multiple parameters and requires further consideration of failure modes and parameter ratios to improve the accuracy and efficiency of the calibration.
4.2. Mesoscopic Parameter Calibration
In PFC3D numerical simulations, a porosity n of 0.34 is typically used as the default value for specimen generation. The stiffness ratio kp* can be determined from the inverse calculation of the Poisson’s ratio. In their study on the parameter calibration of a discrete element model for sandstone, Huang Yisheng et al. found through multivariate analysis of variance that the minimum particle radius Rmin has a relatively minor effect on peak strength, elastic modulus, and Poisson’s ratio [36]. Taking into account the relationship between the total number of particles and computational efficiency, this study adopts Rmin = 0.8 mm.
Based on the aforementioned macro–meso mapping relationship, when macroscale parameters such as peak strength σc, elastic modulus E, and Poisson’s ratio v are known, the corresponding values of highly sensitive mesoscale parameters can be derived. For the elastic modulus E and Poisson’s ratio v, since their controlling mesostructural parameters are relatively simple, the parameter inversion process is relatively straightforward; whereas peak strength σc is simultaneously influenced by shear strength τcp, normal strength σcp, porosity n, and stiffness ratio kp*. This multi-parameter control means that similar peak strengths may be obtained from different combinations of τcp and σcp, whereas the associated crack development and failure characteristics may differ. Therefore, the regression equation was used to determine the quantitative strength level and the dominant parameter relationship, while the normal-to-shear bond strength ratio was further considered to constrain the strength-parameter combination.
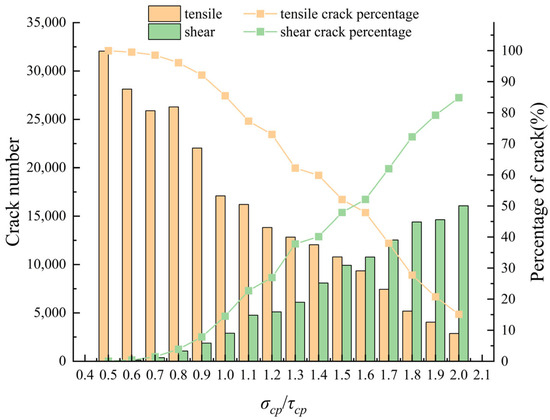
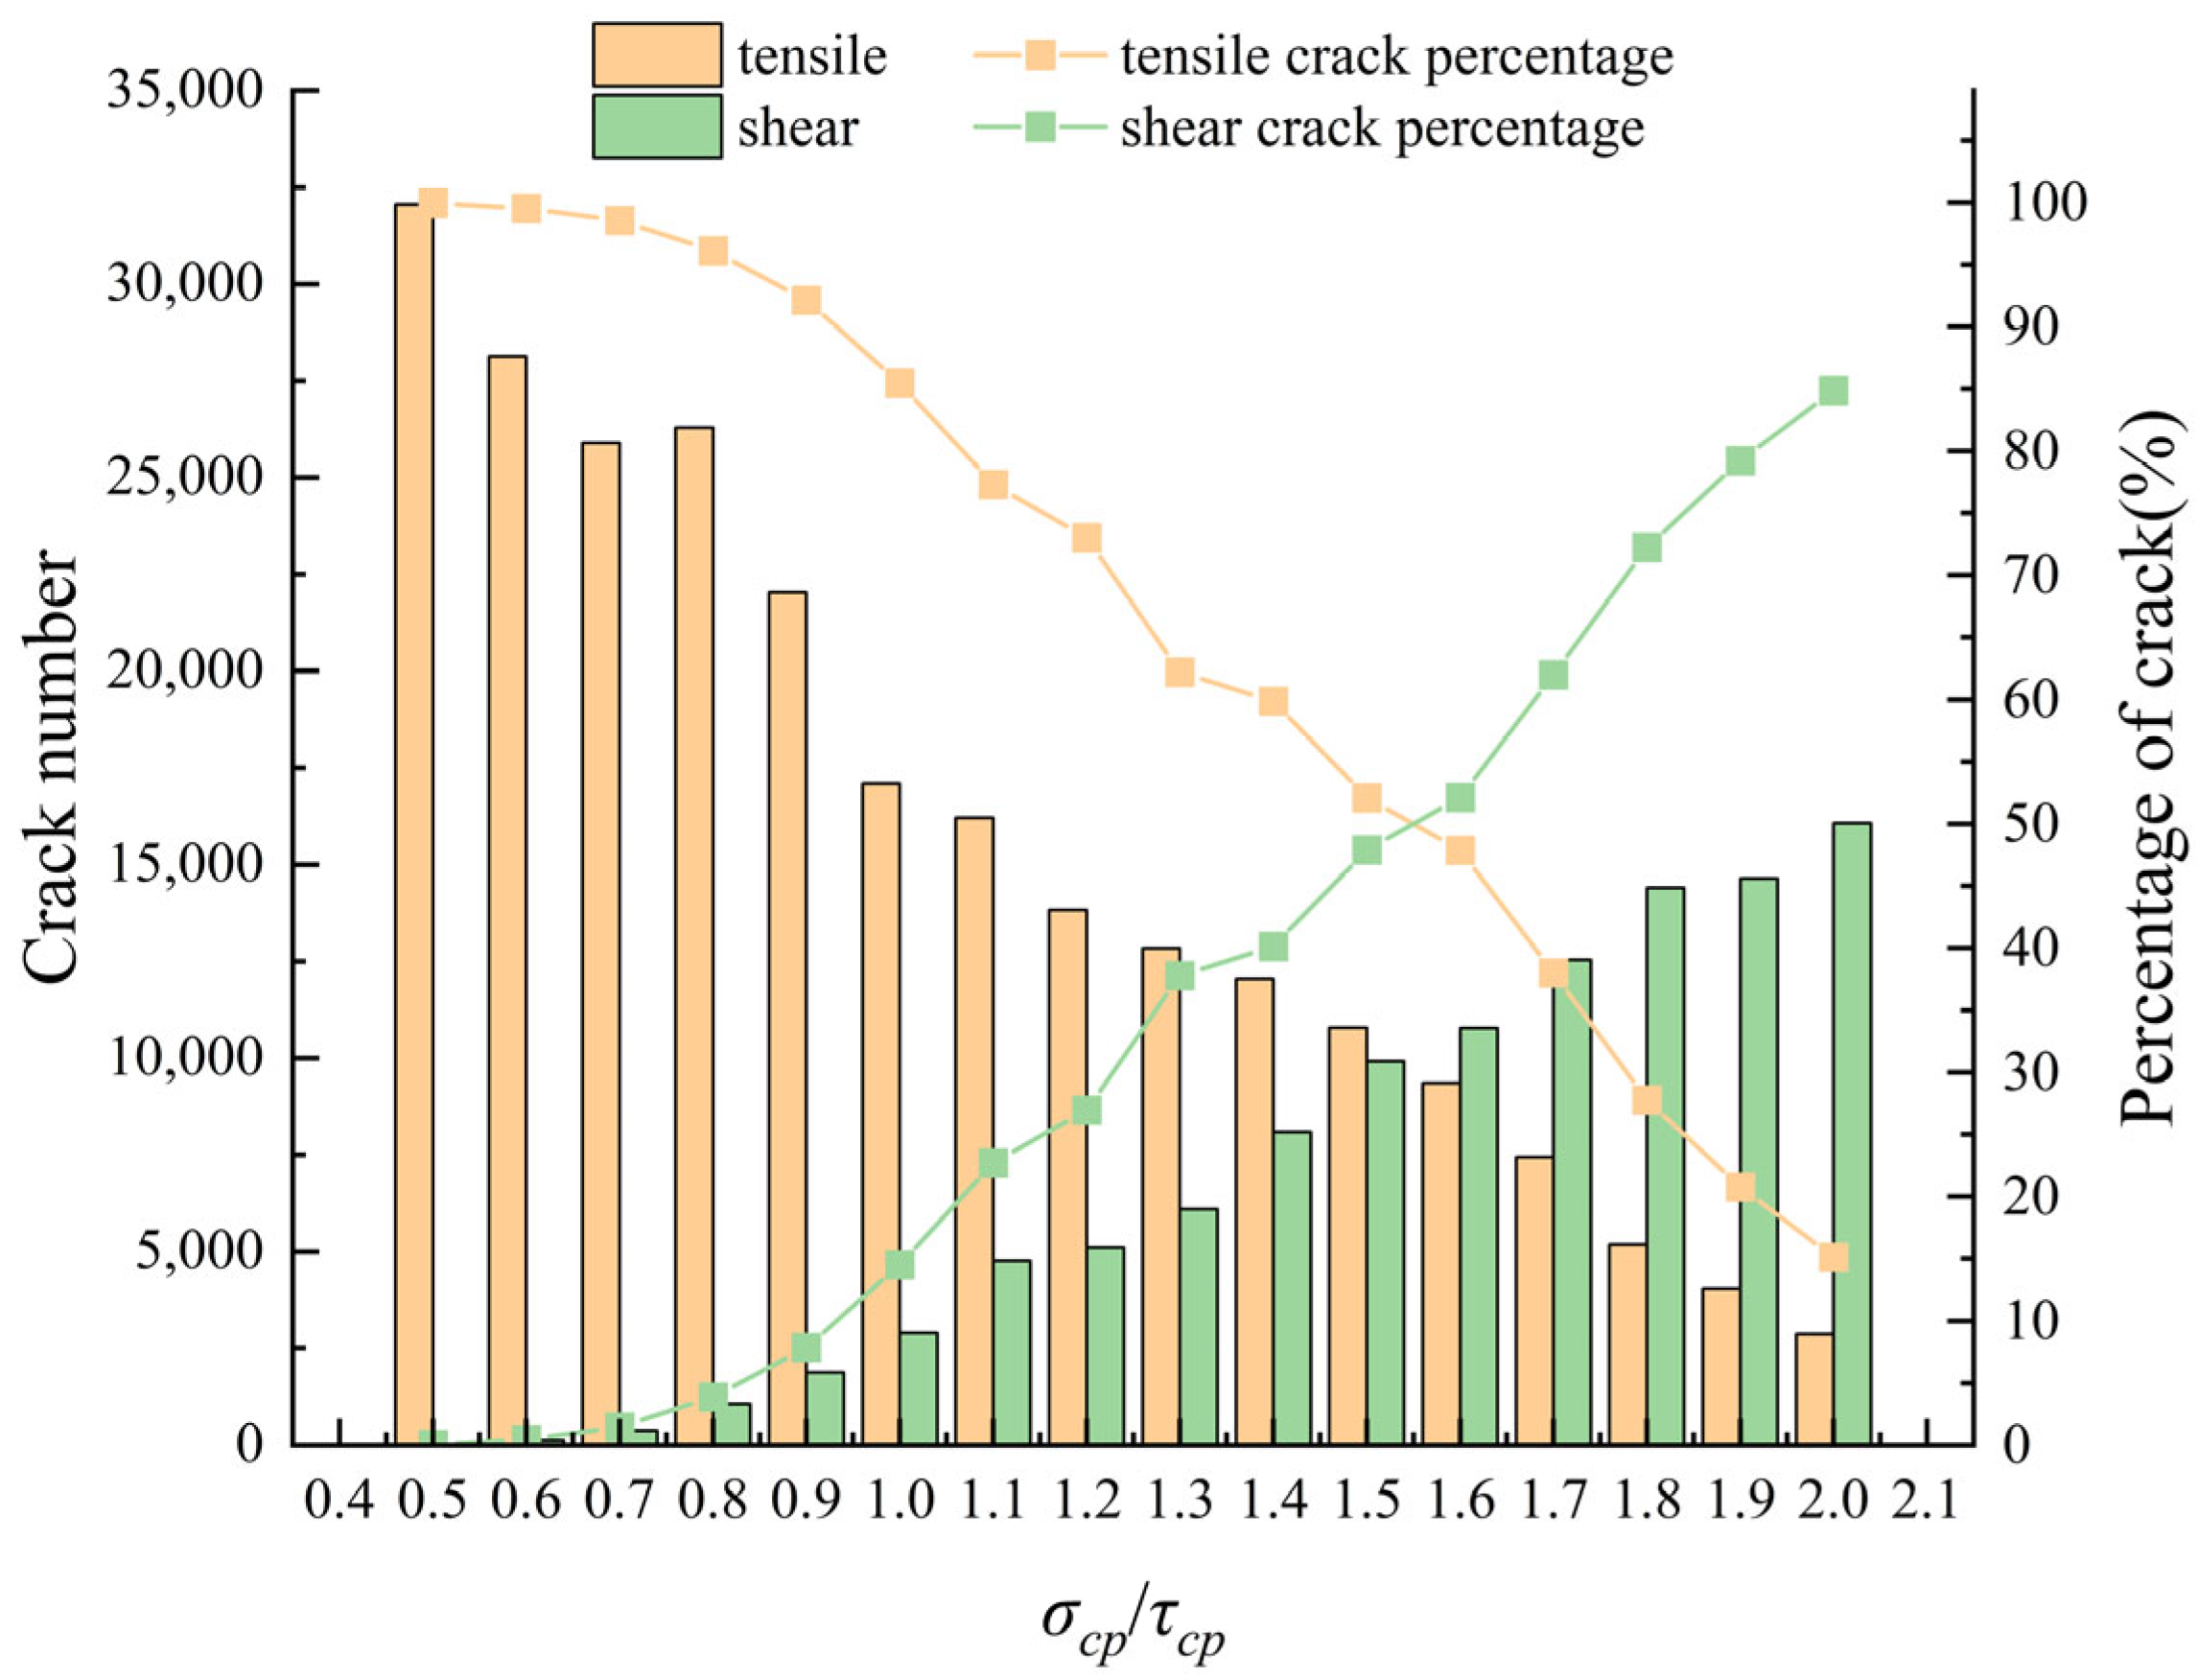
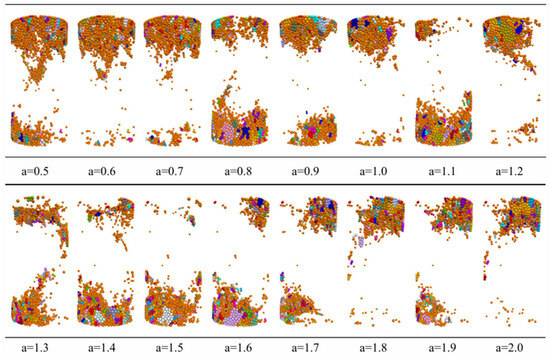
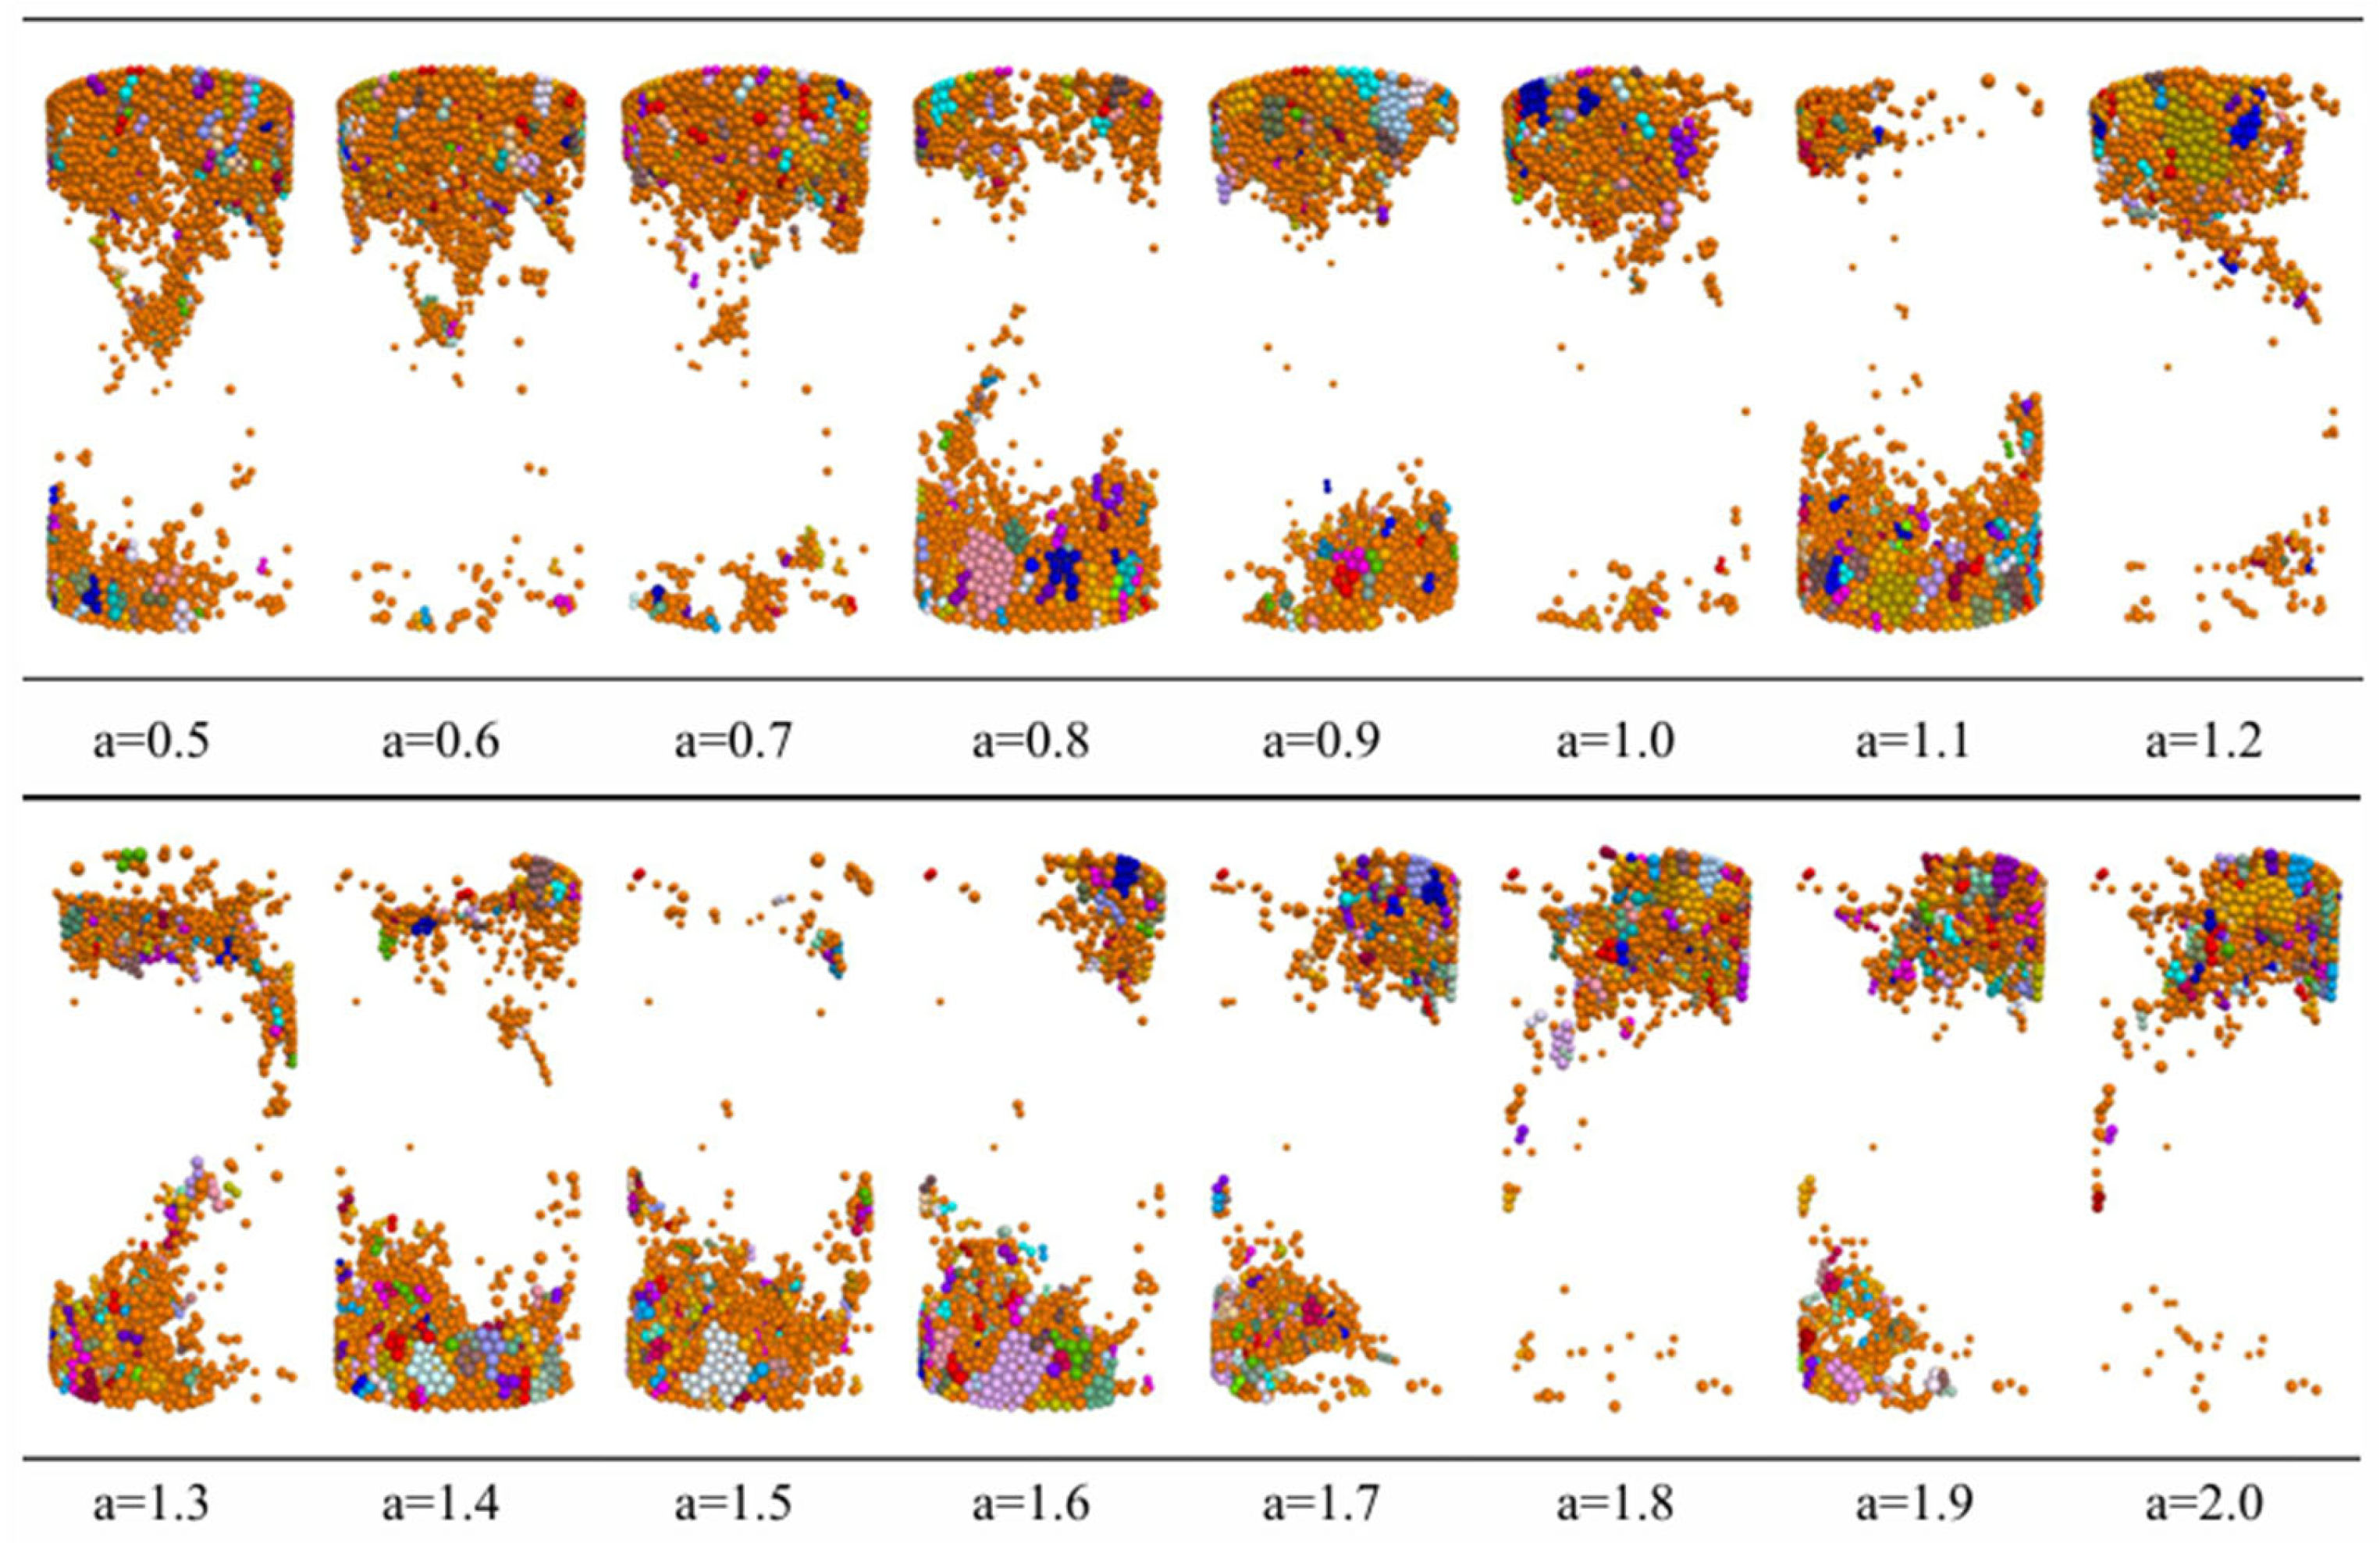
In addition, previous studies have shown that brittle fracture and shear failure account for approximately 60% and 40% of rock fragmentation, respectively, indicating that the strength relationship between the normal and shear bond components should satisfy a certain proportion [37]. On this basis, comparative simulations with different a = σcp/τcp ratios ranging from 0.5 to 2.0 at an interval of 0.1 were further conducted in this study. As shown in Figure 4 and Figure 5, the results showed that when a = 1.4, the simulated crack number was closest to the experimental result, and the failure characteristics were also in better agreement with the laboratory observations. Therefore, this study uses the bond strength ratio 1.4 as the initial constraint for determining the peak strength parameters of green sandstone. Based on this, and in conjunction with the actual failure modes of specimens in uniaxial compression tests, appropriate adjustments are made to the specific combinations of τcp and σcp to ensure that the numerical specimens match the physical specimens in terms of strength levels and failure modes. In this way, the selection of the strength-parameter combination is guided by the macro–meso regression relationship and further constrained by comparative simulations and failure-mode consistency.
Figure 4.
The relationship between the number and proportion of cracks and σcp/τcp.
Figure 5.
Simulated failure modes at different σcp/τcp (the main body of the specimen is hidden; only the failed section is shown).
Following the approach described above, by substituting the macroscopic parameters obtained from uniaxial compression tests into the mapping relationship model, the mesostructural parameters corresponding to the three sets of green sandstone specimens can be determined. The calibration results show that the bond moduli Ecp of the three sets of specimens are 10.396 GPa, 10.312 GPa, and 10.676 GPa, respectively; stiffness ratios kp* are 3.467, 3.510, and 3.456, respectively; normal strengths σcp are 27.670 MPa, 30.900 MPa, and 27.890 MPa, respectively; and shear strengths τcp are 19.689 MPa, 21.220 MPa, and 21.550 MPa, respectively. The above results provide a unified basis of mesostructural parameters for subsequent numerical simulation validation.
4.3. Calibration Result Verification
4.3.1. Verification of Macroscopic Mechanical Parameters
Based on the mesoscale parameters obtained from calibration, uniaxial compression numerical simulations were re-conducted in PFC3D, and the simulation results were compared with those from laboratory tests. As can be seen from Table 5, group A refers to simulation tests conducted based on the calibration results described above, whilst group B refers to physical experiments. The three sets of numerical specimens show good agreement with the physical test results in terms of peak strength, elastic modulus, and Poisson’s ratio. The error rates for peak strength ranged from 0.09% to 3.11%, those for elastic modulus ranged from 0.16% to 0.53%, and those for Poisson’s ratio ranged from 0.70% to 3.745%. Overall, the errors for each indicator were kept at a low level. This level of accuracy is comparable to the results reported in previous DEM/PFC calibration studies. For example, Ji et al. calibrated DEM cohesive granular material using a differential evolution algorithm and reported that four macroparameters, including UCS, direct tensile strength, Young’s modulus, and Poisson’s ratio, could be calibrated with high accuracy, with most calibrations achieving a total relative error below 5% [24]. Heo et al. also emphasized that PFC DEM microparameter calibration is commonly conducted by reproducing the macroscopic behavior of physical specimens through comparisons with laboratory uniaxial or triaxial test results [38]. Against this background, the low error values obtained in this study support the reliability of the calibrated PBM parameter set.
Table 5.
Comparison between numerical experiment results and physical experiments.
Further comparison reveals that the calibration accuracy of the elastic modulus is the highest, with the error consistently remaining within 1%, which is consistent with the fact that it is primarily controlled by a single dominant parameter Ecp. Although the error for the Poisson’s ratio is slightly higher than that of the elastic modulus, it remains at a relatively low level overall, which is related to the high identification accuracy of its dominant parameter, the stiffness ratio kp*. The error in peak strength is relatively slightly larger but is still controlled within 3.11%, indicating that despite the multi-parameter coupling effects present in strength parameters, high-precision parameter inversion can still be achieved by introducing the bond strength ratio as an additional constraint.
From the perspective of calibration efficiency, the advantages of the proposed method are evident. Traditional trial-and-error calibration usually requires experience-based adjustment of multiple mesoscopic parameters and repeated numerical simulations to gradually approach the target macroscopic response, which is time-consuming. Although optimization algorithms and response-surface methods have been used to improve calibration efficiency, the direct interpretation of dominant parameter–response relationships remains limited in some cases. In the present framework, XGBoost is first used to identify the dominant mesoscopic parameters, and stepwise regression is then employed to establish explicit macro–meso mapping equations. Once the mapping relationships are obtained, the target macroscopic parameters can be substituted into the equations to rapidly estimate the corresponding mesoscopic parameters. This procedure improves calibration efficiency while retaining clear mathematical interpretability for macro–meso-parameter inversion.
4.3.2. Stress–Strain Curve and Failure Mode Verification
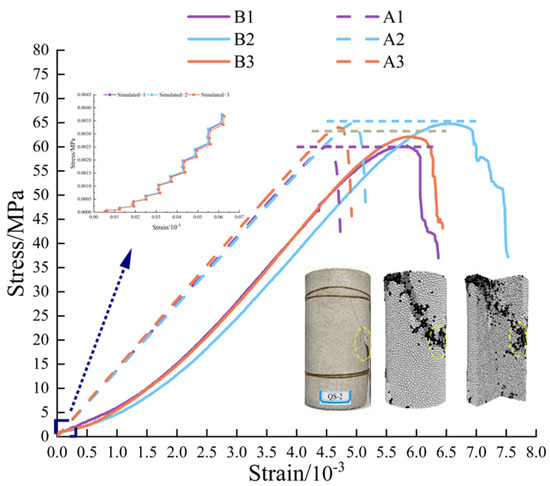
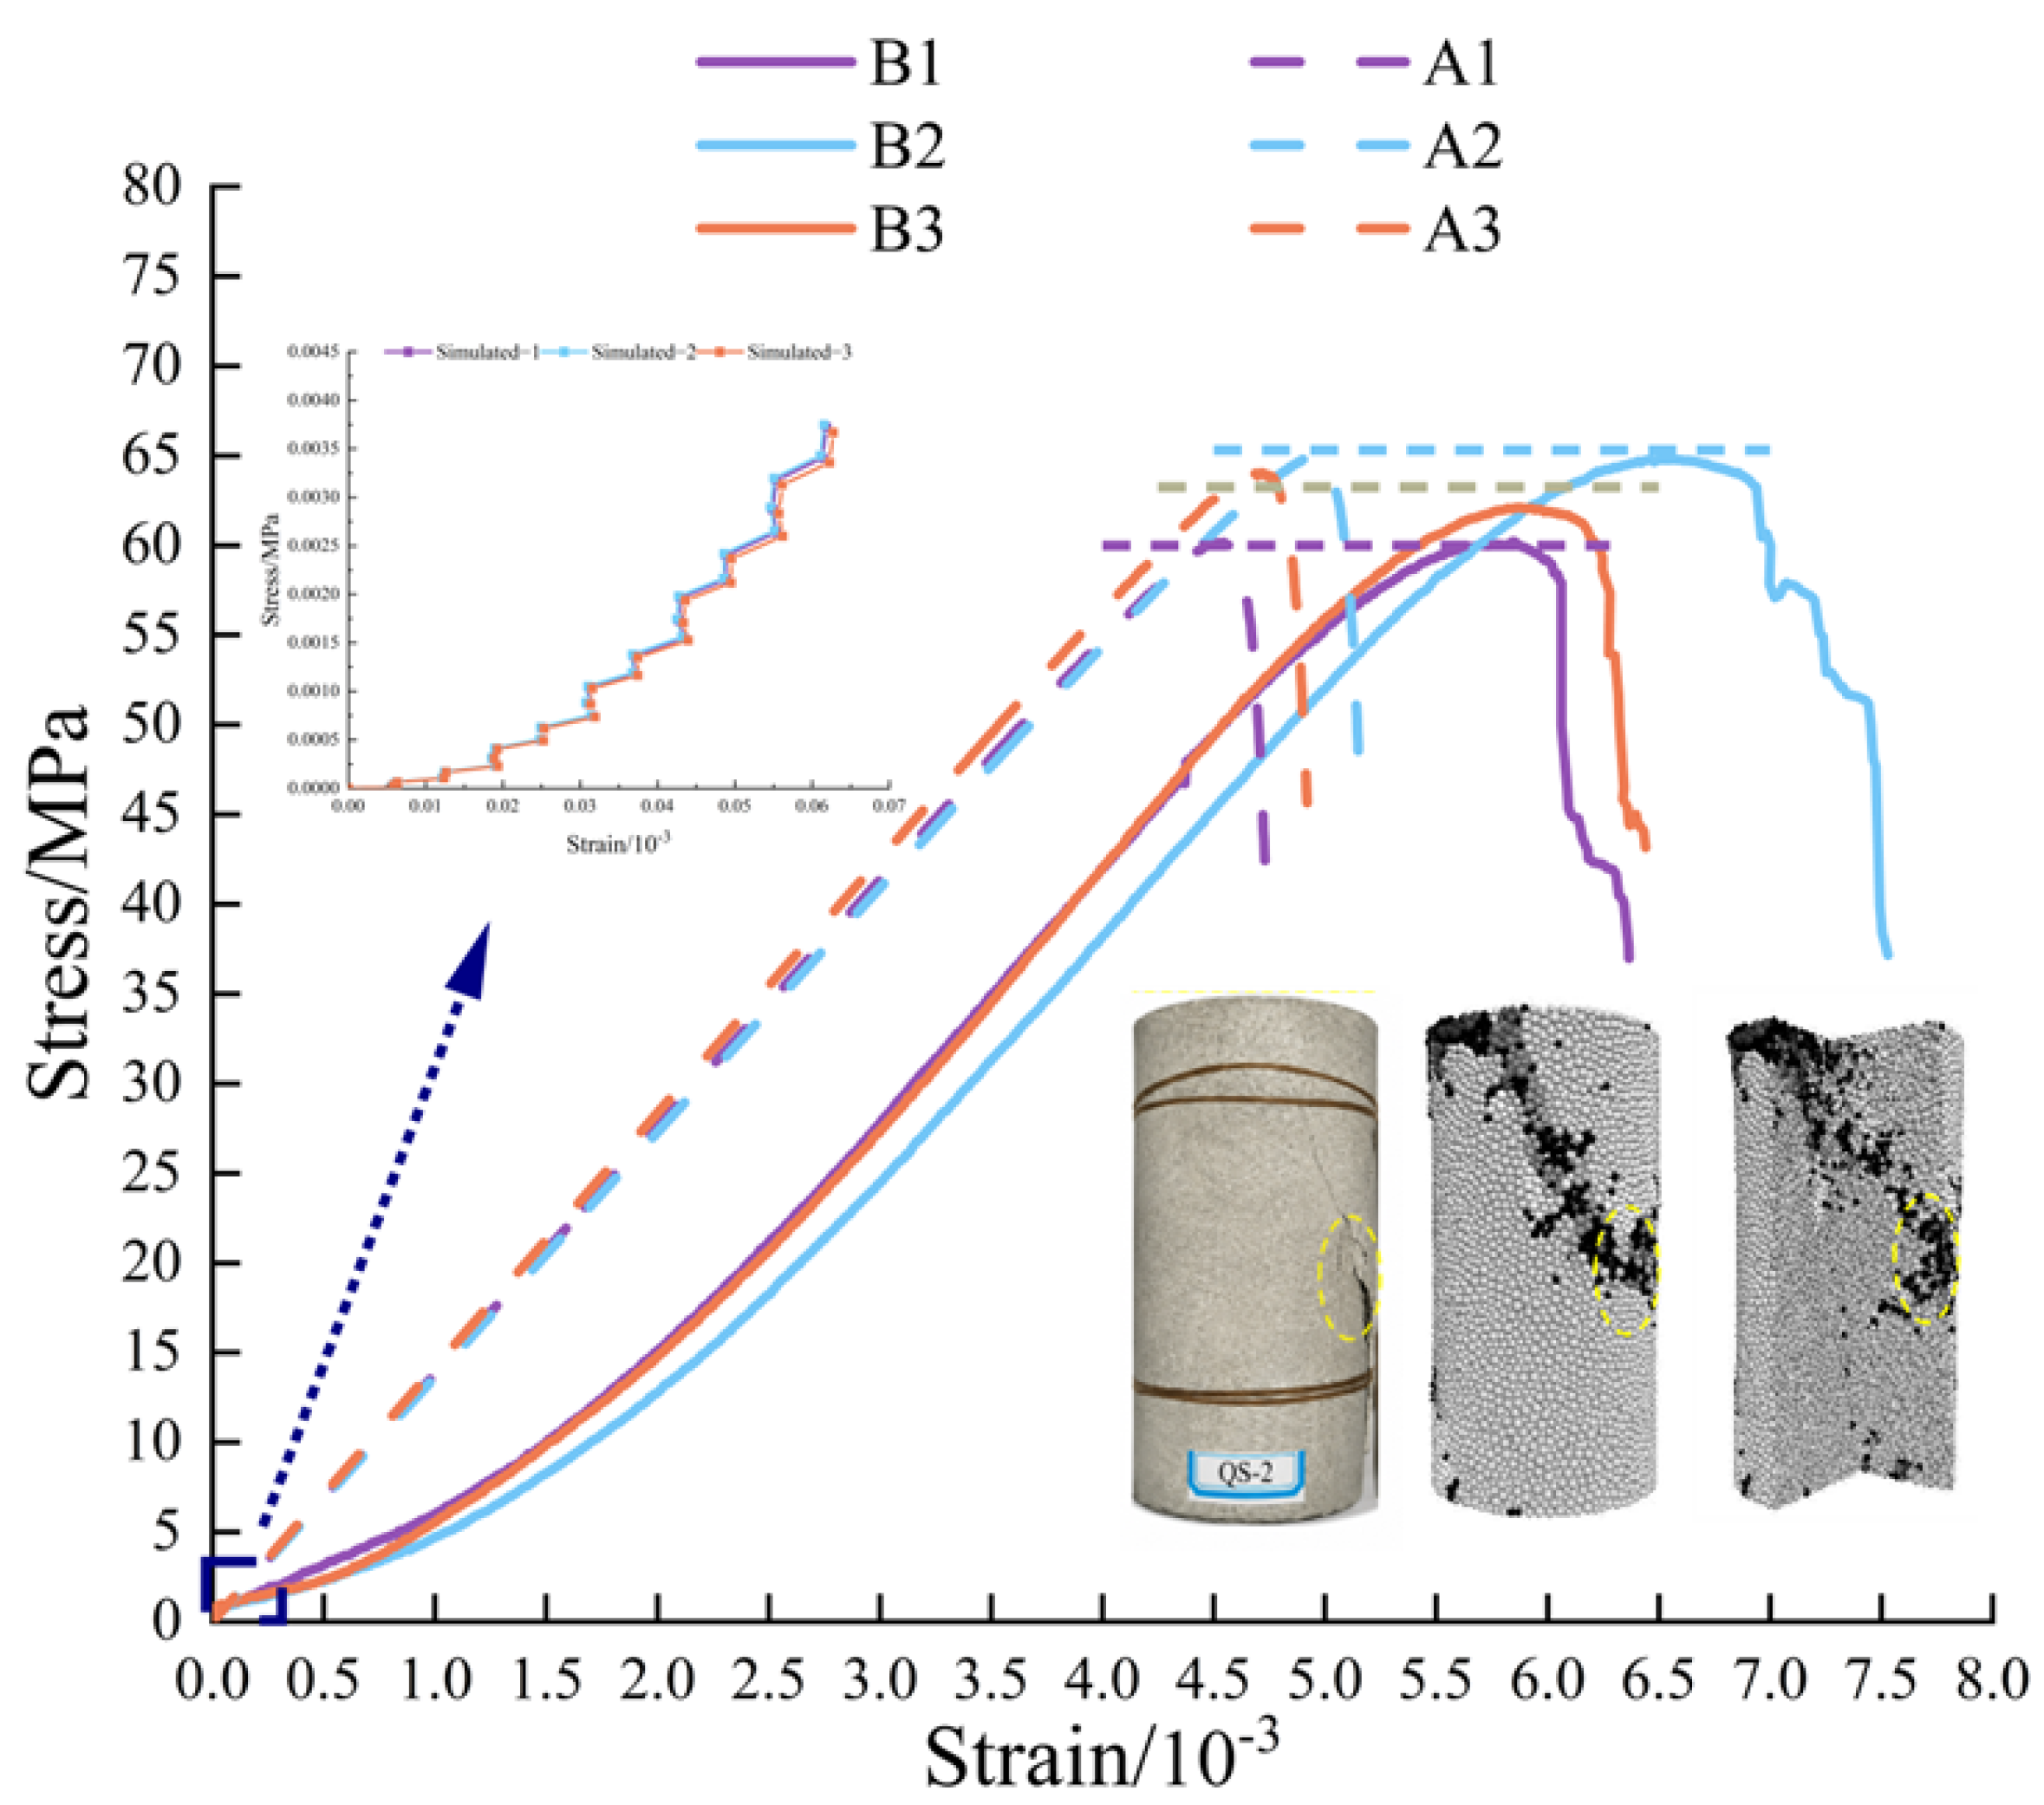
In addition to comparing errors in macroscopic mechanical parameters, the stress–strain curves and failure morphologies of the numerical and physical specimens were further compared to evaluate the deformation and failure characteristics represented by the calibrated parameters. As shown in Figure 6, the experimental and numerical stress–strain curves can be analyzed according to the typical deformation stages of rock under uniaxial compression, including initial compaction, elastic deformation, stable crack development, and post-peak failure.
Figure 6.
Comparison of experimental and simulated stress–strain curves and failure patterns used for meso-parameter calibration. (The section enclosed by the yellow dotted circle shows a comparison between the physical test results and the simulated failure zone.).
In the initial compaction stage, the experimental curves exhibit a more evident concve-up feature, which is related to the closure of pre-existing pores, microcracks, and weak structural surfaces in the natural green sandstone specimens. By contrast, the numerical curves show a shorter and less pronounced compaction stage. This is because the DEM specimens are generated from an idealized particle assembly with prescribed porosity, and the initial microdefects and heterogeneous cementation existing in natural rock are not fully represented.
In the elastic deformation stage, the numerical and experimental curves show similar slopes. This agrees with the low error of the calibrated elastic modulus shown in Table 4 and indicates that the calibrated bond modulus and stiffness-related parameters can reasonably reproduce the elastic stiffness of green sandstone. Near the peak stage, the numerical curves reproduce the peak strength well, but they reach the peak stress at smaller axial strains than the experimental curves. This suggests that the present calibration framework can effectively reproduce the strength level, but the peak strain and detailed pre-peak damage accumulation are not fully captured. The earlier peak strain in the numerical model may be associated with the simplified spherical-particle packing, relatively uniform bond properties, and faster formation of the load-bearing contact network.
In the post-peak stage, the simulated failure mode shown in Figure 5 is generally consistent with the laboratory observation. Both the numerical and experimental specimens exhibit shear–brittle composite failure characteristics, with a dominant shear zone and local block detachment. Therefore, Figure 5 indicates that the calibrated parameter set can reasonably reproduce the main strength level, elastic response, damage-development trend, and final failure morphology of green sandstone. The main discrepancy lies in the shortened initial compaction stage and the smaller simulated peak strain.
To further validate the validity of the mesoscale parameter calibration results, this study compares the ultimate failure modes of numerical specimens and physical specimens under uniaxial compression. The surface of the physical specimens generally exhibits a primary shear band extending from the end face toward the center of the side face, accompanied by small-scale spalling in localized areas, and overall displays typical shear–brittle composite failure characteristics. The failure results of the numerical specimen under the ball fragment mode show that a principal shear zone formed inside the specimen, aligned with the direction of the physical specimen, and localized block detachment also occurred at corresponding locations. To further examine the internal failure structure of the specimen, a cross-sectional analysis was performed on the numerical model. The results indicate the presence of continuous and distinct shear planes within the specimen, accompanied by noticeable block detachment in localized areas, demonstrating a high degree of consistency with the internal failure characteristics of the physical specimen. Overall, the numerical specimen successfully reproduced the actual failure patterns observed in the uniaxial compression tests of green sandstone in terms of the main crack direction, shear zone location, and local fragmentation characteristics. Combined with the aforementioned comparisons of macroscopic mechanical parameter errors and stress–strain curves, it can be concluded that the parameter calibration method proposed in this study not only exhibits high numerical accuracy but also demonstrates good applicability in simulating failure mechanisms and morphologies.
In summary, the calibrated parameters are suitable for describing the primary mechanical response and dominant failure characteristics of green sandstone. They also provide a sound basis for evaluating the relative fracture and energy evolution characteristics under representative impact conditions.
4.3.3. Comparison of Energy Density Before the Peak
To further evaluate the differences between physical testing and numerical simulation in terms of energy absorption, this paper calculates the energy absorption density prior to the peak using the area under the stress–strain curve. The calculation formula is as follows:
where Up is the pre-peak absorbed energy density, σ is the axial stress, and εp is the axial strain corresponding to the peak stress. Since the stress is expressed in MPa and the strain is dimensionless, the calculated energy density has the unit of MJ/m3. Using physics experiments as a benchmark, a comparison of the pre-peak energy density in physical experiments and numerical simulations is shown in Table 6.
Table 6.
Comparison of pre-peak absorbed energy density between laboratory tests and numerical simulations.
As shown in Table 6, the pre-peak energy absorption densities of the physical specimens were 0.168, 0.200, and 0.169 MJ/m3, respectively, while the corresponding numerical simulation results were 0.138, 0.167, and 0.156 MJ/m3, with relative errors of 17.86%, 16.50%, and 7.69%, respectively. The numerical results are slightly lower than the experimental results, indicating that the calibrated model underestimates the pre-peak energy absorption capacity to some extent. This discrepancy is consistent with the comparison of the stress–strain curves in Figure 3, namely, the initial consolidation stage of the numerical curve is shorter, and the peak stress is reached at a smaller axial strain.
The higher pre-peak energy absorption density observed in the physical tests is primarily attributed to the more pronounced consolidation process in natural green sandstone. During the initial consolidation stage, primary pores and microcracks gradually close, thereby dissipating a portion of the input energy. In contrast, the simulated specimens are generated from an idealized aggregate of particles, which provides a limited representation of initial defects. Consequently, the consolidation phase in the numerical curves is shorter, the pre-peak deformation path is shorter, and the area under the stress–strain curve prior to the peak stress is smaller.
It should also be noted that the consolidation stage primarily reflects the closure of primary defects; it is not the dominant stage for the massive generation and unstable propagation of new cracks. Major crack propagation and failure localization typically occur during the subsequent damage accumulation stage and the post-peak failure stage. Under impact loading conditions, the loading duration is shorter, and the consolidation process is further compressed. Therefore, although the energy density absorbed before the peak is relatively low, its influence on subsequent crack growth patterns, ultimate failure modes, and the analysis of impact energy evolution is relatively limited.
4.4. Analysis of Impact Crushing Energy Evolution
4.4.1. Impact Crushing Methodology and Definition of Energy Metrics
After calibrating the mesostructural parameters of the green sandstone, this study conducted numerical simulations of drop-weight impact crushing under a set of representative impact conditions to further evaluate the model’s applicability to dynamic fracture problems. The impact crushing model utilized standard cylindrical green sandstone specimens consistent with the parameters calibrated earlier, with dimensions of 50 mm in diameter and 100 mm in height. Impact loading was applied via a top-mounted falling hammer, with the bottom boundary fixed, to simulate the dynamic failure process of the specimen under a single forward impact at a velocity of 6 m/s. The FISH program was used to simultaneously record the evolution of input energy, fracture energy, and crack count over time, thereby establishing a correlation between energy changes and crack propagation.
During the impact process, the external input energy can be characterized by the kinetic energy loss of the falling hammer. Let the mass of the falling hammer be m, the velocity at the moment of contact be v0, and the velocity at the moment of separation be vt. Then, the energy input into the specimen from the start of the impact to that moment can be expressed as
The FISH program calculated the input energy for this impact crushing process to be 78.9 J.
To characterize the effective portion of the input energy involved in crack initiation and propagation, this paper introduces the equivalent fracture energy Gf. This energy is used to characterize the energy corresponding to crack initiation, propagation, and penetration during the impact process. The energy utilization efficiency ηf is defined as
When ηf is small, it indicates that only a small portion of the input energy is used for crack initiation; when ηf is high, it indicates that a larger proportion of the input energy is involved in crack propagation and the formation of the fracture surface.
4.4.2. Crack Propagation and Energy Utilisation Efficiency
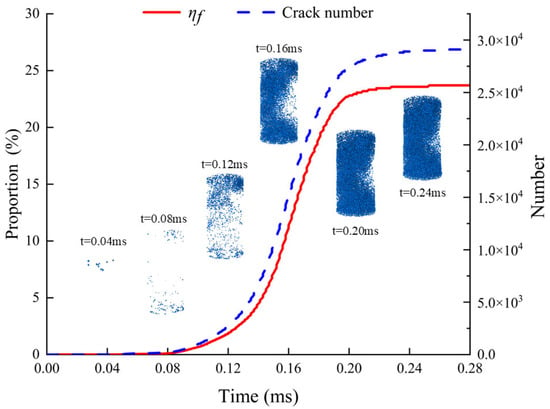
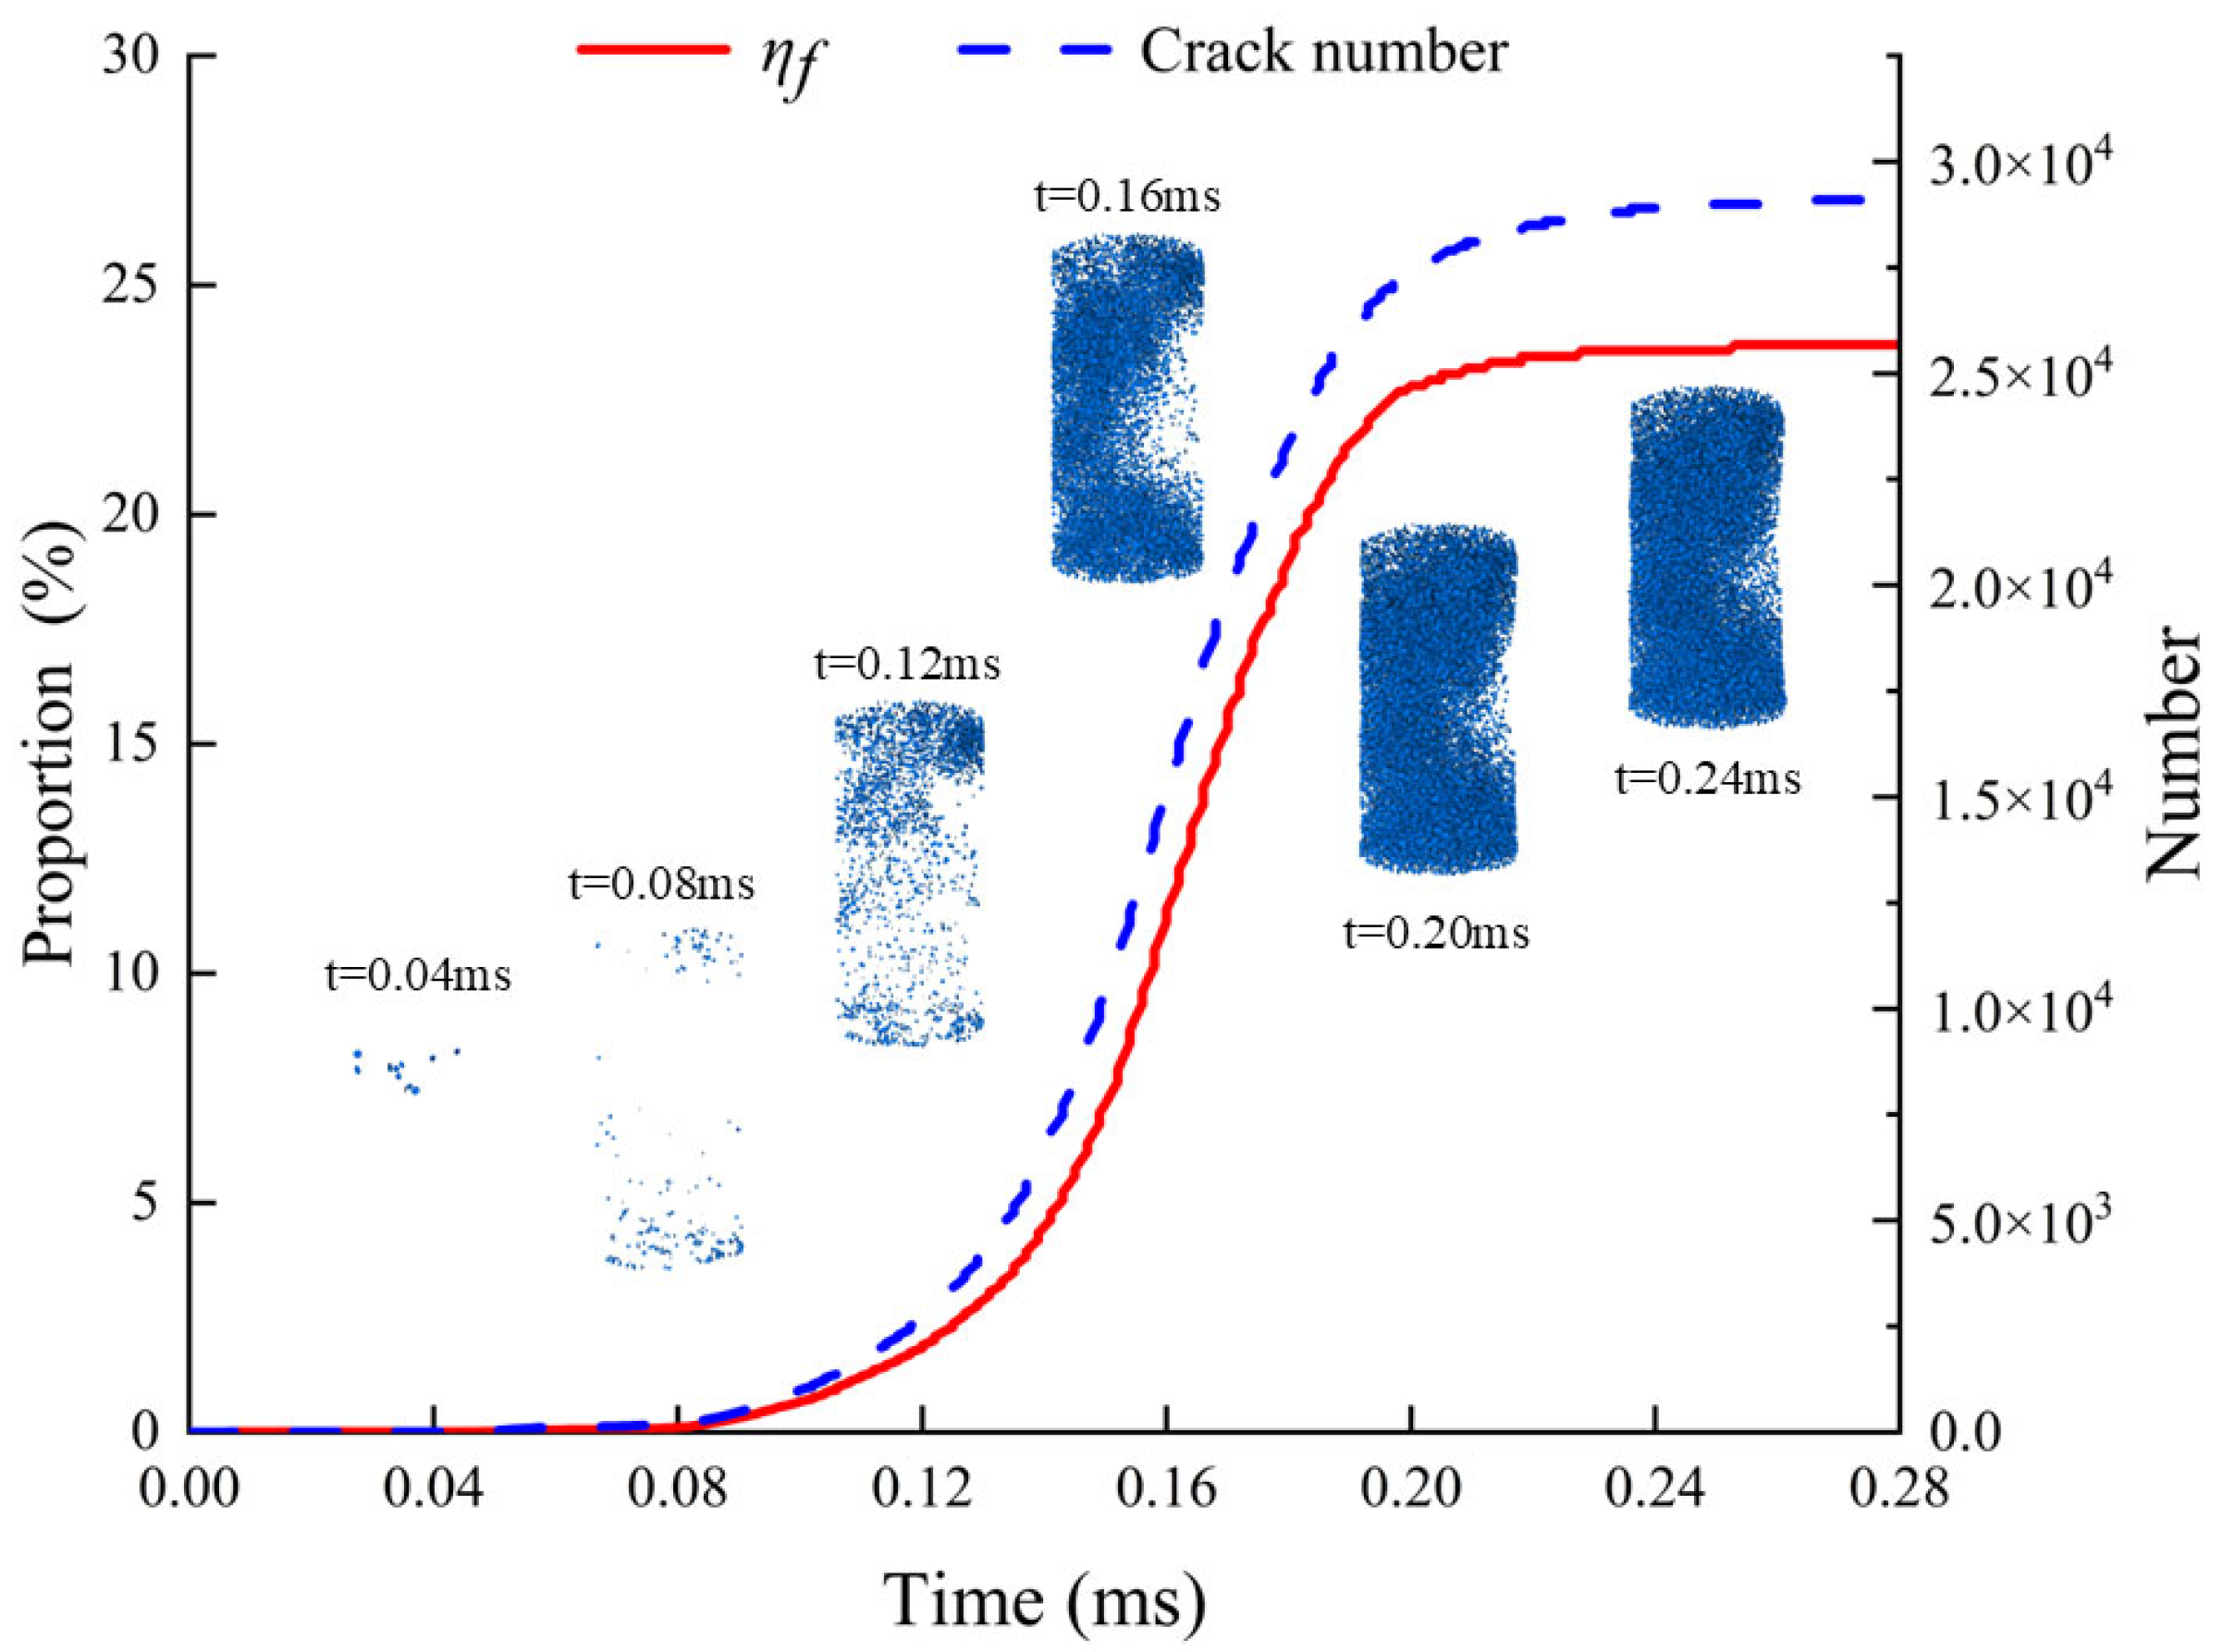
Figure 7 shows the energy and crack propagation at an impact velocity of 6 m/s.
Figure 7.
Energy-crack evolution diagram.
As can be seen from Figure 7, under simulated impact conditions, the efficiency of fracture energy utilization ηf evolves continuously with the duration of the impact. In the initial stage of the impact, after the falling hammer makes contact with the specimen, internal cracks are still in the initiation phase. The number of cracks is small and their propagation is limited; the input energy has not yet been extensively converted into the effective energy required for crack propagation. Consequently, the energy utilization efficiency ηf increases slowly and remains at a low level. During this stage, the specimen primarily exhibits microcrack initiation, with no macroscopic failure yet apparent. Energy consumption is mainly concentrated in local elastic deformation and contact adjustment. Cracks are primarily concentrated in the hammer contact zone and areas of localized tensile stress concentration; they are few in number and short in length, and have not yet formed a distinct interconnected network.
As the impact continues, cracks within the specimen evolve from local initiation to stable propagation: the number and area of cracks increase rapidly, crack paths become progressively clearer and extend along preferred directions, and some cracks begin to interconnect, forming localized zones of failure. At this point, the efficiency of fracture energy utilization ηf significantly improves, indicating that an increasingly larger proportion of the input energy is used to drive crack propagation and the formation of new fracture surfaces. The spatial distribution of cracks gradually aligns with the preferred direction, and interconnected propagation occurs in some regions. This not only accelerates the formation of fracture surfaces but also causes the energy conversion efficiency to rise at an accelerating rate. This stage corresponds to the critical transition process as the specimen progresses from localized damage to global failure, and it is the primary stage in which energy utilization is significantly enhanced during impact fracture.
As the crack propagates further and forms a main crack or a through-failure zone, the failure within the specimen exhibits a distinct global nature, and the block begins to separate. At this stage, part of the input energy continues to be used for crack propagation, but a significant proportion of the energy begins to contribute to block movement and secondary collisions between fragments. The fracture energy utilization efficiency ηf gradually stabilized in the later stages, settling at around 23.7%. The crack network gradually forms a continuous and stable structure, with through-cracks becoming the dominant failure path, and the failure process gradually transitions from crack initiation to block disintegration. It can thus be seen that the conversion of input energy into crack initiation energy during the impact-fragmentation process is not a linear accumulation, but rather exhibits distinct phasic characteristics accompanying crack propagation and the evolution of the failure mode.
Overall, the calibrated mesoscale parameters can reasonably describe the quantitative relationship between “input energy–crack initiation–failure surface formation” under impact crushing conditions, providing a clear basis for understanding the evolution of energy. Combined with the static validation results, the impact simulation further shows that the calibrated parameter set can be used to analyze the staged evolution of crack development and fracture-related energy under the selected impact condition. This establishes a quantifiable theoretical foundation for subsequent analyses of crushing mechanisms, evaluations of energy efficiency, and optimizations of crushing process parameters under various impact conditions, while also validating the transferability of the stepwise regression method combined with feature selection under dynamic crushing conditions.
5. Discussion
Traditional parameter calibration for discrete element models often relies on a “trial-and-error” approach. While this method remains practical when the number of parameters is small or the subject of study is relatively simple, its limitations become apparent when the number of parameters to be calibrated increases, parameter couplings intensify, or there is more than one macroscopic response target. First, the trial-and-error method lacks a clear hierarchy of parameter influence, making it difficult to determine which parameters play a dominant role. Second, the method is highly dependent on the researcher’s experience, and different researchers often arrive at different parameter combinations. Finally, as the number of parameters increases, the search space expands rapidly, making the trial-and-error process time-consuming and unstable. In contrast, the method proposed in this paper uses prior sensitivity screening to clarify the hierarchy of parameter effects and employs explicit models for inversion, offering significant advantages over traditional trial-and-error methods in terms of efficiency, reproducibility and interpretability.
Compared to methods that rely entirely on black-box proxy models, the core of the approach presented in this paper does not lie in simply pursuing higher predictive accuracy, but rather in balancing fitting ability with interpretability under conditions of limited data. For discrete-parameter calibration problems, there is typically a nonlinear or multi-parameter coupling between macroscopic responses and mesoscopic parameters. Therefore, identifying the dominant mesoscopic parameters before establishing macro–meso mapping relationships is important for reducing calibration dimensionality and improving the clarity of parameter inversion. Although black-box models may theoretically achieve high fitting accuracy, they require a large number of samples and lack interpretability, making it difficult to directly elucidate the physical mechanisms underlying the meso-parameters. This paper employs XGBoost for preliminary screening, followed by stepwise regression to establish explicit mapping relationships. By combining the nonlinear recognition capabilities of machine learning with the interpretability of statistical regression, the approach ensures predictive accuracy while also elucidating the contributions and mechanisms of different meso-parameters to the macroscopic response.
For responses such as peak strength, which are jointly controlled by multiple parameters, the results indicate that relying solely on main effect terms is insufficient to achieve adequate fitting accuracy; it is necessary to introduce quadratic and interaction terms to reflect nonlinear coupling characteristics. However, when key parameters such as elastic modulus and Poisson’s ratio are relatively concentrated, explicit models are already capable of providing a satisfactory description. This suggests that it is more reasonable to adopt models of varying complexity for different responses, enabling the entire calibration method to maintain interpretability while still achieving good predictive accuracy.
The method presented in this paper not only calculates results but also interprets them and guides subsequent modeling, holding practical significance for the application of discrete element models in rock mechanics and crushing engineering. Specifically, the proposed XGBoost–stepwise regression framework provides an efficient and interpretable route for PBM meso-parameter calibration of green sandstone by linking parameter importance ranking, explicit regression mapping, and experimental verification. The analysis of impact crushing energy not only verifies the transferability of parameters but also provides a quantifiable basis for evaluating energy utilization efficiency under different operating conditions. In this study, the impact-fragmentation analysis is used as a representative application of the calibrated parameter set, showing that the calibrated meso-parameters can support the analysis of the staged relationship among input energy, fracture-related energy, and crack development.
5.1. Limitations
Although the method presented in this paper has achieved satisfactory results under uniaxial compression conditions, certain limitations remain. First, the sample data were obtained from uniaxial compression tests, and the established macro–meso mapping relationship is primarily applicable to peak strength, elastic modulus, and Poisson’s ratio under these specific conditions. Under different loading conditions—such as confining pressure, cyclic loading, or high-strain-rate impact—the parameter-control relationships may change, and the original mapping model may not be directly applicable. In addition, the stress–strain curves, failure morphology, peak strain, and pre-peak absorbed energy density were used as verification indicators rather than direct inversion targets. Although the calibrated PBM parameters can reproduce the main mechanical indices and dominant failure characteristics, the detailed reproduction of peak strain, the full pre-peak deformation path, and energy absorption capacity can be further improved by incorporating peak strain, absorbed energy density, crack-initiation stress, and full-curve similarity into a multi-objective calibration framework.
For the green sandstone specimens investigated in this study, the normal-to-shear bond strength ratio of 1.4 produced a good match between the simulated and experimental crack characteristics under uniaxial compression. When the method is applied to other rock types or loading paths, this ratio can be further determined by combining laboratory failure-mode comparison with numerical sensitivity analysis.
Although R min was included in the XGBoost sensitivity analysis and was not identified as a dominant factor for peak strength, elastic modulus, and Poisson’s ratio, particle size may still influence crack-related quantities and fragmentation details. A finer particle assembly usually contains more contacts and potential bond-breakage events, which may affect crack number, local crack path, and fragment-size characteristics. The established macro–meso mapping relationships are therefore considered reliable for the present calibration targets within the adopted particle-size range. When the research objective shifts to detailed crack density, crack propagation path, or fragment-size distribution, additional particle-size sensitivity or convergence analysis should be conducted.
Second, although the stepwise regression model improves fitting capability through main effects, quadratic terms, and interaction terms, it remains a low-order explicit model. When higher-order nonlinearities or complex local responses exist between mesostructural parameters and macroscopic responses, the model may fail to fully capture their variation patterns. This is particularly true for peak strength, where multi-parameter coupling is significant; even with the inclusion of interaction terms, the model remains an approximate representation. This implies that the method presented in this paper is better suited for establishing mapping relationships with clear physical significance and good engineering interpretability, rather than pursuing optimal fitting at the limit.
Furthermore, the impact energy analysis employs an efficiency metric based on the ratio of fracture-related energy to input energy; this remains, in essence, an equivalent characterization rather than a strictly material-intrinsic fracture energy. This method is suitable for analyzing relative changes in crack propagation efficiency across different loading stages. To enhance physical rigor, the definition and calculation of fracture-related energy can be further refined by combining precise crack area statistics, extraction of local contact energy, or multiscale fracture analysis.
5.2. Future Research Directions
Future research could be conducted in the following areas: First, extend the analysis to different confining pressures, strain rates, and impact load conditions to investigate how operational variations affect the sensitivity ranking and mapping relationships of parameters. Second, incorporate additional structural parameters—such as bedding, jointing, or particle shape distribution—to expand the mesostructural parameter framework. Third, while maintaining the interpretability advantages of explicit models, introduce more flexible nonlinear modeling strategies to improve the ability to capture complex responses. Fourth, further coupling parameter calibration with energy efficiency analysis, so that parameter inversion not only serves to reproduce macroscopic mechanical responses but can also be applied to the evaluation of crushing efficiency and energy utilization efficiency.
6. Conclusions
This study focuses on green sandstone and establishes an XGBoost–stepwise regression calibration framework for PFC3D parallel-bond mesoscopic parameters. Based on uniaxial compression tests and 150 LHS-generated numerical samples, the dominant mesoscopic parameters controlling peak strength, elastic modulus, and Poisson’s ratio were identified, and explicit macro–meso mapping equations were constructed. The calibrated parameter set was then verified through macroscopic mechanical indices, stress–strain curves, failure morphology, and representative impact-fragmentation analysis. The main conclusions are as follows:
- (1)
- The XGBoost sensitivity analysis showed that different macroscopic responses are governed by different mesoscopic parameters. Peak strength is jointly controlled by bond shear strength, bond normal strength, bond stiffness ratio, and porosity; elastic modulus is mainly controlled by bond effective modulus; and Poisson’s ratio is mainly influenced by the bond stiffness ratio. In contrast, Rmin was not identified as a dominant factor for the three selected macroscopic responses within the adopted particle-size range. These results indicate that mesoscopic parameter calibration should be conducted according to specific target responses rather than through a uniform all-parameter trial-and-error adjustment.
- (2)
- The stepwise regression models established from the significant parameters provided explicit and interpretable macro–meso mapping relationships for green sandstone. The main-effect terms showed that peak strength is affected by both bond strength and structural parameters, elastic modulus is positively related to bond effective modulus, and Poisson’s ratio is mainly associated with bond stiffness ratio. The inclusion of quadratic terms improved the fitting accuracy of the peak-strength and Poisson’s ratio models, while the interaction terms increased the adjusted R2 of the peak-strength model by 27.5%. These results indicate that the strength response is controlled by multi-parameter coupling, whereas elastic modulus and Poisson’s ratio show more concentrated parameter-control characteristics.
- (3)
- The calibrated PBM parameters reproduced the main macroscopic mechanical indices with low errors. The errors of peak strength, elastic modulus, and Poisson’s ratio were controlled within 3.11%, 0.53%, and 3.745%, respectively. The stress–strain curves and failure morphologies further showed that the calibrated model can reasonably reproduce the elastic response, strength level, damage-development trend, and dominant shear–brittle composite failure characteristics of green sandstone. However, the numerical curves reached peak stress at smaller axial strains than the experimental curves, and the pre-peak absorbed energy density was slightly underestimated. The laboratory values of pre-peak absorbed energy density were 0.168, 0.200, and 0.169 MJ/m3, whereas the corresponding numerical values were 0.138, 0.167, and 0.156 MJ/m3. This difference is mainly associated with the simplified representation of initial compaction in the DEM specimens.
- (4)
- The calibrated parameter set was further applied to a representative impact-fragmentation simulation to analyze the staged evolution of input energy, crack development, and fracture-related energy. During the early impact stage, cracks mainly appeared as localized initiation, and the fracture-related energy ratio remained low. As cracks developed from local propagation to stable connection, a larger proportion of input energy was converted into fracture-related energy. After the main crack penetrated and block separation occurred, the energy-evolution trend gradually stabilized. These results indicate that the calibrated parameter set can be used to analyze the relative fracture and energy-evolution characteristics under the selected impact condition.
- (5)
- The proposed workflow, consisting of XGBoost-based significant parameter screening, stepwise regression mapping, mesoscopic parameter calibration, and static–dynamic verification, provides an efficient and interpretable route for PBM parameter calibration of green sandstone. Within the verified particle-size range and uniaxial-compression-based calibration targets, the established macro–meso mapping relationships can support subsequent analysis of fracture development and energy utilization under representative impact conditions.
Author Contributions
C.Y.: methodology, data curation, writing—editing, and funding acquisition. Y.P.: funding acquisition, resources, and writing—review and editing. C.Z.: investigation and project administration. T.H.: software, conceptualization, and writing—review and editing. X.C.: methodology and project administration. Y.Z.: writing—review. All authors have read and agreed to the published version of the manuscript.
Funding
This research was funded by the National Natural Science Foundation of China (NSFC) (Grant No. 52074308). This research was funded by the Open Foundation of State Key Laboratory of Intelligent Optimized Manufacturing in Mining & Metallurgy Process (BGRIMM TECHNOLOGY GROUP) (BGRIMM-KZSKL-2024-01).
Data Availability Statement
The original contributions presented in this study are included in the article. Further inquiries can be directed to the corresponding author.
Acknowledgments
We thank any assistance and/or helpful discussions. We acknowledge the anonymous reviewers for their comments that greatly improved the earlier version of this manuscript.
Conflicts of Interest
The authors declare that they have no known competing financial interestsor personal relationships that could have appeared to influence the work reported in this paper.
References
- Gan, D.; Gao, F.; Liu, Z.; Zhang, C. Effects of energy on the impact comminution characteristics of BIF magnetite ore. J. Vib. Shock. 2019, 38, 75–82. [Google Scholar]
- Hlabangana, N.; Nhira, E.; Masayile, N.; Tembo, P.; Danha, G. A fundamental investigation on the breakage of a bed of PGM ore particles: An attainable region approach, part 2. Powder Technol. 2019, 346, 326–331. [Google Scholar] [CrossRef] [Scilit]
- Zhao, H.; Pan, Y.; Yu, C.; Qiao, X.; Cao, X.; Niu, X.; Yue, F. Influence of impact velocities of hammer crusher on crushing effect and utilizationefficiency of fracture energy in green sandstone. Coal Sci. Technol. 2024, 52, 289–300. [Google Scholar]
- Su, C.D.; Li, H.Z.; Zhang, S.; Gou, P. Experimental investigation on effect of strain rate onmechanical characteristics of marble. Chin. J. Rock Mech. Eng. 2013, 32, 943–950. [Google Scholar]
- Zhao, H.; Pan, Y.; Yu, C.; Cao, X.; Qiao, X. Study on the evolution law of micro damage and utilization efficiency of fractureenergy in green sandstone under the action of ultrasonic vibration. Chin. J. Rock Mech. Eng. 2024, 43, 1646–1661. [Google Scholar]
- Cundall, P.A. A computer model for simulating progressive large-scale movements in blocky rock systems. In Proceedings of the ISRM International Symposium, Nancy, France, 4 October 1971; Volume 1, pp. 11–18. [Google Scholar]
- Liu, Y.; Wu, S.; Zhou, J. Numerical simulation of sand deformation under monotonicloading and mesomechanical analysis. Rock Soil Mech. 2008, 29, 3199–3204+3216. [Google Scholar]
- Hu, G.; Xu, T.; Chen, C.; Yang, X. A microscopic study of creep and fracturing of brittlerocks based on discrete element method. Eng. Mech. 2018, 35, 26–36. [Google Scholar]
- Hu, X.J.; Bian, K.; Liu, J.; Xie, Z.; Chen, M.; Li, B.; Cen, Y. Particle flow code analysis of the effect of discrete fracture network on rockmechanical properties and acoustic emission characteristics. Rock Soil Mech. 2022, 43, 542–552. [Google Scholar]
- Yan, L.; Lyu, C.; Yu, S.; Wen, S.; Yang, H. Test and numerical analysis on combined pressure arch of surrounding rock in adjacent twin tunnels. J. Beijing Jiaotong Univ. 2022, 46, 103–109. [Google Scholar]
- Li, T.; Zhu, L.; Li, B.; Fang, X.; Li, X. Study of influence factors of soil arching effect for deep foundation pit excavation. J. China Univ. Min. Technol. 2017, 46, 58–65. [Google Scholar]
- Duan, K.; Kwok, C.Y.; Tham, L.G. Micromechanical analysis of the failure process of brittle rock. Int. J. Numer. Anal. Methods Geomech. 2015, 39, 618–634. [Google Scholar] [CrossRef] [Scilit]
- Huang, Y.-H.; Yang, S.-Q.; Zhao, J. Three-Dimensional Numerical Simulation on Triaxial Failure Mechanical Behavior of Rock-Like Specimen Containing Two Unparallel Fissures. Rock Mech. Rock Eng. 2016, 49, 4711–4729. [Google Scholar] [CrossRef] [Scilit]
- Liu, G.; Sun, W.C.; Lowinger, S.M.; Zhang, Z.H.; Huang, M.; Peng, J. Coupled flow network and discrete element modeling of injection-induced crack propagation and coalescence in brittle rock. Acta Geotech. 2019, 14, 843–868. [Google Scholar] [CrossRef] [Scilit]
- Yin, P.-F.; Yang, S.-Q. Discrete Element Modeling of Strength and Failure Behavior of Transversely Isotropic Rock under Uniaxial Compression. J. Geol. Soc. India 2019, 93, 235–246. [Google Scholar] [CrossRef] [Scilit]
- Saadat, M.; Taheri, A. A numerical study to investigate the influence of surface roughness and boundary condition on the shear behaviour of rock joints. Bull. Eng. Geol. Environ. 2020, 79, 2483–2498. [Google Scholar] [CrossRef] [Scilit]
- Da, H.; Cen, D. Mechanical responses and energy dissipation mechanismof rock specimen with a single fissure under static anddynamic uniaxial compression using particleflow code simulations. Chin. J. Rock Mech. Eng. 2013, 32, 1926–1936. [Google Scholar]
- Wu, D. Application of Multibody Dynamics and Bonded-Particle GPU Discrete Element Method in Modelling of a Gyratory Crusher. Minerals 2024, 14, 774. [Google Scholar]
- Nghipulile, T.; Bwalya, M.M.; Govender, I.; Simonsen, H. Discrete Element Modeling of the Breakage of Single Polyhedral Particles in the Rotary Offset Crusher. Minerals 2024, 14, 630. [Google Scholar] [CrossRef] [Scilit]
- Xu, C.; Wang, P.; Yin, Z.-Y.; Gao, X.; Xu, C. A dual-level particle breakage model for irregular particles in DEM. Can. Geotech. J. 2026, 63, 1–17. [Google Scholar] [CrossRef] [Scilit]
- Song, S.; Wang, P.; Yin, Z.; Cheng, Y.P. Micromechanical modeling of hollow cylinder torsional shear test on sand using discrete element method. J. Rock Mech. Geotech. Eng. 2024, 16, 5193–5208. [Google Scholar] [CrossRef] [Scilit]
- Gu, R.; Wu, W.; Zhao, S.; Xing, H.; Qin, Z. Simulation and Parameter Optimisation of Edge Effect in Ore Minerals Roll Crushing Process Based on Discrete Element Method. Minerals 2025, 15, 89. [Google Scholar] [CrossRef] [Scilit]
- Chehreghani, S.; Noaparast, M.; Rezai, B.; Shafaei, S.Z. Bonded-particle model calibration using response surface methodology. Particuology 2017, 32, 141–152. [Google Scholar] [CrossRef] [Scilit]
- Ji, S.; Karlovšek, J. Calibration and uniqueness analysis of microparameters for DEM cohesive granular material. Int. J. Min. Sci. Technol. 2022, 32, 121–136. [Google Scholar] [CrossRef] [Scilit]
- Wu, S.; Wang, G.; Fan, L.; Guan, W.; Guo, J.; Liu, Z.; Wang, Y. A method to determine the bonded-particle model parameters for simulation of ores. Particuology 2024, 86, 24–38. [Google Scholar] [CrossRef] [Scilit]
- Cao, X.; Pan, Y.; Zhang, C.; Bi, Y.; Liu, P.; Wang, C.; Tang, C. Molecular Dynamics Study on Crack Angle Effect on Amorphous Silica Fracture Performance. Minerals 2023, 13, 1068. [Google Scholar] [CrossRef] [Scilit]
- Zhang, D.; Guo, W.; Zhao, T.; Zhao, Y.; Chen, Y.; Zhang, X. Energy Evolution Law during Failure Process of Coal–Rock Combination and Roadway Surrounding Rock. Minerals 2022, 12, 1535. [Google Scholar] [CrossRef] [Scilit]
- Potyondy, D.O.; Cundall, P.A. A bonded-particle model for rock. Int. J. Rock Mech. Min. Sci. 2004, 41, 1329–1364. [Google Scholar] [CrossRef] [Scilit]
- Cao, R.H.; Cao, P.; Lin, H.; Pu, C.Z.; Ou, K. Mechanical Behavior of Brittle Rock-Like Specimens with Pre-existing Fissures Under Uniaxial Loading: Experimental Studies and Particle Mechanics Approach. Rock Mech. Rock Eng. 2016, 49, 763–783. [Google Scholar] [CrossRef] [Scilit]
- Potyondy, D.O. A flat-jointed bonded-particle material for hard rock. In Proceedings of the ARMA US Rock Mechanics/Geomechanics Symposium, Chicago, IL, USA, 24–27 June 2012. [Google Scholar]
- Poulsen, B.A.; Adhikary, D.P. A numerical study of the scale effect in coal strength. Int. J. Rock Mech. Min. Sci. 2013, 63, 62–71. [Google Scholar] [CrossRef] [Scilit]
- Zhao, K.; Wu, W.; Zeng, P.; Gong, C. Study on the Characteristics of Acoustic Emission Quiet Period in Rocks with Different Elastic Modulus. Minerals 2022, 12, 956. [Google Scholar] [CrossRef] [Scilit]
- Yoon, J. Application of experimental design and optimization to PFC model calibration in uniaxial compression simulation. Int. J. Rock Mech. Min. Sci. 2007, 44, 871–889. [Google Scholar] [CrossRef] [Scilit]
- Fan, P.; Chen, J.; Liao, Y.; Zhao, J.; Wang, M. Calibrating the microparameters of DEM models using the ant colony optimization algorithm and the optimal hyperparameters. Sci. Rep. 2025, 15, 16795. [Google Scholar] [CrossRef] [Scilit] [PubMed]
- Jin, Z.; Chang, W.; Li, Y.; Wang, K.; Fan, D.; Zhao, L. Microparameters Calibration for Discrete Element Method Based on Gaussian Processes Response Surface Methodology. Processes 2023, 11, 2944. [Google Scholar] [CrossRef] [Scilit]
- Huang, Y.; Xia, X. Research on the calibration method of fine-scale parameters of sandstone particle flow-parallel adhesion model. J. Three Gorges Univ. Nat. Sci. Ed. 2021, 43, 7–12. [Google Scholar]
- Shi, C.; Zhang, Q.; Wang, S. Numerical simula tion techniques and applications of granular flow (PFC5.0). Geotechnics 2018, 39, 36. [Google Scholar]
- Heo, J.H.; Hashemi, S.S.; Melkoumian, N. Study of Micro-Parameters of DEM Model on the Laboratory Experiment Results Obtained from Poorly Cemented Sandstone. Geosciences 2022, 12, 373. [Google Scholar] [CrossRef] [Scilit]

Disclaimer/Publisher’s Note: The statements, opinions and data contained in all publications are solely those of the individual author(s) and contributor(s) and not of MDPI and/or the editor(s). MDPI and/or the editor(s) disclaim responsibility for any injury to people or property resulting from any ideas, methods, instructions or products referred to in the content. |
© 2026 by the authors. Licensee MDPI, Basel, Switzerland. This article is an open access article distributed under the terms and conditions of the Creative Commons Attribution (CC BY) license.