Article

Case Study on the Assessment of Leaching and Migration Risks of Contaminants in Tailings Backfill at an Open-Pit Gold Mine: Leaching Characteristics, Long-Term Release Patterns, and Migration Modeling

1
School of Minerals Processing and Bioengineering, Central South University, Changsha 410083, China
2
Shandong Gold Group Co., Ltd., Jinan 250100, China
3
Beijing Guohuan Tsinghua Environmental Engineering Design Research Institute Co., Ltd., Beijing 100084, China
4
Institute of Water Environment Research, Chinese Research Academy of Environmental Sciences, Beijing 100012, China
*
Author to whom correspondence should be addressed.
Minerals 2026, 16(5), 491; https://doi.org/10.3390/min16050491
Submission received: 23 March 2026 / Revised: 29 April 2026 / Accepted: 4 May 2026 / Published: 7 May 2026
(This article belongs to the Section Environmental Mineralogy and Biogeochemistry)

Abstract

Flotation tailings, the primary solid waste generated during gold extraction, may pose issues such as land occupation, environmental pollution, and geological hazards in open-pit mining areas. This study systematically investigated the environmental characteristics, long-term pollutant release patterns, and migration risks associated with flotation tailings by taking a specific backfill project as a case study and employing short-term leaching tests, long-term column leaching experiments, and multi-model numerical simulations. Short-term leaching tests indicated that tailings leachate exhibited weak alkalinity (pH 8.21−8.45) with low pollutant leaching concentrations, meeting the fundamental requirements for open-pit backfilling. Notably, leaching characteristics varied significantly among tailings from different sources, and an extended storage duration enhanced chemical stability. Long-term leaching tests identified nine characteristic pollutants, including fluoride and sulfate, with their release patterns categorized into three types: continuous slow release, initial rapid leaching, and delayed/complex release. Furthermore, simulation results from the HYDRUS and MODFLOW/MT3DMS models indicated that the maximum predicted concentrations of characteristic pollutants in the surrounding soil and groundwater will remain at low levels for 50 years post-backfilling. The site’s “micro-to-weakly permeable” strata exhibited significant pollutant retention capabilities. Based on these experimental and simulation results, a three-tier risk management system—”source control, process monitoring, and end-point surveillance”, was developed to provide technical support for the long-term environmental safety of the flotation tailings backfill project. This study revealed the environmental risk characteristics associated with the storage of flotation tailings, including land occupation, environmental pollution, and the potential for geological hazards in open pits. Furthermore, the leaching characteristics, long-term release patterns, and migration mechanisms of tailings used to backfill open pits have been elucidated, providing theoretical references and practical guidance for similar solid waste resource recovery and backfilling projects.

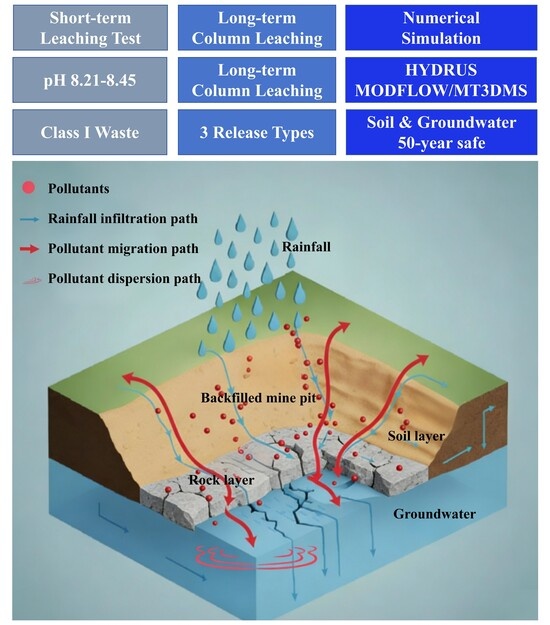
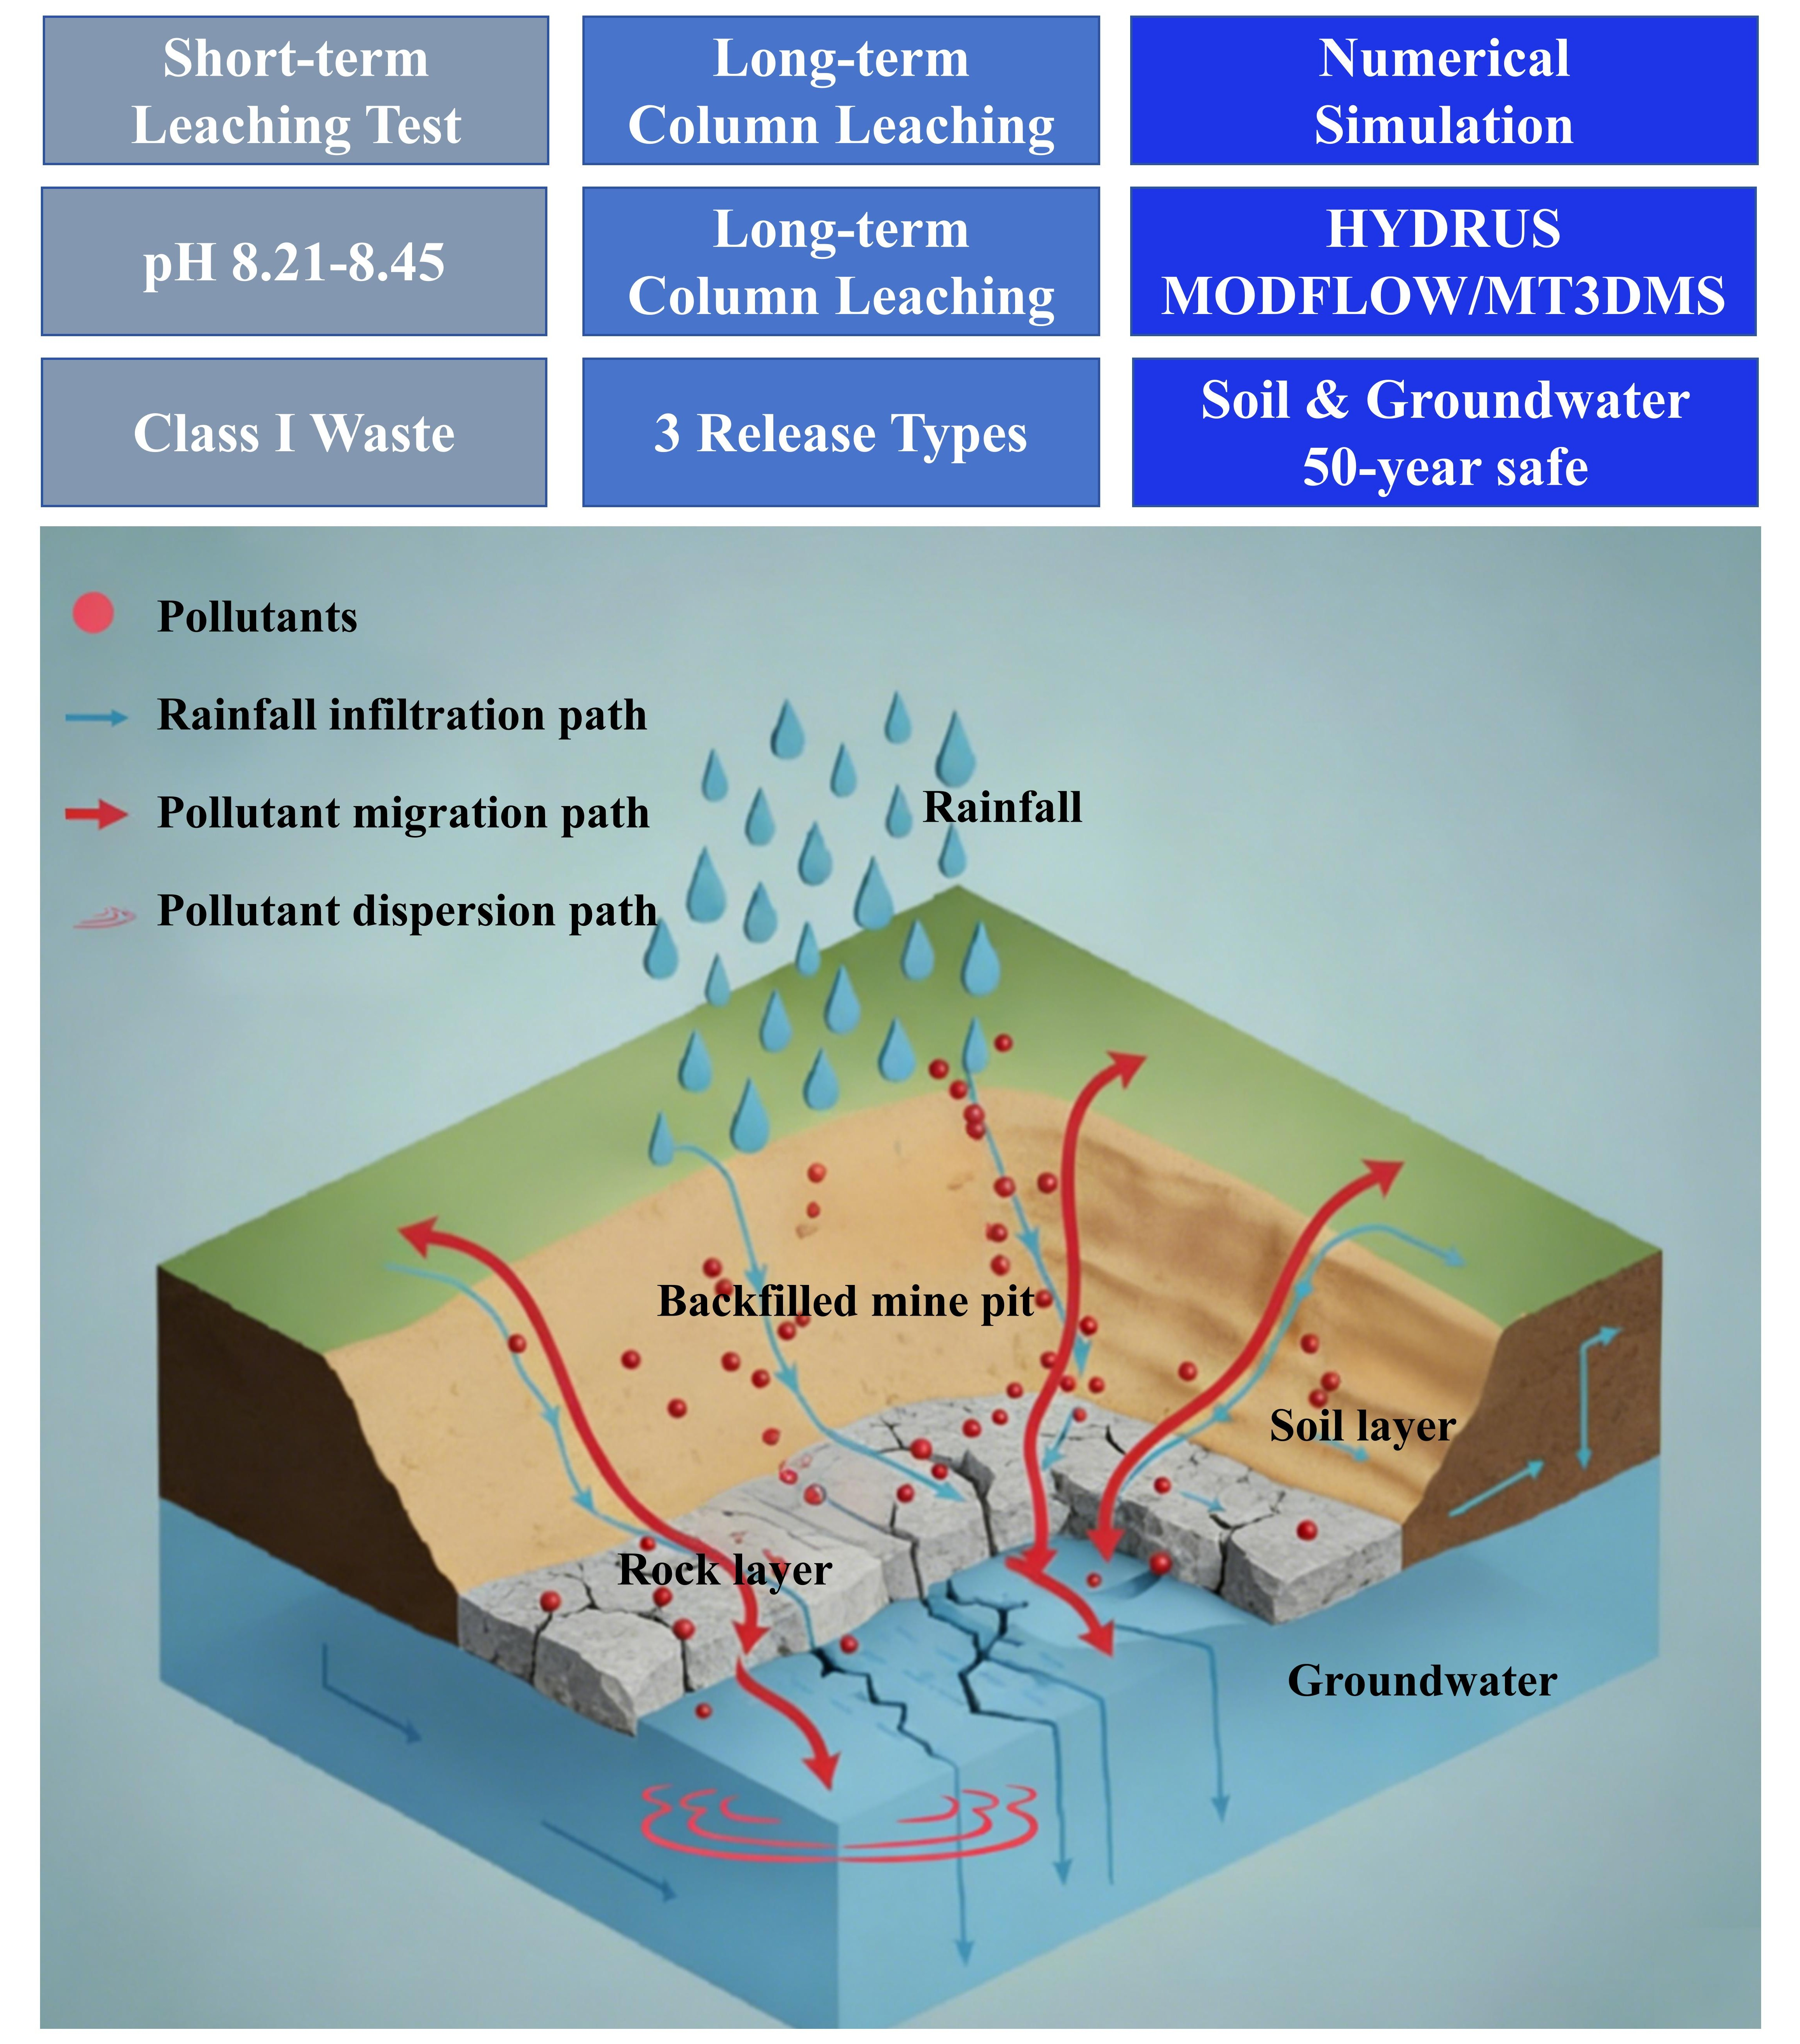
Graphical Abstract

1. Introduction

The issues of abandoned open-pit spaces and tailings storage facilities generated during the development of mineral resources such as gold have become critical environmental bottlenecks constraining the sustainable development of the mining industry [1,2]. Open pits not only lead to significant land resource wastage but also readily trigger geological hazards such as slope instability and soil erosion [3,4]. Meanwhile, flotation tailings, as a bulk industrial solid waste, require extensive land areas for storage [5]. Moreover, heavy metals and soluble salts contained within them can migrate through the environment, posing potential ecological risks [6]. Flotation tailings are utilized for open-pit mine backfilling, effectively managing solid waste and alleviating storage pressure while simultaneously enabling the resourceful utilization of abandoned spaces, representing a crucial technical approach that balances economic and environmental benefits [7,8].
Currently, significant progress has been made in the research and application of tailings backfill technology [9,10]. For instance, numerous studies by international scholars have explored processes such as cement-stabilized tailings backfill and dry backfill, confirming the effectiveness of tailings backfill in slope reinforcement and solid waste disposal [11,12,13]. In recent years, research and development efforts have primarily focused on engineering solutions such as backfill mix optimization and slope stability enhancement [13]. However, existing research predominantly centers on short-term engineering outcomes, with insufficient attention paid to the long-term environmental behavior of tailings [14]. Compared to existing research that primarily focuses on short-term engineering outcomes, there is insufficient attention paid to the long-term environmental behavior of tailings [15,16,17,18].
Nevertheless, the long-term environmental safety of tailings backfill remains a core constraint on technology adoption [19]. The long-term release patterns, migration pathways, and potential risks of pollutants in tailings under prolonged exposure to natural rainfall leaching and groundwater seepage remain unclear, given that single short-term experiments cannot fully reflect the environmental behavior observed in actual scenarios [20,21,22]. Therefore, systematic experimental research and numerical modeling are required to elucidate the long-term environmental evolution mechanisms following tailings backfilling, and constructing a scientific risk management system is necessary to provide support for the safe implementation of the project [23,24].
Taking a specific project involving the backfilling of an open pit with flotation tailings as the research subject, this study utilized short-term leaching tests to determine the solid waste classification of the tailings. Subsequently, long-term leaching column tests were employed to reveal the long-term release characteristics of pollutants. A systematic assessment of contaminant migration risks to soil and groundwater was conducted through integrated analysis with numerical models such as HYDRUS and MODFLOW/MT3DMS [25,26]. The study proposes targeted risk management measures, providing a reference for environmental risk assessment and the safe implementation of similar projects.

2. Materials and Methods

2.1. Tailings Sample Collection and Pretreatment

Three representative tailings samples were collected from the production line and the Jiajia tailings pond, with specific procedures described in Text S2 (Supplementary Materials). These samples were air-dried, sieved through a 200-mesh screen to remove plant roots, leaves, plastic, and other debris, and then stored separately for subsequent leaching tests.

2.2. Tailings Basic Properties

The density of tailings was typically determined using the density bottle method, which measured the volume of displaced liquid to determine the true density of the solid particles. XRD analysis was conducted to determine the mineral phase composition of the tailings. Bulk density and porosity were assessed using the ring knife method. XRF was employed to analyze the chemical composition of the tailings in order to further clarify their elemental composition of the tailings. To accurately assess the environmental risks of tailings backfilling, the primary task was to scientifically identify pollutants that may be present in the tailings and could potentially migrate and be released under specific environmental conditions.

2.3. Short-Term Leaching Test

Short-term environmental behaviors primarily characterized the risk of immediate release when tailings first come into contact with water. The diagram of the short-term leaching test is shown in Figure 1. The pretreated tailings sample (100 g) was weighed and mixed with deionized water at a solid–liquid ratio of 1:10 (kg/L). Subsequently, the mixture underwent agitated leaching at 25 °C and 120 r/min for 18 h. The leachate was collected after filtration through a 0.45 μm membrane filter. The pH of the leachate was determined using a pH meter. Heavy metal concentrations were measured by inductively coupled plasma mass spectroscopy (ICP-MS), while soluble salt concentrations were determined by ion chromatography [19,27].

2.4. Long-Term Leaching Column Test

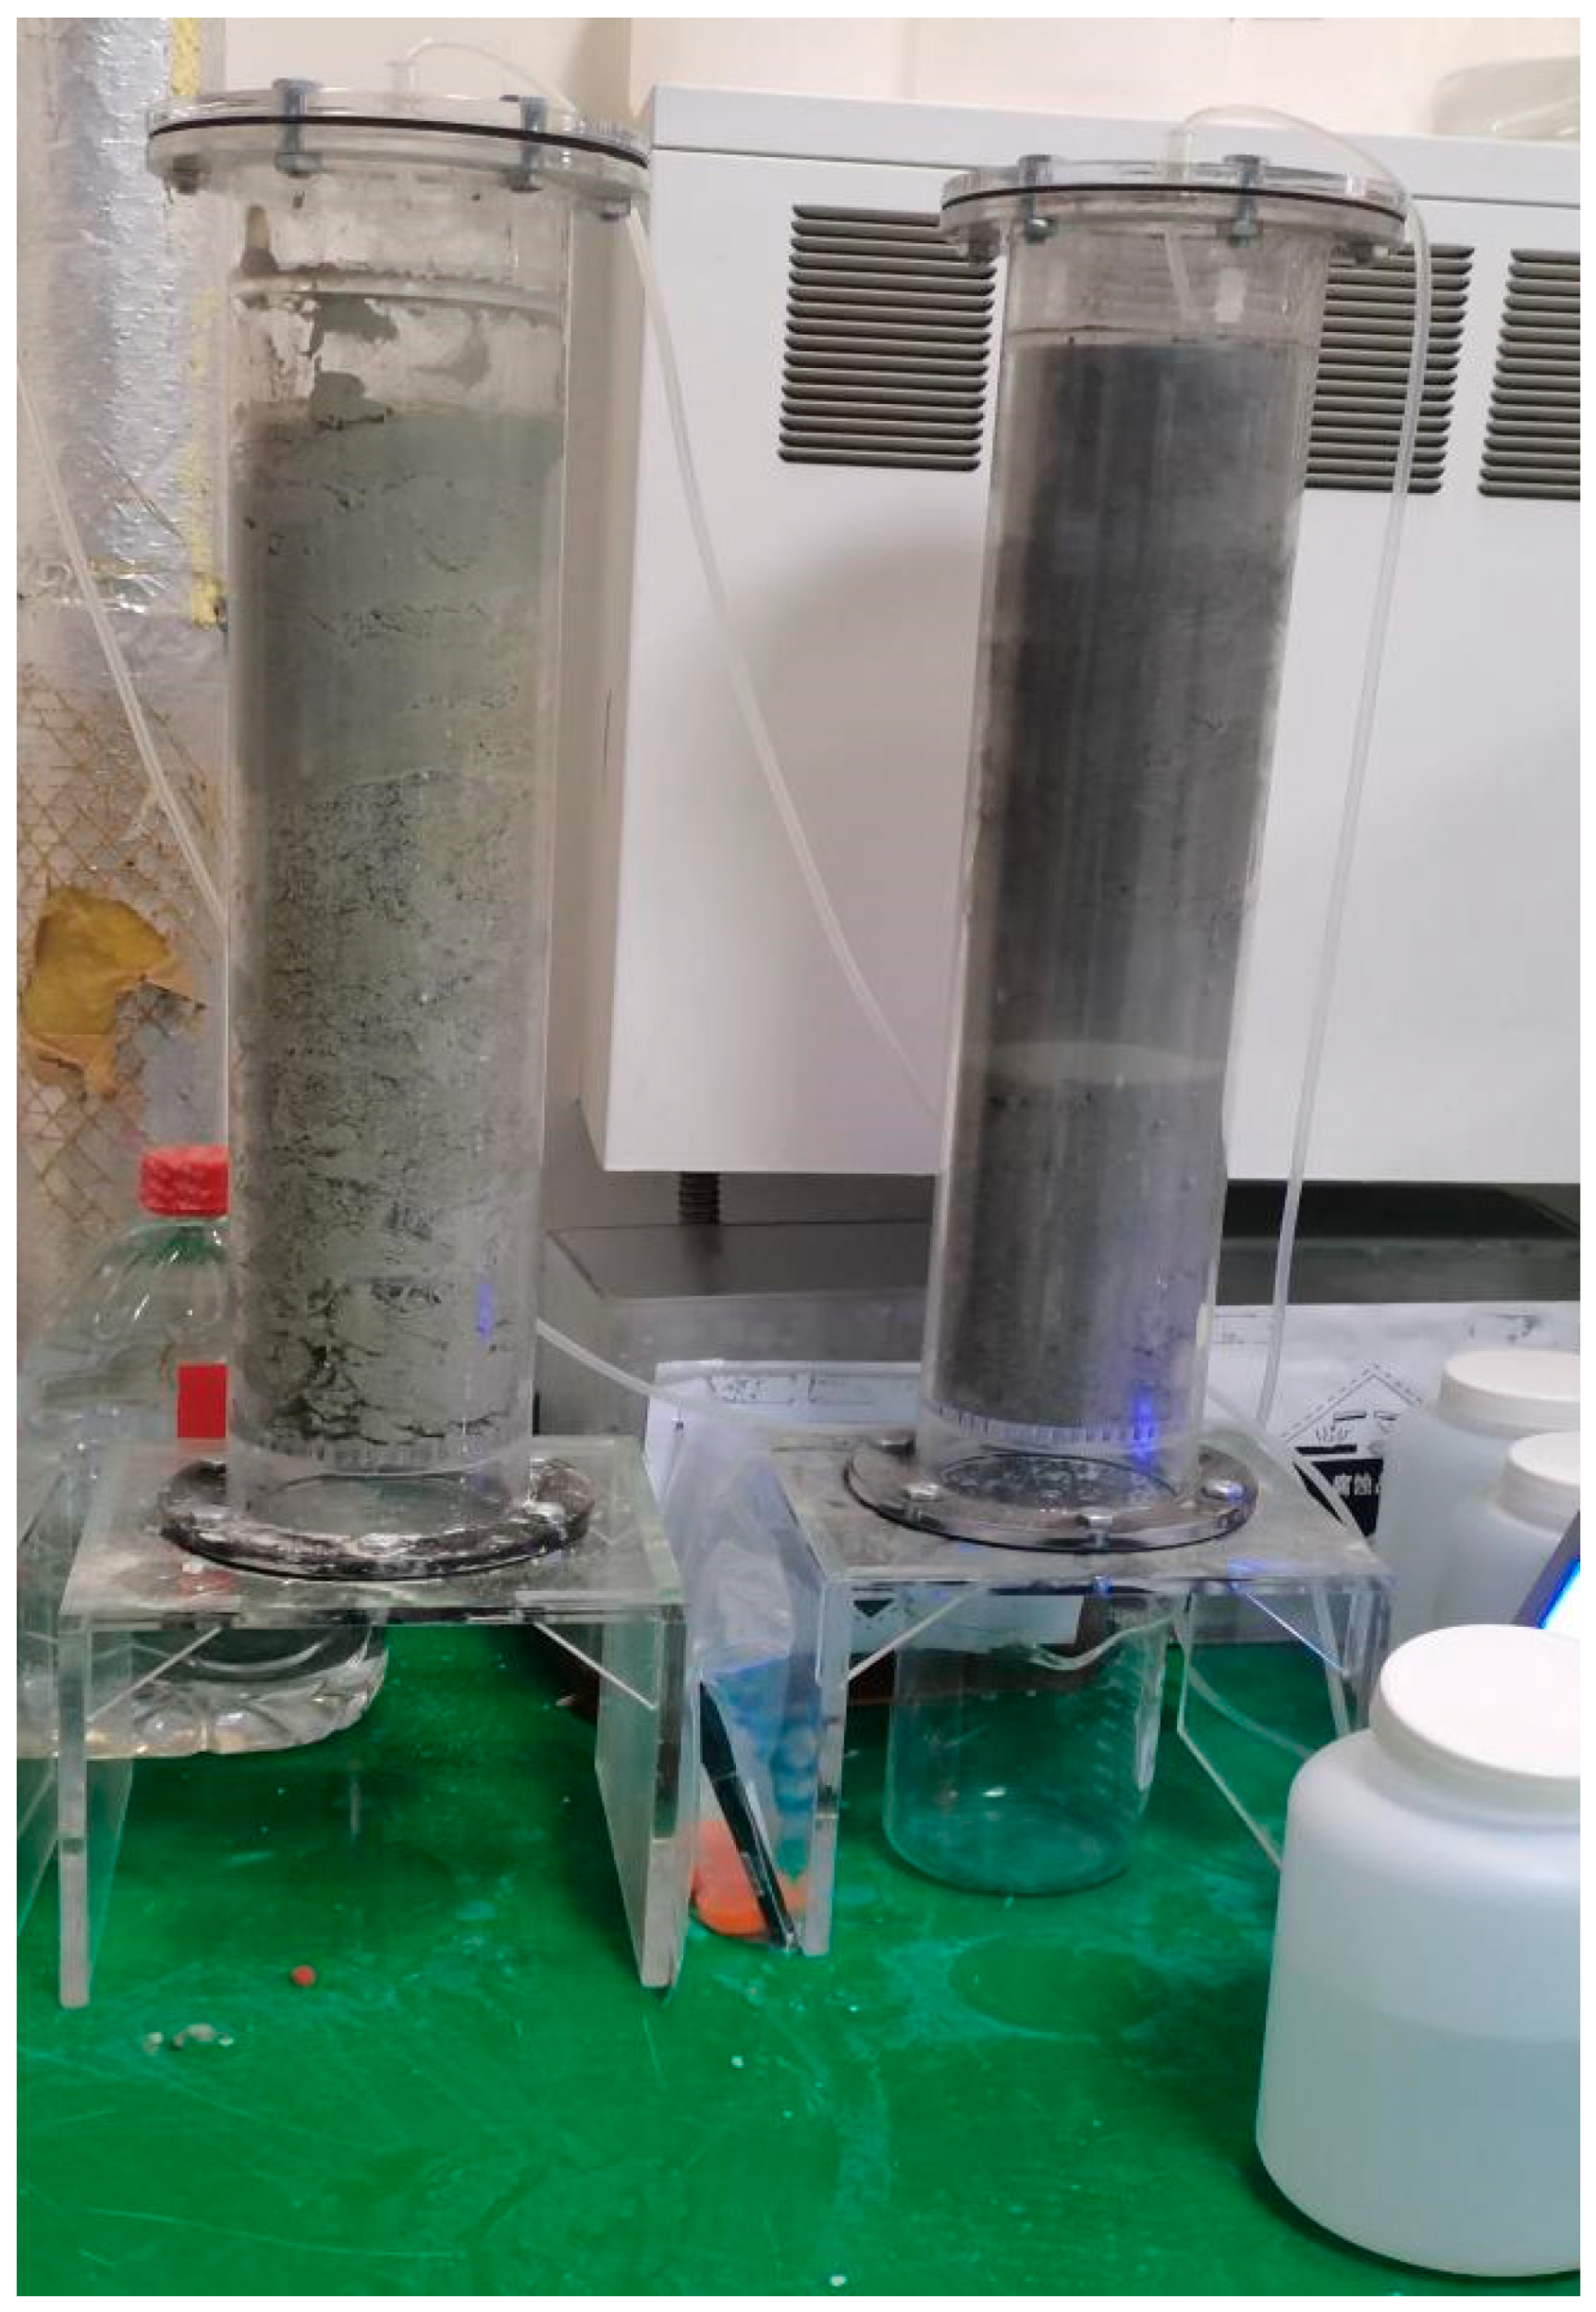
Long-term environmental behavior primarily described the sustained leaching patterns of tailings under prolonged rainfall infiltration in the natural environment. In terms of the time scale, this was equivalent to the leaching process caused by decades of rainfall in nature. The leaching column test system primarily consisted of a transparent column, a peristaltic pump, a temperature control system, and a sample collection device (Figure 2). This experiment employs the “cumulative liquid-to-solid ratio (L/S) equivalence principle” to characterize long-term leaching processes. Based on the site’s annual average precipitation and infiltration coefficients calculated using the HELP model, the target cumulative liquid-to-solid ratio required for simulating natural rainfall infiltration over a specific period (10 years) at the site was determined. The relatively high-risk S1 sample was selected for testing. An acrylic column with an inner diameter of 10 cm and an effective height of 50 cm was used. Tailings were layered, uniformly packed and compacted at a dry bulk density of 2.8 t/m3 to simulate “dry backfilling” conditions [10]. Based on regional meteorological characteristics, deionized water (pH = 6.57, simulating local rainfall) was used as the leaching solution. The leaching rate was set at 3.465 mL/min to match the annual average rainfall in Qingdao (635.62 mm), simulating long-term natural leaching conditions [23]. The start time was when the solution began to flow. Samples were taken at 4, 8, and 12 h, and then every 24 h thereafter, for a total of ten days. Leachate samples were collected periodically to analyze pollutant concentration changes over time.
Leachate samples were collected at preset intervals to measure pH and pollutant concentrations. A first-order exponential decay model was applied to fit the data on pollutant concentrations versus cumulative leaching volume, with the model expression as follows [28]:
C(t) = C0 ∙ ekt + Ce
where C(t) represents the pollutant concentration at time t (mg/L); C0 is the initial release concentration (mg/L); k represents the decay coefficient (d−1); t is the leaching time (d); and Ce represents the equilibrium concentration (mg/L).

2.5. Numerical Simulation of Pollutant Migration

2.5.1. Soil Environmental Risk Simulation

The HYDRUS model was employed to simulate the lateral migration of pollutants from the backfill into the surrounding soil [25,29]. The model was assumed to depict a homogeneous porous medium, with water flow characterized as saturated–a unsaturated flow. Model parameters were set as follows: residual moisture content 0.015–0.07 cm3/cm3, saturated moisture content 0.08–0.38 cm3/cm3, and permeability coefficient 0.05–0.5 m/d [30,31].

2.5.2. Groundwater Environmental Risk Modeling

A three-dimensional groundwater flow model (MODFLOW) and a solute transport model (MT3DMS) were established utilizing site hydrogeological investigation data [26,32,33]. The model area was generalized into two layers: a shallow confined aquifer (thickness 57.34–64.43 m) and a deep unconfined aquifer. Boundary conditions were set as fixed-head boundaries based on the regional flow field [34,35]. Contaminant source terms were categorized into two types: (1) concentration C1 entering the deep groundwater, obtained through HYDRUS simulation of vadose zone attenuation; and (2) concentration C0 entering the shallow confined aquifer, directly derived from long-term leaching test results.
Furthermore, the characteristics of pollutant release phases and their control mechanisms are analyzed by examining the relationship between pollutant concentrations and the cumulative liquid-to-solid ratio, thereby plotting leaching curves for each pollutant, as detailed in Text S3 (Supplementary Materials). After obtaining the “source term” data for long-term pollutant release, this approach will establish a systematic numerical modeling chain to dynamically predict the migration and transformation processes of pollutants under specific geohydrological conditions, as detailed in Text S4 (Supplementary Materials).

3. Results and Analysis

3.1. Basic Property Analysis of Tailings

To comprehensively characterize the material composition of the tailings, XRD analysis was first conducted to determine their mineral phase composition, with the primary mineral constituents shown in Table 1. The mineral phase analysis results indicated that the material composition of these flotation tailings was dominated by common rock-forming minerals. Among these, quartz (SiO2) exhibited the highest content at 37%, followed by plagioclase and microcline (combined 29%) and mica (16%). These four silicate minerals constitute the bulk of the tailings’ framework, accounting for 82%. These minerals possess stable physicochemical properties and are chemically inert under natural conditions, forming the primary matrix of the tailings. Notably, the tailings contained a total of 11% carbonate minerals (calcite and dolomite). The presence of these carbonate minerals holds significant environmental importance, as they possess natural acid-neutralizing capabilities. They could partially buffer pH declines potentially caused by the oxidation of sulfide minerals, thereby helping to inhibit the migration and dissolution of various heavy metal ions. This also contributed to the tailings exhibiting a stable, weakly alkaline pH.
XRF analysis was conducted on the tailings to determine their chemical composition and further clarify their elemental makeup. The chemical composition results in Table 2 highly coincided with the mineral phase analysis, further corroborating the material composition characteristics of the tailings. SiO2 and Al2O3 were identified as the most abundant chemical components, collectively accounting for 65.30%, fully corresponding to the composition of major silico-aluminate minerals such as quartz, feldspar, and mica. Similarly, components such as CaO, Fe2O3, K2O, and MgO also matched the elemental composition of minerals present in the tailings, including feldspar, mica, calcite, dolomite, and chlorite.
Based on the combined analysis of the two studies, the flotation tailings were primarily composed of silicates and carbonates. Environmental risk assessment focused not only on the main matrix but also on trace components with low concentrations yet possessing potential pollutant characteristics and environmental mobility.
As shown in Table 3, the tailings contained heavy metals such as Pb, Cu, Zn, and Cr. Although XRF full-element analysis provided the total content of these elements in the solid phase, accurately assessing their environmental risk requires more precise quantification of their specific concentration levels and identification of other pollutants that might have been enriched during the flotation process. Among these, the primary metal element content (including heavy metals) in the tailings is presented in Table 3, while the soluble salt pollutant content in the tailings is shown in Table 4.
The results for the content of major metallic elements (including heavy metals and metalloids) in the flotation tailings were listed, indicating that besides matrix elements such as Al, Ca, K, Mg, and Na, the tailings contained multiple heavy metal elements. Among these, Ba, Mn, Zn, and Pb exhibited relatively high concentrations, reaching 731.60 mg/kg, 628.00 mg/kg, 435.10 mg/kg, and 191.60 mg/kg, respectively. Additionally, high-risk heavy metal pollutants such as Cr, Ni, Cd, and As were detected. The results for major metallic elements (including heavy metals and metalloids) in the flotation tailings (Table 3) indicate that the tailings contain multiple heavy metal elements in addition to matrix elements such as Al, Ca, K, Mg, and Na.
In addition to heavy metals, another category of pollutants requiring attention was soluble salts, which primarily exist as inorganic anions readily soluble in water. In this tailings sample, these mainly included sulfate ions, fluoride ions, and chloride ions, as shown in Table 4.
Analysis of organic compounds revealed only three semi-volatile organic compounds: phosphoric acid tri (2,4-di-tert-butylphenyl) ester, phosphorous acid tri (2,4-di-tert-butylphenyl) ester, and 1-chlorodocosane. These compounds are not primary constituents or degradation products of the collector (xanthate) or frother used in the flotation process of this project. Instead, they are antioxidants widely used in plastic products (e.g., sampling bags). Their detection was generally considered laboratory-derived contamination introduced during sample collection or analysis, and cannot be attributed to inherent components of the tailings. Therefore, this assessment excludes organic compounds as characteristic pollutants from subsequent quantitative risk assessment modeling.

3.2. Leaching Characteristics and Environmental Properties of Tailings

3.2.1. Leachate pH and Pollutant Concentration

Leachate pH and pollutant concentration are displayed in Table 5. The pH values of the leachate from the three tailings samples ranged between 8.21 and 8.45, exhibiting weakly alkaline characteristics that are conducive to reducing the dissolution and migration potential of heavy metals [20]. Additionally, pollutant concentrations in the leachate remained at low levels: Ni ranged from 5.43 × 10⁻³ to 8.01 × 10⁻³ mg/L, Cr ranged from 8.82 × 10⁻³ to 0.014 mg/L, Pb ranged from 3.98 × 10⁻³ to 6.44 × 10⁻³ mg/L, As ranged from 2.10 × 10⁻³ to 3.40 × 10⁻³ mg/L, Hg concentration was below 0.0001 mg/L, and soluble salt concentrations were at relatively low levels, confirming the low environmental risk of the tailings under short-term forced conditions. According to the Pollution Control Standard for Storage and Landfill of General Industrial Solid Waste (GB 18599-2020) [36], these flotation tailings are classified as Category I general industrial solid waste.

3.2.2. Differences in Leaching Characteristics of Tailings from Different Sources

The leaching concentrations of pollutants in tailings from different sources exhibited distinct patterns: tailings from the production process (S1) > tailings from the newly constructed Jiajia tailings pond (S2) > tailings from the existing Jiajia tailings pond (S3). Specifically, the Ni leaching concentration at S1 was 1.48 times that at S3, while the Pb leaching concentration at S1 was 1.62 times that at S3.
This pattern indicates that as storage time increases, tailings undergo weathering and leaching processes in the natural environment, where highly reactive pollutants are released through migration or transformed into more chemically stable phases via immobilization. This reduces their leaching potential and enhances their chemical stability.
This pattern indicates that as stockpiling duration increases, tailings undergo weathering and leaching processes in the natural environment, where highly reactive pollutants may be released through migration or transformed into more chemically stable phases via immobilization. Subsequently, their leaching potential decreases while chemical stability is enhanced, providing a crucial reference for optimizing backfilling schemes [38]. Prioritizing tailings with longer stockpiling periods for backfilling can effectively mitigate short-term environmental risks [24].

3.3. Long-Term Leaching Release Patterns of Pollutants

3.3.1. Pollutant Concentration Characteristics in Leachate

The results of the long-term leaching test are shown in Table 6. Although no pollutant exceeded standards in the short-term leaching test, nine pollutants (fluoride, sulfate, Be, Mn, Ni, Mo, Cd, Hg, and Pb) exceeded the Class III limits specified in the Groundwater Quality Standard (GB/T 14848-2017) during specific stages of the continuous leaching experiments, indicating that short-term leaching tests may underestimate long-term release risks [18,21,39].
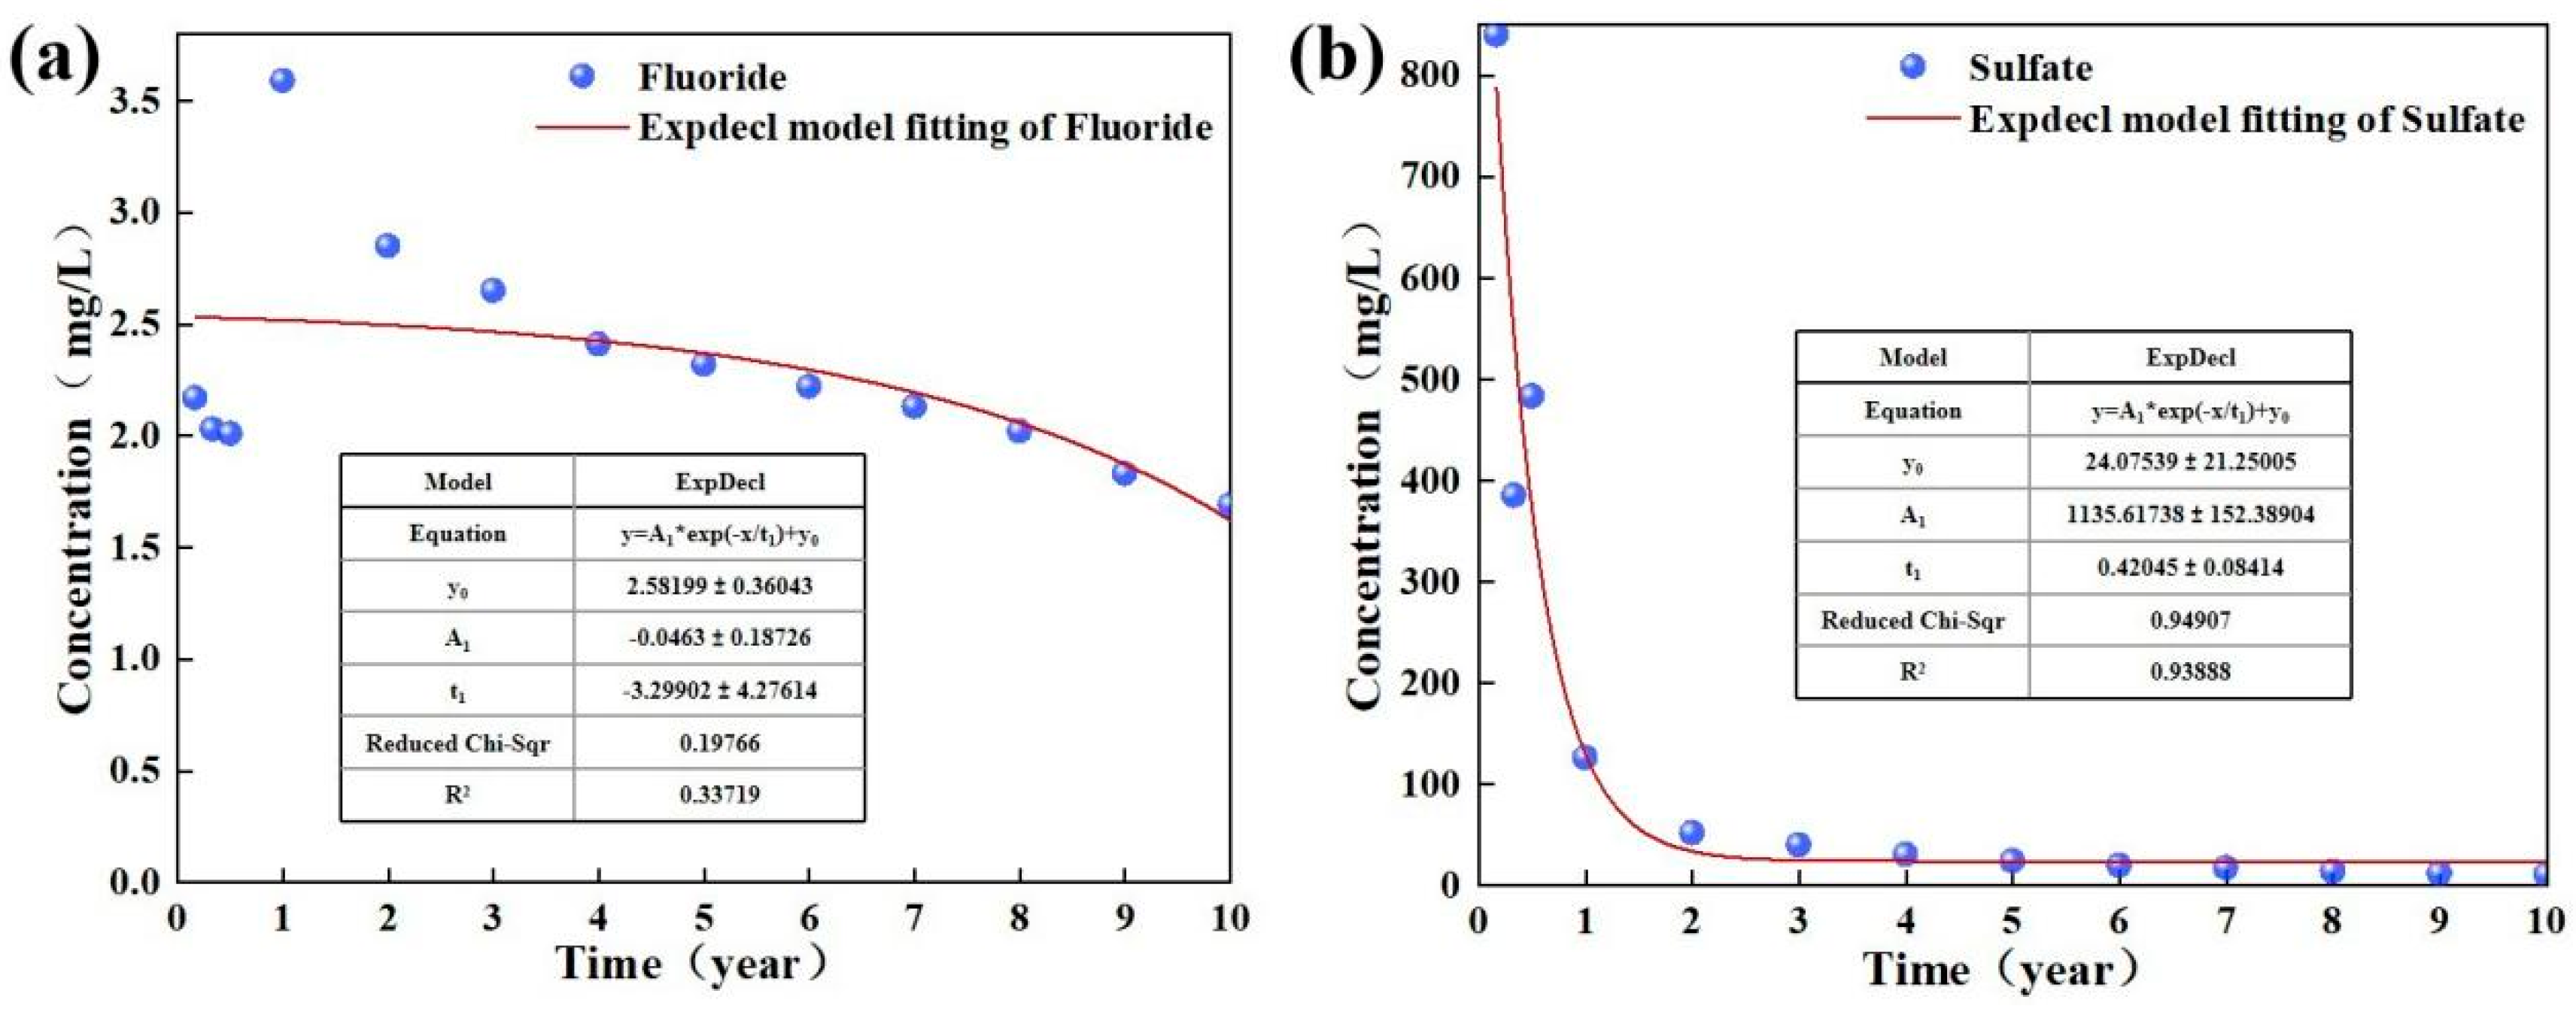
Fluoride demonstrated a slow release pattern with consistently high concentrations throughout the long-term simulation test. As shown in Figure 3a, the leaching concentration peaked at 3.59 mg/L in the early stages of leaching and subsequently declined gradually. However, the concentration remained above 1.0 mg/L throughout the test, and it was still 1.69 mg/L at the end of the test. Therefore, it is likely that the release of fluoride is governed by the dissolution kinetics of poorly soluble fluoride-bearing minerals, as these minerals exhibit relatively slow dissolution rates. Consequently, fluoride ions were continuously released into the solution over an extended period, resulting in consistently high fluoride concentrations that were difficult to completely leach out in the short term. This indicated that fluoride was a contaminant that requires long-term, close monitoring in this backfilling scenario.
Additionally, there are significant differences in the discharge patterns of pollutants. For example, sulfate concentrations peaked at 840 mg/L, with the majority being released during the initial leaching phase, followed by a rapid decline. Among heavy metals, Mn, Mo, and Hg reached peak concentrations during the initial leaching phase before rapidly declining. Pb exhibited a brief peak exceeding standards in the fourth month of leaching. Ni and Cd showed peak concentrations and exceedances during the middle to late leaching stages. Be remained below detection limits throughout the early and middle leaching phases, with a single peak occurring only in the 10th simulated year. As for the other pollutants, their concentrations remained at relatively low levels throughout the entire experimental period and showed no signs of exceeding the standard.

3.3.2. Pollutant Release Patterns and Kinetic Analysis

Based on the fitting results of the first-order exponential decay model, the release patterns of the nine characteristic pollutants are categorized into three types:
(1) Soluble salt release pattern
Fluoride exhibited a characteristic of slow release at a persistently high concentration during the long-term simulation test (Figure 3a). The initial leaching concentration of fluoride peaked at 3.59 mg/L, then gradually declined, remaining at 1.69 mg/L by the end of the test, consistently exceeding the 1.0 mg/L threshold throughout the entire cycle. The sustained release characteristic of fluoride might be governed by the dissolution kinetics of insoluble fluoride-bearing minerals such as fluorite (CaF2). For instance, the dissolution reaction of fluorite proceeded as follows: CaF2(s) ⇌ Ca2+ + 2F, with a solubility product constant Ksp = 3.45 × 10⁻¹¹ (25 °C). The slow dissolution rate implied that fluorite minerals can continuously release F into solution during long-term leaching, leading to sustained high fluoride concentrations. This characteristic indicated that fluoride was a core pollutant requiring long-term, focused attention following tailings backfilling [23].
Sulfate concentrations reached 840 mg/L during the initial leaching phase, primarily due to the rapid dissolution of soluble sulfate minerals in the tailings (Figure 3b). Thereafter, sulfate levels rapidly decreased to 126 mg/L, likely originating from soluble sulfate minerals retained in the tailings or the oxidation products of sulfides such as early pyrite. Upon contact with water, these rapidly dissolved and migrated components were depleted, causing concentrations to drop sharply. Analysis of migration and transformation mechanisms indicates that sulfate ion removal is primarily governed by two processes: the rapid leaching observed during the initial leaching phase, where limited soluble sulfates in the tailings are swiftly dissolved and carried away by leachate, causing a sharp concentration decline; and the potential role of chemical precipitation and immobilization [19].
(2) Heavy metal release pattern
The leaching behavior of heavy metals also exhibits diversity and complexity. Based on the characteristics of their concentration-time fitting curves, their release patterns can be broadly categorized into the following three types:
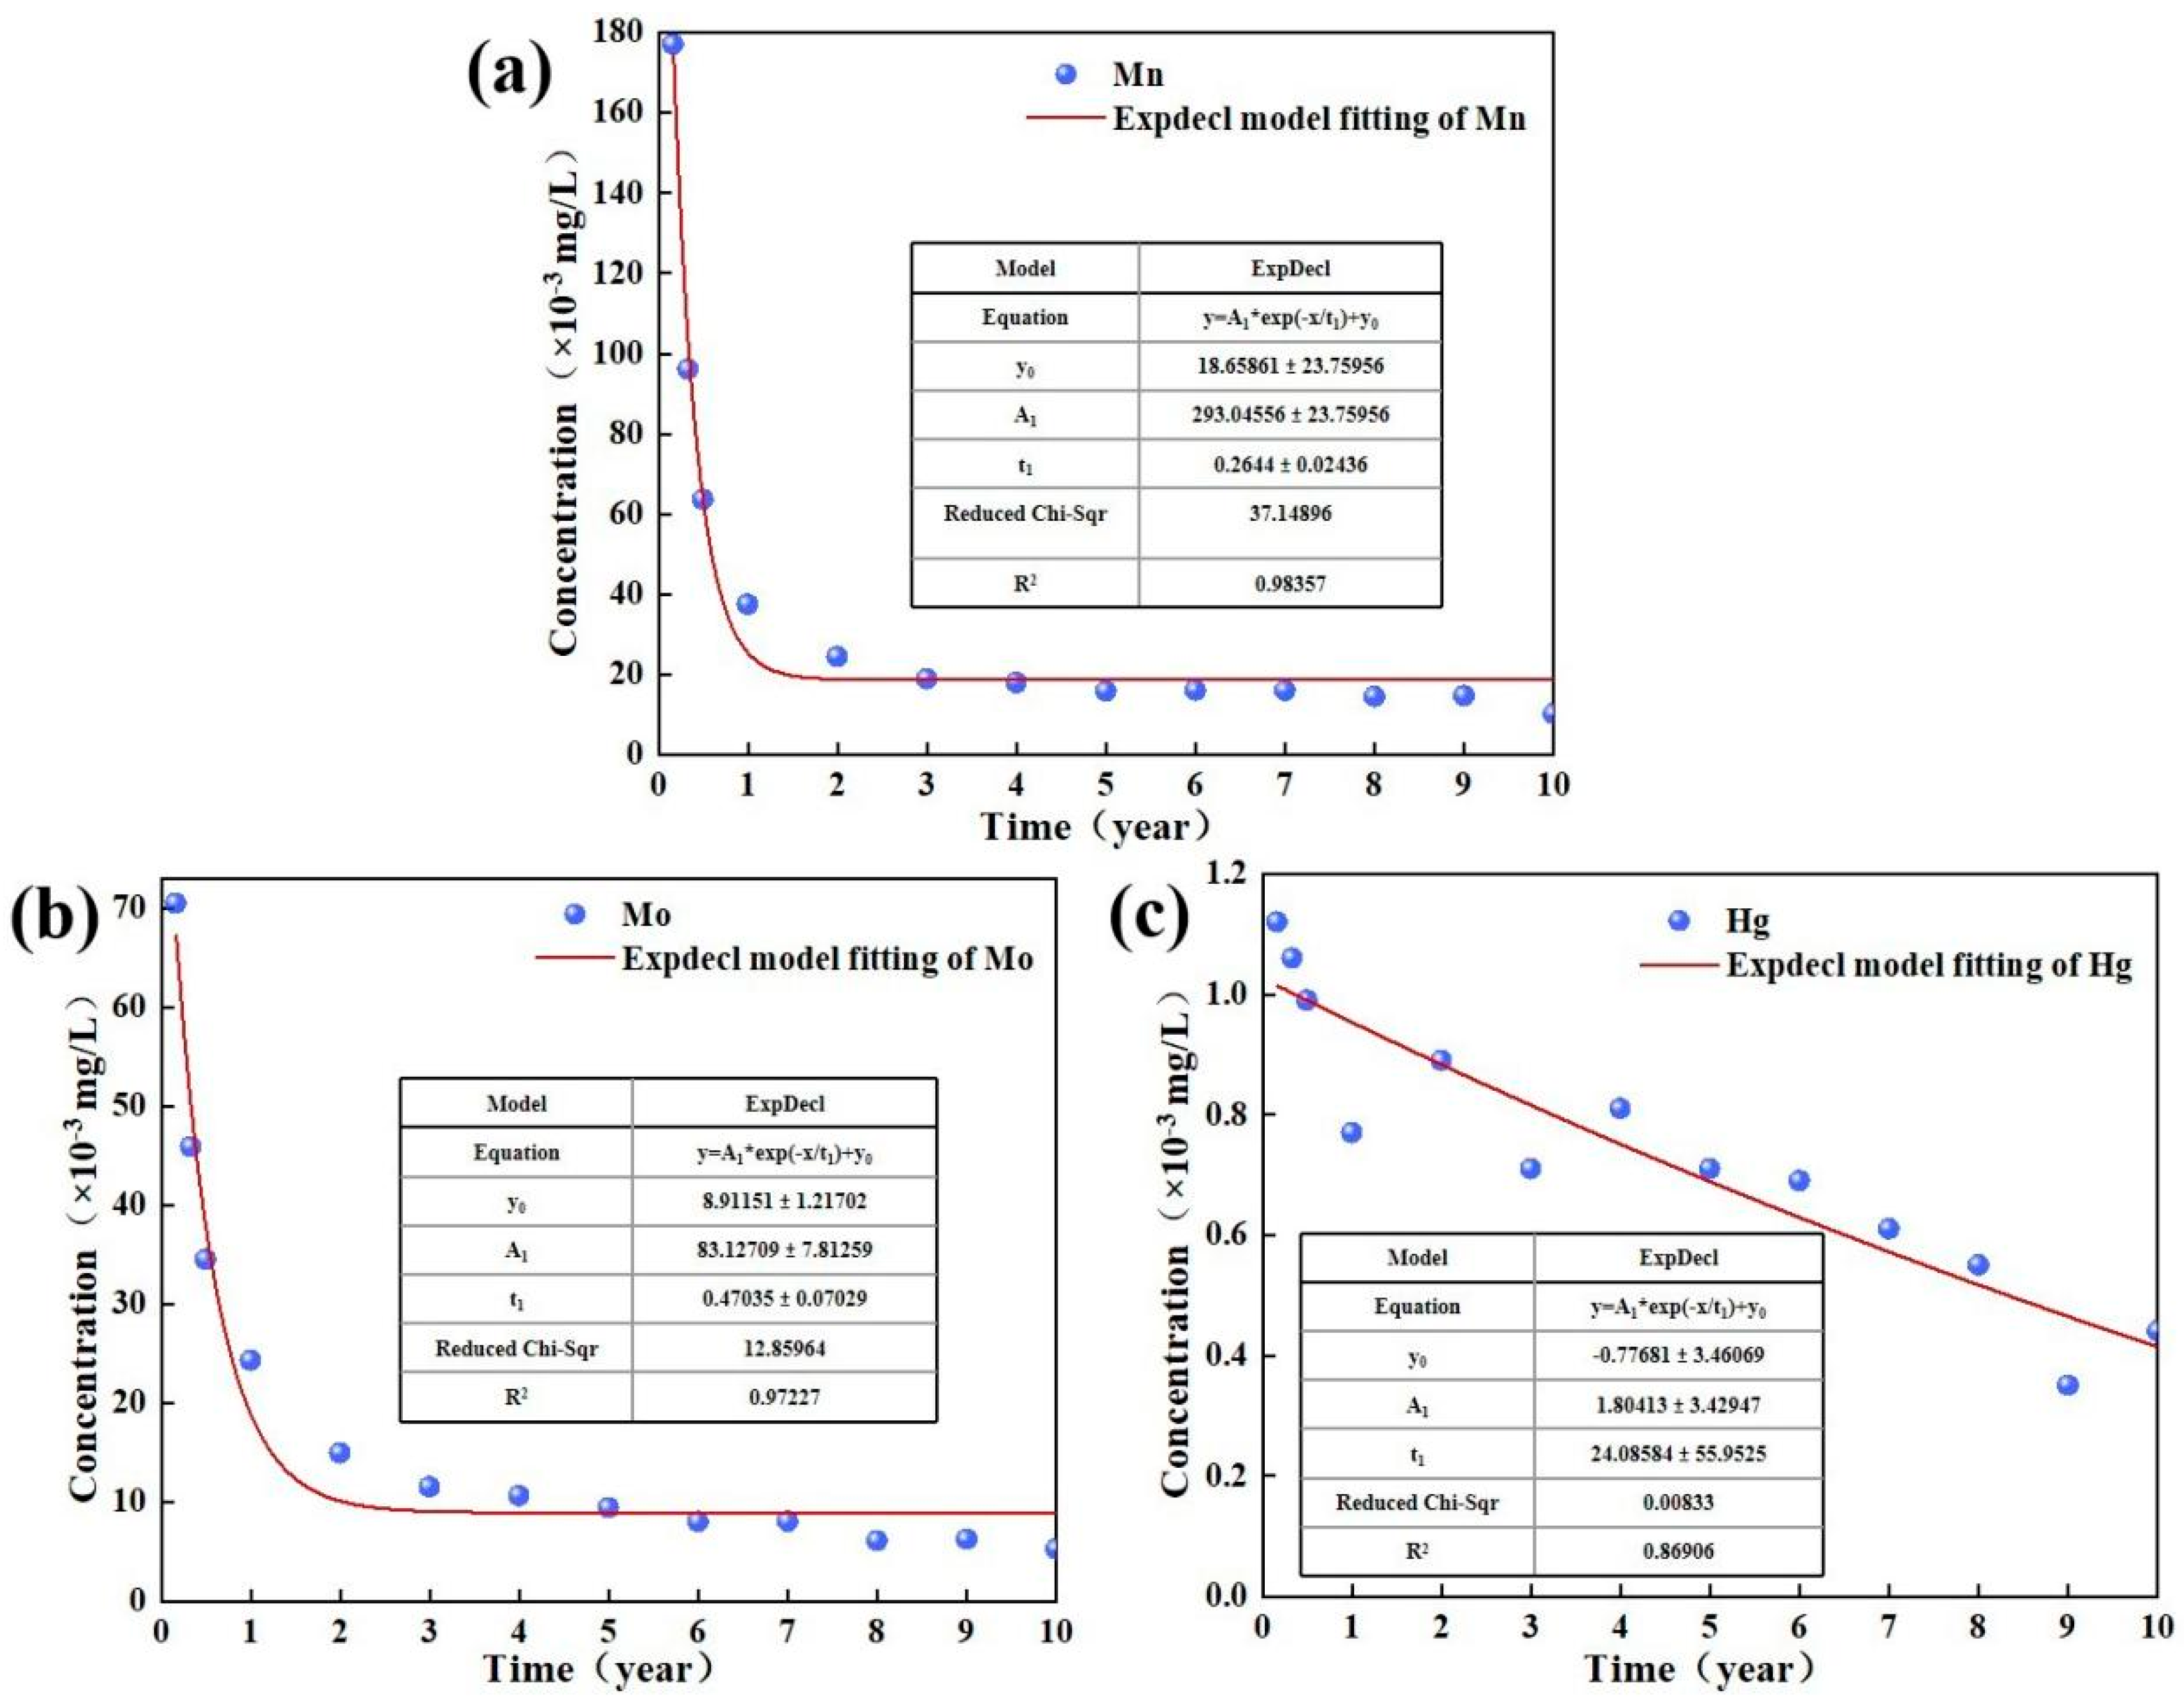
The first type exhibited a pattern of rapid initial leaching, primarily represented by manganese, molybdenum, and mercury, as shown in Figure 4. Mn, Mo, and Hg rapidly declined after reaching peak concentrations during the initial leaching phase, primarily because they were initially present in soluble mineral phases, adsorbed on particle surfaces, or in easily oxidized sulfide minerals. These elements were rapidly released through dissolution, desorption, or oxidative decomposition during early leaching, followed by a sharp decrease in concentration via adsorption and precipitation processes [20,36].
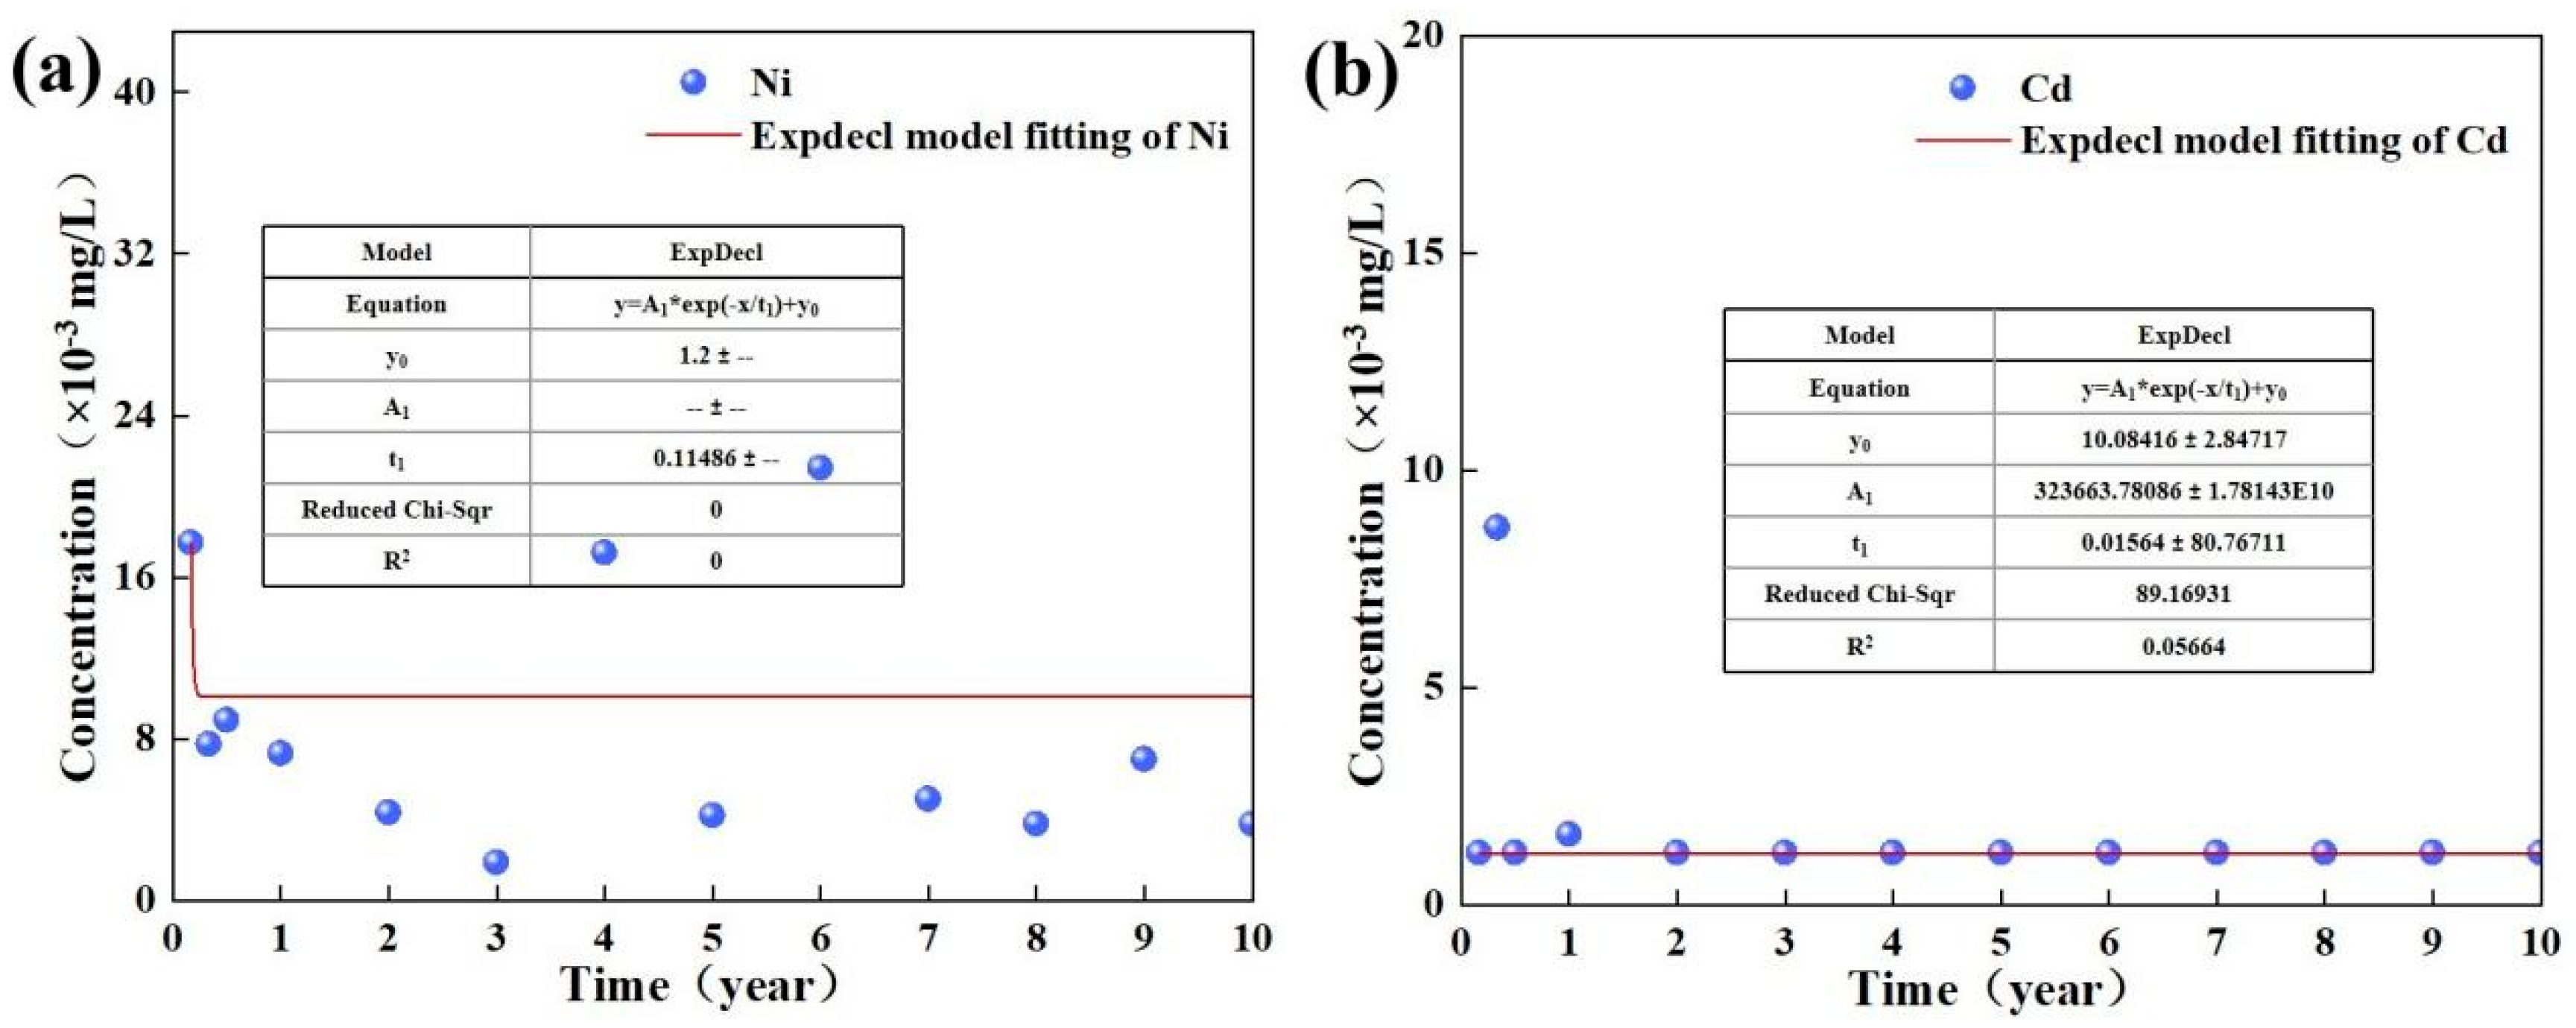
The second category exhibited delayed release in the middle to late stages or more complex release characteristics, with nickel and cadmium being typical examples, as shown in Figure 5. Ni exhibited low concentrations during the early leaching phase, with significant peaks appearing in the middle and late phases. This delayed release behavior might be controlled by the slow dissolution of host minerals (such as silicates and oxides), where Ni ions were encapsulated within the mineral lattice and gradually released as the minerals dissolved [28].
Cd displayed a biphasic release pattern, occurring respectively in the early and mid-to-late stages of leaching. This was attributed to pH changes during the leaching process: lower initial pH promoted Cd2+ release, followed by a pH increase causing Cd2+ precipitation. In the mid-to-late stages, Cd2+ was released again due to mineral dissolution or adsorption site saturation [40,41].
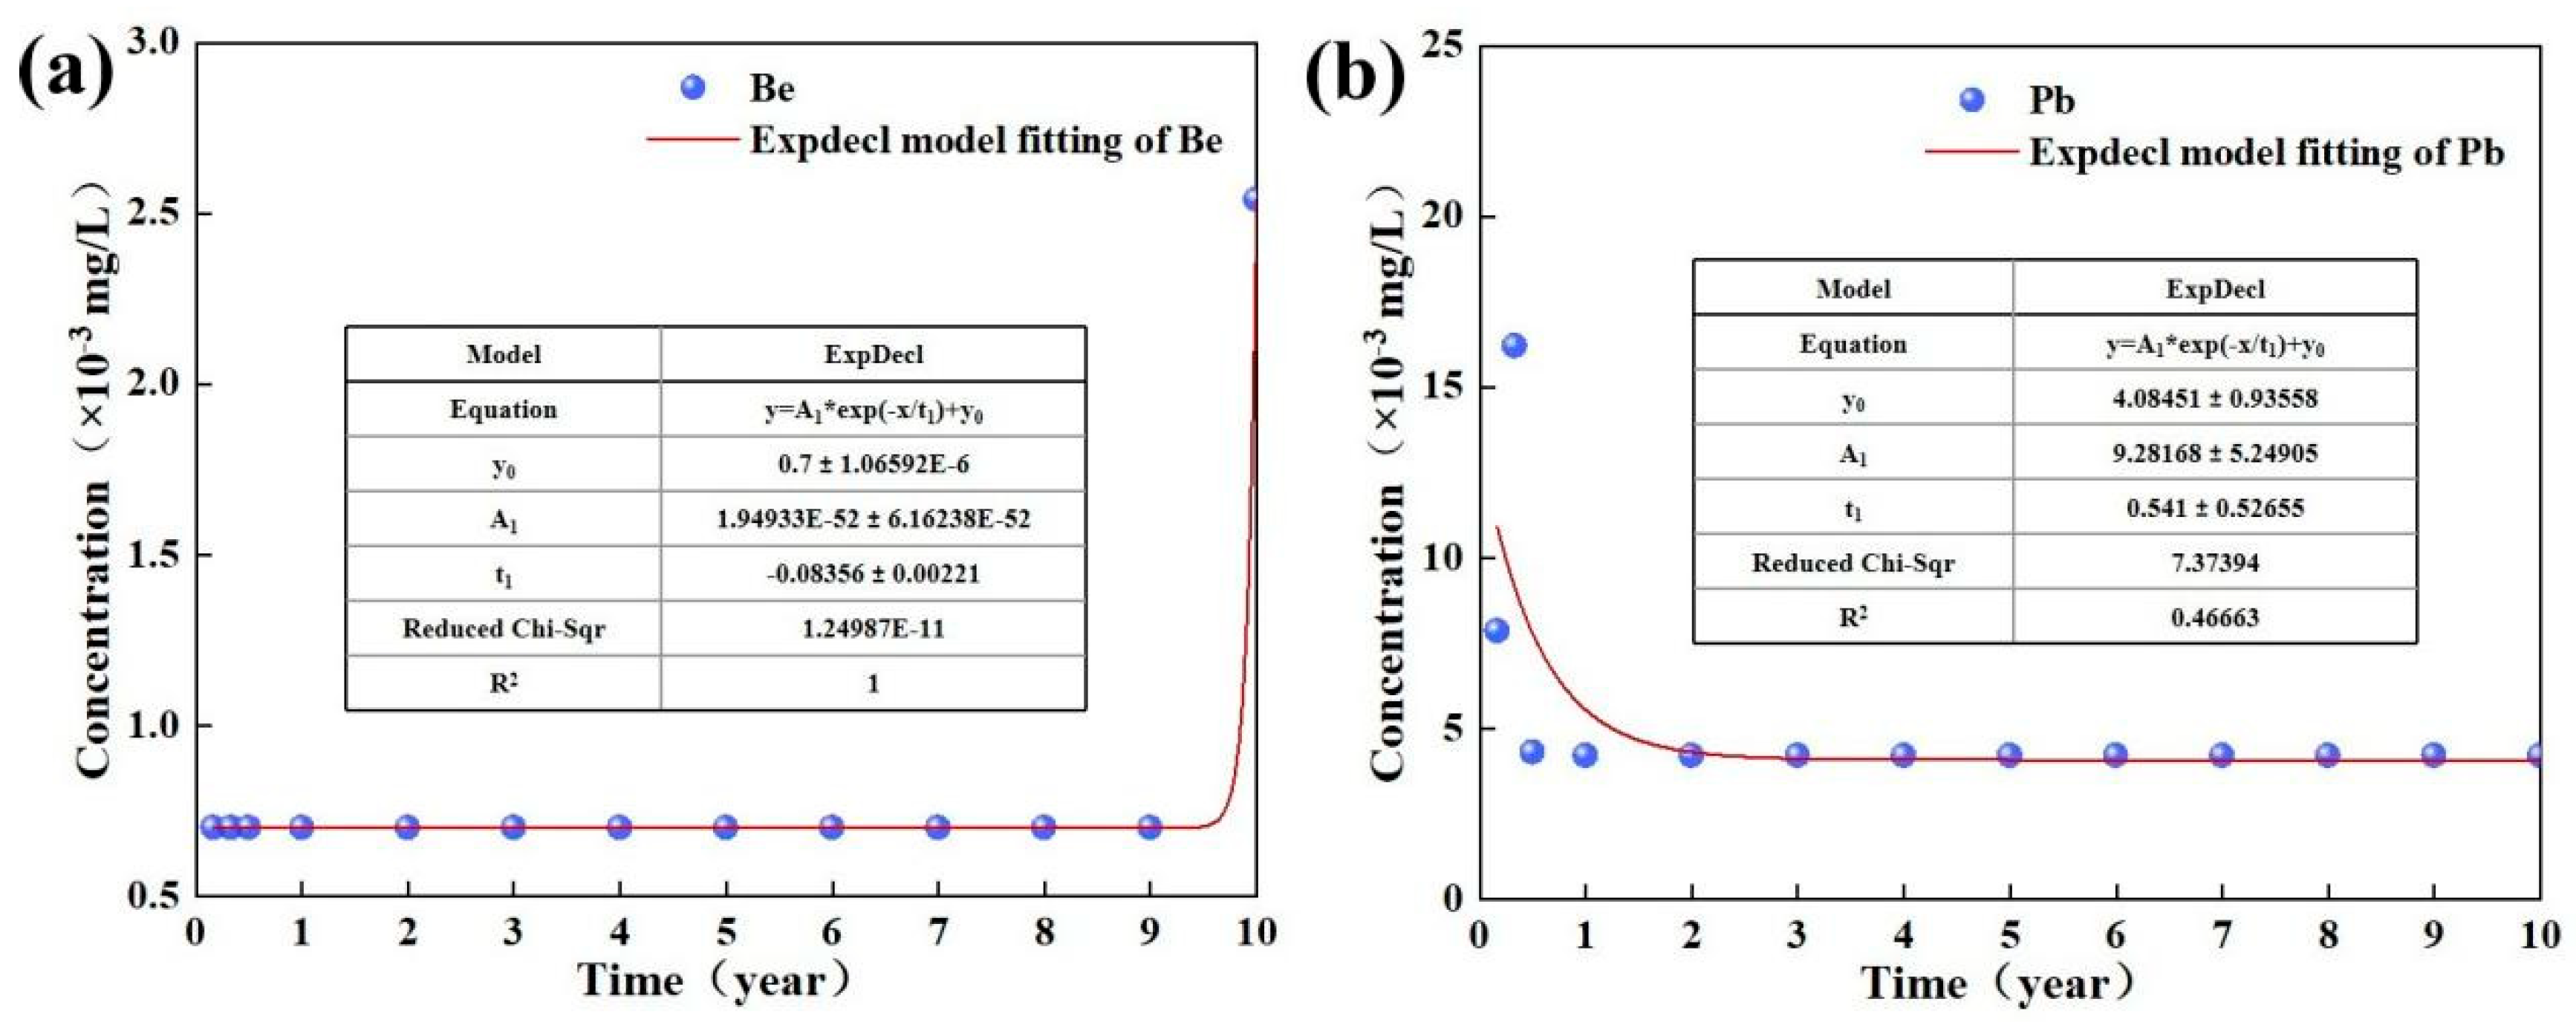
The third category exhibited a single peak pattern during release, with beryllium and lead being typical examples, as shown in Figure 6. Be concentrations remained below the detection limit throughout the first nine years of simulation, with only a single peak of 0.00254 mg/L observed in the tenth year, indicating its highly stable occurrence form in tailings and extremely low mobility. The element likely exists as stable oxides within insoluble minerals, released only through extremely slow mineral dissolution or diffusion processes under prolonged leaching [42].
Pb exhibited a peak concentration of 0.0162 mg/L during the fourth month of leaching, with concentrations remaining below the limit or detection limit during the remaining period. This could be associated with the phased dissolution of a specific lead mineral phase or influenced by transient changes in chemical conditions during the leaching process [36].

3.4. Numerical Simulation Analysis of Pollutant Migration Pathways

The dynamic release patterns of characteristic pollutants under simulated rainfall leaching conditions were quantitatively revealed through long-term leaching experiments, providing essential source term data for subsequent detailed migration modeling and risk assessment. The migration and diffusion behavior of pollutants released from tailings backfill in the subsurface environment and their potential impacts on sensitive receptors (soil, groundwater, etc.) were analyzed to predict pollutant behavior under actual backfilling scenarios. The HELP, HYDRUS, and MODFLOW/MT3DMS models were further utilized to construct a numerical model for contaminant migration and transformation applicable.

3.4.1. Soil Environmental Risk Simulation Analysis

The focus of risk assessment was not only on the static content of pollutants but also on their migration characteristics under long-term environmental exposure and their dynamic impact on surrounding environmental media. According to the long-term leaching test results in Table 6, the leachate from tailings under continuous leaching conditions still exhibited the potential for excessive release of certain pollutants. There was a risk that leachate might migrate laterally along the pit walls into surrounding soils, indicating that environmental impacts might still occur during long-term migration processes. The HYDRUS model was selected for specialized simulation of lateral pollutant migration processes. In this simulation, source concentrations (C0) were derived from long-term leaching test results to reflect actual pollutant levels when leachate from the backfill enters adjacent soil. The model was capable of predicting trends in pollutant concentration changes within the soil during lateral leachate migration. Key parameters employed in the model are listed in Table S2.
As shown in Table 7, pollutant concentrations migrating laterally from the backfill into surrounding soils remained consistently low, as observed in HYDRUS model simulation results [29]. Compared to soil environmental safety thresholds, maximum predicted concentrations for all characteristic pollutants were hundreds to thousands of times lower, indicating a significant safety margin. Notably, the maximum predicted concentration of Cd was 0.1189 mg/kg, representing only 20% of the safety threshold, while Pb reached 0.2212 mg/kg, equivalent to 0.13% of the threshold. The maximum predicted concentration of fluoride (2.15 mg/kg) was far below the safety threshold. These results suggest that concentrations of pollutants entering the soil through lateral migration remain consistently within safe levels, posing no significant impact on the surrounding soil environment. The associated soil environmental risks were within an acceptable range [43].

3.4.2. Groundwater Environmental Risk Simulation Analysis

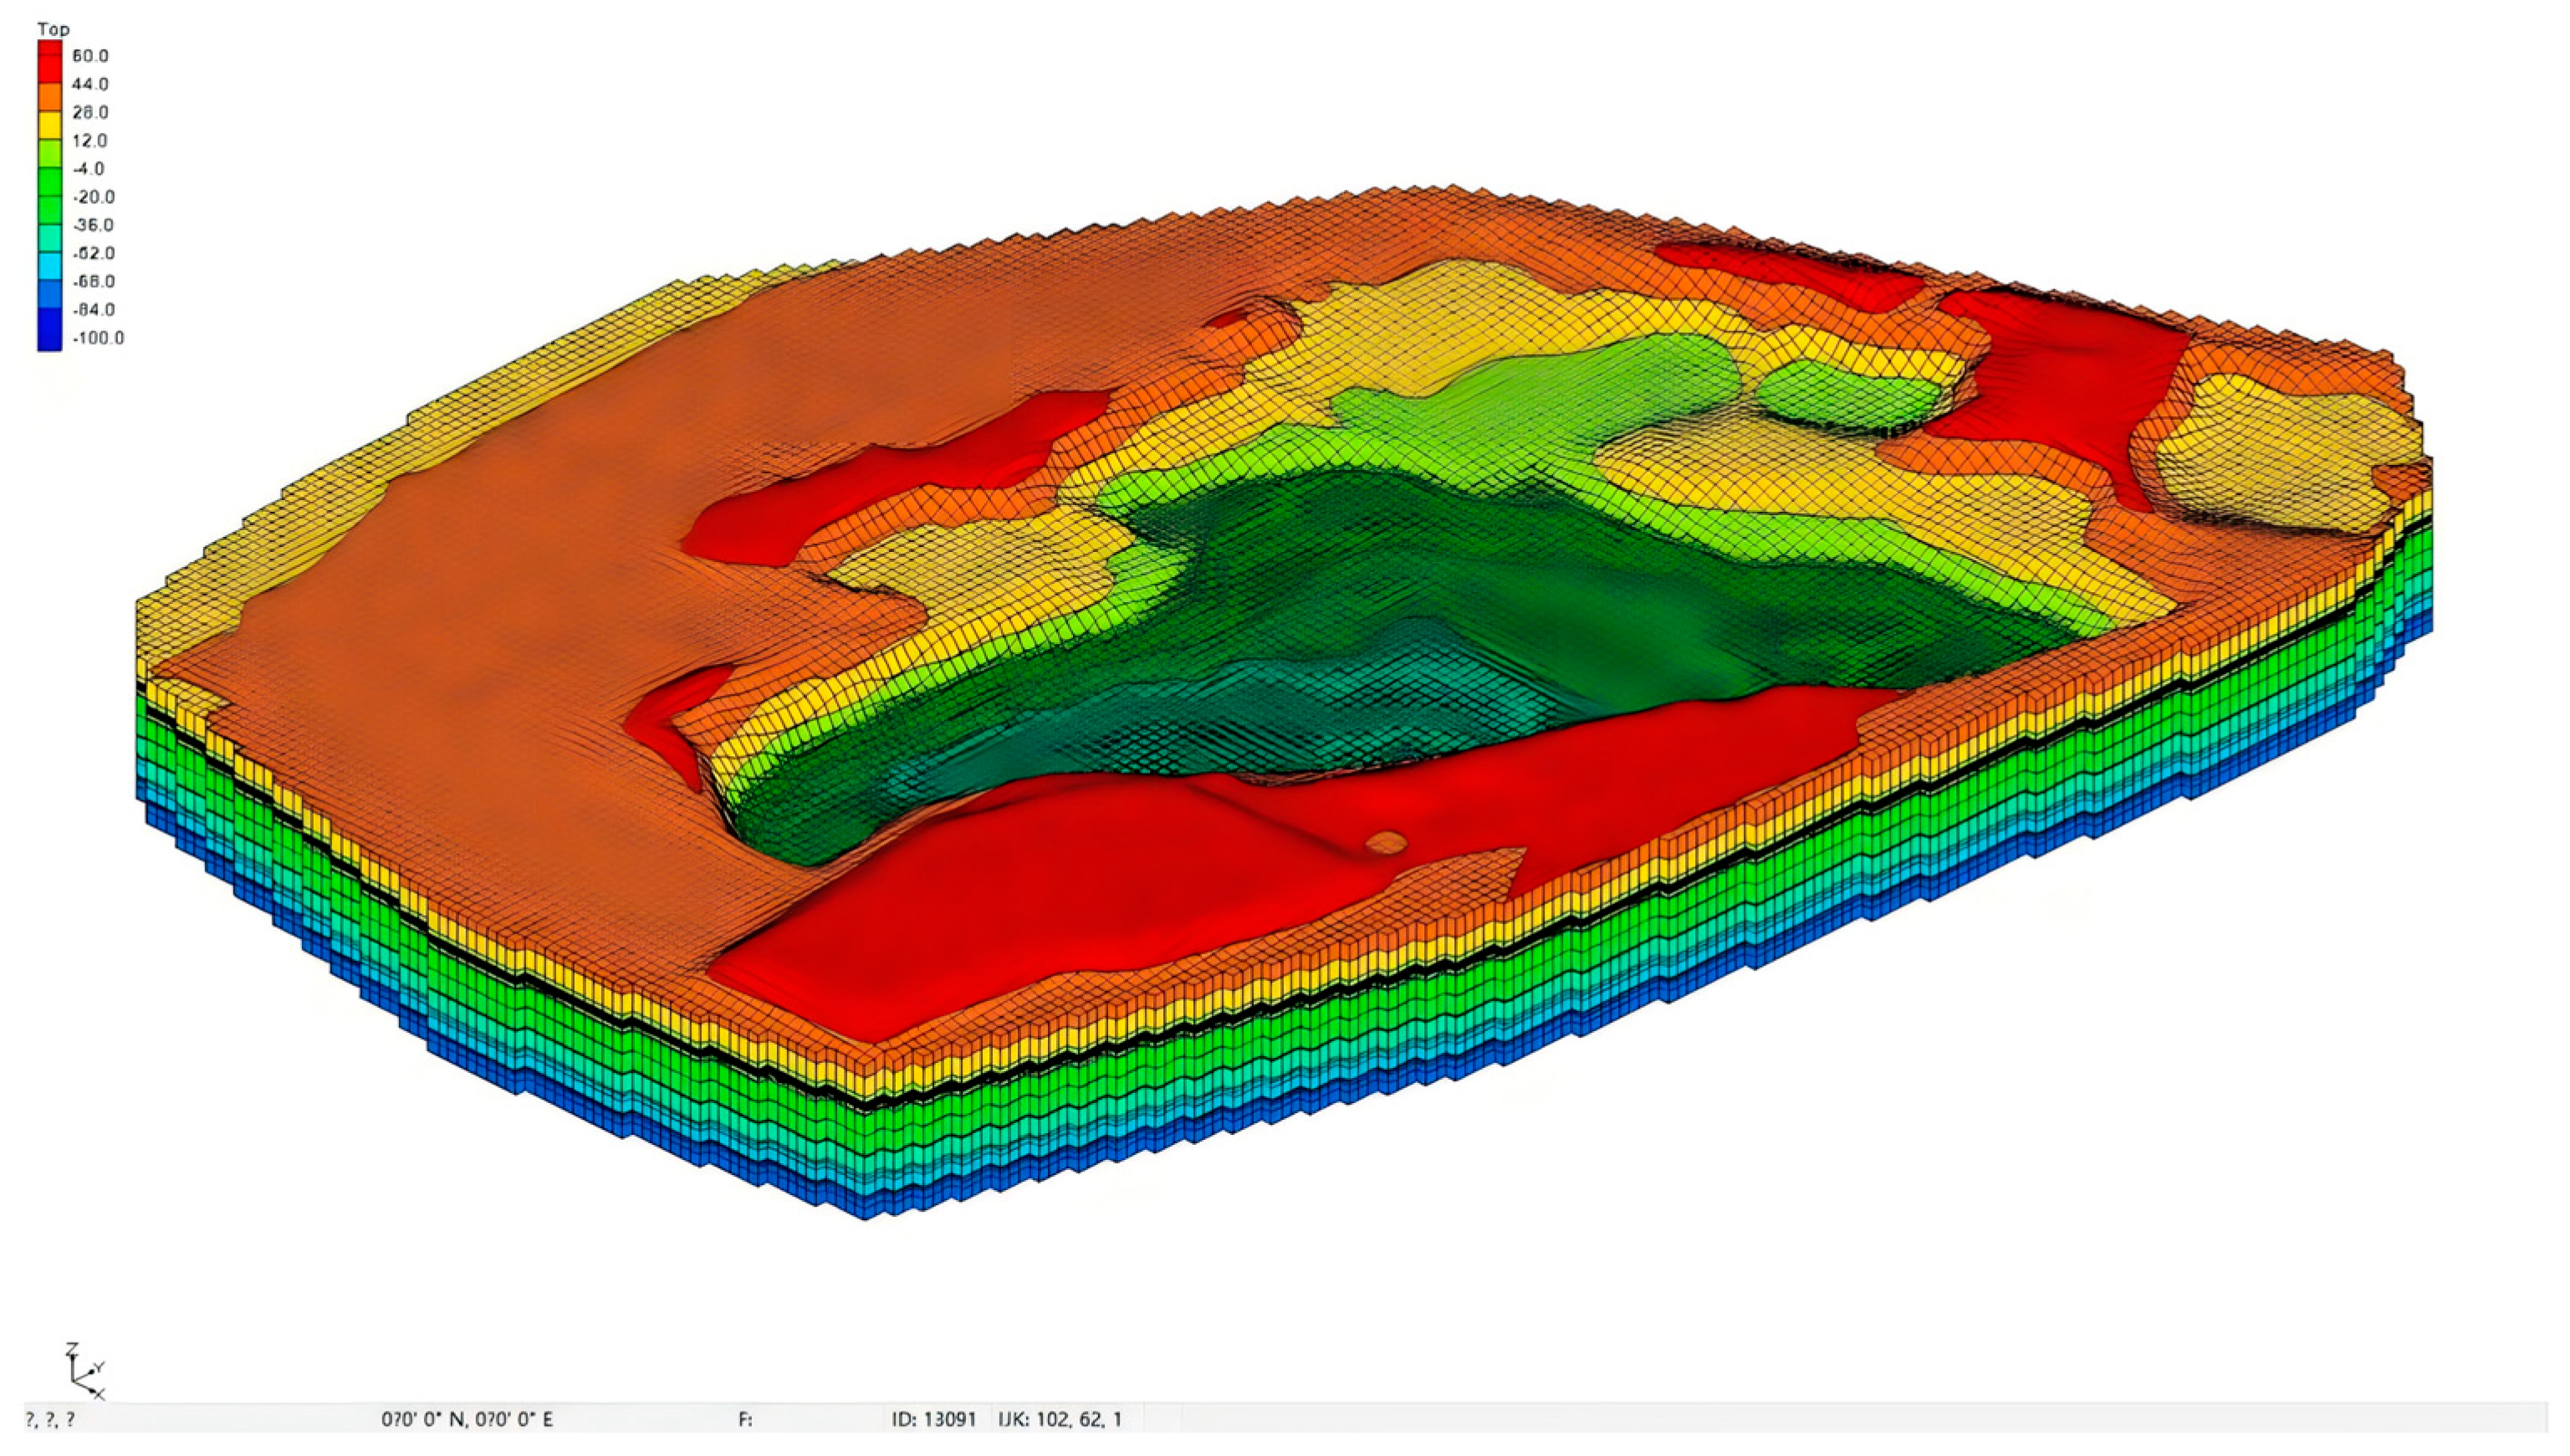
Considering the topography of the abandoned open-pit quarry, groundwater is divided into deep groundwater and shallow aquifer water. The environmental model was constructed based on a generalization of the site’s hydrogeological conditions to establish a flow model (MODFLOW). The fundamental hydrogeological parameters were obtained from the literature reviews and hydrogeological survey data (Table S3, Supplementary Materials). Initial conditions were established based on measured water levels from monitoring wells at the site. Boundary conditions were generalized according to regional groundwater flow characteristics. Subsequently, the solute transport model (MT3DMS) was constructed upon the hydraulic flow model. For deep groundwater source concentrations, the concentrations C1 of characteristic pollutants were obtained from long-term leaching tests—based on fitted curves of concentration changes over time (or maximum measured concentrations)—as they reach the groundwater table through the bedrock layer, along with precipitation infiltration rates derived from the HELP model. For shallow aquifer stagnant water, source concentrations were based on fitted curves (or maximum measured concentrations C0) of characteristic pollutant concentrations over time obtained from long-term leaching tests, combined with HELP model-derived precipitation infiltration rates. The three-dimensional visualization structure of the site model constructed through the above steps is shown in Figure 7.
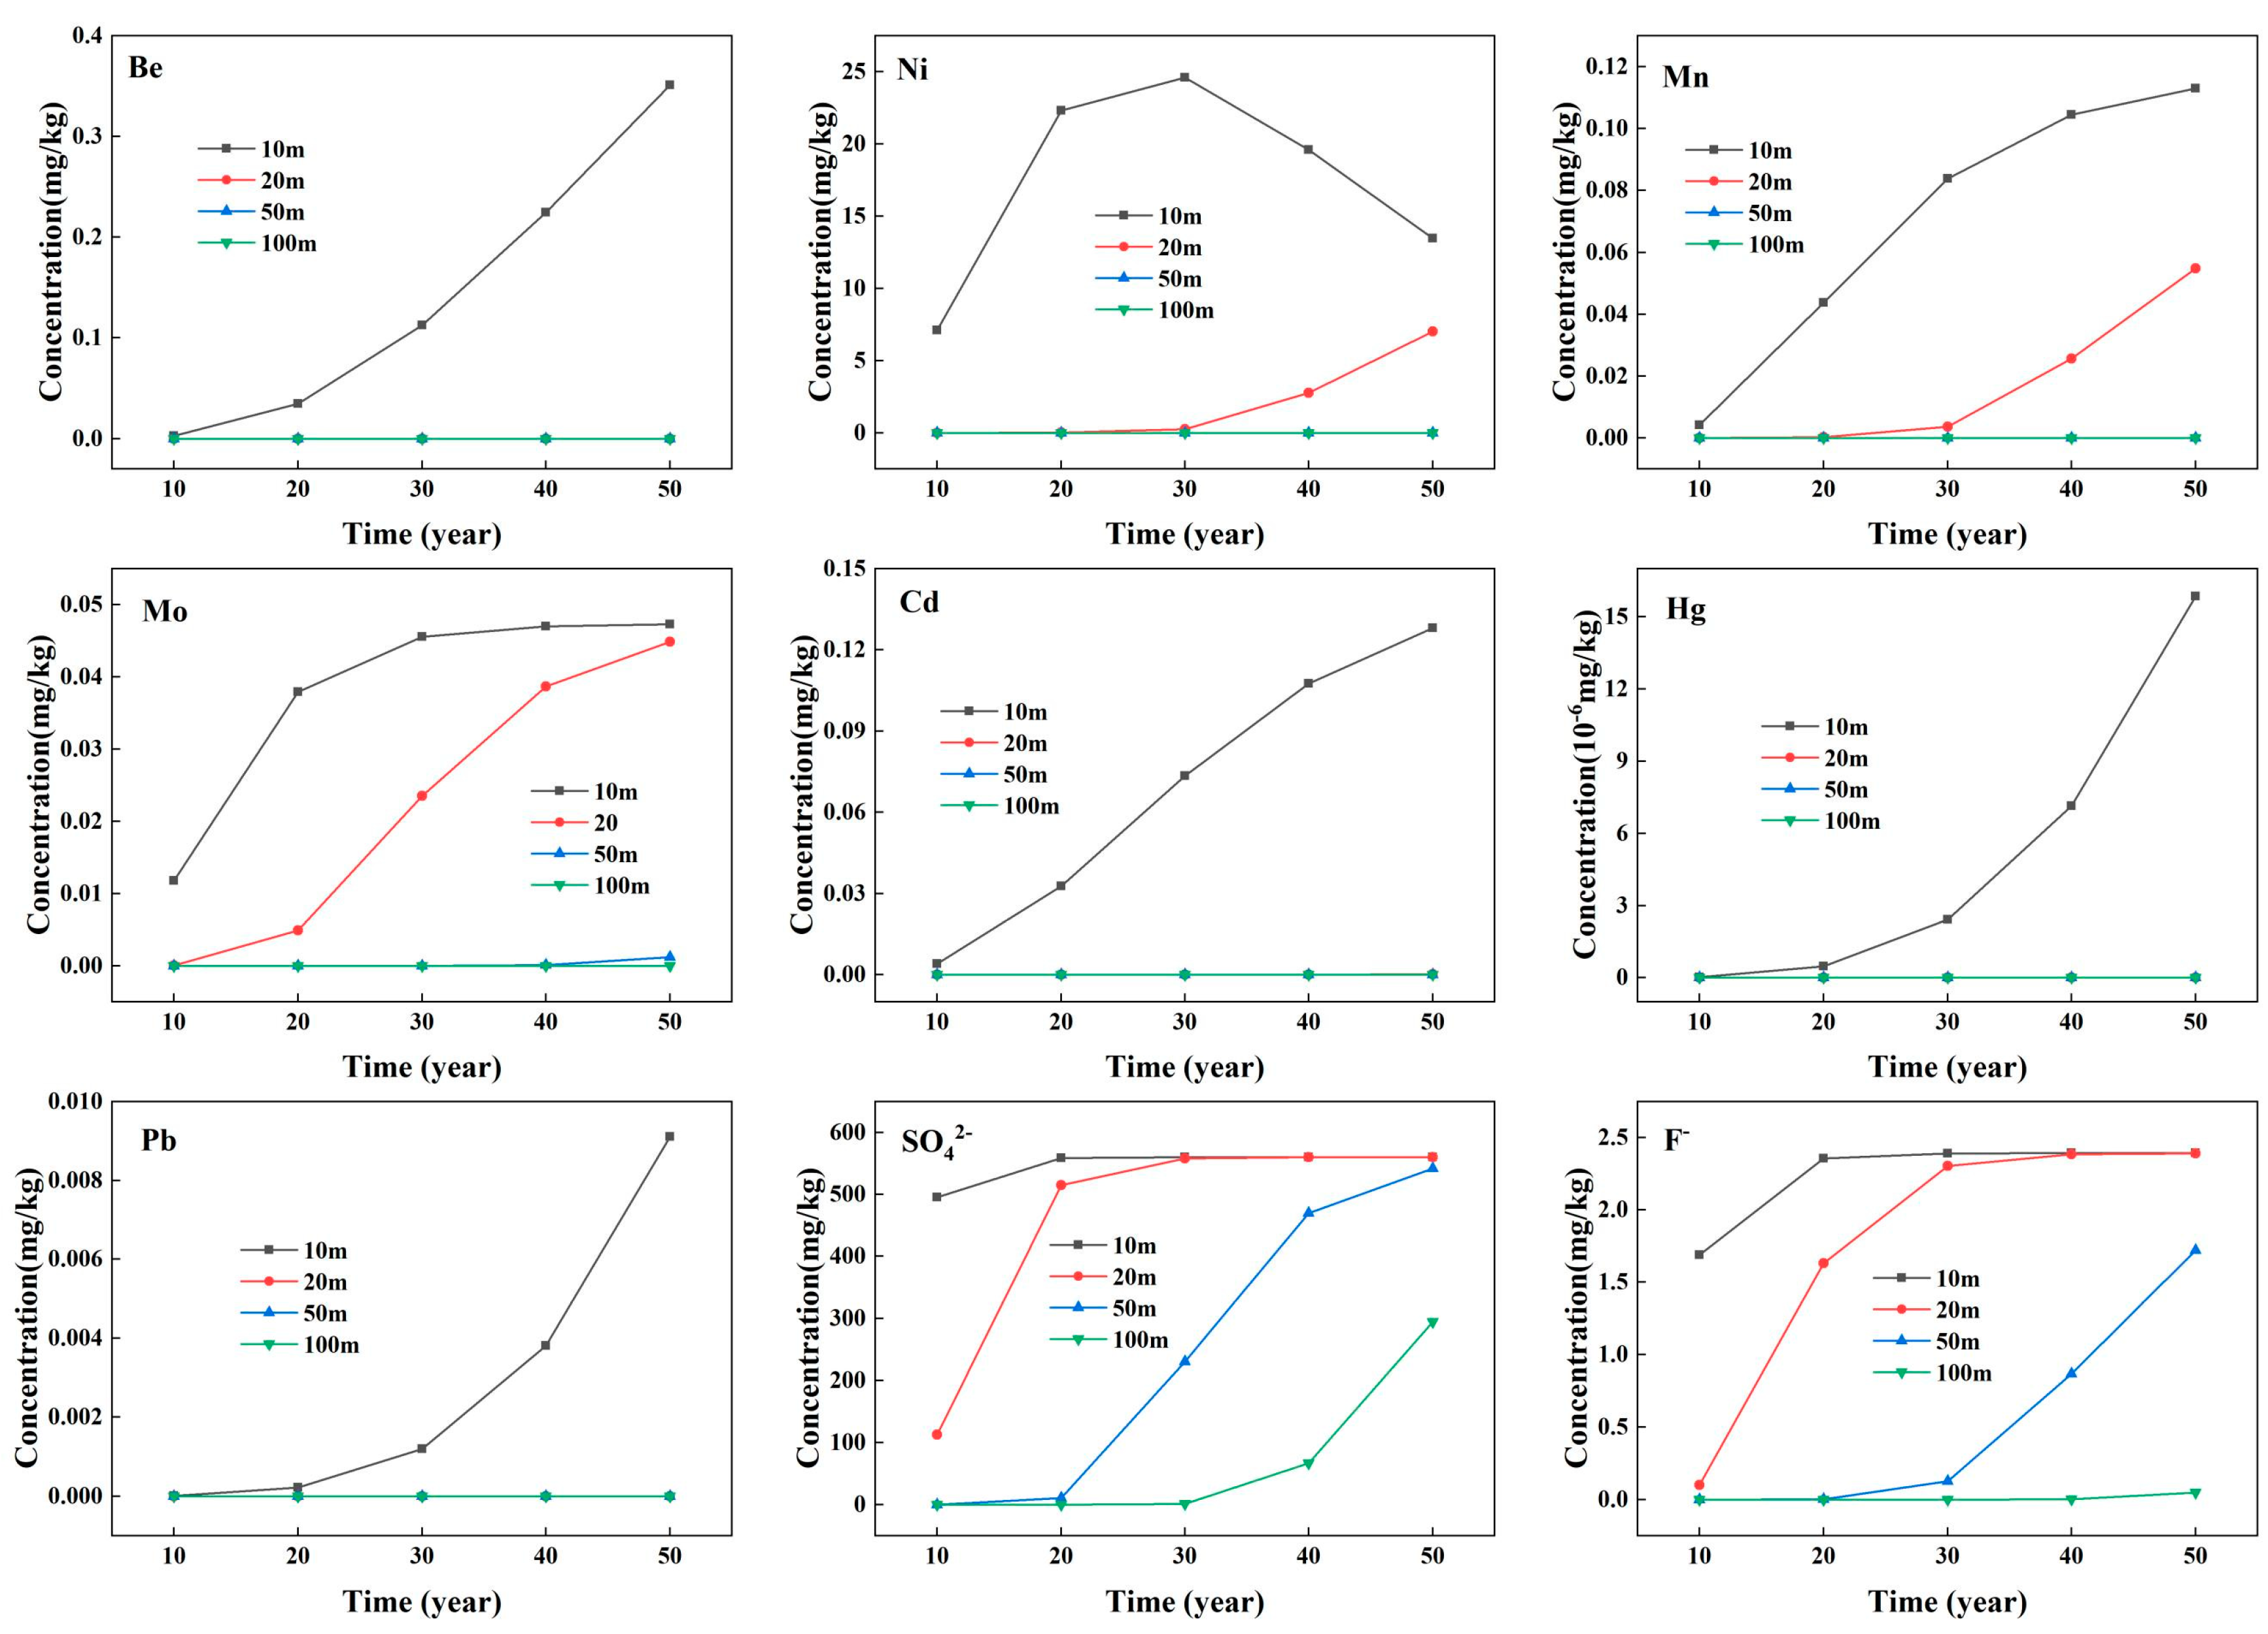
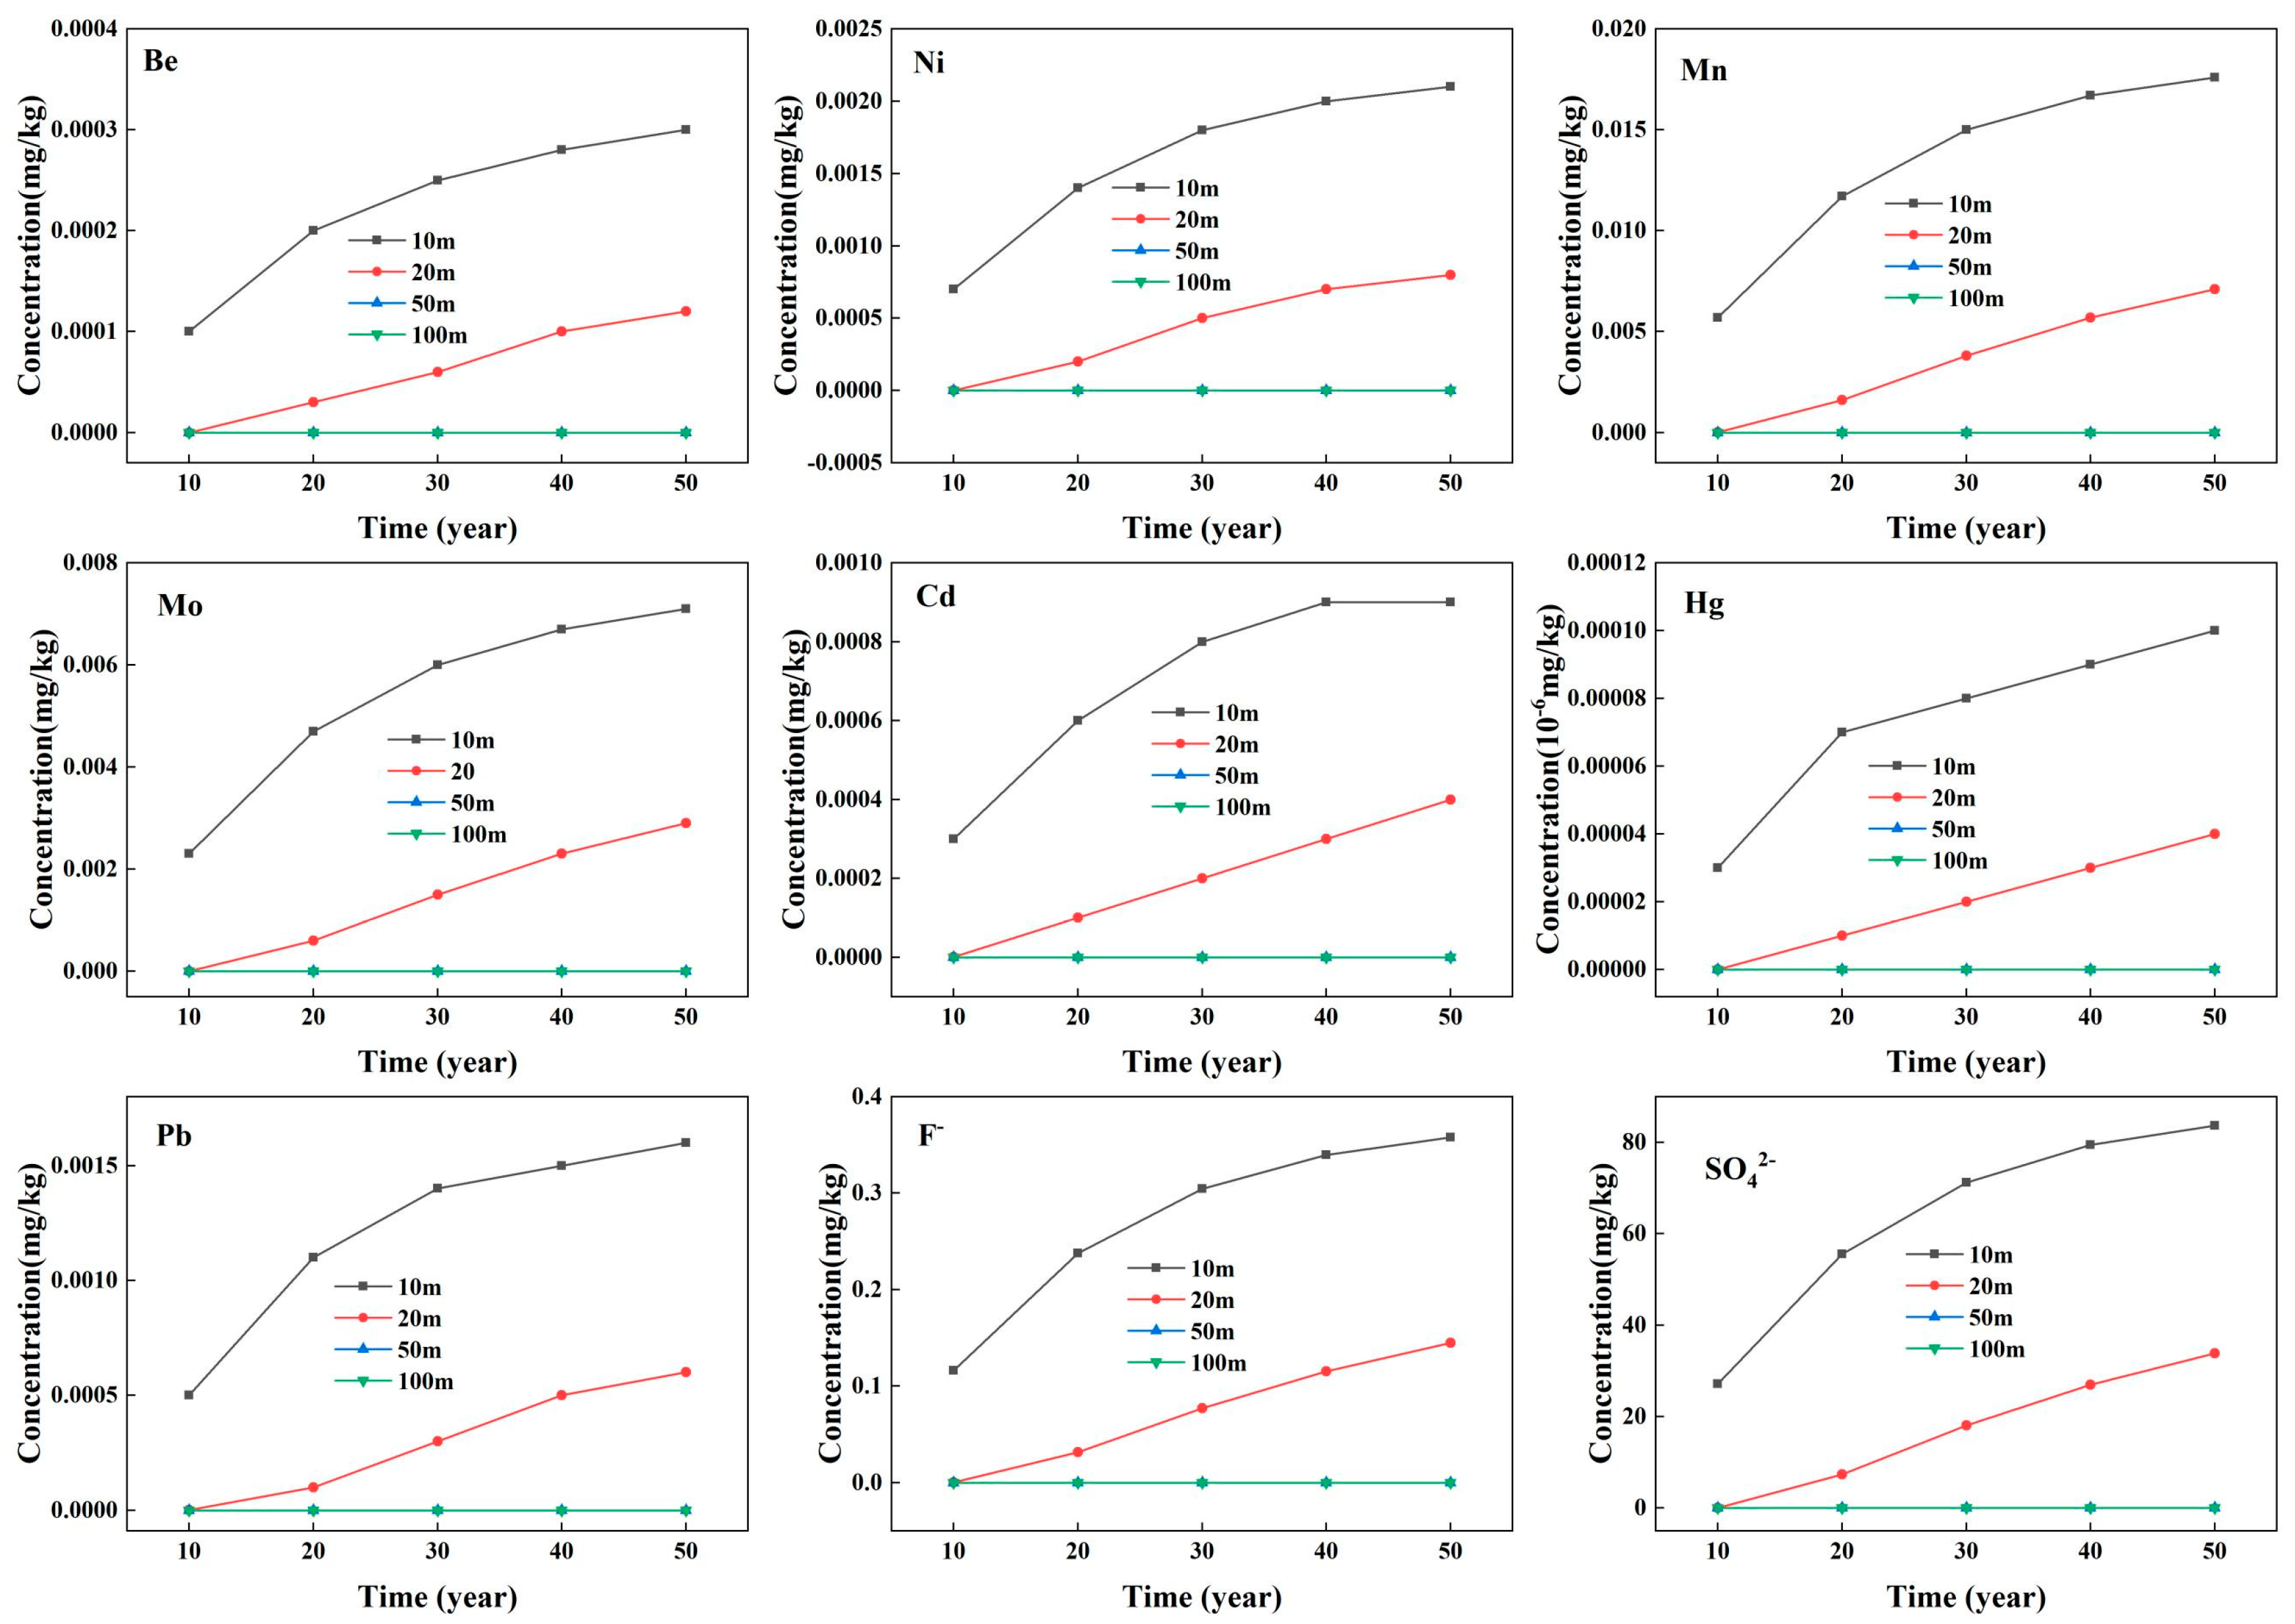
Time-dependent concentration curves of pit-bottom pollutants migrating to the groundwater surface were displayed in Figure 8. Contaminants must traverse the unsaturated zone rock layer during their vertical migration from the pit bottom to deep groundwater (−80 m). This rock layer can be generalized as a porous medium where pollutants exist in forms similar to soil, divided into solid and liquid phases. Pollutants in the solid phase are immobilized on the rock matrix through adsorption and other mechanisms; pollutants in the liquid phase dissolve in the rock’s pore water. The MODFLOW/MT3DMS model predictions (Table 8) show that the maximum predicted concentrations of nine characteristic pollutants at all deep groundwater monitoring points remained at low levels over a 50-year period [33,44]. Among pollutants, the highest fluoride concentration reached 0.724 mg/L, while the highest sulfate concentration was 226.13 mg/L. Heavy metal concentrations were all well below safety thresholds, with the highest concentration of Mn reaching only 1.11 × 10⁻¹² mg/L and Ni at 8.47 × 10⁻¹⁹ mg/L. This positive outcome was primarily attributable to the barrier effect and natural attenuation processes within the unsaturated zone rock layers [35]. Pollutant concentrations were significantly reduced through adsorption, precipitation, and dispersion, posing extremely low environmental risks to deep groundwater during migration [32,45].
Time-dependent concentration curves of pollutants at four monitoring points were shown in Figure 9. The maximum predicted concentrations of characteristic pollutants in the shallow aquifer stagnant water occurred at the 10 m downstream monitoring point, all within safe levels. The highest concentration was 0.855 mg/L for fluoride, 200.104 mg/L for sulfate, and 0.0169 mg/L for molybdenum (Mo) among heavy metals—only 24.1% of the safety threshold (Table 9). As distance increased, pollutant concentrations decreased significantly. Pollutant concentrations decreased significantly with increasing distance, particularly at 50 m where concentrations had already dropped to low levels, and at 100 m where concentrations approached the detection limit. This indicated that under the hydrogeological conditions of the site, after migration, dispersion, and adsorption attenuation through the subsurface strata, the environmental risk posed by shallow aquifer stagnant water remains within a controllable range.
Regarding the impacts of extreme rainfall and climate change, the model scenarios have been designed with conservative considerations and coverage. As for deep groundwater, it is overlain by a thick vadose zone and rock layers. This layer of slightly to weakly permeable strata provides a strong buffering and damping effect against extreme surface rainfall; therefore, short-term extreme rainfall is highly unlikely to significantly alter the long-term flow distribution and recharge conditions of deep groundwater. For shallow groundwater, the very construction of shallow groundwater pathways in our model is intended to simulate the most unfavorable extreme climate scenario: “the formation of localized shallow surface water/groundwater accumulation on-site following an extreme heavy rainfall event.” Even under this extreme rainfall recharge scenario, the simulated concentrations of the vast majority of pollutants remain well below regulatory limits.

3.4.3. Risk Management and Monitoring Requirements

Based on experimental and simulation results, combined with engineering practice, a three-tier risk management system comprising “source control, process monitoring, and end-of-pipe monitoring” was established to ensure long-term environmental safety after tailings backfilling [46].
Source control is the core of risk management, aiming to reduce the potential for pollutant release from the tailings themselves. Key measures include: (1) screening and washing tailings to remove coarse impurities and some soluble pollutants; (2) strictly implementing dry backfilling techniques, controlling backfill dry density to 2.8 t/m3, and using layered compaction to ensure physical stability, while maintaining unsaturated conditions to minimize rainwater infiltration [10,47]; (3) prioritizing using tailings with longer storage periods, leveraging their higher chemical stability to reduce release risks [24]; (4) adding modifiers such as lime and fly ash to the tailings to adjust their physicochemical properties, promote the formation of stable heavy metal precipitates, and lower their leaching potential [14,27].
Process monitoring aims to track the real-time status of the backfill body and the migration dynamics of pollutants, enabling prompt detection of abnormal conditions [48]. Key measures include: (1) establishing monitoring points for surface horizontal displacement, deep horizontal displacement, and settlement to regularly monitor pile displacement and settlement, preventing cracks in the cover layer caused by uneven settlement; (2) installing phreatic line observation wells within the backfill body to monitor changes in internal saturation and provide early warnings for risks of concentrated rainfall infiltration; (3) establishing monitoring points in the surrounding soil to periodically collect soil samples, test concentrations of characteristic pollutants, and track lateral migration dynamics [29]; (4) installing a drainage collection system at the base of the backfill to regularly collect leachate samples, monitor pollutant concentration changes, and evaluate whether release patterns align with simulation results [23].
Endpoint monitoring aims to assess groundwater environmental quality and prevent potential pollution risks [49]. Key measures include: (1) establishing reference monitoring wells upstream of the groundwater flow field and tracking monitoring wells downstream in the direction of contaminant plume dispersion, with monitoring points located 10 m, 20 m, 50 m, and 100 m from the backfill area [47]; (2) ensuring monitoring parameters include pH, fluoride, sulfate, and characteristic pollutants such as various heavy metals [50]; (3) establishing a monitoring data early warning mechanism [51]. When measured concentrations exceed warning thresholds (as shown in Table S4), initiate response procedures are initiated to investigate pollution causes and implement targeted control measures. Based on concentration-triggered warnings, alarms, and emergency responses, measures such as increased monitoring frequency, enhanced impermeability, and interception, diversion, and drainage are implemented to ensure the long-term safety of the groundwater environment.

4. Conclusions

(1) The leachate from all three types of flotation tailings samples examined in this study was slightly alkaline (pH 8.21–8.45), and the leaching concentrations of pollutants were generally low, indicating that these tailings meet the basic requirements for backfilling open pits under the operating conditions of this study. Pollutant leaching concentrations across tailings from different sources followed the pattern: “tailings from the production process > tailings from the newly constructed Jiajia tailings pond > tailings from the existing Jiajia tailings pond.” Extended storage duration significantly enhanced the chemical stability of the tailings.
(2) Nine characteristic pollutants were identified in long-term leaching experiments conducted on the high-risk tailings sample (S1) in this study. Their release patterns were classified into three categories: continuous slow release (fluorides), initial rapid elution (sulfates, Mn, Mo, Hg), and delayed/complex release (Ni, Cd, Be, Pb). Under the test conditions, the release kinetics of these pollutants were effectively characterized by first-order exponential decay models, with R2 values ranging from 0.85 to 0.96.
(3) Based on the hydrogeological parameters of the site and the backfilling conditions, HYDRUS model simulation results revealed that the maximum concentrations of pollutants migrating laterally into surrounding soils remain well below safety thresholds, with soil environmental risks within acceptable limits. Simulation results from the MODFLOW/MT3DMS model demonstrate that within 50 years post-backfilling, maximum concentrations of characteristic pollutants in both deep groundwater and shallow aquifer water remain within safe levels. The site’s “micro-to-weakly permeable” strata exhibit significant barrier effects and natural attenuation capabilities against pollutants.
(4) Given the tailings characteristics, site conditions, and environmental objectives of this project, a three-tier risk management system encompassing source control, process monitoring, and endpoint surveillance was established. Specific control measures such as tailings pretreatment, pile stability monitoring, and groundwater tracking monitoring were proposed. These measures could serve as a technical reference for the safe implementation of similar open-pit backfilling projects involving flotation tailings.
This study focused on the analysis of weakly alkaline, low-leaching flotation tailings and dry backfilling conditions in a specific region. Not all samples were subjected to long-term leaching, and the numerical simulations were based on the idealized assumptions of homogeneous strata and a 50-year timescale; therefore, the applicability of the conclusions is limited to a certain extent. Future research could be expanded to include multiple types of tailings and various backfilling processes, conduct long-term in situ experiments, and develop detailed heterogeneous models. This would further refine the full lifecycle environmental risk assessment and standardized management system, providing more comprehensive technical support for similar projects.

Supplementary Materials

The following supporting information can be downloaded at: https://www.mdpi.com/article/10.3390/min16050491/s1, Text S1: Detailed site description; Text S2: Sampling sites and sample collection; Text S3: Simulation of long-term pollutant release patterns; Text S4: Simulation of pollutant migration and transformation pathways; Figure S1: Current state of the quarry (aerial photograph); Figure S2: Engineering geological cross-section diagram; Figure S3: Elevation map of the study area [52]; Table S1: Sample collection method; Table S2: Input of model parameters; Table S3: Input of model parameters; Table S4: Alarm threshold.

Author Contributions

Conceptualization, P.L.; methodology, Y.L.; validation, Z.L.; formal analysis, P.L.; investigation, Y.L.; resources, P.L. and Q.L.; data curation, Y.L.; writing—original draft preparation, Y.S.; writing—review and editing, Y.S.; visualization, W.M.; supervision, Z.H.; project administration, Z.H.; funding acquisition, Y.S. All authors have read and agreed to the published version of the manuscript.

Funding

This research was funded by the Shandong Postdoctoral Science Foundation (SDZZ-ZR-202501088).

Data Availability Statement

The data presented in this study are available on request from the corresponding author.

Conflicts of Interest

Peng Li, Yang Sun, Wenwen Meng, Zhe Hu and Zhengcan Li are employees of Shandong Gold Group Co., Ltd. Qilin Liu is employee of Beijing Guohuan Tsinghua Environmental Engineering Design Research Institute Co., Ltd. The authors declare that they have no known competing financial interests or personal relationships that could have appeared to influence the work reported in this paper.

References

  1. Liu, G.; Guo, W.; Chai, S.; Li, J. Research on production capacity planning method of open-pit coal mine. Sci. Rep. 2023, 13, 8676. [Google Scholar] [CrossRef]
  2. Asr, E.T.; Kakaie, R.; Ataei, M.; Tavakoli Mohammadi, M.R. A review of studies on sustainable development in mining life cycle. J. Clean. Prod. 2019, 229, 213–231. [Google Scholar] [CrossRef]
  3. Adiansyah, J.S.; Rosano, M.; Vink, S.; Keir, G. A framework for a sustainable approach to mine tailings management: Disposal strategies. J. Clean. Prod. 2017, 108, 1050–1062. [Google Scholar] [CrossRef]
  4. Lèbre, É.; Corder, G.; Golev, A. The role of the mining industry in a circular economy: A framework for resource management at the mine site level. J. Ind. Ecol. 2017, 21, 662–672. [Google Scholar] [CrossRef]
  5. Mudd, G.M. The environmental sustainability of mining in Australia: Key mega-trends and looming constraints. Resour. Policy 2010, 35, 98–115. [Google Scholar] [CrossRef]
  6. Kossoff, D.; Dubbin, W.E.; Alfredsson, M.; Edwards, S.J.; Macklin, M.G.; Hudson-Edwards, K.A. Mine tailings dams: Characteristics, failure, environmental impacts, and remediation. Appl. Geochem. 2014, 51, 229–245. [Google Scholar] [CrossRef]
  7. Hudson-Edwards, K.A.; Jamieson, H.E.; Lottermoser, B.G. Mine wastes: Past, present, future. Elements 2011, 7, 375–380. [Google Scholar] [CrossRef]
  8. Xu, L.; Wei, D.; Liu, H.; Li, G.; Jiang, T. Super-high bed homogeneous sintering for iron ores with low carbon emissions. J. Clean. Prod. 2025, 529, 146848. [Google Scholar] [CrossRef]
  9. Zhang, Q.L.; Zhang, J.X. A review of cemented paste backfill: Materials, design, and properties. Constr. Build. Mater. 2022, 314, 125667. [Google Scholar]
  10. Belem, T.; Benzaazoua, M. An overview of the use of paste backfill technology as a ground support method in cut-and-fill mines. Minerals 2021, 11, 959. [Google Scholar]
  11. Qi, C.; Fourie, A. Cemented paste backfill for mineral tailings management: Review and future perspectives. Miner. Eng. 2019, 144, 106025. [Google Scholar] [CrossRef]
  12. Yin, S.; Shao, Y.; Wu, A.; Wang, H.; Liu, X. A systematic review of paste technology in metal mines for cleaner production in China. J. Clean. Prod. 2020, 247, 119590. [Google Scholar] [CrossRef]
  13. Chen, Q.; Zhang, Q.; Wang, X.; Xiao, C.; Hu, J. Recycling of mine tailings for the geopolymers production: A systematic review. Case Stud. Constr. Mater. 2020, 13, e00433. [Google Scholar]
  14. Li, X.; Du, J. Recent advances in the utilization of mine tailings as construction materials: A review. J. Build. Eng. 2021, 44, 103366. [Google Scholar]
  15. Wang, J.; Zhang, C.; Fu, J.; Song, W.; Zhang, Y. Effect of water saturation on mechanical characteristics and damage behavior of cemented paste backfill. J. Mater. Res. Technol. 2021, 15, 6624–6639. [Google Scholar] [CrossRef]
  16. Tabelin, C.B.; Sasaki, R.; Igarashi, T.; Park, I.; Tamoto, S.; Arima, T.; Ito, M.; Hiroyoshi, N. Simultaneous leaching of arsenite, arsenate, selenite and selenate, and their migration in tunnel-excavated sedimentary rocks: II. Kinetic and reactive transport modeling. Chemosphere 2017, 188, 444–454. [Google Scholar] [CrossRef]
  17. Wang, J.; Xing, M.; Yang, X.; Jiao, H.; Yang, L.; Yang, T.; Wang, C.; Liu, X. Study on the Long-Term Durability and Leaching Characteristics of Low-Consumption Cement Backfill under Different Environmental Conditions. Sustainability 2024, 16, 5138. [Google Scholar] [CrossRef]
  18. Blowes, D.W.; Ptacek, C.J.; Jambor, J.L.; Weisener, C.G. The geochemistry of acid mine drainage. In Treatise on Geochemistry, 2nd ed.; Elsevier: Amsterdam, The Netherlands, 2014; Volume 11, pp. 131–190. [Google Scholar]
  19. Lottermoser, B.G. Mine Wastes: Characterization, Treatment and Environmental Impacts, 3rd ed.; Springer: Berlin/Heidelberg, Germany, 2010. [Google Scholar]
  20. Zhang, W.; Chen, X.; Li, Y. Assessment of long-term heavy metal release from sulfide-rich tailings backfill using humidity cell tests. Chemosphere 2023, 310, 136834. [Google Scholar]
  21. Fall, M.; Nasir, O. Mechanical behavior of cemented paste backfill at early ages: Effect of temperature and curing stress. Minerals 2021, 11, 243. [Google Scholar]
  22. Zhang, T.; Liu, S. Machine learning-based prediction of heavy metal leaching from mine tailings under varying environmental conditions. J. Hazard. Mater. 2023, 443, 130209. [Google Scholar]
  23. Liu, C.; Wang, H.; Xiao, B.; Nie, J.; Liu, M. Initial commissioning parameters research of full-tailings backfill system in metal mine: From laboratory tests to industrial operation. Constr. Build. Mater. 2025, 365, 130123. [Google Scholar] [CrossRef]
  24. Simunek, J.; van Genuchten, M.T.; Sejna, M. Recent developments and applications of the HYDRUS computer software packages. Vadose Zone J. 2016, 15, 1–25. [Google Scholar] [CrossRef]
  25. Prommer, H.; Barry, D.A.; Zheng, C. MODFLOW/MT3DMS-based reactive transport modeling: A review. Groundwater 2019, 57, 6–18. [Google Scholar]
  26. Kiventerä, J.; Perumal, P.; Yliniemi, J.; Illikainen, M.; Kinnunen, P. Mine tailings as a raw material in alkali activation: A review. Int. J. Miner. Metall. Mater. 2020, 27, 1009–1020. [Google Scholar] [CrossRef]
  27. Gherghel, A.; Busch, M. Evaluation of acid mine drainage and metal release potential of cemented paste backfill of sulfide rich tailings. Int. J. Min. Reclam. Environ. 2023, 39, 491–510. [Google Scholar]
  28. Wang, F.; Drumm, E.C. Numerical modeling of heavy metal transport in unsaturated soils amended with mine tailings. Environ. Geotech. 2023, 10, 106–118. [Google Scholar]
  29. Riquelme, J.I.; Vidal, K. Local sensitivity analysis of fitting parameters for the water retention curve in unsaturated flow models in filtered tailings. In Paste 2025: Proceedings of the 27th International Conference on Paste, Thickened and Filtered Tailings; Australian Centre for Geomechanics: Crawley, Australia, 2025; pp. 565–576. [Google Scholar]
  30. Fall, M.; Adrien, D.; Célestin, J.C.; Pokharel, M.; Touré, M. Saturated hydraulic conductivity of cemented paste backfill. Miner. Eng. 2010, 23, 65–70. [Google Scholar] [CrossRef]
  31. Sherstiuk, Y.A.; Petlovanyi, M.V.; Sai, K.S. Predicting the geofiltration processes within the closed quarry zone in difficult technogenically disturbed conditions. Nauk. Visnyk Natsionalnoho Hirnychoho Universytetu 2025, 013–021. [Google Scholar] [CrossRef]
  32. Zheng, C.; Bennett, G.D. Applied Contaminant Transport Modeling, 2nd ed.; Wiley-Interscience: Hoboken, NJ, USA, 2002. [Google Scholar]
  33. Bozan, C.; Wallis, I.; Cook, P.G.; Dogramaci, S. Groundwater-level recovery following closure of open-pit mines. Hydrogeol. J. 2022, 30, 1819–1832. [Google Scholar] [CrossRef]
  34. Szczepiński, J. The significance of groundwater flow modeling study for simulation of opencast mine dewatering, flooding, and the environmental impact. Water 2019, 11, 848. [Google Scholar] [CrossRef]
  35. Wang, L.; Chen, Q.; Jamieson, H.E. Geochemical and mineralogical controls on the long-term release of arsenic from historical gold mine tailings. Appl. Geochem. 2024, 160, 105821. [Google Scholar]
  36. GB 18599-2020; Ministry of Ecology and Environment, State Administration for Market Regulation. Pollution Control Standards for the Storage and Landfilling of General Industrial Solid Waste. China Environmental Publishing Group Co., Ltd.: Beijing, China, 2020.
  37. GB 8978-1996; State Environmental Protection Administration, General Administration of Quality Supervision, Inspection and Quarantine. Comprehensive Discharge Standard for Wastewater. China Standards Press: Beijing, China, 1996.
  38. Zeng, S.; Li, J.; Gao, Q. Dissolution kinetics of fluorite (CaF2) and its implications for fluoride release in mine tailings. Chem. Geol. 2022, 608, 121029. [Google Scholar]
  39. GB/T 14848-2017; Ministry of Land and Resources of the People’s Republic of China, General Administration of Quality Supervision, Inspection and Quarantine of the Peoples Republic of China, Standardization Administration of China. Groundwater Quality Standards. China Standards Press: Beijing, China, 2017.
  40. Parbhakar-Fox, A.; Lottermoser, B.G. A critical review of acid rock drainage prediction methods and practices. Miner. Eng. 2015, 82, 107–124. [Google Scholar] [CrossRef]
  41. U.S. Environmental Protection Agency. Framework for Metals Risk Assessment (EPA 120/R-07/001); Office of the Science Advisor; U.S. Environmental Protection Agency: Washington, DC, USA, 2022.
  42. Xu, D.M.; Zhan, C.L.; Liu, H.X.; Lin, H.Z. A critical review of environmental indices for assessing the risk of tailings dam failure. Sci. Total Environ. 2021, 783, 146914. [Google Scholar]
  43. He, X.; Wu, S.; Xu, C.; Li, J. Coupled hydro-mechanical modeling of contaminant transport through fractured rock mass below a tailings impoundment. J. Hydrol. 2024, 628, 130567. [Google Scholar]
  44. Duan, N.; Wang, F. Multi-scale simulation of subsurface drainage using coupled MODFLOW-LGR-SDR and MT3DMS models in arid agricultural areas. J. Hydrol. 2023, 617, 129028. [Google Scholar]
  45. Song, W.; Li, Y. A tiered risk management framework for industrial solid waste backfilling projects based on source-process-end principles. J. Environ. Manag. 2023, 326, 116712. [Google Scholar]
  46. Petlovanyi, M.; Sai, K.; Khalymendyk, O.; Borysovska, O.; Sherstiuk, Y. Analytical research of the parameters and characteristics of new “quarry cavities—Backfill material” systems: Case study of Ukraine. Min. Miner. Depos. 2023, 17, 126–139. [Google Scholar] [CrossRef]
  47. Li, J.; Liu, Y.; Gao, R. A new framework for dynamic risk assessment of mine tailings ponds considering rainfall and reservoir level fluctuations. Reliab. Eng. Syst. Saf. 2022, 225, 108627. [Google Scholar] [CrossRef]
  48. Ighalo, J.O.; Adeniyi, A.G. A comprehensive review of water quality monitoring and assessment in Nigeria. Chemosphere 2020, 260, 127569. [Google Scholar] [CrossRef]
  49. International Council on Mining and Metals (ICMM). Integrated Mine Closure: Good Practice Guide, 2nd ed.; International Council on Mining and Metals (ICMM): London, UK, 2019. [Google Scholar]
  50. Shandong Provincial Department of Ecology and Environment; Shandong Provincial Department of Natural Resources. Shandong Province Bulk Industrial Solid Waste Backfilling Pilot Program (Lu Huan Fa [2025] No. 16); Shandong Provincial Department of Ecology and Environment: Shandong, China; Shandong Provincial Department of Natural Resources: Shandong, China, 2025.
  51. Zhang, S. Expert Interpretation of the Shandong Province Bulk Industrial Solid Waste Backfilling Pilot Program; Shandong Provincial Department of Ecology and Environment: Shandong, China, 2025.
  52. Tabelin, C.B.; Uyama, A.; Tomiyama, S.; Villacorte-Tabelin, M.; Phengsaart, T.; Silwamba, M.; Jeon, S.; Park, I.; Arima, T.; Igarashi, T. Geochemical audit of a historical tailings storage facility in Japan: Acid mine drainage formation, zinc migration and mitigation strategies. J. Hazard. Mater. 2022, 438, 129453. [Google Scholar] [CrossRef]
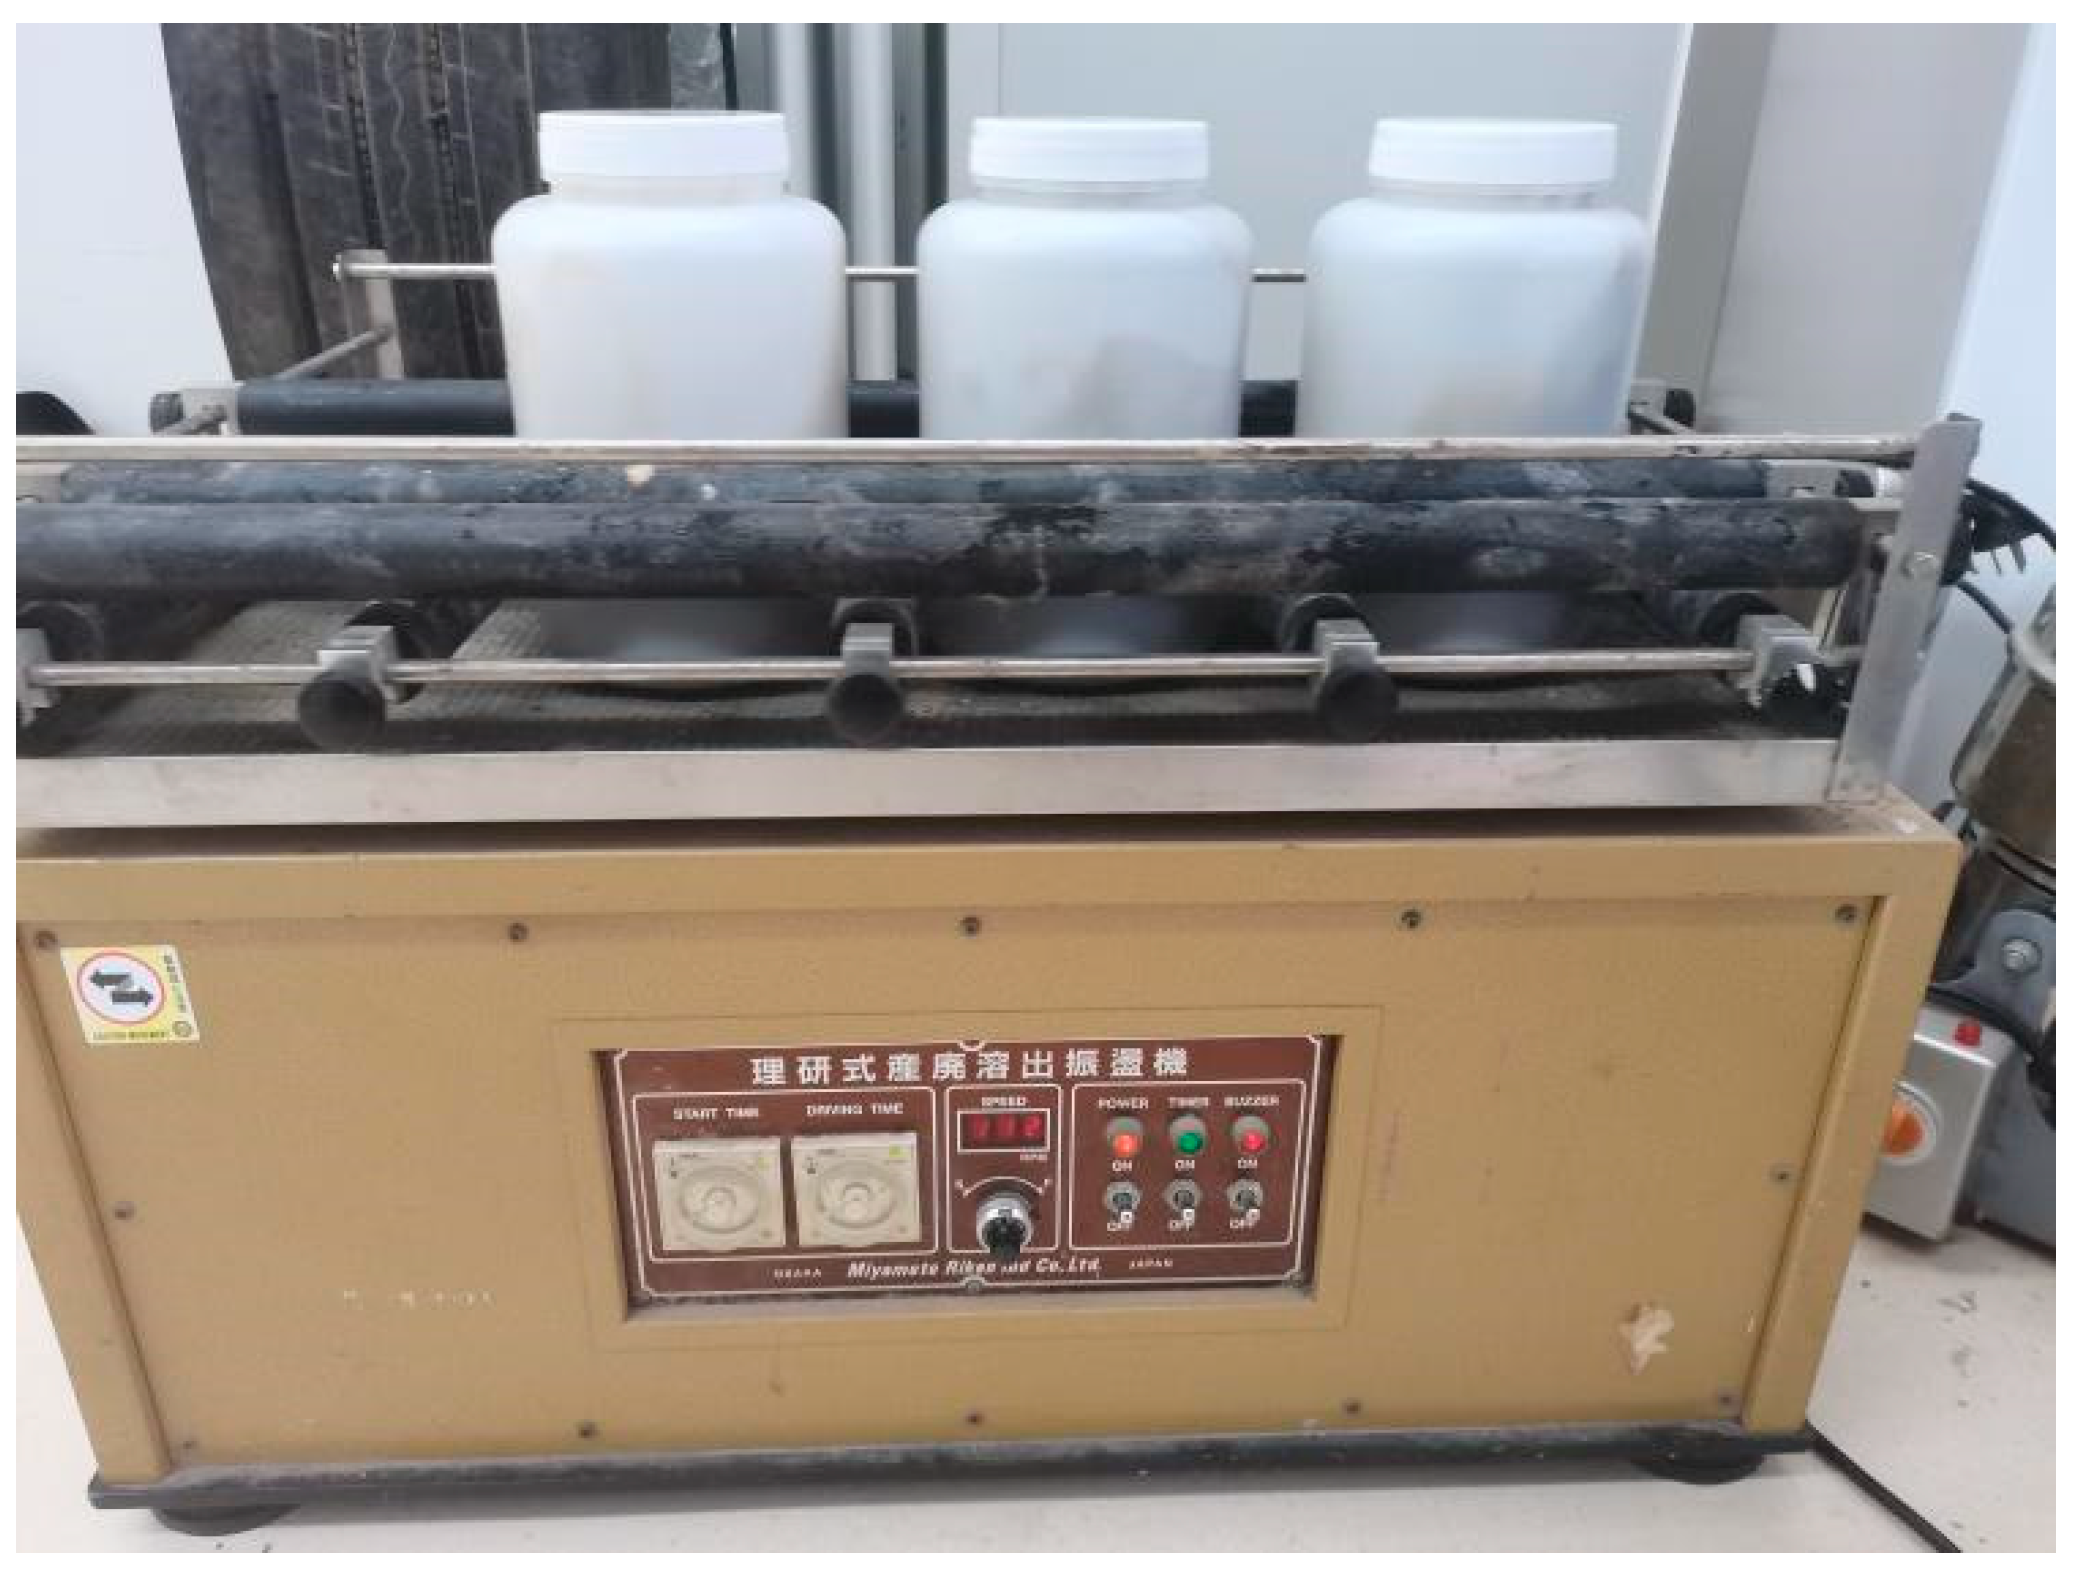
Figure 1. Schematic diagram of short-term leaching test.
Minerals 16 00491 g001
Figure 2. Schematic diagram of long-term leaching test.
Minerals 16 00491 g002
Figure 3. (a) Long-term release pattern of fluoride, (b) Long-term release pattern of sulfate.
Minerals 16 00491 g003
Figure 4. (a) Long-term release patterns of Mn, (b) Long-term release patterns of Mo, (c) Long-term release patterns of Hg.
Minerals 16 00491 g004
Figure 5. (a) Long-term release patterns of Ni, (b) Long-term release patterns of Cd.
Minerals 16 00491 g005
Figure 6. (a) Long-term release patterns of Be, (b) Long-term release patterns of Pb.
Minerals 16 00491 g006
Figure 7. Visualization diagram of the backfill site model.
Minerals 16 00491 g007
Figure 8. Time-dependent concentration curves of pit-bottom pollutants migrating to the groundwater surface.
Minerals 16 00491 g008
Figure 9. Time-dependent concentration curves of pollutants at four monitoring points.
Minerals 16 00491 g009
Table 1. Mineral phase composition of flotation tailings.
Mineral Phase CompositionChemical FormulaContent
QuartzSiO237%
Plagioclase(Na, Ca)Al(Si, Al)3O814%
Microcline feldsparK(AlSi3)O815%
MicaKAl2Si3AlO10(OH)216%
Green mudstone(Mg, Al, Fe)6(Si, Al)4O10(OH)86%
CalciteCaCO33%
DolomiteCaMg(CO3)28%
Table 2. Chemical composition analysis of flotation tailings.
ComponentContentElementContent
SiO255.00%Si 25.70%
Al2O311.30%Al 5.96%
CaO8.01%Ca 5.72%
Fe2O35.06%Fe 3.54%
K2O3.54%K 2.94%
MgO2.68%Mg 1.61%
Na2O1.43%Na 1.06%
TiO20.50%Ti 0.30%
SO30.25%S0.10%
P2O50.12%P0.05%
BaO0.11%Ba0.10%
MnO0.09%Mn0.07%
ZnO0.04%Zn0.03%
CuO0.04%Cu0.03%
ZrO20.03%Zr0.02%
PbO0.02%Pb0.02%
Cl0.02%Cl0.02%
SrO0.02%Sr0.01%
Cr2O30.01%Cr0.01%
Rb2O0.01%Rb0.01%
Table 3. Main metal element content in flotation tailings.
Metal ElementsContent (mg/kg)Metal ElementsContent (mg/kg)
Ag2.60Al 5.14 × 10⁵
Ba731.60Be1.40
Ca4.22 × 104Cd3.70
Co4.50Cr32.11
K2.69 × 104Mg1.43 × 104
Mn628.00Na1.13 × 104
Ni12.00Pb191.60
Sr115.10Ti2.66 × 103
V30.30Zn435.10
Tl0.50Sb0.40
As3.50Mo1.70
Sn37.80Hg0.40
Table 4. Soluble salt pollutant content in flotation tailings.
Pollutant CategoryDetection ComponentsContent
Inorganic anionsF51.9 mg/kg
Cl13.6 mg/kg
SO42−216 mg/kg
NO2<0.248 mg/kg
Br<0.484 mg/kg
NO3<0.428 mg/kg
Table 5. Concentration of leachate from flotation tailings.
Detection CategoryS1S2S3GB 8978
Limit Values 1
pH8.458.338.216−9
Be (mg/L)1.88 × 10−3<0.001<0.001/
Ni (mg/L)8.01 × 10−36.99 × 10−35.43 × 10−31.0
Cr (mg/L)0.0140.0118.82 × 10−31.5
V (mg/L)2.26 × 10−3<0.001<0.001/
Co (mg/L)<0.001<0.001<0.001/
Cu (mg/L)0.00590.00410.00350.5
As (mg/L)3.40 × 10−32.62 × 10−32.10 × 10−30.5
Mn (mg/L)0.0439.58 × 10−38.30 × 10⁻³/
Mo (mg/L)7.37 × 10−37.55 × 10−36.75 × 10⁻³/
Se (mg/L)<0.001<0.001<0.0010.1
Cd (mg/L)<0.001<0.001<0.0010.1
Ag (mg/L)<0.001<0.001<0.001/
Zn (mg/L)0.0930.0810.0672.0
Ba (mg/L)0.0990.0580.045/
Sb (mg/L)<0.001<0.001<0.001/
Sn (mg/L)7.80 × 10−3<0.001<0.001/
Hg (mg/L)<0.0001<0.0001<0.00010.05
Tl (mg/L)<0.0001<0.0001<0.0001/
Pb (mg/L)6.44 × 10−35.11 × 10−33.98 × 10−31.0
Sulfide(mg/L)<0.01<0.01<0.011.0
Cyanide(mg/L)<0.002<0.002<0.0020.5
Iodide(mg/L)<0.05<0.05<0.05/
Ammonia(mg/L)0.04<0.020.0215
1 The maximum allowable discharge concentration for Class I pollutants or the Grade I standard limit for Class II pollutants specified in the “Integrated Wastewater Discharge Standard” (GB 8978-1996) [37]. “/” indicates that no relevant limit has been established for this pollutant under this standard.
Table 6. Long-term leaching solution concentration of flotation tailings.
Detection CategoryMaximum Concentration (mg/L)Initial Concentration (mg/L)Final Concentration
(mg/L)
Detection Limit
(mg/L)
GB/T 14848-2017 Limit Values
(mg/L) 1
Be 0.00254<7 × 10−40.00254<7 × 10−40.002
Ni0.02140.0177<3.8 × 10⁻³<3.8 × 10−30.02
Cr 0.03970.02800.0233<2 × 10−30.05
V1.31 × 10−3<1.1 × 10⁻³<1.1 × 10⁻³<1.1 × 10−30.05
Co2.42 × 10−32.21 × 10⁻³<2.2 × 10⁻³<2.2 × 10−30.05
Cu0.006660.00316<0.0025<2.5 × 10−31.0
As5.87 × 10−31.73 × 10−33.75 × 10−3<1 × 10−30.01
Mn 0.1770.1770.0101<3.6 × 10−30.1
Mo 0.07050.07055.24 × 10−3<1.5 × 10−30.07
Se3.34 × 10−33.34 × 10⁻³<1.3 × 10⁻³<1.3 × 10−30.01
Cd8.68 × 10−3<1.2 × 10⁻³<1.2 × 10⁻³<1.2 × 10−30.005
Ag<2.9 × 10⁻³<2.9 × 10⁻³<2.9 × 10⁻³<2.9 × 10−30.05
Zn0.02810.0142<6.4 × 10⁻³<6.4 × 10−31.0
Ba0.1340.02030.117<1.8 × 10−30.7
Sb3.56 × 10−33.56 × 10⁻³<3.2 × 10⁻³<3.2 × 10−30.005
Sn0.01230.009940.00852//
Hg1.12 × 10−31.12 × 10−34.4 × 10−4/0.001
Tl<0.0013<0.0013<0.0013<0.00130.0001
Pb0.01627.85 × 10−3<4.2 × 10⁻³<4.2 × 10−30.01
Sulfate84084010.70.018250
Chloride2462460.9780.007250
Phosphate<0.051<0.051<0.0510.051/
Fluoride3.592.171.690.0061.0
1 Class III standard limit values in the Groundwater Quality Standard (GB/T 14848-2017) [39]. “/” indicates that no relevant limit value has been established for this pollutant in the standard.
Table 7. Comparison of soil contaminant concentrations with agricultural land soil standards.
CategoryConcentration
(mg/kg)
GB 15618-2018
6.5 < pH ≤ 7.5pH > 7.5
Limit ValueMultiplierLimit ValueMultiplier
Cd0.11890.32.52 0.65.05
Hg0.01532.4156.86 3.4222.22
As0.080430373.13 25310.95
Pb0.2212120542.50 170768.54
Cr0.6604200302.85 250378.56
Cu0.09121001096.49 1001096.49
Ni0.2934100340.83 190647.58
Zn0.3844250650.36 300780.44
Table 8. Deep groundwater simulation prediction results.
CategoryMaximum Concentration (mg/L)Ground Water Depth
(m)
Peak Concentration Time
(year)
GB/T 14848-2017 Limit ValueMultiplier
Be0−80/0.002/
Cd0−80/0.005/
Mn1.11 × 10−12−80500.19.01 × 1010
Mo3.49 × 10−6−80500.072.01 × 104
Ni8.47 × 10−19−80500.022.36 × 1016
Hg0−80/0.001/
Pb0−80/0.01/
Fluoride0.724−805011.38
Sulfate226.13−80502501.11
Table 9. Simulation predictions for Shallow Aquifer Percolation.
CategoryMaximum Concentration (mg/L)Highest Concentration Point
(m)
Maximum Concentration Time
(year)
GB/T 14848-2017 Limit ValueMultiplier
Be0.00071510400.0022.80
Cd0.0021410400.0052.34
Mn0.042210400.12.37
Mo0.016910400.074.14
Ni0.00510400.024.00
Hg0.00023810400.0014.20
Pb0.0038110400.012.62
Fluoride0.855104011.17
Sulfate200.10410402501.25
Disclaimer/Publisher’s Note: The statements, opinions and data contained in all publications are solely those of the individual author(s) and contributor(s) and not of MDPI and/or the editor(s). MDPI and/or the editor(s) disclaim responsibility for any injury to people or property resulting from any ideas, methods, instructions or products referred to in the content.