


Abstract
The efficient recovery of rare earth elements from associated rare-earth-bearing phosphate ores is of paramount importance for expanding the supply of rare earth resources. In contrast to conventional studies that focus on extracting rare earths either from phosphate concentrates or from phosphogypsum generated during the sulfuric acid wet-process, this study takes as its subject the rare-earth-enriched residue—an intermediate product obtained after the selective leaching of phosphorus via the hydrochloric acid route—from a rare-earth-bearing phosphate ore in Zhijin, Guizhou Province. The occurrence states, leaching behavior, and kinetic mechanisms of rare earth elements within this residue were systematically elucidated. Analyses using scanning electron microscopy coupled with energy-dispersive spectroscopy (SEM–EDS) and aberration-corrected scanning transmission electron microscopy (STEM) reveal that rare earth elements are hosted in residual fluorapatite and newly formed CaF2 through isomorphic substitution. The substitution of REE3+ for Ca2+ induces lattice contraction in CaF2, with the interplanar spacing decreasing from 0.27 nm to 0.26 nm. Through single-factor experiments and response surface methodology (RSM) optimization, the optimal leaching conditions were determined to be a temperature of 80 °C, a leaching time of 120 min, a hydrochloric acid dosage of 160% of the theoretical requirement, a solid–liquid ratio of 1:6, and a agitation speed of 500 r·min−1. Under these conditions, the leaching efficiency of rare earth elements reached as high as 92.69%. Kinetic analysis indicates that the leaching process follows the shrinking-core model, with the rate controlled by diffusion through the solid product layer. The apparent activation energy was calculated to be 37.2 kJ·mol−1, characteristic of a diffusion-controlled process. Furthermore, response surface analysis of variance confirms that leaching temperature and time are the most significant factors influencing rare earth leaching. This study elucidates, from multiple perspectives, the leaching mechanism of rare earth elements from enriched residues within a hydrochloric acid system, thereby providing important theoretical support for the efficient recovery and process optimization of rare earth resources from associated phosphate ores.
1. Introduction
Although global rare earth resources are abundant, economically exploitable deposits are limited, unevenly distributed, and highly concentrated [1]. According to the Mineral Commodity Summaries 2024 issued by the United States Geological Survey (USGS), global rare earth reserves (expressed as rare earth oxides, REO) are approximately 110 million tons, with China possessing the largest share, accounting for about 40% of the world’s total reserves [2]. Among the 17 rare earth elements, light rare earth elements (LREEs) include La, Ce, Pr, Nd, Pm, Sm, and Eu; medium rare earth elements (MREEs) comprise Gd, Tb, and Dy; and heavy rare earth elements (HREEs) include Ho, Er, Tm, Yb, Lu, Y, and Sc. Light rare earth elements are predominantly concentrated in primary deposits, whereas heavy rare earth elements are mainly found in ion-adsorption-type deposits. In addition, rare earth elements are widely associated with other mineral resources, with phosphate rock and bauxite serving as their principal host minerals. Although the rare earth content associated with bauxite can reach approximately 0.1%, nearly all rare earth elements are transferred into red mud during alumina production. Consequently, compared with the recovery of associated rare earths from phosphate rock, the extraction of rare earths from bauxite is associated with significantly higher costs and limited economic viability. Therefore, the recovery of rare earth elements from phosphate rock exhibits more pronounced technological and economic advantages and is expected to emerge as an important alternative source of rare earths in the future [3,4,5,6].
Rare earth deposits in China are widely distributed and, according to deposit type, can be classified into primary deposits, weathering crust deposits, ion-adsorption-type deposits, and placer deposits. These deposits host a complete spectrum of rare earth minerals and elements and exhibit a distinctive resource distribution pattern characterized as “heavy rare earths in the south and light rare earths in the north” [7,8,9,10]. The Zhijin rare-earth-bearing phosphate deposit in Guizhou, discovered in 1958, is located southeast of Zhijin County and was formed during the Meishucun Stage of the Early Cambrian. The ore mainly consists of dolomitic phosphorite and siliceous phosphorite [11]. It is a super-large sedimentary rare-earth-bearing phosphate deposit, with proven phosphate reserves of approximately 339 million tons [12,13] and associated rare earth reserves (expressed as RE2O3) reaching as high as 3.5018 million tons. It is particularly enriched in medium and heavy rare earth elements, with yttrium oxide (Y2O3) accounting for approximately 35.33%. The rare earth reserves of the Zhijin deposit rank second only to the Bayan Obo rare earth deposit in Inner Mongolia. It is currently the largest and most well-preserved rare-earth-bearing phosphate deposit discovered in China, with ores typically occurring as colloform aggregates [14,15,16,17]. Among the associated elements, fluorine, rare earth elements, strontium, and iodine are present in relatively high concentrations and abundant reserves. The RE2O3 content generally ranges from 0.05% to 0.13%, with heavy rare earth elements—dominated by yttrium—accounting for more than 35% [18,19]. The total resource reserve is estimated at approximately 5–10 million tons, indicating substantial development potential and significant comprehensive utilization value [20,21,22,23,24].
Chemical leaching remains the predominant route for rare earth extraction, typically employing sulfuric, hydrochloric, or nitric acid as leaching agents. For mineral-type rare earth ores, processes such as low-temperature roasting with concentrated sulfuric acid and sodium carbonate roasting followed by sulfuric acid leaching are commonly adopted, whereas ion-adsorption (weathered crust) rare earth deposits are generally treated by ammonium salt leaching [25,26]. The leaching of phosphate ores and their associated rare earth elements is principally carried out via sulfuric acid, nitric acid, or hydrochloric acid routes. The sulfuric acid process is currently the dominant method for wet-process phosphoric acid production; however, for every tonne of crude phosphoric acid produced, approximately 4–5 tonnes of phosphogypsum are generated, with about 70% of the rare earth elements partitioning into the phosphogypsum, resulting in substantial rare earth losses [27,28,29]. Moreover, secondary recovery of rare earths from phosphogypsum entails large processing volumes and high production costs, while the recovery efficiency remains below 90% [30,31,32]. Although the nitric acid process yields leaching efficiencies of phosphorus and rare earth elements comparable to those of the hydrochloric acid route, the high cost of nitric acid and the need for freeze crystallization to recover the by-product Ca(NO3)2 render the process relatively complex and limit its widespread industrial application. In contrast, during the conventional hydrochloric acid decomposition of rare-earth-bearing phosphate ores, the majority of rare earth elements can be effectively dissolved into the leachate [33,34], resulting in high leaching efficiencies for both phosphorus and rare earth elements, while imposing relatively low requirements on the grade of phosphate concentrate. Moreover, compared with the sulfuric acid process, the hydrochloric acid route produces a smaller volume of leaching residue, thereby alleviating environmental burdens. Its by-product, CaCl2, has a wide range of applications, including use as a desiccant, deicing agent, stabilizer for industrial solid waste, and animal feed additive. Furthermore, unlike the nitric acid process, the crystallization of CaCl2 does not require freeze crystallization, leading to lower energy consumption in industrial applications. Consequently, the hydrochloric acid decomposition of rare-earth-bearing phosphate ores holds considerable research significance.
Distinct from conventional studies that extract rare earth elements during the traditional wet-process phosphoric acid production or recover them from phosphogypsum, this study focuses on a rare-earth-bearing-associated phosphate ore from Zhijin, Guizhou Province, where selective phosphorus leaching with hydrochloric acid was employed, and the resulting rare-earth-enriched residue after phosphorus removal was taken as the primary research subject. Firstly, the occurrence state of rare earth elements and the mineralogical changes within the enriched residue were elucidated using STEM and other analytical techniques. Secondly, hydrochloric acid was employed for secondary leaching of rare earths from the residue. Through single-factor experiments, the key process parameters for hydrochloric acid leaching were optimized to determine the optimal leaching conditions. Finally, kinetic analysis and response surface methodology were applied to identify the controlling model of hydrochloric acid decomposition of the rare-earth-enriched residue and to examine the interactions among the influencing factors.
2. Experimental Section
2.1. Sample and Reagents
The experimental raw material for this study was obtained from a phosphate deposit in Zhijin County, Guizhou Province. Following magnesia removal flotation, an associated rare earth phosphate concentrate was produced. Phosphorus was then selectively leached at ambient temperature (30 °C) using hydrochloric acid, yielding a rare-earth-enriched residue with an RE2O3 grade of 0.756%, an enrichment factor of 4.7, and a rare earth loss rate of 1.517%. The P2O5 grade decreased from 31.61% to 16.27%.
Hydrochloric acid (Chengdu Kelong Chemical Co., Ltd., Chengdu, China), of analytical grade purity (36%), was used as the leaching agent for rare earth elements in the enriched residue. Polyacrylamide (Shanghai Macklin Biochemical Co., Ltd., Shanghai, China), also of analytical grade purity (90%), was employed as the flocculant for the leaching residue.
2.2. Experimental Method
2.2.1. Leaching Experiments on Rare-Earth-Enriched Residue
The leaching experiments on the rare-earth-enriched residue primarily included tests on leaching temperature, leaching time, acid dosage, solid–liquid ratio (S/L), and stirring speed. The experimental procedure was as follows: (1) Mix deionized water with a specified amount of hydrochloric acid in a 2 L beaker. (2) Gradually add 300 g of the associated rare earth phosphate concentrate to the beaker. (3) Under the conditions of a hydrochloric acid dosage at 70% of the theoretical requirement, a leaching time of 30 min, a temperature of 30 °C, a S/L of 1:5(CHCl = 3.76 mol/L), and an agitation speed of 400 r·min−1, phosphorus was preferentially leached, yielding a rare-earth-enriched residue with a recovery of 22.47%. (4) Add a 0.1% polyacrylamide ((CH2CHCONH2)n) solution as a flocculant and allow settling for 3 min. (5) Decant the supernatant. (6) Add a specified amount of hydrochloric acid to the beaker. (7) At the end of the reaction time, add another portion of 0.1% polyacrylamide solution. (8) Perform solid–liquid separation using a Büchner funnel, and wash the leaching residue five times with deionized water. (9) The contents of phosphorus (P) and impurity elements—including aluminum (Al), iron (Fe), calcium (Ca), and magnesium (Mg)—in the leaching residue (yield: 20.5%) were determined using ICP-OES, while the concentrations of rare earth elements were analyzed by ICP-MS, and the corresponding leaching efficiencies were subsequently calculated.
2.2.2. Process Mineralogical Analysis of Rare-Earth-Enriched Residue and Leaching Residue
(1) Analysis of Microtextural Relationships and Elemental Distribution in Rare Earth-Enriched Residues
The textural relationships and elemental distributions of the rare earth–enriched residue and the rare earth leaching residue were investigated using scanning electron microscopy coupled with energy-dispersive spectroscopy (SEM–EDS). The SEM–EDS analyses were conducted at an accelerating voltage of 20 kV with a sputtering current of 40 mA, and the sample surfaces were coated with platinum.
(2) Phase composition analysis of the leaching residue
A Panalytical X-ray powder diffractometer (XRD) (Malvern Panalytical, Malvern, UK) was employed to analyze the major phase constituents of the rare earth leaching residues. The instrument was operated using a Cu target with a wavelength of 1.54056 Å, a scanning speed of 5 °/min, and a scanning range of 5–90°. The X-ray diffraction patterns were analyzed using the HighScore Plus v3.0e software. The chemical elemental composition of the leaching residue was analyzed using an X-ray fluorescence spectrometer (XRF) manufactured by Shimadzu (Kyoto, Japan).
(3) Occurrence states and concentration analysis of rare earth elements
A Thermo Fisher Scientific Spectra 300 double aberration-corrected scanning transmission electron microscope (STEM) (Thermo Fisher Scientific, Waltham, MA, USA) was used to investigate the crystal structure of the rare-earth-enriched residue, as well as the distribution and occurrence states of rare earth elements. The instrument was operated at an accelerating voltage of 300 kV, with imaging performed in STEM-iDPC mode.
(4) Analysis of major and trace elements
Major elements in the rare-earth-enriched residue and the rare earth leaching residue were determined using a PerkinElmer Avio 500 inductively coupled plasma optical emission spectrometer (ICP-OES) (PerkinElmer, Shelton, CT, USA), while the rare earth fractions were analyzed using a PerkinElmer NexION 300X inductively coupled plasma mass spectrometer (ICP-MS) (PerkinElmer, Shelton, USA).
2.2.3. Software for Response Surface Analysis of Rare Earth Leaching
Response surface analysis of rare earth leaching was conducted using Design-Expert 13 software developed by Stat-Ease, Inc. (Minneapolis, MN, USA).
3. Results and Discussion
3.1. Textural Characteristics of the Rare-Earth-Enriched Residue and Occurrence States of Rare Earth Elements
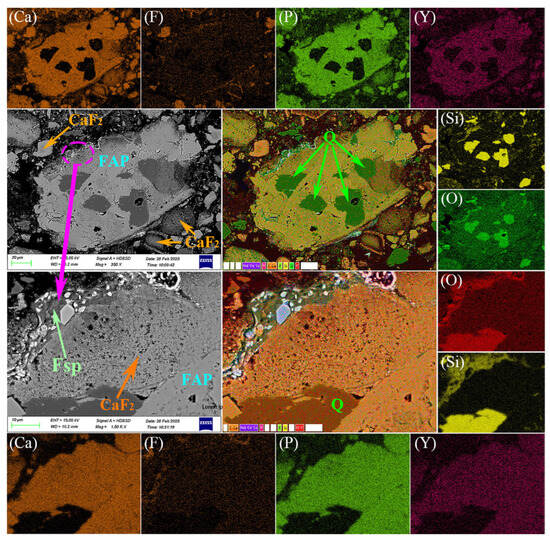
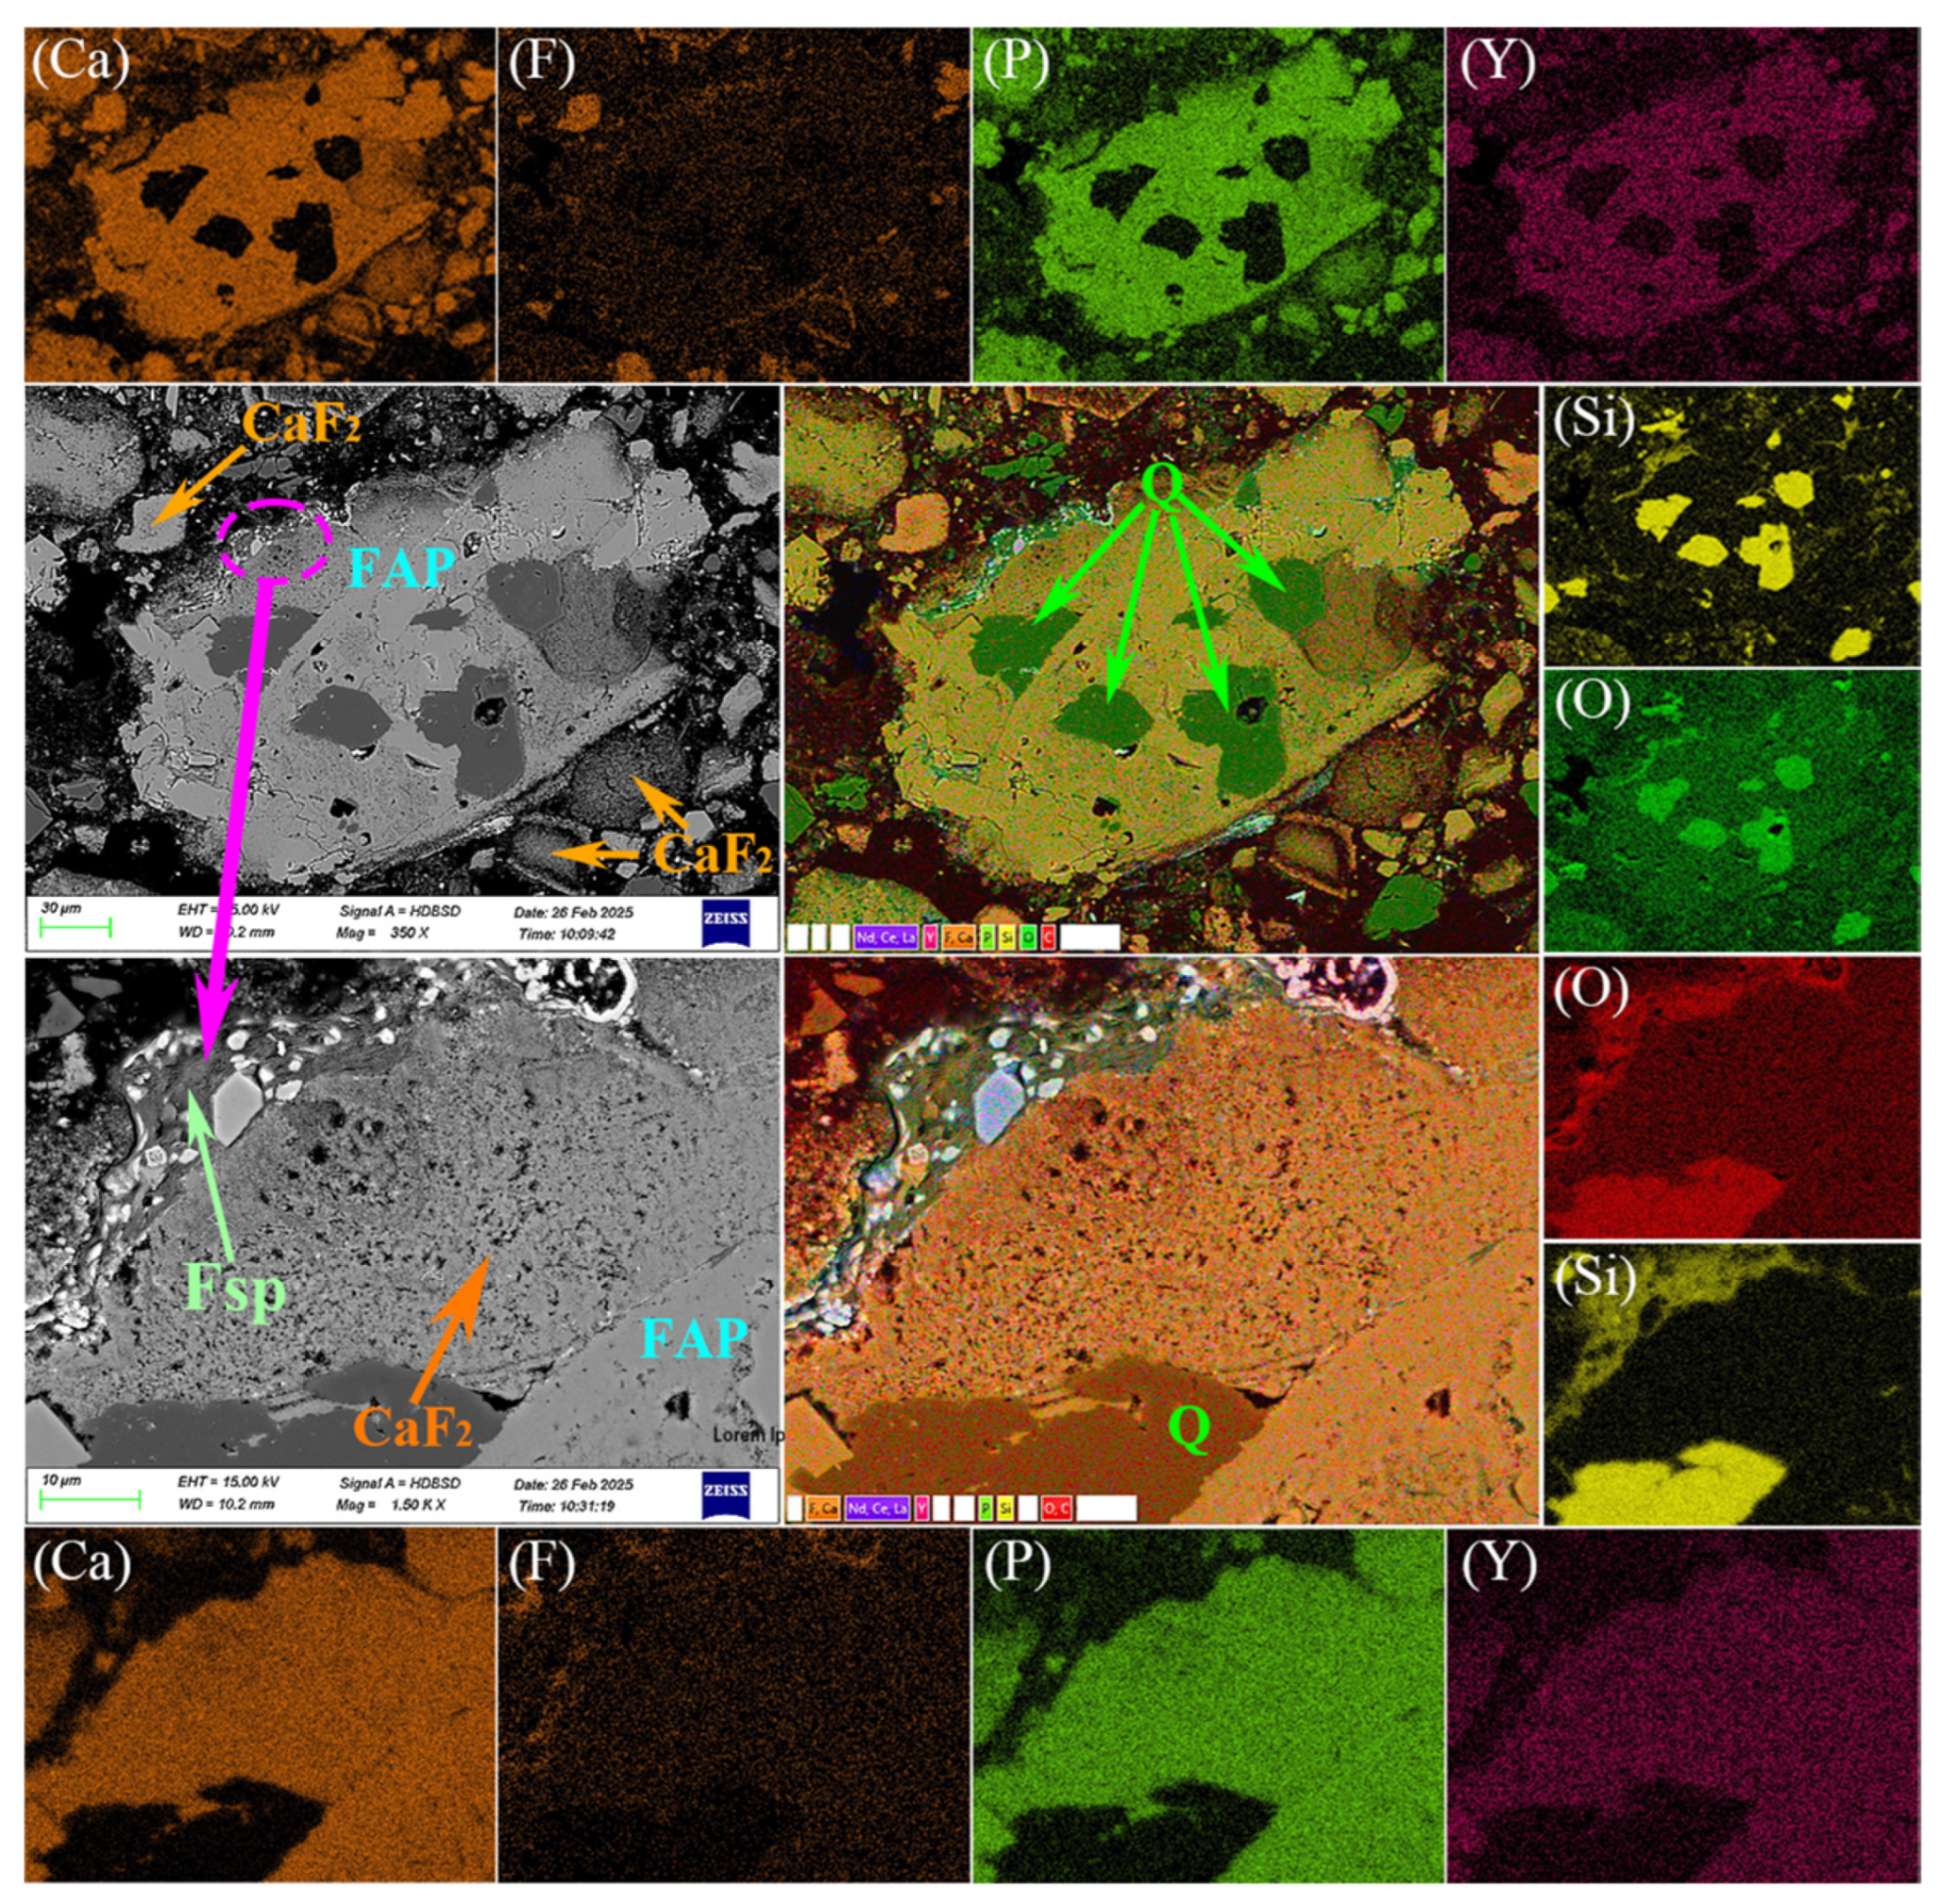
SEM–EDS was employed to analyze the textural relationships of residual minerals and the elemental distributions within the rare-earth-enriched residue, and the results are shown in Figure 1.
Figure 1.
SEM-EDS images of the rare earth–enriched residue. Abbreviations: Q—Quartz; FAP—fluorapatite; Fsp—Feldspar.
As shown in Figure 1, a small amount of residual phosphorus in the rare-earth-enriched residue remains within fluorapatite. Following the preferential leaching of phosphorus, the residual Ca and F precipitate in the form of CaF2. Owing to the short leaching duration (30 min) and low reaction temperature (30 °C), the reaction did not propagate into the interiors of large fluorapatite particles. Consequently, a “honeycomb-like” CaF2 layer preferentially formed around coarser fluorapatite grains, and minor amounts of quartz were observed to crystallize within the fluorapatite. Elemental distribution analysis further reveals a high degree of spatial overlap among Ca, F, P, and Y, providing preliminary evidence that rare earth elements are hosted within both fluorapatite and CaF2.
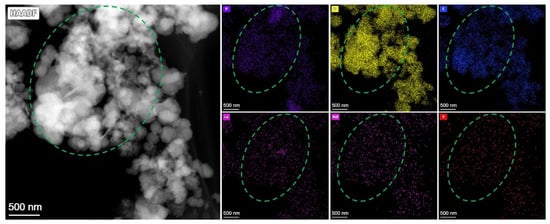
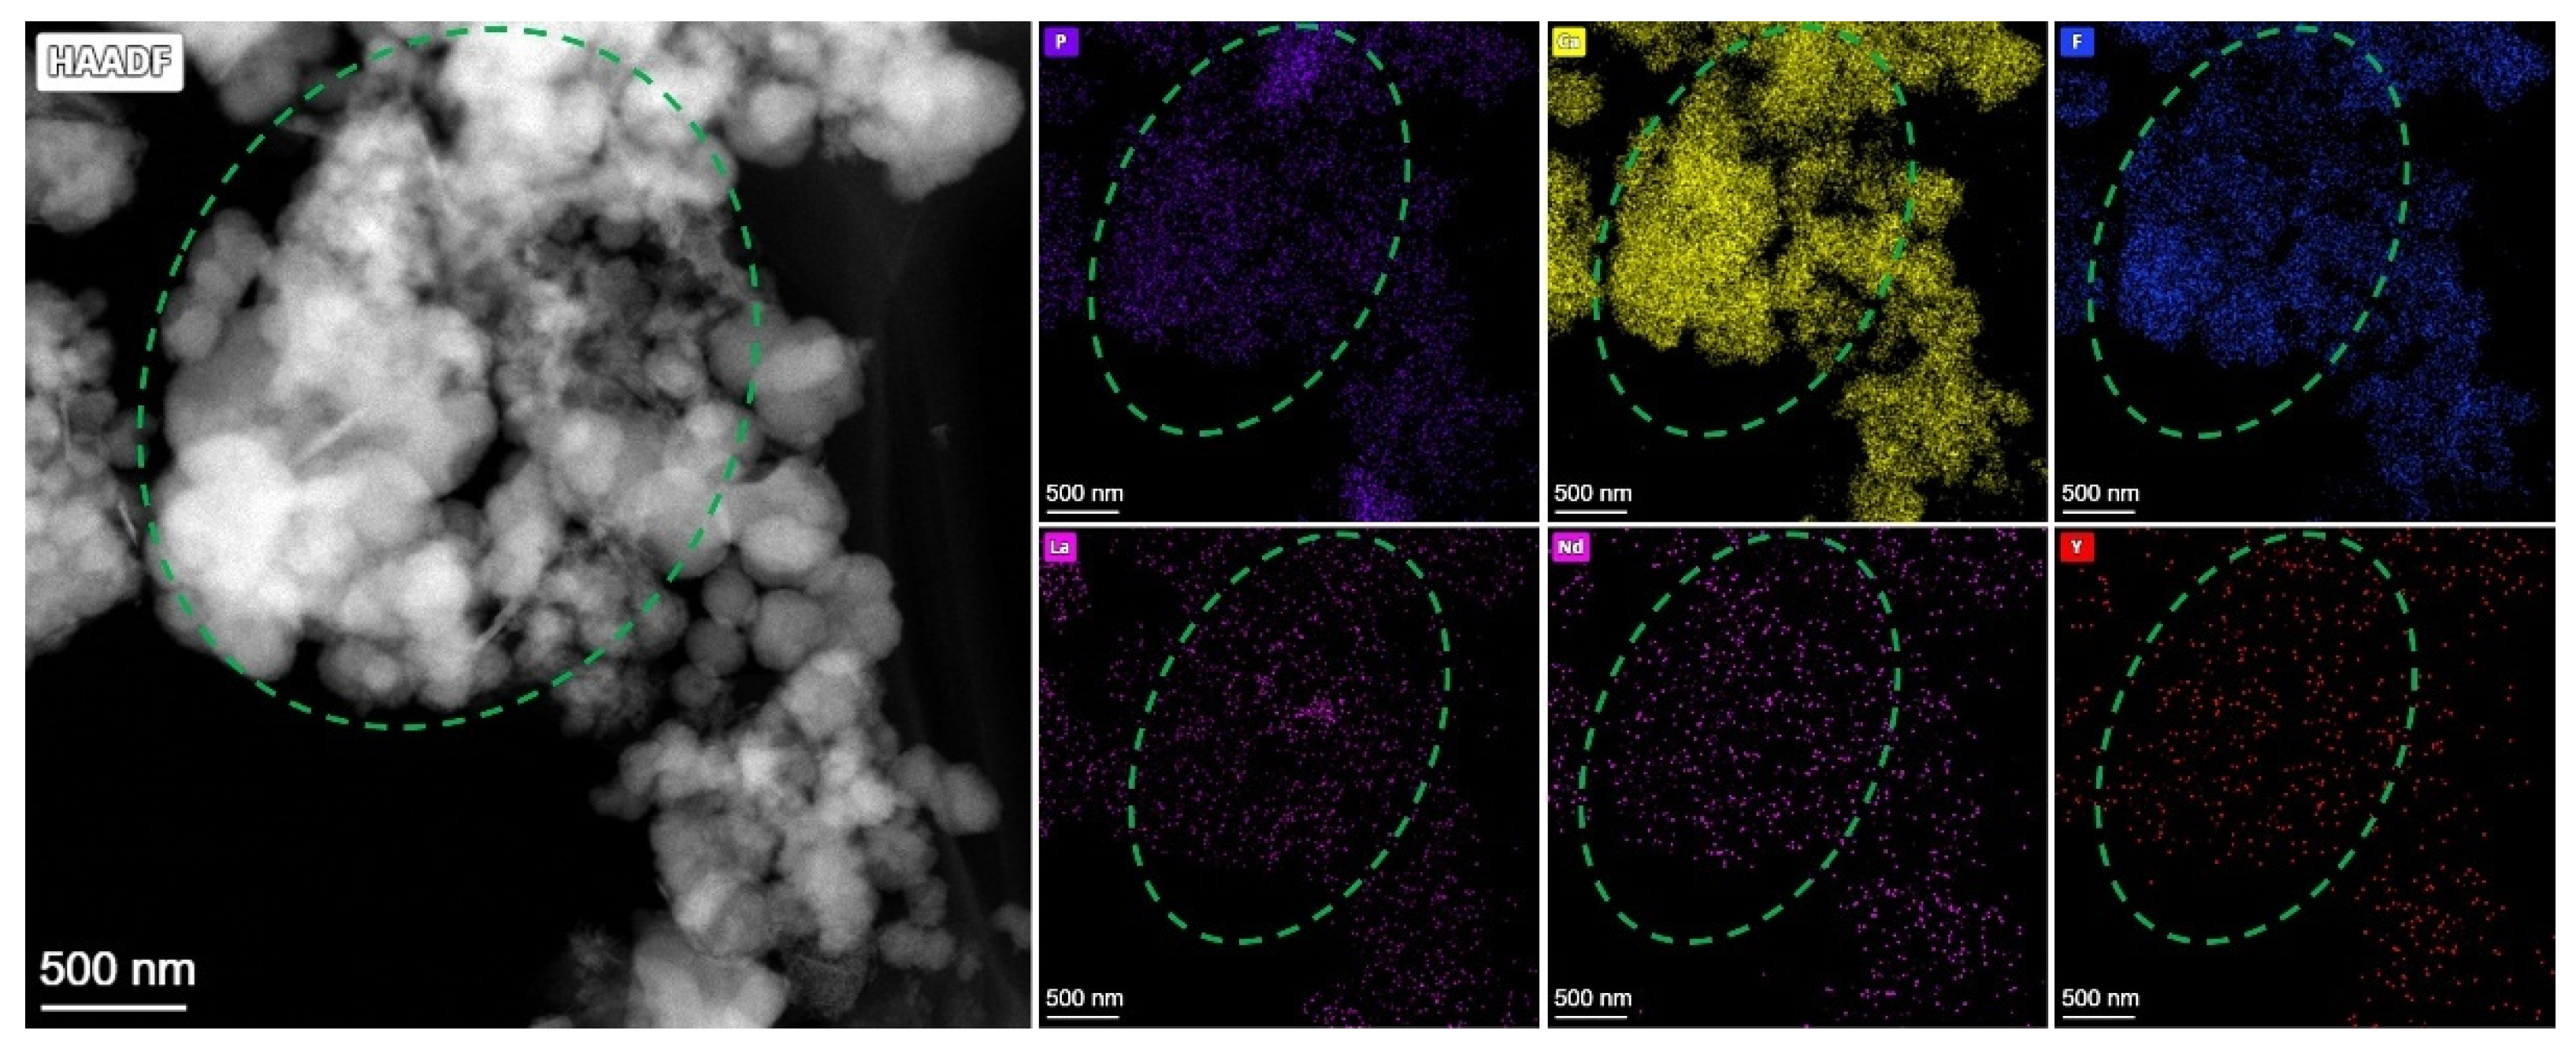
To further elucidate the occurrence states of rare earth elements in the enriched residue, scanning transmission electron microscopy (STEM) was employed. The morphological characteristics, along with transmission electron microscopy and energy-dispersive spectroscopy (TEM–EDS) analysis results, are presented in Figure 2.
Figure 2.
STEM-EDS images of the rare earth–enriched residue.
As revealed by the elemental mapping in Figure 2, the distributions of the rare earth elements La, Nd, and Y closely coincide with those of P, Ca, and F, consistent with the SEM–EDS results. This further confirms that rare earth elements are hosted within residual fluorapatite and CaF2.
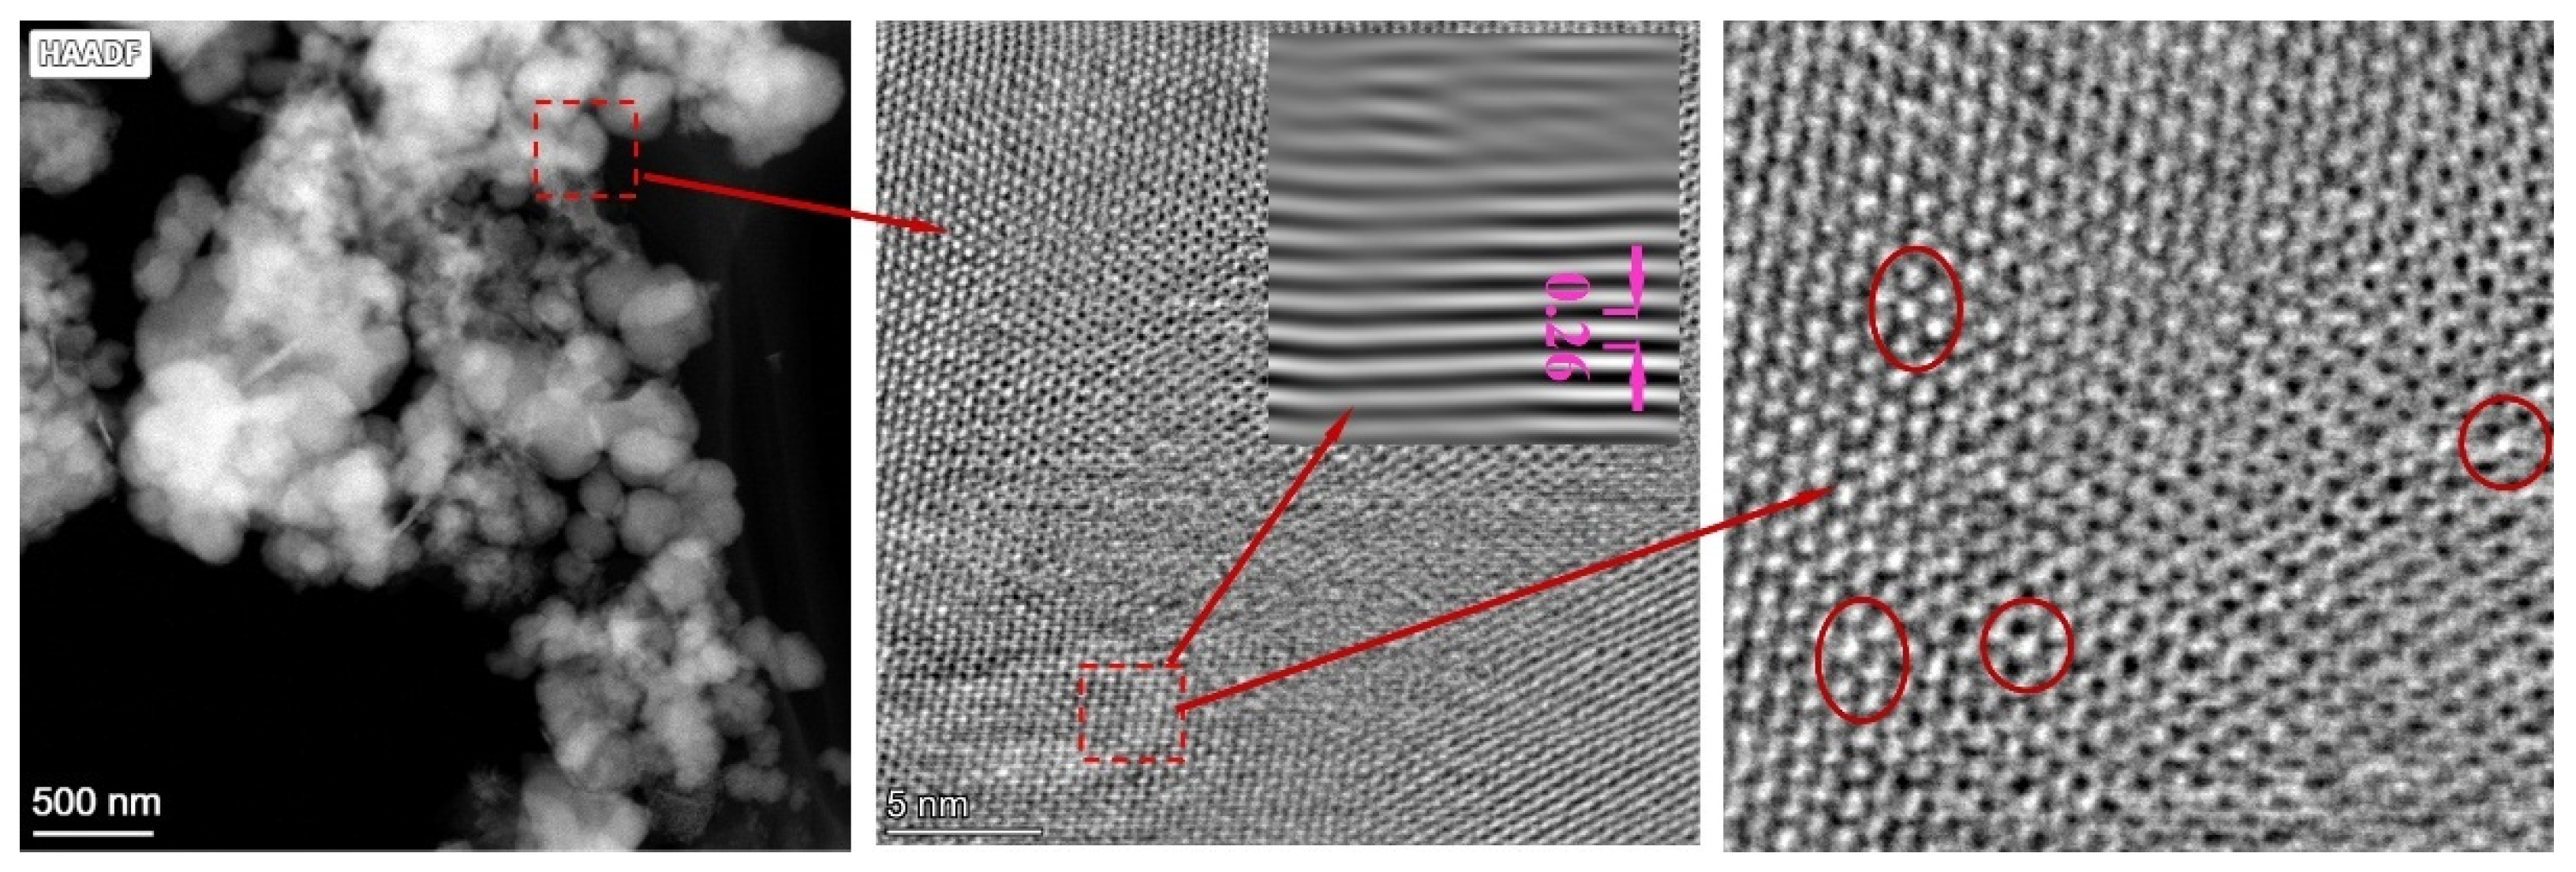
High-resolution transmission electron microscopy (HRTEM) analysis reveals that the enriched residue exhibits well-defined lattice fringes and an ordered atomic arrangement (Figure 3). The measured interplanar spacing is approximately 0.26 nm, which is close to that of the (200) plane of CaF2, yet slightly smaller than the theoretical value of 0.27 nm for standard CaF2. This contraction suggests that the incorporation of rare earth elements into the CaF2 lattice induces local structural distortions [35]. On the one hand, differences in ionic valence and radius between RE3+ and Ca2+ lead to lattice distortion; on the other hand, to maintain charge neutrality, additional F− ions may be introduced into interstitial sites or local defect structures may form. Such structural adjustments are typically manifested as subtle changes in lattice parameters or interplanar spacings, while the overall CaF2-type cubic structure remains preserved [36,37,38,39]. Moreover, because rare earth elements possess higher atomic numbers than Ca and F, they appear with the highest brightness under STEM-iDPC imaging. Accordingly, the brightest features in the image correspond to rare earth elements substituting into the CaF2 lattice, confirming that the rare-earth-enriched residue occurs predominantly as a CaF2-type crystal structure incorporating rare earth elements.
Figure 3.
HRTEM images of the rare earth–enriched residue.
The phosphorus content (expressed as P2O5) and the concentrations of impurity elements in the rare-earth-enriched residue are presented in Table 1, while the total rare earth content and their distribution patterns are shown in Table 2.
Table 1.
Multi-Element Analysis Results of the Rare-Earth-Enriched Residue.
Table 2.
Rare Earth Element Content and Distribution in the Rare-Earth-Enriched Residue.
As shown in Table 1, a small amount of phosphorus remains in the rare-earth-enriched residue, with a content of 16.267%. The impurity elements CaO, F, SiO2, Fe2O3, and Al2O3 are present in relatively high concentrations, at 40.53%, 20.56%, 13.32%, 3.75%, and 3.48%, respectively.
As shown in Table 2, the total rare earth content in the rare-earth-enriched residue (expressed as RE2O3) is 0.756%, of which heavy rare earth elements account for as much as 38.7%.
3.2. Acid Leaching Process of the Rare-Earth-Enriched Residue
Based on the SEM–EDS and multi-element analysis results, the major phases in the rare-earth-enriched residue are fluorapatite, quartz, feldspar, and CaF2. First, the formation of the CaF2 phase results from the preferential leaching of phosphorus from fluorapatite, which also contains substantial amounts of calcium and fluorine. Since the exact CaF2 content cannot be accurately determined by chemical analysis, for convenience in calculating the hydrochloric acid dosage, all Ca and F are considered as part of the fluorapatite, as represented by reaction Equation (1). Second, rare earth elements occur in an isomorphic substitution mode within the residual fluorapatite and CaF2 and do not exist as independent minerals. However, to facilitate the calculation of the theoretical hydrochloric acid requirement for rare earth leaching, REEs are treated in the form of oxides (RE2O3), as shown in reaction Equation (5) [40]. Using Equations (1)–(5), the theoretical hydrochloric acid dosage required for 100 g of rare-earth-enriched residue is calculated to be 63.69 g.
Ca5(PO4)3F + 10HCl = 3H3PO4 + 5CaCl2 + HF
6HF + SiO2 = H2SiF6 + 2H2O
Fe2O3 + 6HCl = 2FeCl3 + 3H2O
Al2O3 + 6HCl = 2AlCl3 + 3H2O
RE2O3 + 6HCl = 2RECl3 + 3H2O
3.2.1. Effect of Leaching Temperature on Leaching Efficiency
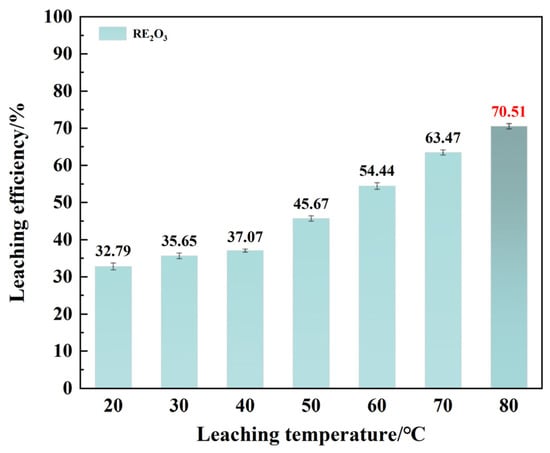
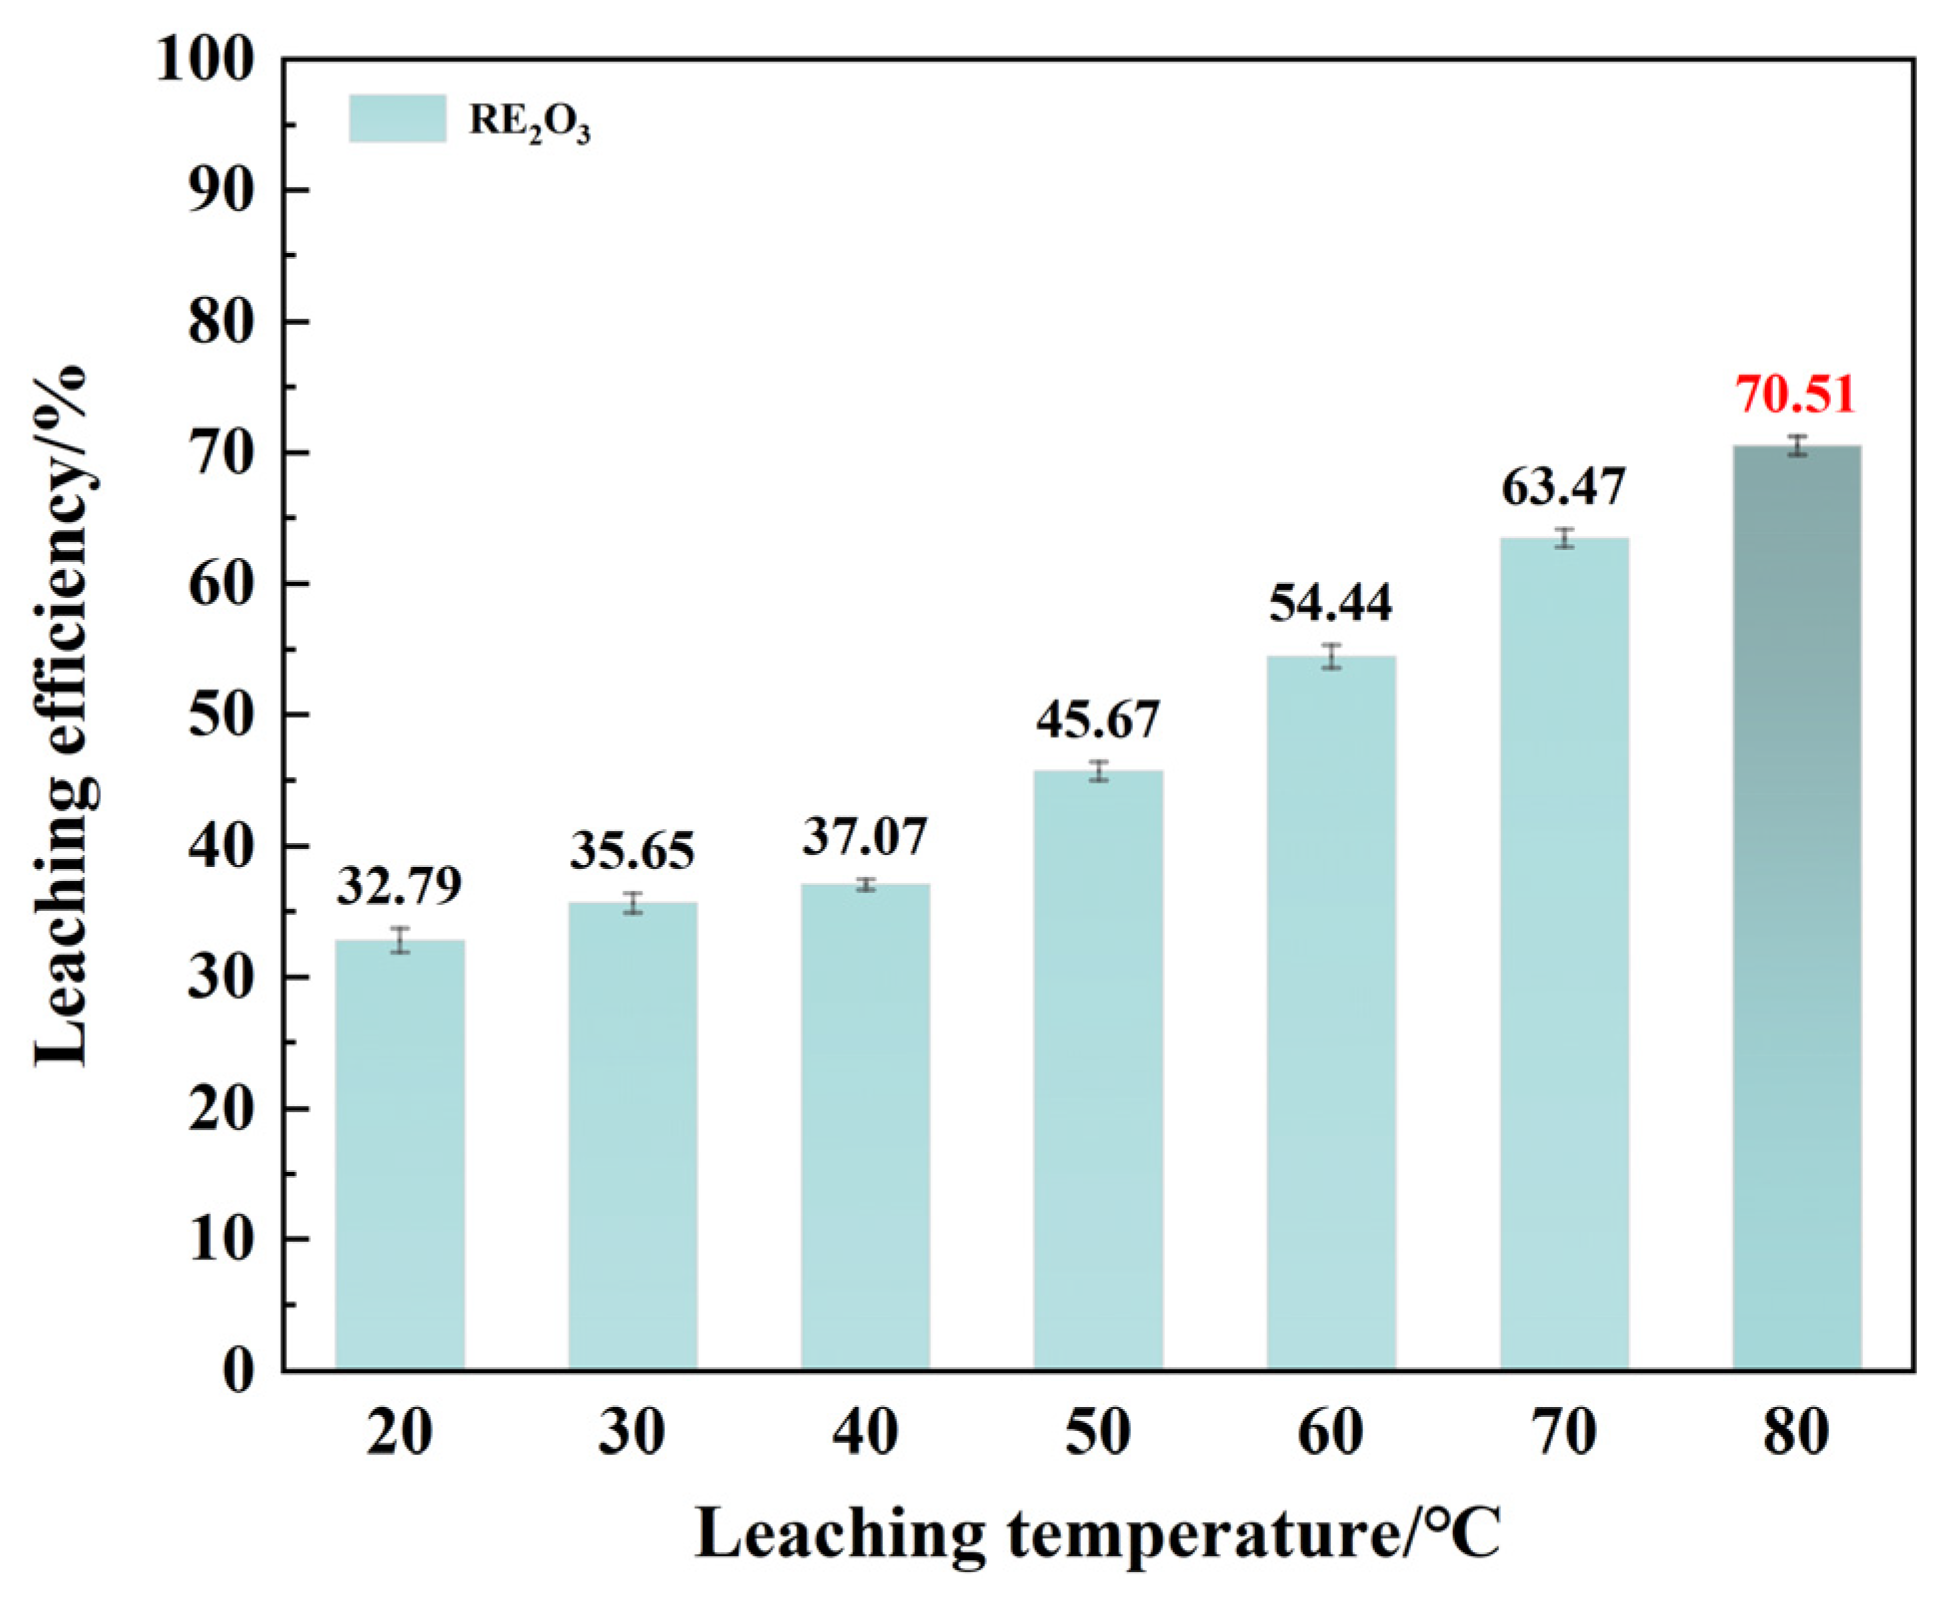
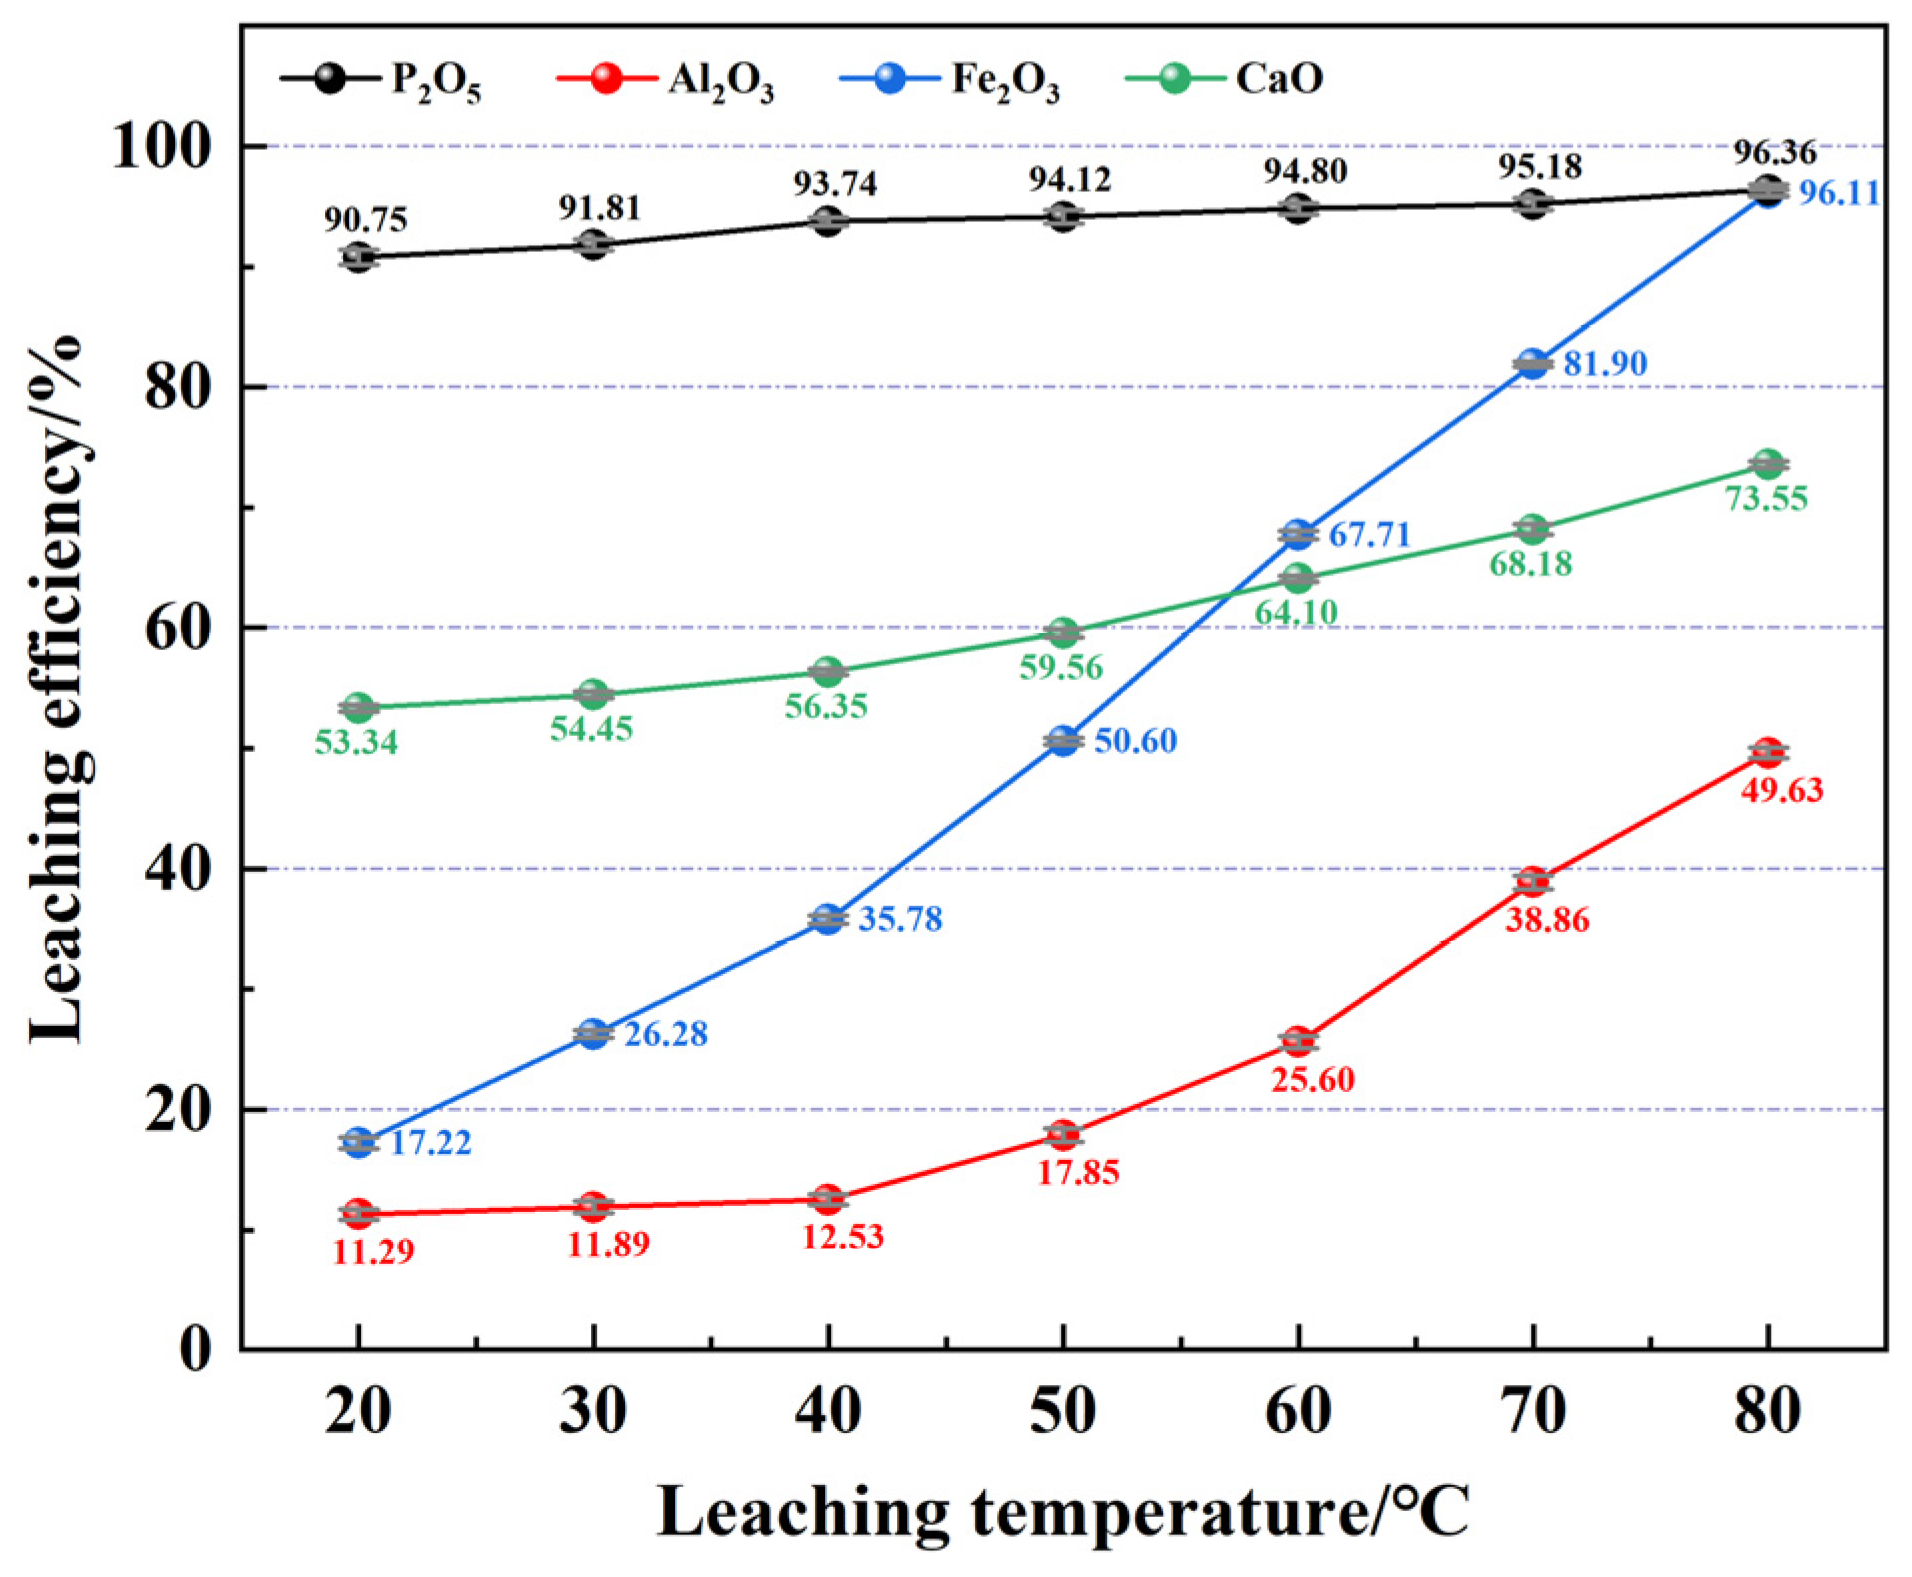
Under conditions of a 60 min leaching time, hydrochloric acid dosage at 105% of the theoretical requirement, agitation speed of 300 r·min−1, and solid–liquid ratio of 1:4, the effect of leaching temperature on rare earth leaching efficiency was investigated. A 0.1% polyacrylamide solution was used as the flocculant for the leaching residue, with an addition of 1–2%. The results are shown in Figure 4 and Figure 5.
Figure 4.
Effect of leaching temperature on the rare earth leaching efficiency.
Figure 5.
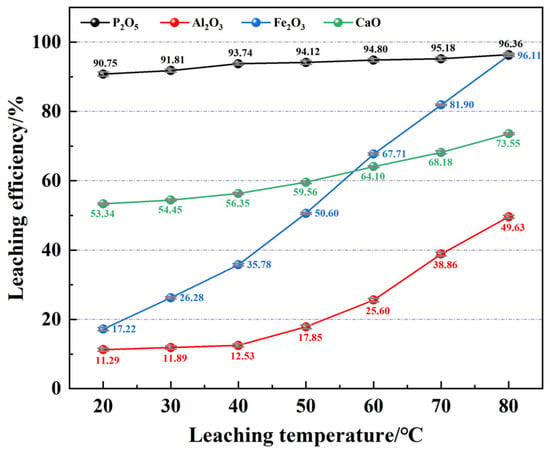
Effect of leaching temperature on the leaching efficiency of impurity elements.
As shown in Figure 4, the rare earth leaching efficiency exhibits a clear positive correlation with leaching temperature. With increasing temperature, the leaching efficiency rises from 32.79% to 70.51%, an improvement of 37.72 percentage points. In Figure 5, the leaching efficiencies of impurity elements Ca, Al, and Fe also increase with temperature, with Fe showing the most pronounced rise, from 17.22% to 96.11%, an increase of 78.89 percentage points. The Al leaching efficiency increases significantly when the temperature exceeds 40 °C, rising from 12.53% to 49.63%, an increase of 37.10 percentage points. The leaching efficiency of residual phosphorus remains relatively stable above 90% across the temperature range. Considering the overall rare earth recovery, the optimal leaching temperature was determined to be 80 °C.
3.2.2. Effect of Leaching Time on Leaching Efficiency
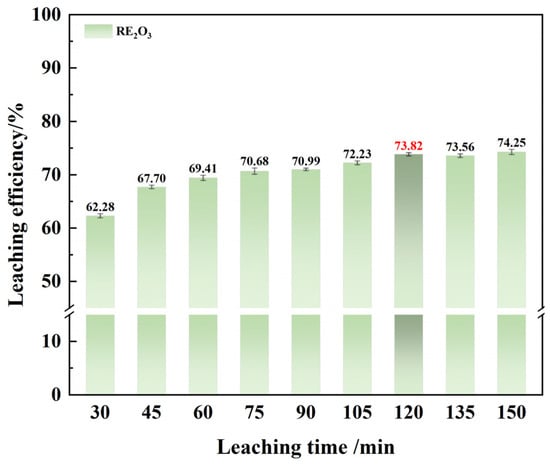
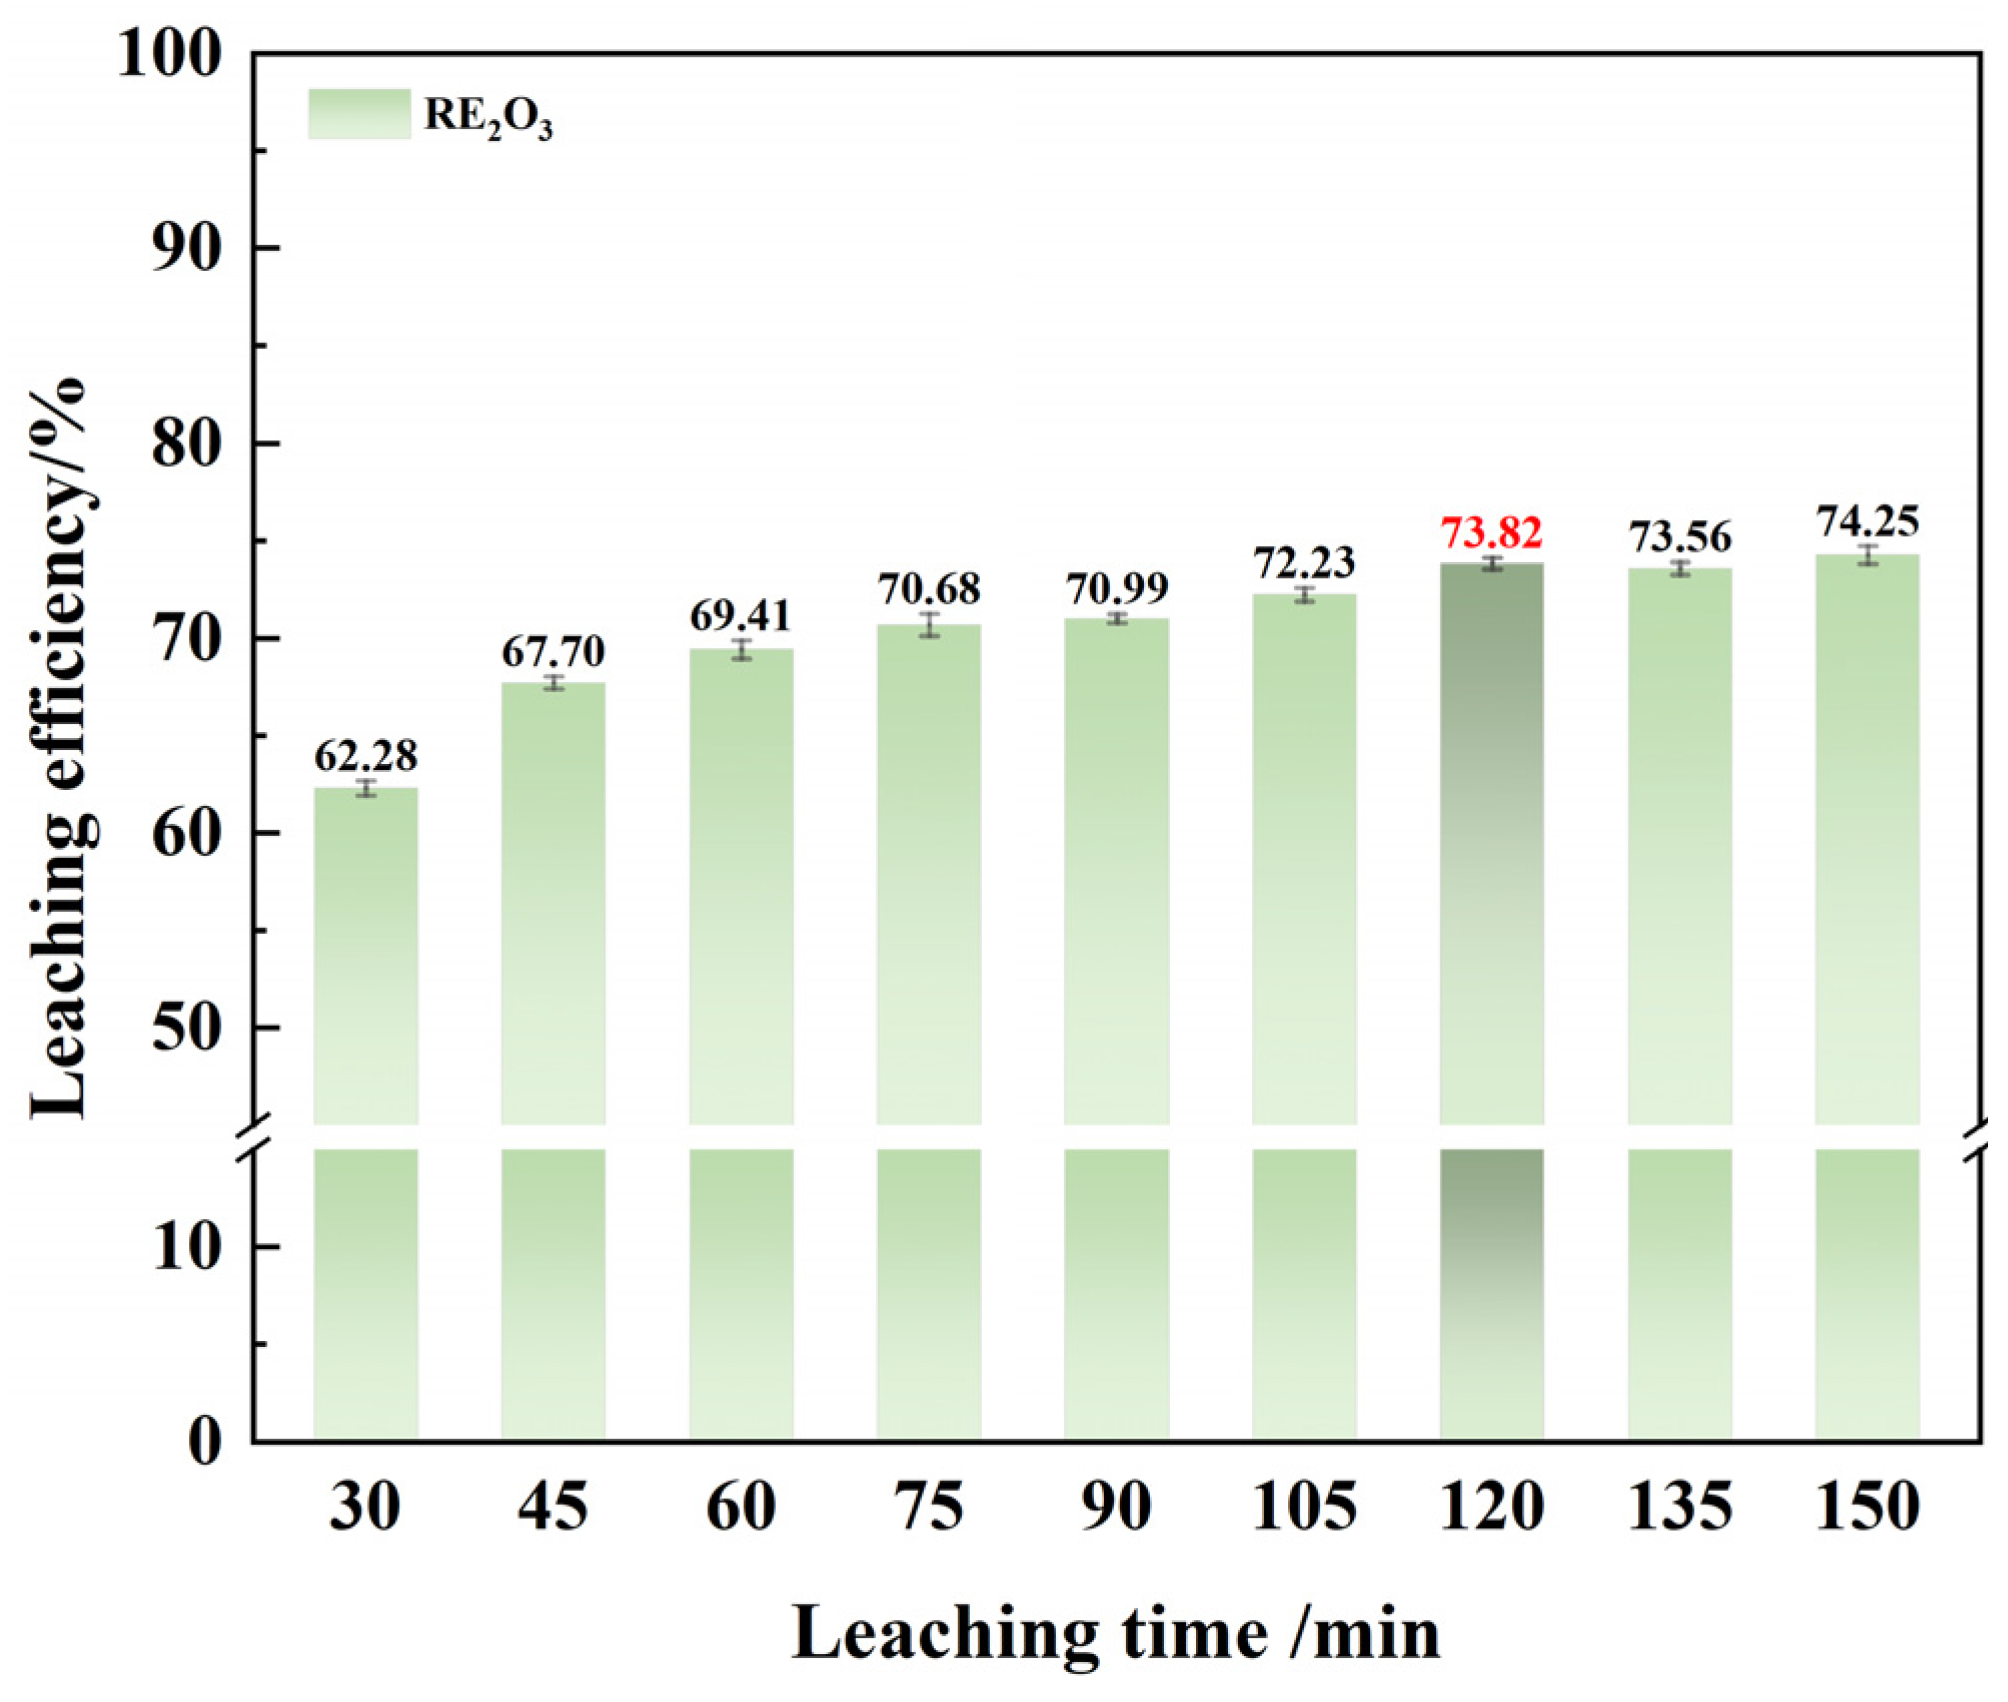
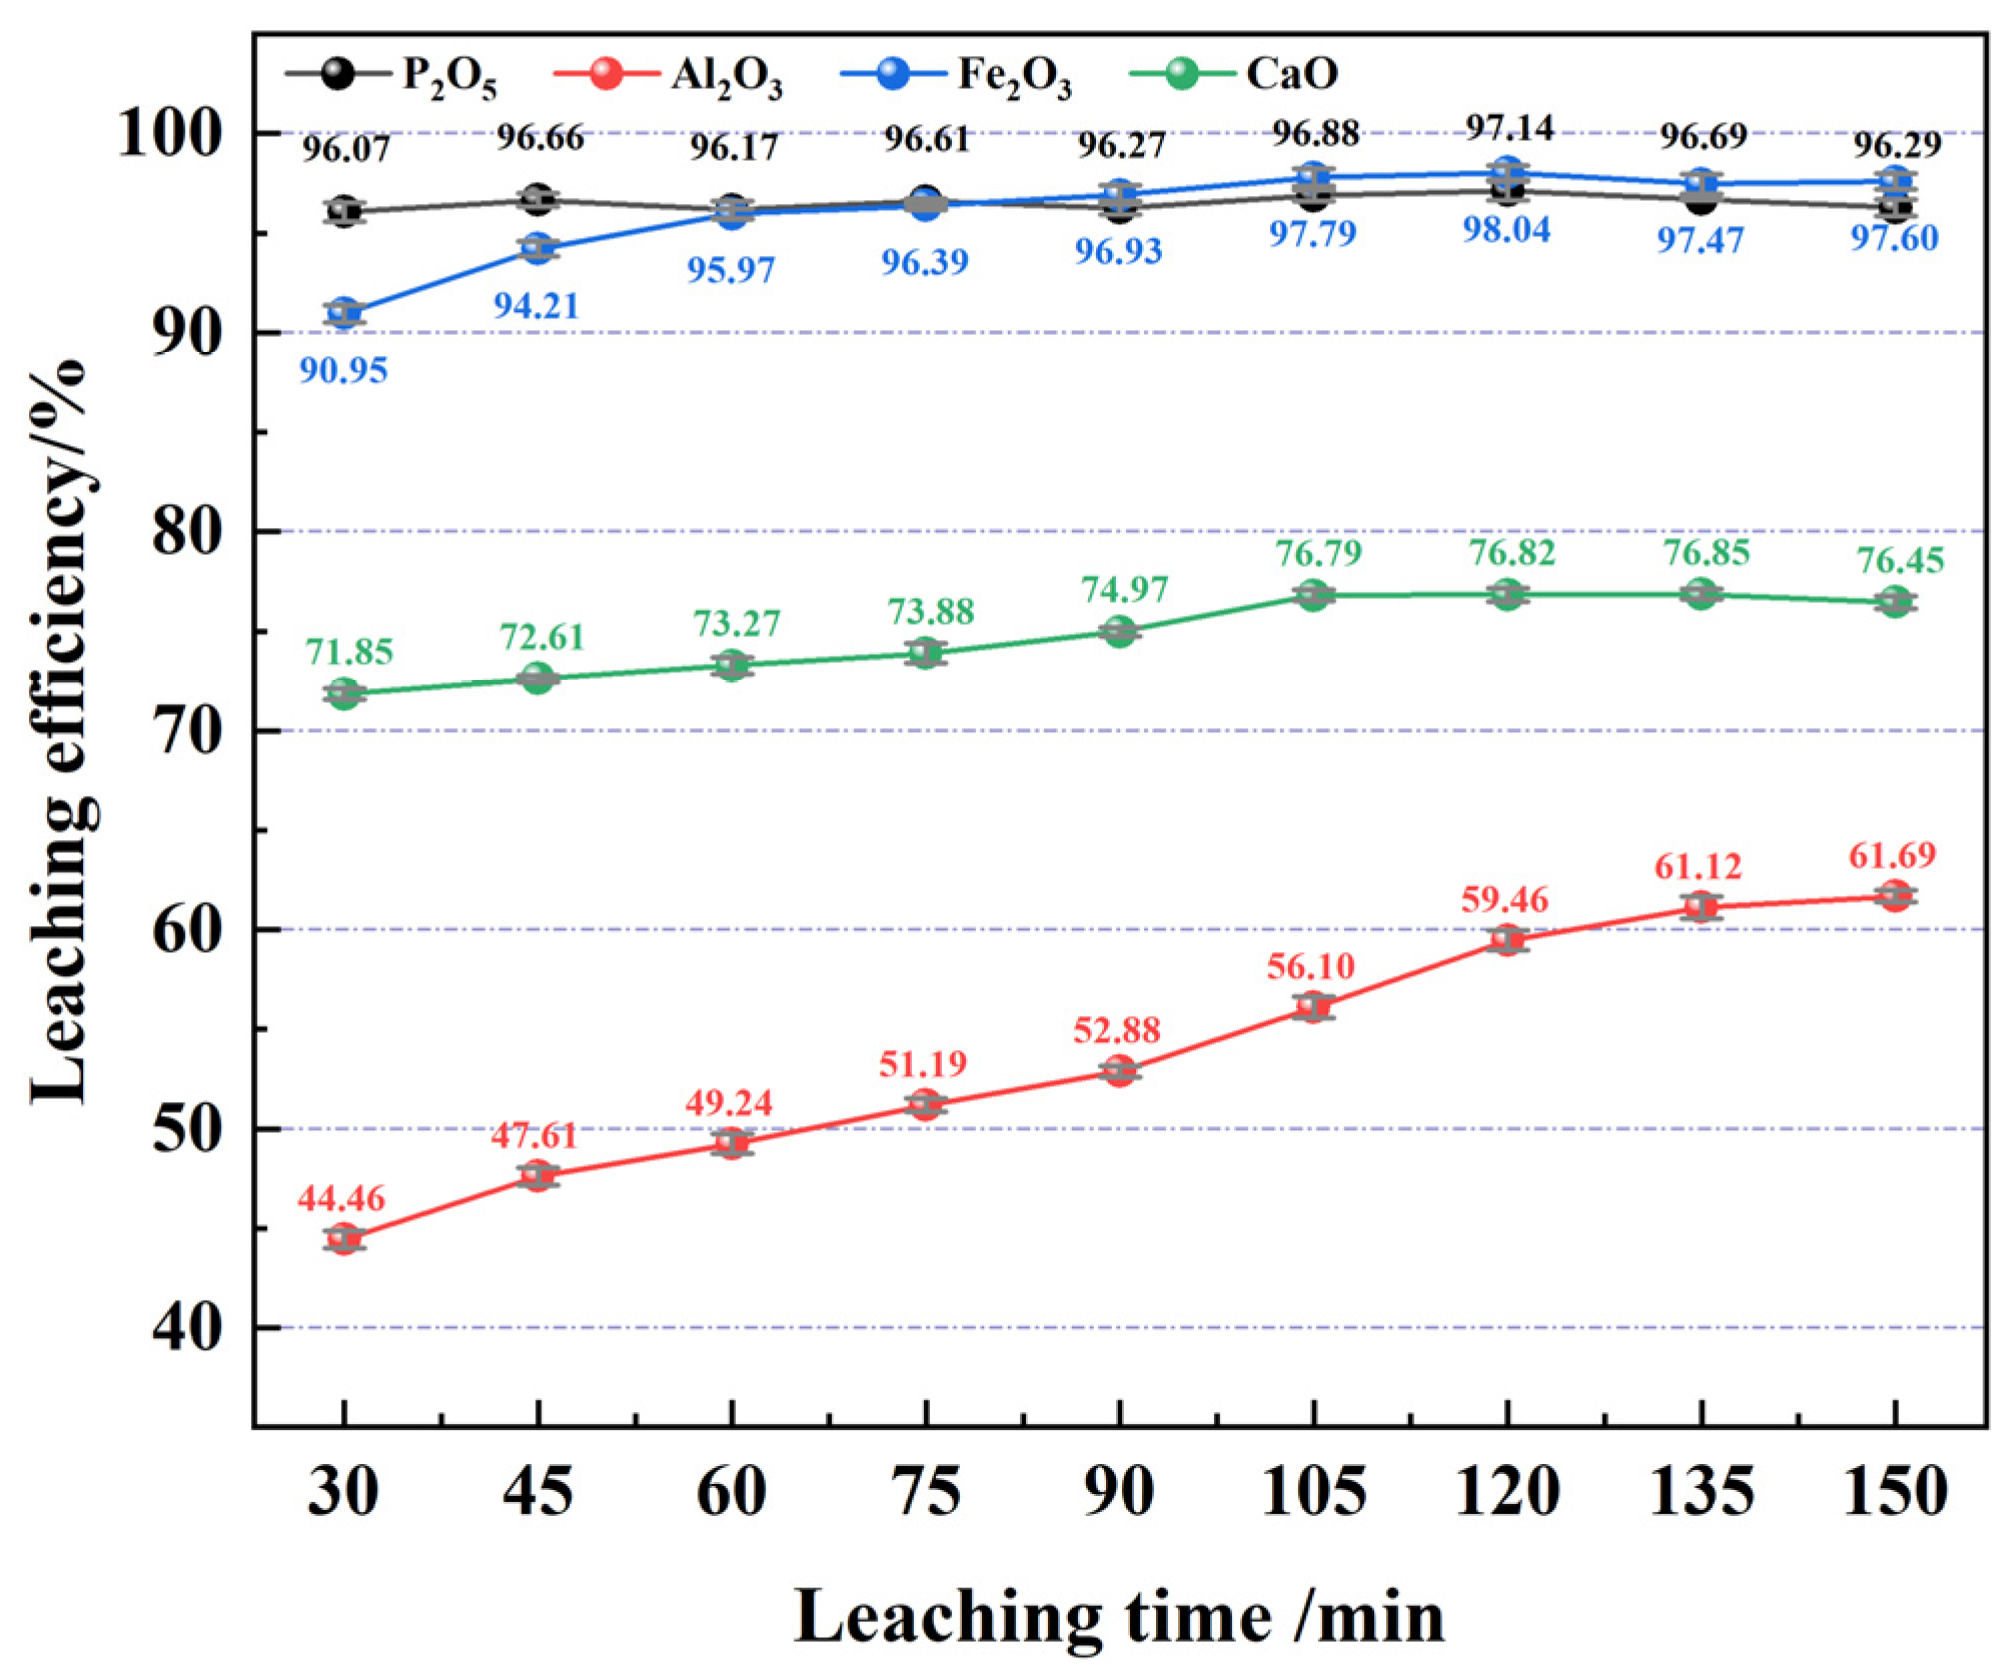
Under the optimal leaching temperature of 80 °C, with all other leaching conditions kept constant, the effect of leaching time on rare earth leaching efficiency was investigated. The results are shown in Figure 6 and Figure 7.
Figure 6.
Effect of leaching time on the rare earth leaching efficiency.
Figure 7.
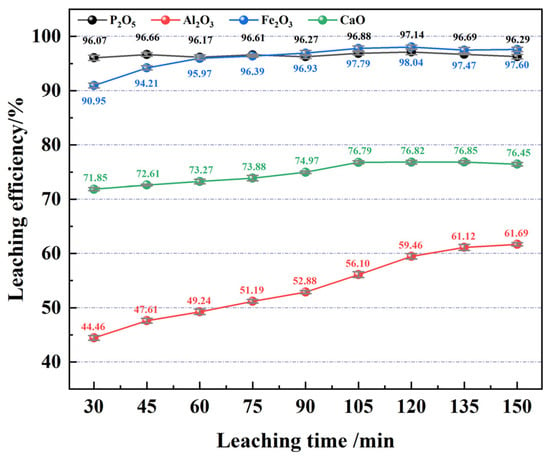
Effect of leaching time on the leaching efficiency of impurity elements.
As shown in Figure 6, with increasing leaching time, the rare earth leaching efficiency rises markedly from 62.28% at 30 min to 73.82% at 120 min, an increase of 11.54 percentage points. Beyond 120 min, the efficiency shows little further improvement. In Figure 7, the leaching efficiencies of impurity elements also increase with time, with Al exhibiting the most significant rise, from 44.46% at 30 min to 61.69% at 150 min, an increase of 17.23 percentage points, while the increases for Ca and Fe are relatively minor. Therefore, the optimal leaching time was determined to be 120 min.
3.2.3. Effect of Acid Dosage on Leaching Efficiency
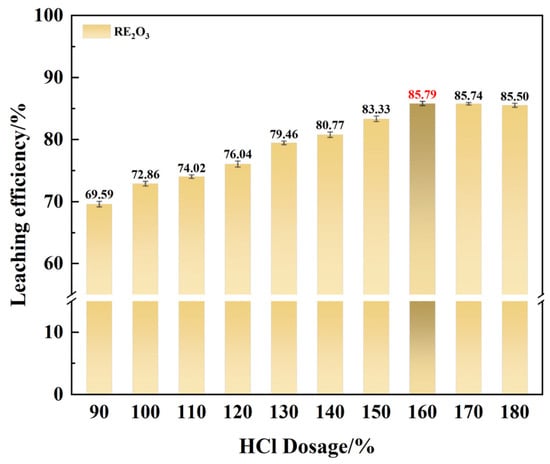
Under the optimal leaching conditions of 80 °C and 120 min, with all other parameters unchanged, the effect of hydrochloric acid dosage on rare earth leaching efficiency was investigated. The results are presented in Figure 8 and Figure 9.
Figure 8.
Effect of hydrochloric acid dosage on the rare earth leaching efficiency.
Figure 9.
Effect of hydrochloric acid dosage on the leaching efficiency of impurity elements.
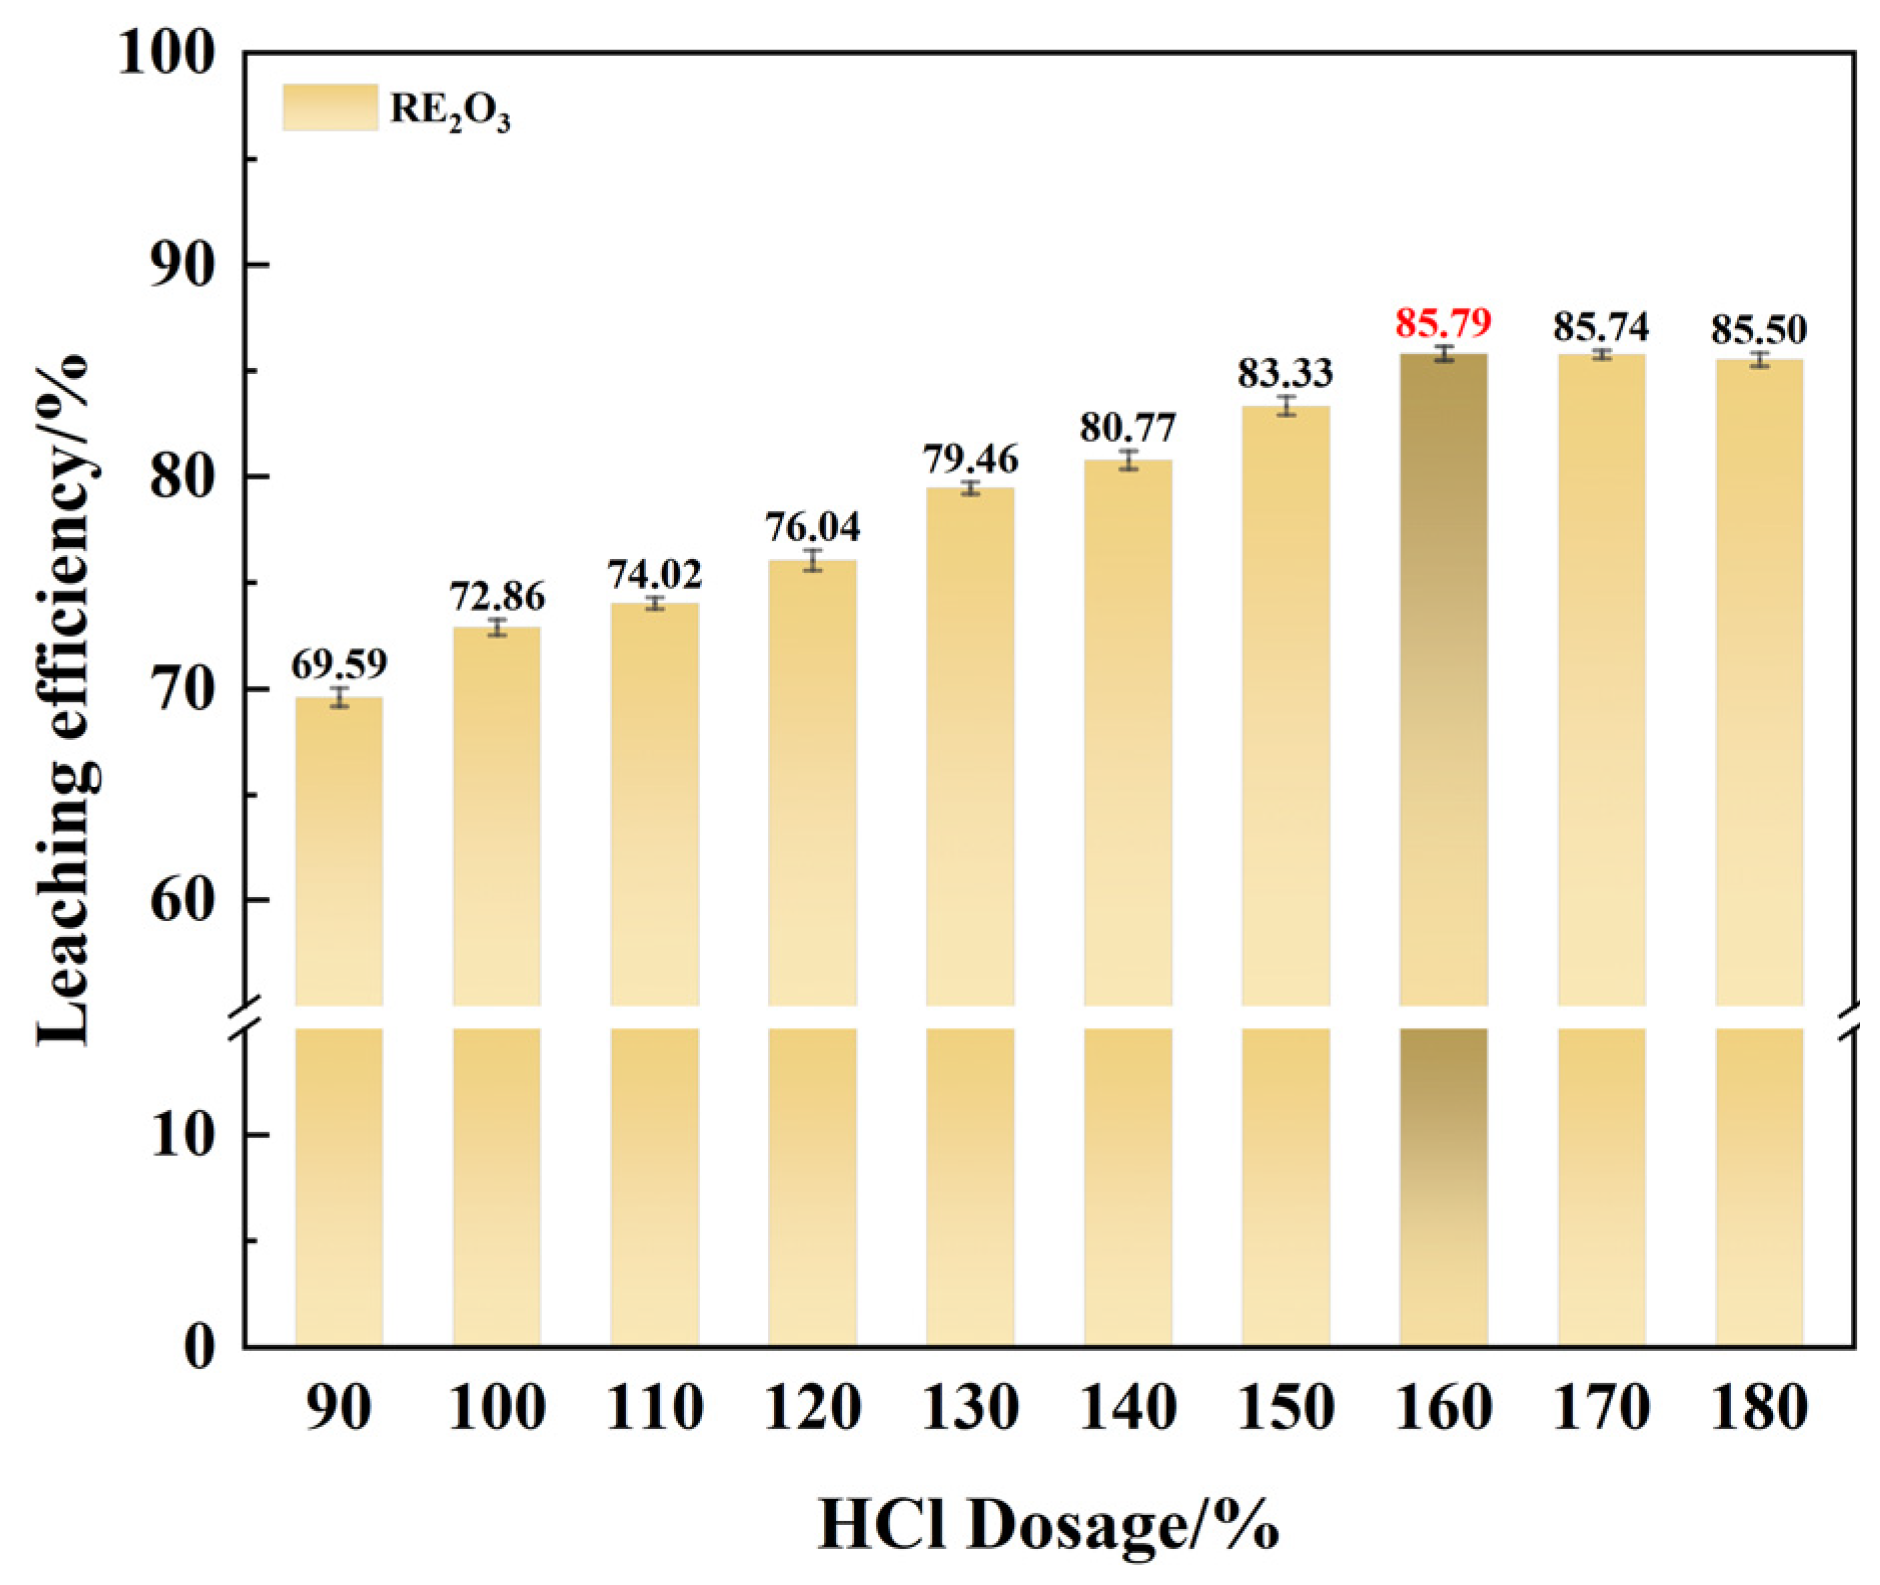
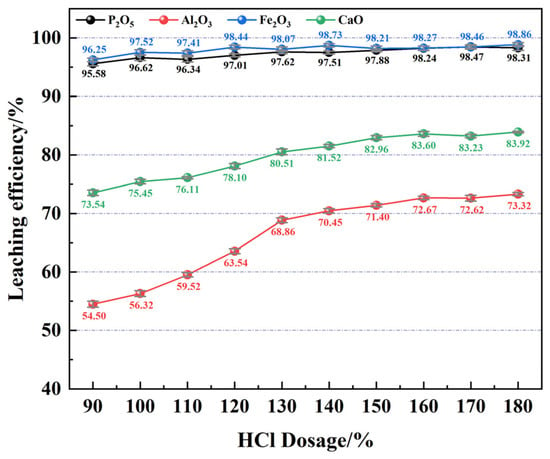
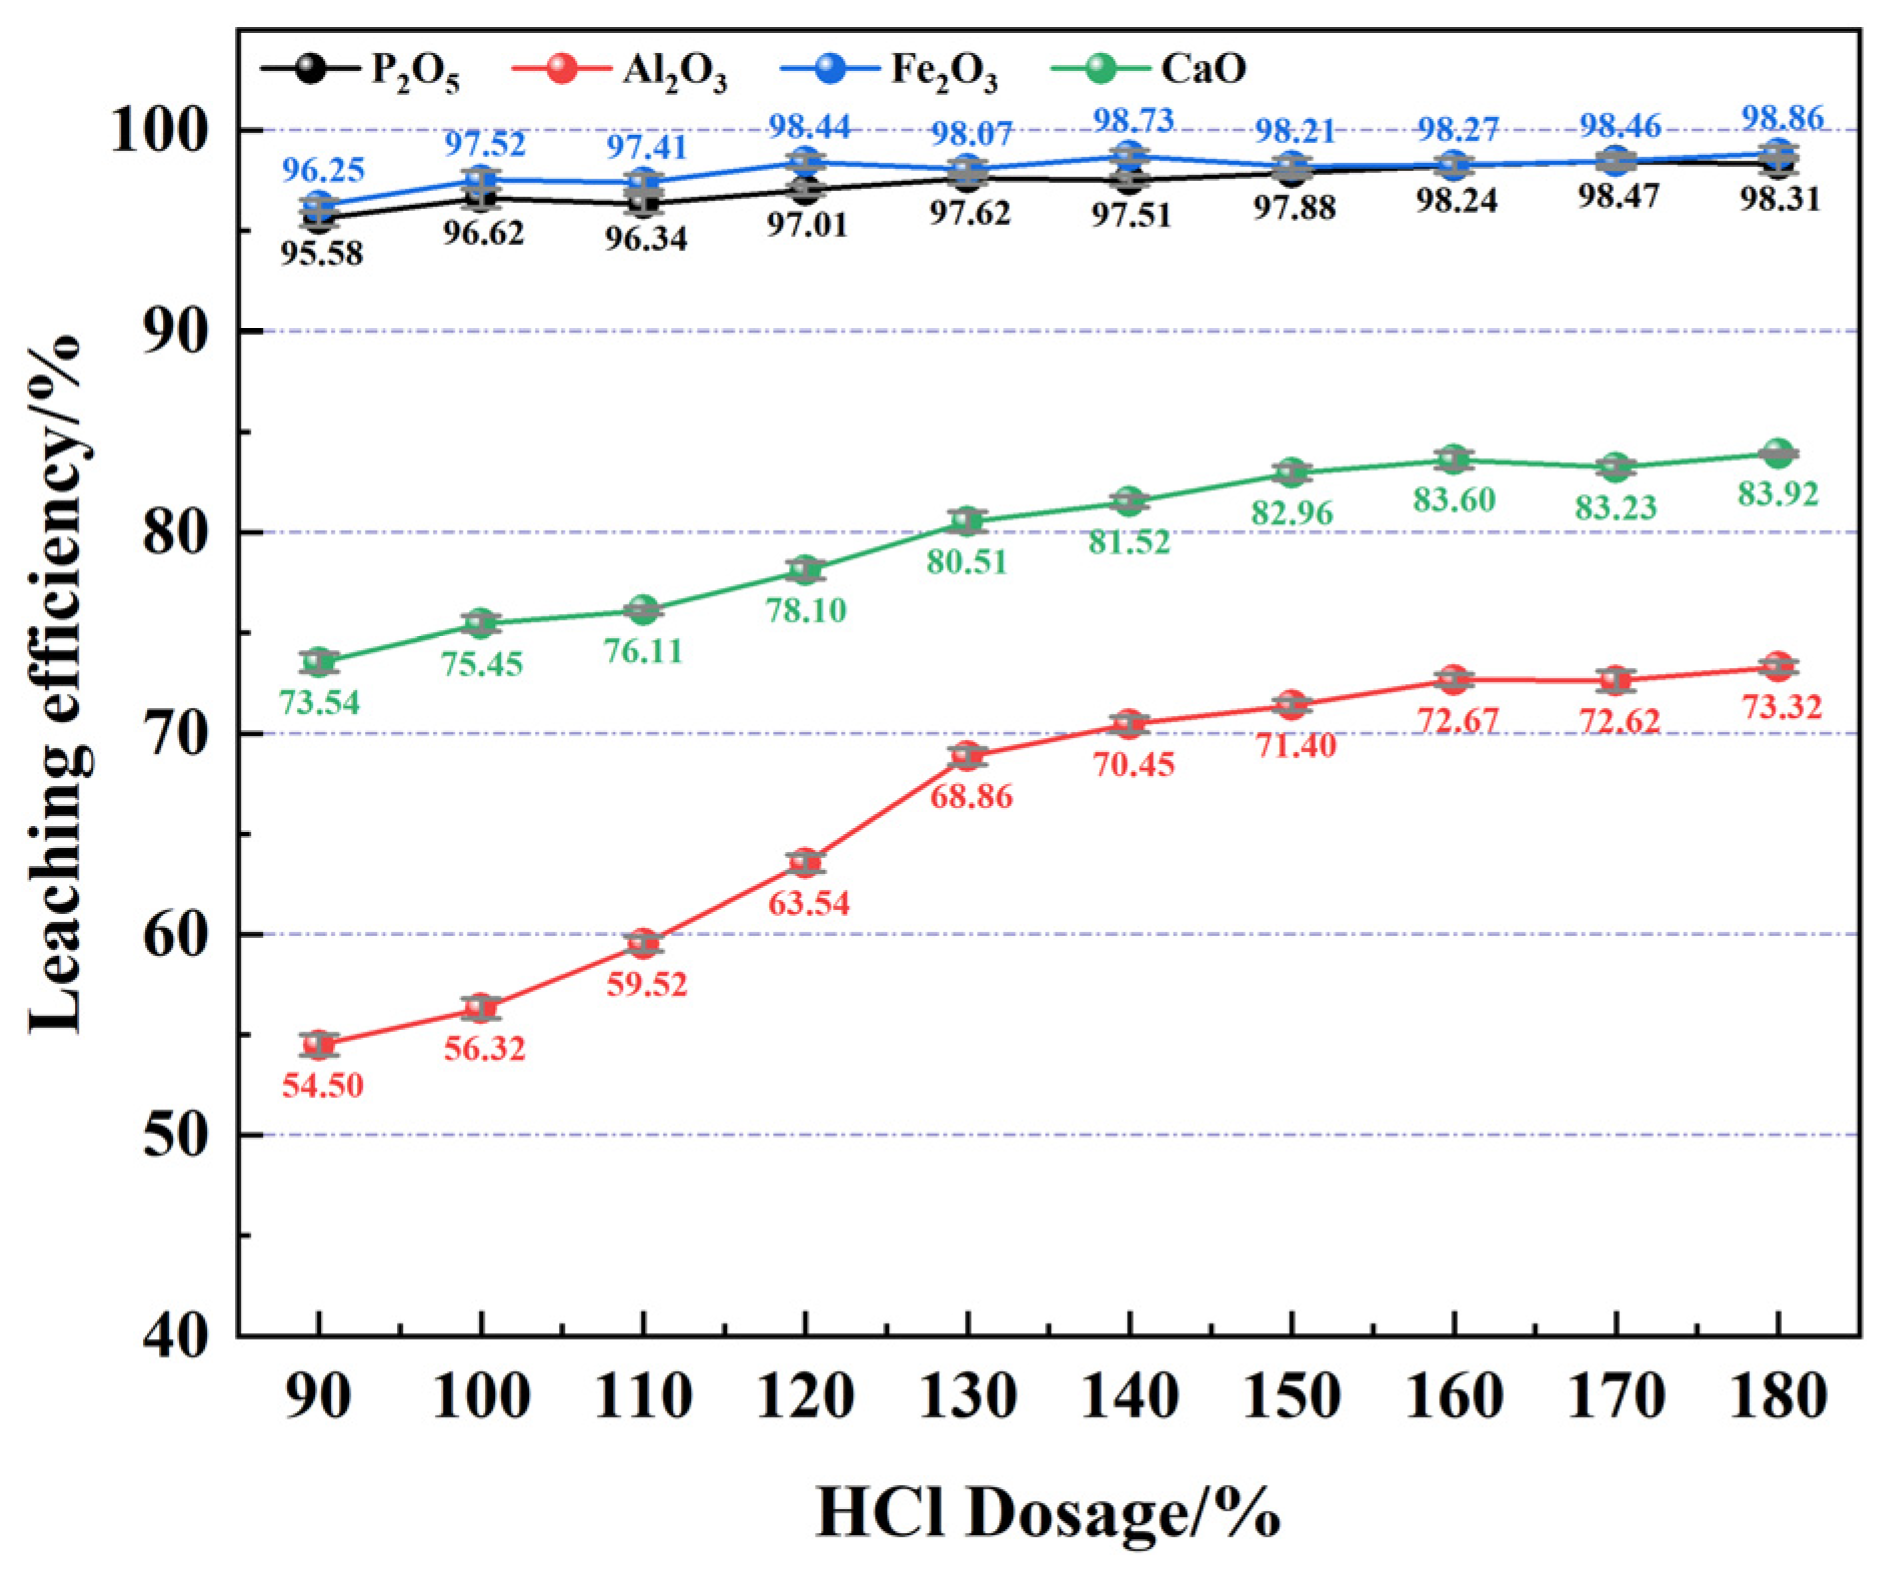
As illustrated in Figure 8, the leaching efficiency of rare earth elements increases with increasing hydrochloric acid dosage. When the acid dosage ranges from 90% to 160% of the theoretical requirement, the leaching efficiency rises markedly, from 69.59% to 85.79%. However, when the hydrochloric acid dosage exceeds 160% of the theoretical amount (CHCl = 6.73 mol/L), the leaching efficiency of rare earth elements shows little further improvement. As shown in Figure 9, the leaching efficiencies of impurity elements Ca and Al are significantly influenced by variations in hydrochloric acid dosage. When the dosage is below 130% of the theoretical requirement, the leaching efficiencies of Ca and Al increase notably, with Ca rising from 73.54% to 80.51% (an increase of 6.97 percentage points) and Al from 54.50% to 68.86% (an increase of 14.36 percentage points). When the hydrochloric acid dosage exceeds 130% of the theoretical amount, the leaching efficiencies of Ca and Al increase more gradually. Considering the overall leaching performance of rare earth elements, the optimal hydrochloric acid dosage was ultimately determined to be 160% of the theoretical requirement.
3.2.4. Effect of Solid–Liquid Ratio on Leaching Efficiency
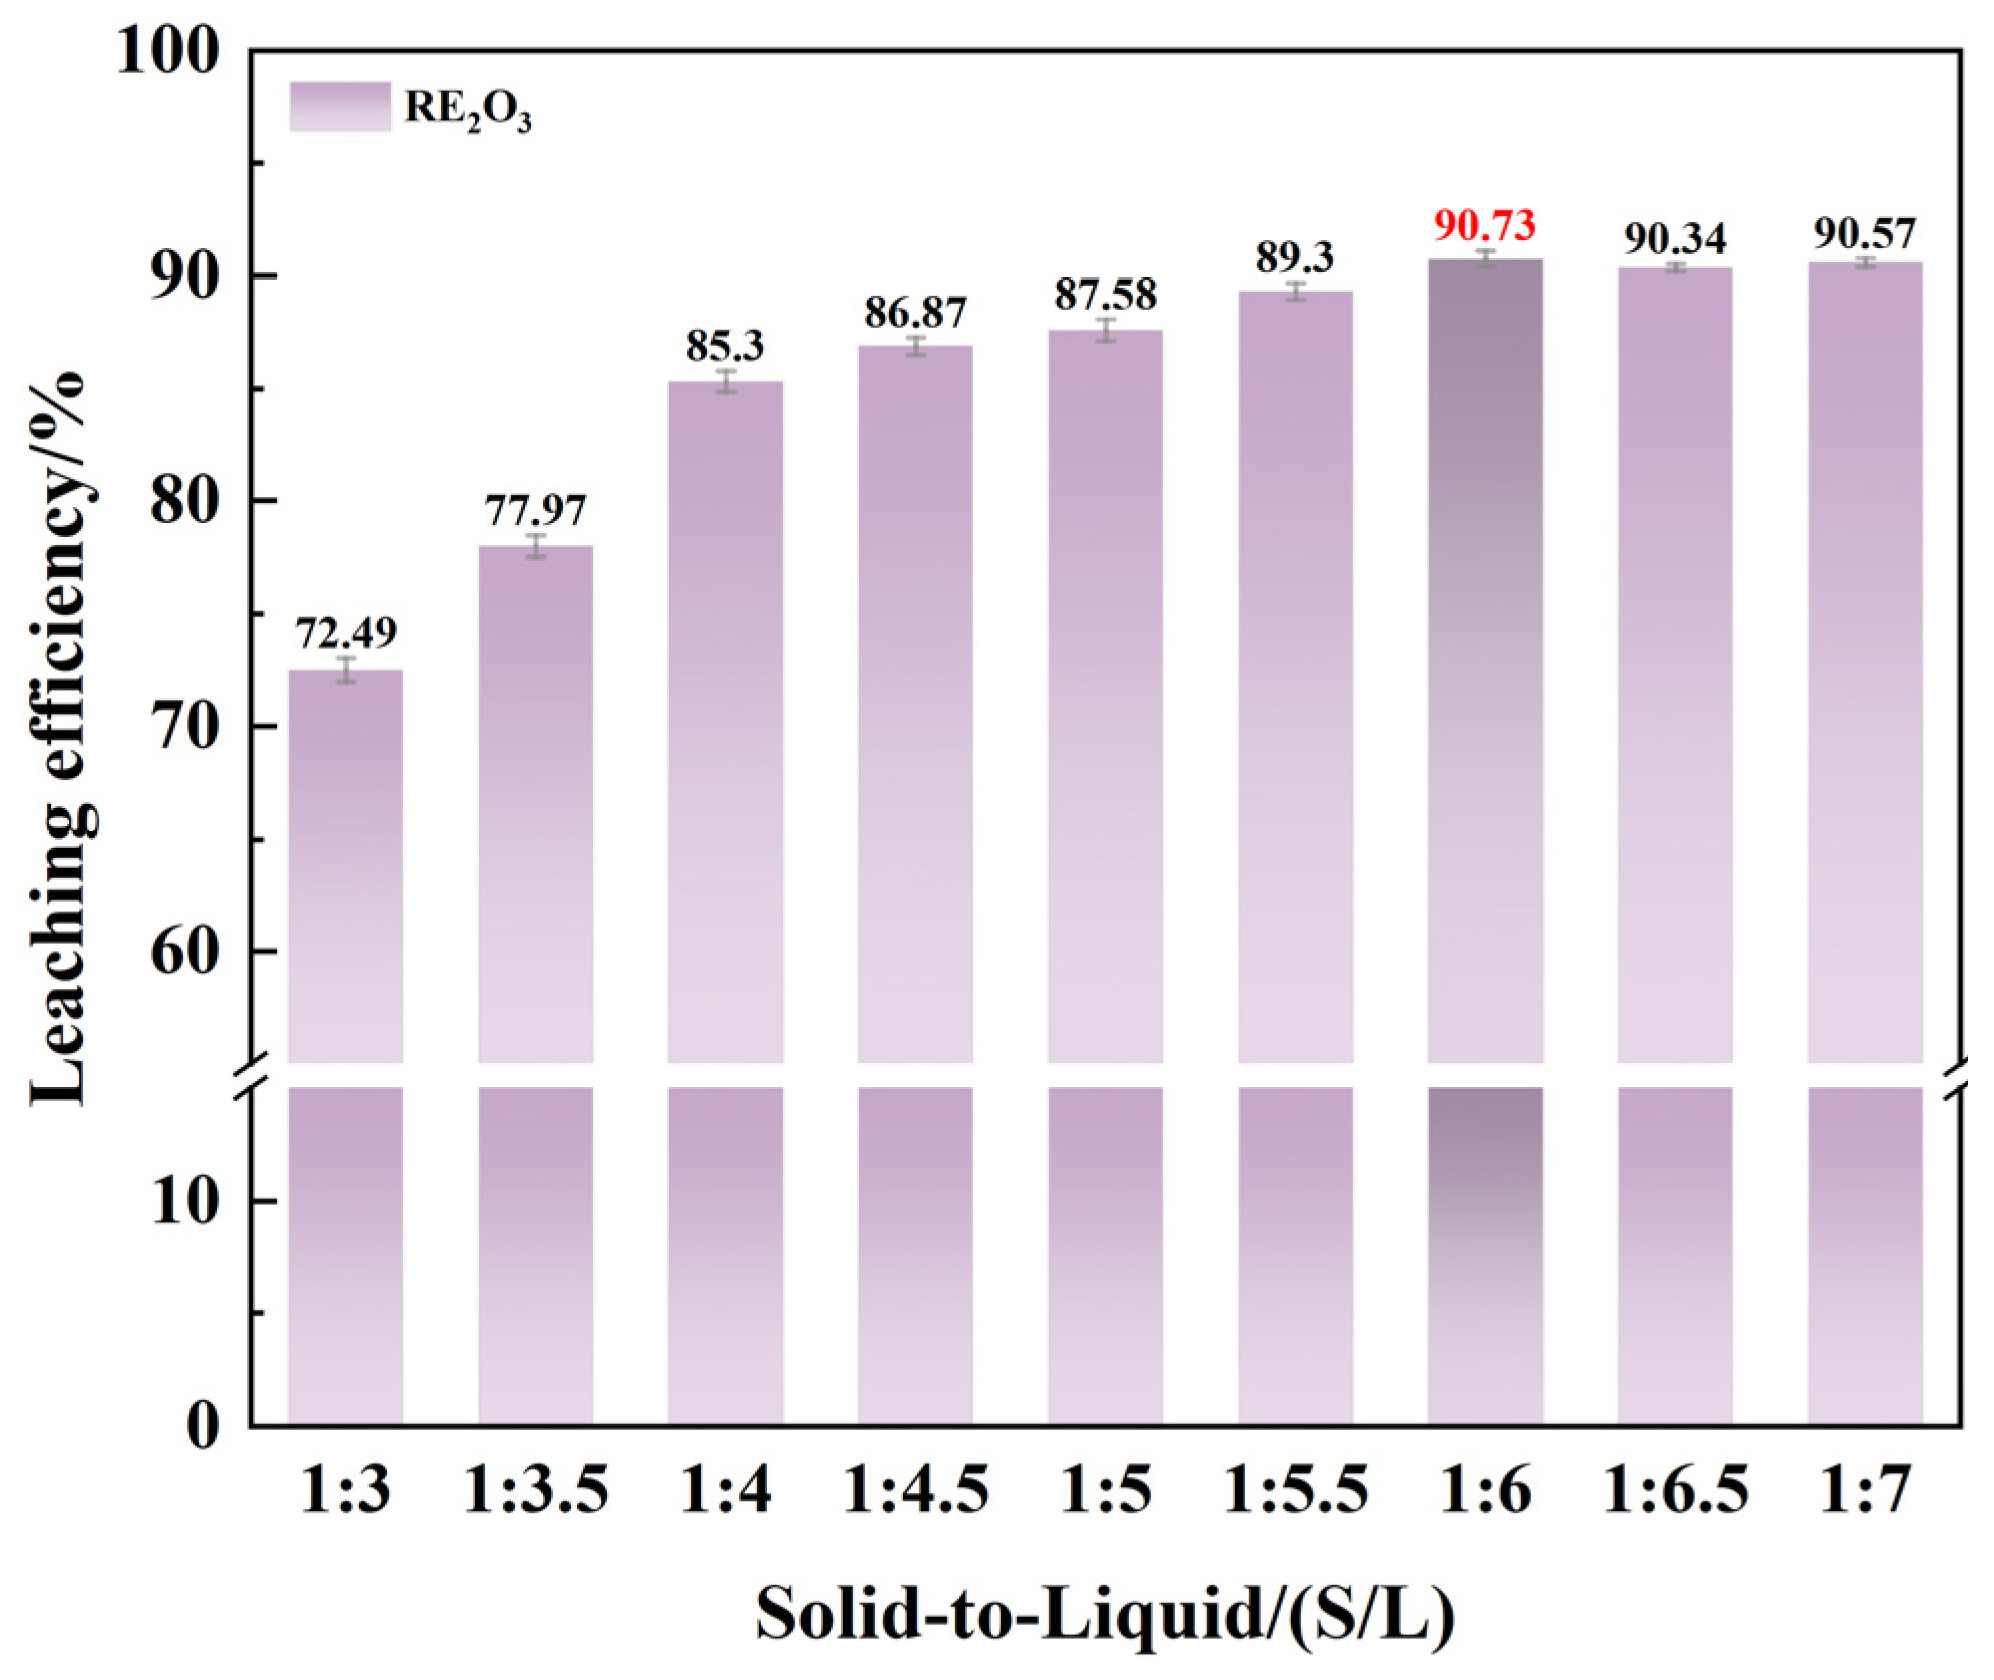
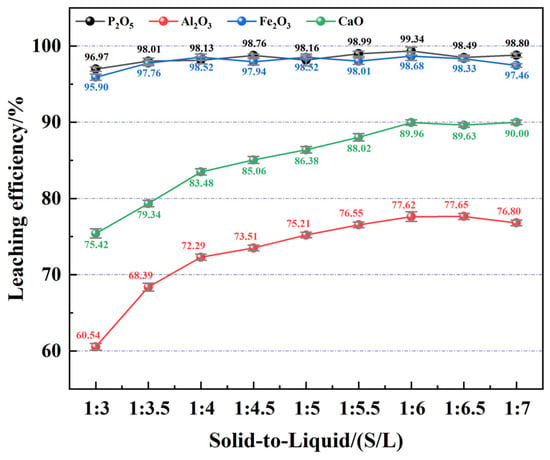
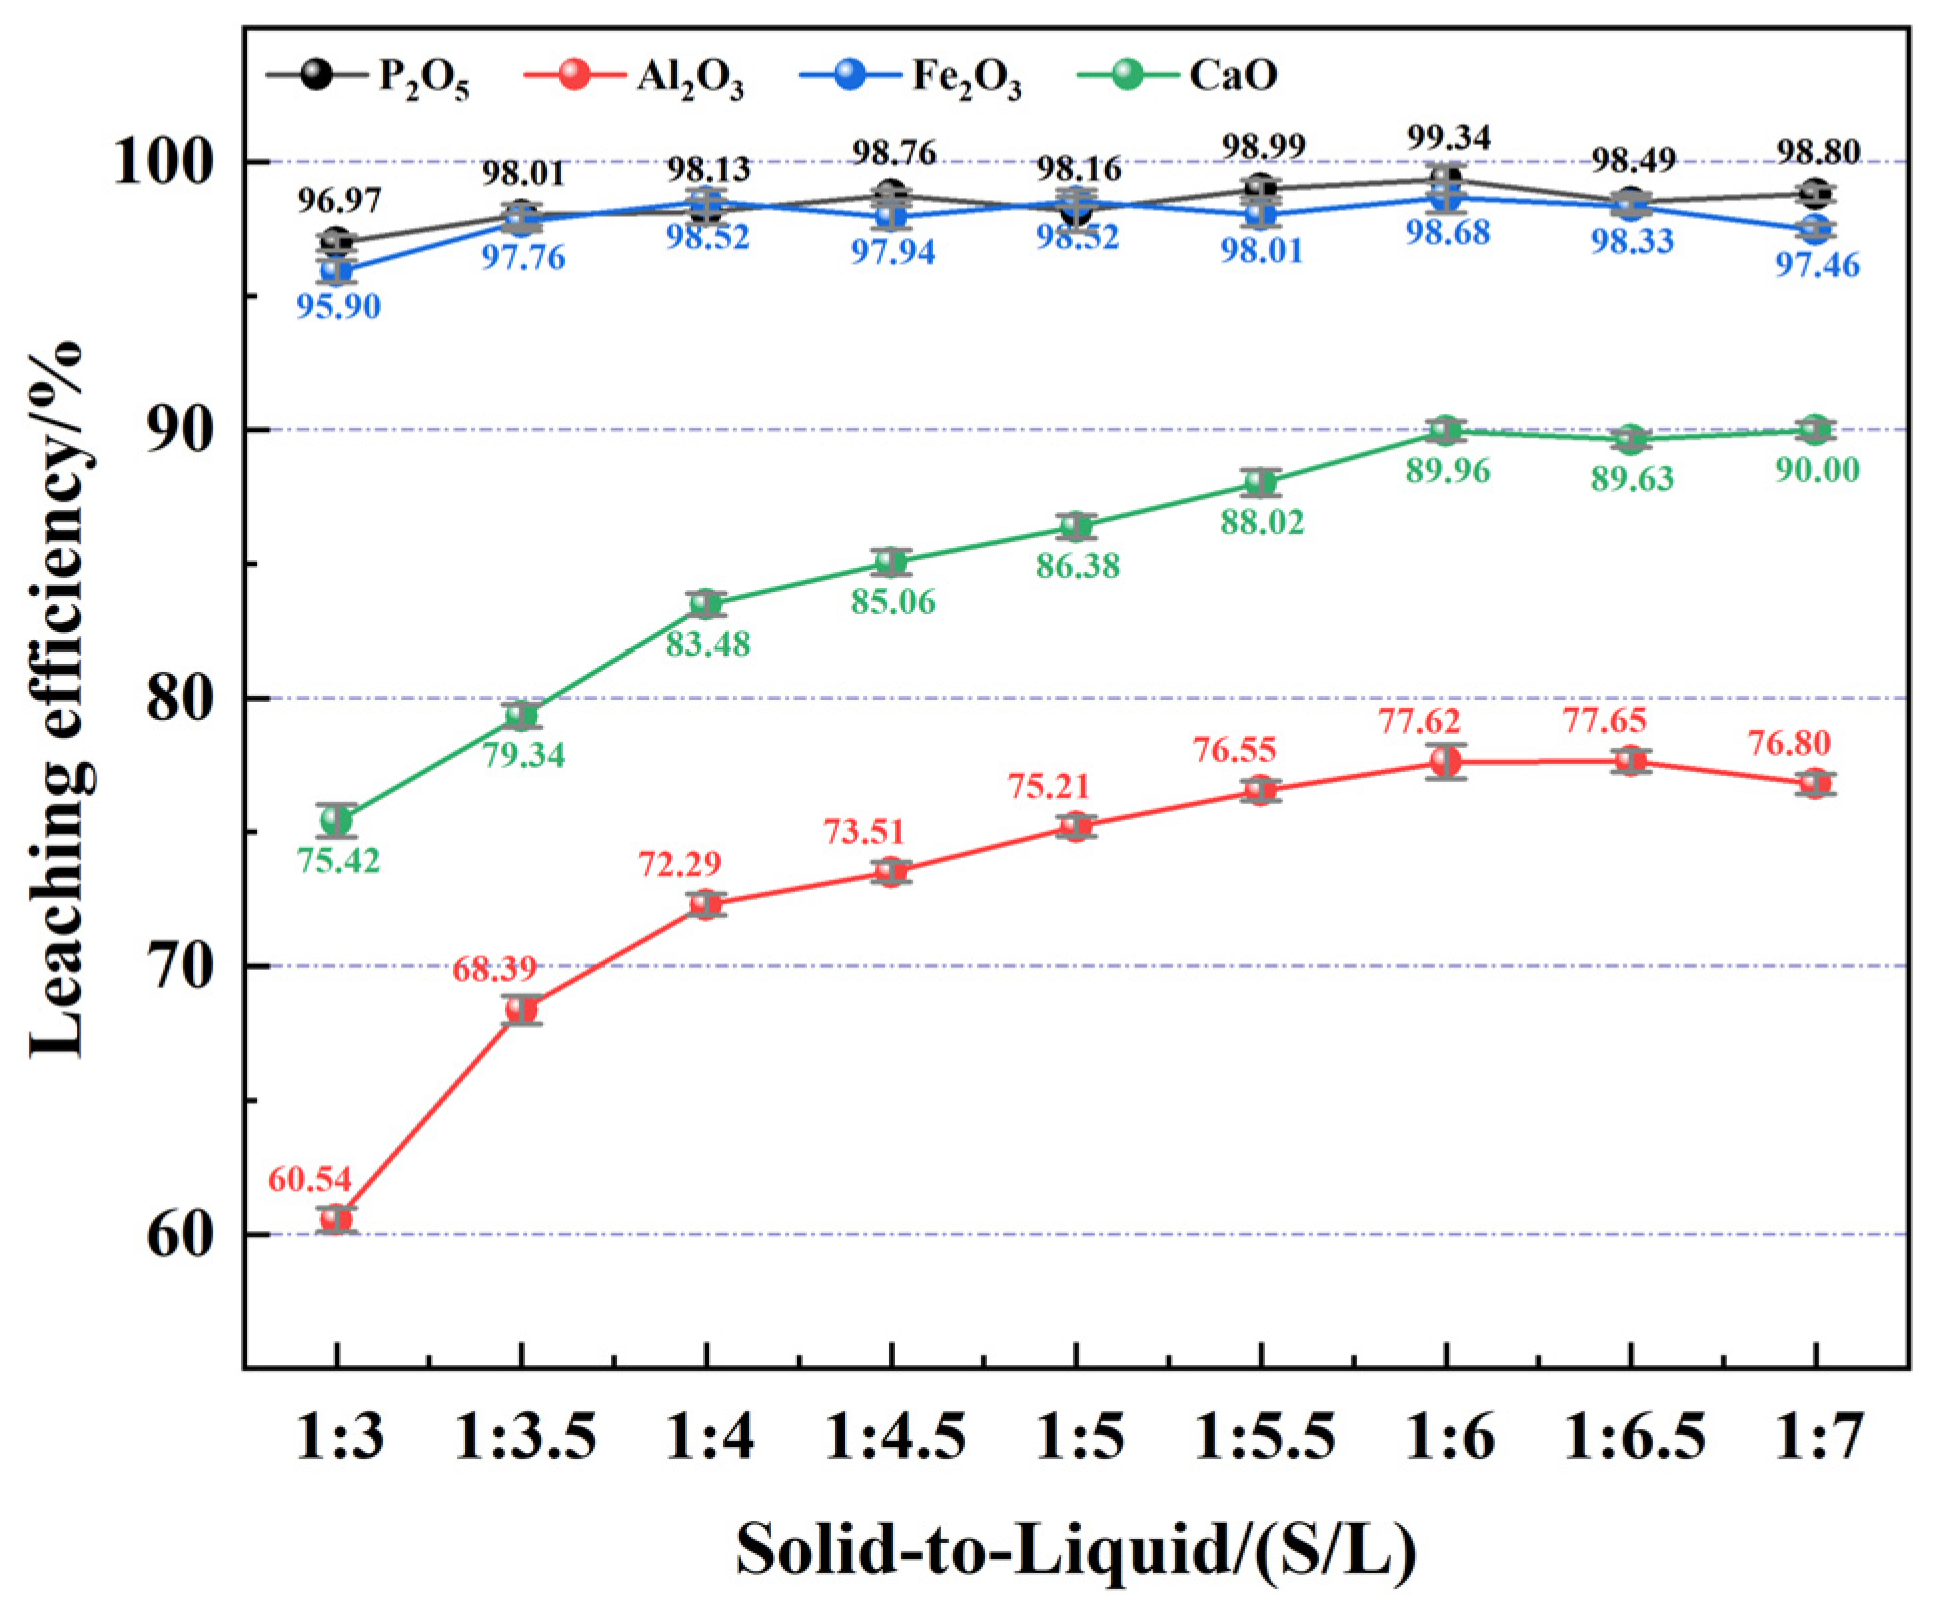
Under the optimal conditions of 80 °C leaching temperature, 120 min leaching time, and 160% of the theoretical hydrochloric acid dosage, with all other parameters unchanged, the effect of S/L ratio on rare earth leaching efficiency was investigated. The results are shown in Figure 10 and Figure 11.
Figure 10.
Effect of the solid-to-liquid ratio on the rare earth leaching efficiency.
Figure 11.
Effect of the solid-to-liquid ratio on the leaching efficiency of impurity elements.
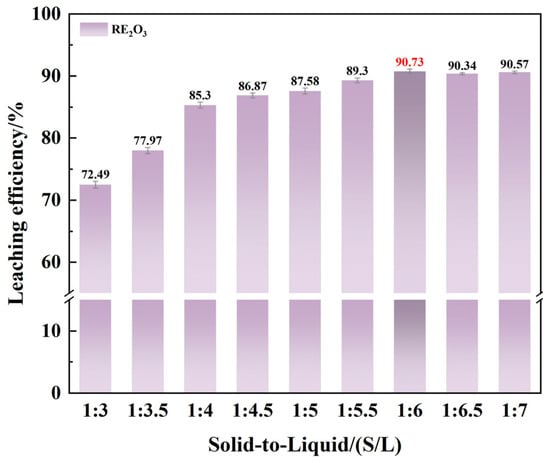
As shown in Figure 10, the leaching efficiency of rare earth elements increases significantly with increasing S/L ratio. When the S/L ratio reaches 1:6 (CHCl = 4.66 mol/L), the leaching efficiency attains its maximum value, with a rare earth leaching rate of 90.73%. Figure 11 indicates that the impurity elements most affected by the S/L ratio are Ca and Al, both of which exhibit increased leaching efficiencies with rising S/L ratio. This suggests that an increased S/L ratio not only enhances mass transfer within the leaching system but also improves the contact conditions between the leaching agent and the particles. The leaching efficiencies of Ca and Al both reach their maximum values at a S/L ratio of 1:6, at 89.96% and 77.62%, respectively. Therefore, the optimal S/L ratio was determined to be 1:6.
3.2.5. Effect of Agitation Speed on Leaching Efficiency
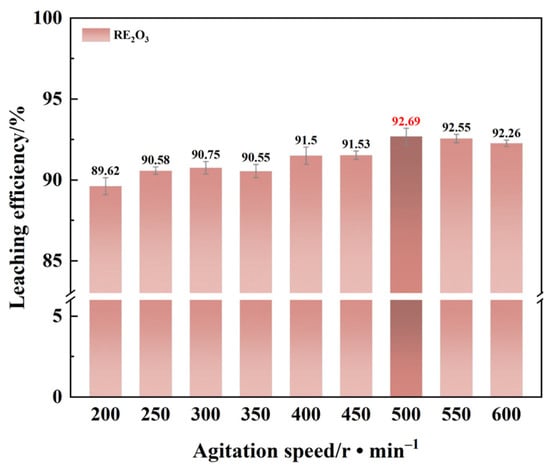
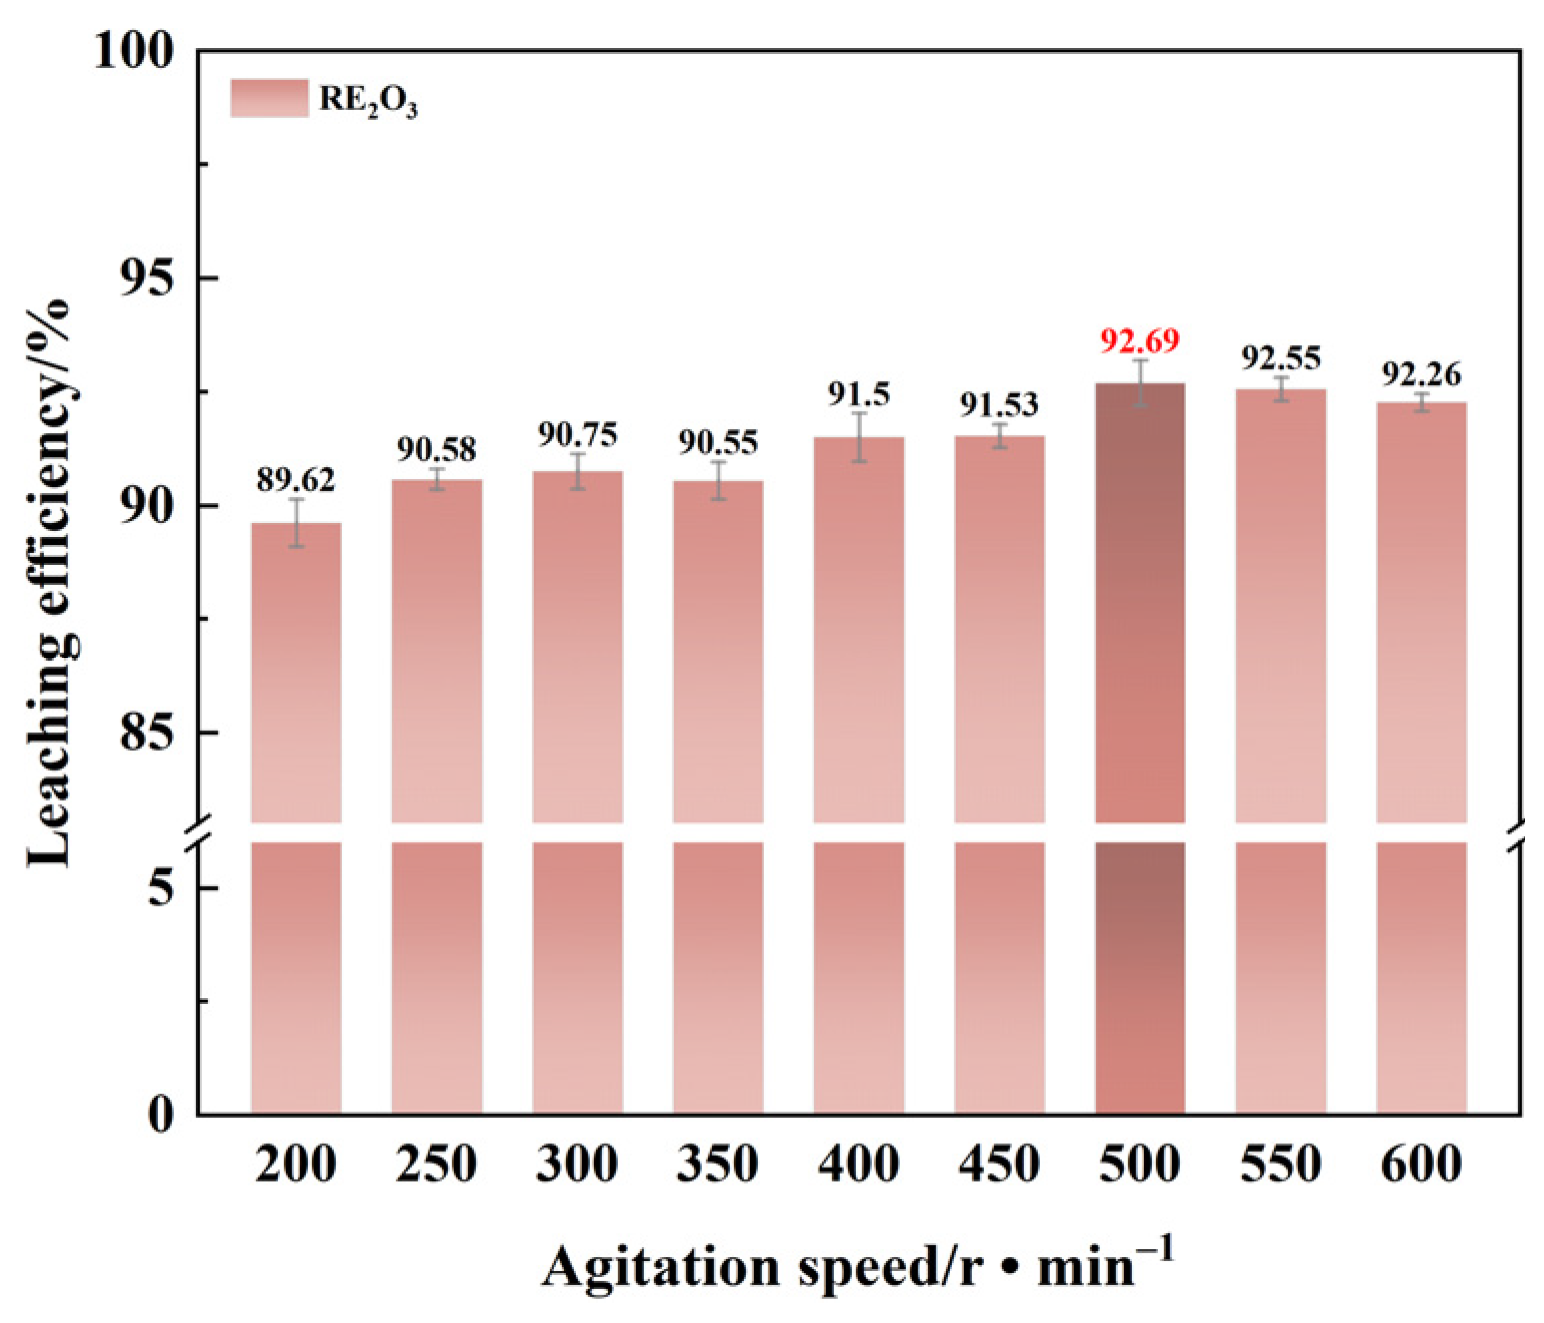
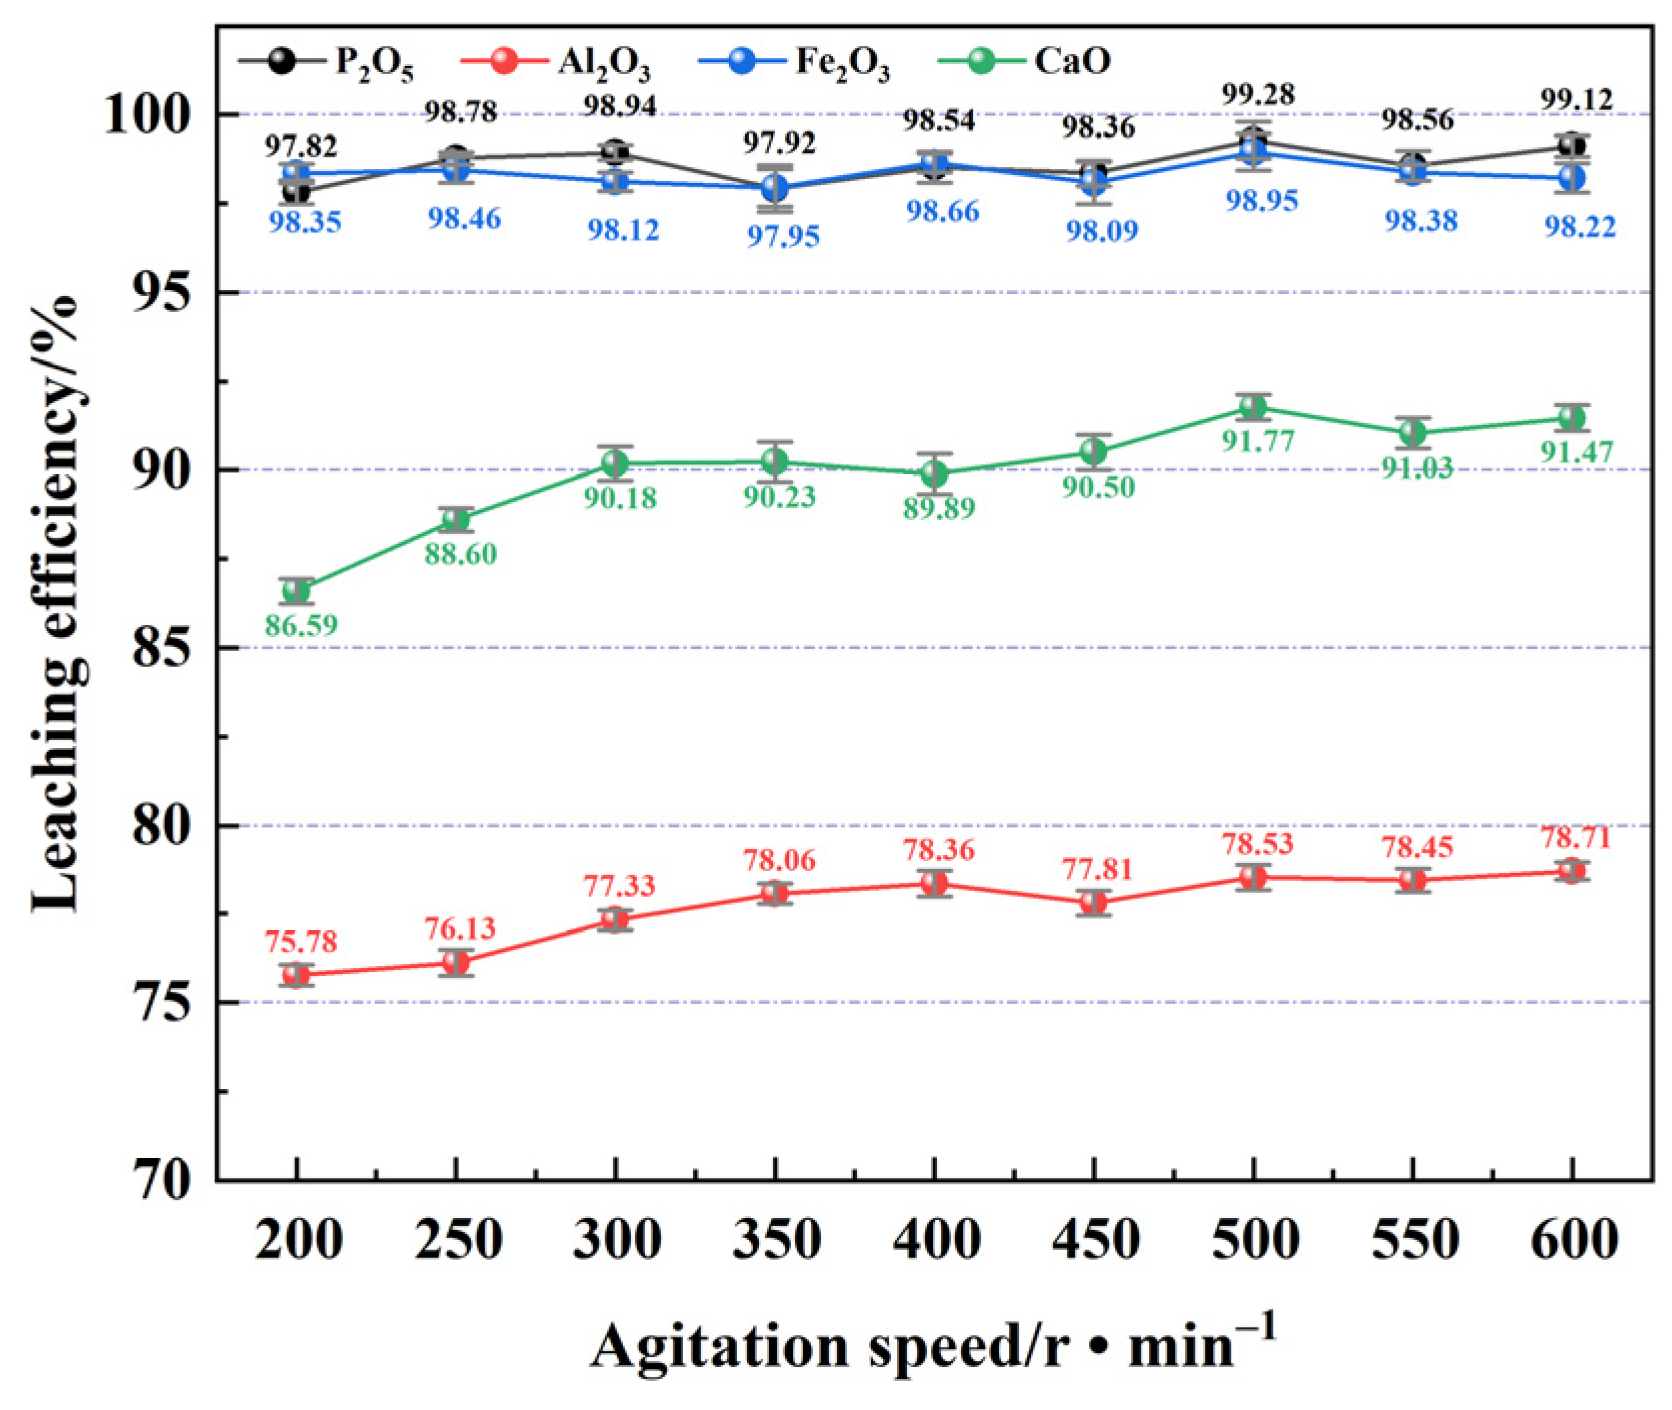
Under the optimal conditions of 80 °C leaching temperature, 120 min leaching time, 160% hydrochloric acid dosage, and a 1:6 S/L ratio, the effect of agitation speed on rare earth leaching efficiency was investigated. The results are presented in Figure 12 and Figure 13.
Figure 12.
Effect of agitation speed on the rare earth leaching efficiency.
Figure 13.
Effect of agitation speed on the leaching efficiency of impurity elements.
As shown in Figure 12, when the agitation speed is below 500 r·min−1, the rare earth leaching efficiency increases markedly with increasing speed. Beyond 500 r·min−1, the efficiency shows little further improvement. In Figure 13, the leaching efficiencies of impurity elements Ca and Al exhibit slight increases with higher agitation speeds. Considering the overall rare earth recovery, the optimal agitation speed was determined to be 500 r·min−1.
Therefore, based on the above experimental investigations, the optimal leaching conditions for rare earth were determined as follows: leaching temperature of 80 °C, leaching time of 120 min, hydrochloric acid dosage at 160% of the theoretical requirement, solid–liquid ratio of 1:6 (CHCl = 4.66 mol/L), and agitation speed of 500 r·min−1. Under these conditions, the rare earth leaching efficiency reached a maximum of 92.69%, the residual P2O5 leaching efficiency was 99.28%, and the leaching efficiencies of impurity elements Al, Fe, and Ca were 78.53%, 98.95%, and 91.77%, respectively.
3.3. Migration and Enrichment of Rare Earth Elements in the Leaching Residue
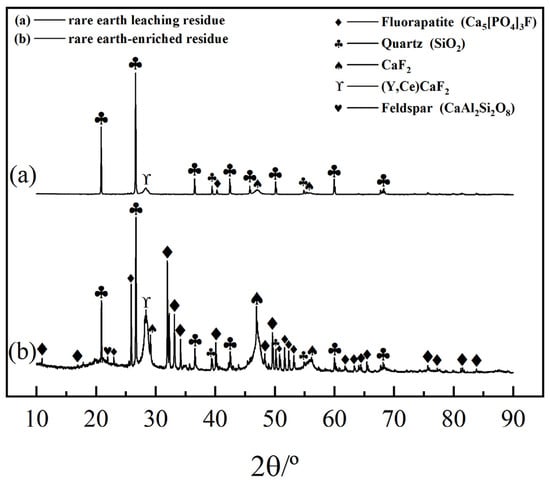
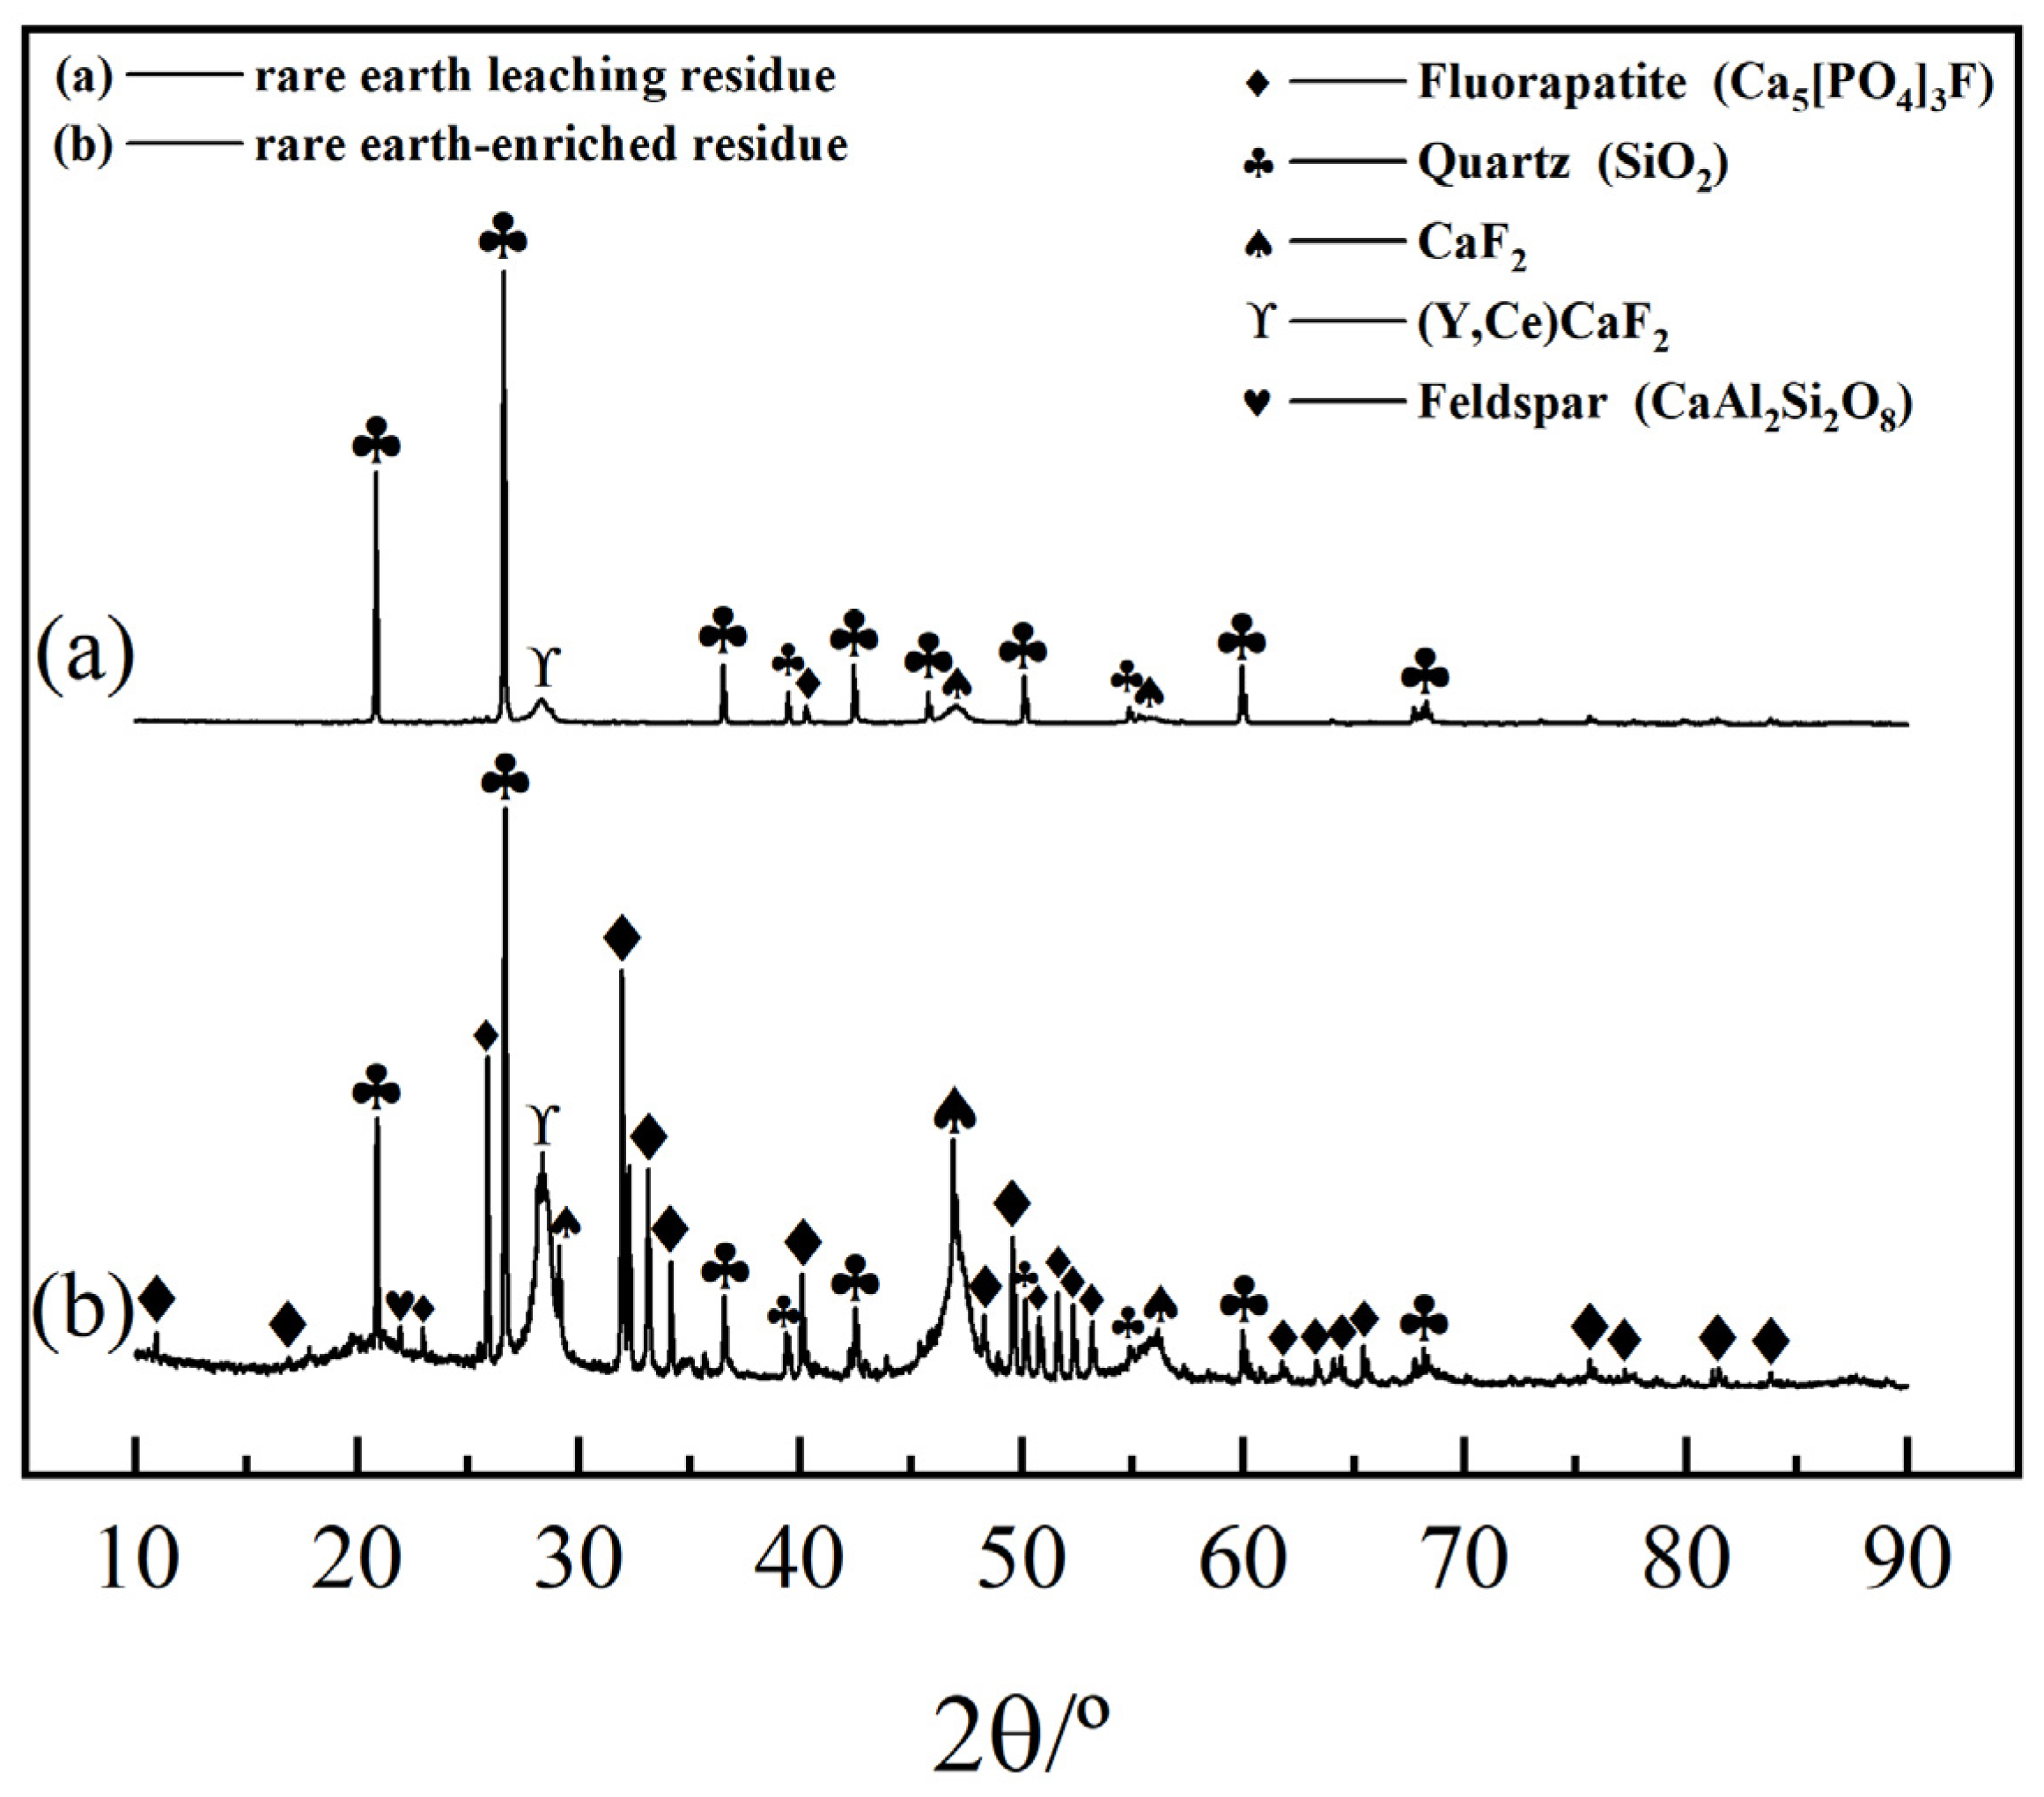
First, the phase composition of the leaching residue was analyzed using XRD, and the results are shown in Figure 14.
Figure 14.
XRD pattern of the leaching residue.
In Figure 14, A comparison of (a) and (b) shows that the major phases in the leaching residue are silicate minerals (quartz and feldspar), with a small amount of undissolved CaF2 occurring in the form of yttrium-substituted fluorite.
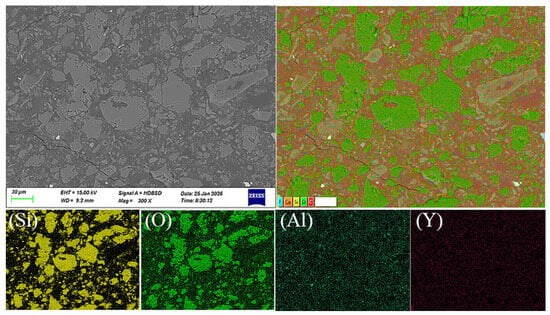
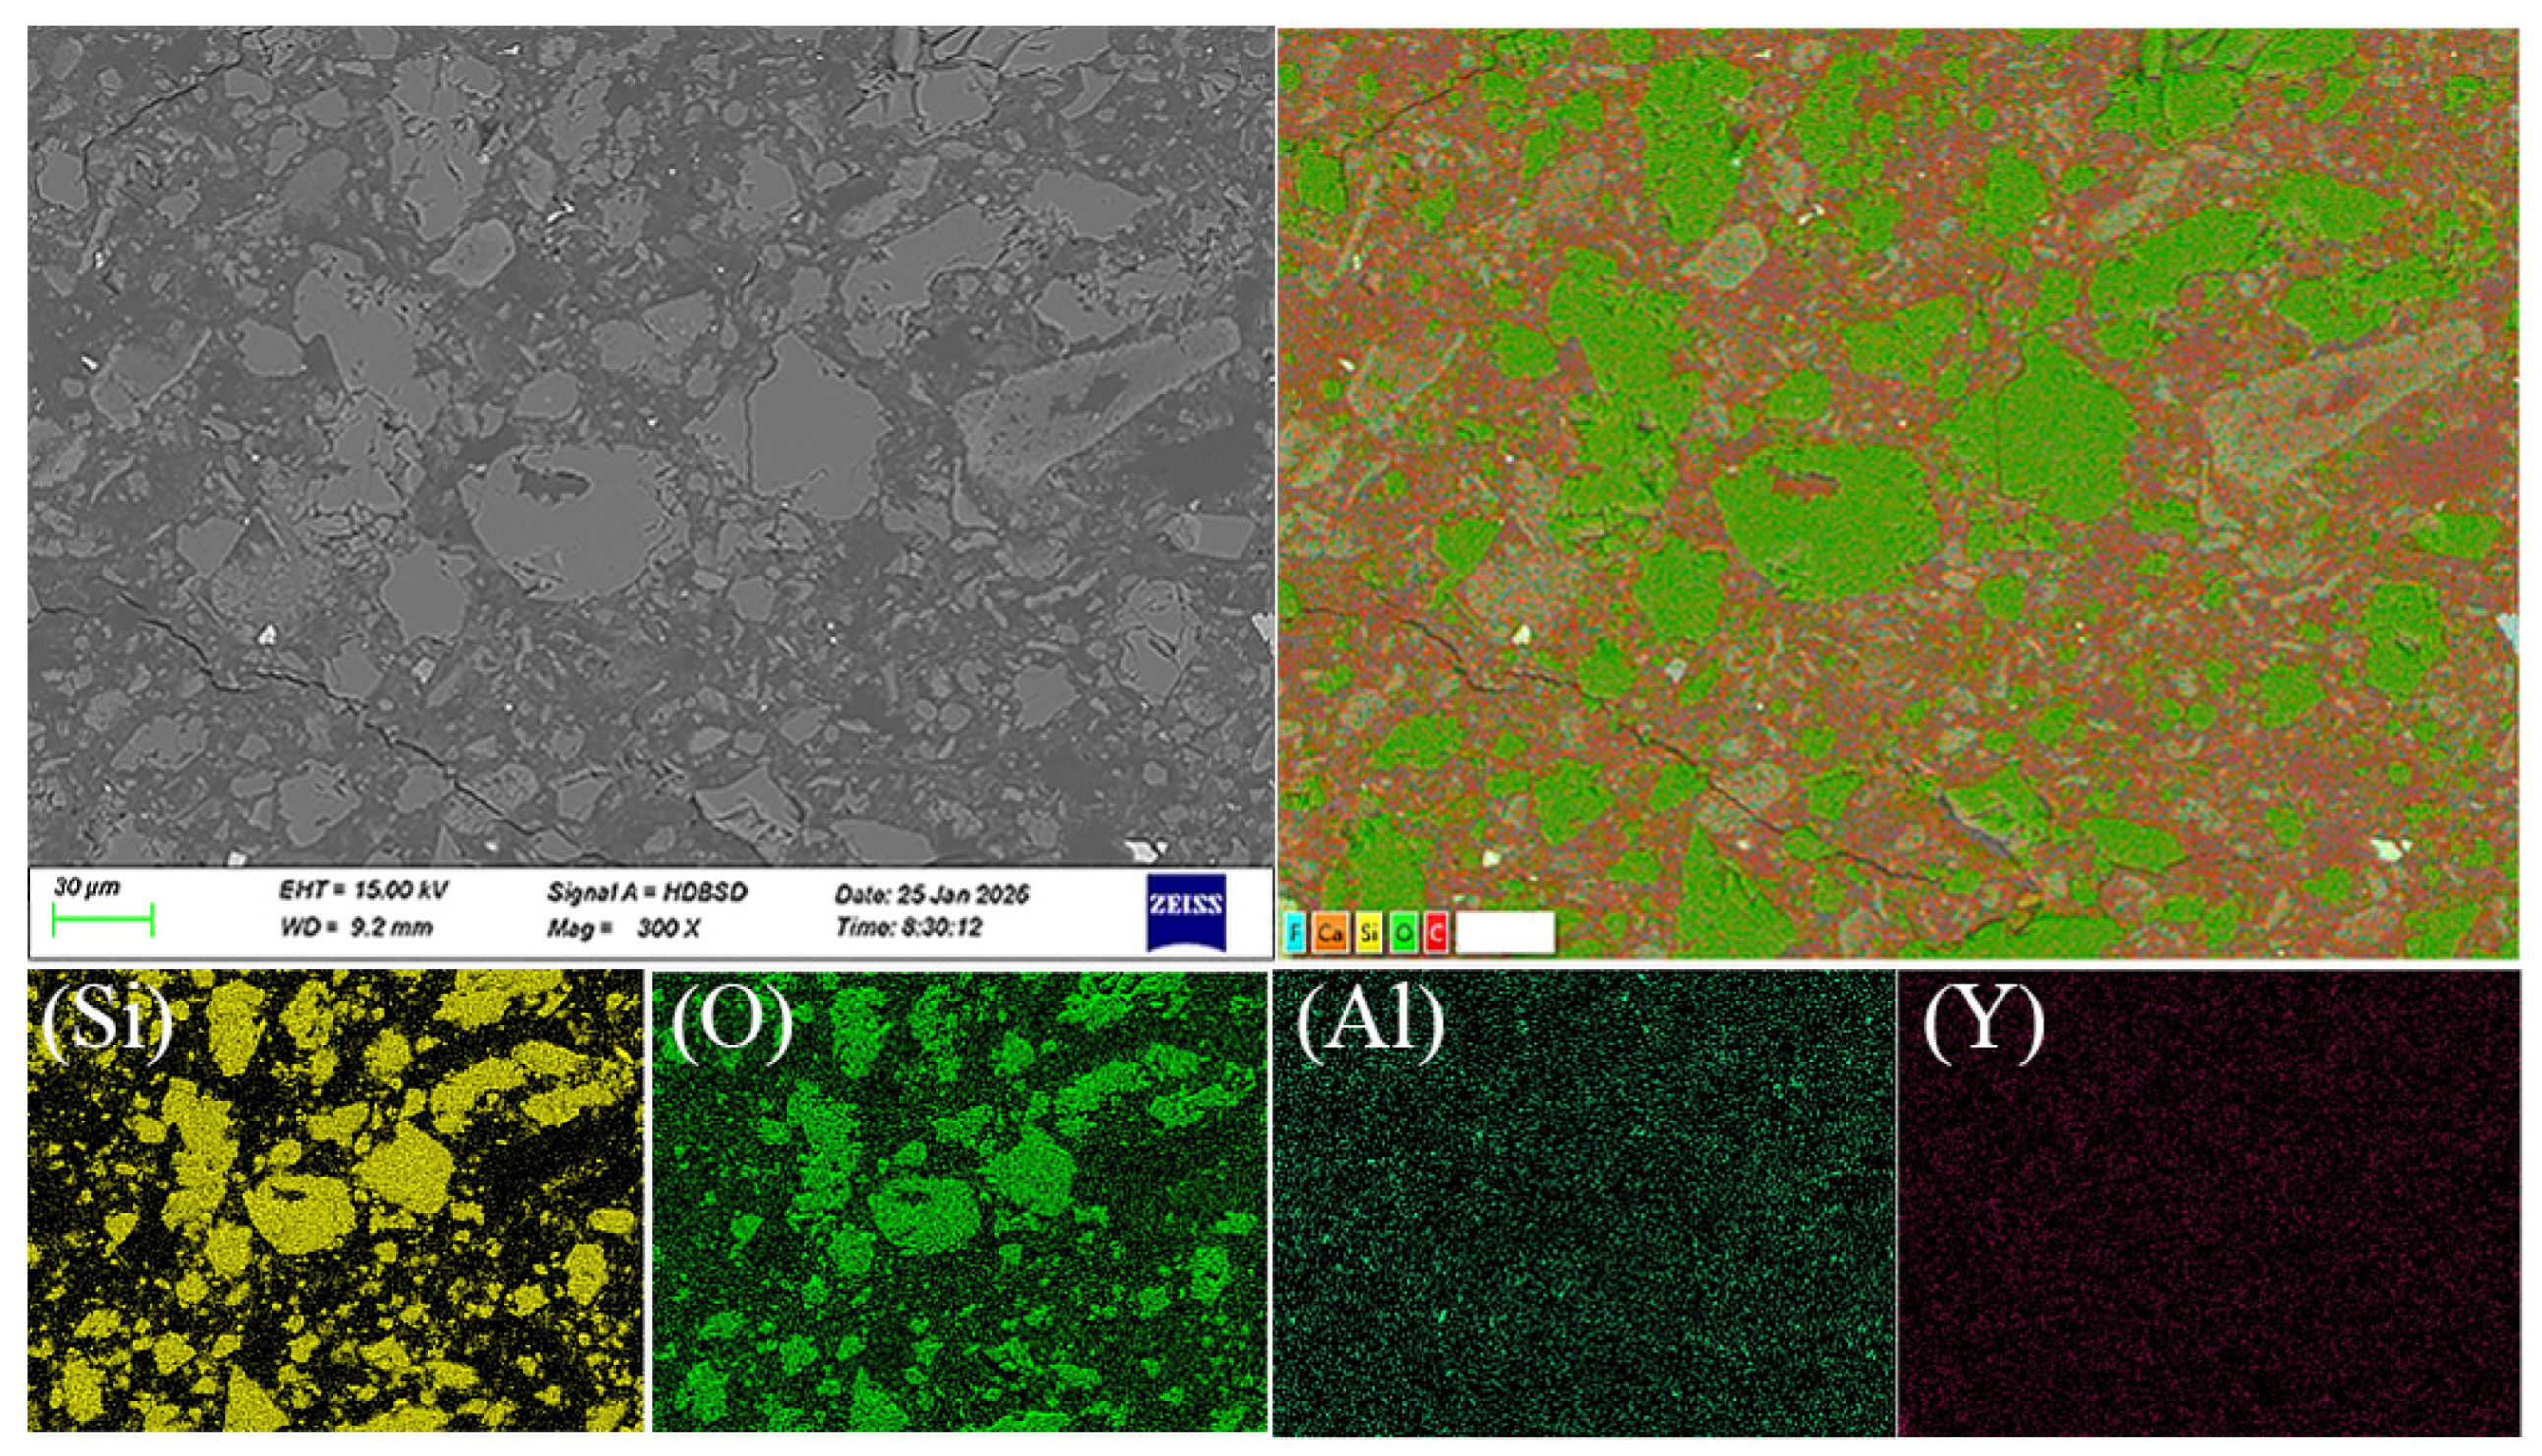
The elemental distribution in the leach residue was analyzed by SEM–EDS, and the results are presented in Figure 15.
Figure 15.
SEM–EDS Images of the Rare Earth Leach Residue.
As illustrated by the elemental mapping in Figure 15, the leach residue is dominated by the distribution of Si and O. Minor amounts of Al are also detected, spatially coinciding with Si and O; combined with the XRD results, this suggests the presence of feldspar. Notably, almost no distribution of the rare earth element Y is observed in the leach residue, indicating that the rare earth elements in the enriched residue have been nearly completely leached.
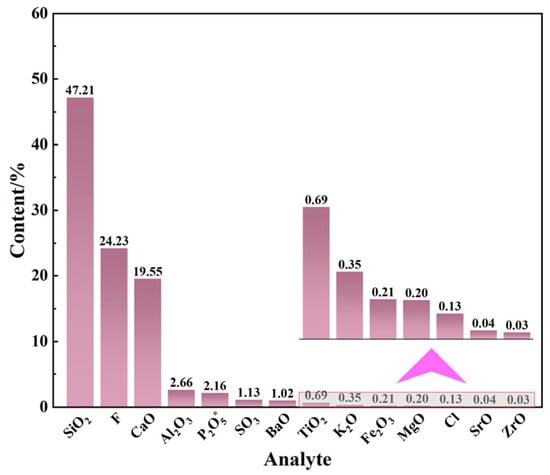
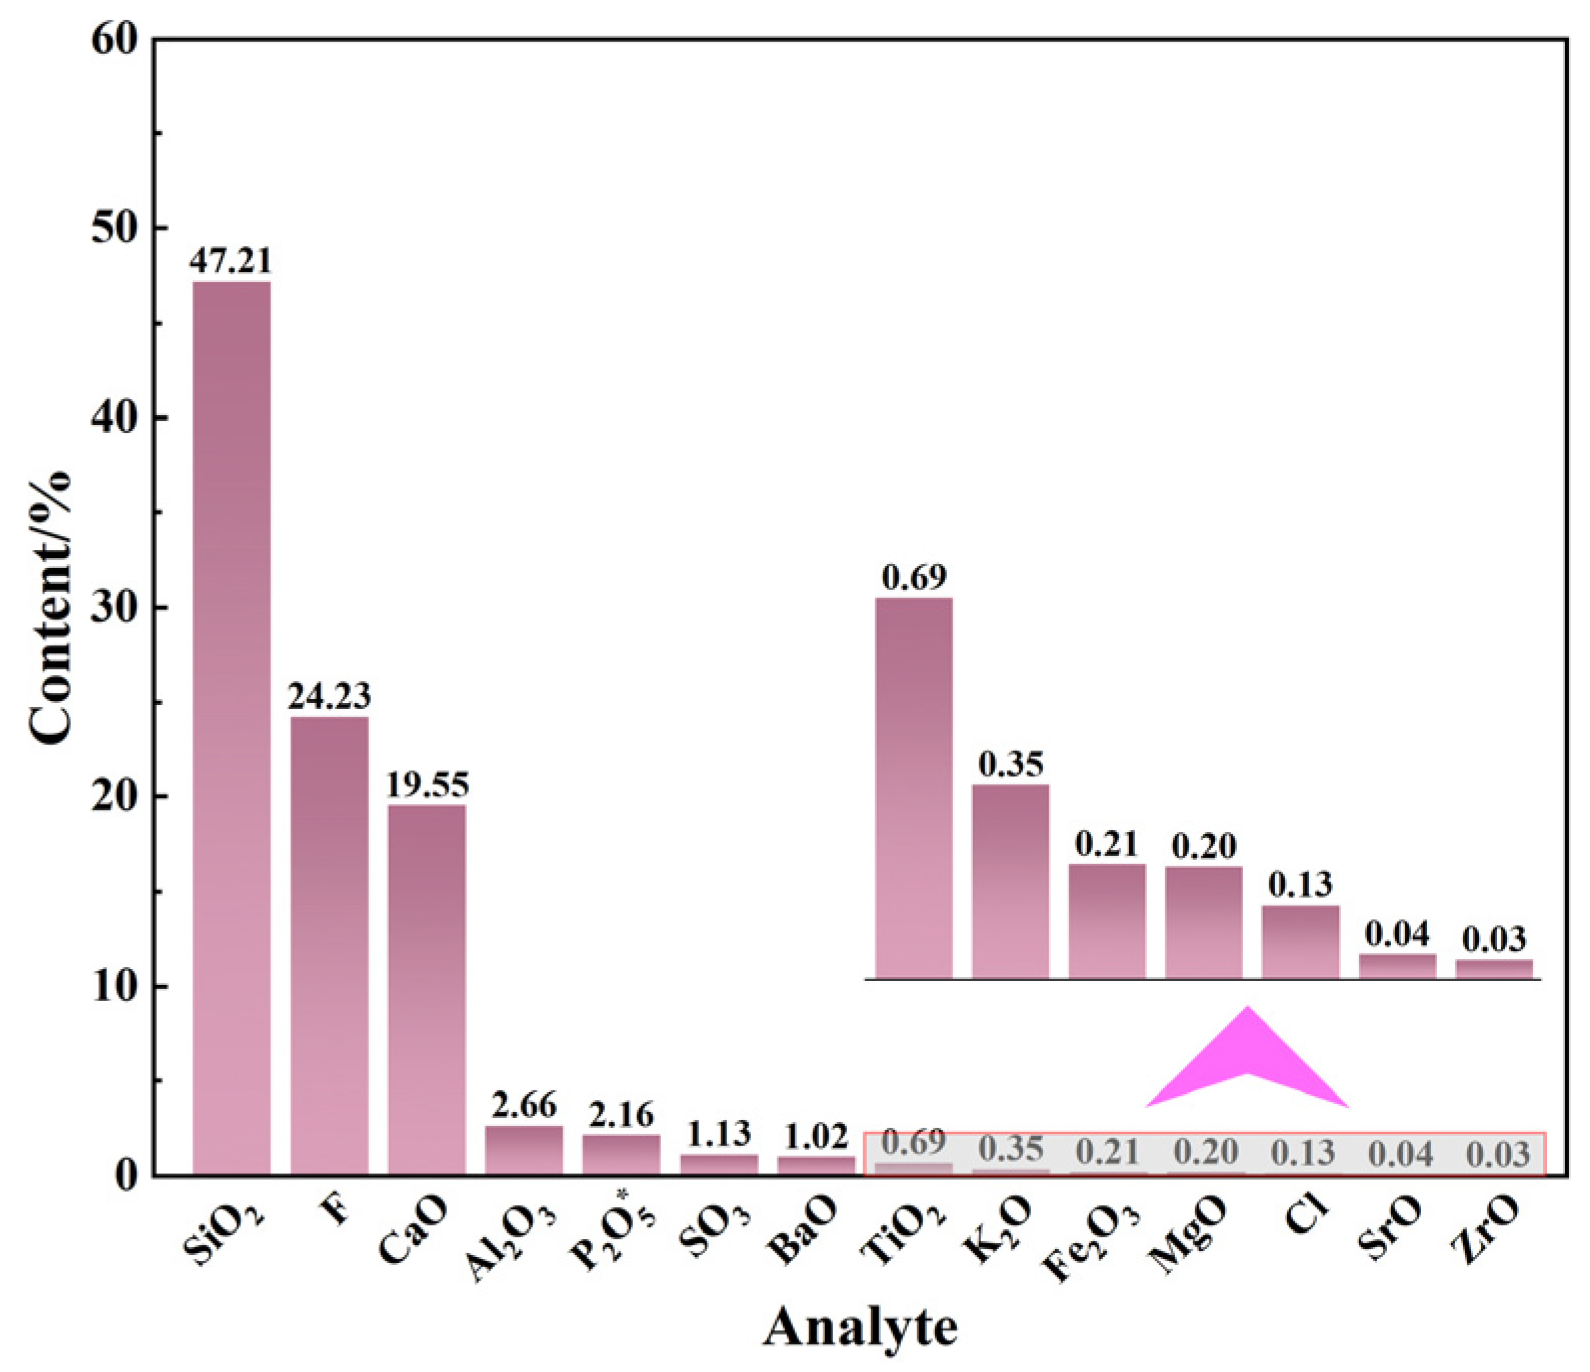
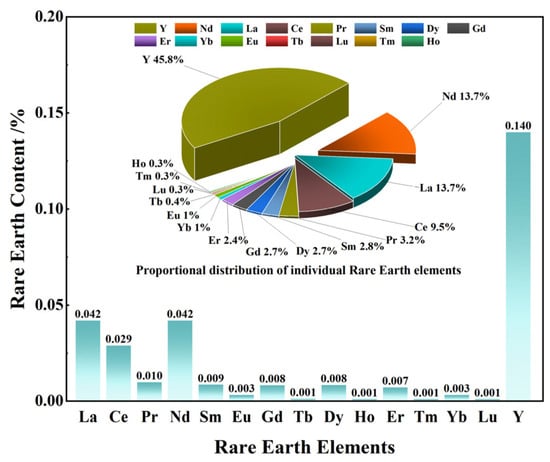
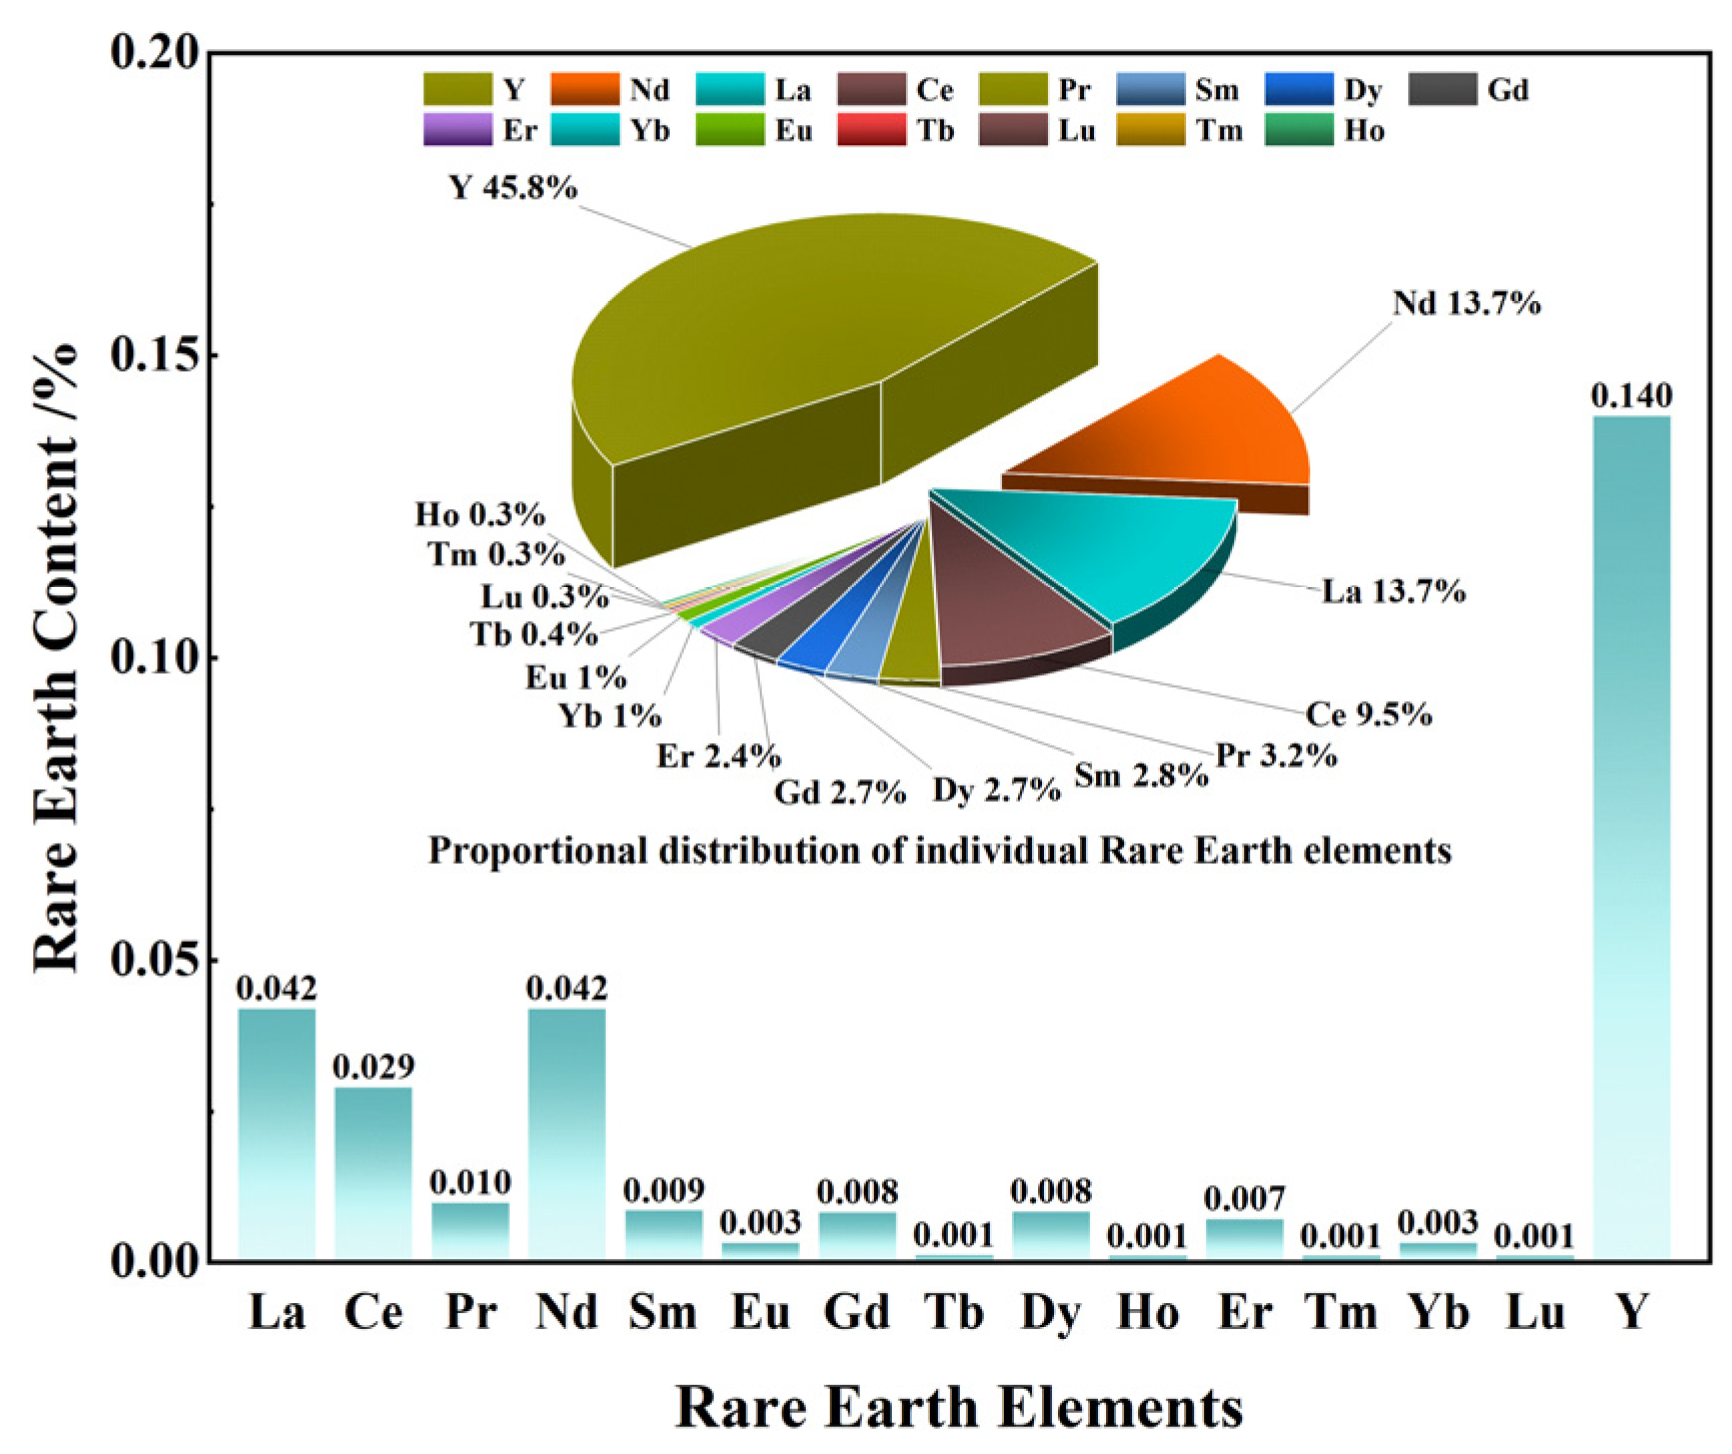
To further determine the chemical composition of the rare earth leaching residue, as well as the content and distribution of individual rare earth elements, XRF, ICP-OES, and ICP-MS analyses were conducted. The results are shown in Figure 16 and Figure 17.
Figure 16.
Multi-Element analysis results of the leaching residue. * denotes quantitative analysis by ICP-OES.
Figure 17.
Rare earth element content and distribution in the leaching residue.
Figure 17, showing the elemental composition of the rare earth leaching residue (XRF), reveals a significant enrichment of SiO2, as silicate minerals are largely unreactive with hydrochloric acid. As shown in Figure 18, the total rare earth content in the leaching residue decreases from 0.756% in the rare-earth-enriched residue to 0.306%, a reduction of 0.45 percentage points.
3.4. Kinetics Study of Rare Earth Leaching
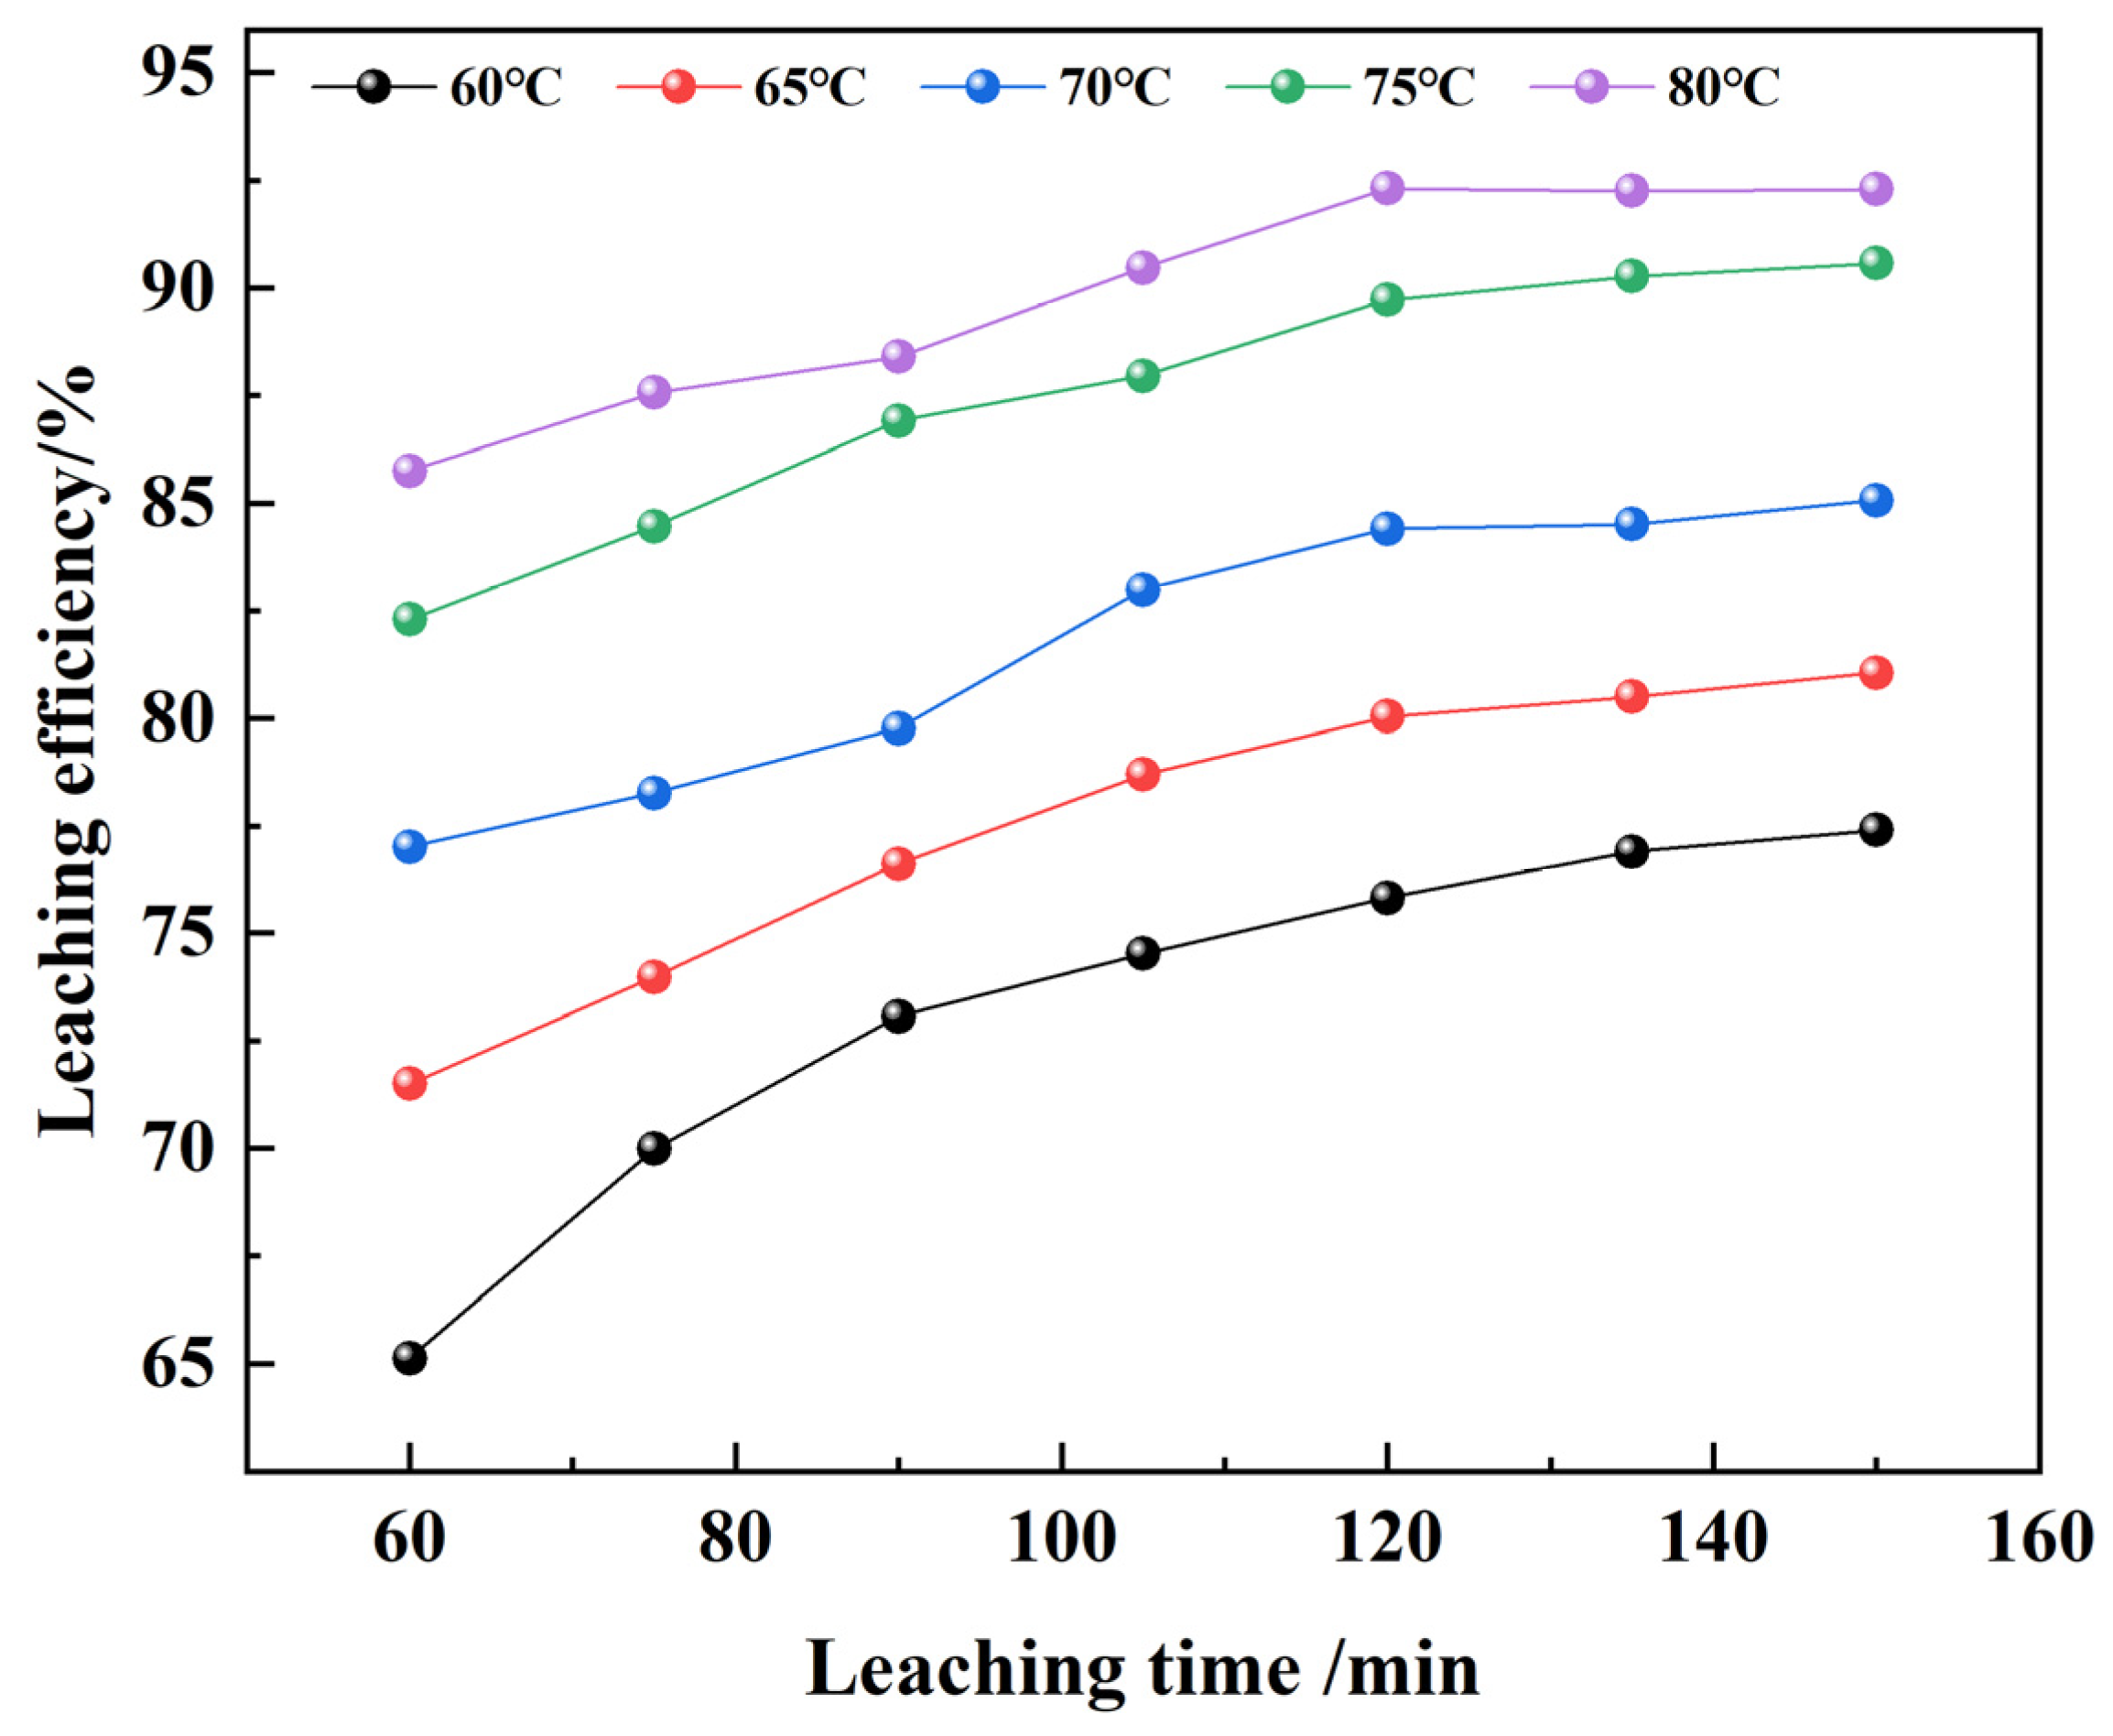
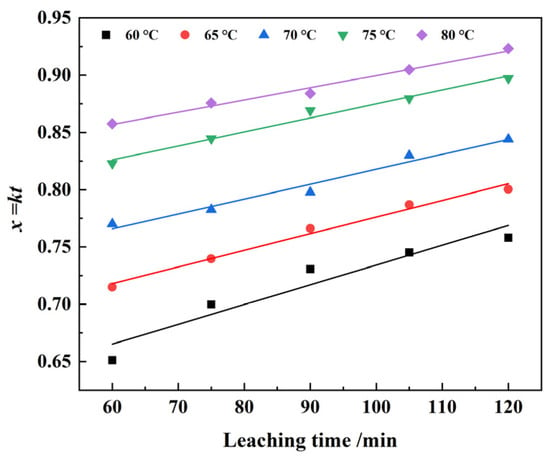
The results of the rare earth leaching experiments indicate that hydrochloric acid dosage, leaching time, leaching temperature, solid–liquid ratio, and stirring speed all influence the phosphorus leaching efficiency. Figure 18 illustrates the effect of leaching temperature on rare earth leaching efficiency at different leaching times during hydrochloric acid leaching. It can be observed that the rare earth leaching efficiency gradually increases with rising temperature and longer reaction times.
Figure 18.
Effect of reaction time and temperature on rare earth leaching.
Since the individual particles in the rare-earth-enriched residue mixture are approximately spherical, they conform to the characteristics of the shrinking core model. Therefore, the leaching process can be described using a shrinking core model with constant particle size. The corresponding kinetic equations are as follows:
(1) Fluid retention film diffusion control
(2) Chemical reaction control
(3) Diffusion control through the solid product layer
(4) Mixed Control
In the equation: x—REO leaching rate (%);
t—Leaching time (min);
k—Apparent reaction rate constant.
After identifying the controlling model of the reaction between rare earths and hydrochloric acid, the apparent activation energy of the reaction can be calculated using the Arrhenius Equation (10).
Taking the logarithm of both sides of Equation (10), we get:
In the equation: k: The apparent rate constant (min−1);
A: The pre-exponential factor (min−1);
Ea: The activation energy of the reaction (J/mol);
R: The molar gas constant, 8.314 J/(mol·k);
T: Thermodynamic temperature (K).
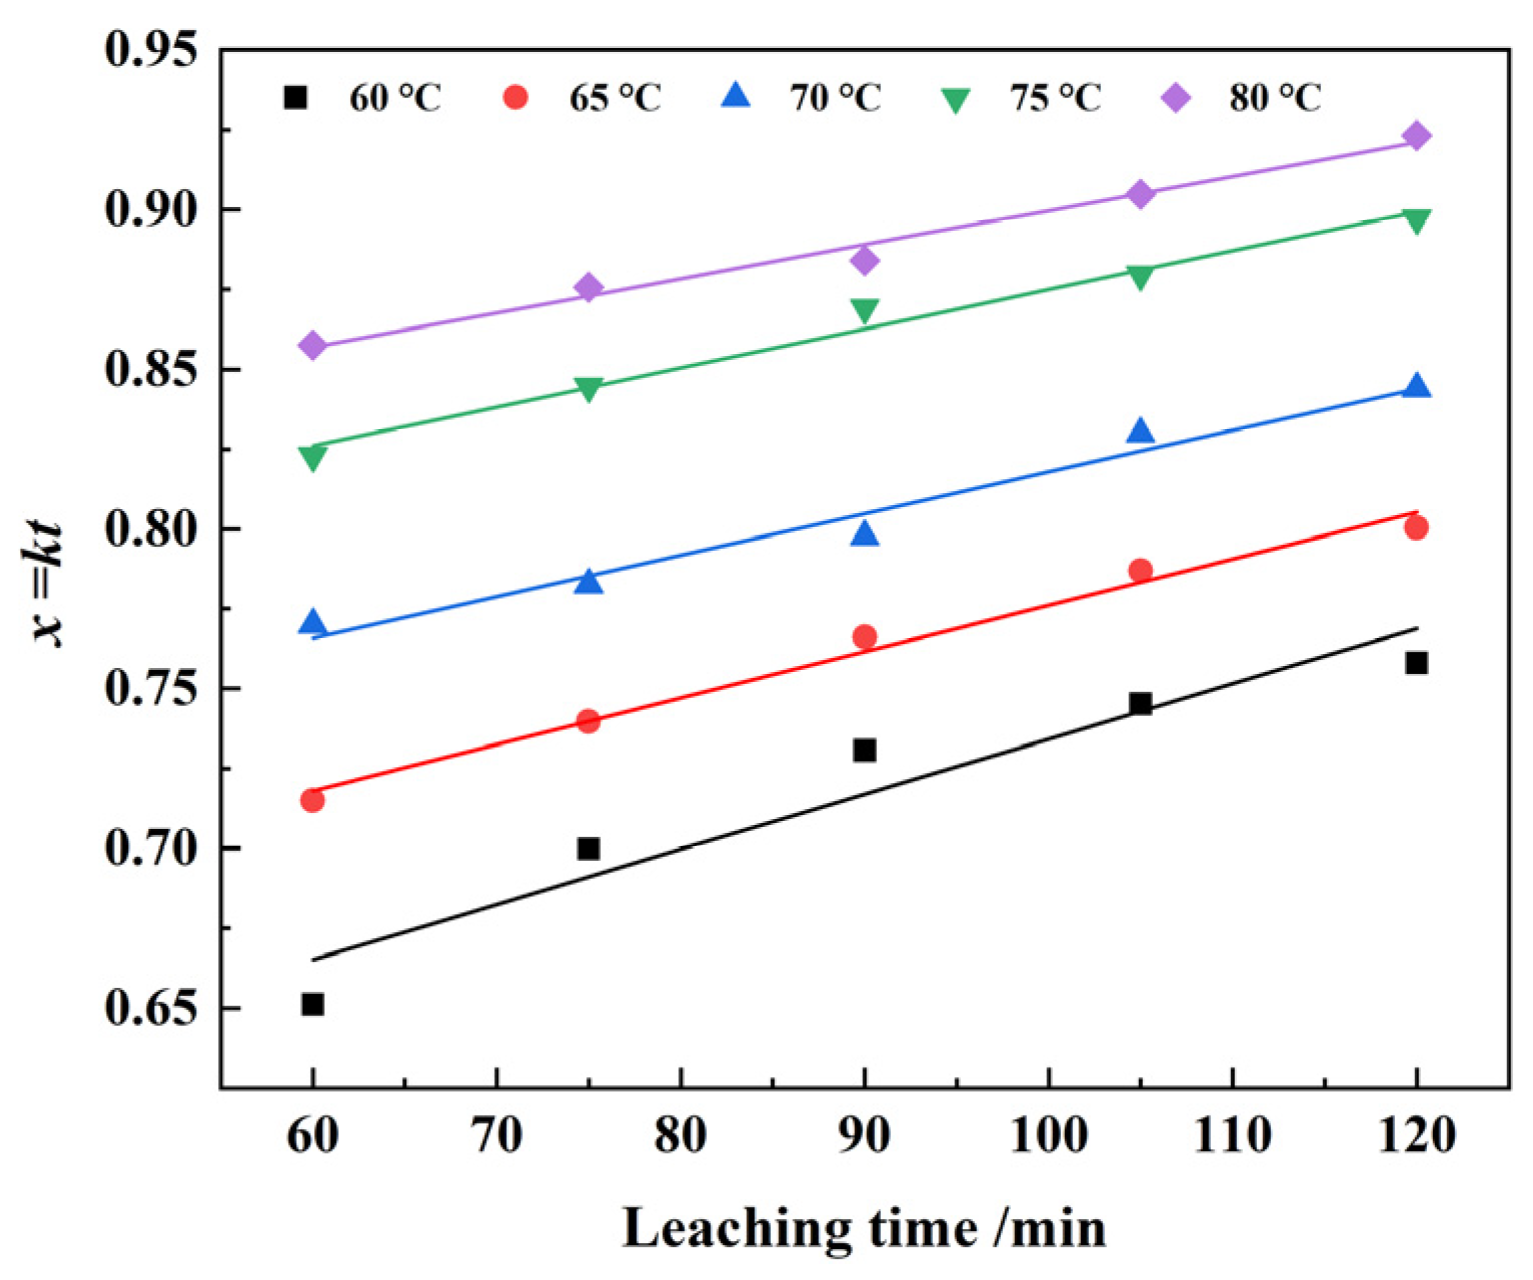
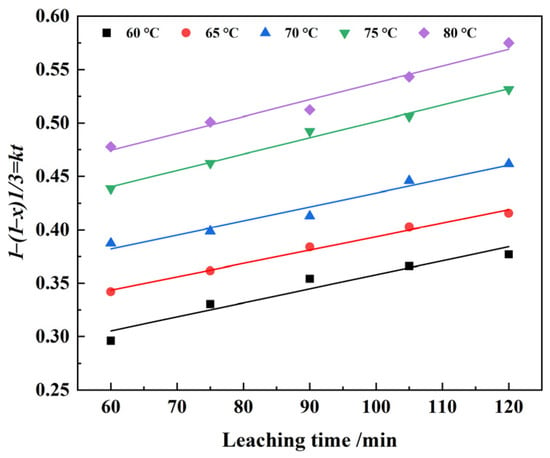
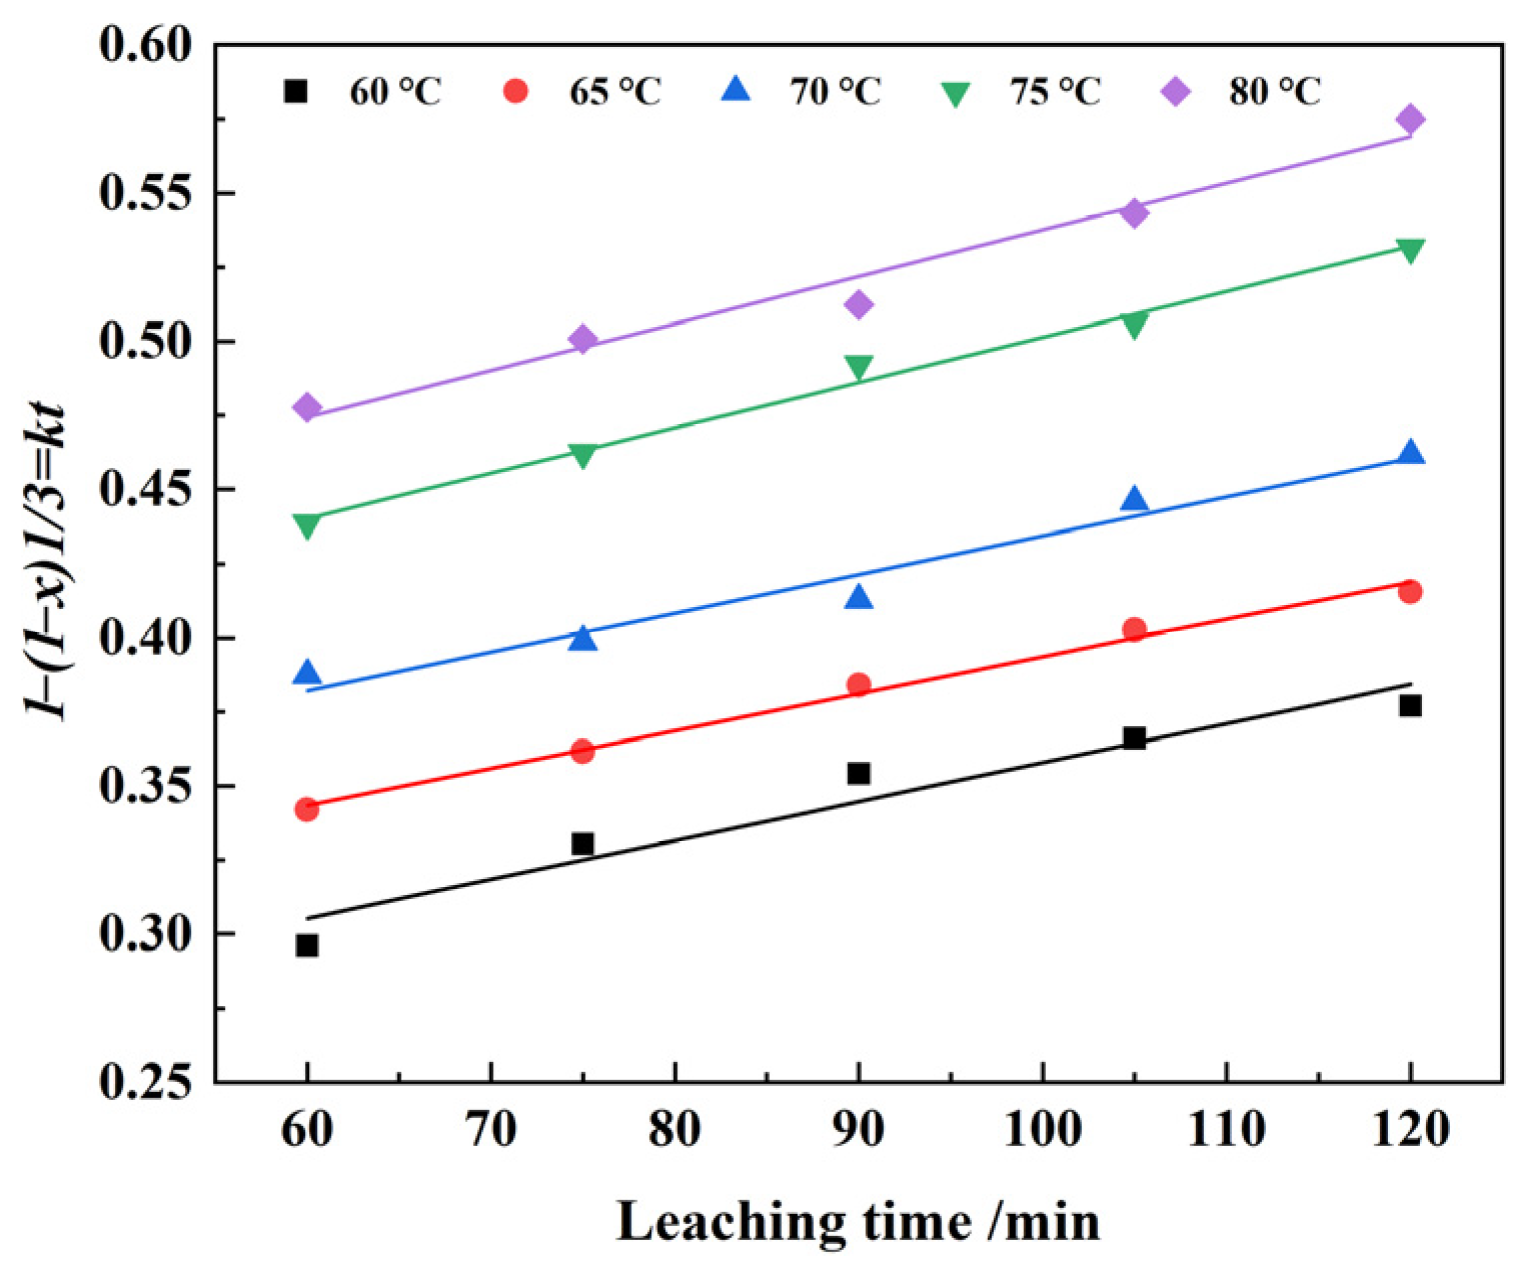
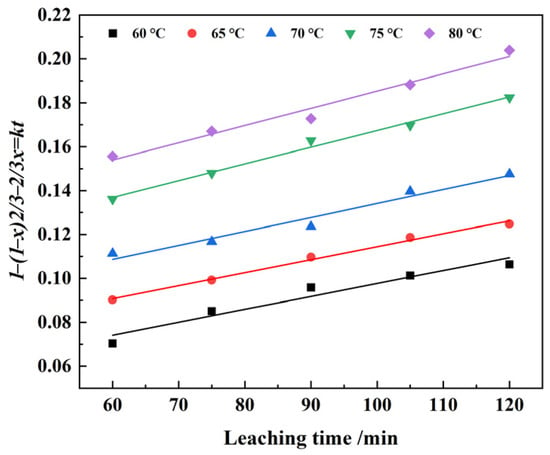
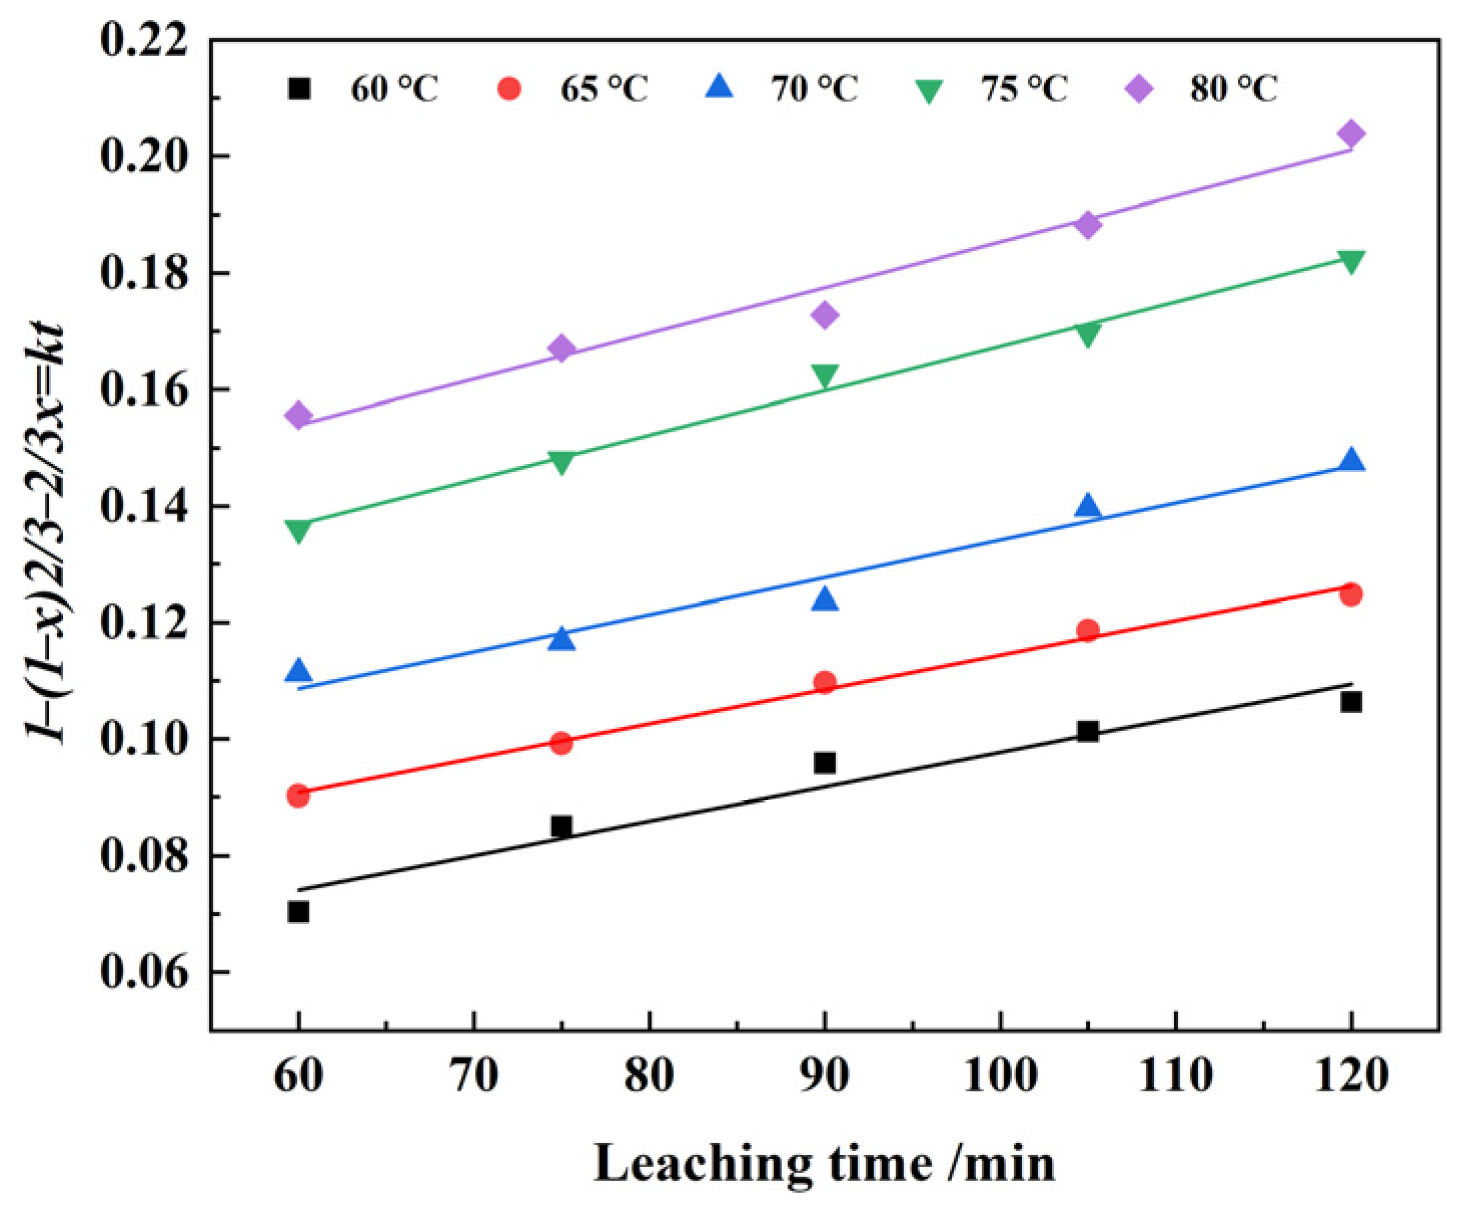
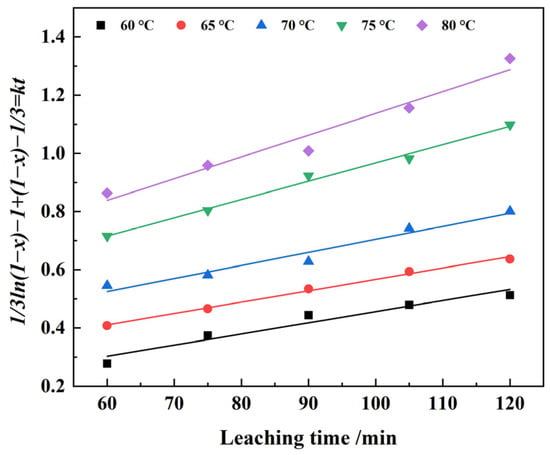
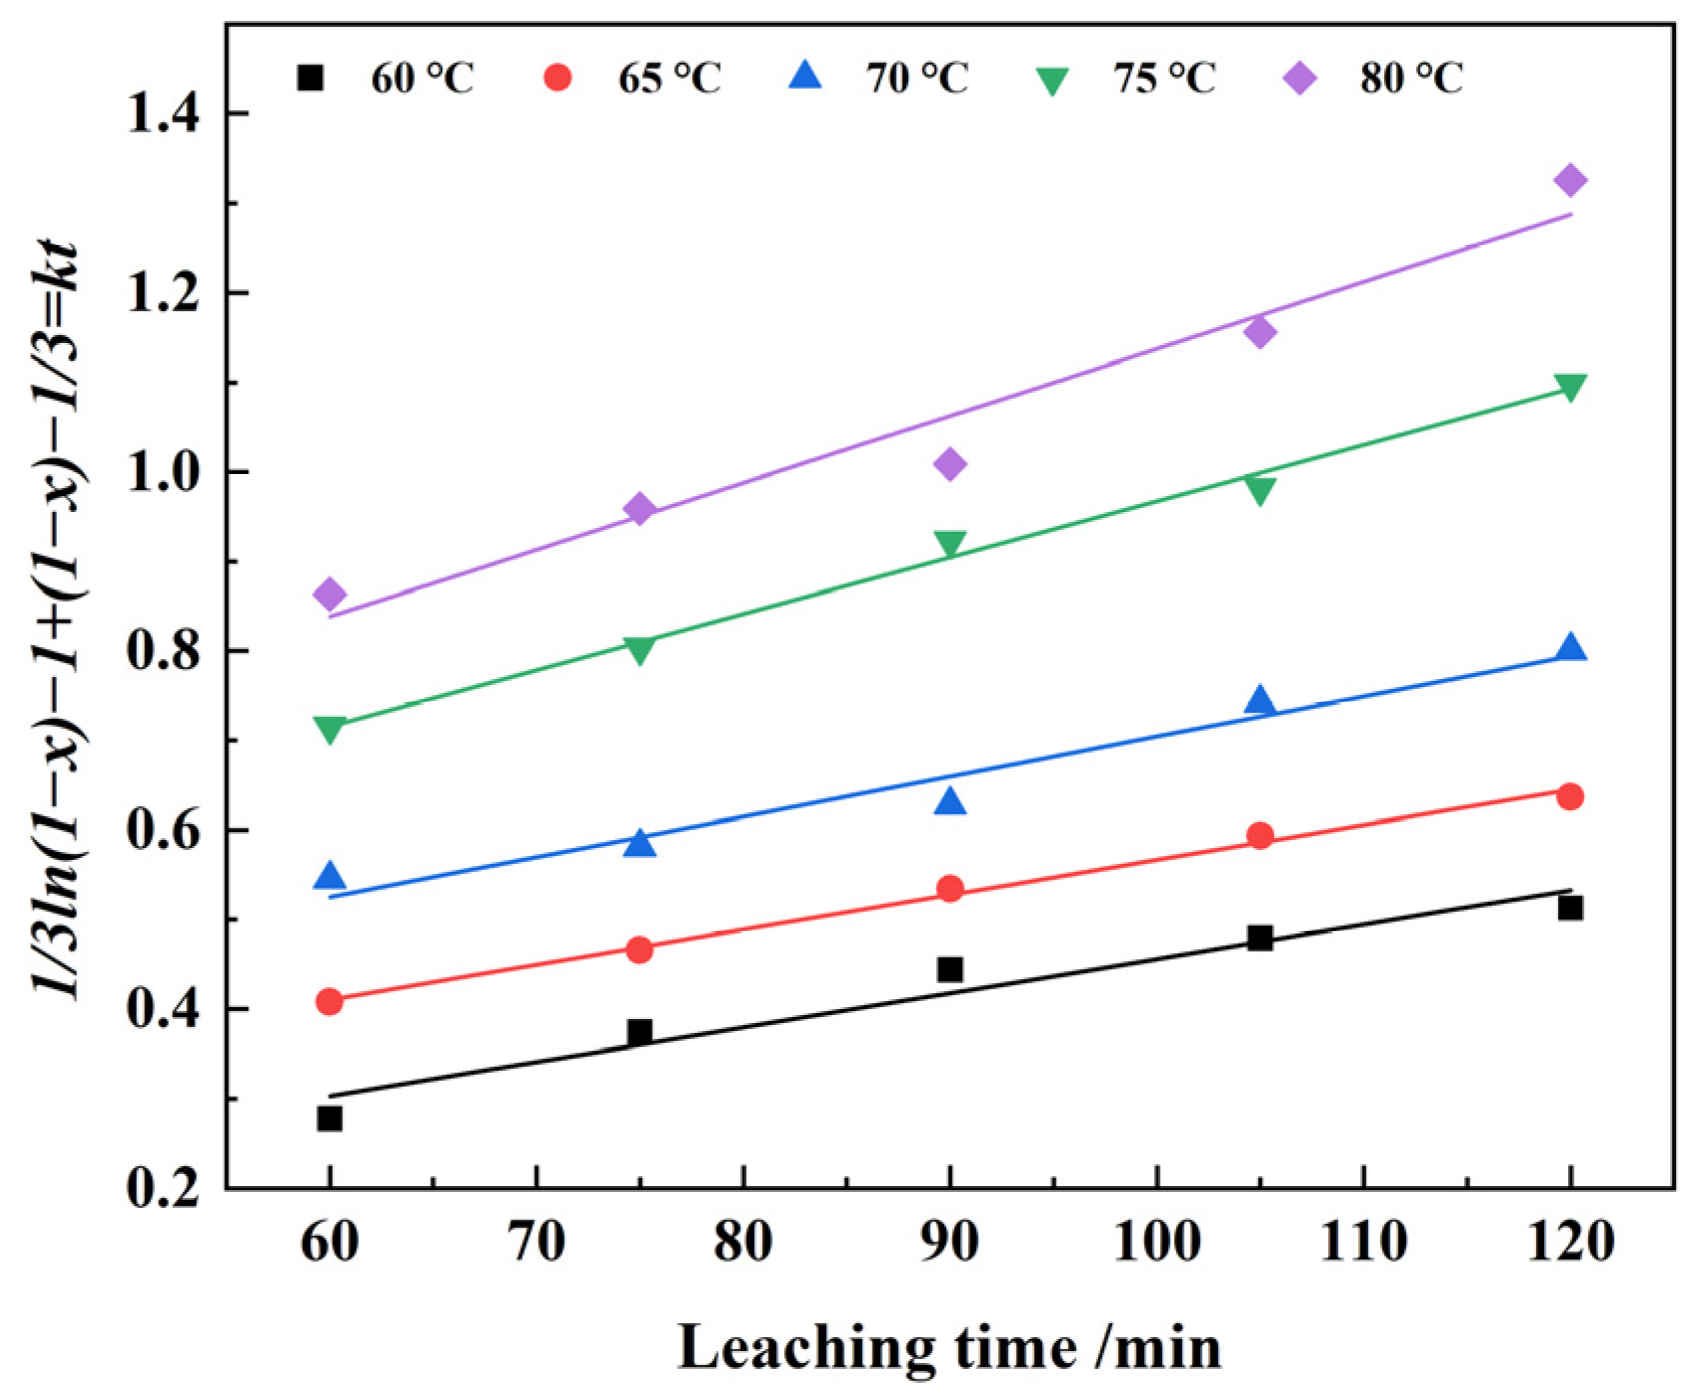
Based on the leaching reaction kinetic equations, the relationship between rare earth leaching efficiency and temperature was investigated under conditions of 160% theoretical hydrochloric acid dosage, a S/L ratio of 1:6, and a stirring speed of 500 r·min−1, at leaching temperatures of 60 °C, 65 °C, 70 °C, 75 °C, and 80 °C. Using three diffusion models, the data prior to reaction equilibrium (leaching time of 120 min) were fitted to Equations (6)–(9) to determine the kinetic model governing the reaction between rare earths and hydrochloric acid [41]. The results are shown in Figure 19, Figure 20, Figure 21 and Figure 22 and Table 3.
Figure 19.
Curve of the changing exponent in the fluid–film diffusion-controlled model.
Figure 20.
Variation curves of model exponents for the chemical reaction-controlled process.
Figure 21.
Variation curves of model exponents for the solid product layer diffusion-controlled process.
Figure 22.
Variation curves of model exponents for the mixed-control model.
Table 3.
Apparent rate constants and correlation coefficients of the rare earth leaching kinetic models.
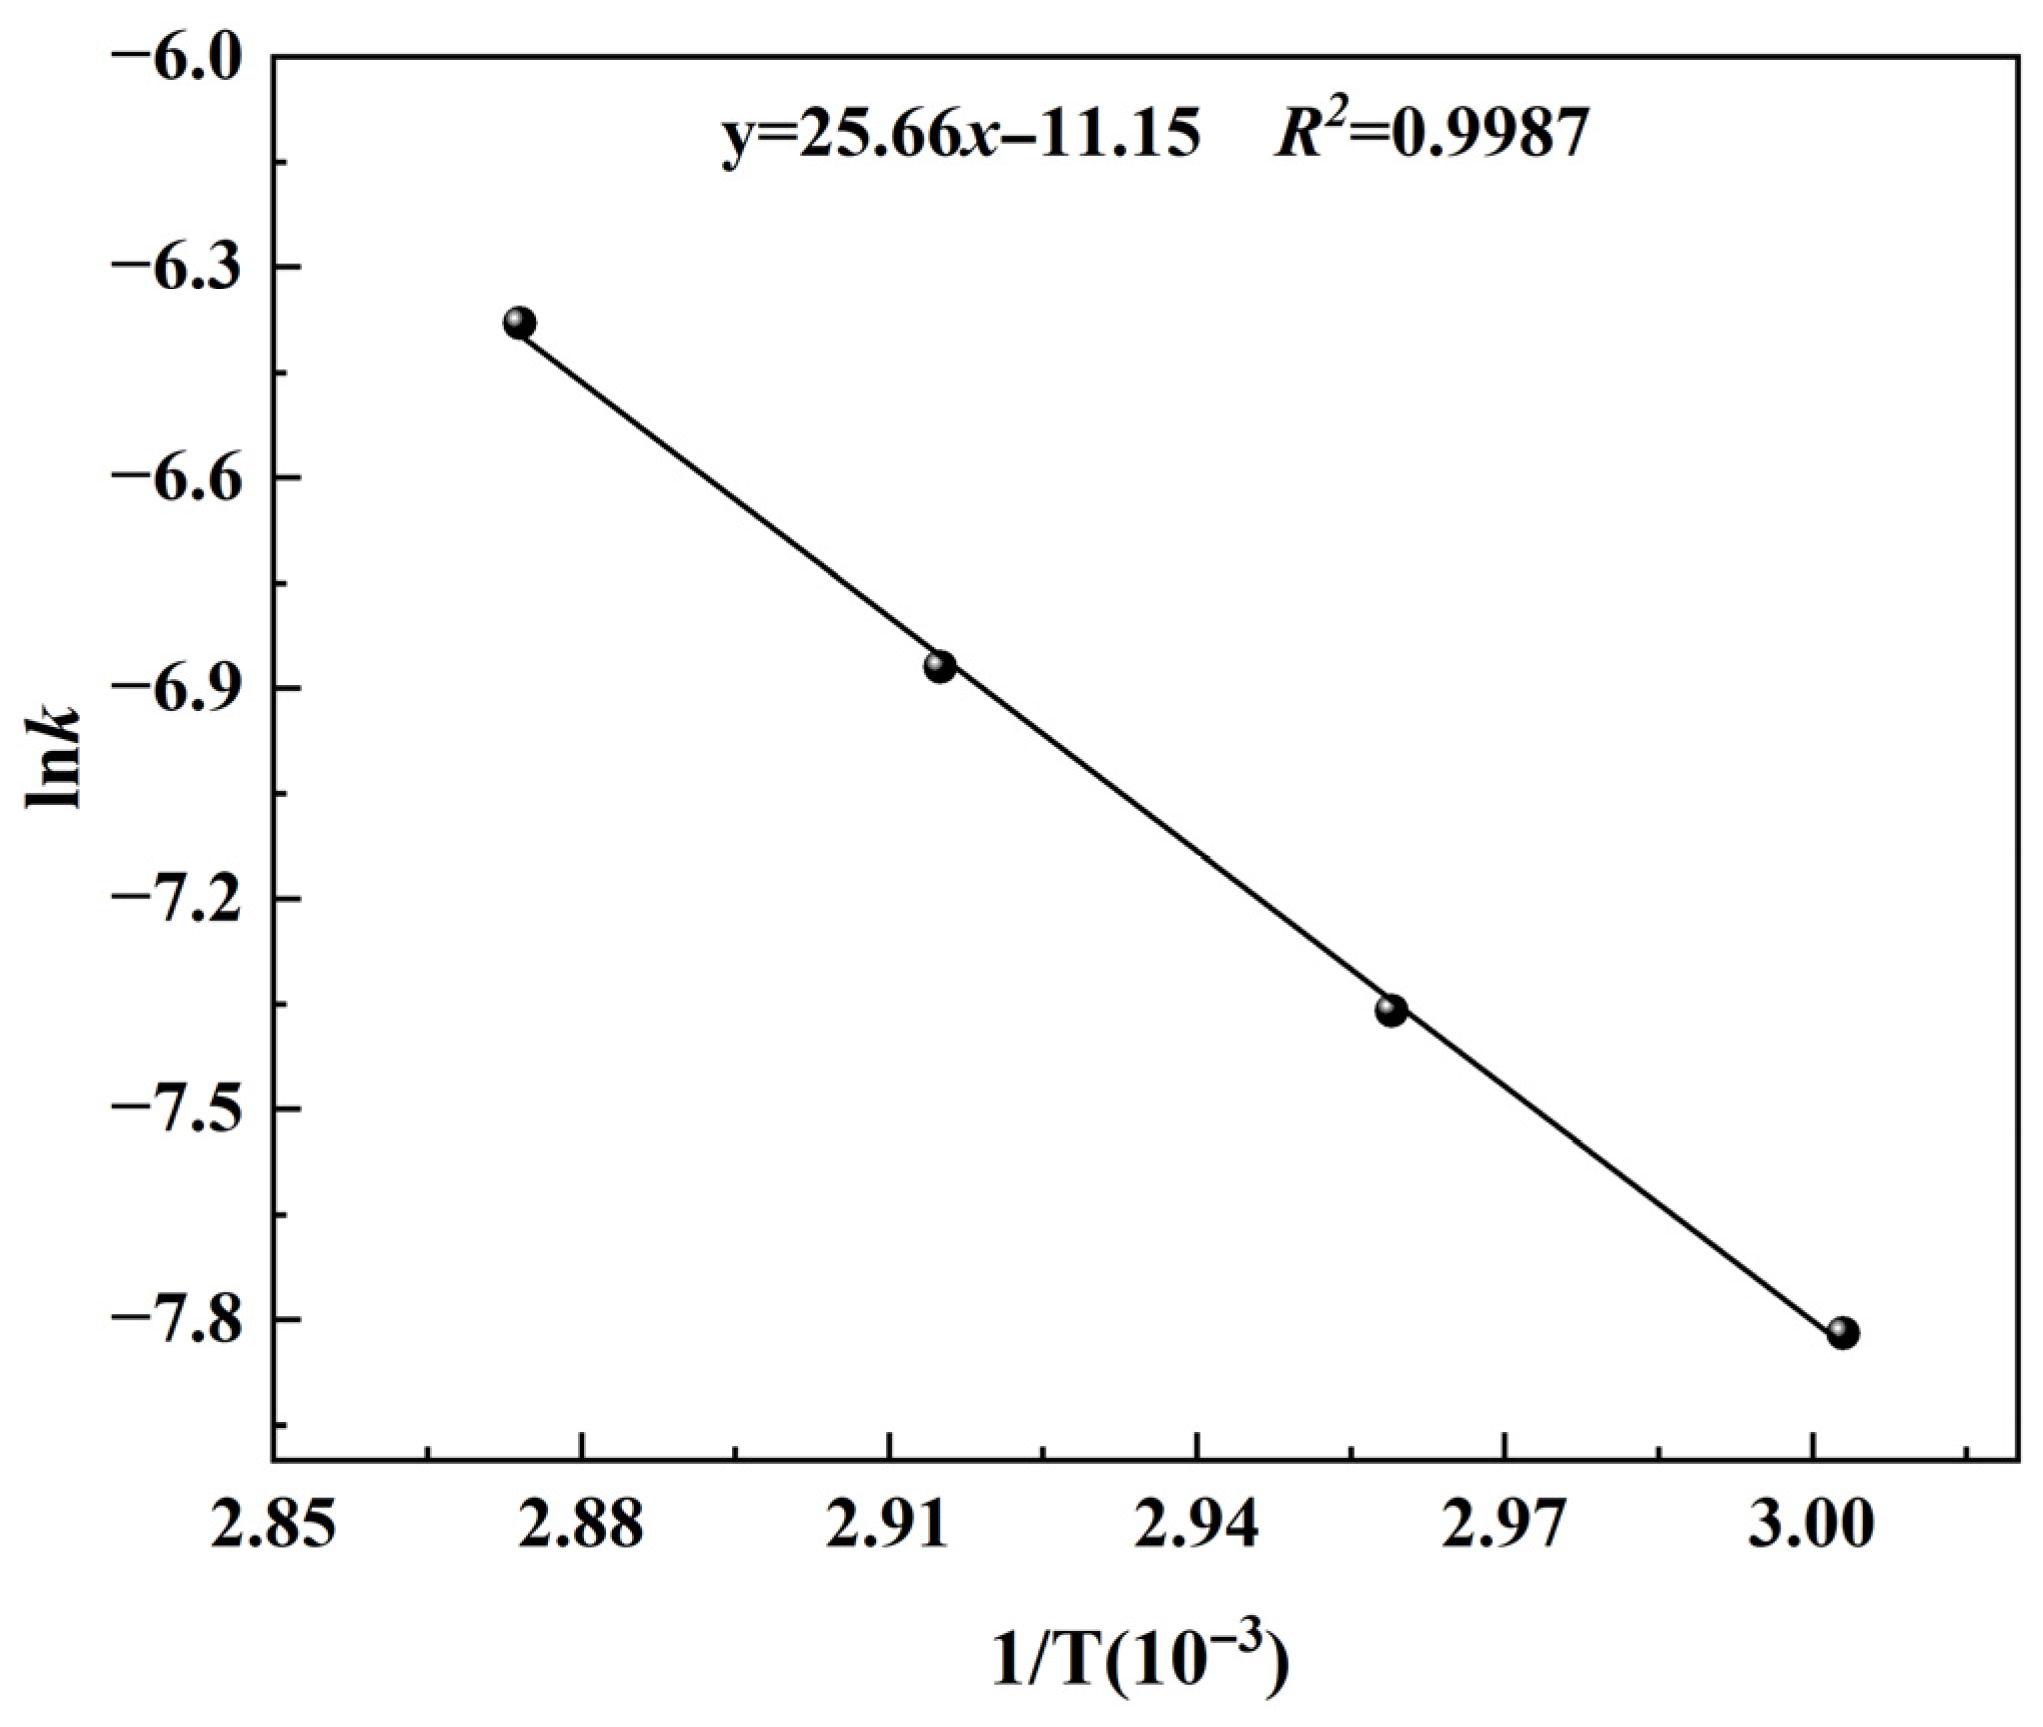
As shown in Table 3, the reaction is predominantly governed by mixed control. In the initial stage of hydrochloric acid leaching of the rare-earth-enriched residue, the acid comes into sufficient contact with the particle surface, and interfacial chemical reactions play a significant role in determining the leaching rate. As the reaction progresses, a dense product layer enriched in silica, calcium, or rare-earth-depleted phases gradually forms on the solid surface, resulting in a decline in the leaching rate over time [42]. Ions (H+, Cl−) must diffuse through this product layer to reach the unreacted core, and thus, diffusion increasingly imposes a limiting effect on the overall reaction rate [43,44]. At different leaching temperatures, the fitting relationship between the characteristic function 1/3 ln(1 − x) − 1 + (1 − x)−1/3 = kt and leaching time is presented in Figure 23, with the corresponding apparent rate constants k listed in Table 3.
Figure 23.
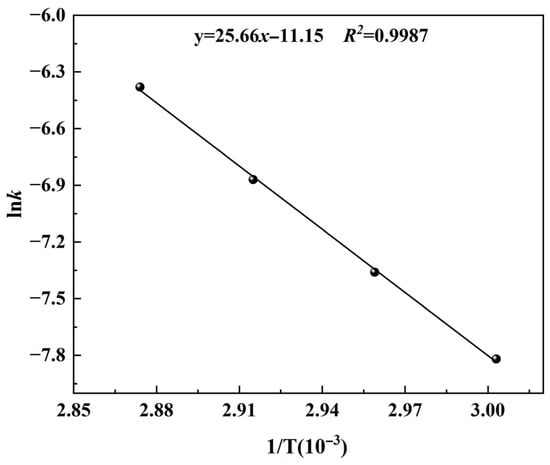
Arrhenius plot for rare earth elements.
By substituting the temperature and the corresponding rate constants into Equation (11), the Arrhenius plot can be obtained. Additionally, the relationship between lnk and 1/T at different hydrochloric acid leaching temperatures was fitted, and the results are shown in Figure 23.
The slope of the fitted straight line in the figure corresponds to −Ea/R, from which the apparent activation energy for rare earth leaching from the rare-earth-enriched residue was calculated to be 37.2 kJ·mol−1. This result indicates that the intraparticle diffusion-controlled product-layer model is well suited to describing the system. Comparison with previously reported reaction models and activation energies for rare earth leaching in hydrochloric acid media further confirms the consistency and reliability of the present findings [45,46,47]. The fitted line has a negative slope, and as the temperature increases, the rate constant k rises significantly, demonstrating that the leaching reaction is temperature-sensitive. Overall, the gradual thickening of the product layer increases the diffusion path, limiting the reaction rate. However, raising the temperature enhances diffusion, thereby improving overall leaching efficiency. Therefore, the rare earth leaching process of the residue by hydrochloric acid is primarily controlled by internal diffusion through the solid product layer, and the physical hindrance of this layer decisively affects the leaching rate. This provides a theoretical basis for subsequently enhancing leaching efficiency by increasing temperature, reducing product layer thickness, or intensifying stirring [48].
3.5. Response Surface Analysis of Rare Earth Leaching
Based on the single-factor leaching experiments, a five-factor, three-level Box–Behnken design was employed to achieve efficient extraction of rare earth elements from the enriched residue. The independent variables and their levels are listed in Table 4. This design systematically investigates the effects of key process parameters on rare earth leaching efficiency, providing a comprehensive basis for in-depth understanding and optimization of the leaching process.
Table 4.
Independent variable codes and their corresponding levels.
In the response surface experiments, the rare-earth-enriched residue was used as the raw material, and the rare earth leaching efficiency served as the response variable. Leaching temperature, leaching time, HCl dosage, solid–liquid ratio, and stirring speed were treated as independent variables to systematically investigate the effects of these five factors on rare earth leaching efficiency.
Based on the experimental data, a multivariate quadratic regression model was established relating rare earth leaching efficiency (R) to leaching temperature (A), leaching time (B), HCl dosage (C), solid–liquid ratio (D), and stirring speed (E). The equation is presented as Equation (12), with an adjusted coefficient of determination (adj R2) of 0.96, indicating a high degree of fit. This model can be used to analyze the significance of each factor on the rare earth leaching efficiency [49].
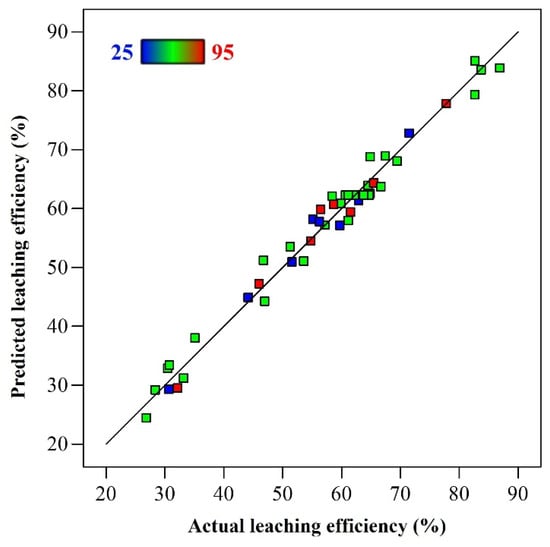
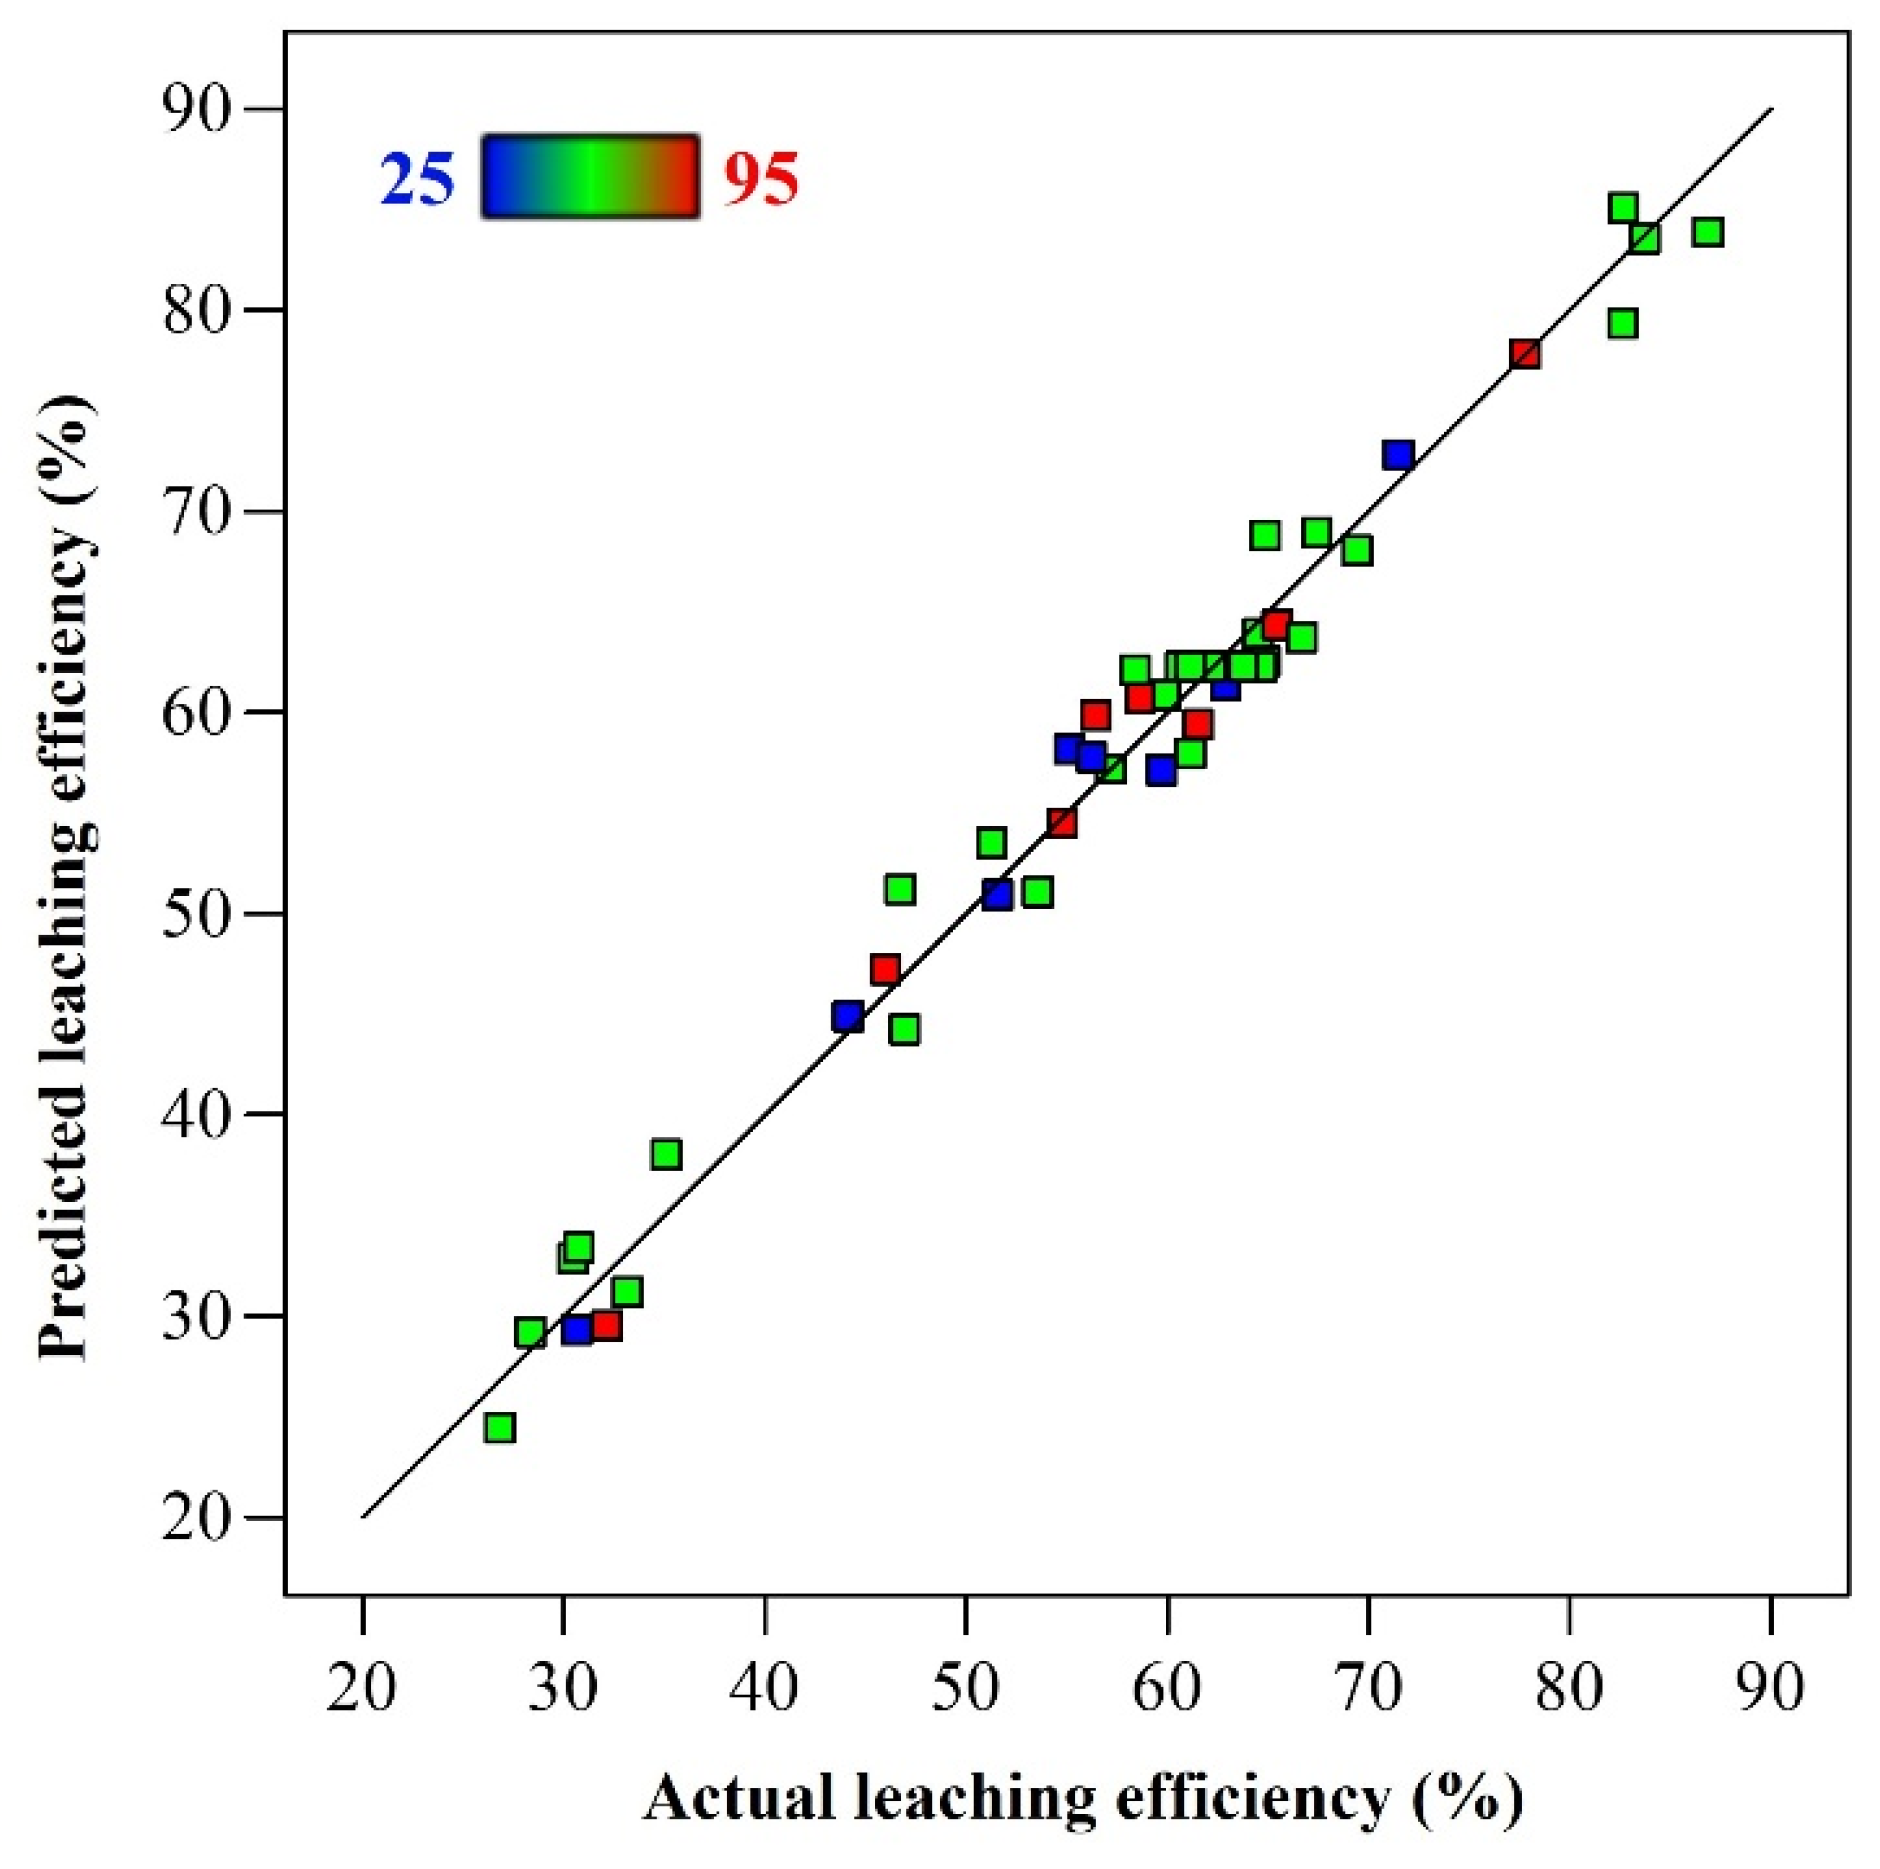
The relationship between the experimentally obtained rare earth leaching efficiencies and the values predicted by the multivariate quadratic regression model is shown in Figure 24. It can be observed that the experimental values are generally close to the predicted values, indicating a high degree of agreement. This demonstrates that the fitted multivariate quadratic regression model is both reasonable and highly accurate.
Figure 24.
Relationship between actual and predicted values of rare earth leaching rate.
Table 5 presents the analysis of variance (ANOVA) results for the multivariate quadratic regression model, indicating that the model is highly significant overall, with an F-value of 57.72. The difference between Adj R2 and Predi R2 is less than 0.2, and the signal-to-noise ratio (SNR) is 30.06, with only a 0.01% probability of abnormal SNR occurrence. Since the SNR exceeds 4, the model is considered valuable for prediction. The lack-of-fit term has an F-value of 3.79 and a p-value of 0.0725, indicating it is not significant and that the model contains no systematic error. Overall, the model fits well and can reliably describe the variation of the response variable [50,51].
Table 5.
Analysis of variance (ANOVA) results for the rare earth leaching rate model.
Among the main influencing factors, leaching temperature (A) contributes the most (F = 946.02, p < 0.0001), followed by leaching time (B, F = 77.97, p < 0.0001), stirring speed (E, F = 9.39, p = 0.0052), HCl dosage (C, F = 17.77, p = 0.0003), and solid–liquid ratio (D, F = 3.09, p = 0.0908). The quadratic terms A2, B2, and D2 are all highly significant (p < 0.0001), indicating obvious nonlinear saturation effects [52,53]. Significant interaction terms include AB (p = 0.0411) and AC (p = 0.0026), while the other interactions—AD, AE, BC, BD, BE, CD, CE, and DE—are not significant.
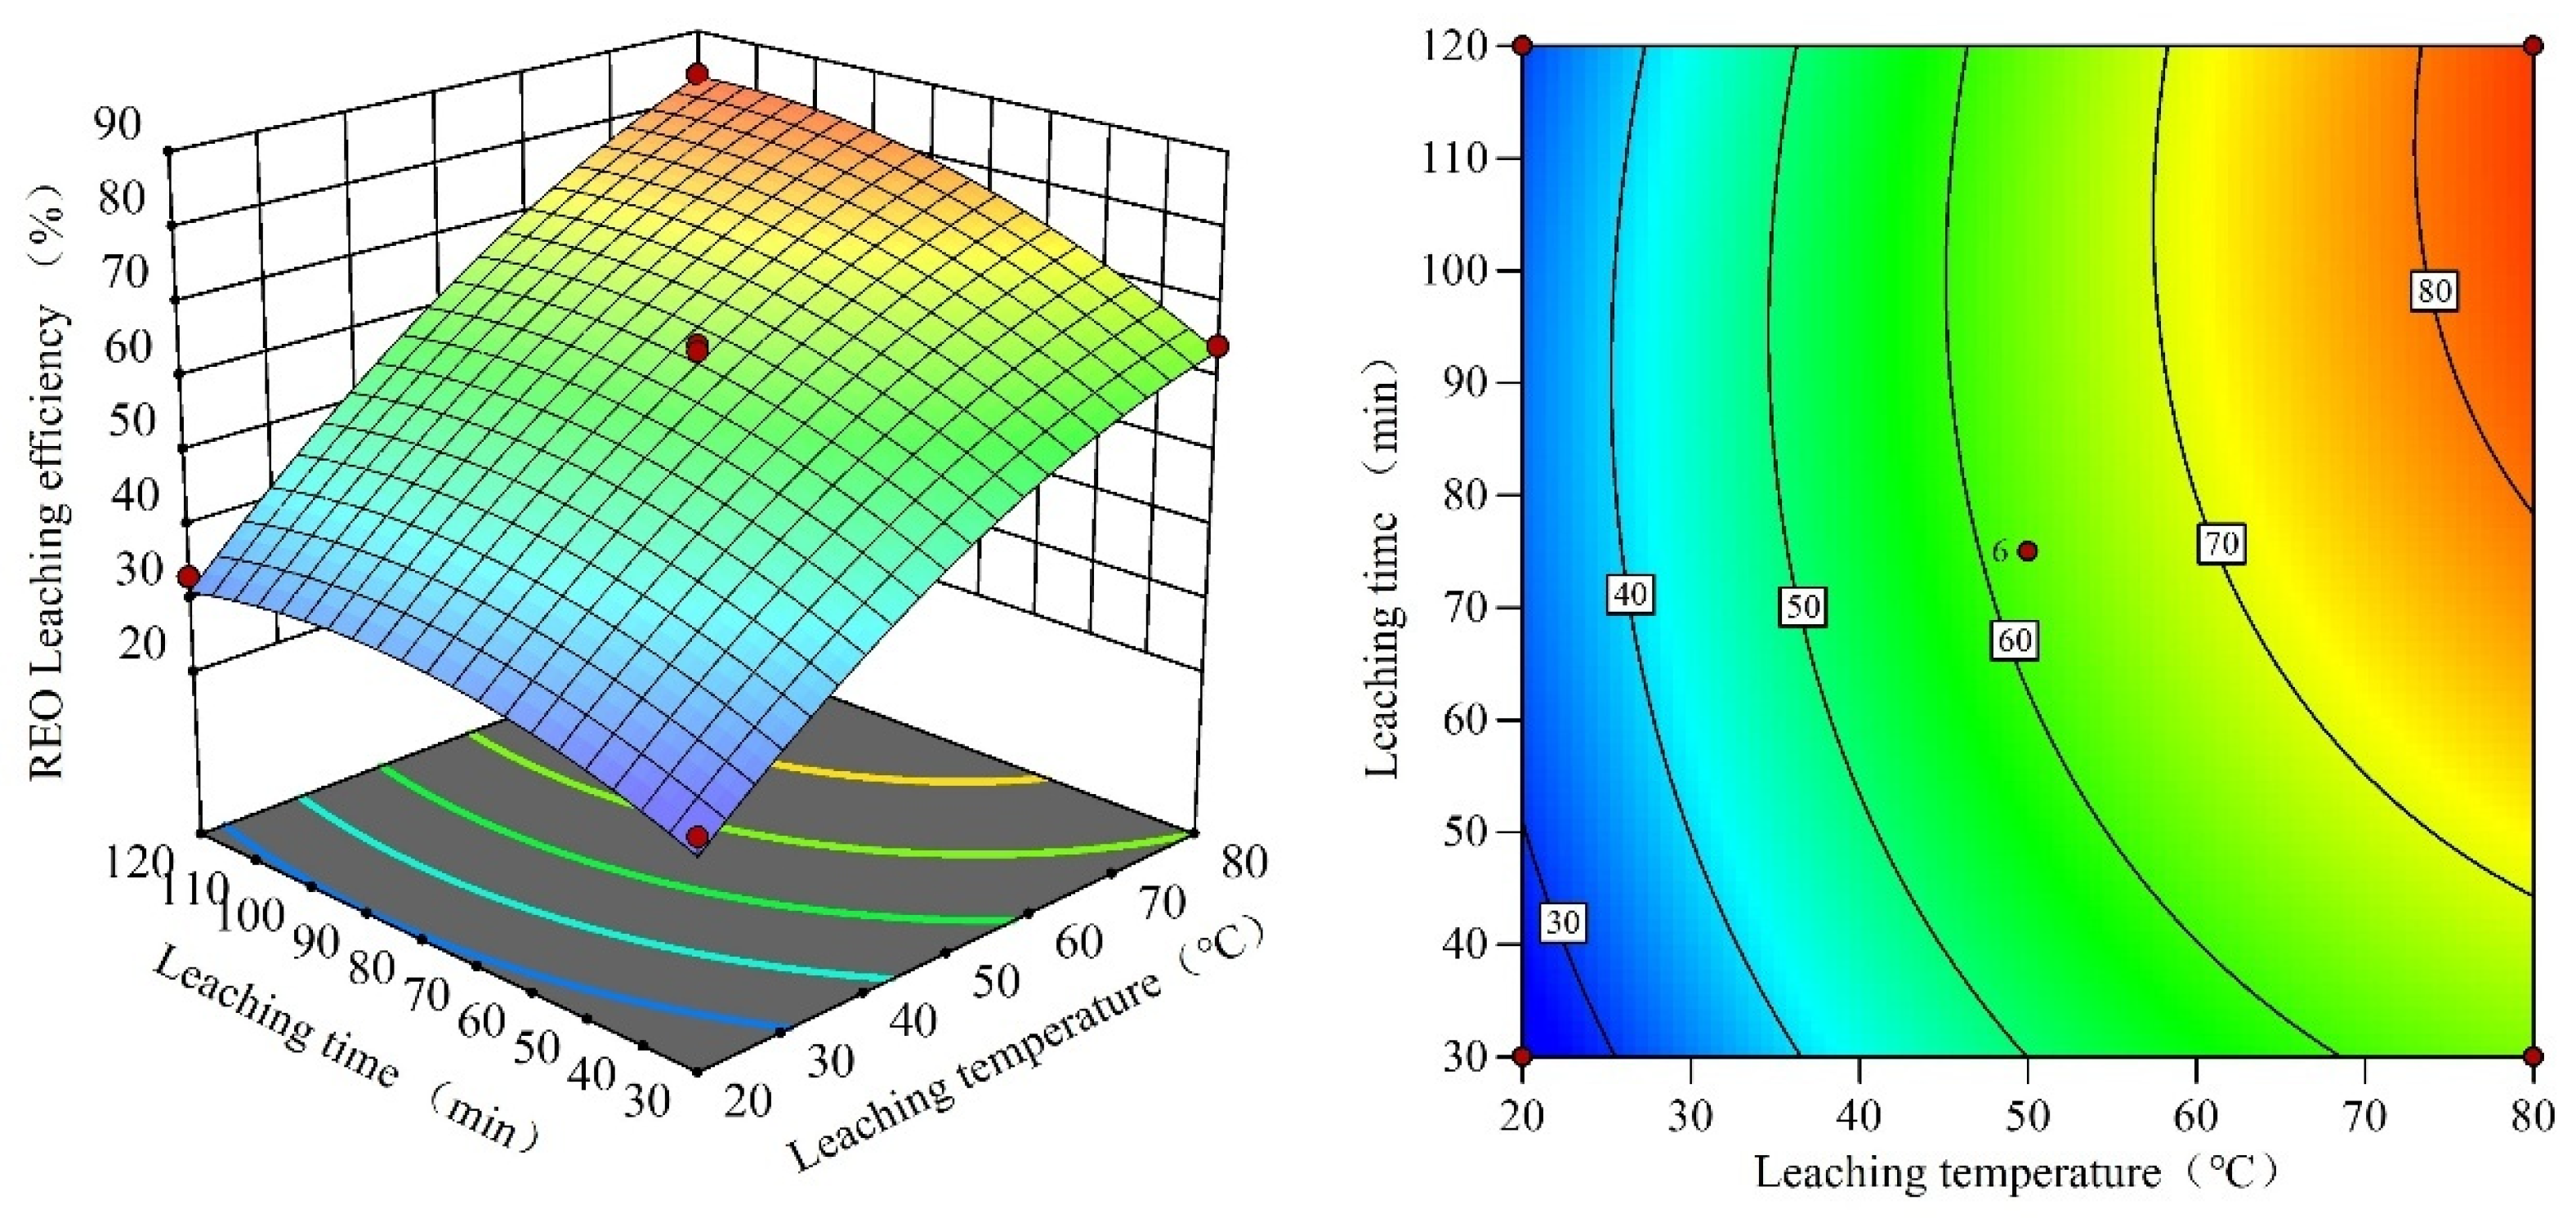
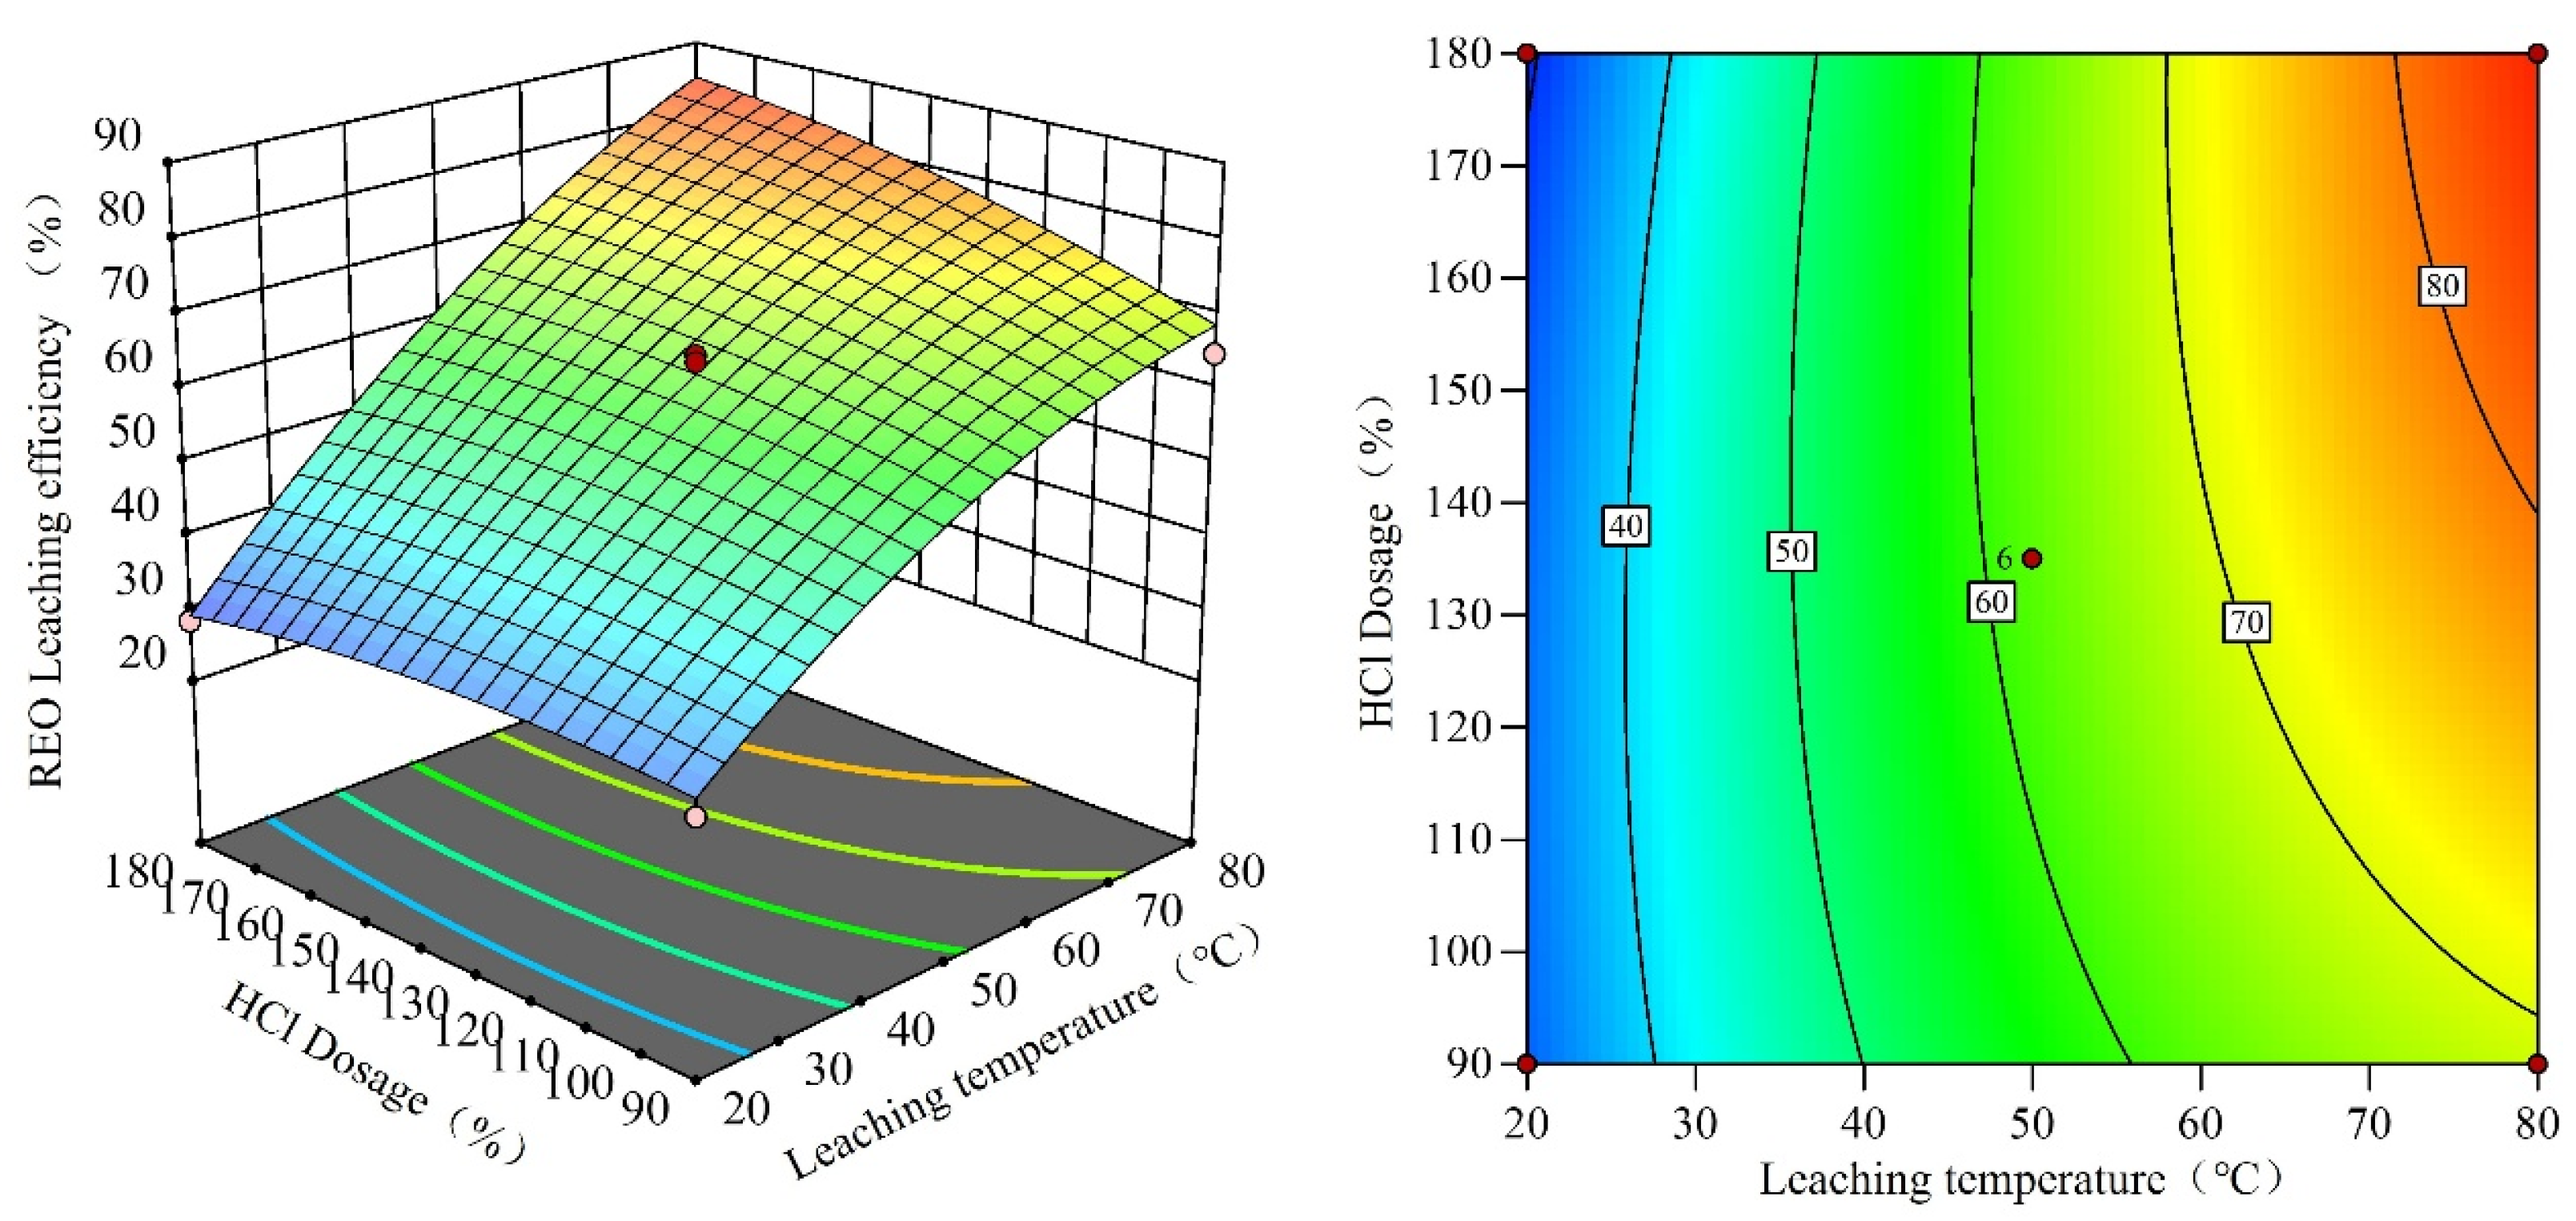
To further investigate the significance of the effects of leaching temperature, leaching time, HCl dosage, solid–liquid ratio, and stirring speed, as well as their interactions, on the rare earth leaching efficiency, three-dimensional response surface plots and corresponding two-dimensional contour plots describing the relationships between any two factors and the rare earth leaching rate were constructed based on Equation (12), as shown in Figure 25, Figure 26, Figure 27 and Figure 28.
Figure 25.
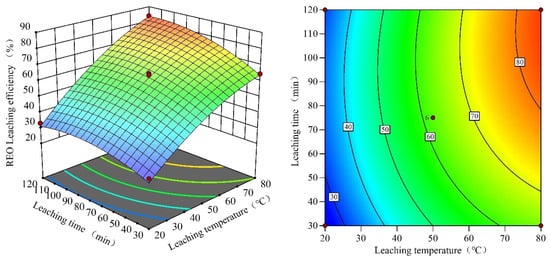
Response surface and contour plots of rare earth leaching efficiency with respect to leaching temperature and leaching time.
Figure 26.
Response surface and contour plots of rare earth leaching efficiency with respect to leaching temperature and HCl dosage.
Figure 27.
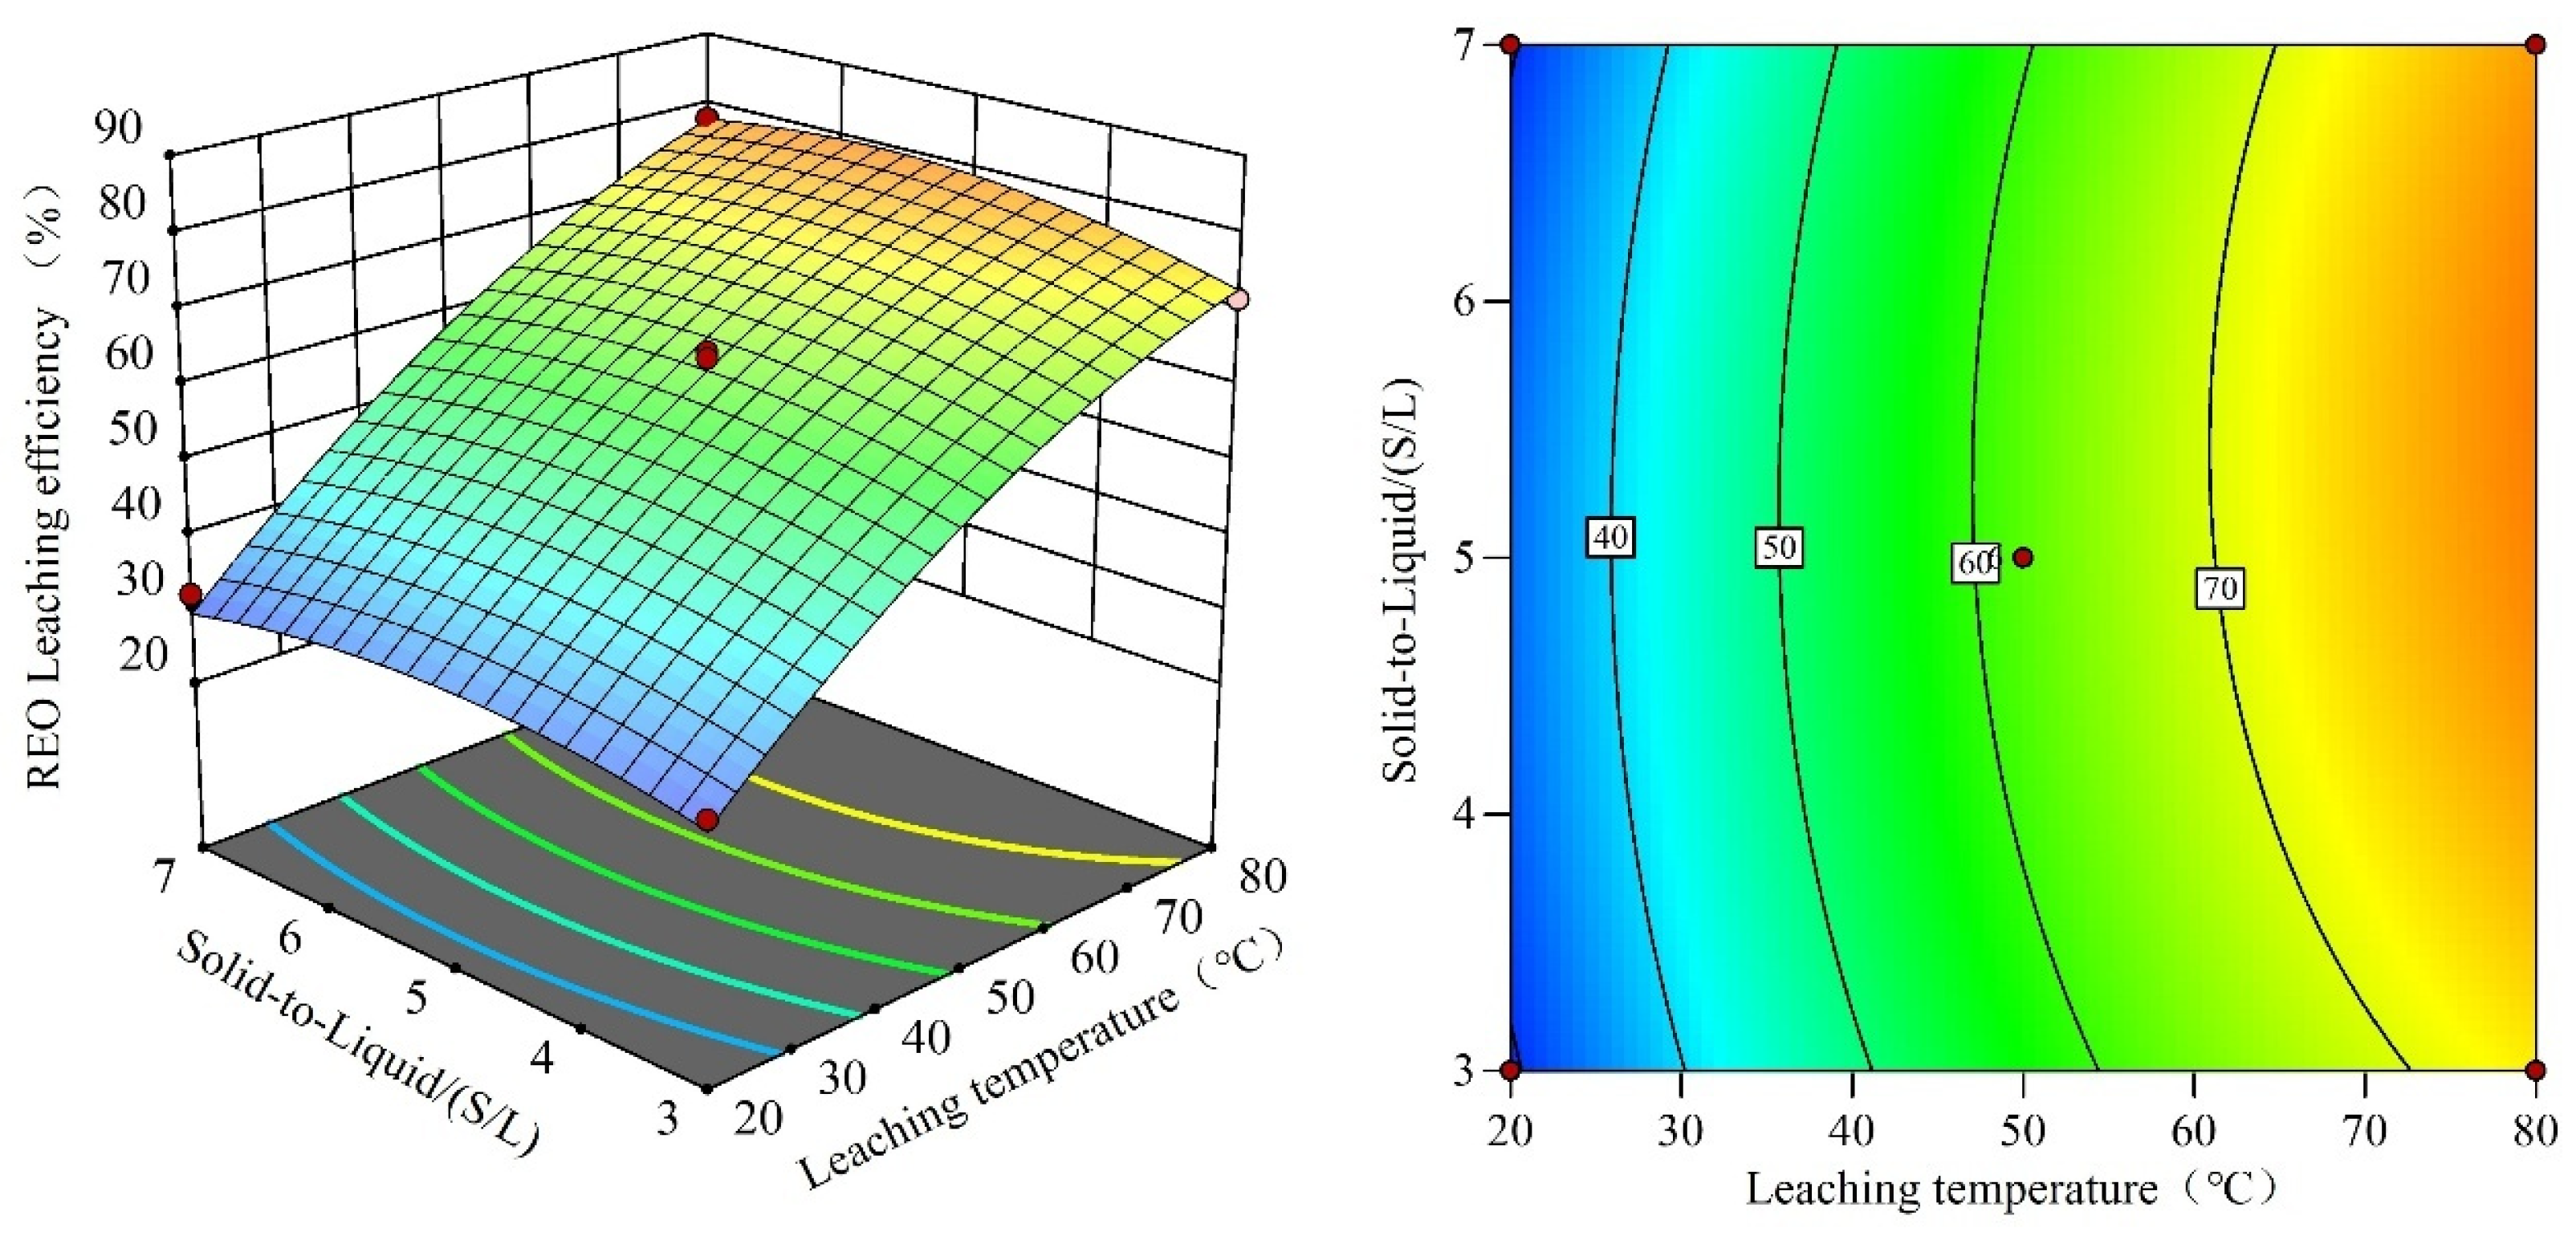
Response surface and contour plots of rare earth leaching efficiency with respect to leaching temperature and solid-to-liquid ratio.
Figure 28.
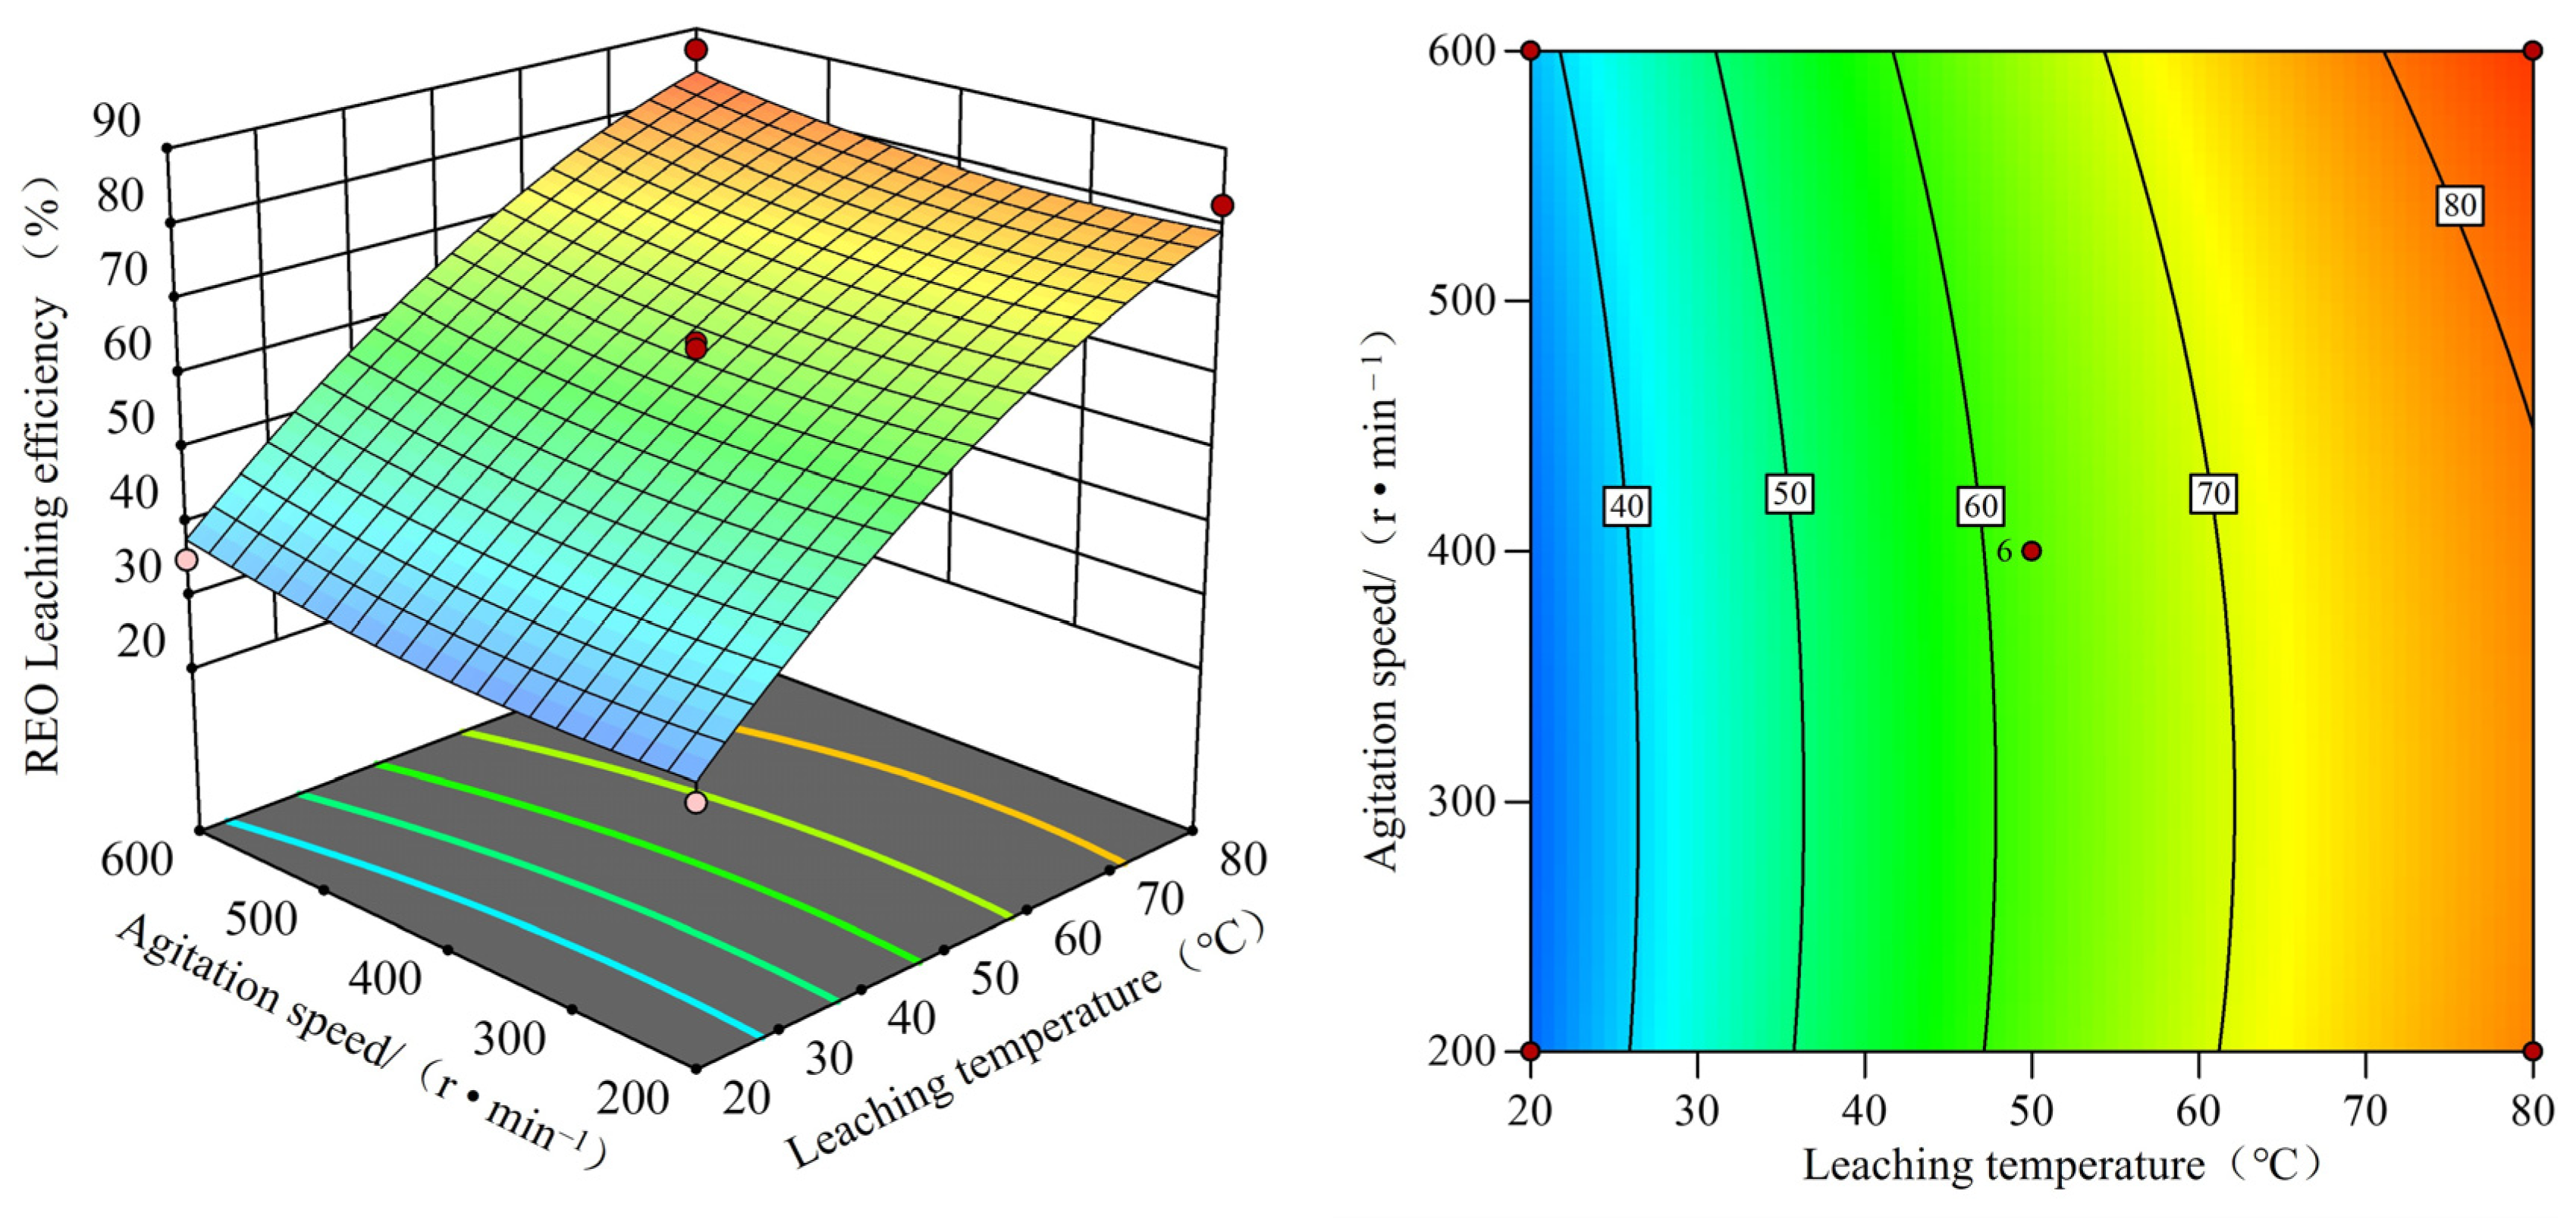
Response surface and contour plots of rare earth leaching efficiency with respect to leaching temperature and stirring speed.
As shown in Figure 25, the overall trend exhibits positive synergy, with the leaching efficiency of rare earth elements increasing markedly with both time and temperature. The elevation of temperature accelerates the dissolution rate of rare earth elements, and the synergistic interaction between leaching temperature and time effectively overcomes mass transfer limitations. Notably, rare earth leaching demonstrates a stronger dependence on leaching temperature. The response surface displays a nonlinear upward curvature, rising from the region of short leaching time and low temperature toward higher values, and reaching a maximum in the region of long leaching time and high temperature. This behavior indicates a strong positive interaction between temperature and time, whereby elevated temperature amplifies the effect of prolonged leaching time. The contour plots are elliptical and inclined toward the upper right, with sparse contours in the high-value region and dense contours in the low-value region. The moderate horizontal spacing suggests that variations in leaching time have a significant effect, while the relatively larger vertical spacing—becoming denser at longer leaching times—indicates that the positive effect of temperature is increasingly enhanced in this region.
As shown in Figure 26, the overall trend exhibits a positive synergistic effect: the rare earth leaching rate increases with increasing HCl dosage and leaching temperature. This indicates that an appropriate increase in HCl dosage promotes the dissolution of rare earth elements, while elevating the leaching temperature further enhances leaching efficiency. The response surface is inclined upward with an obvious curvature, suggesting the presence of a nonlinear interaction between HCl dosage and temperature. In the region of high HCl dosage and high temperature, the surface tends to become relatively flat, indicating that the increase in rare earth leaching rate gradually slows as these two factors continue to rise. Along the HCl dosage axis, the surface rises steeply, demonstrating that HCl dosage is the dominant factor. In contrast, the increase along the temperature axis is more moderate, indicating that the temperature effect is secondary but still significant. In the contour plot, the spacing between contour lines gradually increases from the lower-left to the upper-right region, and the contours are curved, confirming a nonlinear response. The contours are relatively dense in the horizontal direction, indicating that the rare earth leaching rate is highly sensitive to changes in HCl dosage, whereas they are comparatively sparse in the vertical direction, suggesting that the effect of temperature variation is milder.
As shown in Figure 27, the response surface exhibits a curved and downward-sloping trend from the high-value region (high solid-liquid ratio and high leaching temperature) to the low-value region (low solid-liquid ratio and low leaching temperature). Along the leaching temperature axis, the surface rises slowly, indicating that leaching temperature has a positive effect on the rare earth leaching rate; however, this effect is constrained by the solid–liquid ratio. This suggests that the solid–liquid ratio exerts a dominant negative influence, whereas leaching temperature plays a positive but secondary role. In the contour plot, the contour lines are distributed from the upper left to the lower right and show noticeable curvature, confirming the presence of nonlinear effects. The contours are closely spaced in the horizontal direction, indicating that the negative effect of the solid–liquid ratio is highly sensitive, while the wider spacing in the vertical direction implies that the positive effect of temperature variation is relatively mild.
As shown in Figure 28, the response surface appears as an upward-sloping plane with pronounced curvature, and it becomes relatively flat in the region of high stirring speed and high leaching temperature, indicating the presence of a nonlinear quadratic effect. Along the stirring speed axis, the surface rises steeply, demonstrating that stirring speed is the dominant positive factor; increasing the stirring speed enhances the mass transfer efficiency of rare earth elements. In contrast, along the temperature axis, the surface increases more gently, suggesting that temperature also exerts a positive effect, but to a lesser extent. In the contour plot, the contours are densely distributed from the lower left to the upper right and exhibit noticeable curvature, confirming a nonlinear response. The contour spacing is smaller in the horizontal direction and larger in the vertical direction, indicating that the rare earth leaching rate is more sensitive to changes in stirring speed, whereas its response to variations in leaching temperature is relatively mild.
In summary, based on the established quadratic regression model, the process parameters for rare earth leaching were numerically optimized. The optimal conditions were determined to be a leaching temperature of 80 °C, a leaching time of 117.84 min, a hydrochloric acid dosage of 180% of the theoretical requirement, a S/L ratio of 1:5.54, and a stirring rate of 600 r·min−1. Under these conditions, the predicted rare earth leaching efficiency reaches 95.39%. These results indicate that appropriately prolonging the leaching time and ensuring a sufficient hydrochloric acid dosage are conducive to enhancing the leaching efficiency of rare earth elements. Meanwhile, increasing the stirring rate strengthens mass transfer, thereby facilitating more efficient rare earth extraction.
4. Conclusions
This study focuses on the rare-earth-enriched residue generated during the hydrochloric acid processing of rare-earth-bearing phosphate ores for phosphoric acid production. The occurrence characteristics, hydrochloric acid leaching behavior, and kinetic mechanisms of rare earth elements were systematically investigated. The principal conclusions are as follows:
(1) Process mineralogical analysis indicated that rare earth elements in the rare-earth-enriched residue occur mainly in an isomorphous substitution state within residual fluorapatite and CaF2, with no independent rare earth mineral phases identified. The incorporation of rare earth elements induces a certain degree of lattice distortion in CaF2; however, the overall crystal structure remains stable, with a lattice spacing of 0.26 nm.
(2) Hydrochloric acid leaching experiments demonstrated that leaching temperature, hydrochloric acid dosage, and leaching time are the primary factors affecting rare earth leaching efficiency. Under the optimal leaching conditions, the rare earth leaching efficiency reached 92.69%, while the leaching efficiency of residual P2O5 was 98.28%.
(3) Kinetic analysis indicates that the leaching of rare earth elements in the hydrochloric acid system conforms to the shrinking-core model, with the reaction rate governed by a mixed-control mechanism. The apparent activation energy was determined to be 35.34 kJ·mol−1. This suggests that, in the initial stage of the reaction, interfacial chemical reactions play a significant role in controlling the leaching rate; as the reaction progresses, diffusion gradually becomes the dominant rate-limiting step.
(4) A response surface model was established to describe the relationship between rare earth leaching efficiency and the principal process parameters. The model exhibits a signal-to-noise ratio of 30.06, indicating strong reliability and practical significance. Based on this model, the optimal process conditions were determined to be a leaching temperature of 80 °C, a leaching time of 117.84 min, a hydrochloric acid dosage of 180% of the theoretical requirement, a S/L ratio of 1:5.54, and a stirring rate of 600 r·min−1. Under these conditions, the model predicts a rare earth leaching efficiency of 95.39%, demonstrating the model’s robust predictive capability and its value for process optimization.
Author Contributions
J.L.: Investigation, data curation, conceptualization, writing—review & editing; J.K.: Resources, writing—review & editing, funding acquisition; C.S.: Resources, writing—review & editing; H.X.: Data curation, validation; X.W.: Data curation, investigation. All authors have read and agreed to the published version of the manuscript.
Funding
This research was supported by the National Key R&D Program (No. 2021YFC2901703).
Data Availability Statement
The original contributions presented in this study are included in the article. Further inquiries can be directed to the corresponding authors.
Conflicts of Interest
There are no conflicts of interest associated with this study.
References
- Liu, S.L.; Fan, H.R.; Liu, X.; Meng, J.Y.; Butcher, A.R.; Yann, L.; Yang, K.F.; Li, X.C. Global rare earth elements projects: New developments and supply chains. Ore Geol. Rev. 2023, 157, 105428. [Google Scholar] [CrossRef] [Scilit]
- U.S. Geological Survey. Mineral Commodity Summaries 2024; U.S. Geological Survey: Reston, VA, USA, 2024.
- Yan, C.H.; Huang, X. Progress of rare earth science and technology in 2024. J. Rare Earths 2025, 43, 2029–2052. [Google Scholar] [CrossRef] [Scilit]
- Depraiter, L.; Goutte, S.; Porcher, T. Geopolitical risk and the global supply of rare earth permanent magnets: Insights from China’s export trends. Energy Econ. 2025, 146, 108496. [Google Scholar] [CrossRef] [Scilit]
- Chanturia, V.A.; Nikolaev, A.I.; Aleksandrova, T.N. Innovative environmentally safe processes for the extraction of rare and rare-earth elements from complex ores of perplexed material composition. Geol. Ore Depos. 2023, 65, 425–437. [Google Scholar] [CrossRef] [Scilit]
- Bai, J.J.; Xu, X.; Duan, Y.T.; Zhang, G.Y.; Wang, Z.; Wang, L.; Zheng, C.L. Evaluation of resource and environmental carrying capacity in rare earth mining areas in China. Sci. Rep. 2022, 12, 6105. [Google Scholar] [CrossRef] [Scilit]
- Huang, X.W.; Li, H.W.; Wang, C.F.; Wang, G.Z.; Xue, X.X.; Zhang, G.C. Development status and research progress in rare earth industry in China. Rare Met. 2007, 31, 279–288. [Google Scholar]
- Wang, X.; Wang, Y.Y.; Yu, C.B.; Kang, J.X. Progress in beneficiation processes and flotation collectors for rare earth ores. China Mine Eng. 2020, 49, 73–76. [Google Scholar] [CrossRef] [Scilit]
- Zhou, Z.; Xiong, W.L.; Zhang, L.J.; Chen, D.; Xue, H.J.; Ouyang, A.N. Experimental Study on the Recovery of Rare Earth from a Low Grade Rare Earth Tailings in Sichuan. Multipurp. Util. Miner. Resour. 2023, 4, 66–70. [Google Scholar]
- Qin, Y.F.; Li, N.; Ma, Y.; Wang, Q.W. Preferential flotation of rare earths from iron beneficiation tailings of Bayan Obo deposit. Min. Metall. 2021, 30, 32–37. [Google Scholar]
- Xing, J.Q.; Zhang, Z.Y.; Xian, H.Y.; Jiang, Y.H.; Liang, X.L.; Tan, W.; Niu, H.C.; He, H.P.; Zhu, J.X. Enrichment mechanisms, occurrence state and utilization potential of rare earth elements in Zhijin phosphorite, Guizhou Province. Bull. Mineral. Petrol. Geochem. 2022, 41, 505–516. [Google Scholar]
- Ministry of Natural Resources of the People’s Republic of China. China Mineral Resources Report 2024; Geological Publishing House: Beijing, China, 2024. [Google Scholar]
- Ministry of Natural Resources of the People’s Republic of China. National Mineral Resources Reserves Statistics 2022; Geological Publishing House: Beijing, China, 2024. [Google Scholar]
- Wang, M.; Sun, X.M.; Ma, M.Y. Rare earth element compositions and genesis of the Xinhua large-scale phosphorite deposit in western Guizhou, China. J. Rare Earths 2005, 23, 323–330. [Google Scholar]
- Chen, J.Y.; Yang, R.D. Rare earth element geochemistry of Cambrian phosphorites from the Yangtze Region. J. Rare Earths 2013, 31, 101–112. [Google Scholar] [CrossRef] [Scilit]
- Yang, Z.; Zhang, J.; Fu, Y. Polymetallic mineralization in early Cambrian black shale: Insights from Guizhou, South China. Ore Geol. Rev. 2025, 180, 105004. [Google Scholar] [CrossRef] [Scilit]
- Wang, M.; Xie, H.; Wang, C.J.; Li, Z.; Yang, C.L.; Wang, Y.H. Enrichment process of phosphorite-type REY based on structural and geochemical features of the Zhijin Xinhua phosphorite, China. Sci. Rep. 2025, 15, 22218. [Google Scholar] [CrossRef] [Scilit] [PubMed]
- Xie, Y.L.; Qin, X.Y.; Dai, Z.W.; Geng, Z.Y. Types and resource potential of associated rare earth element resources in China. J. Geomech. 2024, 30, 723–746. [Google Scholar]
- Chen, M.Z.; Fu, Y.; Xia, Y.; Xie, Z.J.; Zhou, K.L.; Zhang, P. Resource prospect of phosphorite-type rare earth deposits in China. Acta Mineral. Sin. 2019, 39, 345–358. [Google Scholar] [CrossRef]
- Wang, A.Q.; Zhang, J.; Yang, L. Occurrence state of rare earth elements in rare earth-bearing phosphorite from Zhijin, Guizhou Province. J. Rare Earths 2019, 40, 40–46. [Google Scholar]
- Chen, W.X.; Zhou, F.; Wang, H.Q.; Zhou, S.; Yan, C.J. Occurrence states of rare earth elements in phosphorite ores and rare earth enrichment through selective reverse flotation. Minerals 2019, 9, 698. [Google Scholar] [CrossRef] [Scilit]
- Xie, J.; Zhang, Q.; Mao, S. Occurrence state of yttrium in phosphorite from Zhijin, Guizhou Province. J. Guizhou Univ. Nat. Sci. 2020, 37, 41–47. [Google Scholar]
- Xie, J.; Wang, C.; Zhang, Q.; Min, F.F. Occurrence state, occupying sites and coordination structure of rare earth elements in phosphorite. J. Rare Earths 2024, 43, 2016–2028. [Google Scholar] [CrossRef] [Scilit]
- Yang, H.Y.; Zhao, Z.F.; Xia, Y.; Xiao, J.F. REY enrichment mechanisms in early Cambrian phosphorite from South China. Sediment. Geol. 2021, 426, 106041. [Google Scholar] [CrossRef] [Scilit]
- Hu, T.W.; Wang, L.M.; Cao, C.; Zhang, W.B. Research Progress on Smelting and Separation Technologies of Rare Earth Resources in China. Conserv. Util. Miner. Resour. 2020, 40, 151–161. [Google Scholar]
- Xie, D.Y.; Fu, C.P.; Tang, Z.Y.; Liu, X.H. Current Status of Rare Earth Resources in China and Progress in Smelting Technologies. Conserv. Util. Miner. Resour. 2021, 41, 152–160. [Google Scholar]
- Qing, J.L.; Zhao, D.P.; Zeng, L.; Zhang, G.Q.; Zhou, L.; Du, J.W.; Li, Q.G.; Cao, Z.Y.; Wu, S.X. Comprehensive recovery of rare earth elements and gypsum from phosphogypsum: A wastewater-free process combining gravity separation and hydrometallurgy. J. Rare Earths 2025, 43, 362–370. [Google Scholar] [CrossRef] [Scilit]
- Walawalkar, M.; Nichol, C.K.; Azimi, G. Acid leaching of rare earth elements from phosphogypsum using HCl, HNO3 and H2SO4. Hydrometallurgy 2016, 166, 195–204. [Google Scholar] [CrossRef] [Scilit]
- Rashad, A.M. Phosphogypsum as a construction material. J. Clean. Prod. 2017, 166, 732–743. [Google Scholar] [CrossRef] [Scilit]
- Masmoudi-Soussi, A.; Hammas-Nasri, I.; Horchani-Naifer, K.; Férid, M. Rare earth leaching after hydrothermal conversion of phosphogypsum. Chem. Afr. 2019, 2, 415–422. [Google Scholar] [CrossRef] [Scilit]
- Ait Hak, S.; Sraidi, A.; Khaless, K.; Benhida, R. Two-step leaching process for recovery of rare earths from Moroccan phosphogypsum. J. Clean. Prod. 2023, 427, 138976. [Google Scholar] [CrossRef] [Scilit]
- Bandara, A.; Senanayake, G. Leachability of rare-earth and calcium ions from fluorapatite in acidic media. Hydrometallurgy 2015, 153, 179–189. [Google Scholar] [CrossRef] [Scilit]
- Wu, P.Z. Wet-Process Phosphoric Acid; Chemical Industry Press: Beijing, China, 1987. [Google Scholar]
- Wu, S.X.; Wang, L.S.; Zhao, L.S.; Zhang, P.; El-Shall, H.; Moudgil, B.; Huang, X.W.; Zhang, L.F. Recovery of rare earth elements from phosphate rock by hydrometallurgical processes: A critical review. Chem. Eng. J. 2018, 335, 774–800. [Google Scholar] [CrossRef] [Scilit]
- Janbandhu, K.S.; Pawade, V.B.; Pethe, A.M.; Dhoble, S.J. Solvothermal synthesis of lanthanide-doped CaF2 upconversion nanoparticles. Sci. Rep. 2025, 15, 34517. [Google Scholar] [CrossRef] [Scilit]
- Sorokin, N.I. Relationship between lattice parameters and cation radius in rare-earth oxofluorides with fluorite structure. Crystallogr. Rep. 2025, 70, 892–896. [Google Scholar] [CrossRef] [Scilit]
- Horsburgh, N.J.; Finch, A.A.; Friis, H. Lanthanide and yttrium substitution in natural fluorite. Phys. Chem. Miner. 2023, 50, 15. [Google Scholar] [CrossRef] [Scilit]
- Kempe, U.; Plötze, M.; Brachmann, A.; Böttcher, R. Stabilisation of divalent rare earth elements in natural fluorite. Mineral. Petrol. 2002, 76, 213–234. [Google Scholar] [CrossRef]
- Jiang, W.; Gao, Z.Y.; Sun, W.; Gao, J.D.; Hu, Y.H. Effect of lattice impurities on electronic structure and reactivity of fluorite: A DFT study. Minerals 2017, 7, 160. [Google Scholar] [CrossRef] [Scilit]
- Nie, D. Occurrence State of Rare Earth Elements in Rare-Earth-Rich Phosphate Ore from Zhijin, Guizhou and Their Behavior during Acid and Thermal Decomposition. Ph.D. Thesis, Guizhou University, Guiyang, China, 2018. [Google Scholar]
- Abdulvaliyev, R.; Utarakova, A.; Mukangaliyeva, A.; Lokhova, N.; Kassymzhanov, K. Comparative analysis of acid leaching for the efficient recovery of lanthanum and cerium from phosphate. Separations 2024, 11, 288. [Google Scholar] [CrossRef] [Scilit]
- van Wyk, P.; Bradshaw, S.; Dorfling, C.; Ghosh, T.; Akdogan, G. Characterisation and hydrochloric acid leaching of rare earth elements in discard coal and coal fly ash. Minerals 2024, 14, 1070. [Google Scholar] [CrossRef] [Scilit]
- Baigenzhenov, O.S.; Chepushtanova, T.A.; Altmyshbayeva, A.Z.; Temirgali, I.A.; Maldybayev, G.; Sharipov, R.H.; Altaibayev, B.T.; Dagubayeva, A.T. Investigation of thermodynamic and kinetic regularities of asbestos waste leaching processes. Results Eng. 2024, 21, 102000. [Google Scholar] [CrossRef] [Scilit]
- Ait Brahim, J.; Ait Hak, S.; Achiou, B.; Boulif, R.; Beniazza, R.; Benhida, R. Kinetics and mechanisms of leaching of rare earth elements from secondary resources. Miner. Eng. 2022, 177, 107351. [Google Scholar] [CrossRef] [Scilit]
- Ruan, Z.; Li, M.; Gao, K.; Zhang, D.L.; Huang, L.; Xu, W.; Liu, X.Y. Effect of particle size refinement on the leaching behavior of mixed rare-earth concentrate using hydrochloric acid. ACS Omega 2019, 4, 9813–9822. [Google Scholar] [CrossRef] [Scilit]
- Li, Z.L.; Xie, Z.H.; Deng, J.; He, D.S.; Zhao, H.Q.; Liang, H. Leaching kinetics of rare earth elements in phosphoric acid from phosphate rock. Metals 2021, 11, 239. [Google Scholar] [CrossRef] [Scilit]
- Guan, Q.J.; Sui, Y.; Liu, C.F.; Wang, Y.J.; Zeng, C.X.; Yu, W.J.; Gao, Z.Y.; Zang, Z.Y.; Chi, R.A. Characterization and leaching kinetics of rare earth elements from phosphogypsum in hydrochloric acid. Minerals 2022, 12, 703. [Google Scholar] [CrossRef] [Scilit]
- Tan, Q.; Deng, C.; Li, J. Innovative application of mechanical activation for rare earth elements recovering: Process optimization and mechanism exploration. Sci. Rep. 2016, 6, 19961. [Google Scholar] [CrossRef] [Scilit]
- Hamza, H.; Eterigho-Ikelegbe, O.; Jibril, A.; Bada, S.O. Application of the response surface methodology to optimise the leaching process and recovery of rare earth elements from discard and run of mine coal. Minerals 2022, 12, 938. [Google Scholar] [CrossRef] [Scilit]
- Lütke, S.F.; Oliveira, M.L.S.; Waechter, S.R.; Silva, L.F.O.; Cadaval, T.R.S.; Duarte, F.A.; Dotto, G.L. Leaching of rare earth elements from phosphogypsum. Chemosphere 2022, 301, 134661. [Google Scholar] [CrossRef] [Scilit] [PubMed]
- Amine, M.; Asafar, F.; Bilali, L.; Nadifiyine, M. Hydrochloric acid leaching study of rare earth elements from Moroccan phosphate. J. Chem. 2019, 2019, 4675276. [Google Scholar] [CrossRef] [Scilit]
- Lütke, S.F.; Pinto, D.; Brudi, L.C.; Silva, L.F.O.; Cadaval, T.R.S., Jr.; Duarte, F.A.; Ahmad, N.; Nawaz, A.; Dotto, G.L. Ultrasound-assisted leaching of rare earth elements from phosphogypsum. Chem. Eng. Process.-Process Intensif. 2023, 191, 109458. [Google Scholar] [CrossRef] [Scilit]
- Lu, S.D.; Sun, S.C.; Huang, X.X.; Tu, G.F.; Zhu, X.P.; Kong, X.H. Optimization of recovering cerium from the waste polishing powder using response surface methodology. Green Process. Synth. 2017, 6, 217–224. [Google Scholar] [CrossRef] [Scilit]

Disclaimer/Publisher’s Note: The statements, opinions and data contained in all publications are solely those of the individual author(s) and contributor(s) and not of MDPI and/or the editor(s). MDPI and/or the editor(s) disclaim responsibility for any injury to people or property resulting from any ideas, methods, instructions or products referred to in the content. |
© 2026 by the authors. Licensee MDPI, Basel, Switzerland. This article is an open access article distributed under the terms and conditions of the Creative Commons Attribution (CC BY) license.