


Abstract
Diopside–hedenbergite solid solution is the most common clinopyroxene end-member combination in mafic and ultramafic igneous rocks. The crystal structure variety caused by Mg-Fe isomorphous substitution can indicate geological processes such as Mg-Fe isotope fractionation. To explore the effect of Hubbard U correction and Fe content on iron-bearing clinopyroxene structures, we employed GGA and GGA + U to study the lattice constants, unit-cell volume, and average Fe-O bond length of the diopside–hedenbergite solid solution series. On the whole, the results by GGA + U are the increase in lattice constant a (from 9.910 Å to 10.030 Å) and volume (from 456.656 Å3 to 464.640 Å3), the decrease in β angle (from 106.121°to 105.320°), and a slight variation in the lattice constant b (from 9.007 Å to 9.010 Å) with increasing Fe content, which is a better match with the experiment than those by GGA. The average Fe-O bond lengths and polyhedral volumes calculated by GGA and GGA + U both increase with increasing Fe content. The Hubbard U correction significantly affects the lattice constants and unite-cell volume at medium-high Fe content (Fe/(Ca+ Mg + Fe) > 2/8), the Fe-O bond at low Fe content (Fe/(Ca+ Mg + Fe) < 1/8), the bond angle variance, distortion index and quadratic elongation at relatively medium Fe content (1/8 ≤ Fe/(Ca+ Mg + Fe) ≤ 5/16). This study verifies the effectiveness of U-value correction on iron-bearing clinopyroxene and provides a theoretical basis for understanding its structural evolution.
1. Introduction
Pyroxene, one of the most important rock-forming silicate minerals on Earth, is widely distributed in geological bodies such as crust, mantle, and meteorite. Its crystal structure and composition characteristics are the key to analyzing geological processes such as magmatic evolution, partial melting of the mantle, and mineral phase transition [1,2,3]. Clinopyroxene is the most complex and significant subclass of pyroxenes. Its crystal structure is characterized by a monoclinic C2/c space group and consists of a three-dimensional framework composed of a silicon–oxygen tetrahedral chain ([Si2O6]4−) and octahedrally coordinated cations (e.g., Ca2+, Mg2+, Fe2+/Fe3+). The difference in cation occupancy directly modulates the physical and chemical properties of minerals, and pyroxene can easily form a variety of solid solution series. The diopside (CaMgSi2O6)–hedenbergite (CaFeSi2O6) solid solution series is the most representative end-member combination in clinopyroxene solid solution. Isomorphous substitution of Mg2+ by Fe2+ within this series is accompanied by changes in lattice constants, unit volume, and cation coordination environment. Consequently, this is not only an ideal system for studying the mechanism of ion exchange and crystal structure response, but also closely related to geological processes such as isotope fractionation, magmatic evolution, crystallization differentiation, etc.
Accurate characterization of mineral structures constitutes the foundation for understanding their properties, and the research methodologies can be categorized into experimental approaches and theoretical calculations. In terms of experimental techniques, X-ray diffraction (single crystal/powder XRD) is an important means to directly obtain comprehensive structural information, such as lattice constants and volume of minerals, which has been widely used [4,5,6,7]. Previous studies investigated the structures of synthetic hedenbergite (CaFeSi2O6)–petedunnite (CaZnSi2O6) solid solutions at 298 K by powder XRD [8], and explored the synthetic samples with different chemical compositions along the hedenbergite (CaFe2+Si2O6)–aegirine (NaFe3+Si2O6) solid solution series at 298 K by single-crystal XRD [9]. However, at present, most of these XRD experimental studies are limited to crystal structure characterization at room temperature and pressure, and the research objects are almost exclusively synthetic samples with inadequate compositional precision. For the diopside–hedenbergite isomorphism series, most previous studies only involved two kinds of end-member minerals and lacked systematic quantification of the lattice constants, bond length, and other microstructure parameters of isomorphous substitution intermediate minerals. Therefore, it is difficult to reveal the internal mechanism of Mg-Fe substitution on the structural evolution of clinopyroxene.
In contrast, ab initio calculation based on density functional theory (DFT) can simulate the crystal structure of minerals at the electronic level without relying on empirical parameters, and quantitatively analyze the mineral structures and physical properties under different temperature, pressure, and composition conditions. This method has been widely used in the study of crystal structure and electronic structure of metal oxides such as magnetite and pyrite [10,11], and various silicate minerals such as perovskite and olivine [12,13,14,15,16]. The core accuracy of DFT calculation depends on the selection of the exchange correlation functional. Although traditional DFT (such as GGA, LDA) can describe the ground state properties of most minerals, it is not enough to deal with the strong correlation electron effect of transition metal (such as Fe) systems, leading to significant deviations in calculated structural parameters. The DFT + U method (i.e., GGA + U and LDA + U) corrects the electron correlation effect of d/f orbitals of transition metals by introducing an effective Coulomb interaction parameter U into the Hubbard model, which can significantly improve the accuracy of the calculation of Fe-bearing mineral structure [17,18]. However, there are relatively few direct and systematic studies on mineral structure (e.g., lattice parameters, unit-cell volume, bond length) using DFT + U, and only some relevant mineral structure data are available in the studies of isotope fractionation in minerals [19,20,21,22]. According to previous studies, under static conditions, LDA and LDA + U relatively underestimated mineral volume [20], while GGA and GGA + U relatively overestimated mineral volume [22]. None of these previous studies have involved DFT + U calculations on pyroxene structures, and only one study applied Hubbard U correction (GGA + U) to the calculation of mineral isomorphism series (forsterite-fayalite) [22]. Therefore, the effect of Hubbard U correction still needs to be verified, and theoretical calculations on the structure of pyroxene are still scarce.
In this study, we take the diopside–hedenbergite solid solution series as the research object, employing both DFT (GGA) and DFT + U (GGA + U) methods to calculate the lattice constants, unit-cell volume, average Fe-O bond, and polyhedral distortion parameters of clinopyroxene. This study can not only explore the effectiveness of U-value correction on the structure of iron-bearing clinopyroxene, but also lay a structural foundation for further research on this mineral series. Moreover, the structural changes caused by isomorphous replacement in this study have reference significance for the study of magma evolution and crystallization differentiation, partial melting of the mantle, and Fe-Mg isotope fractionation.
2. Methods
2.1. The First-Principles Calculation
Based on the basic principles of quantum mechanics, the first-principles calculation simplifies the polyatomic system into a multi-electron system composed of electrons and nuclei (atomic cores). The core is to accurately calculate the geometric structure, energy, and atomic bonding mechanism of molecules (or ions) by solving the Schrodinger equation, and then derive the physical, chemical, and mechanical properties related to the electronic structure of the material. Density functional theory (DFT) is the core theoretical framework of first-principles calculations, which establishes a functional relationship between the ground state energy and electron density of multi-electron systems [23]. The Hohenberg–Kohn theorem points out that the ground state physical properties of the system are uniquely determined by the ground state electron probability density ρ (r). The total energy of the system can be calculated by solving for the electron density ρ (r), which greatly simplifies the calculation difficulty.
In the density functional theory, the local density approximation (LDA) uses the exchange-correlation energy density of the uniform electron gas instead of the non-uniformity [24]. However, this method is not suitable for systems with strong localization of electron distribution and uneven charge density distribution. In fact, the electron density distribution of the multi-electron system is not uniform, and the exchange correlation energy term also depends on the electron density gradient. The generalized gradient approximation (GGA) improves the error caused by the LDA method by introducing the electron density gradient to describe the inhomogeneity of the electron density. Common GGA functionals have many forms, such as Perdew–Wang1991 (PW91), Perdew–Burke–Ernzerhof (PBE), Projector augmented wave (PAW), RPBE, and so on. The Perdew–Burke–Ernzerhof (PBE) functional is one of the most commonly used GGA functionals in the fields of materials science and earth science due to its computational accuracy and efficiency [25].
2.2. Initial Crystal Structures
Pyroxene belongs to single-chain silicate minerals. The crystal chemical formula of pyroxene is XY[T2O6], where X is Ca2+, Na+, Li+, Mn2+, Mg2+, Fe2+, etc., occupying the M2 site with a large gap in the crystal structure, forming a distorted octahedron with a coordination number of five to eight, and Y is Mg2+, Fe2+, Mn2+, Al3+, Fe3+, Ti3+, etc., occupying the M1 site with a small gap in the crystal structure, forming a normal six-coordinated octahedron. T is Si or Al; in a few cases, T is Fe3+, Cr3+, Ti4+, etc., occupying the silicon–oxygen tetrahedron position in the crystal structure. According to different symmetries, pyroxene can be divided into two subfamilies: orthopyroxene (Opx) and clinopyroxene (Cpx), and pyroxene often forms an isomorphism series.
In this study, the end-member diopside (CaMgSi2O6) and hedenbergite (CaFeSi2O6) form a complete solid solution series in clinopyroxene with space group C2/c. The initial crystal structure of diopside and hedenbergite was downloaded from the Crystallography Open Database (http://www.crystallography.net/cod/search.html, accessed on 29 January 2026) (COD ID of initial diopside: 1000007). Since there are two non-equivalent metal sites, M1 and M2, with the same number in clinopyroxene, cation occupation is selective. According to previous studies, in diopside, the Ca2+ with a larger radius occupies the larger M2 site, while the Mg2+ occupies the smaller M1 site [26]; in hedenbergite, Fe2+ only exists at the M1 site [27]. Our calculations also show that the structure with Fe2+ at the M1 site exhibits lower energy, so Fe2+ prefers the M1 site in clinopyroxene. The clinopyroxenes with different Fe contents are formed by the continuous substitution of Fe for Mg at the M1 position. For example, there are 16 Mg and 16 Ca atoms in the 160-atom supercell of a diopside, and one of the 16 Mg atoms is replaced by an Fe atom to obtain a monoclinic pyroxene with a Fe/(Ca + Mg + Fe) ratio of 1/16. The initial structures with Fe/(Ca + Mg + Fe) of 2/8, 3/16, and 5/16 have multiple non-equivalent configurations (3, 5, and 5 configurations, respectively). Therefore, all non-equivalent configurations need to be calculated, and the configuration with the lowest total energy is selected as the optimal configuration under this Fe ratio. The DFT calculation of Wang et al. (2017) shows that the effect of supercell size on the structure is almost negligible, and the average bond lengths calculated under different supercell sizes in this paper are consistent [28]. Therefore, the influence of supercell size is not considered in this study. In addition, all the initial structures of this study were constructed in VASP (Vienna Ab initio Simulation Package), and the cell size, total number of atoms, and non-equivalent configuration number of the initial structures with different Fe contents are shown in Table S1.
2.3. Calculation Details
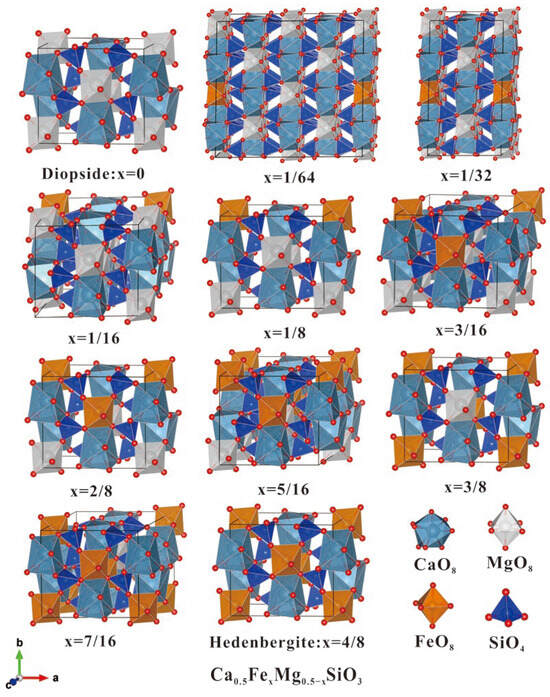
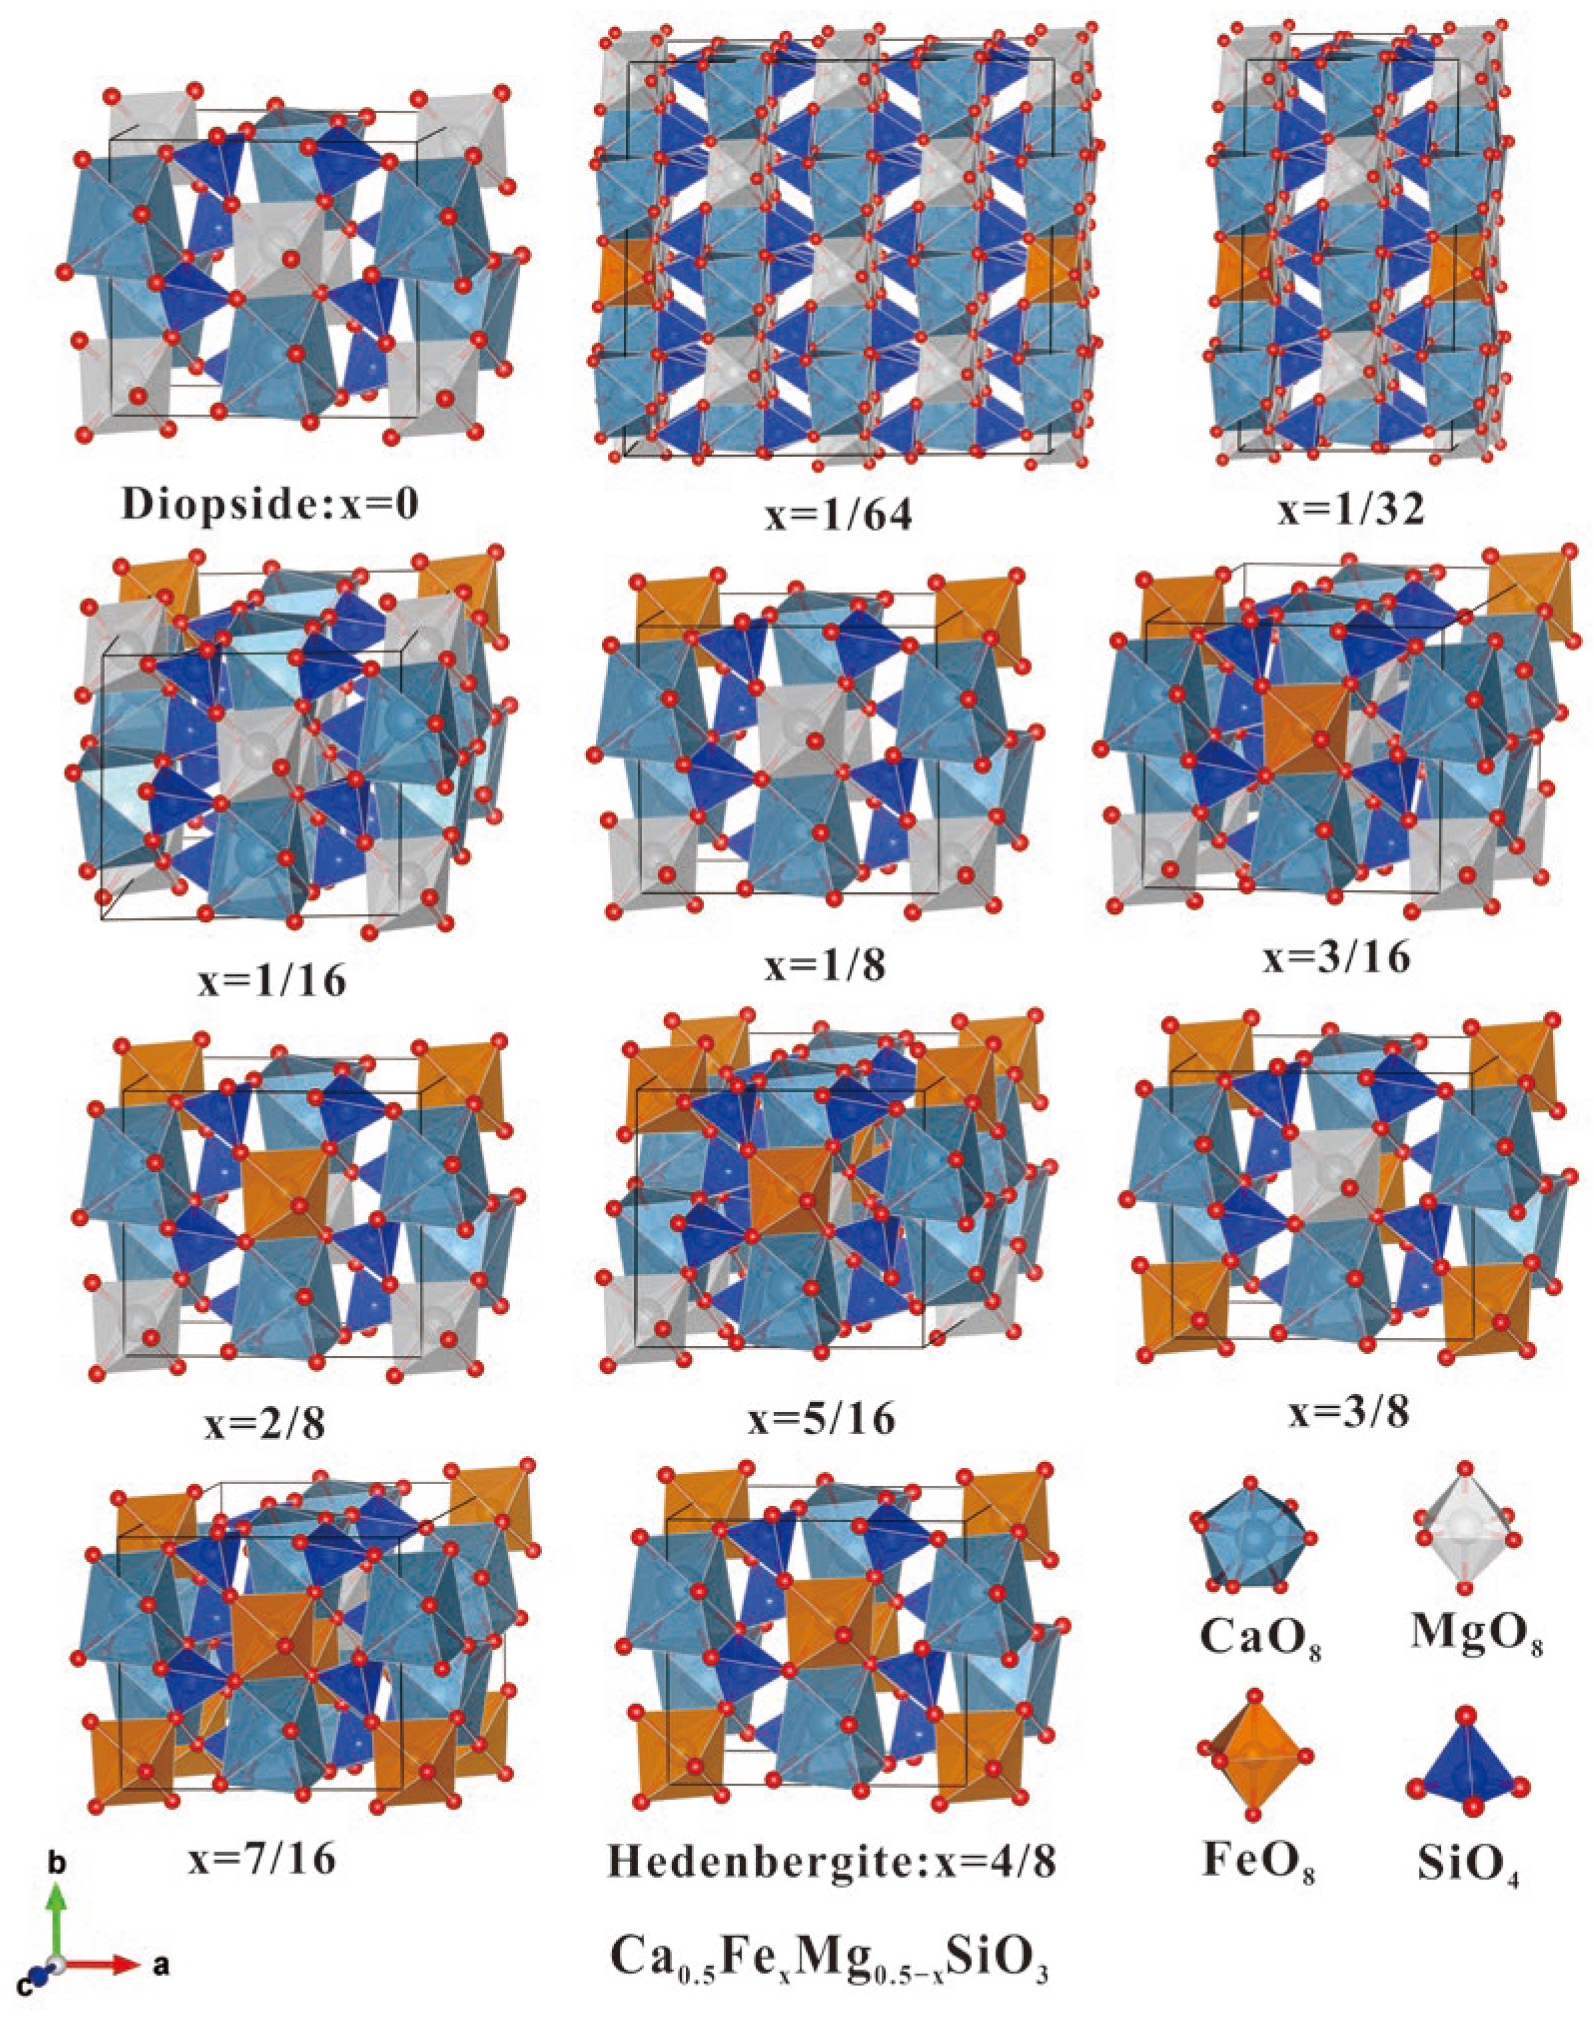
All crystal structures were calculated by the software package VASP 6.3 (Vienna Ab initio Simulation Package) based on density functional theory (DFT), plane wave, and pseudopotential. The Perdew–Burke–Ernzerhof (PBE) functional, a commonly used approximation in density functional theory, was adopted to describe the exchange-correlation energy [25]. The ionic cores were dealt with Projector Augmented Wave (PAW) pseudopotentials [29] from the VASP pseudopotential library (https://www.vasp.at accessed on 29 January 2026) and the pseudopotentials for O, Fe, Si, Ca, and Mg were O.pbe-n-kjpaw_psl.1.0.0.UPE, Fe.pbe-spn-kjpaw_psl.1.0.0.UPE, Si.pbe-n-kjpaw_psl.1.0.0.UPF, Ca.pbe-spn-kjpaw_psl.1.0.0.UPE, and Mg.pbe-spn-kjpaw_psl.1.0.0.UPE, respectively. The Monkhorst–Pack grid [30] is used to integrate over the Brillouin zone for generating the N1 × N2 × N3 k-point grid. The number of k-points depends on the cell shape and size (Figure 1 and Table S2).
Figure 1.
Optimized structures of diopside–hedenbergite solid solutions with different Fe/(Ca + Mg + Fe). All of these crystal structures are drawn by the software VESTA (version 3.16) [31].
The large in situ Coulomb interaction among local electrons (e.g., 3d electrons of Fe) cannot be ignored [17]. In order to compare, the Hubbard U modification on the GGA calculation (DFT + U) is also introduced into all structural optimizations of iron-bearing clinopyroxene in this study. The Hubbard U-value of the Fe atom in different Fe ratio configurations (Table S2) was determined non-empirically by the linear response method [32]. After obtaining the U-value, variable cell shape molecular dynamics [33] is used to relax each initial structure at zero pressure in both DFT and DFT + U calculations. The convergence criteria for stress, force, and self-consistent energy are set to 0.5 Kbar, 10−4 eV/Å and 10−6 eV, respectively. The cutoff energy of wavefunctions is 600 eV to ensure the calculation accuracy of this study. All calculations allow free relaxation of the magnetic moment and apply spin polarization to the Fe atom.
3. Results and Discussion
The DFT + U method is actually a mixture of DFT and the Hubbard model in mathematical form. It performs DFT calculations on the whole system, but in particular applies an additional Hubbard correction to some selected atomic orbitals (such as the d orbital of Fe). Table S2 shows that the calculated U-values (2.89–8.14 eV) of clinopyroxenes with different iron contents vary greatly, which is caused by many factors. On the one hand, the local coordination environment and chemical bond of clinopyroxenes change with increasing Fe content, which directly affects the effective correlation strength of Fe 3d electrons. On the other hand, as shown in Tables S1 and S2, different supercells and k-point grids are used for structures with different Fe contents, which will affect the final calculated U-value.
3.1. Influence of Hubbard U Correction on Lattice Constants and Unit-Cell Volumes of Clinopyroxene
The lattice constants and unit cell volumes of clinopyroxene with different Fe/(Ca + Mg + Fe) ratios (from 1/8 to 4/8) calculated by GGA (PBE) and GGA (PBE) +U methods, together with the experimental results, are shown in Table 1 (more experimental references are given in Figure 2 and Figure 3 and Table S5). The calculated crystal structures of other members are listed in Tables S3 and S4. The calculated crystal structure values of both GGA and GGA + U are in good agreement with the measured values, showing that the lattice constant errors of both are within 1.9%, and the cell volume errors of GGA and GGA + U are less than 3.1% and 3.3%, respectively. For lattice constants a, b, c, and β, as the Fe content increases from 1/8 to 4/8, the error ranges between GGA calculation and experiment are 1.2%–1.9%, −0.6%–0.9%, −0.4%–1.3%, and −0.4%–0.6%, respectively, while the corresponding error ranges of GGA + U are 1.4%–1.9%, −0.2%–0.6%, 1.4%–1.6%, and 0.5%–0.8%, respectively. For the unit-cell volume, the error range of GGA calculation is 1.5%–3.1%, while that of GGA + U calculation is 3.0%–3.2%. Thus, although some errors of GGA calculation in Table 1 are smaller than those of GGA + U, the sizes of the GGA + U error range are much smaller than those of GGA (e.g., for unit-cell volume, the size of the error range of GGA with 1.5%–3.1% is 1.6%, while that of GGA + U with 3.0%–3.2% is only 0.2%). This means that with the increase in Fe content, the structural trend of GGA + U calculation should be more consistent with the experimental trend.
Table 1.
Calculated and experimental lattice contents and unit-cell volume of clinopyroxene.
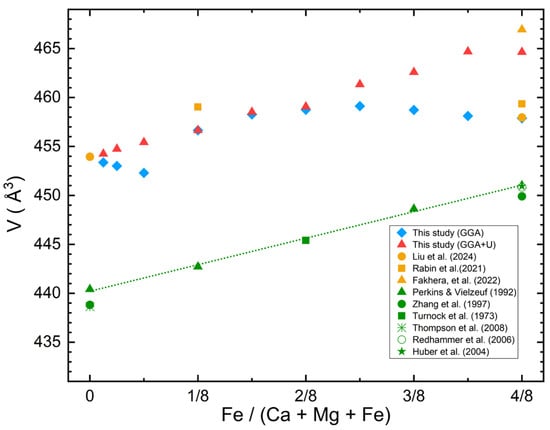
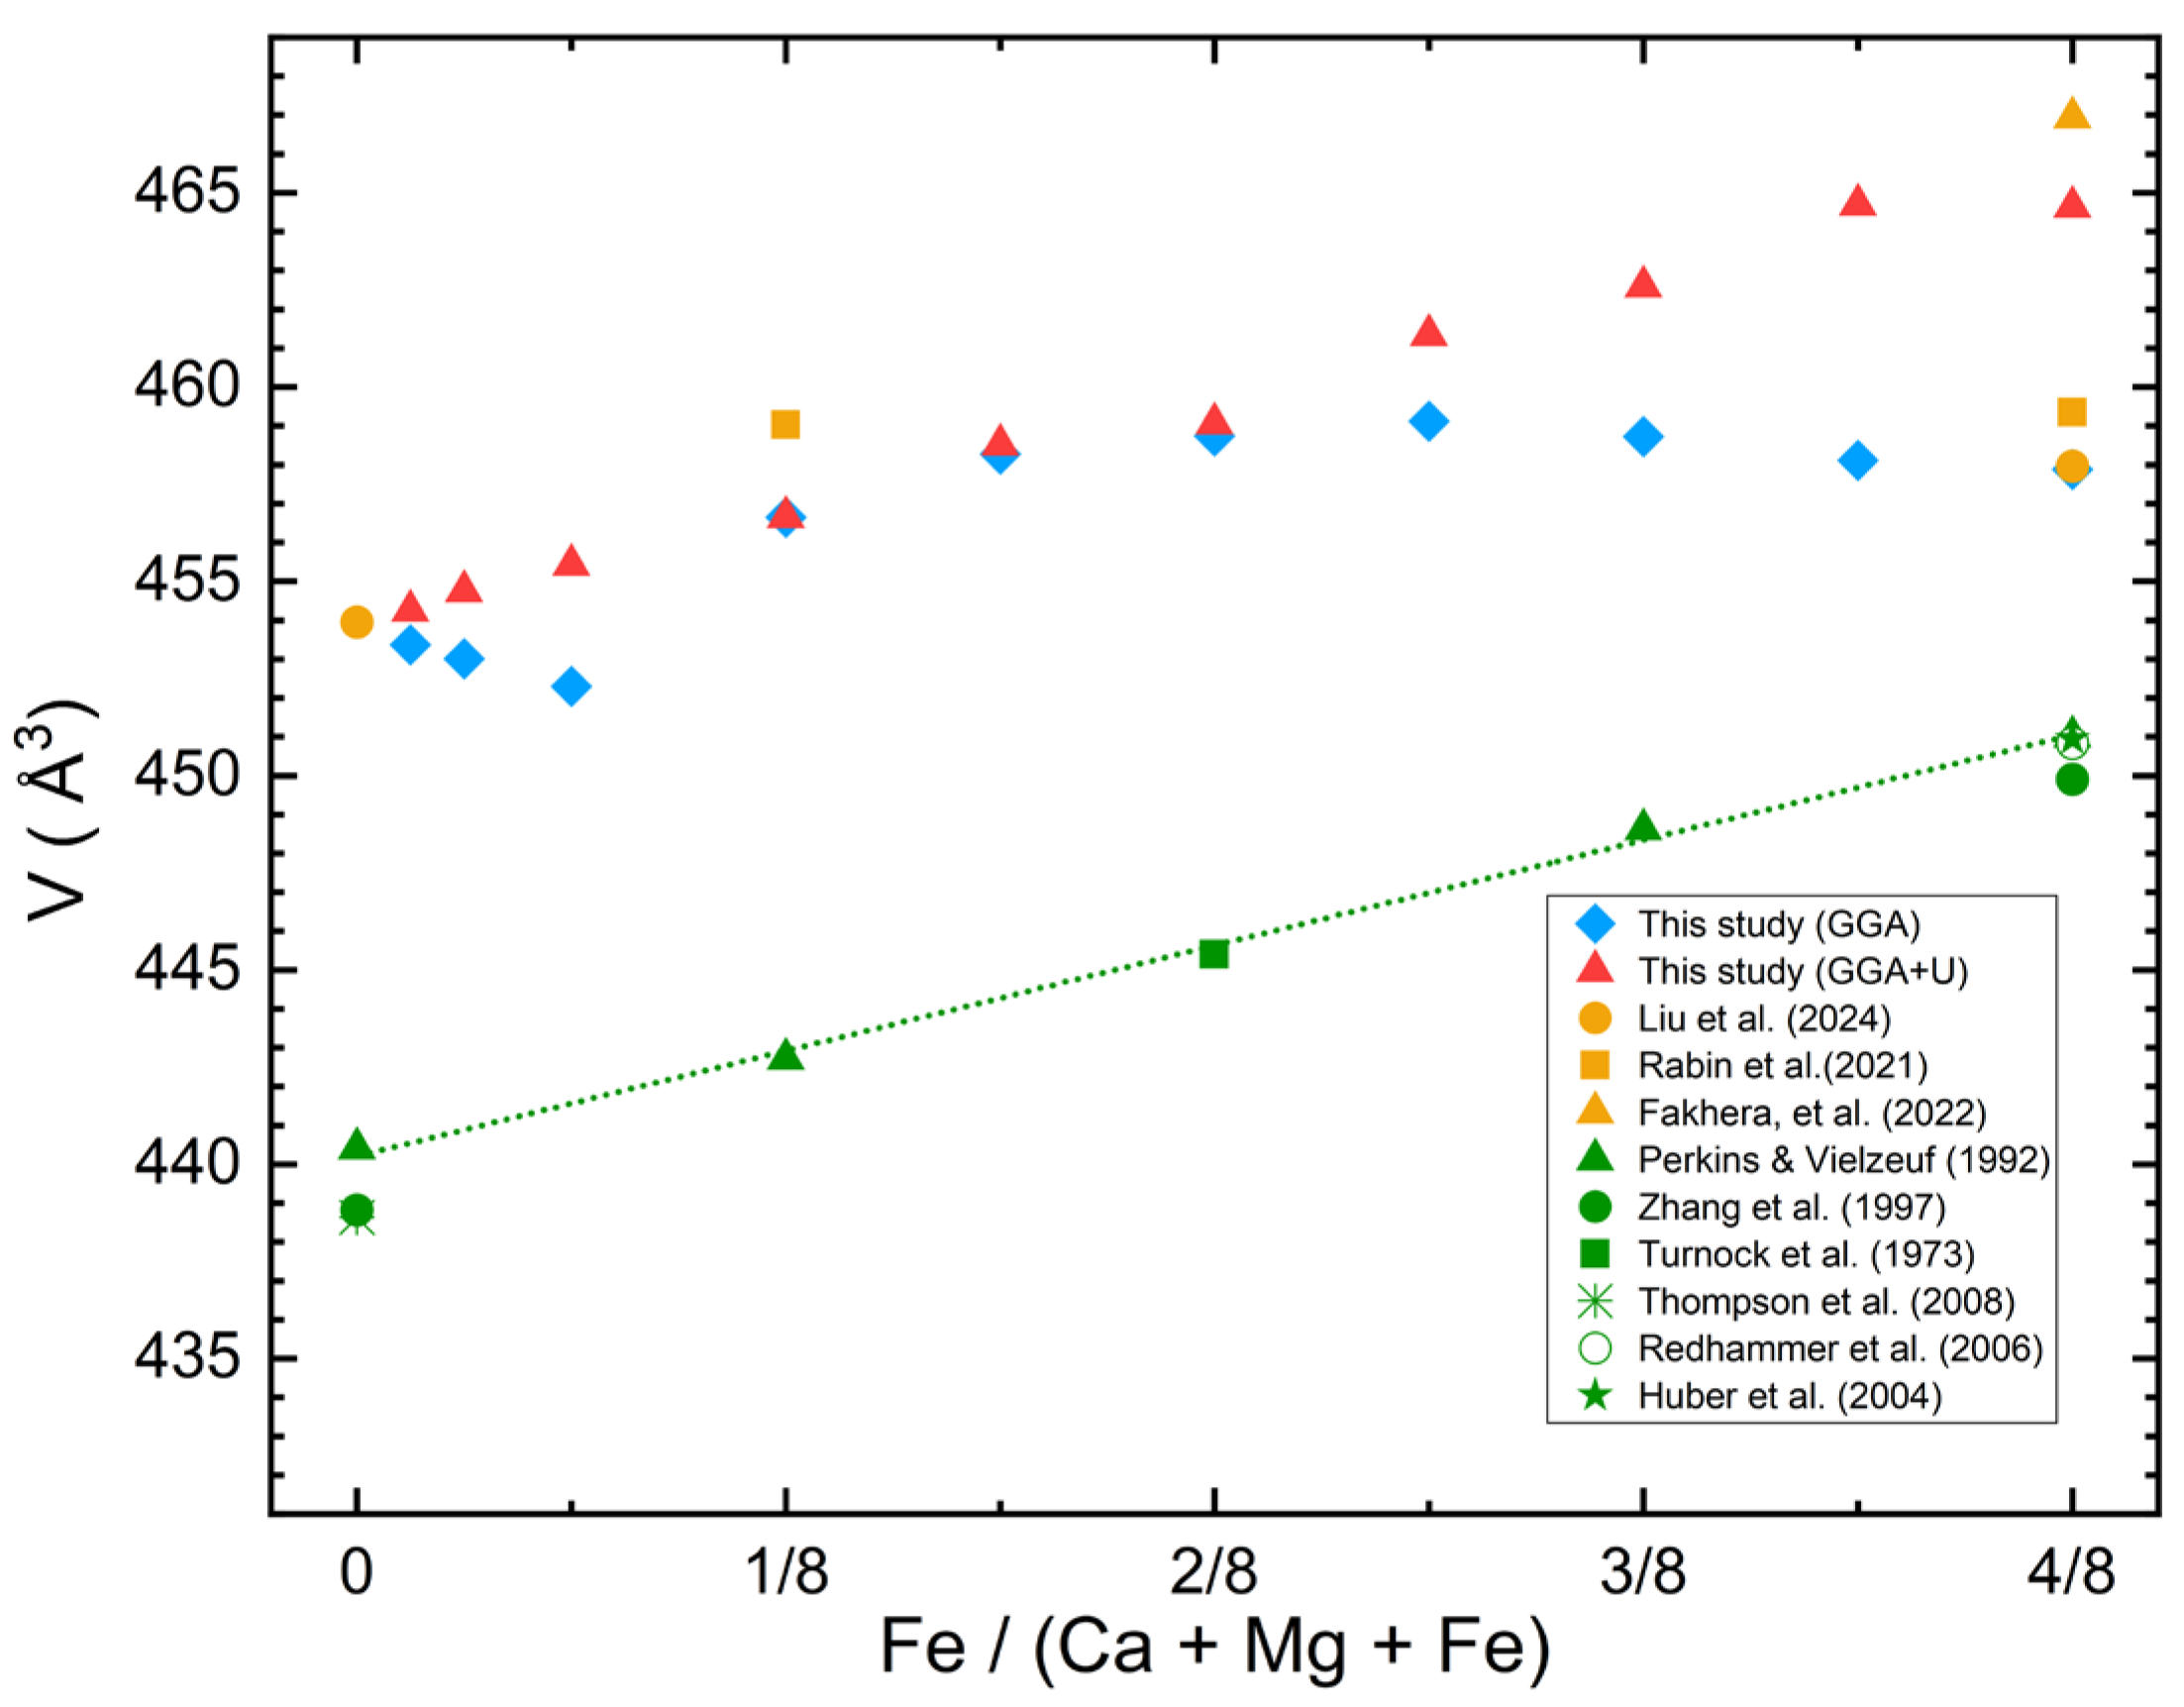
Figure 2.
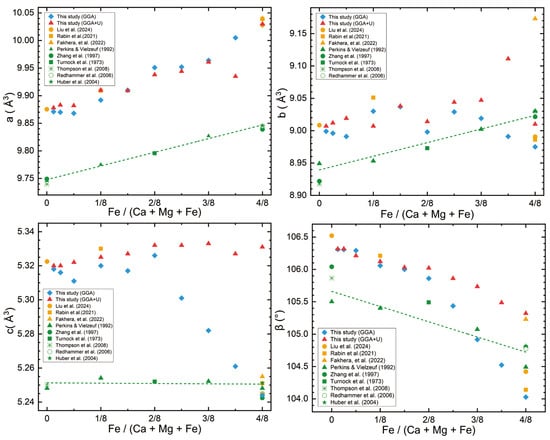
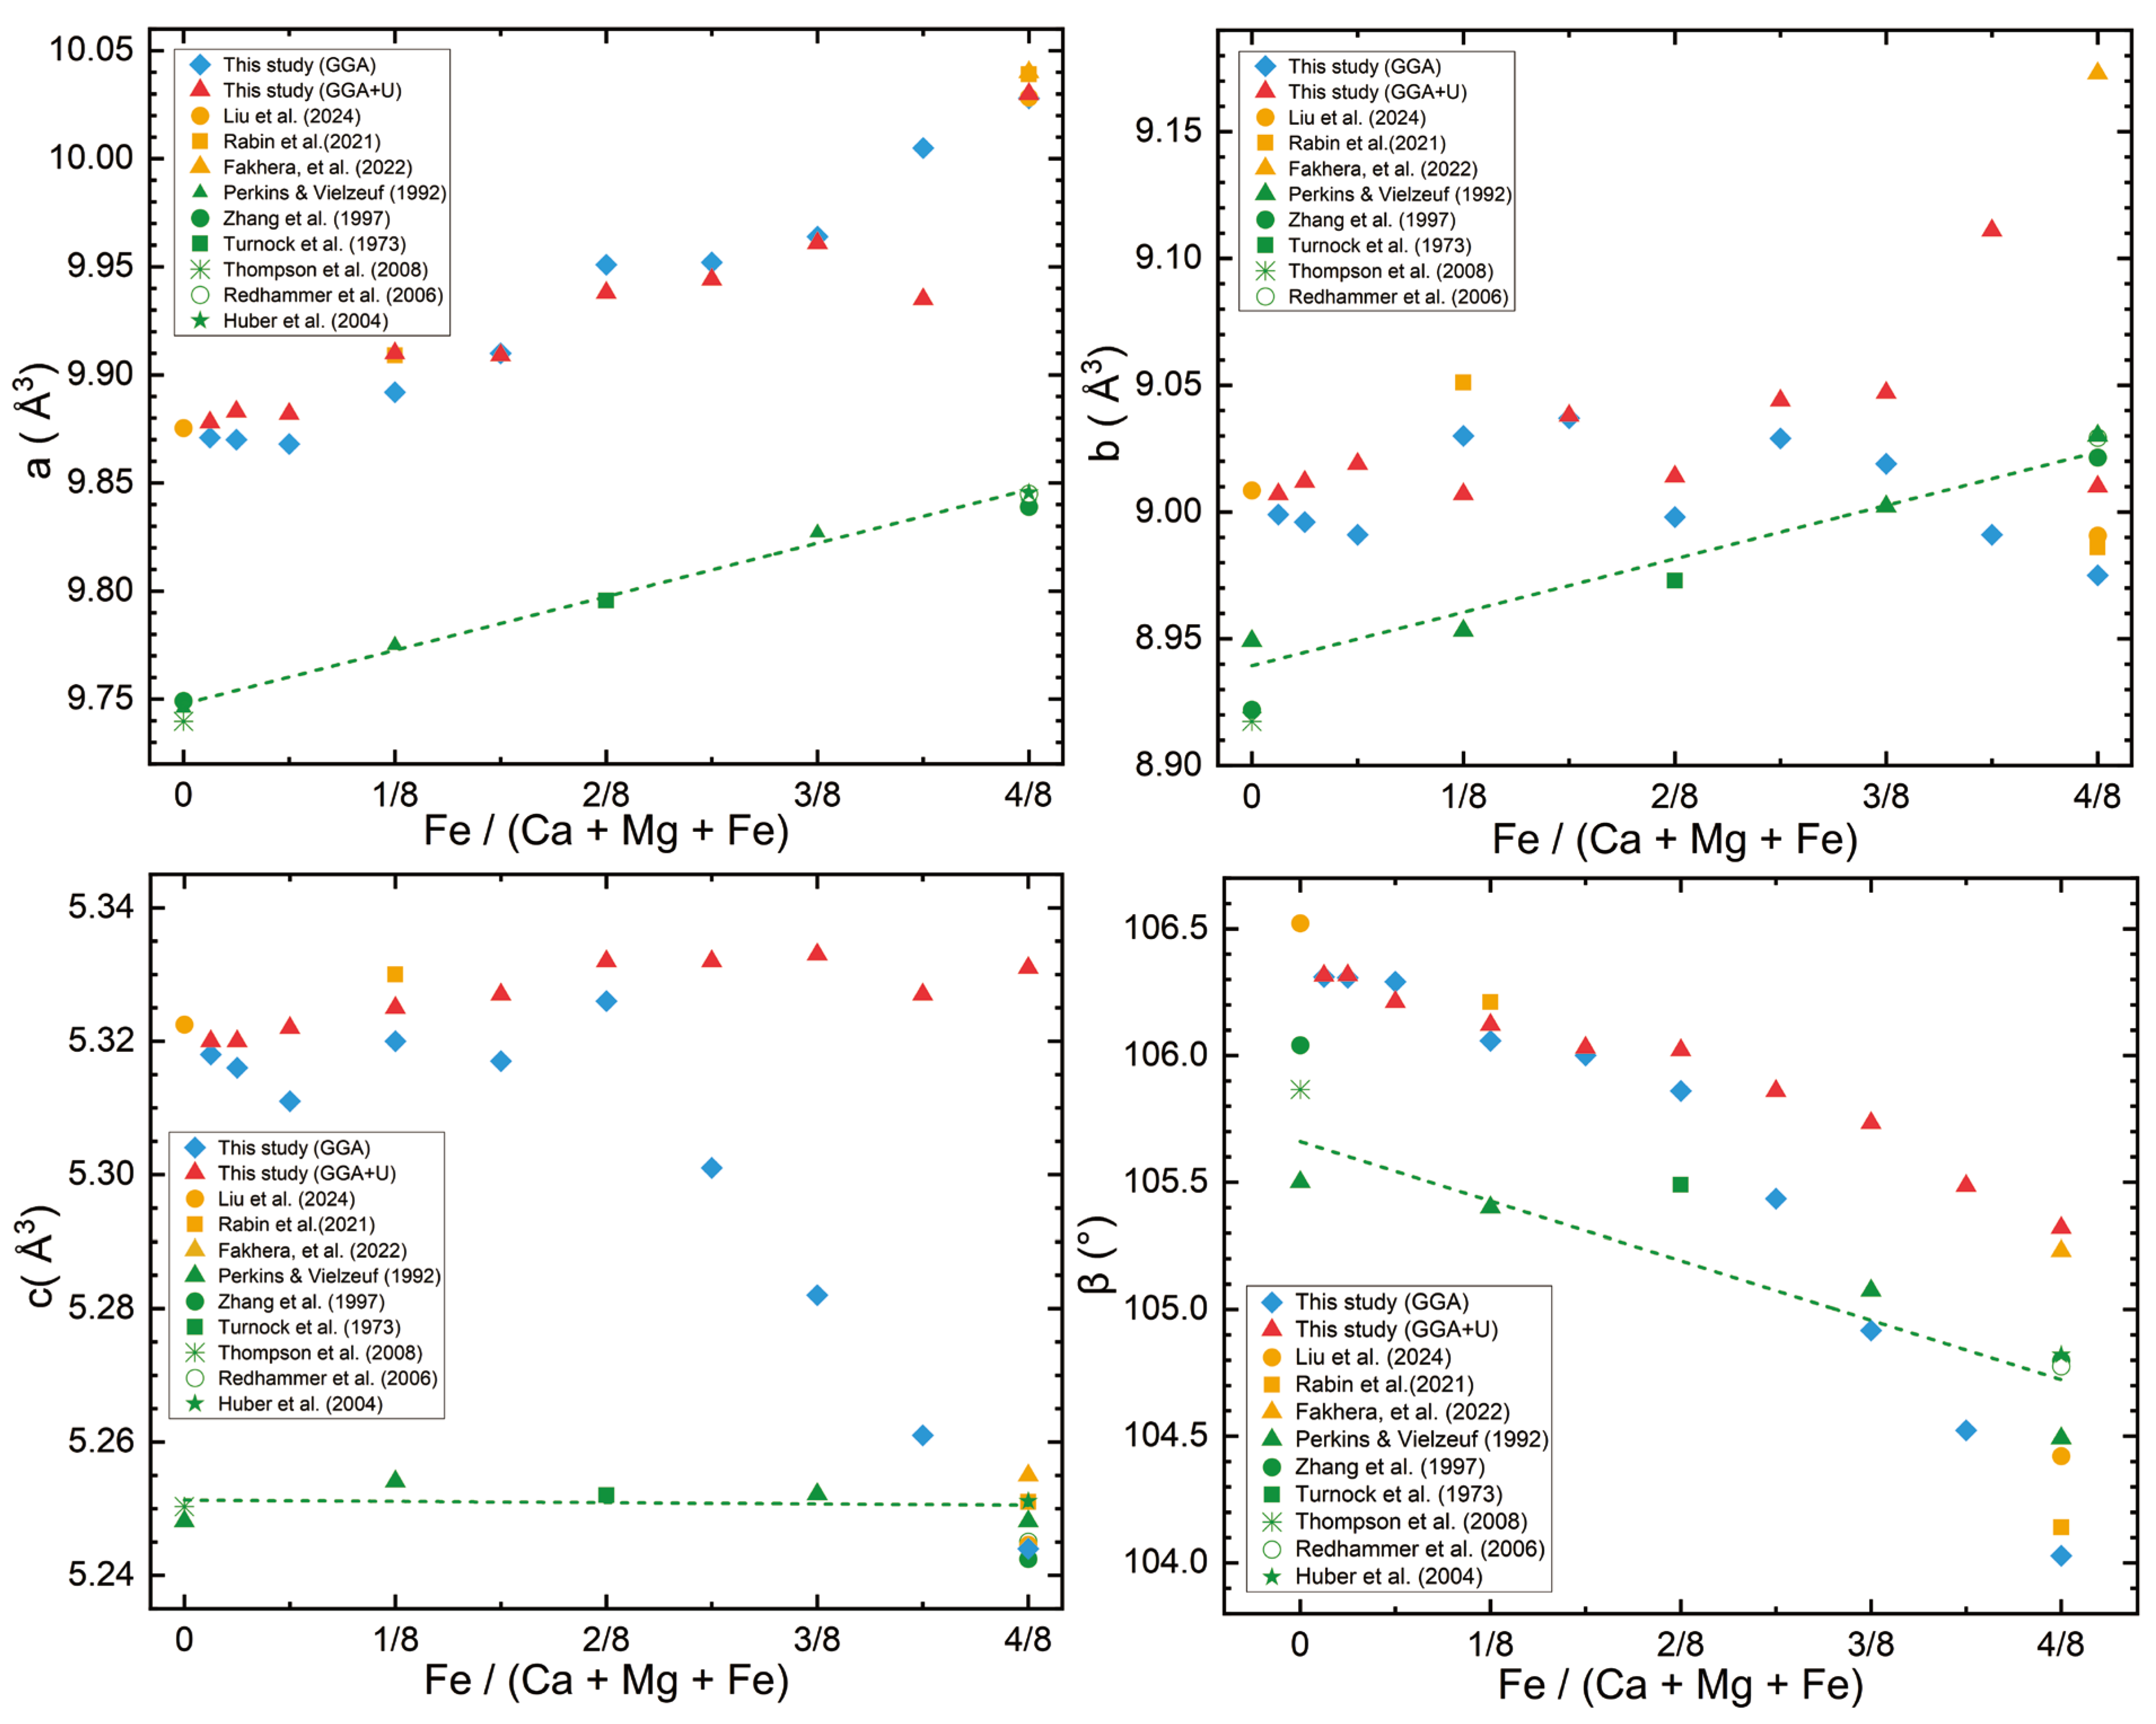
Variation in lattice constants and unit-cell volume of clinopyroxene as a function of Fe/(Ca + Mg + Fe) ratio. The previous data of the XRD experiment at 1 atm, room temperature [4,5,6,7,8,9] and GGA calculation [22,27,34] were also illustrated for comparison.
Figure 3.
Correlations between Fe/(Ca + Mg + Fe) ratio and average Fe–O bond length in clinopyroxene. The previous data of the XRD experiment at 1 atm, room temperature [4,5,6,7,8,9], and GGA calculation [22,27,34] were also illustrated for comparison.
The dependence of calculated and experimental values of lattice constants and unit-cell volumes of clinopyroxene on Fe content is shown in Figure 2 and Figure 3. For the experiment, lattice constants a, b, and unit-cell volume of clinopyroxene increase with increasing Fe content, the lattice constant c remains basically stable, while the lattice constant β angle decreases gently. The GGA + U calculation roughly replicates the experimental trend. In the GGA + U calculation, except for the change trend of the lattice constant b, which is slightly deviated from the experimental results (except for Fe/(Ca + Mg + Fe) = 7/16), the trends of the other lattice constants and the unit-cell volume are in good agreement with the experimental trends. With the increase in Fe content, the unit-cell volume and lattice constant a (except for Fe/(Ca + Mg + Fe) = 7/16) increase, the lattice constant β decreases, and the lattice constant c is maintained in the range of 5.320–5.333 Å. The constants a and b calculated by GGA + U at Fe content of 7/16 have significant deviations in Figure 2. These deviations may be caused by local structural relaxation under a specific Fe/Mg arrangement, that is, the arrangement of Fe and residual Mg at the M1 site in clinopyroxene structure may form a specific and energy-favorable superstructure or cationic ordered configuration.
In the GGA calculation, only the increasing trend of the lattice constant a with increasing Fe content closely matches the measured data; the other structural constants have different degrees of deviation from the experimental trend. Those deviations of lattice constants lead to the GGA calculated trend of unit-cell volume with increasing Fe content, which is not uniform. Specifically, the unit-cell volume of the experiment increases uniformly with increasing Fe content. The unit-cell volume calculated by GGA decreases slightly as the Fe/(Ca + Mg + Fe) increases from 1/64 to 1/16, and then increases gradually as Fe/(Ca + Mg + Fe) increases to 5/16; when Fe/(Ca + Mg + Fe) > 5/16, the unit cell volume decreases slightly and remains basically unchanged. Furthermore, for lattice constants c, β, and V, when Fe/(Ca + Mg + Fe) ≤ 2/8, the calculation errors between GGA and GGA + U are within 0.21%, 0.15%, and 0.69%, respectively; when Fe/(Ca + Mg + Fe) > 2/8, the calculation errors between GGA and GGA + U increase with increasing Fe content, and almost reach the maximum near Fe/(Ca + Mg + Fe) = 4/8, which are 1.66%, 1.24%, and 1.48%, respectively.
Therefore, the clinopyroxene structure calculated by GGA and GGA + U is significantly different when Fe/(Ca + Mg + Fe) > 2/8 (i.e., Fe/(Fe + Mg) > 1/2), and the matching degree between the GGA + U calculation and experimental trend is obviously better than that of the GGA calculation. The effect of U correction on lattice constant and unit-cell volume becomes significant at medium and high Fe concentrations, which is consistent with the previous research conclusions of the olivine system [22]. This is caused by the lattice constant and unit-cell volume, which are the long-range cumulative effects of the crystal. When Fe content is very low (Fe/(Ca + Mg + Fe) ≤ 2/8), Fe atoms are isolated and dispersed in the lattice dominated by Mg, and the skeleton and volume of the whole lattice are mainly determined by the absolute majority of Mg-O polyhedral. Although the U correction changes the electronic state of the Fe atom itself, this change is localized. However, at medium and high Fe concentrations (Fe/(Ca + Mg + Fe) > 2/8), the Fe atom occupies a dominant position in the M1 site, forming a connected Fe-O-Fe network. At this time, the electron localization and strong correlation effects introduced by the U correction on each Fe atom will be coupled through the lattice to produce the synergistic effect.
In addition, all the previous data in Figure 2 are calculated by GGA [22,27,34], and except for a few special values, the calculated structures of clinopyroxene (both previous and this calculations) are generally higher than the XRD experiments due to the overestimation caused by the GGA functional. The calculated data in Liu et al. (2024) [22] and Rabin et al. (2021) [27] are consistent with this study. However, for the calculated data of Fakhera et al. (2022) [34], only the lattice constant a is consistent with the GGA calculation in this study, and the other lattice constants are biased, resulting in a slight overestimation of volume by 1.97%. This may be caused by the different GGA exchange correlation functionals used in the calculation (the GGA-WC functional for [34] and the GGA-PBE functional for [22] and [27]).
3.2. Influence of Hubbard U Correction on Average Fe-O Bond Lengths of Clinopyroxene
In clinopyroxene, Mg2+ and Fe2+ are six-coordinated, and Ca2+ is eight-coordinated. Based on a previous study [35], the ionic radius of Fe2+ (0.78 Å, high spin state) is larger than that of Mg2+ (0.72 Å). Therefore, the substitution of Fe2+ for Mg2+ will distort the M1 octahedron [36], and the Fe-O bond in the augite is larger than the Mg-O bond in the diopside. The calculated average Fe-O bond lengths of diopside–hedenbergite solid solution with different Fe/(Ca + Mg + Fe) at static conditions are drawn in Figure 4 and listed in Table 2. Both GGA and GGA + U calculated average Fe-O bond lengths are consistent with XRD measurements, and the errors are within 0.98% and 1.11%, respectively.
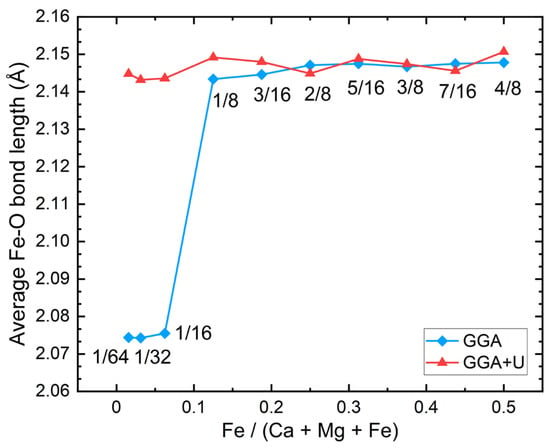
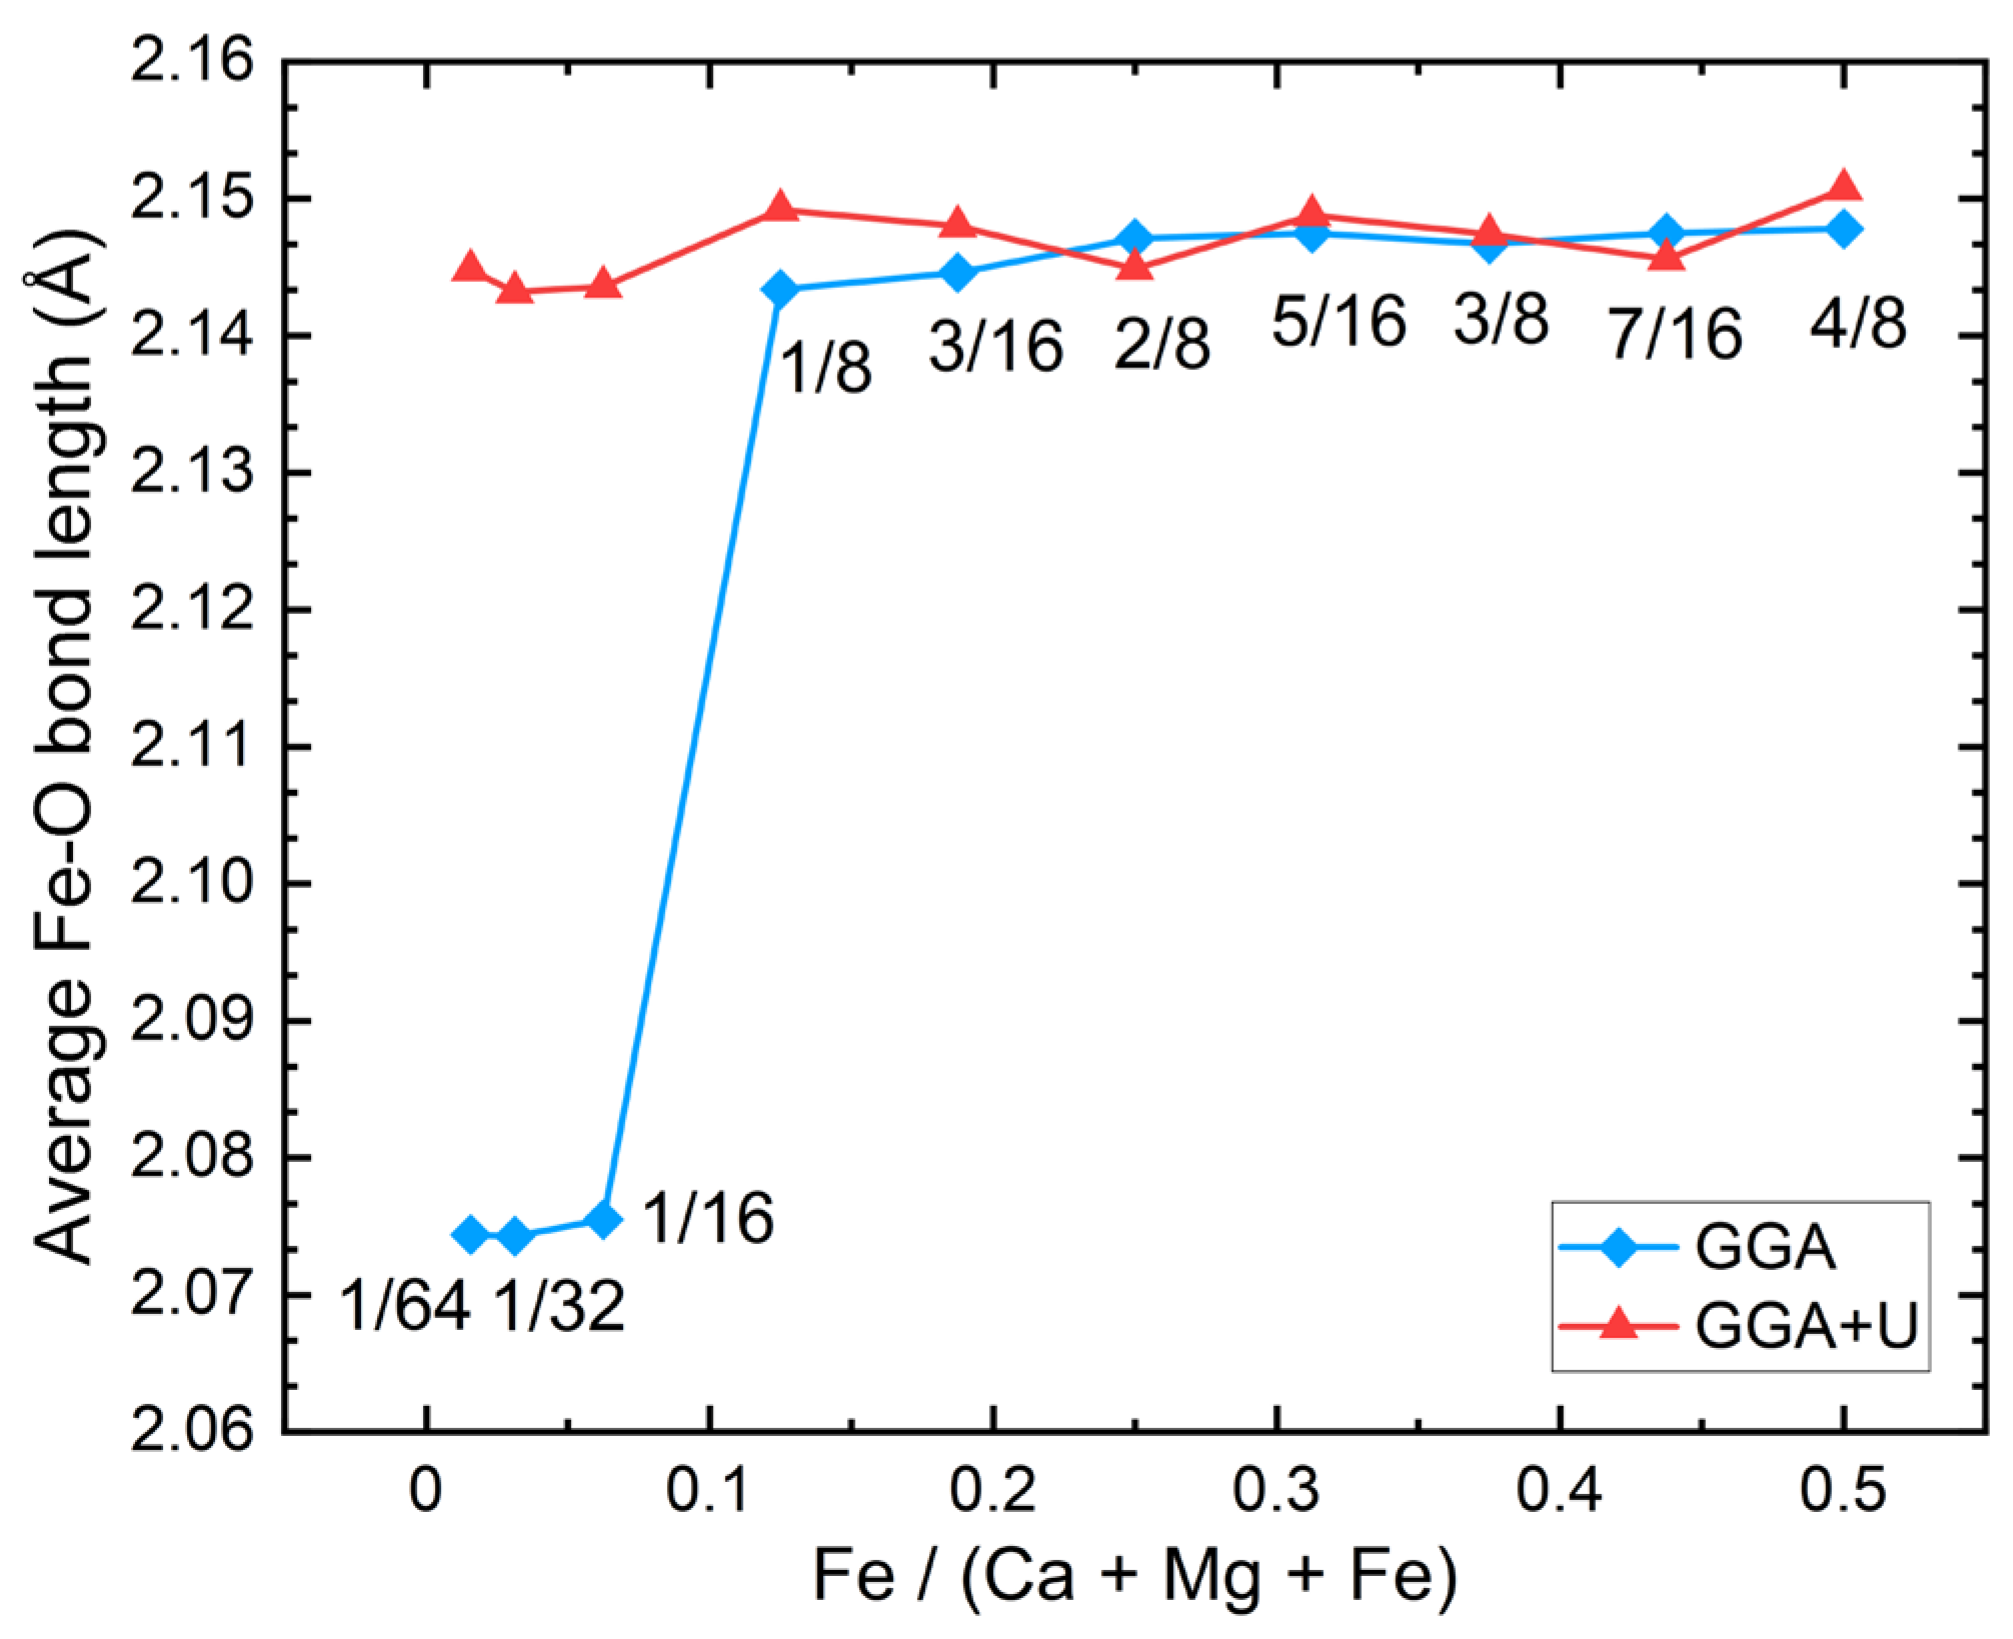
Figure 4.
Correlations between Fe/(Ca + Mg + Fe) ratio and average Fe-O bond length in clinopyroxene.
Table 2.
Calculated average Fe-O bond lengths (Å) of clinopyroxene with different Fe/(Ca + Mg + Fe) at static conditions compared with the experimental data at 1 atm, room temperature.
As shown in Figure 4, the average Fe-O bond lengths calculated by GGA and GGA + U both increase approximately with increasing Fe/(Ca + Mg + Fe), but the growth trends are very different. With Fe/(Ca + Mg + Fe) increase from 1/64 to 4/8, the average Fe-O bond length calculated by GGA increases from 2.0744 Å to 2.1478 Å by 3.5%. While the average Fe-O bond length calculated by GGA + U increases from 2.1448 Å to 2.1507 Å, only by 0.28%. In the GGA + U calculation, the average Fe-O bond length stabilizes near 2.1436 Å as Fe/(Ca + Mg + Fe) increases from 1/64 to 1/16, then increases to 2.1492 Å by 0.26% as Fe/(Ca + Mg + Fe) reaches 1/8, and finally increases with fluctuations to 2.1507 Å at Fe/(Ca + Mg + Fe) = 4/8, with a fluctuation range within 0.21%. In the GGA calculation, the average Fe-O bond length is stable in the range of 2.0743–2.0755 Å as Fe/(Ca + Mg + Fe) increases from 1/64 to 1/16. It then increases sharply to 2.1434 Å as Fe/(Ca + Mg + Fe) reaches 1/8, increases slightly to 2.1471 Å at Fe/(Ca + Mg + Fe) = 2/8, and finally remains almost unchanged and stable in the range of 2.1467–2.1478 Å, when Fe/(Ca + Mg + Fe) > 2/8.
Therefore, the trend of average Fe-O bond length in clinopyroxene calculated by GGA shows a stronger concentration effect than that of GGA+ U with the increasing Fe content. It is shown that the average A-O bond length almost remains constant when the A content in the mineral solid solution series is lower than or higher than a certain value. As shown in Figure 3, when the Fe content in clinopyroxene is low enough (Fe/(Ca + Mg + Fe) < 1/16), Fe atoms are adapted to the structure of diopside controlled by Mg atoms, and the average Fe-O bond length is almost unchanged. With the Fe content in clinopyroxene ranging from 1/16 to 2/8, the average Fe-O bond length first increases dramatically (as Fe content from 1/16 to 1/8) and then increases slightly (as Fe content from 1/8 to 2/8) with increasing Fe content. When Fe is enriched in clinopyroxene (Fe/(Ca + Mg + Fe) > 2/8), Fe atoms play a dominant role in their local structure, so the average Fe-O bond length is not sensitive to Fe content and tends to be a constant. The concentration effect on crystal bond length is a common feature in solid solution systems, such as the Ca-O bond in carbonate minerals [28] and the K-O bond in alkaline feldspar [15]. In addition, the average Fe-O bond length calculated by GGA only significantly varies with the Fe concentration in a narrow range of 1/16 < Fe/(Ca + Mg + Fe) < 1/8. A similar behavior was found in the Ca-O bond lengths of orthopyroxene [37] and forsterite [38] (1/48 < Ca/(Fe + Ca + Mg) < 1/8 for orthopyroxene, and 1/64 < Ca/(Fe + Ca + Mg) < 1/8 for forsterite).
Obviously, the difference between GGA and GGA + U calculations mainly occurs in Fe/(Ca + Mg + Fe) < 1/8, and the two calculations are in good agreement when Fe/(Ca + Mg + Fe) ≥ 1/8. Therefore, the effect of Hubbard U correction on the average Fe-O bond length is obvious at low Fe concentration (when Fe/(Ca + Mg + Fe) < 1/8), which is different from the trends of lattice constant and unit-cell volume. This is because the lattice constant and cell volume have a long-range cumulative effect on the crystal, while the Fe-O bond length directly reflects the local chemical bonding environment and electronic structure of the Fe atom. On the one hand, the U correction directly changes the occupation and energy level of the 3d orbital of the Fe atom, especially solving the problem of excessive delocalization of 3d electrons caused by self-interaction errors in standard DFT. On the other hand, in the Fe-O octahedron, there is a strong hybridization between the 3d orbital of Fe and the 2p orbital of O. The U correction indirectly affects the orbital overlap and covalent bond strength between Fe-O by enhancing the 3d electron localization of Fe. This will immediately change the equilibrium distance between Fe and O. Therefore, even at very low concentrations, the U correction will immediately act on a single Fe atom and its surrounding coordinated oxygen atoms.
3.3. Influence of Hubbard U Correction on Individual Polyhedron Distortion of Clinopyroxene
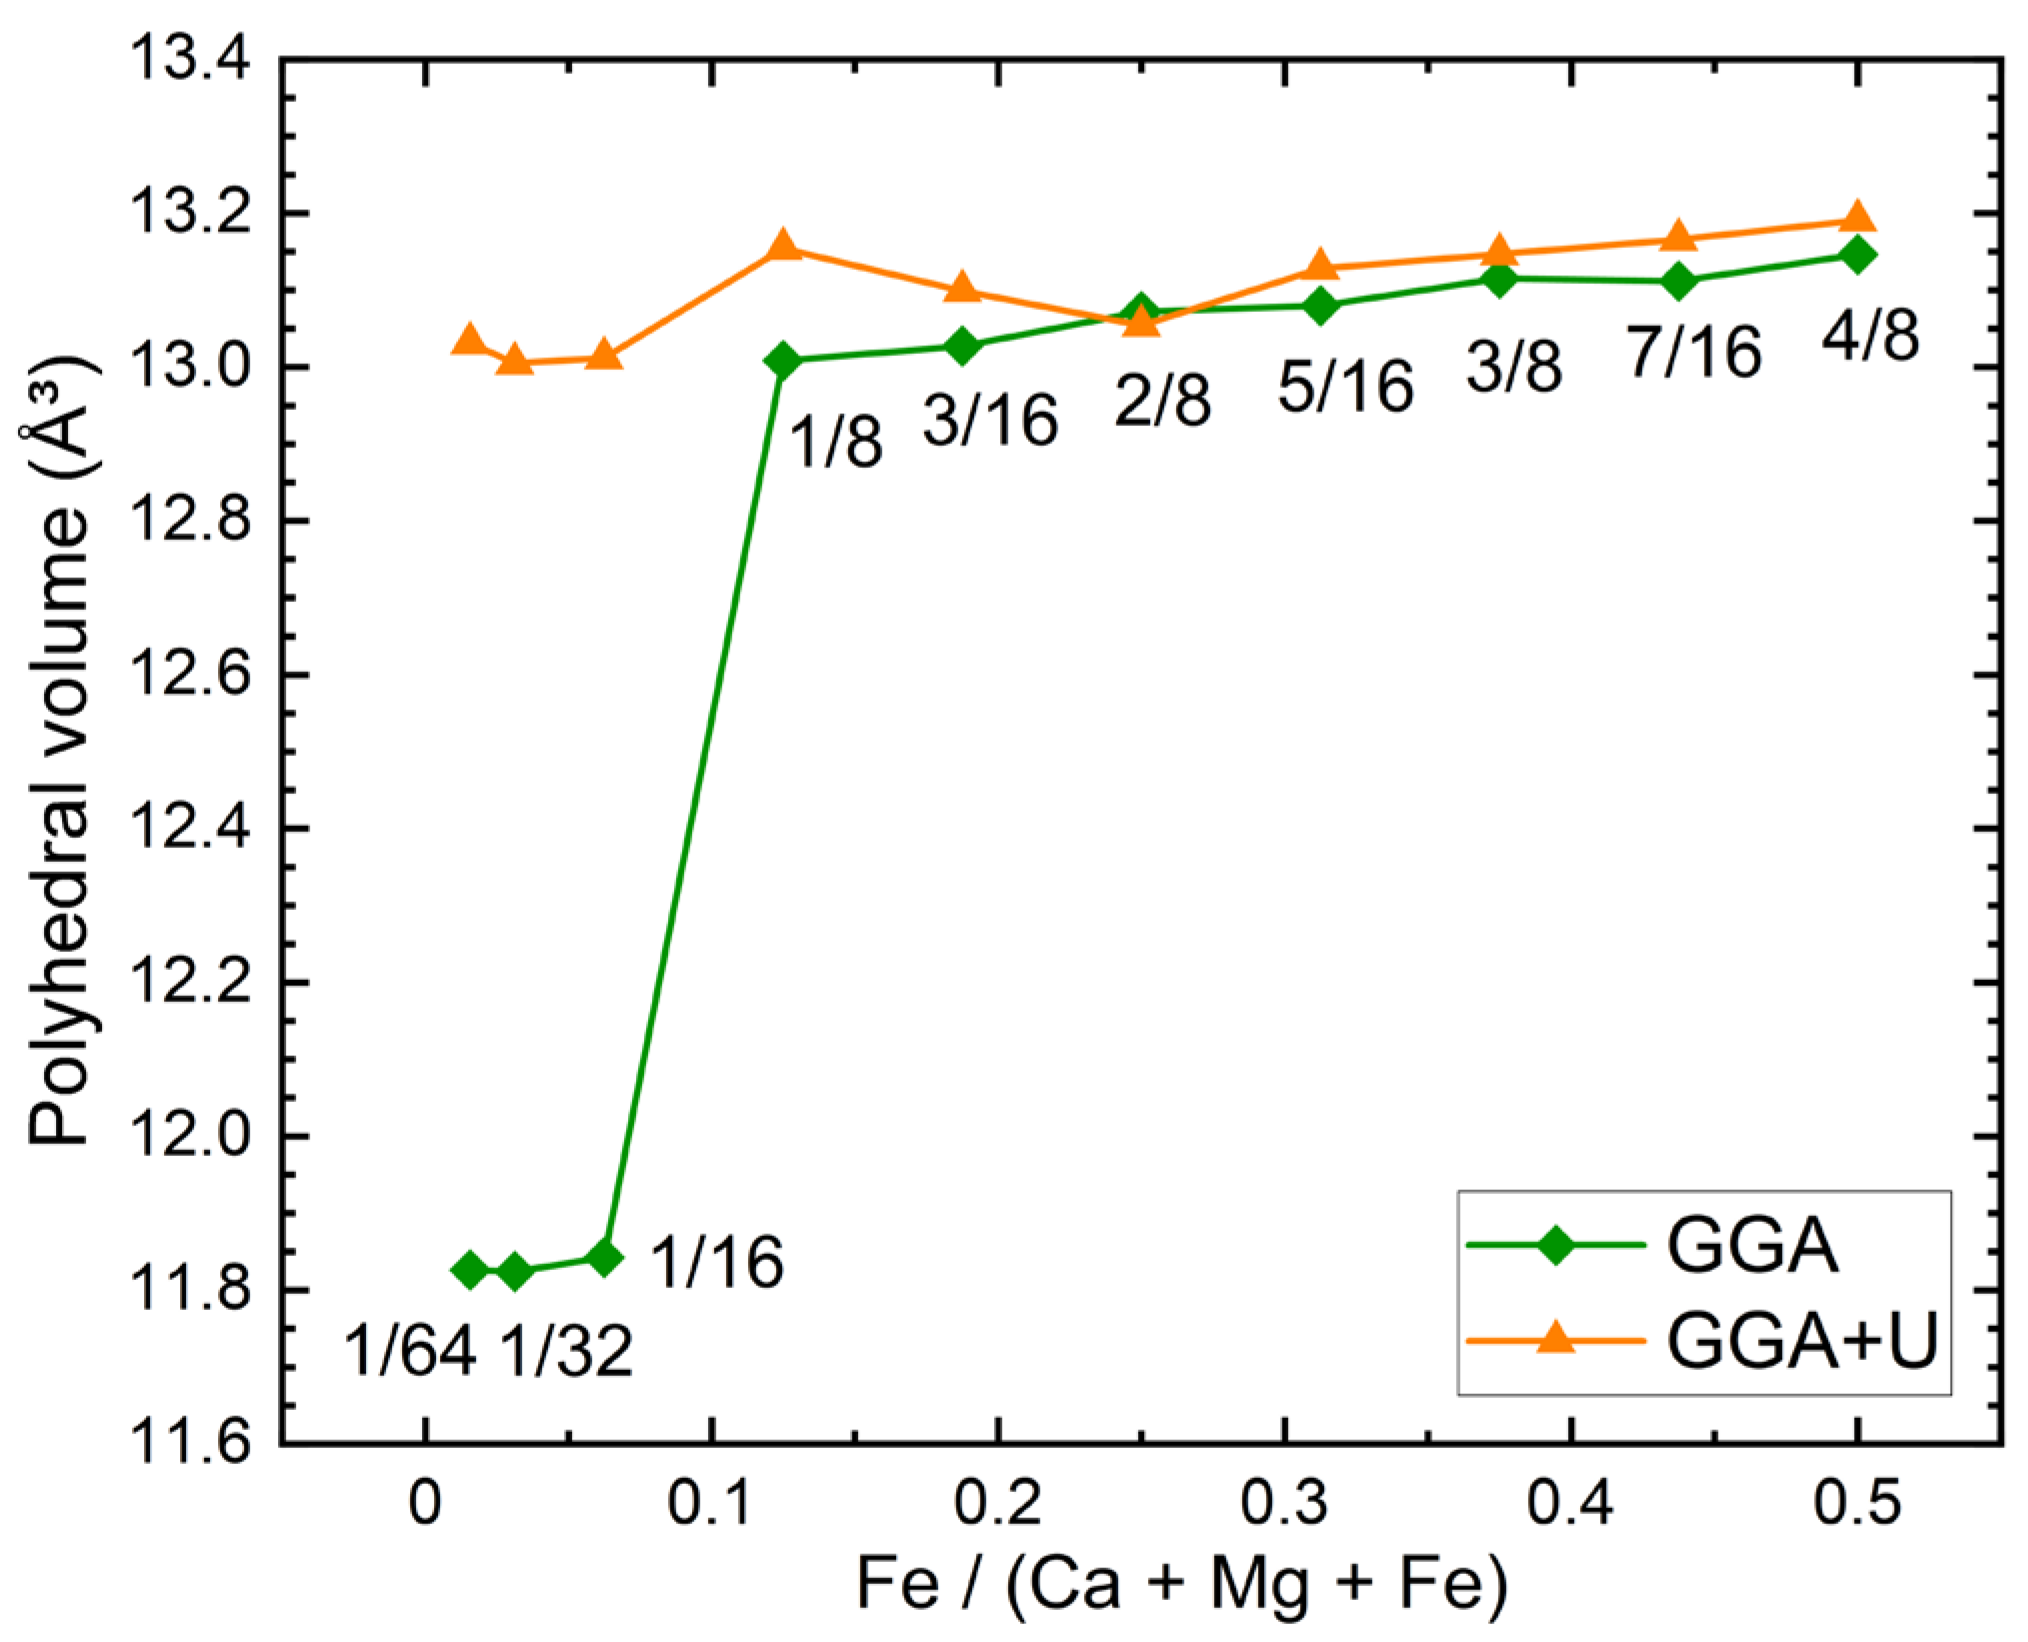
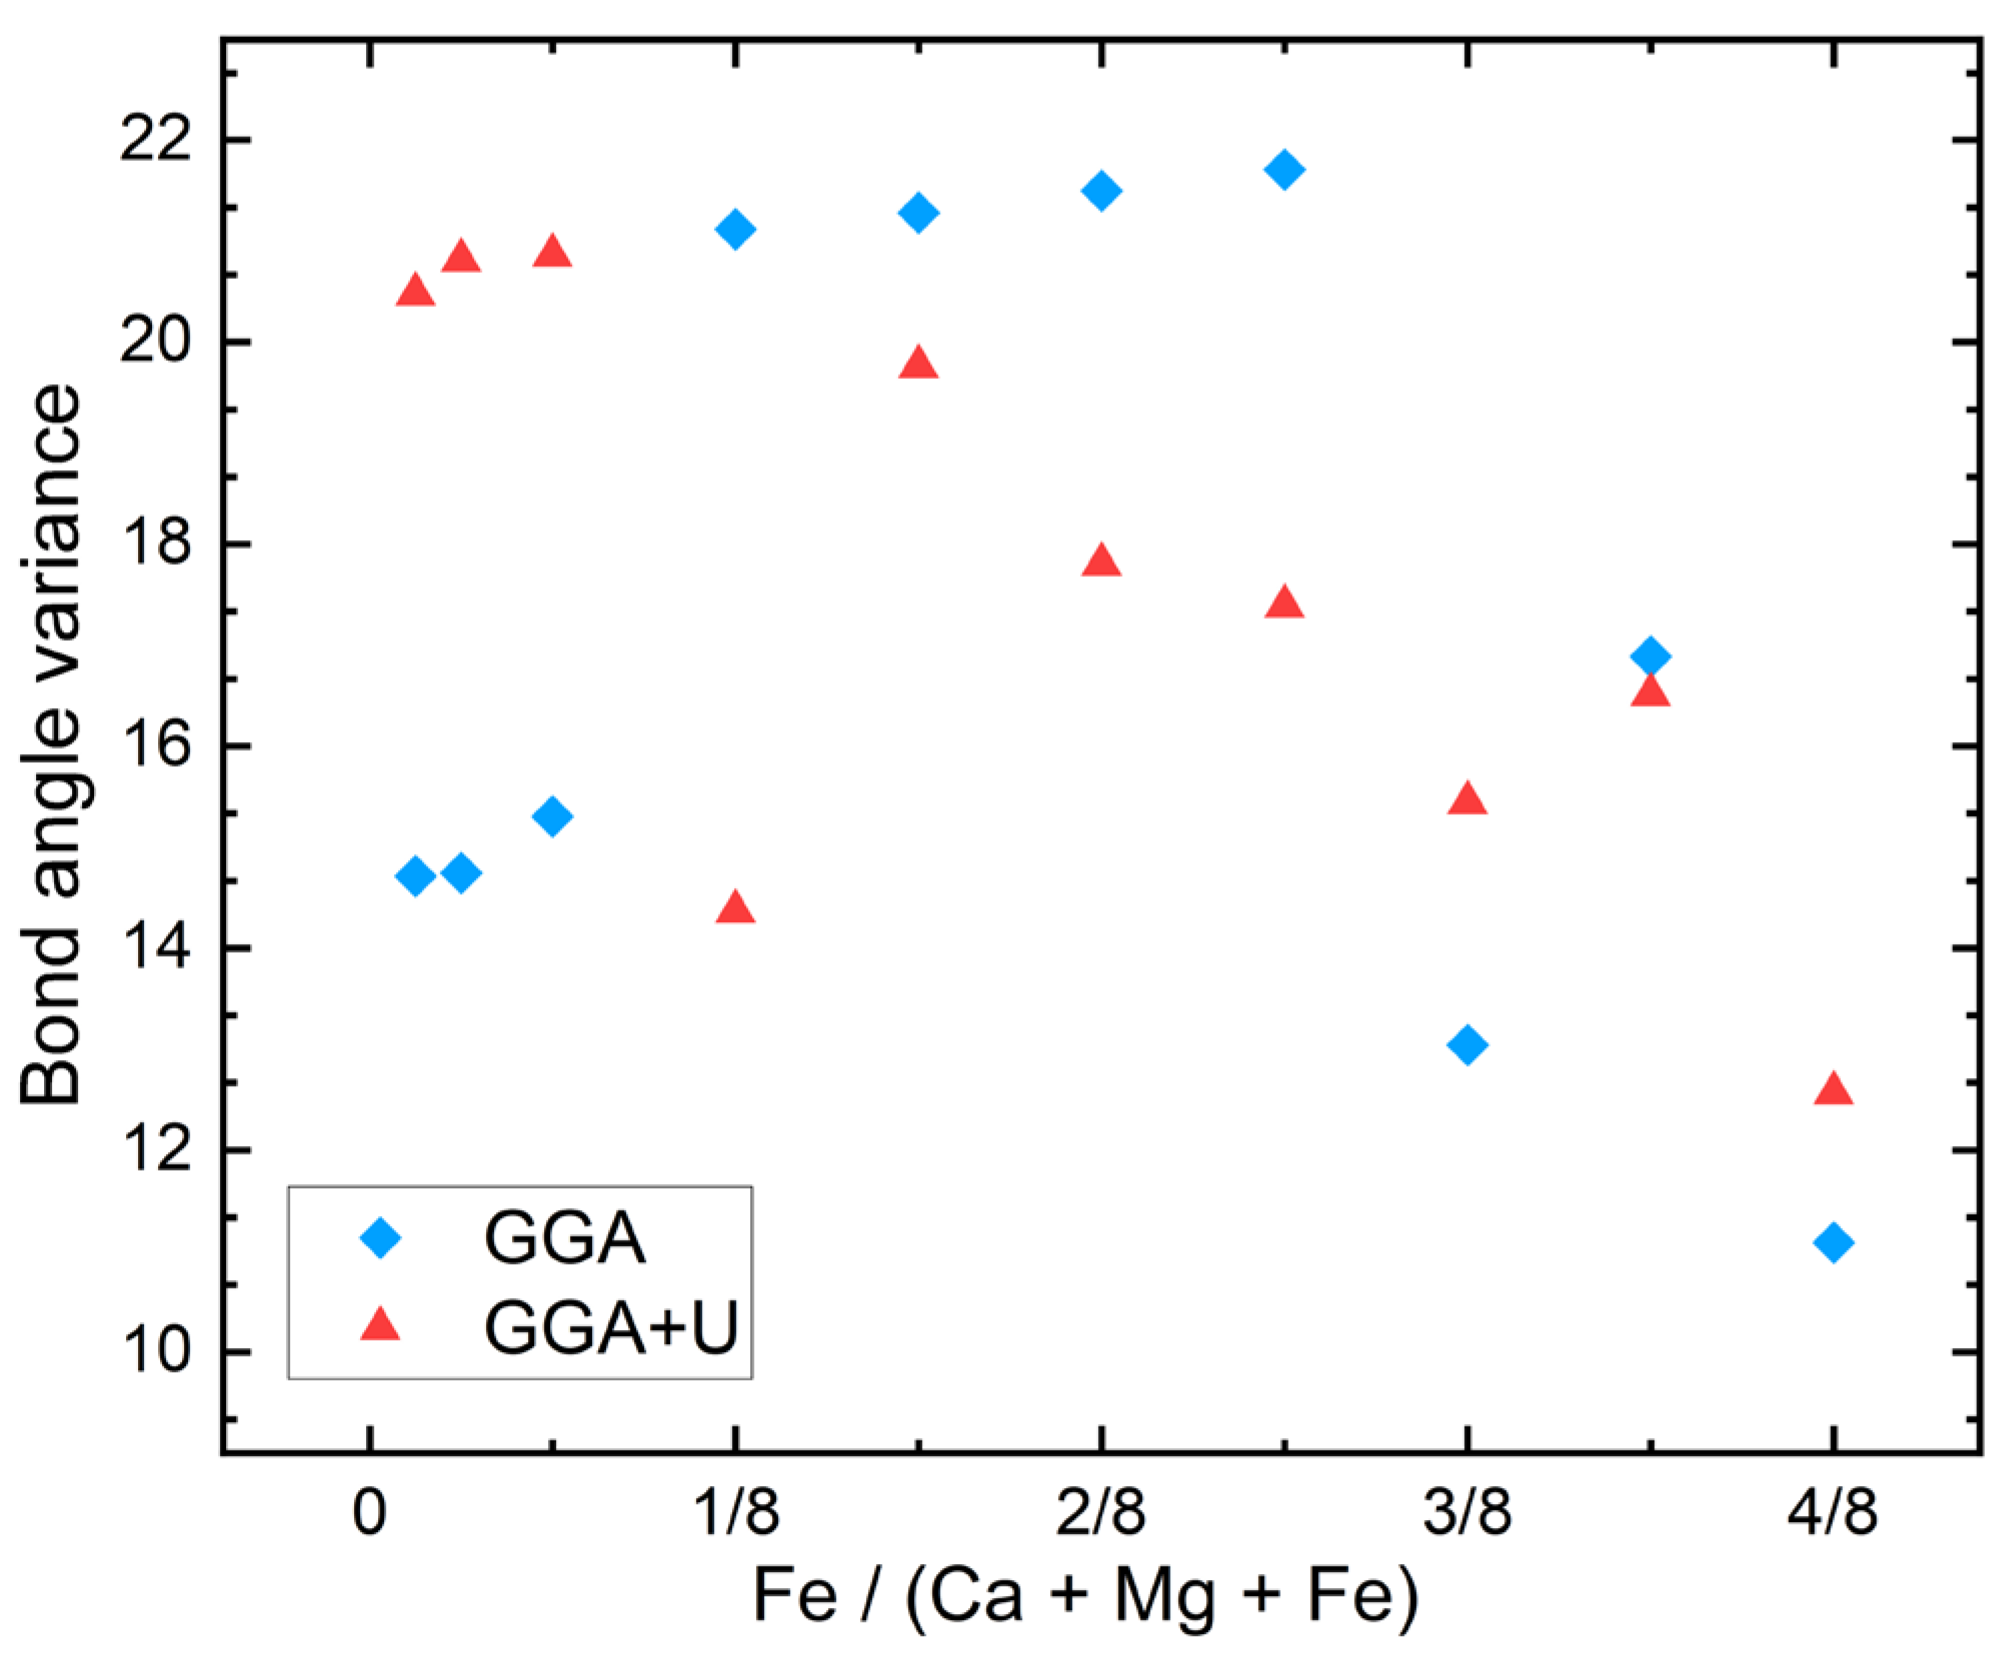
In the diopside–hedenbergite solid solution series, as the iron oxide octahedron gradually replaces the magnesium oxide octahedron, the coordination polyhedron in clinopyroxene will produce different degrees of distortion. In order to study the effect of U correction on polyhedron distortion, we compare different polyhedral distortion parameters calculated by GGA and GGA + U. The specific data are drawn in Figure 5 and Figure 6 and listed in Table 3 and Table 4. In addition, for clinopyroxene containing multiple polyhedra, the distortion parameters of all single polyhedra are shown in Tables S6 and S7.
Figure 5.
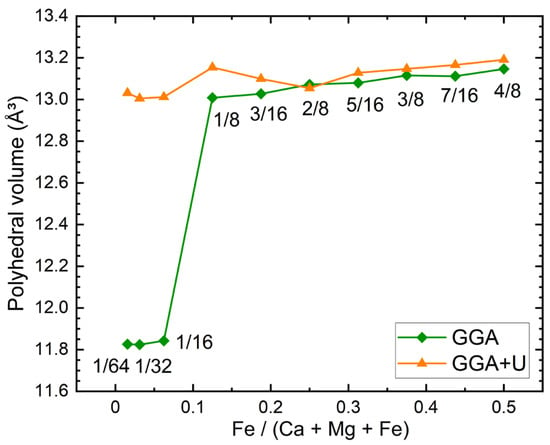
Correlations between Fe/(Ca + Mg + Fe) ratio and polyhedral volume in clinopyroxene.
Figure 6.
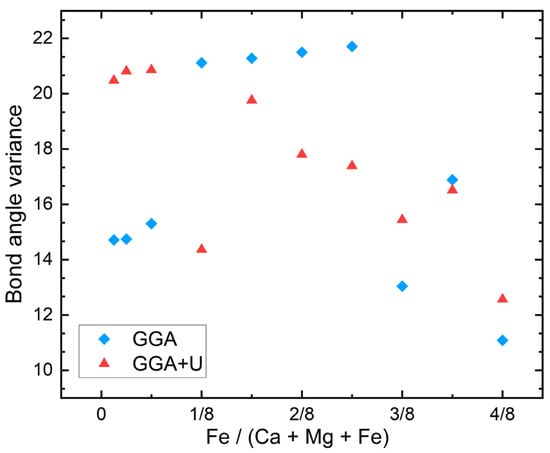
Correlations between Fe/(Ca + Mg + Fe) ratio and bond angle variance in clinopyroxene.
Table 3.
The calculated individual polyhedron distortion parameters of clinopyroxenes using GGA.
Table 4.
The calculated individual polyhedron distortion parameters of clinopyroxenes using GGA + U.
As shown in Figure 5, the trends of polyhedral volume calculated by GGA and GGA + U with Fe content are similar to the trends of average Fe-O bond length. In the GGA + U calculation, the polyhedral volume stabilizes in the range of 13.0048–13.0314 Å3 as Fe/(Ca + Mg + Fe) increases from 1/64 to 1/16, then increases sharply to 13.1542 Å3 as Fe/(Ca + Mg + Fe) reaches 1/8, decreases to 13.0540 Å3 at Fe/(Ca + Mg + Fe) = 2/8, and finally increases slightly to 13.1906 Å3 at Fe/(Ca + Mg + Fe) = 4/8. In the GGA calculation, the average Fe-O bond length is stable in the range of 11.8243–11.8261 Å3 as Fe/(Ca + Mg + Fe) increases from 1/64 to 1/16, then increases sharply to 13.0081 Å3 as Fe/(Ca + Mg + Fe) reaches 1/8, increases slightly when Fe/(Ca + Mg + Fe) > 2/8, and finally reaches 13.1906 Å3 at Fe/(Ca + Mg + Fe) = 4/8. For the polyhedral volumes of GGA and GGA + U, the maximum increase occurs when the Fe content is 1/16 to 1/8, but the increase amplitude of GGA is much larger than that of GGA + U. The polyhedral volumes calculated by GGA and GGA + U both increase with increasing Fe/(Ca + Mg + Fe), but the growth trend of GGA shows a significant concentration effect, while that of GGA + U is not obvious. Therefore, the effect of Hubbard U correction on polyhedron volume is more significant only at low Fe concentration (Fe/(Ca + Mg + Fe) < 1/8). The reason for this trend is similar to the average Fe-O bond length.
As shown in Figure 6, the bond-angle variance is used to specifically measure the angular distortion by calculating the variance of all bond angles in the polyhedron and the ideal bond angle (such as 90° in the octahedron). As shown in Figure 6, the bond angle variances calculated by GGA + U are greater than those of GGA when Fe/(Ca + Mg + Fe) is both <1/8 and >5/16, and lower than those of GGA only when the Fe/(Ca + Mg + Fe) ratio is between 1/8 and 5/16. This indicates that the U correction is obvious only at a relatively medium Fe content (when Fe/(Ca + Mg + Fe) from 1/8 to 5/16), making the bond angle distortion smaller and closer to the ideal bond angle. The larger the twist index (bond length) value or the more the secondary elongation deviates from one (completely regular polyhedron, secondary elongation is one), the greater the degree of polyhedron distortion. As shown in Table 3 and Table 4, both the distortion index and quadratic elongation calculated by GGA + U are lower than those of GGA only when the Fe/(Ca + Mg + Fe) ratio is between 1/8 and 5/16 (except for the distortion index of Fe/(Ca + Mg + Fe) = 7/16). These trends are consistent with the change trend of bond angle variance: U correction is only obvious at relatively medium Fe content. The distortion index and quadratic elongation are not large in both GGA and GGA + U calculations, indicating that the distortion is not serious in the process of replacing magnesium with iron in clinopyroxene.
3.4. Influence of Hubbard U Correction on Electronic Structure and Lattice Dynamical Properties
In this study, the influence of Hubbard U effect correction on the structures of diopside–hedenbergite solid solution series was studied by comparing the change trend of different structural parameters calculated by GGA and GGA + U with increasing Fe content. In addition to the accurate description of the crystal geometry, the Hubbard U correction is also crucial for obtaining other key physical and chemical properties of iron-bearing minerals. Firstly, in terms of electronic structure, the Hubbard U correction can correctly open the band gap and provide an accurate electronic ground state for subsequent calculations. Secondly, the U correction is directly related to magnetism, which is crucial for understanding the magnetic properties of minerals and the magnetic ordered structure (such as antiferromagnetic transition) at low temperatures. Finally, the U correction also significantly affects the lattice dynamics and thermodynamic properties. The vibration entropy, heat capacity, and elastic constant of minerals can be obtained by phonon spectrum calculation.
4. Conclusions
The lattice contents, unit-cell volume, and Fe-O bond lengths of diopside–hedenbergite solid solution series were calculated by GGA and GGA + U methods. The crystal structures calculated by GGA and GGA + U are in good agreement with the measured values, with the lattice constant errors both within 1.9% and the cell volume errors within 3.1% and 3.3%, respectively. In the GGA + U calculation, with the increase in Fe content, the lattice constant a (except for Fe/(Ca + Mg + Fe) = 7/16) and cell volume increase, the lattice constant β decreases, the lattice constant c remains stable within 5.320–5.333 Å, and the lattice constant b deviates from the experiment. In the GGA calculation, only the increasing trend of the lattice constant a with the increase in Fe content is in good agreement with the measured data. Consequently, the structural variation by GGA + U is more consistent with the experiment than GGA with increasing Fe content.
The average Fe-O bond length calculated by GGA and GGA + U both increased with Fe content from 1/64 to 4/8. The GGA + U calculated average Fe-O bond length increases slowly and evenly, from 2.1448 to 2.1507 by only 0.28%. While the GGA calculated average Fe-O bond length increased by 3.5%, the increase was only obvious in a narrow range (1/16 ≤ Fe/(Ca + Mg + Fe) ≤ 2/8), and almost remained stable when the Fe content was less than 1/16 or more than 2/8. The trend of average Fe-O bond length in clinopyroxene calculated by GGA shows a stronger concentration effect than that of GGA+ U with increasing Fe content.
The polyhedral volume calculated by GGA and GGA + U both increased with Fe content from 1/64 to 4/8, and these change trends are well consistent with those of the average Fe-O bond length. The bond angle variance, distortion index, and quadratic elongation calculated by GGA + U are lower than those of GGA only when the Fe/(Ca + Mg + Fe) ratio is between 1/8 and 5/16.
The Hubbard U correction has great significant impact on unite-cell volume at medium–high Fe content (Fe/(Ca+ Mg + Fe) > 2/8), while significantly affecting the average Fe-O bond and polyhedral volume at low Fe content (Fe/(Ca+ Mg + Fe) < 1/8), and polyhedral distortion parameters (the bond angle variance, distortion index, and quadratic elongation) at relatively medium Fe content (1/8 ≤ Fe/(Ca+ Mg + Fe) ≤ 5/16).
Supplementary Materials
The following supporting information can be downloaded at: https://www.mdpi.com/article/10.3390/min16030336/s1. Table S1: The unit-cell size and configuration number of the initial clinopyroxene structure with different Fe content; Table S2: The U-value and k-mesh for structural optimization of clinopyroxene; Table S3: Calculated crystal structure of clinopyroxene using GGA; Table S4: Calculated crystal structure of clinopyroxene using GGA + U; Table S5: Previous calculated and experimental lattice contents and unit-cell volumes of clinopyroxene; Table S6: The calculated individual polyhedron distortion parameters of clinopyroxenes using GGA; Table S7: The calculated individual polyhedron distortion parameters of clinopyroxenes using GGA + U.
Author Contributions
Conceptualization, Q.W. and Y.Z.; methodology, Q.W. and Y.Z.; software, Y.L. (Yongbing Li); validation, Q.W., Y.Z. and Y.L. (Yonghui Li); investigation, Q.W., Y.Z., Y.L. (Yongbing Li) and Y.L. (Yonghui Li); resources, Y.L. (Yongbing Li), Y.L. (Yonghui Li) and S.L.; data curation, Q.W., Y.Z. and Y.L. (Yonghui Li); writing—original draft preparation, Q.W. and Y.Z.; writing—review and editing, Q.W., Y.Z. and Y.L. (Yongbing Li); visualization, Y.L. (Yongbing Li) and S.L.; supervision, Y.L. (Yongbing Li), Y.L. (Yonghui Li) and S.L.; funding acquisition, Y.L. (Yongbing Li). All authors have read and agreed to the published version of the manuscript.
Funding
This study was supported by the National Key Research and Development Program of China (2022YFC2903304).
Data Availability Statement
The original contributions in this study are included in the article, and you can contact the corresponding author directly for further inquiries.
Conflicts of Interest
The authors declare no conflicts of interest.
Correction Statement
This article has been republished with a minor correction to the existing affiliation information. This change does not affect the scientific content of the article.
References
- Anderson, D.L.; Bass, J.D. Mineralogy and composition of the upper mantle. Geophys. Res. Lett. 1984, 11, 637–640. [Google Scholar] [CrossRef] [Scilit]
- Neave, D.A.; Putirka, K.D. A new clinopyroxene-liquid barometer, and implications for magma storage pressures under Icelandic rift zones. Am. Mineral. 2017, 102, 777–794. [Google Scholar] [CrossRef] [Scilit]
- Huang, F.; Chen, L.; Wu, Z.; Wang, W. First-principles calculations of equilibrium Mg isotope fractionations between garnet, clinopyroxene, orthopyroxene, and olivine: Implications for Mg isotope thermometry. Earth Planet. Sci. Lett. 2013, 367, 61–70. [Google Scholar] [CrossRef] [Scilit]
- Turnock, A.C.; Lindsley, D.H.; Grover, J.E. Synthesis and unit cell parameters of Ca-Mg-Fe pyroxenes. Am. Mineral. 1973, 58, 50–59. [Google Scholar]
- Perkins, D.; Vielzeuf, D. Experimental investigation of Fe-Mg distribution between olivine and clinopyroxene: Implications for mixing properties of Fe-Mg in clinopyroxene and garnet-clinopyroxene thermometry. Am. Mineral. 1992, 77, 774–783. [Google Scholar]
- Zhang, L.; Ahsbahs, H.; Hafner, S.S.; Kutoglu, A. Single-crystal compression and crystal structure of clinopyroxene up to 10 GPa. Am. Mineral. 1997, 82, 245–258. [Google Scholar] [CrossRef] [Scilit]
- Thompson, R.M.; Downs, R.T. The crystal structure of diopside at pressure to 10 GPa. Am. Mineral. 2008, 93, 177–186. [Google Scholar] [CrossRef] [Scilit]
- Huber, A.L.; Heuer, M.; Fehr, K.T.; Bente, K.; Schmidbauer, E.; Bromiley, G.D. Characterization of synthetic hedenbergite (CaFeSi2O6)–petedunnite (CaZnSi2O6) solid solution series by X-ray powder diffraction and 57Fe Mössbauer spectroscopy. Phys. Chem. Miner. 2004, 31, 67–79. [Google Scholar] [CrossRef] [Scilit]
- Redhammer, G.J.; Amthauer, G.; Roth, G.; Tippelt, G.; Lottermoser, W. Single-crystal X-ray diffraction and temperature dependent 57Fe Mossbauer spectroscopy on the hedenbergite-aegirine (Ca, Na)(Fe2+, Fe3+) Si2O6 solid solution. Am. Mineral. 2006, 91, 1271–1292. [Google Scholar] [CrossRef] [Scilit]
- Johari, N.A.; Hamzah, N.; Faizal, A.F.A.; Samat, M.H.; Hassan, O.H.; Ali, A.M.M.; Yahya, M.Z.A.; Taib, M.F.M. Effects of Hubbard U correction on the structural and electronic properties of rutile, anatase and brookite TiO2. Mater. Today Proc. 2022, 66, 4061–4067. [Google Scholar] [CrossRef] [Scilit]
- Li, Y.; Chen, J.; Chen, Y.; Zhao, C.; Lee, M.-H.; Lin, T.-H. DFT+ U study on the electronic structures and optical properties of pyrite and marcasite. Comput. Mater. Sci. 2018, 150, 346–352. [Google Scholar] [CrossRef] [Scilit]
- Watanabe, Y. DFT + U accurate for strain effect and overall properties of perovskite oxide ferroelectrics and polaron. J. Appl. Phys. 2024, 135, 224103. [Google Scholar] [CrossRef] [Scilit]
- Liu, S.; Li, Y.; Liu, J.; Ju, Y.; Liu, J.; Yang, Z.; Shi, Y. Equilibrium lithium isotope fractionation in Li-bearing minerals. Geochim. Cosmochim. Acta 2018, 235, 360–375. [Google Scholar]
- Wang, W.; Wu, Z.; Huang, S.; Huang, F. First-principles investigation of equilibrium magnesium isotope fractionation among mantle minerals: Review and new data. Earth-Sci. Rev. 2023, 237, 104315. [Google Scholar]
- Li, Y.; Wang, W.; Huang, S.; Wang, K.; Wu, Z. First-principles investigation of the concentration effect on equilibrium fractionation of K isotopes in feldspars. Geochim. Cosmochim. Acta 2019, 245, 374–384. [Google Scholar] [CrossRef] [Scilit]
- Liu, S.; Li, Y.; Li, M.; Yang, Z.; Liu, J.; Shen, Y. Equilibrium fractionation of S, Fe, and Ni isotopes in Fe-Ni sulfides: A first-principles investigation. Chem. Geol. 2022, 610, 121100. [Google Scholar] [CrossRef] [Scilit]
- Anisimov, V.I.; Zaanen, J.; Andersen, O.K. Band theory and Mott insulators: Hubbard U instead of Stoner I. Phys. Rev. B 1991, 44, 943. [Google Scholar] [CrossRef] [Scilit]
- Timrov, I.; Marzari, N.; Cococcioni, M. Hubbard parameters from density-functional perturbation theory. arXiv 2018, arXiv:1805.01805. [Google Scholar] [CrossRef] [Scilit]
- Blanchard, M.; Dauphas, N.; Hu, M.Y.; Roskosz, M.; Alp, E.E.; Golden, D.C.; Sio, C.K.; Tissot, F.L.H.; Zhao, J.; Gao, L. Reduced partition function ratios of iron and oxygen in goethite. Geochim. Cosmochim. Acta 2015, 151, 19–33. [Google Scholar] [CrossRef] [Scilit]
- Wang, W.; Huang, S.; Huang, F.; Zhao, X.; Wu, Z. Equilibrium inter-mineral titanium isotope fractionation: Implication for high-temperature titanium isotope geochemistry. Geochim. Cosmochim. Acta 2020, 269, 540–553. [Google Scholar] [CrossRef] [Scilit]
- Wang, W.; Liu, J.; Zhu, F.; Li, M.; Dorfman, S.M.; Li, J.; Wu, Z. Formation of large low shear velocity provinces through the decomposition of oxidized mantle. Nat. Commun. 2021, 12, 1911. [Google Scholar] [CrossRef] [Scilit]
- Liu, S.; Li, Y.; Yang, Z.; Tian, H.; Liu, J. Reduced partition function ratios of iron, magnesium, oxygen, and silicon isotopes in olivine: A GGA and GGA+ U study. Geochim. Cosmochim. Acta 2024, 384, 111–127. [Google Scholar] [CrossRef] [Scilit]
- Hohenberg, P.; Kohn, W. Inhomogeneous electron gas. Phys. Rev. 1964, 136, B864. [Google Scholar] [CrossRef] [Scilit]
- Kohn, W.; Sham, L.J. Self-consistent equations including exchange and correlation effects. Phys. Rev. 1965, 140, A1133. [Google Scholar] [CrossRef] [Scilit]
- Perdew, J.P.; Burke, K.; Ernzerhof, M. Generalized gradient approximation made simple. Phys. Rev. Lett. 1996, 77, 3865. [Google Scholar] [CrossRef] [Scilit] [PubMed]
- Feng, C.; Qin, T.; Huang, S.; Wu, Z.; Huang, F. First-principles investigations of equilibrium calcium isotope fractionation between clinopyroxene and Ca-doped orthopyroxene. Geochim. Cosmochim. Acta 2014, 143, 132–142. [Google Scholar] [CrossRef] [Scilit]
- Rabin, S.; Blanchard, M.; Pinilla, C.; Poitrasson, F.; Grégoire, M. First-principles calculation of iron and silicon isotope fractionation between Fe-bearing minerals at magmatic temperatures: The importance of second atomic neighbors. Geochim. Cosmochim. Acta 2021, 304, 101–118. [Google Scholar] [CrossRef] [Scilit]
- Wang, W.; Qin, T.; Zhou, C.; Huang, S.; Wu, Z.; Huang, F. Concentration effect on equilibrium fractionation of Mg-Ca isotopes in carbonate minerals: Insights from first-principles calculations. Geochim. Cosmochim. Acta 2017, 208, 185–197. [Google Scholar] [CrossRef] [Scilit]
- Kresse, G.; Furthmüller, J. Efficiency of ab-initio total energy calculations for metals and semiconductors using a plane-wave basis set. Comput. Mater. Sci. 1996, 6, 15–50. [Google Scholar]
- Monkhorst, H.J.; Pack, J.D. Special points for Brillouin-zone integrations. Phys. Rev. B 1976, 13, 5188. [Google Scholar] [CrossRef] [Scilit]
- Momma, K.; Izumi, F. VESTA: A three-dimensional visualization system for electronic and structural analysis. J. Appl. Crystallogr. 2008, 41, 653–658. [Google Scholar] [CrossRef] [Scilit]
- Cococcioni, M.; De Gironcoli, S. Linear response approach to the calculation of the effective interaction parameters in the LDA+ U method. Phys. Rev. B—Condens. Matter Mater. Phys. 2005, 71, 035105. [Google Scholar] [CrossRef] [Scilit]
- Wentzcovitch, R.M. Invariant molecular-dynamics approach to structural phase transitions. Phys. Rev. B 1991, 44, 2358. [Google Scholar] [CrossRef] [Scilit] [PubMed]
- Fakhera, F.; Shahed, N.A.; Khanom, S.; Hossain, M.K.; Ahmed, F. The first-principle study on structural, mechanical, electronic and optical properties of half-metallic CaMSi2O6 (M = Co, Fe, Mn) clinopyroxenes. Comput. Condens. Matter 2022, 33, e00749. [Google Scholar] [CrossRef] [Scilit]
- Shannon, R.D. Revised effective ionic radii and systematic studies of interatomic distances in halides and chalcogenides. Found. Crystallogr. 1976, 32, 751–767. [Google Scholar] [CrossRef] [Scilit]
- Clemens, J.D.; Holloway, J.R.; White, A.J.R. Origin of an A-type granite; experimental constraints. Am. Mineral. 1986, 71, 317–324. [Google Scholar]
- Wang, W.; Zhou, C.; Qin, T.; Kang, J.-T.; Huang, S.; Wu, Z.; Huang, F. Effect of Ca content on equilibrium Ca isotope fractionation between orthopyroxene and clinopyroxene. Geochim. Cosmochim. Acta 2017, 219, 44–56. [Google Scholar] [CrossRef] [Scilit]
- Song, Y.; Li, Y.; Wang, W.; Wu, Z. First-principles investigation of the concentration effect on equilibrium fractionation of Ca isotopes in forsterite. Acta Geochim. 2019, 38, 497–507. [Google Scholar] [CrossRef] [Scilit]

Disclaimer/Publisher’s Note: The statements, opinions and data contained in all publications are solely those of the individual author(s) and contributor(s) and not of MDPI and/or the editor(s). MDPI and/or the editor(s) disclaim responsibility for any injury to people or property resulting from any ideas, methods, instructions or products referred to in the content. |
© 2026 by the authors. Licensee MDPI, Basel, Switzerland. This article is an open access article distributed under the terms and conditions of the Creative Commons Attribution (CC BY) license.