


Abstract
To the authors’ knowledge, this is the first industrial machine learning (ML) study focused on wet vertical stirred media milling. The study develops and validates machine learning (ML) models to predict the key operating parameters, namely mill discharge product size, mill feed slurry flow rate, mill power draw, and the specific energy consumption of an industrial wet vertical stirred media mill operating at a copper plant. A physics-guided workflow was adapted, combining relief coefficient-based variable screening with fundamental stirred milling principles to define 20 different structured model input scenarios. In the scope, six regression approaches, linear regression (LR), fine tree regression (FTR), support vector regression (SVR), random forest regression (RFR), artificial neural network regression (ANN), and Gaussian process regression (GPR), were trained and validated using plant sensor data and evaluated using R2 and RMSE. Overall performance was reasonable, with GPR providing the highest predictive accuracy, followed by RFR/ANN, while LR, SVR, and FTR performed lower. The potential benefit of feed size was also assessed conceptually through an upper-bound sensitivity analysis, representing a best-case scenario where an online feed size measurement would be available. Because the feed size descriptor (F80) was not independently measured but derived from an energy–size relationship, the associated accuracy gains are reported as theoretical upper-bound indications rather than independent predictive capability. Overall, the findings support ML-based decision support in stirred milling operations and motivate future work using independently measured feed size (or reliable proxy sensing).
1. Introduction
The recent advances in artificial intelligence (AI) and machine learning (ML) have attracted the attention of various engineering domains, including mining and mineral industries. Improvements in computational power and data-handling capabilities now allow complex, multivariable problems to be solved more efficiently than in the past. As a result, AI-based techniques have emerged as powerful tools for extracting actionable insights from large volumes of industrial process data.
In modern mineral processing plants, the operational data is measured, recorded, and stored for process monitoring and control. These datasets are primarily used to maintain stable operation and identify circuit limitations. Moreover, such a large dataset offers potential for advanced process understanding and optimization. The mining and minerals industry is known as energy-intensive [1]; therefore, even a modest improvement may lead to a noticeable impact on the overall economy and carbon footprint. In addition to energy consumption, water and raw material management are the other key factors, which represent the environmental impacts and the sustainability of the sector. Although water has limited availability, its use has reached a significant level and the trend points to increases in the future [2,3]. Consequently, effective processing and interpretation of industrial “big data” using AI techniques may contribute not only to an improved economic performance but also to a reduced environmental impact.
In a mining operation, comminution has the highest share of energy utilization [4,5]. Therefore, the plants track the performance of this section by measuring and controlling the key performance indicators (KPI), such as product fineness, throughput, sump slurry flow rates, sump level, cyclone overflow product density, etc. Maintaining these KPIs within target ranges helps minimize process fluctuations and stabilize downstream operations [6,7,8]. This task relies heavily on operator experience, although advanced process control systems are increasingly employed. In this context, AI and ML techniques offer a strong alternative, enabling the development of multivariable predictive models that utilize real-time sensor data to forecast process behavior. In such approaches, algorithms learn underlying relationships from historical data and construct predictive models that can support process optimization and decision-making [9].
Comminution circuits face several inherent challenges that make them particularly suitable for AI-based applications. First, ore characteristics often vary significantly across different geological domains, necessitating continuous adjustments to operating conditions to maintain target production rates. Failure to adapt to such variability can result in throughput losses and operational instability. Second, operator-dependent behavior introduces additional variability, as similar feed conditions may yield different outcomes depending on individual operational practices [10,11]. This can lead to shift-based deviations and inconsistencies in plant performance. Together, these factors complicate budget forecasting, profitability assessment, and investment planning, which is one of the key responsibilities of process engineers. Improving predictability in comminution performance can therefore reduce operational pressure on plant personnel and improve overall planning accuracy, highlighting the potential value of AI-based tools.
Several AI- and ML-based studies have been reported in the comminution literature, primarily focusing on primary grinding equipment. SAG milling is considered as one of the best applications, since its grinding performance tends to vary noticeably with ore characteristics and liner conditions [12]. A recent study on SAG mill throughput prediction proposed a hybrid framework combining machine learning methods with expert knowledge. Based on 37,000 records, the framework achieved a mean R2 of 0.67 [13]. In another study, implementing an artificial neural network (ANN) for SAG mill operations increased throughput by 4.4% and reduced energy consumption by 7.6% [14]. Some studies reported the elimination of SAG overload downtime events with the development of machine learning algorithms [15]. Liner wear prediction in SAG mills was also studied by Pural et al. [16]. Other than SAG applications, some studies considered using an ML-based approach to measure the feed size with the aim of integrating it into process [17]. Recent studies have also investigated machine learning approaches for identifying operational regions and predicting performance indicators in SAG milling, demonstrating that data-driven models can improve process understanding and control strategies in grinding circuits [18]. High-pressure grinding rolls (HPGRs) were another technology of interest, and Tohry et al. [19] worked on the advanced modeling of an industrial-scale unit operated at an iron ore plant. The power draw of HPGRs was predicted as a function of operational conditions and material properties via different models, boosted neural network (BNN), random forest (RF), and support vector regression (SVR). The authors assessed the real-time data of industrial operation and demonstrated that BNN is superior to other models, having an R2 of 0.94 in the power prediction. Ball milling was studied by Tohry et al. [20], who utilized RF and emphasized the importance of such a modeling approach by discussing the drawbacks of empirical modeling. Similarly, they considered machine and material characteristics to predict the power draw of the ball mill. RF was found to have a higher level of correlation coefficient than the so-called typical regression model with an R2 of 0.94 > 0.6. Machine learning models have also been applied to analyze industrial grinding circuit data and predict key process variables such as grind size and operating conditions, demonstrating strong predictive capability compared with conventional empirical models [21]. Azhin et al. [22] emphasized the importance of soft sensor development and reported that sensors with neural network models are being utilized by industry.
Despite these advancements, comparatively limited attention has been given to fine grinding operations, such as regrind circuits, which play a critical role in downstream beneficiation efficiency. Wet vertical stirred media mills (WSMMs) are increasingly employed in such applications due to their superior energy efficiency and ability to produce fine and ultrafine particles [23,24]. Nevertheless, the grinding performance of these mills is governed by complex interactions among operational parameters such as stirrer speed, grinding media size, slurry rheology, and stress intensity, which complicates process monitoring and predictive modeling [25]. Recent research has begun to explore artificial intelligence-based monitoring approaches for stirred media mills, including neural network-based soft sensors capable of predicting particle size distribution and slurry viscosity from online measurements [26]. Hybrid modeling frameworks integrating numerical simulations with artificial intelligence techniques have also been proposed to model wet milling processes [27]. Nevertheless, AI-based predictive modeling studies for industrial-scale WSMM operations remain limited.
The present study aims to address this gap by developing and evaluating ML-based predictive models for an industrial-scale wet vertical stirred media mill. In addition to utilizing extensive real-time sensor data, a physically meaningful parameter—namely the feed size at 80% passing (F80)—was incorporated to characterize the feed and perform calculations under a hypothetical upper-bound scenario representing the potential predictive limit of ML models, even though F80 was back-calculated rather than independently measured. To the authors’ knowledge, this study represents one of the first applications of AI-based predictive modeling for industrial vertical WSMM operation that explicitly combines sensor-based data with a physical comminution descriptor. In the scope, six regression-based modeling approaches were evaluated and compared: linear regression (LR), fine tree regression (FTR), support vector regression (SVR), random forest regression (RFR), artificial neural network regression (ANN), and Gaussian process regression (GPR). Model performance was assessed statistically using the coefficient of determination (R2), and the most accurate predictive models were identified for key operating parameters under industrial process conditions.
2. Materials and Methods
2.1. Research Methodology
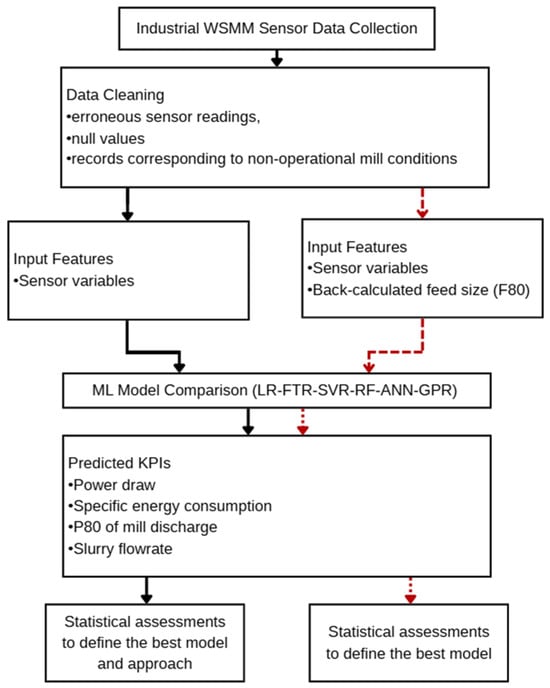
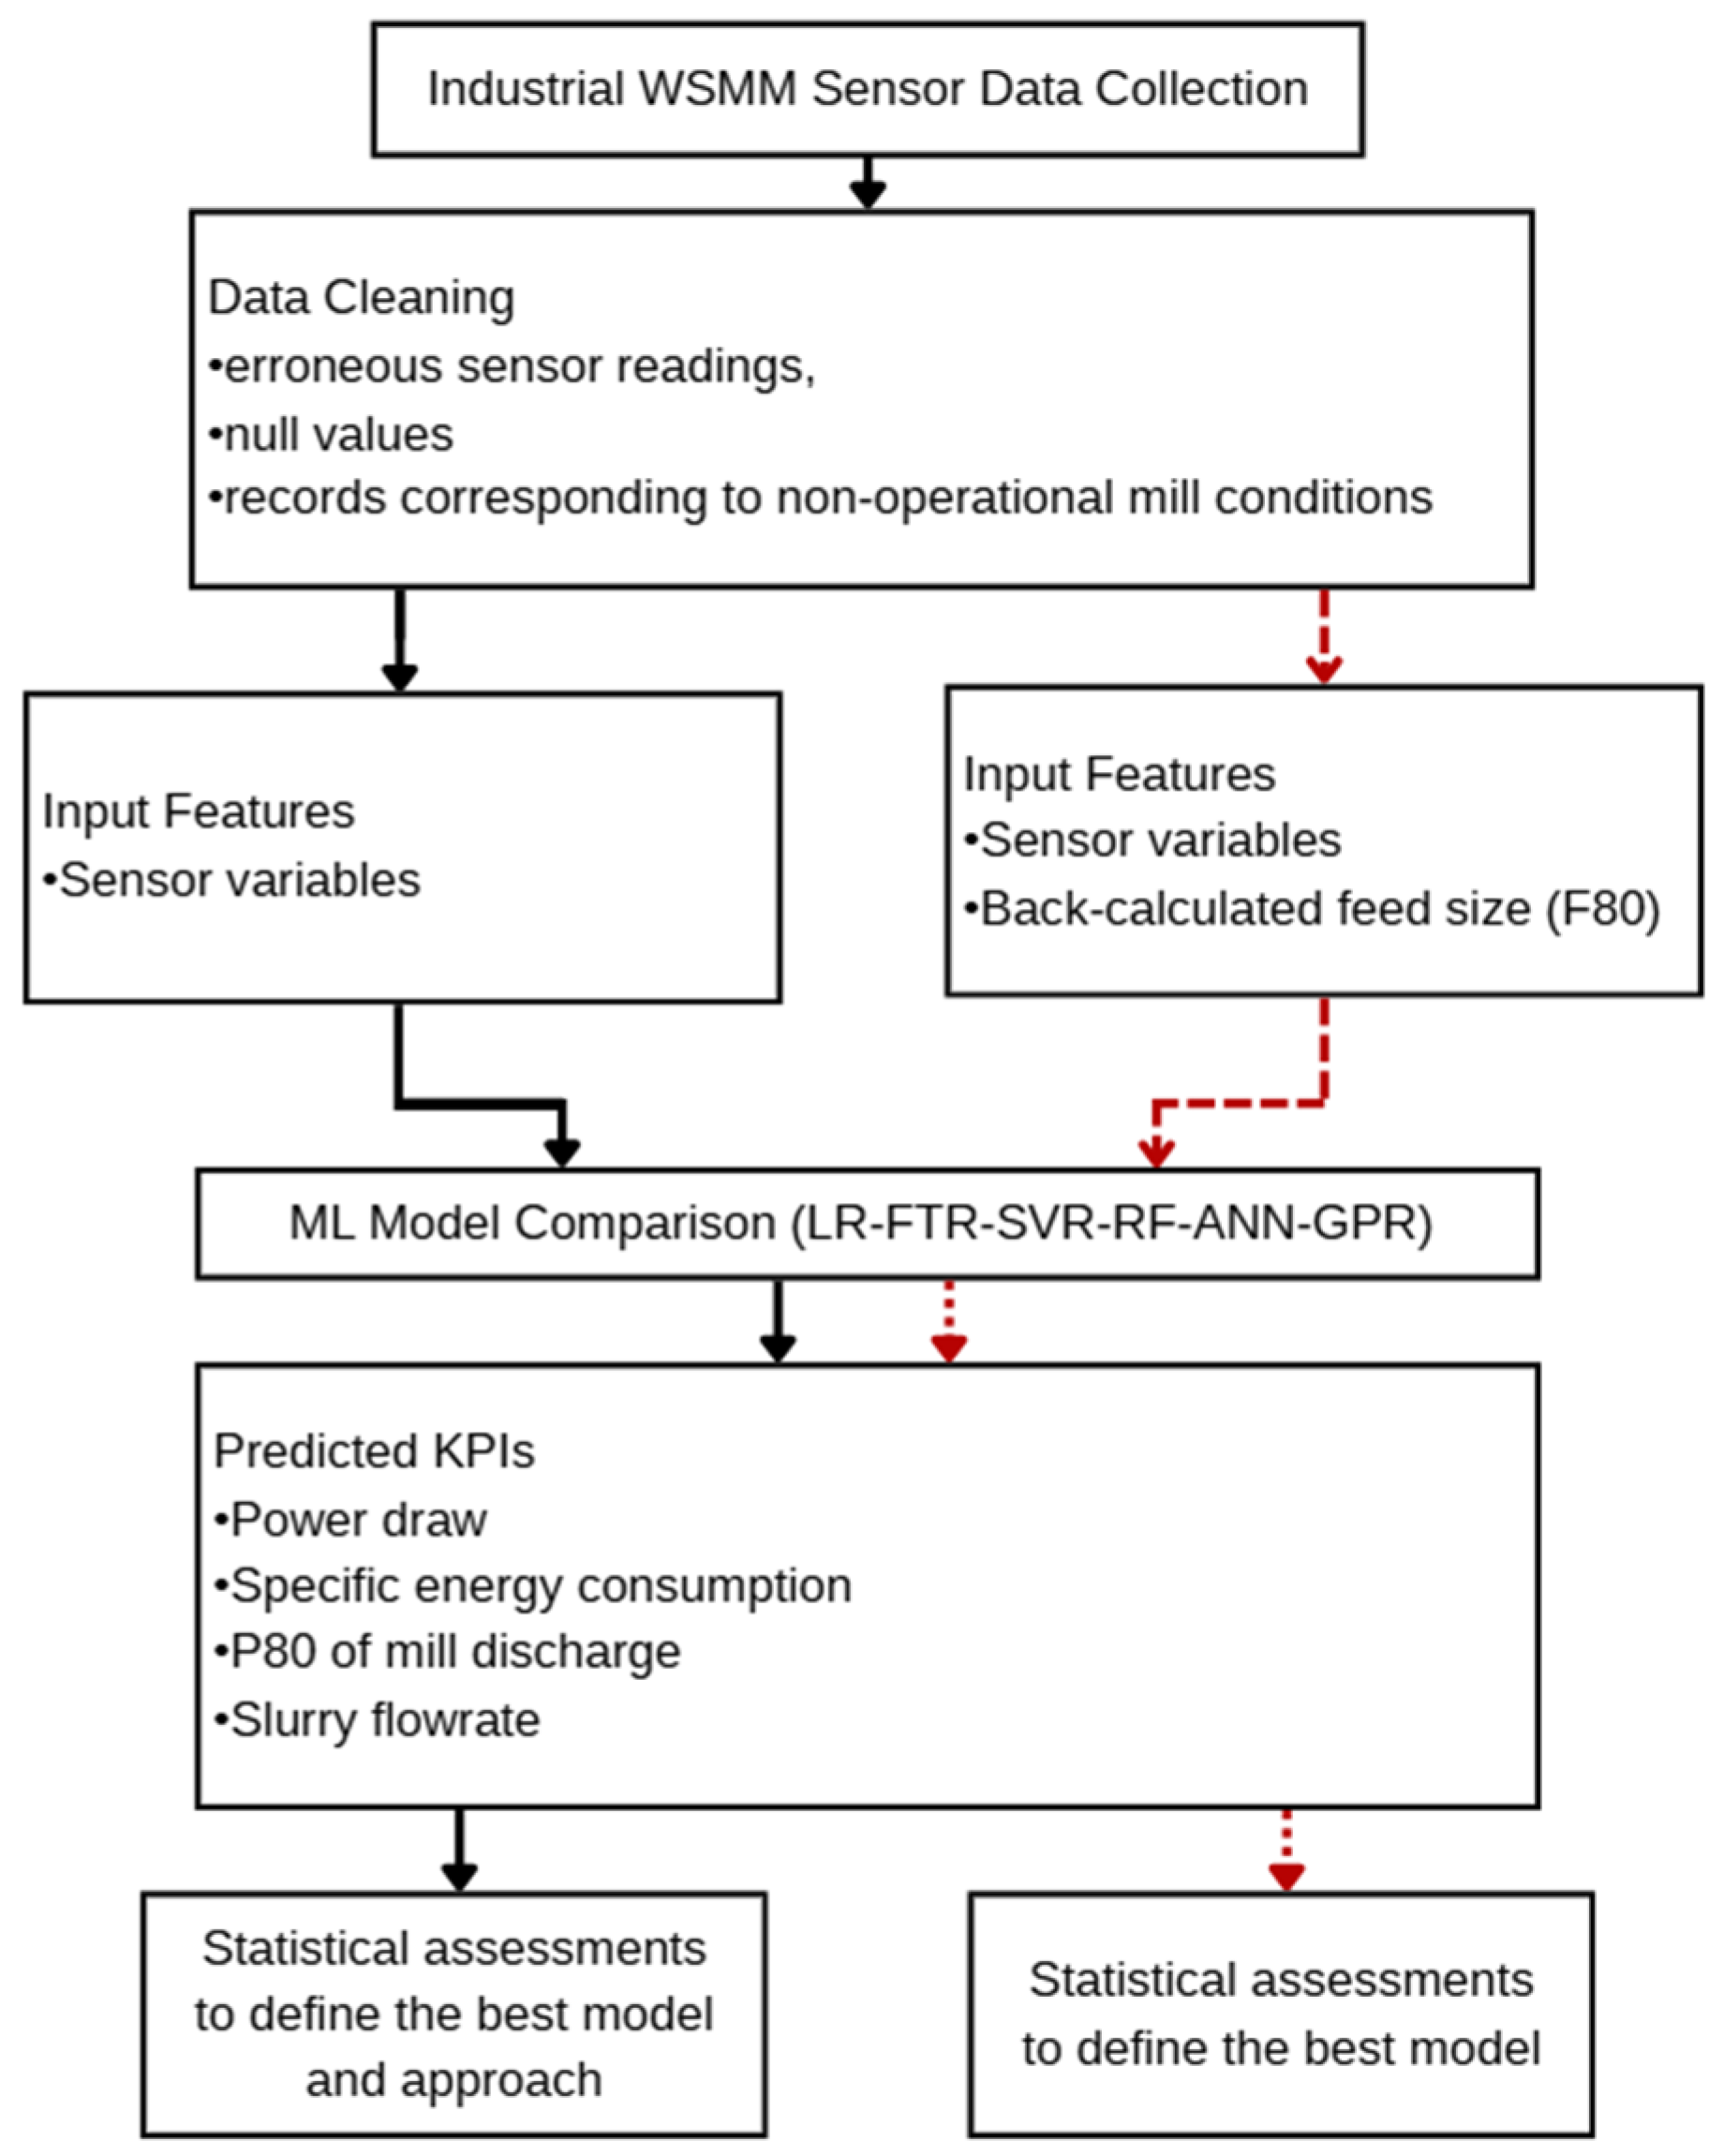
The overall research methodology is illustrated in Figure 1. High-frequency operational sensor data were collected from an industrial-scale wet vertical stirred media mill (WSMM). Prior to model development, the dataset underwent a data-cleaning procedure to ensure reliability and consistency. This process involved identifying and removing erroneous sensor readings, null values, and records associated with non-operational mill conditions. After preprocessing, two alternative input feature configurations were considered. The first configuration used only the available process sensor variables. The second configuration additionally included a physically meaningful descriptor, namely the feed particle size at 80% passing (F80). Because F80 was not independently measured but back-calculated from an energy–size relationship using previously published experimental data, its inclusion was intended to explore the potential contribution of physically informed inputs to prediction performance. These parameters included mill power draw, specific energy consumption, mill discharge particle size (P80), and feed slurry flow rate. Multiple ML regression models were then developed to predict each parameter based on the available sensor inputs and selected physical descriptors. This is to assess the upper-bound limit of the ML studies. Consequently, the resulting improvements should be interpreted as indicative of a theoretical upper-bound scenario rather than reflecting an independently measured process variable. Subsequently, several machine learning (ML) regression algorithms were implemented and systematically compared, including linear regression (LR), functional tree regression (FTR), support vector regression (SVR), random forest regression (RFR), artificial neural networks (ANN), and Gaussian process regression (GPR). These models were developed to predict key comminution-related operating parameters, including mill power draw, specific energy consumption, mill discharge particle size (P80), and feed slurry flow rate, based on the selected input features. Finally, the predictive performance of the developed models was evaluated using statistical performance metrics. Through this comparative assessment, the most accurate and robust ML strategy was identified for each target parameter under the investigated industrial operating conditions.
Figure 1.
Overview of the proposed machine learning-based predictive modeling framework for an industrial-scale wet vertical stirred media mill, integrating industrial sensor data with a conceptual use of feed particle size (F80).
2.2. Wet Vertical Stirred Media Mill
The details of the milling technology can be found in the literature [28,29,30,31]. Essentially, it is a vertically oriented stirred media mill where the feed enters from the bottom of the chamber, and the product exits from the top region. The mill has a shaft on which the agitators are mounted. Agitators stir the grinding media to impart the required energy for grinding the particles. The vertical orientation offers the advantage of keeping the beads inside due to the gravitational effect. Like any other stirred milling technology, the main operating parameters are the stirrer speed, bead size, bead filling, slurry flow rate, and feed particle size. The influences of these parameters, specific to this milling technology, were reported previously [30,32,33].
The mill at the plant has an inner diameter of 1.66 m and an inner height of 6.8 m, respectively, and an installed power of 2.65 MW. The mill is utilized for regrind applications, and the feed to the mill is precycloned. The underflow is reported to the WSMM, and the overflow is sent to the cleaner stage of the beneficiation.
2.3. Mill Sensors and Measurements
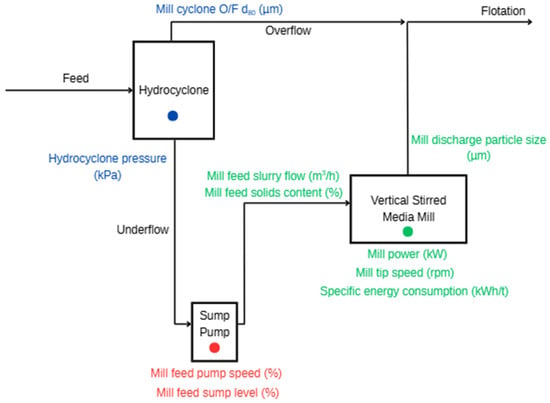
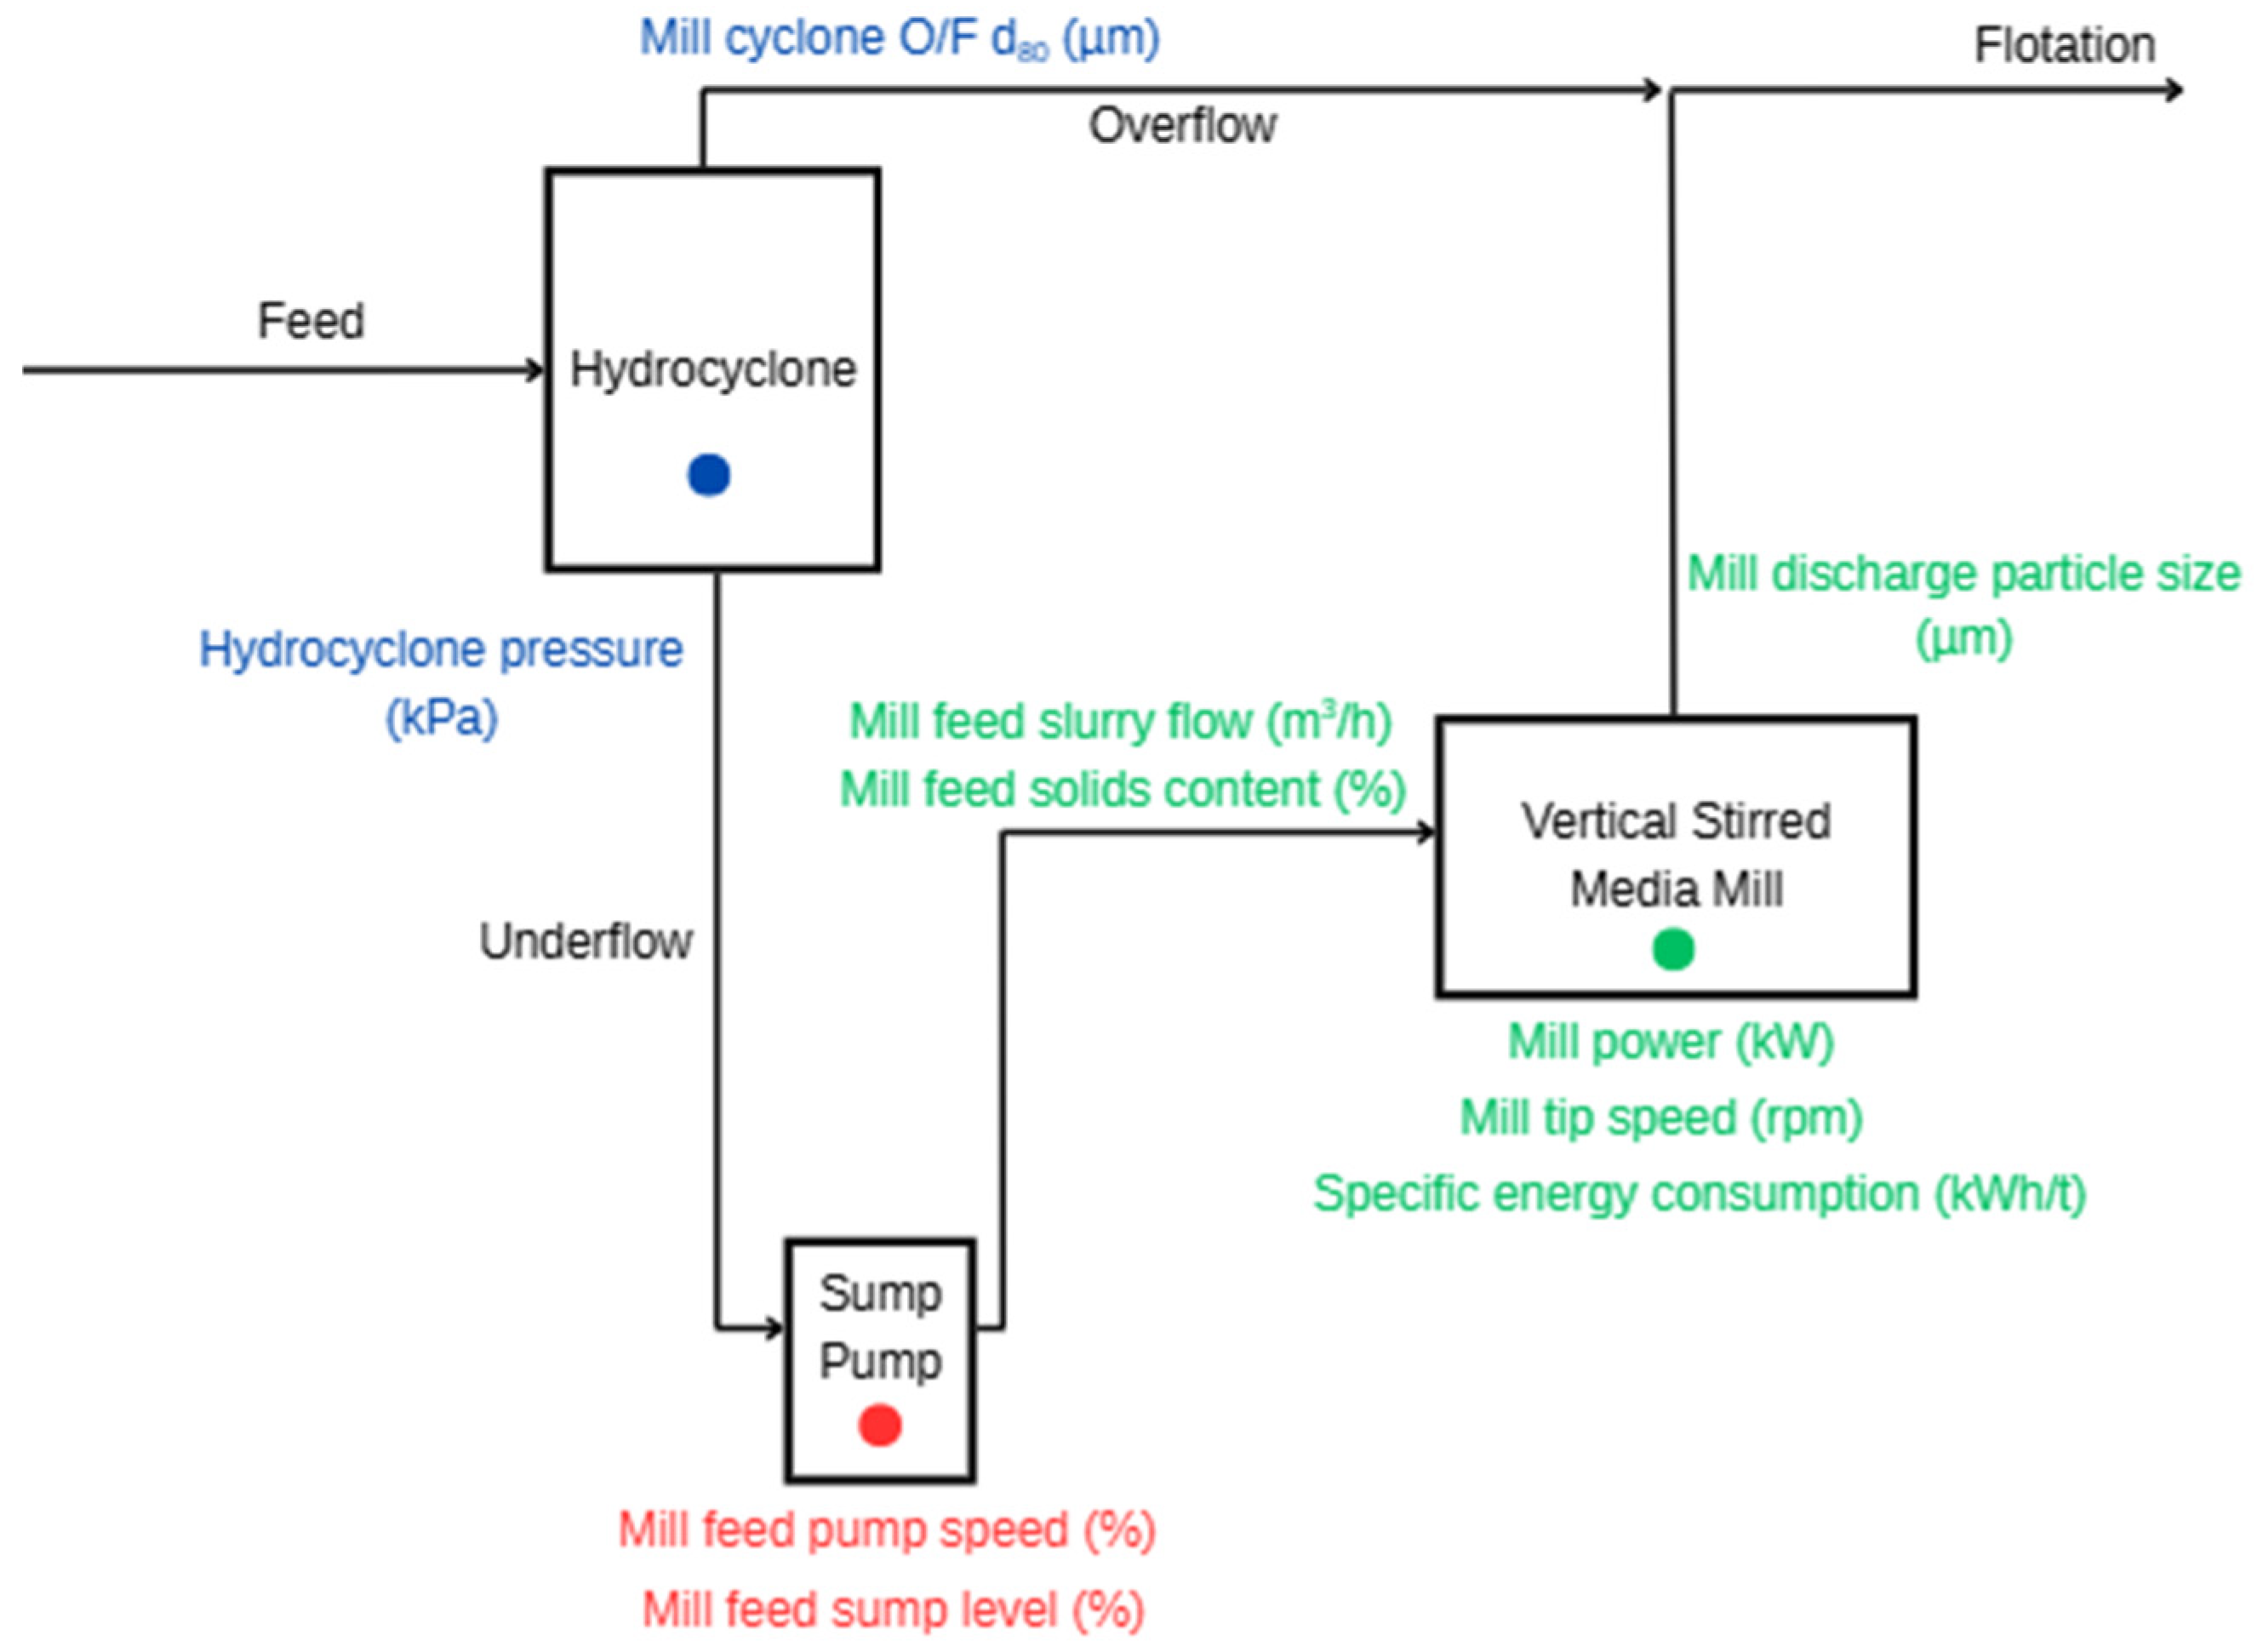
Figure 2 illustrates the SCADA screen, which displays sensor readings, equipment conditions, and operational parameters. Such a system brings operational ease to the mill operators. Moreover, it is coupled with an expert system that allows setting the target-specific grinding energy and adjusting the operating conditions, i.e., the tip speed and the flow of feed, accordingly. However, expert systems are typically operated as rule-based systems rather than having a learning algorithm that can be executed based on process parameters, which AI can accomplish.
Figure 2.
Schematic of human machine interface (HMI) of milling circuit.
In the SCADA, the parameters of mill power, mill speed, feed slurry flow rate, specific energy consumption, solids content, hydrocyclone pressure, pump speed, mill discharge particle size, and hydrocyclone overflow particle size are monitored. This data can be extracted from the system at specified second, minute, or hour intervals. The primary discussion point at the outset of the research was to determine which parameter was necessary for the AI assessments. However, rather than considering some of the parameters, all the data representing the circuit was extracted and analyzed partially or fully.
2.4. Data Collection and Data Cleaning
Real-time operational data were collected from the industrial-scale wet vertical stirred media mill at 15 min intervals over a continuous period of approximately two years. In total, 102,241 data records were obtained, representing a wide range of operating conditions encountered during normal plant operation. The collected parameters from the sensors and the abbreviations are summarized below.
- Specific energy consumption (kWh/t): Ecs;
- Mill feed solids content (%): Cs;
- Mill feed slurry flow (m3/h): Q;
- Mill power (kW): MP;
- Mill cyclone O/F d80 (µm): C80;
- Mill discharge particle size (µm): P80;
- Mill tip speed (rpm): T;
- Mill feed sump level (%): L;
- Mill feed pump speed (%): FP;
- Hydrocyclone pressure (kPa): HP.
The raw dataset was first subjected to preliminary cleaning to remove erroneous sensor readings, null values, and records corresponding to non-operational mill conditions, such as planned shutdowns and abnormal start-up or stop periods. This initial screening ensured that only physically meaningful operating states were retained for further analysis.
After data filtering and cleaning, a total of 75,922 data records remained and were used for ML model development. The refined dataset was employed to predict four key operating parameters: mill power draw, mill discharge particle size (P80), specific energy consumption, and feed slurry flow rate. It should be noted that the same set of input variables was consistently used across all ML modeling cases to ensure a fair and unbiased comparison of model performance.
2.5. Feed Size Assessments in ML Studies
The plant currently does not measure the feed size distribution entering the mill. Therefore, in this study, feed size was introduced conceptually through a “what-if” upper-bound sensitivity analysis to examine how ML prediction performance could change under a best-case scenario where the plant is equipped with an online feed size analysis unit or a reliable proxy sensing. In this context, the objective was not to claim an independently validated improvement, but to quantify the potential leverage of including a physically meaningful feed size descriptor in ML models for industrial wet vertical stirred media milling applications.
To this end, the feed size at 80% passing (F80) was back-calculated for each data record using measured specific energy consumption and mill discharge particle size (P80). This back-calculation was based on an energy–size relationship appropriate for fine grinding applications. Several studies have demonstrated the superiority of Rittinger’s equation (Equation (1)) in predicting the energy consumption of stirred media mills [34,35], which was also used in this research.
where Ecs is the specific comminution energy, KR is Rittinger’s constant, Xp and Xf are the product and feed sizes.
To enable the back-calculation of F80 values of each row, Rittinger’s constant (KR) was determined using experimental data reported by Altun et al. [30], obtained from controlled industrial sampling campaigns. In this context, the Generalized Reduced Gradient optimization algorithm was used to fit Equation (1), minimizing the sum of squared residual (SSR) between measured and modeled specific energy values. The SSR expression for energy equation fitting is given in Equation (2).
Here the indices s and t denote survey and test, respectively. Mod and Exp terms refer to the model-predicted and experimental size distributions of products.
Following the determination of Xp, F80 values were back-calculated for a total of 75,922 industrial data records using sensor-measured specific energy consumption and mill discharge particle size (P80) values. The resulting F80 estimates were subsequently incorporated as an additional input feature in the ML models to evaluate their impact on predictive performance.
2.6. Regression Methods Used in Machine Learning
In machine learning, predicting a continuous output variable based on one or more input features is commonly referred to as regression. Regression-based ML models are widely applied in process engineering to capture relationships between operational variables and key performance indicators, particularly when multivariable and non-linear interactions are present.
In this study, six different regression models were selected to enable a comprehensive comparison between classical statistical approaches and modern machine learning techniques. The selected models differ in their underlying assumptions, complexity, and ability to capture non-linear relationships, thereby providing a robust basis for evaluating predictive performance under industrial operating conditions.
Linear regression (LR) was employed as a baseline model. As one of the most fundamental statistical learning methods, LR models the relationship between independent variables and a continuous response by fitting a linear equation to observed data [36]. Although its simplicity and interpretability are advantageous, LR is limited in its ability to represent non-linear behavior and complex feature interactions, which are common in comminution processes.
Fine tree regression (FTR), a form of decision tree regression, was used to capture non-linear relationships through hierarchical decision rules based on input features. By allowing smaller leaf sizes or deeper tree structures, fine tree regression can model intricate data patterns without assuming linearity or specific feature distributions. However, such flexibility may increase the risk of overfitting if not properly constrained [37].
Support vector machine regression (SVR) extends the principles of support vector machines to regression problems by fitting a function within a predefined error margin using an epsilon-insensitive loss function. Through the use of kernel functions, SVR is capable of modeling both linear and non-linear relationships and is particularly effective in high-dimensional feature spaces [38].
Random forest regression (RFR) is an ensemble learning method that combines predictions from multiple decision trees trained on bootstrapped subsets of the data. By averaging the outputs of individual trees, RFR reduces variance and mitigates the overfitting tendency of single decision trees. This method is well suited for handling non-linear relationships and complex variable interactions and has been shown to perform robustly in industrial process modeling applications [39].
Artificial neural network regression (ANN) was adopted to model highly non-linear and complex relationships between input variables and process responses. ANNs consist of interconnected layers of neurons that learn hierarchical feature representations through iterative training. While neural networks offer strong predictive capability for large and complex datasets, they typically require careful tuning of hyperparameters and higher computational effort compared with simpler models [40].
Finally, Gaussian process regression (GPR) was included as a probabilistic, non-parametric modeling approach. GPR defines a prior distribution over functions and updates this prior using observed data to obtain a posterior predictive distribution. In addition to point predictions, GPR provides uncertainty estimates through predictive variance, making it particularly valuable for assessing the confidence in predictions. Although computationally intensive for large datasets, GPR offers strong performance and interpretability in scenarios where uncertainty quantification is of interest [41].
The predictive performance of all regression models was evaluated and compared using consistent input variables and statistical performance metrics, allowing for an objective assessment of their suitability in predicting key operating parameters of the industrial-scale wet vertical stirred media mill.
2.7. Relief Coefficient Assessments and Machine Learning Experiments
Prior to planning the machine learning experiments, the Relief algorithm, adapted for regression tasks, was employed [42] to perform feature selection. Originally designed for classification problems, Relief has been extended to regression through the Relief variant, allowing it to evaluate the relevance of features in predicting continuous outcomes. Unlike traditional filter methods that assess features independently, Relief considers the local structure of the data by analyzing how differences in feature values correspond to differences in the target variable. Specifically, the algorithm estimates feature importance by comparing each instance with its nearest neighbors, weighting their contributions based on the similarity of the target values. Features that vary consistently with the output variable are assigned higher relevance scores, while features that show little or no association with the target are down-weighted. This approach enables the identification of both linear and non-linear dependencies, as well as feature interactions, without requiring an explicit model. The use of Relief for regression is particularly advantageous in high-dimensional settings with potential noise, as it can robustly filter out irrelevant or redundant variables. Our choice of this method was motivated by its capacity to provide a data-driven, model-independent ranking of features, facilitating improved generalization and interpretability in subsequent predictive modeling steps. By using the results of the analyses, the experimental plan of ML tests can be adjusted to reduce the workload and save time in the model development phase.
For all ML experiments, a five-fold cross-validation strategy was adopted to ensure robust model generalization and to avoid bias associated with a single train–test split. In this approach, the available dataset was partitioned into five mutually exclusive subsets (folds). During each iteration, four folds were used for model training, while the remaining fold served as the validation set. This procedure was repeated five times, such that each fold was used once for validation. Model performance was then evaluated as the average across the five validation runs. This cross-validation framework provides a more reliable estimate of predictive performance on unseen data and helps mitigate overfitting by exposing the models to different data subsets during training.
The ML experiments were designed to systematically evaluate the predictive capability of different input variable combinations for four target outputs: mill discharge particle size (P80), mill power draw (MP), feed slurry flow rate (Q), and specific energy consumption (Ecs). A total of 20 test scenarios were defined (Table 1) considering Relief assessments.
Table 1.
The plan for ML experiments where the ticked marks address the completed tests.
To predict mill discharge particle size (P80), multiple input combinations were tested (Tests 1–5) to assess the influence of both feed characteristics and operating conditions. Since the plant does not measure the feed size distribution online, the cyclone overflow particle size (C80) was included as a proxy indicator of mill feed fineness. Finer cyclone overflow generally corresponds to finer underflow material reporting to the mill, and vice versa. Additional variables considered in P80 prediction included specific energy consumption, feed slurry flow rate, solids concentration, and mill tip speed, reflecting their known influence on grinding intensity and residence time.
Feed slurry flow rate (Q) prediction scenarios (Tests 6–8) were constructed based on the expected influence of feed pump speed, solids content, sump level, and hydrocyclone operating conditions. In certain scenarios, specific energy consumption was also included, recognizing that plant operators may target a desired energy input by adjusting slurry flow to the mill.
Mill power draw (MP) prediction scenarios (Tests 9–12) focused on parameters directly associated with mechanical energy input, such as mill tip speed, solids concentration, and slurry flow rate. Additional variables related to throughput and hydraulic conditions were incorporated in extended scenarios to capture indirect effects on power consumption.
Specific energy consumption (Ecs), defined as the ratio of mill power to throughput, was predicted in Tests 13–16 using combinations of variables influencing both power draw and slurry transport. These scenarios were designed to assess whether ML models could reliably capture the combined effects governing energy efficiency in the mill.
For scenarios involving a large number of candidate input variables (Tests 5, 8, 12, and 16), feature relevance was first assessed using Relief-based feature importance analysis. The input variables were then ranked in descending order of importance, and ML models were trained iteratively by progressively adding variables according to this ranking until all parameters were included. This procedure enabled assessment of both individual and cumulative variable contributions to model performance.
In selected test cases (Tests 5-F80, 8-F80, 12-F80, and 16-F80), the back-calculated feed size parameter (F80) was incorporated as an additional input feature to explore the upper-bound limit of the ML studies. Since the plant currently lacks online feed size measurements, F80 was introduced through a hypothetical sensitivity analysis, simulating conditions where feed size data or a reliable proxy is available. The analysis aimed to quantify the potential benefit, showing that a physically meaningful feed size descriptor would enhance ML prediction accuracy, despite the absence of online feed size measurements in the plant.
The predictive performance of all ML models was evaluated using the coefficient of determination (R2), the root mean square error (RMSE) and mean absolute error (MAE) providing complementary measures of goodness-of-fit and the magnitude of prediction error.
3. Results and Discussion
3.1. Data Characteristics
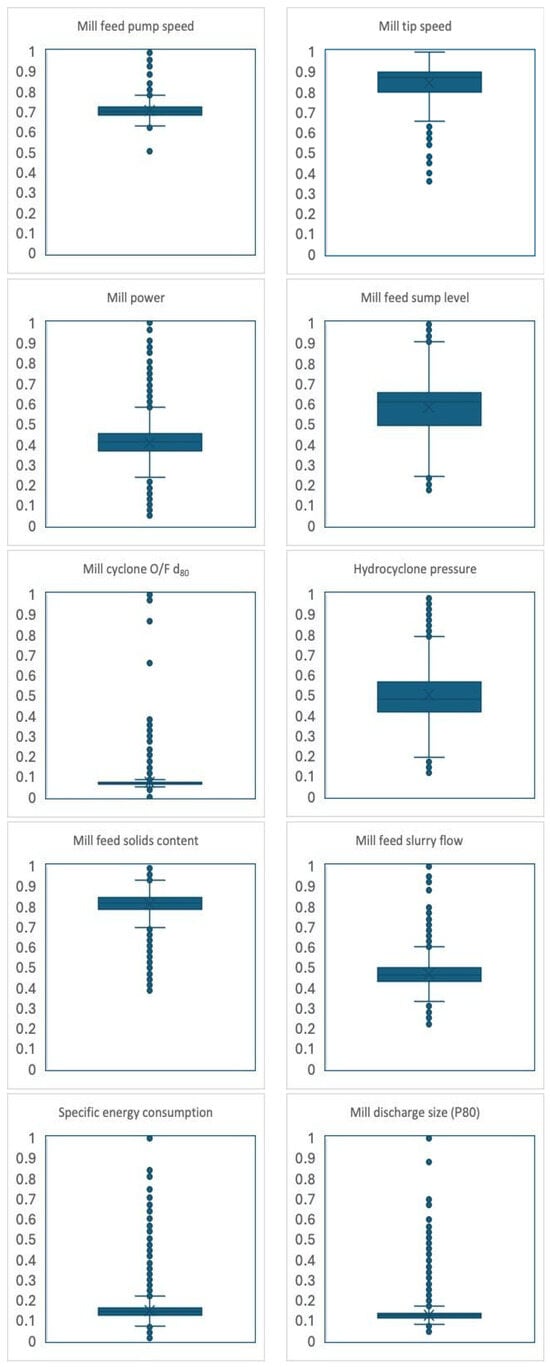
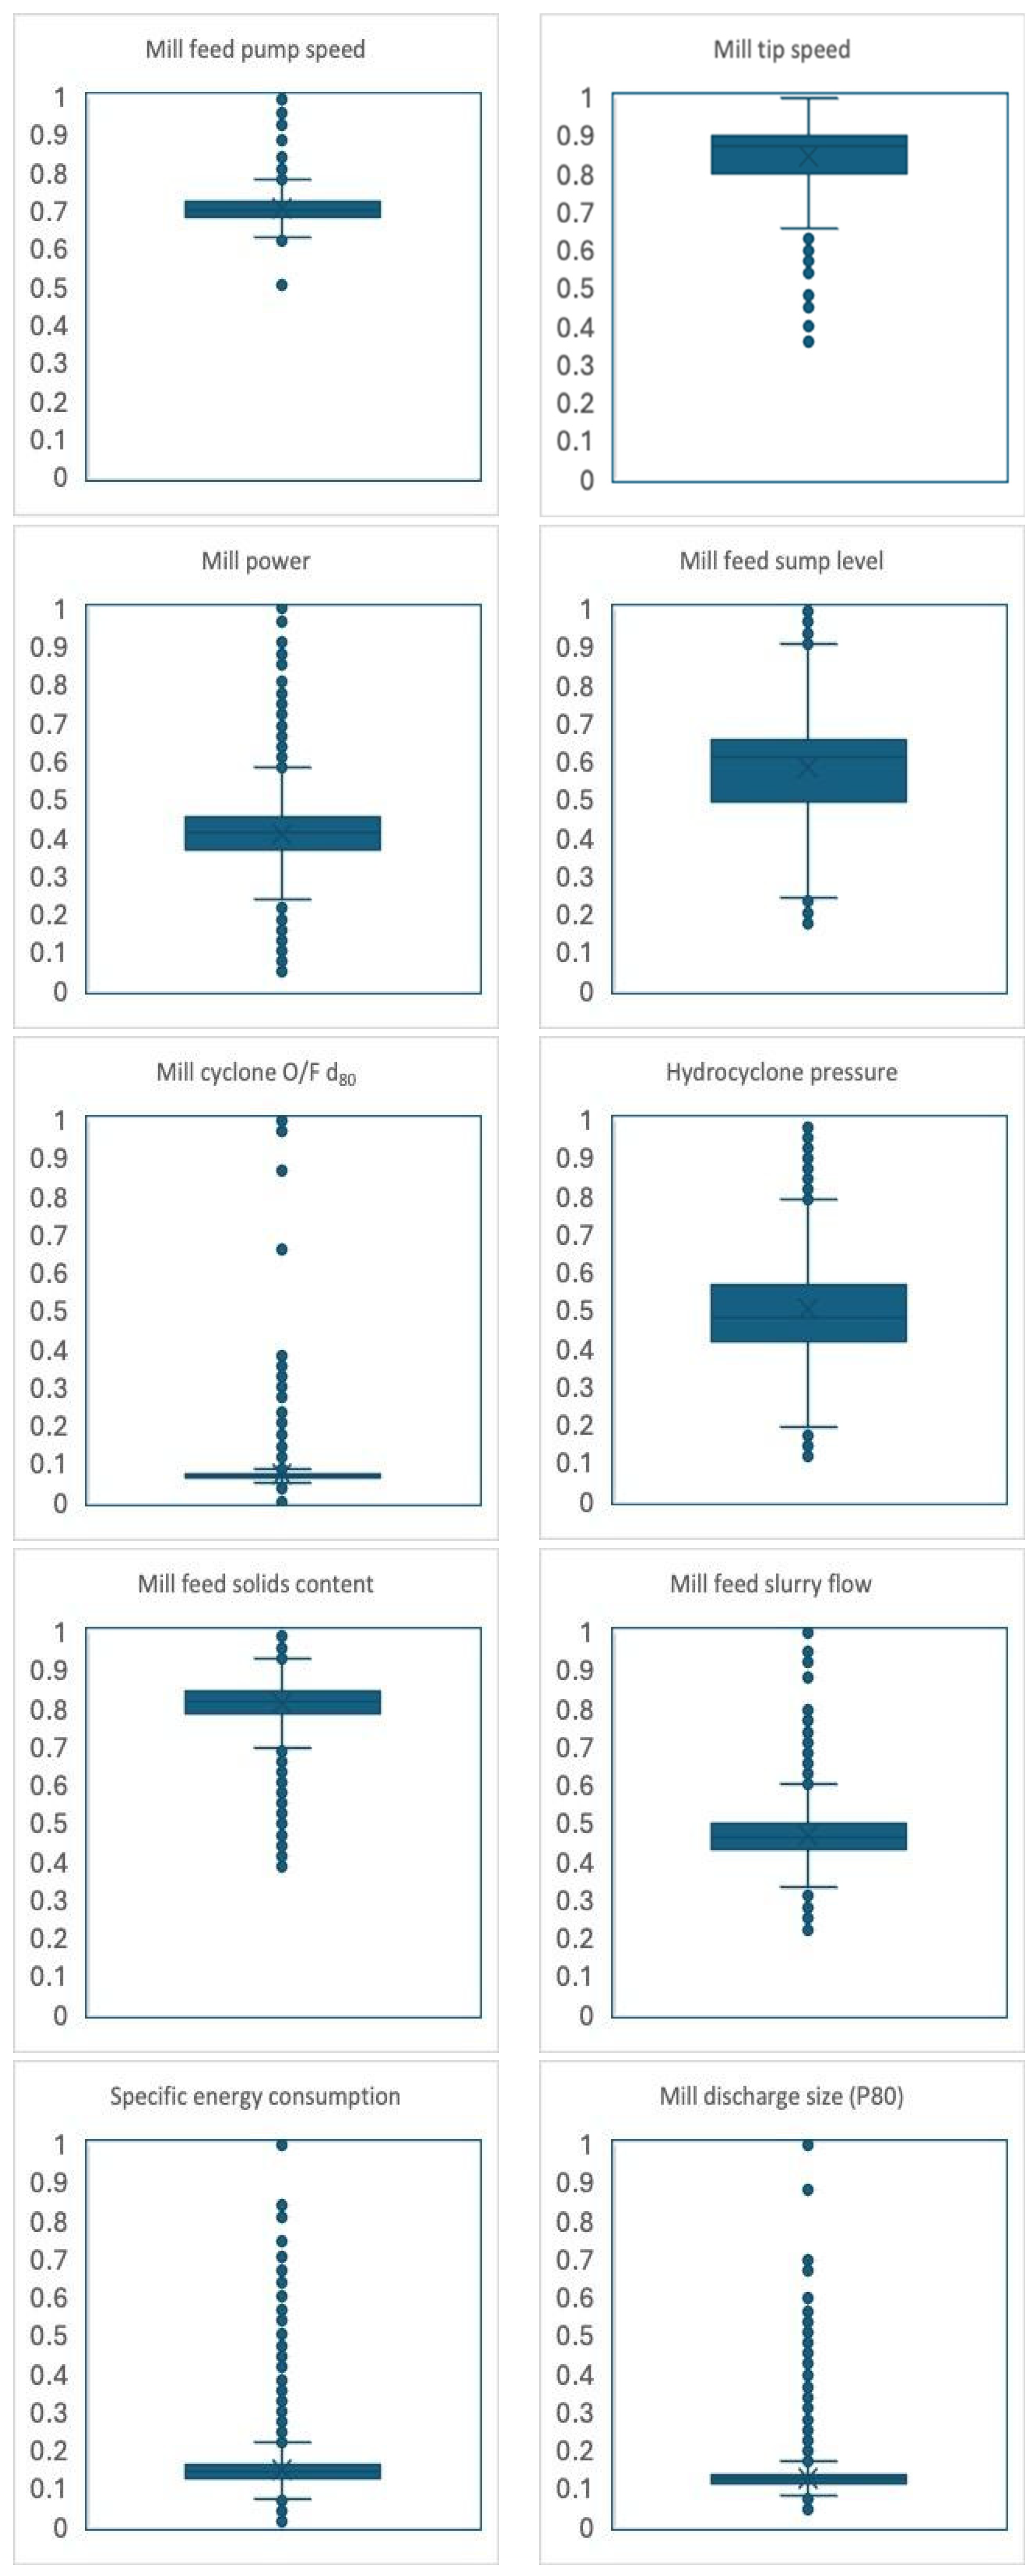
Due to confidentiality constraints, the authors cannot provide the raw dataset; however, the data are visually summarized in Figure 3 using box plots [43]. For clarity and comparability across variables with different units and magnitudes, each variable was scaled to the [0, 1] range by normalizing the observed values with respect to their corresponding maximum value (i.e., ).
Figure 3.
Box plots visualization of the dataset; boxes show the interquartile range with the median line; whiskers indicate data spread.
3.2. Machine Learning Results
3.2.1. Relief Coefficient Assessments
Table 2 summarizes the results.
Table 2.
Relief coefficient analyses of each variable (×10−3).
- Coefficient analyses on the P80 implied that feed pump speed (FP) is the most influential variable, followed by cyclone overflow size (C80), tip speed (T), mill power (MP), feed solids content (Cs), and feed slurry flow (Q). The relief coefficients of these variables fall within a range of 2.2−3.4, highlighting their significant contributions to product size control. In contrast, sump level (L), hydrocyclone pressure (HP) and specific grinding energy (Ecs) are well below this range (0.96−1.8), suggesting a secondary influence on P80. Based on these findings, the initial ML test plan was organized from the most influencing variables—namely, T, Cs, Q, C80—then the fundamental comminution parameters, Ecs and MP, were incorporated to preserve the physical relevance of the model.
- Feed slurry flow (Q) analyses revealed that FP had by far most impact on this parameter which is consistent with circuit operation, as slurry flow is directly adjusted by pump speed. This variable is followed by MP and T, which have a similar degree of influence, reflecting their indirect but coupled effects on slurry transport. The remaining variables, C80, Cs, L and P80, are in a range between 1.1−1.8. The least influencing parameter was found to be HP (0.2). Although its influence is not explicitly reflected in the relief coefficients, the sump level (L) is expected to exert an indirect effect on Q through the control strategy of the circuit, as pump speed adjustments are commonly implemented to maintain the sump level within a target range. Therefore, this operational coupling was also taken into consideration during the design of the machine learning experiments for Q, despite the comparatively low statistical sensitivity observed in the relief analysis. Ecs was excluded from the analyses to reduce this risk of circularity.
- Mill power (MP) analyses indicated that parameter T is the most influential parameter affecting the power draw. This outcome aligns with the fundamental operating principles of stirred media milling as extensively reported in the literature [44,45]. Feed pump speed (FP) was identified as the second most influential variable, which can be attributed to the bead-lifting effect induced by slurry motion, influencing media load and grinding intensity [33]. The parameters Q, P80 and Cs exhibit moderate influence, with relief coefficients of 2.8, 2.6 and 2 respectively. In contrast, C80, L and HP had the least influence, ranging between 0.3 and 1.6. In all the ML experiment tests, tip speed was included, and the feed pump speed effect was incorporated to ensure the physical consistency. Within the MP analyses, the Ecs parameter was excluded due to the risk of circularity.
- The results of Ecs analyses are fully consistent with the fundamentals of stirred media milling operation. As expected from its definition, MP and Q are the dominant variables since Ecs is directly calculated from these parameters. The analyses in Table 2 demonstrate that MP, Cs and Q are the three most influential process variables affecting Ecs. FP also exhibits a relatively high coefficient (7.5), reflecting its indirect effect over slurry flow and, consequently, energy consumption. In contrast C80, HP, P80, and L exhibit relatively less influence suggesting a secondary role under investigated operating conditions.
In addition to the relief coefficient analyses, the fundamental operating principles of stirred media milling were explicitly considered during the design of the machine learning experiments. While the relief coefficients highlight the relative statistical importance of individual process variables, they were evaluated in conjunction with the established comminution fundamentals governing mill behavior. Accordingly, the machine learning test plan was developed by integrating both data-driven insights and physical understanding of the mill operation, rather than relying solely on parameter rankings. This integrated approach and its implications are discussed further in this section. Moreover, the prediction accuracies of the models were systematically evaluated for each test case, including those incorporating the full set of process parameters.
3.2.2. Predicting Mill Discharge Particle Size
Experience in milling technology indicates that the mill discharge particle size of the mill, P80, is influenced by tip speed, solids content, and specific energy utilization [30]. Moreover, it is also a well-established fact that the efficiency of a grinding machine is strongly influenced by the feed size distribution, which directly affects breakage kinetics and classification behavior. In the investigated industrial circuit, the feed size distribution to the mill is not measured online. However, the cyclone overflow size (C80) provides an indirect indication of feed fineness, as coarser overflow conditions generally correspond to a coarser mill feed.
Based on these considerations, the selected input variables for P80 prediction were defined by combining data-driven insights with established milling fundamentals. It should be noted that specific energy consumption (Ecs) is derived from mill power and throughput, where mill power itself is a function of tip speed and feed slurry flow rate [30,33,46]. The feed slurry promotes the lifting and fluidization of grinding media, which reduces the effective load on the impeller and consequently influences the power draw [33]. These interdependencies were explicitly considered in the formulation of the machine learning models to ensure both predictive robustness and physical interpretability. Table 3, Table 4 and Table 5 summarize the results of the P80 validations of the ML studies.
Table 3.
R2 values of the P80 validations of ML studies.
Table 4.
RMSE values of the P80 validations of ML studies.
Table 5.
MAE values of the P80 validations of ML studies.
Across all test cases, GPR and the ensemble model (RFR) delivered the best predictive performance in terms of R2, RMSE and MAE, followed by ANN, while LR, SVR, and FTR were comparatively less accurate. The superior performance of GPR is consistent with its Bayesian, kernel-based nonparametric structure, which captures non-linear relationships, explicitly accounts for noise, and provides uncertainty estimates [47]. Likewise, RFR benefits from aggregating many decorrelated trees, which typically reduces variance and improves robustness in noisy industrial datasets compared with a single tree model [39]. In contrast, LR is limited to linear mappings unless expanded features are introduced [48], and SVR performance can be sensitive to kernel and hyperparameter choices under complex interactions and heteroscedastic noise [49]. Although ANNs are flexible function approximators, their accuracy depends strongly on architecture and regularization and may not consistently surpass kernel or ensemble methods when data quality is variable [50].
From Test 1 to Test 3, the influence of Ecs and Q on P80 prediction was examined using progressively modified input sets (Table 3, Table 4 and Table 5). Using Test 1 as the baseline (GPR R2 = 0.7427, RMSE = 3.5260, MAE = 2.1790), introducing Ecs in Test 2 improved accuracy (GPR R2 = 0.7505, RMSE = 3.4723, MAE = 2.1001). Removing Q in Test 3 slightly reduced performance (GPR R2 = 0.7411, RMSE = 3.5367, MAE = 2.1436), indicating that slurry transport contributes measurably to product size prediction. Expanding the sensor set in Test 4 improved results relative to Tests 1–3 (GPR R2 = 0.7832, RMSE = 3.2367, MAE = 1.8595), and adding Ecs in Test 5 yielded the best performance (GPR R2 = 0.7857, RMSE = 3.2179, MAE = 1.8573, with similarly low RMSE/MAE for RFR). Collectively, these findings suggest that physically meaningful variables, rather than a larger number of sensor tags, are more effective for robust P80 prediction in this circuit.
The outcomes of these assessments are consistent with the fundamentals of the stirred milling operation. The literature reported that the product size of the mill changes with specific energy utilization, tip speed, feed slurry flow and solids content of the feed [51,52,53,54].
3.2.3. Predicting Feed Slurry Flow Rate of the Mill
The volumetric flow rate of the mill feed, Q, is a key operating parameter in comminution circuits. Grinding mills are typically operated within an optimal feeding window to ensure stable performance; therefore, Q is continuously monitored and controlled in real time. For this reason, regression-based machine learning analyses were also performed to predict Q.
In continuous operation, the feed slurry flow rate is governed by both process control actions and feed characteristics. The feed pump speed (FP) directly regulates the slurry flow and is routinely adjusted to maintain target operating conditions. In addition, the sump level (L) affects the available pressure head and can therefore influence the achievable volumetric flow rate [55]. Feed characteristics, i.e., Cs, have effects on the slurry rheology and transport behavior, thereby impacting Q. As a result, these core variables and the sensor data were included in the assessments while predicting the Q parameter.
Table 6, Table 7 and Table 8 summarize the statistical assessments of the Q validations of the ML studies.
Table 6.
R2 values of the Q validations of ML studies.
Table 7.
RMSE values of the Q validations of ML studies.
Table 8.
MAE values of the Q validations of ML studies.
Consistent with the P80 prediction results, Gaussian Process Regression (GPR) and the ensemble approach (RFR) provided the highest predictive accuracy for Q based on the validation statistics R2, RMSE and MAE. Across the evaluated test scenarios, these two methods exhibited comparable R2 values. The ANN models achieved the next-best performance, whereas LR, the single-tree approach (FTR), and SVR generally showed lower predictive accuracy under the investigated operating conditions.
Test 6 was designed to evaluate the predictive contribution of sump level (L), feed pump speed (FP), and feed solids content (Cs), which are commonly identified as key variables governing slurry transport in wet grinding circuits. This reduced input set produced the lowest accuracy (e.g., GPR R2 = 0.4500, RMSE = 8.8253, MAE = 5.7950). Accordingly, specific grinding energy (Ecs) was introduced in Test 7, noting that Ecs is computed from mill power and throughput terms and is therefore linked to feed flow behavior in the control strategy [30]. This improved prediction performance (GPR R2 = 0.5876, RMSE = 7.6419, MAE = 6.7636). A further improvement was obtained in Test 8 by expanding the input set with additional sensor variables, yielding the best performance (GPR R2 = 0.7751, RMSE = 5.6434, MAE = 3.9067). In Test 8, Ecs was omitted to avoid redundancy with MP and other correlated inputs and to reduce the risk of collinearity within the feature set.
3.2.4. Predicting the Power Draw of the Mill
Mill power (MP) is one of the principal performance indicators of a wet stirred media mill and was therefore included as a target variable in the present machine learning (ML) assessment. Fluctuations in MP are typically associated with unstable operating conditions and may lead to deterioration in grinding performance and product quality, particularly with respect to the product size distribution. Consequently, identifying the variables affecting MP through data-driven modeling can support improved operational stability and more efficient comminution control.
The literature has reported that the power draw of WSMM is directly proportional to the rotational speed of the agitators [24,54]. In addition, feed and slurry transport characteristics also influence power draw through their effects on media motion, slurry viscosity, and the degree of media fluidization [24,44]. Accordingly, these variables were incorporated into the regression analyses for MP prediction. Table 9, Table 10 and Table 11 give the summary of the calculations.
Table 9.
R2 values of MP validations of ML studies.
Table 10.
RMSE values of MP validations of ML studies.
Table 11.
MAE values of MP validations of ML studies.
Across the tested scenarios, GPR and the ensemble approach (RFR) provided the highest predictive accuracy for mill power (MP) based on both R2 and RMSE. GPR performs strongly due to its kernel-based Bayesian, nonparametric formulation, which captures nonlinearities and is relatively robust to measurement noise, whereas RFR can surpass GPR in some cases (Tests 10–11) by reducing variance through aggregation of many decorrelated trees, which is advantageous under noisy, interaction-driven process behavior (e.g., FP/HP effects superimposed on T). The single-tree model (FTR) achieved competitive results and exceeded ANN in Tests 10–11, consistent with the trees’ ability to represent piecewise, rule-like relationships, although single trees typically generalize less reliably than ensembles. ANN showed intermediate performance, likely reflecting sensitivity to architecture/regularization, while LR and SVR were least accurate due to LR’s linear restriction and SVR’s kernel/hyperparameter sensitivity under complex interactions and heteroscedastic noise.
In light of stirred media milling fundamentals, the initial ML test for mill power prediction included tip speed (T), feed solids content (Cs), and feed slurry flow rate (Q) (Test 9). This reduced input set yielded the lowest performance (GPR R2 = 0.3940, RMSE = 140.49, MAE = 105.42), indicating that additional explanatory variables are needed to capture variability in power draw. Accuracy improved markedly as key process variables were incorporated: adding feed pump speed (FP) in Test 10 increased GPR performance (to R2 = 0.5830, RMSE = 116.53, MAE = 81.78), and incorporating hydrocyclone pressure (HP) in Test 11 further improved it (R2 = 0.6248, RMSE = 110.54, MAE = 76.70). The most comprehensive input set (Test 12) achieved the highest accuracy among these cases (GPR R2 = 0.7541, RMSE = 89.49, MAE = 56.72). The clear improvement from Test 9 to Test 10 is consistent with the relief coefficient outcomes (Section 3.2.1), supporting the importance of FP as a key driver of MP through its influence on slurry transport and media fluidization.
3.2.5. Specific Energy Consumption
The final parameter considered in this study is the specific energy consumption (Ecs), which is commonly defined as the ratio of mill power draw to throughput in comminution practice in the stirred milling literature [24,54]. Accordingly, the ML input sets for Ecs prediction were established by considering the variables that influence power draw and throughput. At the plant, throughput is determined from plant sensor measurements, primarily based on solids content (Cs), feed slurry flow rate (Q), and ore density. These variables—together with the parameters affecting power draw (or MP itself)—were therefore introduced progressively as model inputs. This stepwise approach enabled assessing the individual contribution of each variable group to the prediction accuracy. The validation statistics of the proposed models are summarized in Table 12, Table 13 and Table 14.
Table 12.
R2 values of Ecs validations of ML studies.
Table 13.
RMSE values of Ecs validations of ML studies.
Table 14.
MAE values of Ecs validations of ML studies.
GPR provided the highest prediction accuracy for Ecs across all tested scenarios based on R2, RMSE, and MAE (Table 12, Table 13 and Table 14). Unlike the MP and Q cases, GPR performed slightly better with the compact, physically consistent input set (Test 13; R2 = 0.9991, RMSE = 0.1097, MAE = 0.0219) than with the expanded sensor set (Test 16; R2 = 0.9981, RMSE = 0.1618, MAE = 0.0254), consistent with GPR’s tendency to generalize well when dominant variables are included and redundant/noisy inputs are avoided. For Test 13, the ranking by R2 was GPR > ANN > RFR > FTR > LR > SVR, reflecting that Ecs is structurally constrained because it is directly defined by MP and throughput-related variables.
Taking Test 13 as the baseline, excluding mill power (MP) and introducing tip speed (T) instead (Test 14) caused a pronounced drop in accuracy (GPR R2 = 0.7169, RMSE = 1.9598, MAE = 1.2681). This result is expected because Ecs depends directly on MP and throughput, and T cannot substitute for MP under varying slurry and operating conditions. Moreover, adding T together with MP did not improve prediction accuracy (Test 13 vs. Test 15; GPR R2 = 0.9991 vs. 0.9990, with RMSE = 0.1097 vs. 0.1156 and MAE = 0.0219 vs. 0.0228), indicating that once MP is provided, T contributes limited additional independent information for Ecs prediction.
3.3. Statistical Significance Comparison of the Regression Methods
This section assesses whether the differences in model performance are statistically significant across the evaluated test cases, rather than reflecting random variation between scenarios. The outcome provides an objective basis for method selection for stirred milling prediction tasks. A repeated measures ANOVA test is applied to perform the significance analysis of regression models. A one-way repeated-measures ANOVA was conducted to statistically compare the predictive performance of the regression models across the evaluated test scenarios, using R2 values as the comparison metric. The Supplementary File summarizes the values to better track the results (Table S1).
Mauchly’s test analyses indicated that the assumption of sphericity had been violated (χ2(14) = 122.67, p < 0.001); therefore degrees of freedom were corrected using Greenhouse–Geisser estimates of sphericity (ε = 0.53). The results show that the effect of different regression models on prediction success was statistically significant (F(2.25, 42.67) = 18.89, p < 0.001, Ƞp2 = 0.50). According to the post hoc analyses (with Bonferroni adjustment), there were no statistically significant differences among the predictions of the Linear Regression (M = 0.64, SE = 0.06), the Tree (M = 0.66, SE = 0.05), and the SVM (M = 0.63, SE = 0.06) methods, and they exhibited lower predictive performance compared to the other methods (p < 0.05). Additionally, the predictions of the GPR method (M = 0.78, SE = 0.04) were more successful than those of the ANN method (M = 0.72, SE = 0.05) (p = 0.018), while there was no difference compared to the Ensemble method (M = 0.76, SE = 0.04). On the other hand, there was no significant difference between the ANN and Ensemble methods (p > 0.05).
3.4. Comparison of the Parameter Predictions
This section compares the prediction accuracy of the evaluated ML methods for the key comminution variables investigated in this study, namely the mill discharge product size (P80), mill feed slurry flow rate (Q), mill power draw (MP), and specific energy consumption (Ecs). Table 15 summarizes the best-performing models identified based on the highest validation R2 values obtained for each predicted variable.
Table 15.
Summary of the best baseline prediction results.
GPR achieved the highest validation R2 for feed slurry flow, mill power, and specific energy consumption, whereas mill discharge particle size was best predicted by RFR. This outcome is in line with the probabilistic, kernel-based nature of GPR, which is well suited to noisy industrial datasets and non-linear relationships, while also providing uncertainty-aware predictions. Among the four target variables, Ecs was predicted with the highest accuracy because it is strongly constrained by its definition (power and throughput terms are directly embedded in the input space), whereas P80, Q, and MP showed moderate-to-high accuracy (R2 ≈ 0.75–0.79), reflecting the additional process complexity and unmeasured disturbances typical of industrial milling circuits. These accuracy levels were found to be similar or higher when compared to other ML studies that had considered different comminution machines, i.e., SAG milling [13].
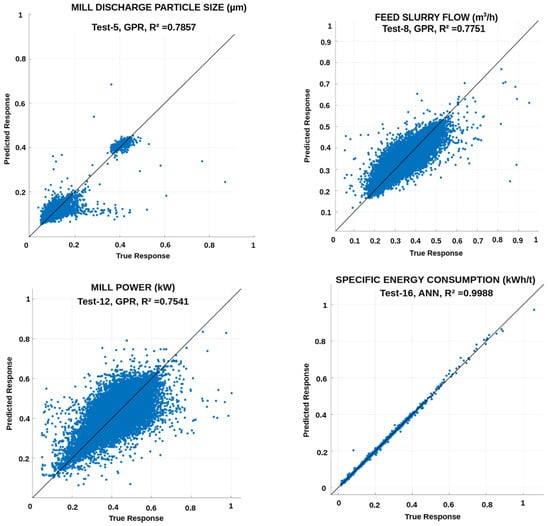
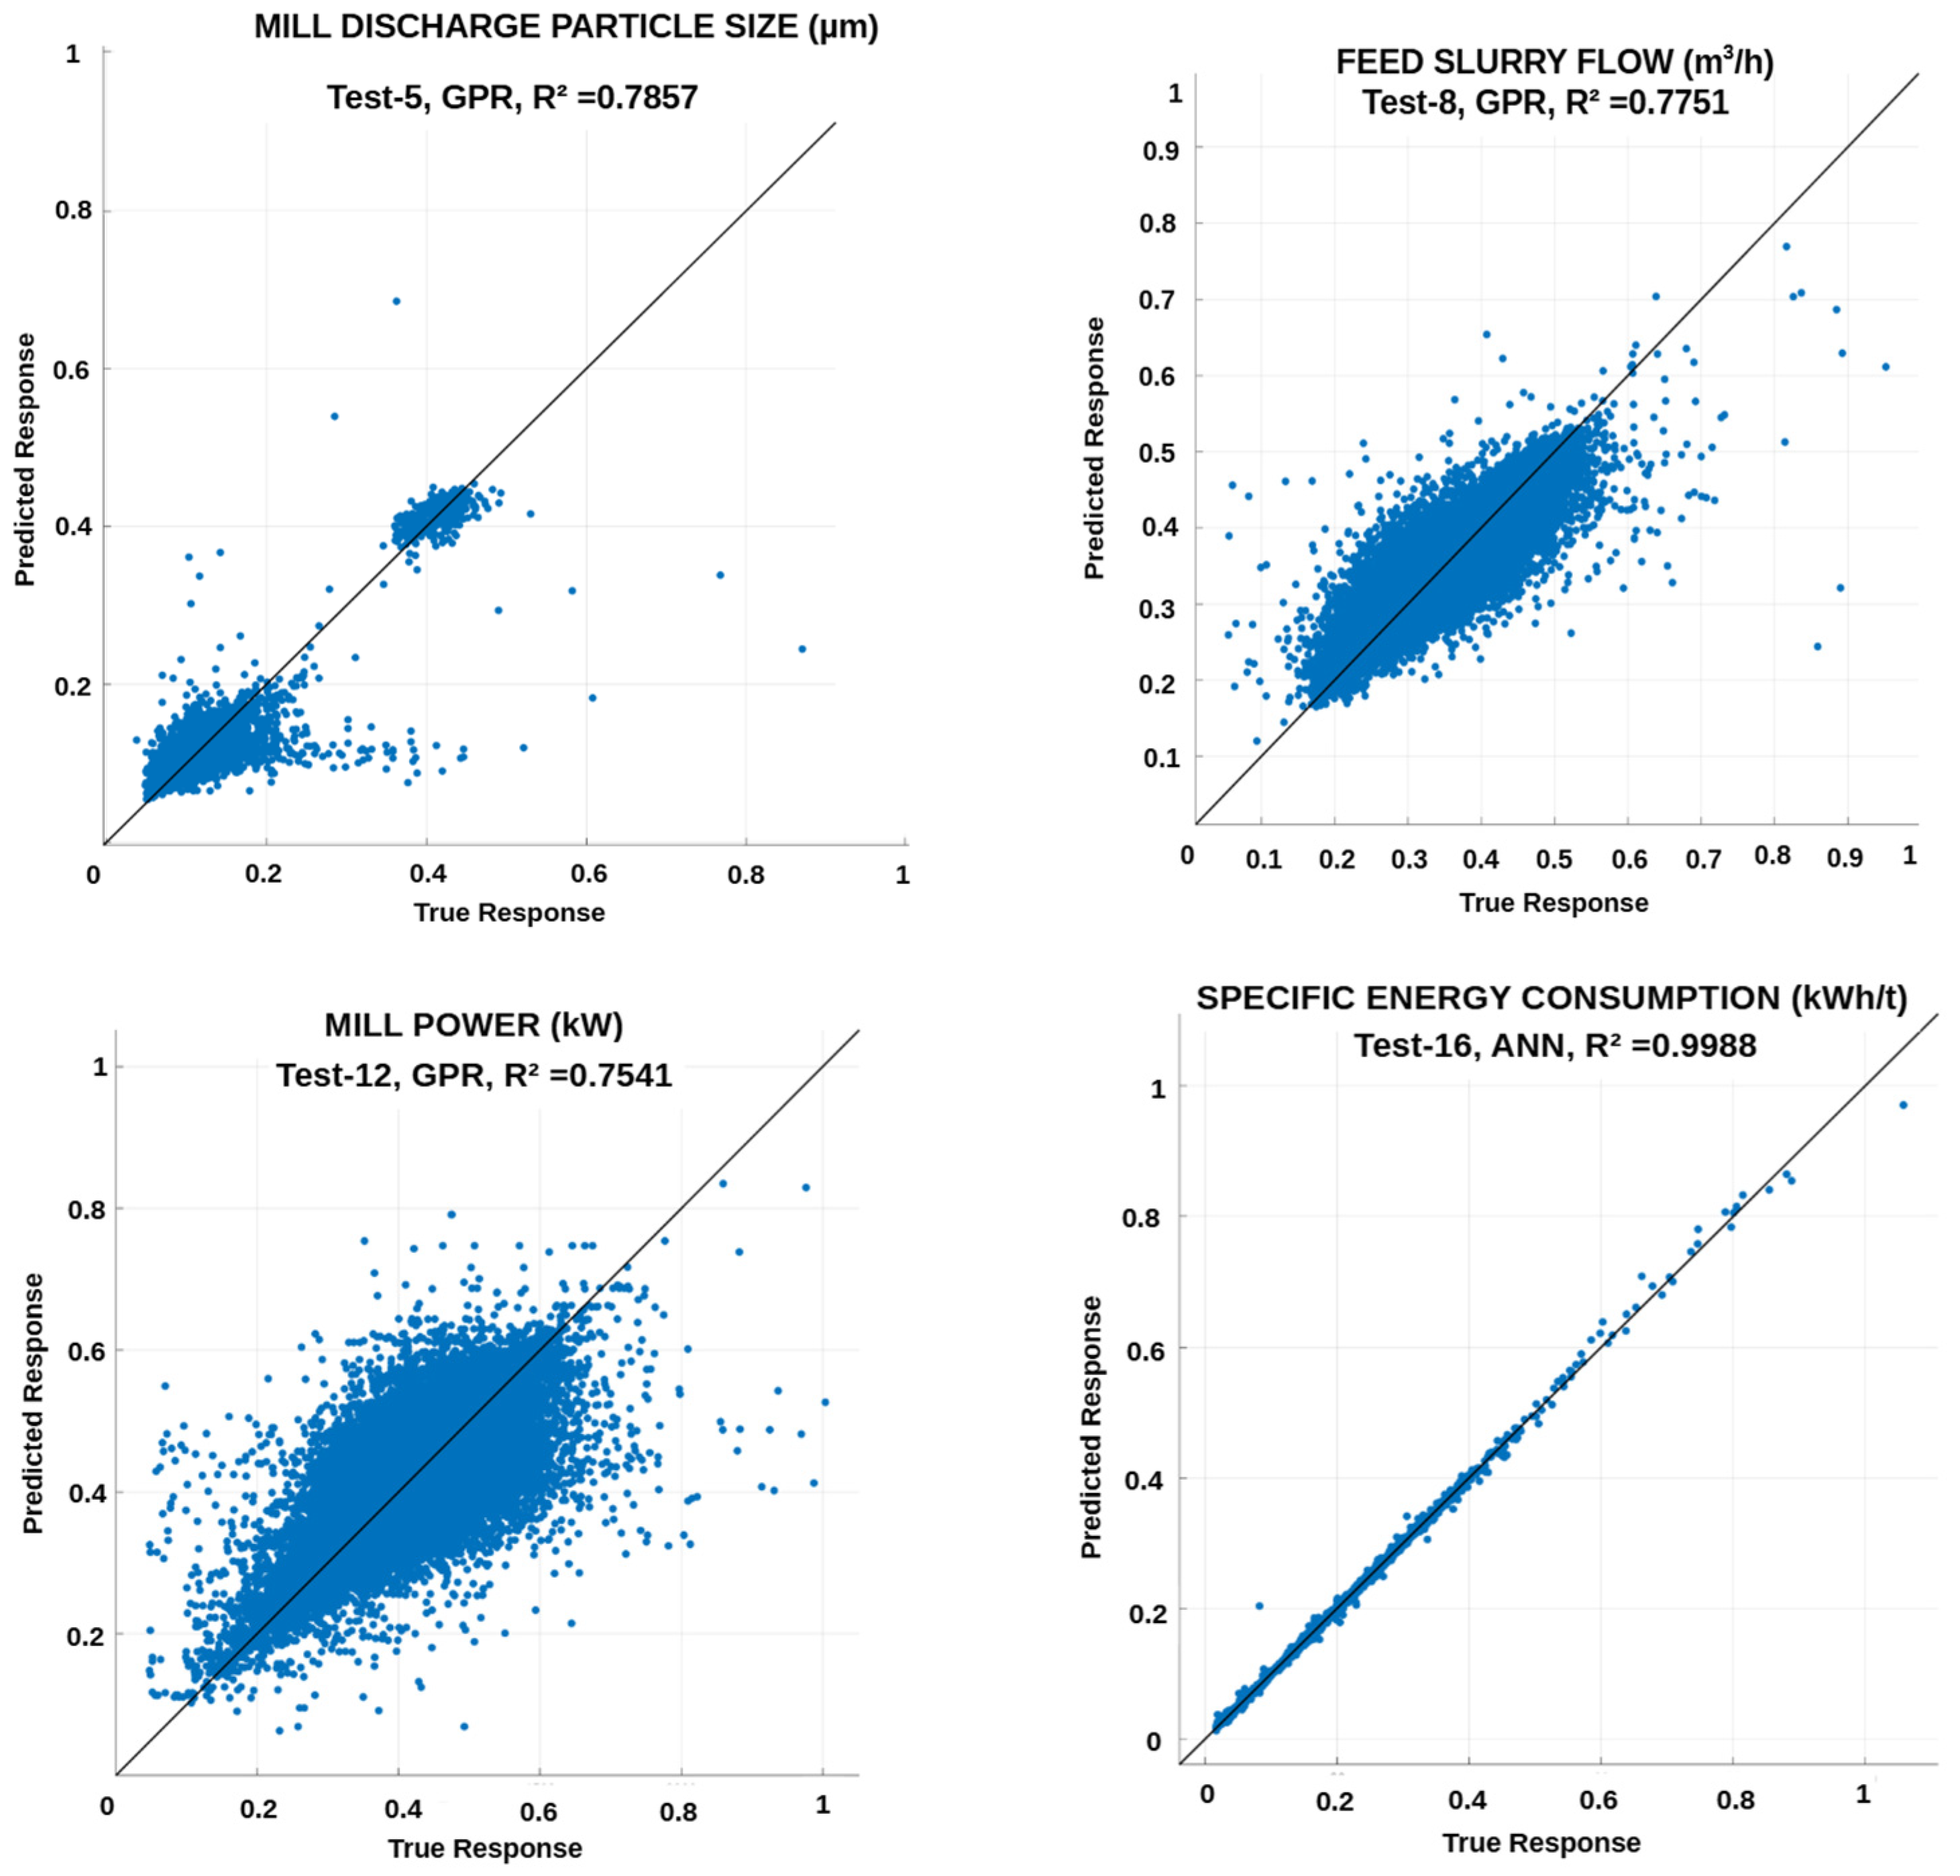
The plots of measured and predicted parameters are illustrated in Figure 4. Again, the values were compared based on the scaled form.
Figure 4.
Comparison of measured and predicted values for the target parameters, shown in normalized (scaled) form.
3.5. Conceptual Use of Feed Particle Size (F80)
3.5.1. Back Calculation of F80 Values
It should be noted that in the present study, F80 was not independently measured but back-calculated using Rittinger’s equation based on P80 and specific energy consumption. These back-calculated values provide a physically informed descriptor of feed characteristics. It should again be emphasized that the results of this section are interpreted as an upper-bound limit of the ML studies.
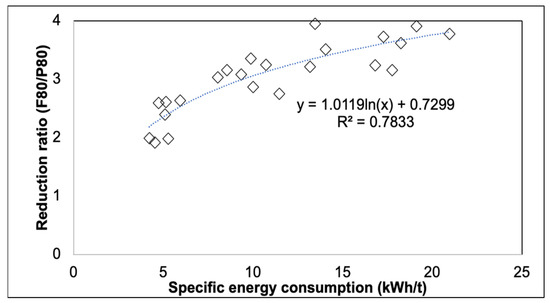
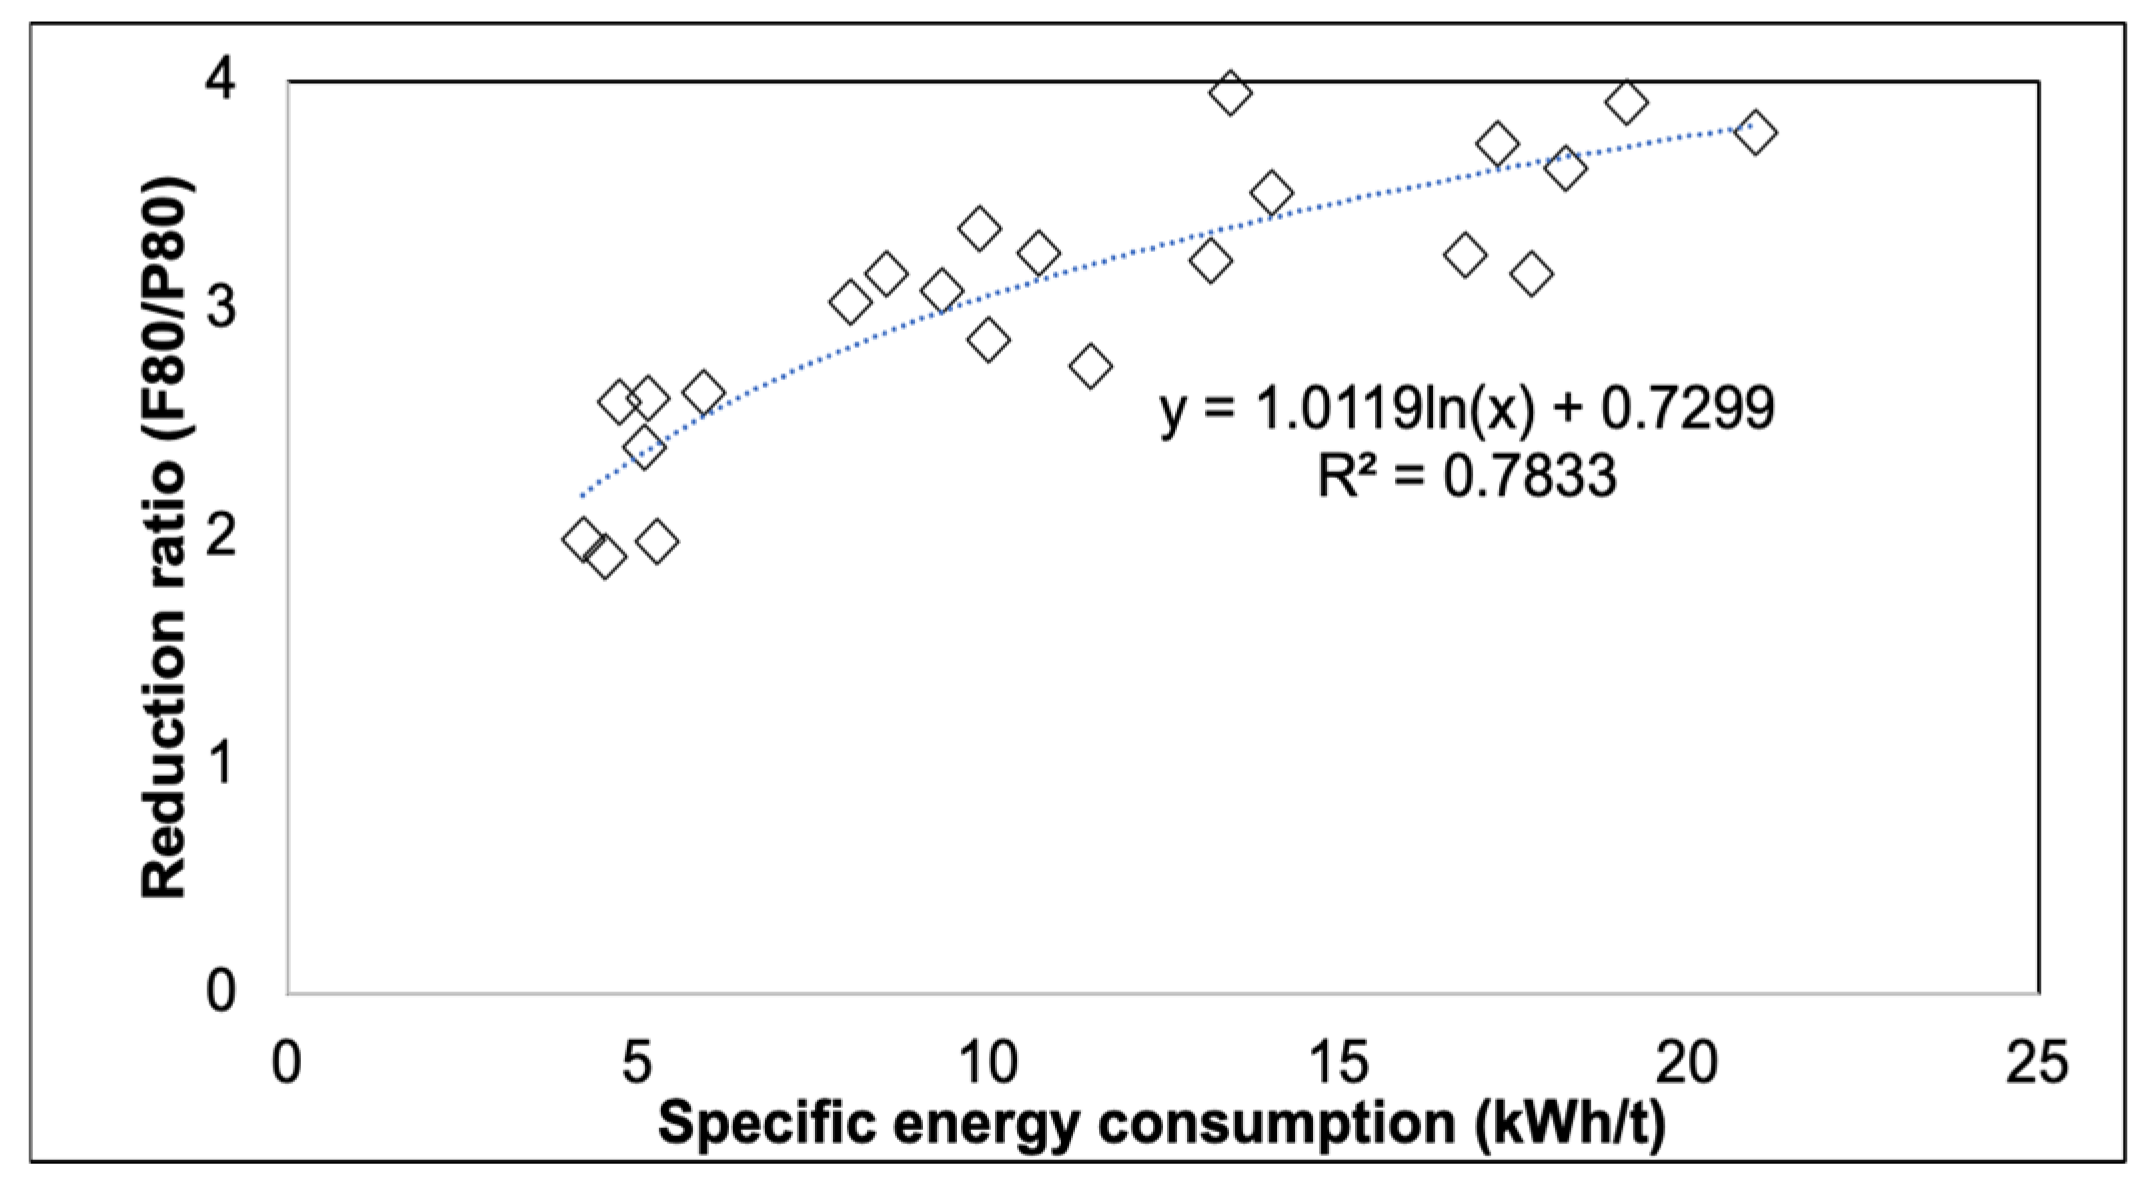
Prior to the back-calculation of feed size values, the quality and consistency of the experimental dataset used for model calibration were first assessed. Figure 5 illustrates the relationship between specific energy consumption and size reduction achieved in the wet vertical stirred media mill (WSMM). A clear positive correlation is observed, indicating that a higher specific energy input results in a higher level of size reduction, which is consistent with the fundamental principles of comminution [56,57].
Figure 5.
Specific energy and size reduction relationship of WSMM.
The observed logarithmic relationship suggests diminishing returns at higher energy levels, implying that beyond a certain energy input, additional energy contributes progressively less to further size reduction. Such behavior is characteristic of fine grinding systems and supports the applicability of energy–size relationships for WSMM operations.
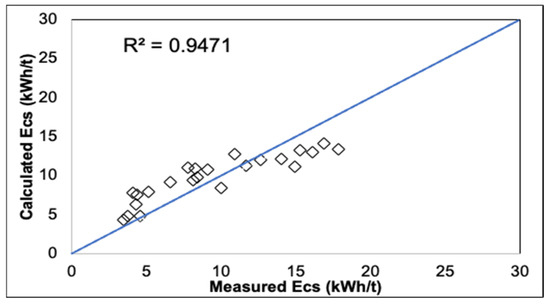
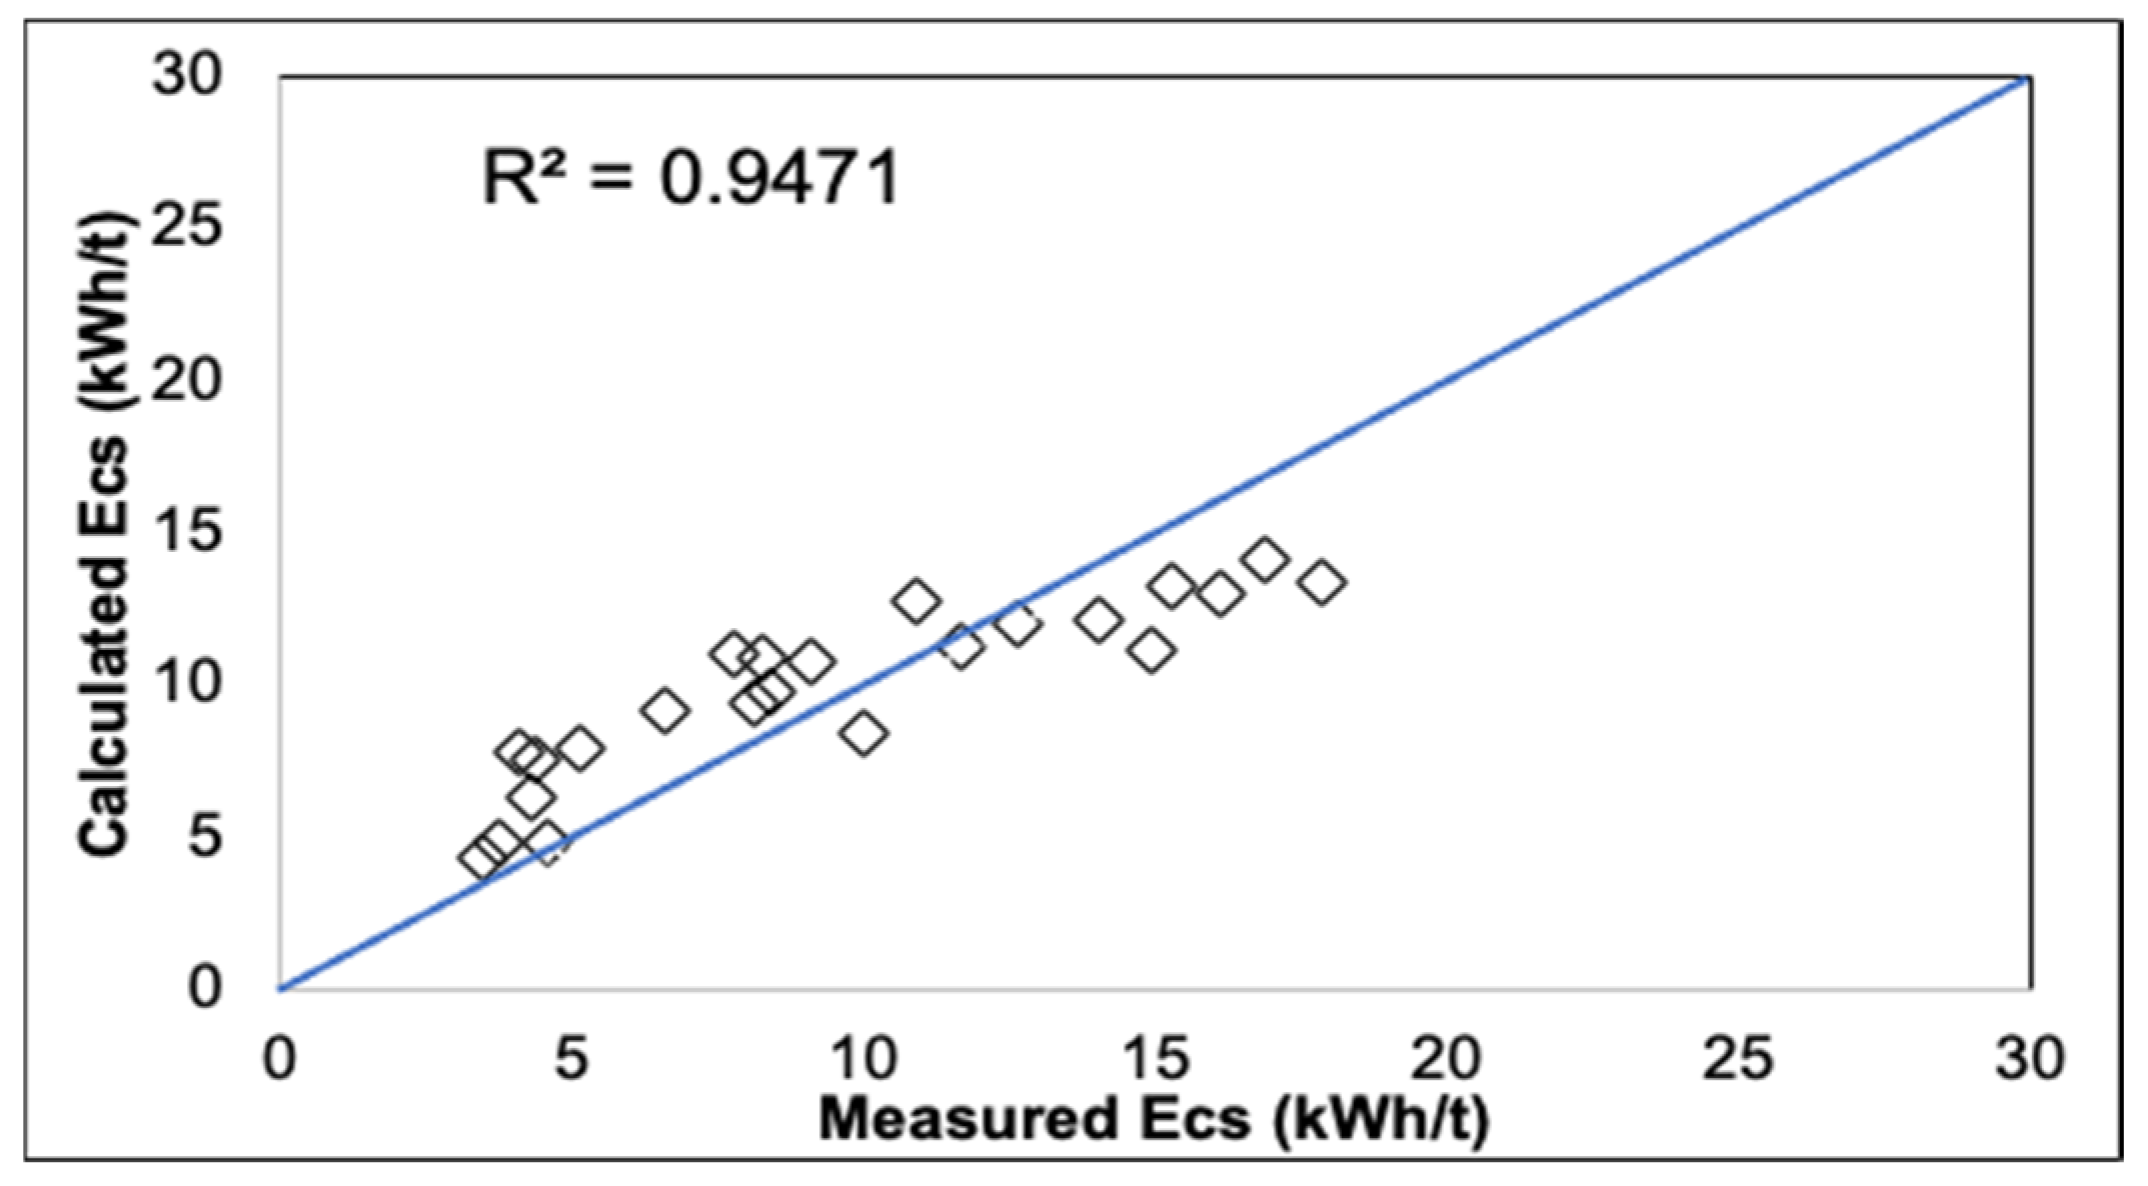
Based on this correlation, the experimental dataset was considered suitable for calibrating Rittinger’s equation. Fitting the equation to the experimental data yielded a Rittinger constant (KR) of 396.98. The goodness of fit, quantified by a coefficient of determination, was R2 of 0.947, indicating a reasonable agreement between measured and calculated specific energy values. The comparison between experimentally measured and model-predicted specific energy consumption values is depicted in Figure 6.
Figure 6.
The agreement between the measured and calculated Ecs.
The fit result confirms that Rittinger’s equation adequately captures the energy–size reduction behavior of the WSMM under the studied operating conditions. Consequently, the calibrated KR value was considered robust for use in back-calculating feed size at 80% passing (F80) from industrial sensor data. Using the measured product particle size (P80) and specific energy consumption, F80 values were back-calculated for a total of 75,922 industrial data records.
The resulting F80 dataset provided a physically informed descriptor of feed characteristics that is otherwise unavailable from direct plant measurements. These back-calculated feed size values were subsequently incorporated into the machine learning framework to evaluate the influence on predictive model performance, as discussed in the following section.
3.5.2. Conceptual Upper-Bound Sensitivity Analysis Using Back-Calculated Feed Size (F80)
This study also explored, conceptually, the potential role of feed size information in ML predictions by introducing a feed size descriptor (F80) that was back-calculated following the methodology described in Section 2.5. Feed size is a fundamental parameter affecting the energy required to achieve a target product size and may also influence power draw and slurry transport within a stirred mill.
The back-calculated F80 values were derived using the Rittinger-based energy–size relationship with a calibrated KR. F80 is not an independently measured plant variable; it is a physically guided estimate that partially embeds information already present in the sensor space. Consequently, the F80-inclusive results are presented only as a theoretical upper-bound (“what-if”) sensitivity analysis representing a best-case scenario where independent online feed size information (or a reliable proxy) is available, rather than as independent predictive capability.
Accordingly, four upper-bound sensitivity cases were evaluated by adding F80 to the baseline input sets: Test 5–F80 (P80), Test 8–F80 (Q), Test 12–F80 (MP), and Test 16–F80 (Ecs) (Table 16, Table 17 and Table 18).
Table 16.
R2 values of upper-bound sensitivity analyses of ML studies.
Table 17.
RMSE values of upper-bound sensitivity analyses of ML studies.
Table 18.
MAE values of upper-bound sensitivity analyses of ML studies.
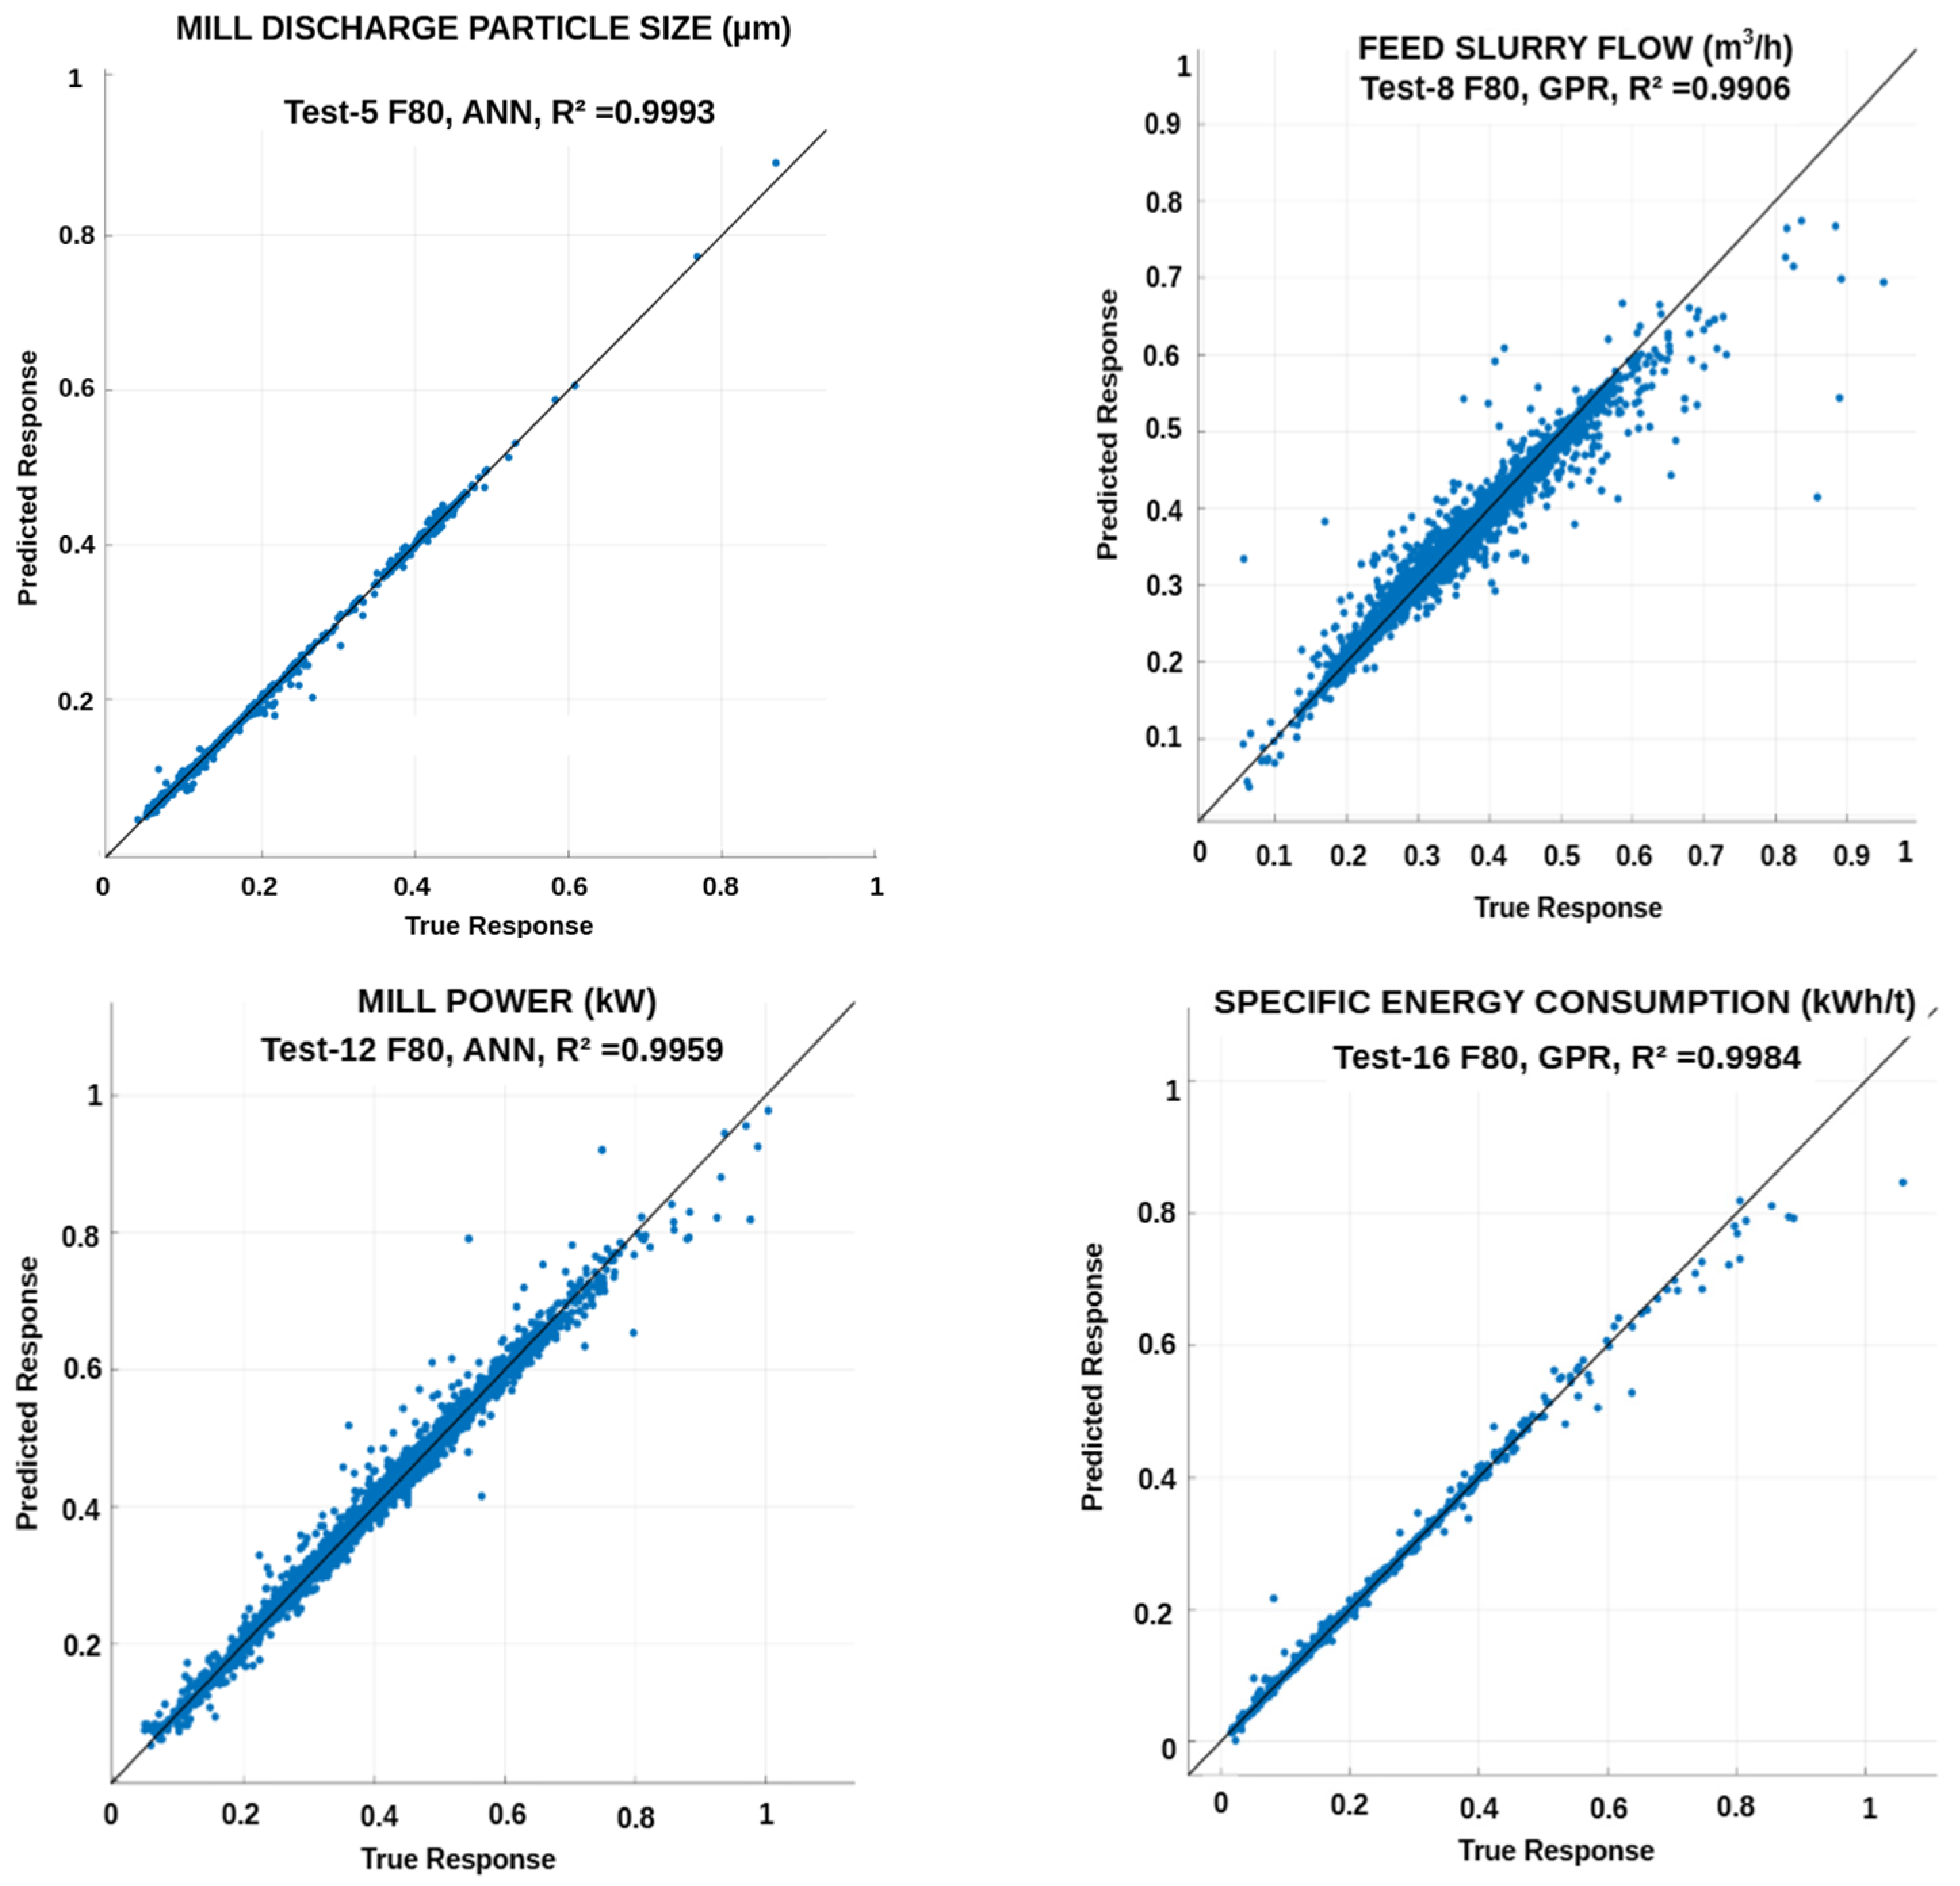
In the scenarios, adding F80 was associated with substantial improvements in the apparent prediction accuracy for P80, Q, and MP. For P80, Test 5–F80 achieved the highest validation performance (maximum R2 = 0.9993 with ANN; Table 16), with sharply reduced errors (ANN RMSE = 0.1804, Table 17; MAE = 0.0716, Table 18). For Q, Test 8–F80 yielded R2 = 0.9906 for both GPR and ANN (Table 16), with low prediction errors (GPR RMSE = 1.1533, ANN RMSE = 1.1538, Table 17; GPR MAE = 0.3608, Table 18). For MP, Test 12–F80 achieved R2 = 0.9959 with ANN and 0.9905 with GPR (Table 16), accompanied by large reductions in RMSE and MAE (Table 17 and Table 18). In contrast, the effect on Ecs was limited; because Ecs is already strongly constrained once MP and throughput-related variables are included, Test 16–F80 provided only a minor change relative to the best baseline cases (Table 12).
Table 19 summarizes the best-case validation R2 values observed in the upper-bound sensitivity analyses.
Table 19.
Summary of upper-bound sensitivity analyses.
Compared to the best baseline models (Table 15), the sensitivity cases show large increases in apparent accuracy for P80 (R2 of 0.7880 to 0.9993), Q (R2 of 0.7751 to 0.9906), and MP (R2 of 0.7541 to 0.9959), while Ecs remains essentially unchanged (R2 of 0.9991 to 0.9984). In practical deployment, the benefit of feed size should be demonstrated using independently measured feed size (or an independent proxy sensor) and time-separated validation.
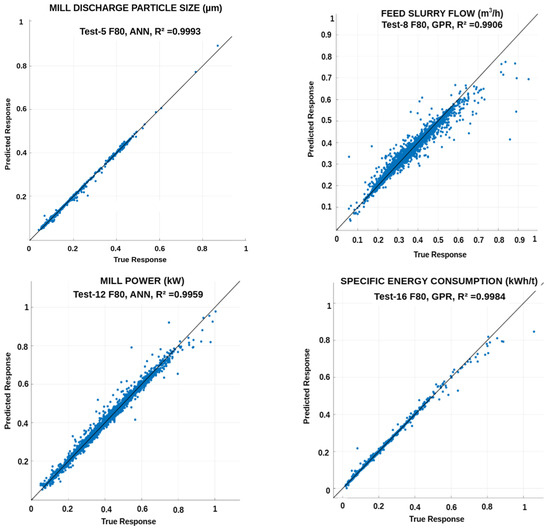
The measured and predicted values are compared in Figure 7; for consistency, all values are presented in scaled form.
Figure 7.
Comparison of measured and predicted values in scaled form, when feed size descriptor F80 is considered.
3.5.3. On the Limitations of F80 Estimation and Potential Points for Improvement
To limit circularity wherever possible, we paid explicit attention to definitional dependencies in the case studies. As a precedent, when predicting mill power (MP) we did not include specific energy consumption (Ecs) among the input variables, because Ecs is directly computed from MP and throughput terms; including it would create an artificial circular relationship and inflate performance. Nevertheless, the F80 descriptor used in this study is not independently measured and is back-calculated from the Rittinger-based energy–size framework using Ecs and P80. Because P80 is also a prediction target in some scenarios, using back-calculated F80 as an input may artificially elevate validation accuracy. Therefore, the F80 sensitivity results, including R2 values approaching unity, should be interpreted as theoretical upper-bound indications rather than independent predictive capability.
Despite this limitation, the conceptual use of F80 was included to illustrate the potential leverage of feed size information in predicting the key performance indicator of vertical WSMM when online sizing is unavailable. Based on prior experience and published evidence for vertical WSMM operation, experimental datasets follow physically meaningful energy equations with good agreement [34], suggesting that a directly measured feed size signal would be correlated with the estimated trends. Accordingly, these findings motivate future plant implementations that provide an independent feed size measurement (or an independent proxy), either through direct online size analysis or alternative sensing technologies (e.g., computer vision-based size inference). In addition, future validation should consider time-independent testing, such as training on one year of data and testing on another or using blocked/rolling temporal windows, to reduce optimistic estimates arising from temporal autocorrelation and to better represent deployment conditions.
4. Conclusions
This study developed and evaluated machine learning (ML) models to the predict key operating and performance variables of an industrial wet vertical stirred media milling circuit, namely mill discharge product size (P80), mill feed slurry flow rate (Q), mill power draw (MP), and specific energy consumption (Ecs). The modeling strategy combined data-driven variable screening (relief coefficient analysis) with stirred milling fundamentals, and model performance was assessed through a structured set of baseline input scenarios. In addition, a separate set of conceptual upper-bound sensitivity cases was examined in which a feed size descriptor (F80) was introduced to explore the potential influence of feed size information on prediction performance under a best-case scenario where independent online sizing (or a reliable proxy) would be available. For the baseline test cases, Gaussian Process Regression (GPR) and the ensemble approach (Random Forest Regression; RFR) provided the highest predictive accuracy across most test cases, while ANN generally followed and LR/SVR/single-tree approaches exhibited lower performance. The statistical comparison confirmed that the choice of regression method has a significant effect on predictive success across scenarios, providing a quantitative basis for method selection in similar comminution applications. Importantly, the results also demonstrated that simply increasing the number of sensor inputs does not necessarily improve prediction accuracy; instead, physically meaningful variables and well-constructed input sets yield greater benefits than expanding the feature space with correlated or redundant tags.
The variable-specific outcomes were consistent with stirred milling fundamentals. For P80 prediction, improvements were mainly associated with incorporating energy- and transport-related descriptors, reflecting the central role of energy utilization and slurry transport conditions in determining product fineness. Predictions of Q were largely governed by operational control variables, consistent with the fact that slurry flow is regulated through pump operation and coupled circuit dynamics. Mill power prediction benefited notably from the transport- and operating-state variables (e.g., pump- and pressure-related descriptors) that influence media fluidization and the effective load on the impeller. Specific energy consumption was predicted with near-perfect accuracy when MP and throughput-related variables were included among the inputs, whereas excluding MP caused a substantial degradation in model performance, highlighting the definitional dependence of Ecs on power and throughput. Overall, the baseline test results exhibited acceptable predictive accuracy, generally consistent with previously reported ML studies on comminution processes. Building on these baseline outcomes, the conceptual sensitivity cases using the back-calculated F80 showed large increases in apparent validation accuracy for P80 (best R2 = 0.9993), Q (best R2 = 0.9906; GPR/ANN tie), and MP (best R2 = 0.9959). However, because F80 was not independently measured and was estimated using P80 and specific energy consumption, these results should be interpreted only as theoretical upper-bound indications, not as independent predictive capability. In contrast, the incremental gain for Ecs was marginal because Ecs is already strongly constrained once MP and throughput-related variables are included (best baseline: GPR R2 = 0.9991 vs. with F80: 0.9984).
From a practical perspective, these results suggest a clear modeling pathway for researchers and practitioners: begin with GPR and/or an ensemble method (RFR) as robust baselines for non-linear and noisy comminution datasets, and then consider ANN when the dataset size is sufficiently large and careful tuning/regularization is feasible. To move beyond baseline prediction levels for variables such as P80, Q, and MP, future ML studies should prioritize physically meaningful descriptors of ore and breakage behavior (e.g., grindability indices and mineralogy/texture proxies) and, critically, evaluate the feed size effect using an independently measured feed size signal (or an independent proxy sensing approach).
The present study is limited to the investigated technology and its dataset; nevertheless, the proposed workflow—physics-guided feature selection, structured test design, and comparative evaluation—can be transferred to other milling technologies and comminution circuits. When implemented in an operating plant, the developed algorithms can continuously incorporate newly collected data, enabling progressive refinement of model parameters and sustained improvement in prediction accuracy over the mine life. With this, the energy and water consumption of the given operation can be optimized.
Supplementary Materials
The following supporting information can be downloaded at: https://www.mdpi.com/article/10.3390/min16030311/s1, Table S1: R2 values of the complete ML studies.
Author Contributions
Conceptualization, O.A., A.K. and A.S.K.; methodology, O.A., A.K., E.U., M.G., N.A.T. and A.S.K.; software, A.K., E.U., M.G. and A.S.K.; validation, A.K., E.U. and M.G.; formal analysis, O.A., A.K., E.U., M.G. and N.A.T.; investigation, O.A., A.K., E.U., M.G., N.A.T. and A.S.K.; data curation, O.A., E.U. and M.G.; writing—original draft preparation, O.A.; writing—review and editing, O.A., E.U., M.G. and N.A.T. All authors have read and agreed to the published version of the manuscript.
Funding
This research received no external funding.
Data Availability Statement
The data presented in this study are available on request from the corresponding author due to privacy.
Conflicts of Interest
The authors declare no conflicts of interest.
References
- Curry, J.A.; Leung, M.J.; Jameson, G.J. Mine operating costs and the potential impacts of energy and grinding. Miner. Eng. 2014, 56, 70–80. [Google Scholar] [CrossRef] [Scilit]
- Beke, B. The Process of Fine Grinding; M. Nijhoff/Dr. W. Junk Publishers: The Hague, The Netherlands, 1981. [Google Scholar]
- Chelgani, S.C.; Parian, M.; Parapari, P.S.; Ghorbani, Y.; Rosenkranz, J. A comparative study on the effects of dry and wet grinding on mineral flotation separation—A review. J. Mater. Res. Technol. 2019, 8, 5004–5011. [Google Scholar] [CrossRef] [Scilit]
- Batterham, R. Trends in comminution driven by energy. Adv. Powder Technol. 2011, 22, 138–140. [Google Scholar] [CrossRef] [Scilit]
- Jeswiet, J.; Szekeres, A. Energy consumption in mining comminution. Procedia CIRP 2016, 48, 140–145. [Google Scholar] [CrossRef] [Scilit]
- Wei, D.; Craig, I.K. Grinding mill circuits—A survey of control and economic concerns. Int. J. Miner. Process. 2009, 90, 56–66. [Google Scholar] [CrossRef] [Scilit]
- Pomerleau, A.; Hodouin, D.; Desbiens, A.; Gagnon, É. A survey of grinding circuit control methods: From decentralized PID controllers to multivariable predictive controllers. Powder Technol. 2000, 108, 103–115. [Google Scholar] [CrossRef] [Scilit]
- Zhou, P.; Lu, S.; Yuan, M.; Chai, T. Survey on higher-level advanced control for grinding circuits operation. Powder Technol. 2016, 288, 324–338. [Google Scholar] [CrossRef] [Scilit]
- Samuel, A.L. Some studies in machine learning using the game of checkers. IBM J. Res. Dev. 1959, 3, 210–229. [Google Scholar] [CrossRef] [Scilit]
- Li, X.; McKee, D.J.; Horberry, T.; Powell, M.S. The control room operator: The forgotten element in mineral process control. Miner. Eng. 2011, 24, 894–902. [Google Scholar] [CrossRef] [Scilit]
- Nachreiner, F.; Nickel, P.; Meyer, I. Human factors in process control systems: The design of human–machine interfaces. Saf. Sci. 2006, 44, 5–26. [Google Scholar] [CrossRef] [Scilit]
- Li, H.; Evertsson, M.; Lindqvist, M.; Hulthén, E.; Asbjörnsson, G.; Bonn, G. Dynamic modelling of a SAG mill–pebble crusher circuit by data-driven methods. In Proceedings of the SAG Conference, Vancouver, BC, Canada, 22–26 September 2019. [Google Scholar]
- Ghasemi, Z.; Neshat, M.; Aldrich, C.; Karageorgos, J.; Zanin, M.; Neumann, F.; Chen, L. An integrated intelligent framework for maximising SAG mill throughput: Incorporating expert knowledge, machine learning and evolutionary algorithms for parameter optimisation. Miner. Eng. 2024, 212, 108764. [Google Scholar] [CrossRef] [Scilit]
- Saldaña, M.; Gálvez, E.; Navarra, A.; Toro, N.; Cisternas, L.A. Optimization of the SAG grinding process using statistical analysis and machine learning: A case study of the Chilean copper mining industry. Materials 2023, 16, 3220. [Google Scholar] [CrossRef] [Scilit]
- Petra. Newcrest SAG Mill Overload Downtime Prevention at Lihir. Available online: https://www.petradatascience.com/casestudy/newcrest-sag-mill-overload-downtime-prevention-at-lihir/ (accessed on 19 January 2026).
- Pural, Y.E.; Ledezma, T.; Hilden, M.; Forbes, G.; Boylu, F.; Yahyaei, M. Application of machine learning for generic mill liner wear prediction in semi-autogenous grinding (SAG) mills. Minerals 2024, 14, 1200. [Google Scholar] [CrossRef] [Scilit]
- Petersen, K.; Aldrich, C.; Van Deventer, J. Analysis of ore particles based on textural pattern recognition. Miner. Eng. 1998, 11, 959–977. [Google Scholar] [CrossRef] [Scilit]
- Lopez, P.; Reyes, I.; Risso, N.; Momayez, M.; Zhang, J. Machine Learning Algorithms for Semi-Autogenous Grinding Mill Operational Regions’ Identification. Minerals 2023, 13, 1360. [Google Scholar] [CrossRef] [Scilit]
- Tohry, A.; Yazdani, S.; Hadavandi, E.; Mahmudzadeh, E.; Chelgani, S.C. Advanced modeling of HPGR power consumption based on operational parameters by BNN: A “conscious-lab” development. Powder Technol. 2021, 381, 280–284. [Google Scholar] [CrossRef] [Scilit]
- Tohry, A.; Chelgani, S.C.; Matin, S.S.; Noormohammadi, M. Power-draw prediction by random forest based on operating parameters for an industrial ball mill. Adv. Powder Technol. 2021, 31, 967–972. [Google Scholar] [CrossRef] [Scilit]
- Peng, J.; Sun, W.; Xu, J.; Zhou, G.; Xie, L.; Han, H.; Xiao, Y.; Chen, J.; Li, Q. Analyzing process parameters for industrial grinding circuit based on machine learning method. Adv. Powder Technol. 2023, 34, 104113. [Google Scholar] [CrossRef] [Scilit]
- Azhin, M.; Lopetinsky, R.; Stiksma, J.; Amjad, F.; Hassanzadeh, B.; Tirumalaraju, S.; Meenavilli, C. Application of multivariable data analysis in mineral processing. IFAC-PapersOnLine 2022, 55, 79–84. [Google Scholar] [CrossRef] [Scilit]
- Shi, F.; Morrison, R.; Cervellin, A.; Burns, F.; Musa, F. Comparison of energy efficiency between ball mills and stirred mills in coarse grinding. Miner. Eng. 2009, 22, 673–680. [Google Scholar] [CrossRef] [Scilit]
- Jankovic, A. Variables affecting the fine grinding of minerals using stirred mills. Miner. Eng. 2003, 16, 337–345. [Google Scholar] [CrossRef] [Scilit]
- Naeimi, M.; Behrad Vakylabad, A.; Hosseini, S.M.; Hassanzadeh, A.; Rahmanian, A.; Asgari, K.; Chenlong, D.; Nazari, S. A Critical Review of Innovations in Stirred Mill Technology for Enhancing Energy Efficiency. Miner. Process. Extr. Metall. Rev. 2025, 1–16. [Google Scholar] [CrossRef] [Scilit]
- Thon, C.; Lahmann, M.; Munyabuhoro, H.D.; Kausche, S.; Kwade, A.; Kirches, C.; Schilde, C. AI-driven soft-sensor for stirred media mills for real-time process control. Adv. Powder Technol. 2025, 36, 105007. [Google Scholar] [CrossRef] [Scilit]
- Thon, C.; Böttcher, A.-C.; Möhlen, F.; Yu, M.; Kwade, A.; Schilde, C. Multi-modal framework to model wet milling through numerical simulations and artificial intelligence (part 1). Chem. Eng. J. 2022, 449, 137794. [Google Scholar] [CrossRef] [Scilit]
- Junnola, J. Basic Testwork with the Outotec Pilot HIGmill. Master’s Thesis, University of Oulu, Oulu, Finland, 2013. [Google Scholar]
- Outotec. HIGmill—Manual; Outotec: Espoo, Finland, 2017. [Google Scholar]
- Altun, O.; Darılmaz, Ö.; Karahan, E.; Sert, T.; Altun, D.; Toprak, A.; Hür, A. Understanding HIGMill operation at copper regrind application: Operating parameters, wear and mineral liberation. Miner. Eng. 2023, 191, 107968. [Google Scholar] [CrossRef] [Scilit]
- Metso Outotec. HIGMill—High Intensity Grinding Mill. Available online: https://www.metso.com/portfolio/higmill-high-intensity-grinding-mill/ (accessed on 19 January 2026).
- Lehto, H.; Musuku, B.; Keikkala, V.; Kurki, P.; Paz, A. Developments in stirred media milling test work and scale performance of Outotec HIG mill. In Proceedings of the Comminution Conference, Cape Town, South Africa, 11–14 April 2016. [Google Scholar]
- Heath, A.; Kinnunen, V.; Paz, A.; Lehto, H. A power model for fine grinding HIGmills with castellated rotors. Miner. Eng. 2017, 103–104, 25–32. [Google Scholar] [CrossRef] [Scilit]
- Altun, O.; Sert, T.; Altun, D.; Toprak, A.; Kwade, A. Scale-up of vertical wet stirred media mill (HIGmill) via signature plots, stress analyses and energy equations. Miner. Eng. 2024, 205, 108300. [Google Scholar] [CrossRef] [Scilit]
- Mucsi, G. Grindability of quartz in stirred media mill. Part. Sci. Technol. 2013, 31, 399–406. [Google Scholar] [CrossRef] [Scilit]
- Freedman, D.A. Statistical Models: Theory and Practice; Cambridge University Press: Cambridge, UK, 2009. [Google Scholar]
- Breiman, L.; Friedman, J.; Olshen, R.A.; Stone, C.J. Classification and Regression Trees; Routledge: New York, NY, USA, 2017. [Google Scholar]
- Drucker, H.; Surges, C.J.C.; Kaufman, L.; Smola, A.; Vapnik, V. Support vector regression machines. In Advances in Neural Information Processing Systems; Mozer, M.C., Jordan, M.I., Petsche, T., Eds.; Morgan Kaufmann: San Francisco, CA, USA, 1996; Volume 9, pp. 155–161. [Google Scholar]
- Breiman, L. Random forests. Mach. Learn. 2001, 45, 5–32. [Google Scholar] [CrossRef] [Scilit]
- Haykin, S. Neural Networks: A Comprehensive Foundation; Macmillan: New York, NY, USA, 1994. [Google Scholar]
- Schulz, E.; Speekenbrink, M.; Krause, A. A tutorial on Gaussian process regression: Modelling, exploring, and exploiting functions. J. Math. Psychol. 2018, 85, 1–16. [Google Scholar] [CrossRef] [Scilit]
- Robnik-Šikonja, M.; Kononenko, I. Theoretical and empirical analysis of Relief. Mach. Learn. 2003, 53, 23–69. [Google Scholar] [CrossRef] [Scilit]
- Tukey, J.W. Exploratory Data Analysis; Addison-Wesley: Reading, MA, USA, 1977; Volume 2. [Google Scholar]
- Gao, M.W.; Forssberg, K.S.E.; Weller, K.R. Power predictions for a pilot scale stirred ball mill. Int. J. Miner. Process. 1996, 44–45, 641–652. [Google Scholar] [CrossRef] [Scilit]
- Radziszewski, P. Assessing the stirred mill design space. Miner. Eng. 2013, 41, 9–16. [Google Scholar] [CrossRef] [Scilit]
- Bilgili, E.; Toprak, N.A.; Altun, D.; Altun, O. PBM of an industrial-scale vertical wet stirred media mill (HIGmill): Assessment of back-calculation and hybrid methods. Powder Technol. 2024, 440, 119760. [Google Scholar] [CrossRef] [Scilit]
- Rasmussen, C.E.; Williams, C.K.I. Gaussian Processes for Machine Learning; MIT Press: Cambridge, MA, USA, 2006. [Google Scholar]
- Bishop, C.M. Pattern Recognition and Machine Learning; Springer: New York, NY, USA, 2006. [Google Scholar]
- Smola, A.J.; Schölkopf, B. A tutorial on support vector regression. Stat. Comput. 2004, 14, 199–222. [Google Scholar] [CrossRef] [Scilit]
- Goodfellow, I.; Bengio, Y.; Courville, A. Deep Learning; MIT Press: Cambridge, MA, USA, 2006. [Google Scholar]
- Austin, L.G.; Klimpel, R.R.; Luckie, P.T. Process Engineering of Size Reduction: Ball Milling; Society of Mining Engineers of AIME: New York, NY, USA, 1984. [Google Scholar]
- Choi, H.K.; Choi, W.S. Ultra-fine grinding mechanism of inorganic powders in a stirred ball mill: The effect of grinding aids. Korean J. Chem. Eng. 2003, 20, 554–559. [Google Scholar] [CrossRef] [Scilit]
- Ouattara, S.; Frances, C. Grinding of calcite suspensions in a stirred media mill: Effect of operational parameters on the product quality and the specific energy. Powder Technol. 2014, 255, 89–97. [Google Scholar] [CrossRef] [Scilit]
- Kwade, A.; Schwedes, J. Wet grinding in stirred media mills. In Handbook of Powder Technology: Particle Breakage; Salman, A., Ghadiri, M., Hounslow, M., Eds.; Elsevier Science: Amsterdam, The Netherlands, 2007; pp. 251–383. [Google Scholar]
- Palaniandy, S.; Yahyaei, M.; Powell, M.S. Assessment of hydrocyclone operation in gravity induced stirred mill circuits. Miner. Eng. 2017, 108, 83–92. [Google Scholar] [CrossRef] [Scilit]
- Wills, B.A.; Finch, F. Wills’ Mineral Processing Technology, 8th ed.; Elsevier Butterworth-Heinemann: Oxford, UK, 2016. [Google Scholar]
- Gupta, A.; Yan, D. Mineral Processing Design and Operations, 2nd ed.; Elsevier: Amsterdam, The Netherlands, 2016. [Google Scholar]

Disclaimer/Publisher’s Note: The statements, opinions and data contained in all publications are solely those of the individual author(s) and contributor(s) and not of MDPI and/or the editor(s). MDPI and/or the editor(s) disclaim responsibility for any injury to people or property resulting from any ideas, methods, instructions or products referred to in the content. |
© 2026 by the authors. Licensee MDPI, Basel, Switzerland. This article is an open access article distributed under the terms and conditions of the Creative Commons Attribution (CC BY) license.