


Abstract
The Tunca River is a transboundary watercourse between Türkiye and Bulgaria. It is the longest tributary of the Meriç River System (MRS) and joins the Meriç River in Türkiye after flowing through Bulgarian territory. In this study, the concentrations of Potentially Toxic Elements (PTEs), including As, Cd, Co, Cr, Cu, Hg, Mn, Ni, Pb, Sb, and Zn, as well as lead (Pb) isotope compositions, in sediments from the Turkish section of the Tunca River were investigated. Contamination levels and ecological risk status were evaluated using single and integrated indices and Sediment Quality Guidelines (SQGs). According to the Geoaccumulation Index (Igeo), Enrichment Factor (EF), and Contamination Factor (Cf) values, As, Cd, Mn, and Pb exhibit moderate to considerable levels of contamination. Pollution Load Index (PLI) and Modified Degree of Contamination (mCdeg) values indicate that pollution from total metal loads locally reaches moderate to high levels. PTE concentrations were below Threshold Effect Concentration (TEC) values, suggesting a low probability of adverse biological effects. However, the Potential Ecological Risk Index (PERI) values indicate locally moderate to high ecological risk of total metal loads. Geostatistical analyses suggest that Cd, Co, Cr, Cu, Hg, Ni, Pb, and Zn are of geogenic origin, whereas As, Sb, and Mn are associated with anthropogenic sources. The 206Pb/207Pb ratios in the sediments range from 1.18 to 1.25, while the 208Pb/206Pb ratios vary between 2.07 and 2.22. These values deviate slightly from natural isotopic signatures, suggesting anthropogenic influence on Pb concentrations.
1. Introduction
Rivers are among the primary freshwater resources that meet human needs such as drinking, domestic use, and agricultural irrigation. Therefore, maintaining water quality of rivers is crucial. Rivers also host sediments in which Potentially Toxic Elements (PTEs) are stored [1]. PTEs have non-biodegradable nature and exhibit toxic properties when taken into the human body through multiple pathways, such as ingestion, inhalation, and/or dermal absorption [2,3,4]. Under suitable physicochemical conditions, these elements can be released from sediments into the water column and threaten water quality [5]. Therefore, investigating the abundance of PTEs in river sediments is critically important for protecting human and ecosystem health and for anticipating potential adverse effects in advance.
In sediments, accumulation levels and assessment of ecological risks caused by trace elements are determined by widely accepted geochemical indices. Indices such as the Geoaccumulation Index (Igeo), Enrichment Factor (EF), Contamination Factor (Cf), Pollution Load Index (PLI), Modified Degree of Contamination (mCdeg), and Potential Ecological Risk Index (PERI) provide measurable and reliable outputs [6]. In addition, Sediment Quality Guidelines (SQGs) allow for the quantitative assessment of potential adverse biological effects on sediment-dwelling organisms [7].
PTEs may originate from geogenic and/or anthropogenic sources. Geogenic sources are closely related to the geochemical composition of the parent rocks from which sediments are derived and to the intensity of their weathering processes [5,8]. Because PTEs are natural constituents of rocks, the amounts accumulated in sediments vary according to their concentrations in the parent lithologies [9,10]. Anthropogenic sources, in contrast, include activities such as industrial operations, mining, agrochemical use, sewage disposal and the combustion of fossil fuels [11]. Geostatistical methods are commonly applied for source apportionment between geogenic and anthropogenic sources, such as the Pearson Correlation Coefficient (PCC), Hierarchical Cluster Analysis (HCA), and Principal Component Analysis (PCA) [12]. In addition to these statistical approaches, lead (Pb) isotopes provide a highly precise method for distinguishing between anthropogenic and geogenic Pb sources [13,14].
Lead (Pb) has four important isotopes in nature. Among them, 204Pb is primordial, meaning it has been stable since the formation of the Earth. The other three isotopes 206Pb, 207Pb, and 208Pb have very long half-lives and are radiogenic decay products of 238U, 235U, and 232Th, respectively. Concentrations of U, Th, and Pb in geological materials change over time due to radioactive decay. However, this behavior differs in Pb sulfide ores, where hydrothermal fluids separate U and Th from the ore, effectively fixing the Pb concentration at the time of ore deposit formation. As a result, each Pb deposit possesses its own distinct isotopic ratio [15]. Pb used in anthropogenic applications, such as industrial products, gasoline additives and pesticides, is primarily derived from Pb sulfide deposits. Consequently, Pb released into the environment reflects the isotopic ratios of the ore deposit used as the Pb source, differing from the natural isotopic ratios found in the natural environment. These differences in isotopic ratios allow for the precise identification of anthropogenic sources [13].
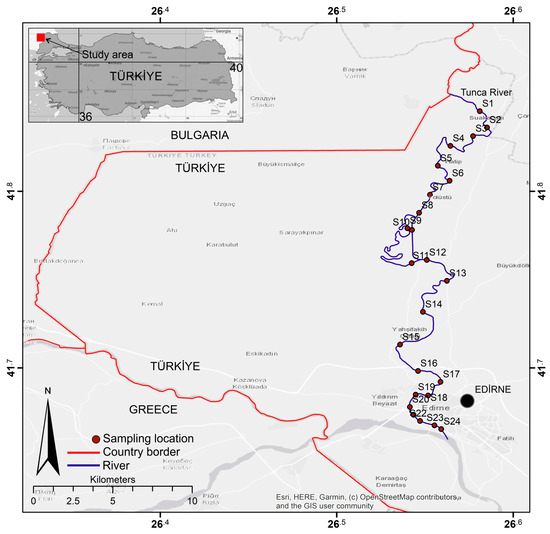
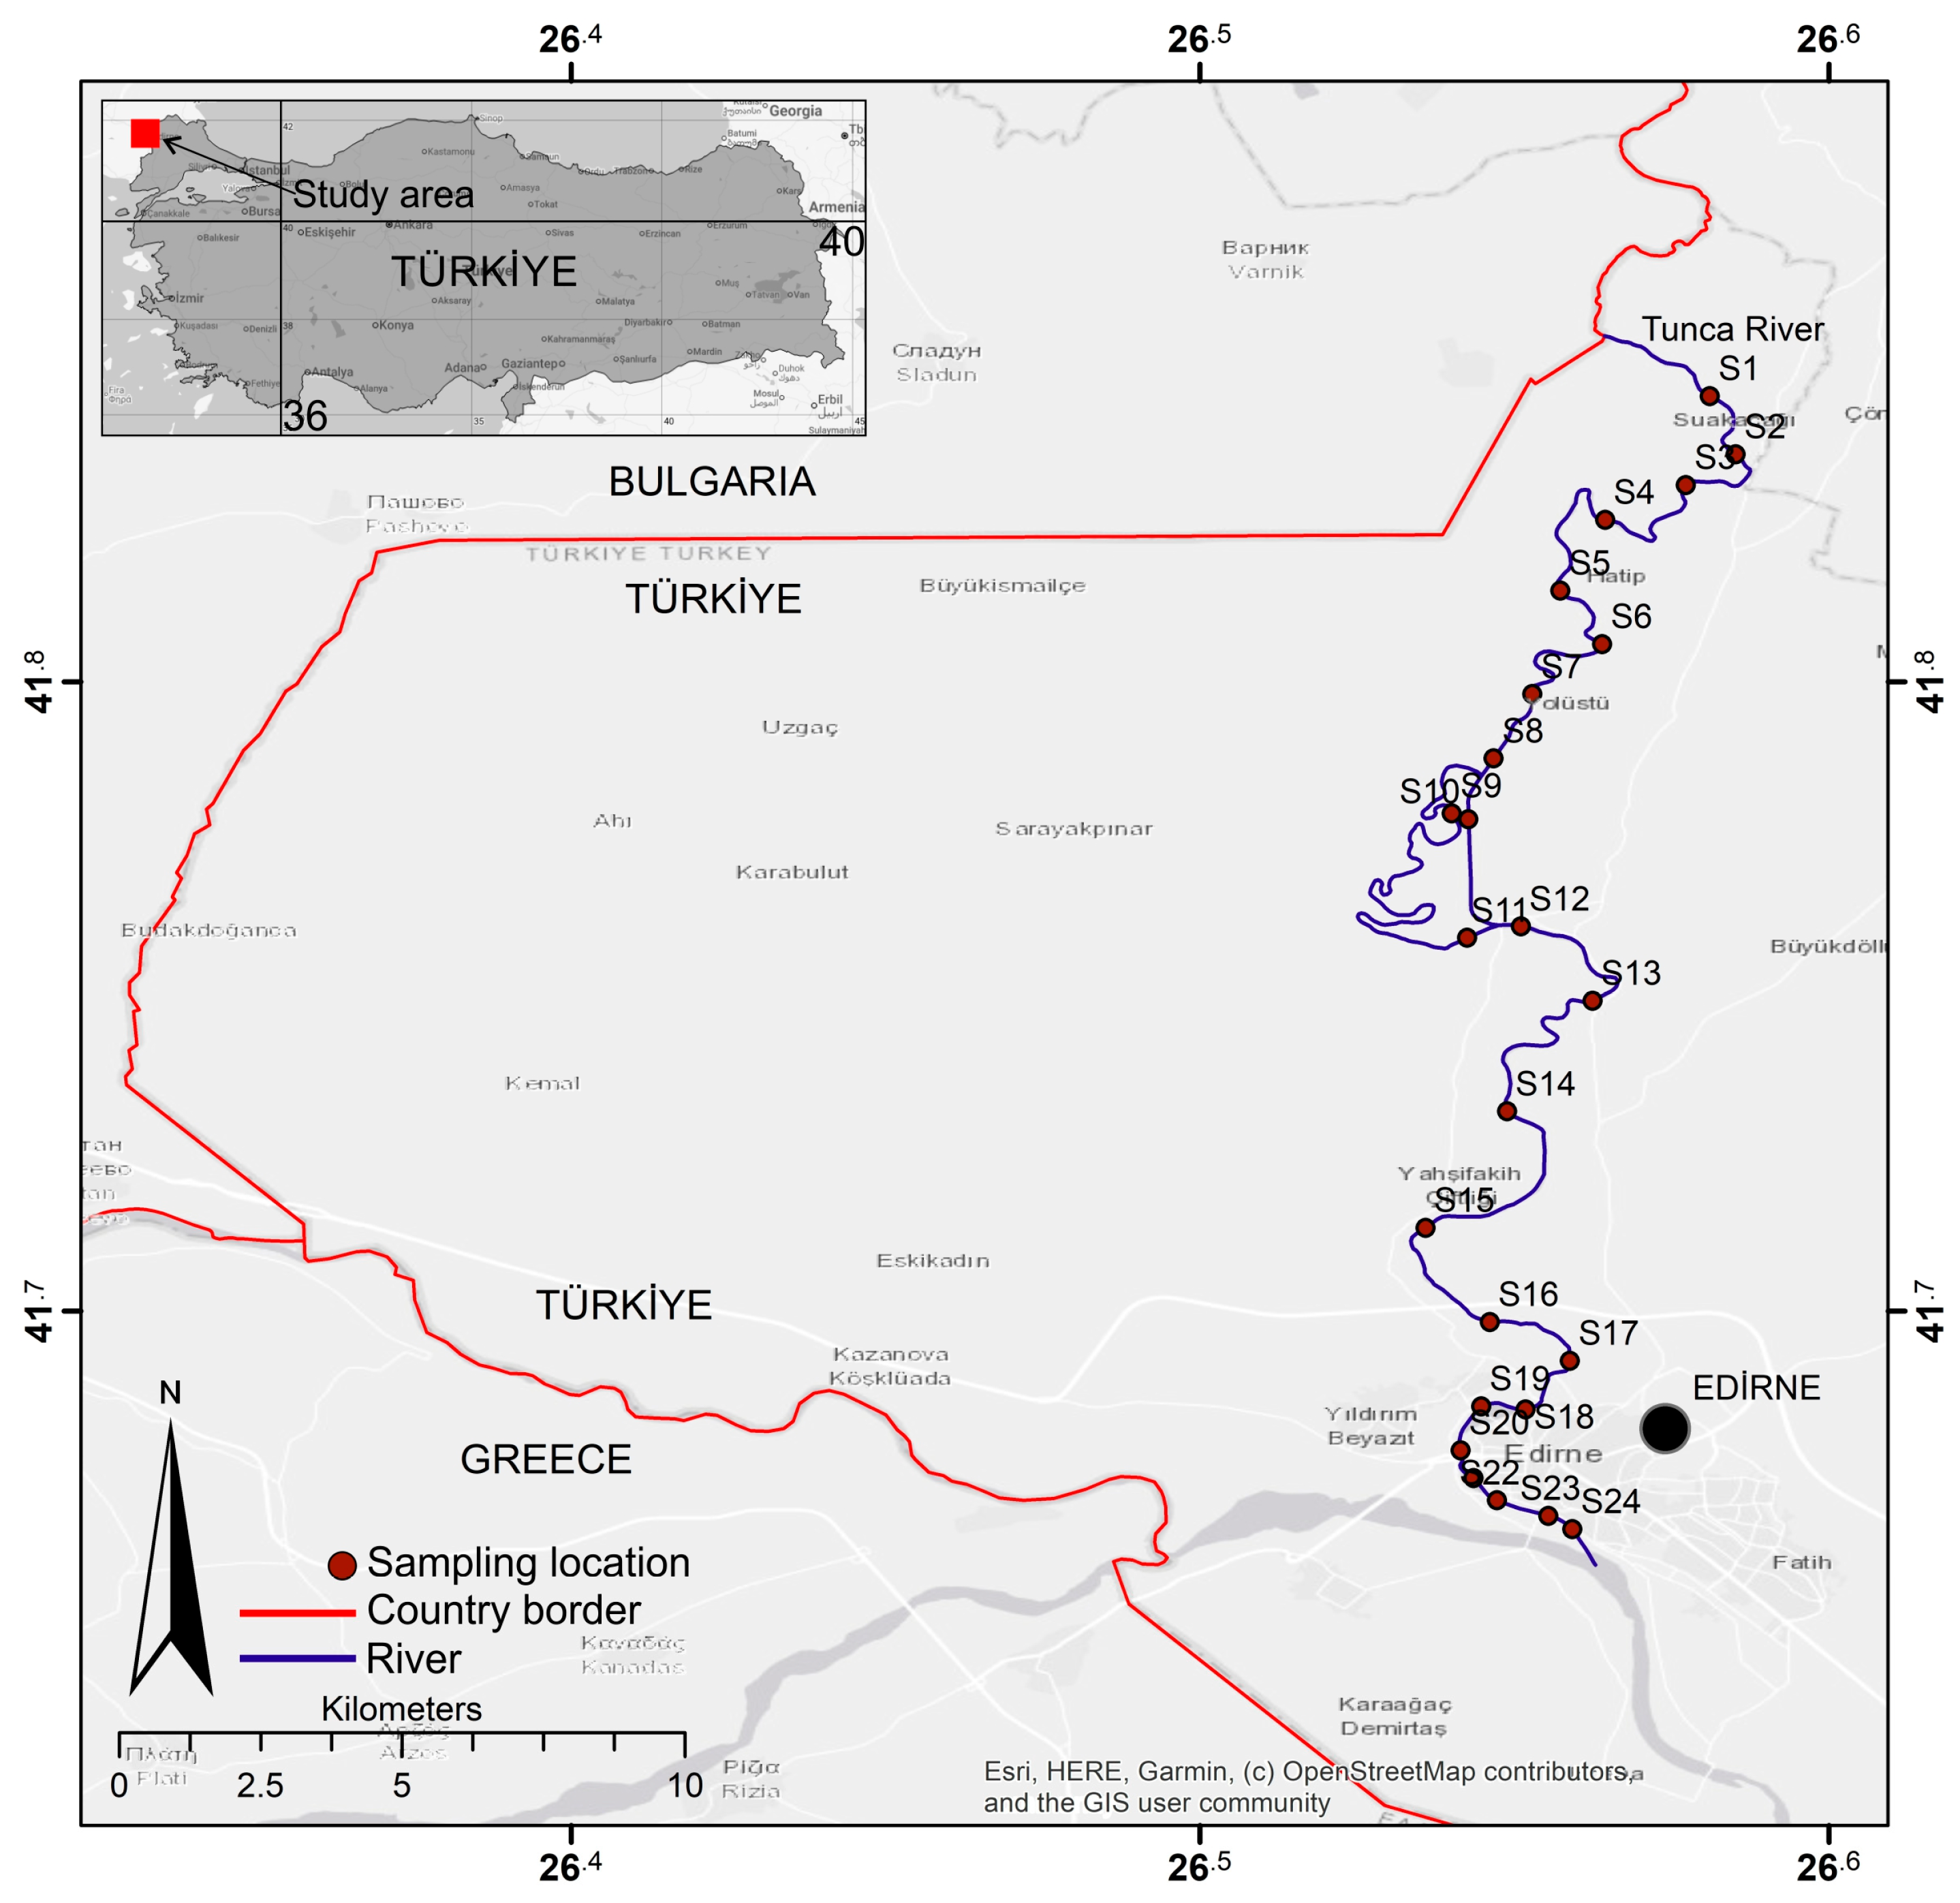
The Tunca River, which constitutes the longest tributary of the MRS, flows for approximately 30 km within the territory of Türkiye before joining the Meriç River (Figure 1). Its main drainage basin is in Bulgaria, with a small portion extending into Türkiye. In this study, the segment of the Tunca River within Türkiye is examined (Figure 1). Hereafter, the name Tunca refers exclusively to the section of the river located within Türkiye.
Figure 1.
Location map of the Tunca River in Türkiye and the sampling sites.
The Meriç, Arda, Tunca, and Ergene Rivers together form the Meriç River System (MRS) in the southeastern part of the Balkans. The Meriç, Arda, and Tunca rivers are transboundary rivers and are shared by Türkiye, Bulgaria, and Greece [16]. In contrast, the Ergene River lies entirely within the borders of Türkiye. The catchment area that feeds the MRS, referred to as the Meriç River Basin (MRB), consists of the Meriç sub-basin, the Arda sub-basin, the Tunca sub-basin, and the Ergene sub-basin. The portion of the MRB within the borders of Türkiye includes part of the Arda sub-basin, part of the Tunca sub-basin, and the entirety of the Ergene sub-basin, and is known in Türkiye as the Meriç–Ergene Basin. Numerous studies have been conducted on the rivers within the Meriç–Ergene Basin. Tokatlı and Islam [17] provided a comprehensive review of these studies, emphasizing that they have been carried out from various perspectives, including water quality, sediment quality, human health risks, ecological risks, and organic pollutants. These studies examined the Tunca River as complementary to the Meriç and Ergene rivers to assess metal pollution in the Meriç–Ergene basin, due to a lack of sufficient sampling locations. However, there is no study in the literature examining the Tunca River in a representative manner, addressing it individually, and focusing on Pb isotope concentrations. In addition, the risk of transboundary metal dispersal including Pb caused by mining activities in Bulgaria to neighboring countries was previously reported [18]. This present study fills the gap in this area by addressing the individual pollution pressure on the river.
Fertile lands used for agricultural production are located along the banks of the Tunca River. This makes the river water particularly important, as it is primarily used for the irrigation of crops such as rice, maize, and sunflower [19]. Consequently, the potential incorporation of PTEs into the food chain through cultivated agricultural products and/or activities such as fishing poses a potential risk to human health. In addition, the river holds substantial importance for the city of Edirne in terms of recreational use. The Kırkpınar oil wrestling festival, which dates back approximately 650 years, is held annually in the Sarayiçi area surrounded by the river. Therefore, this study investigates the contamination levels of Tunca River sediments, assesses potential ecological risks, and identifies PTE sources using pollution indices, geostatistical methods, and Pb isotope signatures.
2. Materials and Methods
2.1. Sampling and Chemical Analyses
In this study, twenty-four ten-centimeter-thick sediment samples (S1 to S24) representing the Tunca River were collected from the riverbed using a stainless-steel sediment sampler (Figure 1). The samples were stored in plastic bags under cold conditions and transported to the laboratory. They were air-dried at room temperature, sieved through a 2 mm mesh, and coarse particles and organic debris were removed. The material was then ground to pass through a 75 µm sieve.
Chemical analyses, including Pb isotopes, were conducted at the internationally accredited ALS laboratory using Inductively Coupled Plasma Mass Spectrometry (ICP-MS). For solution preparation, 0.5 g of each sample was digested in aqua regia (nitric acid:hydrochloric acid = 1:3). This method provides very low detection limits for sediment analyses. The laboratory is accredited to ISO IEC 17025 and ISO 9001 and implements comprehensive Quality Assurance (QA) procedures. Quality Control (QC) procedures were applied at all stages of sample preparation, analysis, and data evaluation, including the use of certified reference materials, duplicate samples, blank measurements, and analytical repeats.
During the data evaluation stage, pollution and ecological risk indices, sediment quality guidelines, geostatistical methods, and Pb isotope ratios were employed.
2.2. Pollution and Ecological Risk Indices
In this section, single (Igeo, EF, Cf) and integrated (PLI, mCdeg, PERI) geochemical indices, their formulas, and classification ranges are described. These indices are commonly used for the assessment of pollution and ecological risk [6]. Due to the possible lithological differences in the upstream source area, and the transboundary situation of the river, Upper Continental Crust (UCC) values [20] were used as background in the calculations.
2.2.1. Geoaccumulation Index (Igeo)
This index, which is widely used in pollution studies, was proposed by Müller [21]. It is calculated using the following Formula (1):
In the formula, n represents the metal in concern, C represents the measured concentration, B denotes the background value, and the factor 1.5 is used to eliminate fluctuations that may arise from lithological variations. The classification ranges are described as follows: “Class 0” (Igeo < 0, uncontaminated), “Class 1” (0 ≤ Igeo < 1, uncontaminated to moderately contaminated), “Class 2” (1 ≤ Igeo < 2, moderately contaminated), “Class 3” (2 ≤ Igeo < 3, moderately to strongly contaminated), “Class 4” (3 ≤ Igeo < 4, strongly contaminated), “Class 5” (4 ≤ Igeo < 5, strongly to extremely contaminated), and “Class 6” (Igeo > 5, extremely contaminated) [21].
2.2.2. Enrichment Factor (EF)
This index is calculated based on reference elements such as Al and Fe using the following Formula (2) [22]:
In the formula, (X/Al)Sample represents the ratio of element X to Al in the sample, while (X/Al)Background denotes the ratio of the same element to Al in the background. The classification ranges are described as follows: “Minimal” (EF < 2), “Deficiency to moderate” (2 < EF < 5), “Significant” (5 < EF < 20), “Very high” (20 < EF < 40), and “Extremely high” (EF > 40) [22].
2.2.3. Contamination Factor (Cf)
The index proposed by Hakanson [23] is calculated using the following Formula (3):
In the formula, n represents the metal in concern, C represents the measured concentration, and B represents the background value. The classification criteria are described as follows: “Low” (Cf < 1), “Moderate” (1 ≤ Cf < 3), “Considerable” (3 ≤ Cf < 6), and “Very high” (Cf ≥ 6) [23].
2.2.4. Modified Degree of Contamination (mCdeg)
This index was developed by Abrahim and Parker [24] and represents a modified version of the Degree of Contamination (Cdeg) index originally proposed by Hakanson [23]. It is calculated using the following Formula (4):
In the formula, Cf denotes the Contamination Factor, and n represents the number of elements used in the calculation. The classification ranges are described as follows: “Very low” (mCdeg < 1.5), “Low” (1.5 ≤ mCdeg < 2), “Moderate” (2 ≤ mCdeg < 4), “High” (4 ≤ mCdeg < 8), “Very high” (8 ≤ mCdeg < 16), “Extremely high” (16 ≤ mCdeg < 32), and “Ultra-high” (mCdeg ≥ 32) [24].
2.2.5. Pollution Load Index (PLI)
The index developed by Tomlinson, et al. [25] provides a comprehensive and quantitative assessment of collective toxicity [26] and is calculated using the following Formula (5):
In the formula, Cf represents the Contamination Factor of each element, and n denotes the number of elements. The evaluation criterion is described as “Pollution” (PLI > 1) or “No pollution” (PLI < 1) [25,27].
2.2.6. Potential Ecological Risk Index (PERI):
The index proposed by Hakanson [23] is used to evaluate the cumulative toxicity of selected metals in ecological systems and is calculated using the following Formula (6):
In the formula, Cf denotes the Contamination Factor, Er represents the potential ecological risk index, and Tr refers to the toxic response factors (As = 10, Cd = 30, Cu = 5, Cr = 2, Hg = 40, Pb = 5, and Zn = 1). The classification ranges are described as follows: “Low” (PERI < 150), “Moderate” (150 ≤ PERI < 300), “Considerable” (300 ≤ PERI < 600), and “Very high” (PERI ≥ 600) [23].
2.2.7. Sediment Quality Guidelines (SQGs)
Various guidelines have been published to assess sediment quality. MacDonald, Ingersoll and Berger [7] defined two key consensus-based concentration thresholds: the Threshold Effect Concentration (TEC) and the Probable Effect Concentration (PEC). Concentrations below the TEC indicate that adverse biological effects are not expected, whereas concentrations above the PEC represent levels at which adverse effects are frequently observed. Concentrations which fall between the TEC and PEC indicate conditions where adverse effects are observed occasionally. Comparisons based on these threshold values provide a practical means of determining the level of toxic risk in sediments.
3. Results and Discussion
In this section, the results obtained from the chemical analyses of the sediments were evaluated.
3.1. PTE Concentrations and Spatial Distribution
The concentrations of arsenic (As), cadmium (Cd), cobalt (Co), chromium (Cr), copper (Cu), mercury (Hg), manganese (Mn), nickel (Ni), lead (Pb), antimony (Sb), and zinc (Zn) in the sediment samples, along with their descriptive statistical parameters, are presented in Table 1.
Table 1.
PTE concentrations in sediments (ppm).
Concentrations ranged as follows (ppm): As (1.19–2.15), Cd (0.05–1.19), Co (4.08–15.10), Cr (6.39–56.70), Cu (4.71–51.90), Hg (0.01–0.08), Mn (263–4230), Ni (5.16–43.60), Pb (12.60–123), Sb (0.07–0.32), and Zn (21.20–185.50). Their mean values decreased in the following order: Mn (1245.63), Zn (74), Pb (29.31), Cr (23.62), Ni (17.87), Cu (17.49), Co (7.68), As (3.68), Cd (0.31), Sb (0.16), and Hg (0.03).
Examination of the PTE concentrations in the sampling sites shows that concentrations in the middle section of the river are lower than those in the upstream and downstream sections (Table 1). In this middle reach, the river is supplied by a high-discharge irrigation canal originating from a different source. This condition may have led to the washing out of metals and their transport toward the downstream section. Individually, Ni reached its maximum concentration at site S4 (43.60); As (8.45) and Co (15.10) at site S8; Hg (0.08) at site S16; and Cd (1.92), Cr (56.70), Cu (51.90), Pb (123), and Sb (0.32) at site S19; while Mn (4230) and Zn (185.50) reached their maximum levels at site S21 (Table 1). Accordingly, Ni attained its highest concentration in the upstream section of the river, As and Co in the middle section, and Hg, Cd, Cr, Cu, Pb, Sb, and Zn in the downstream section. The fact that many PTEs reach their maximum concentrations in the downstream section indicates possible contributions from the Edirne city center.
3.2. Pollution and Ecologic Risk Assessment
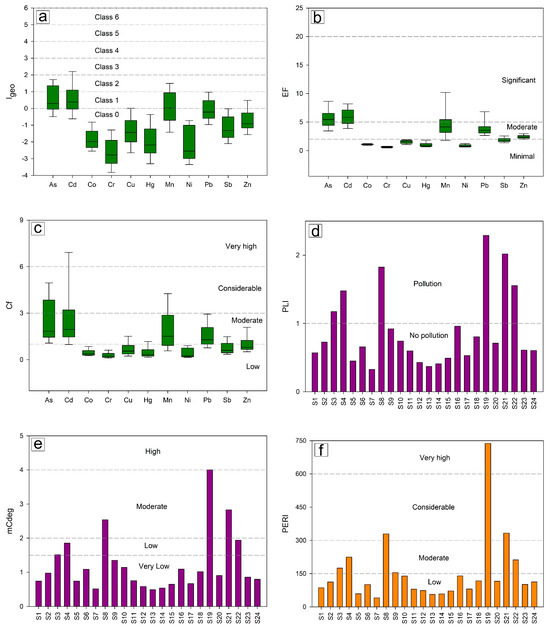
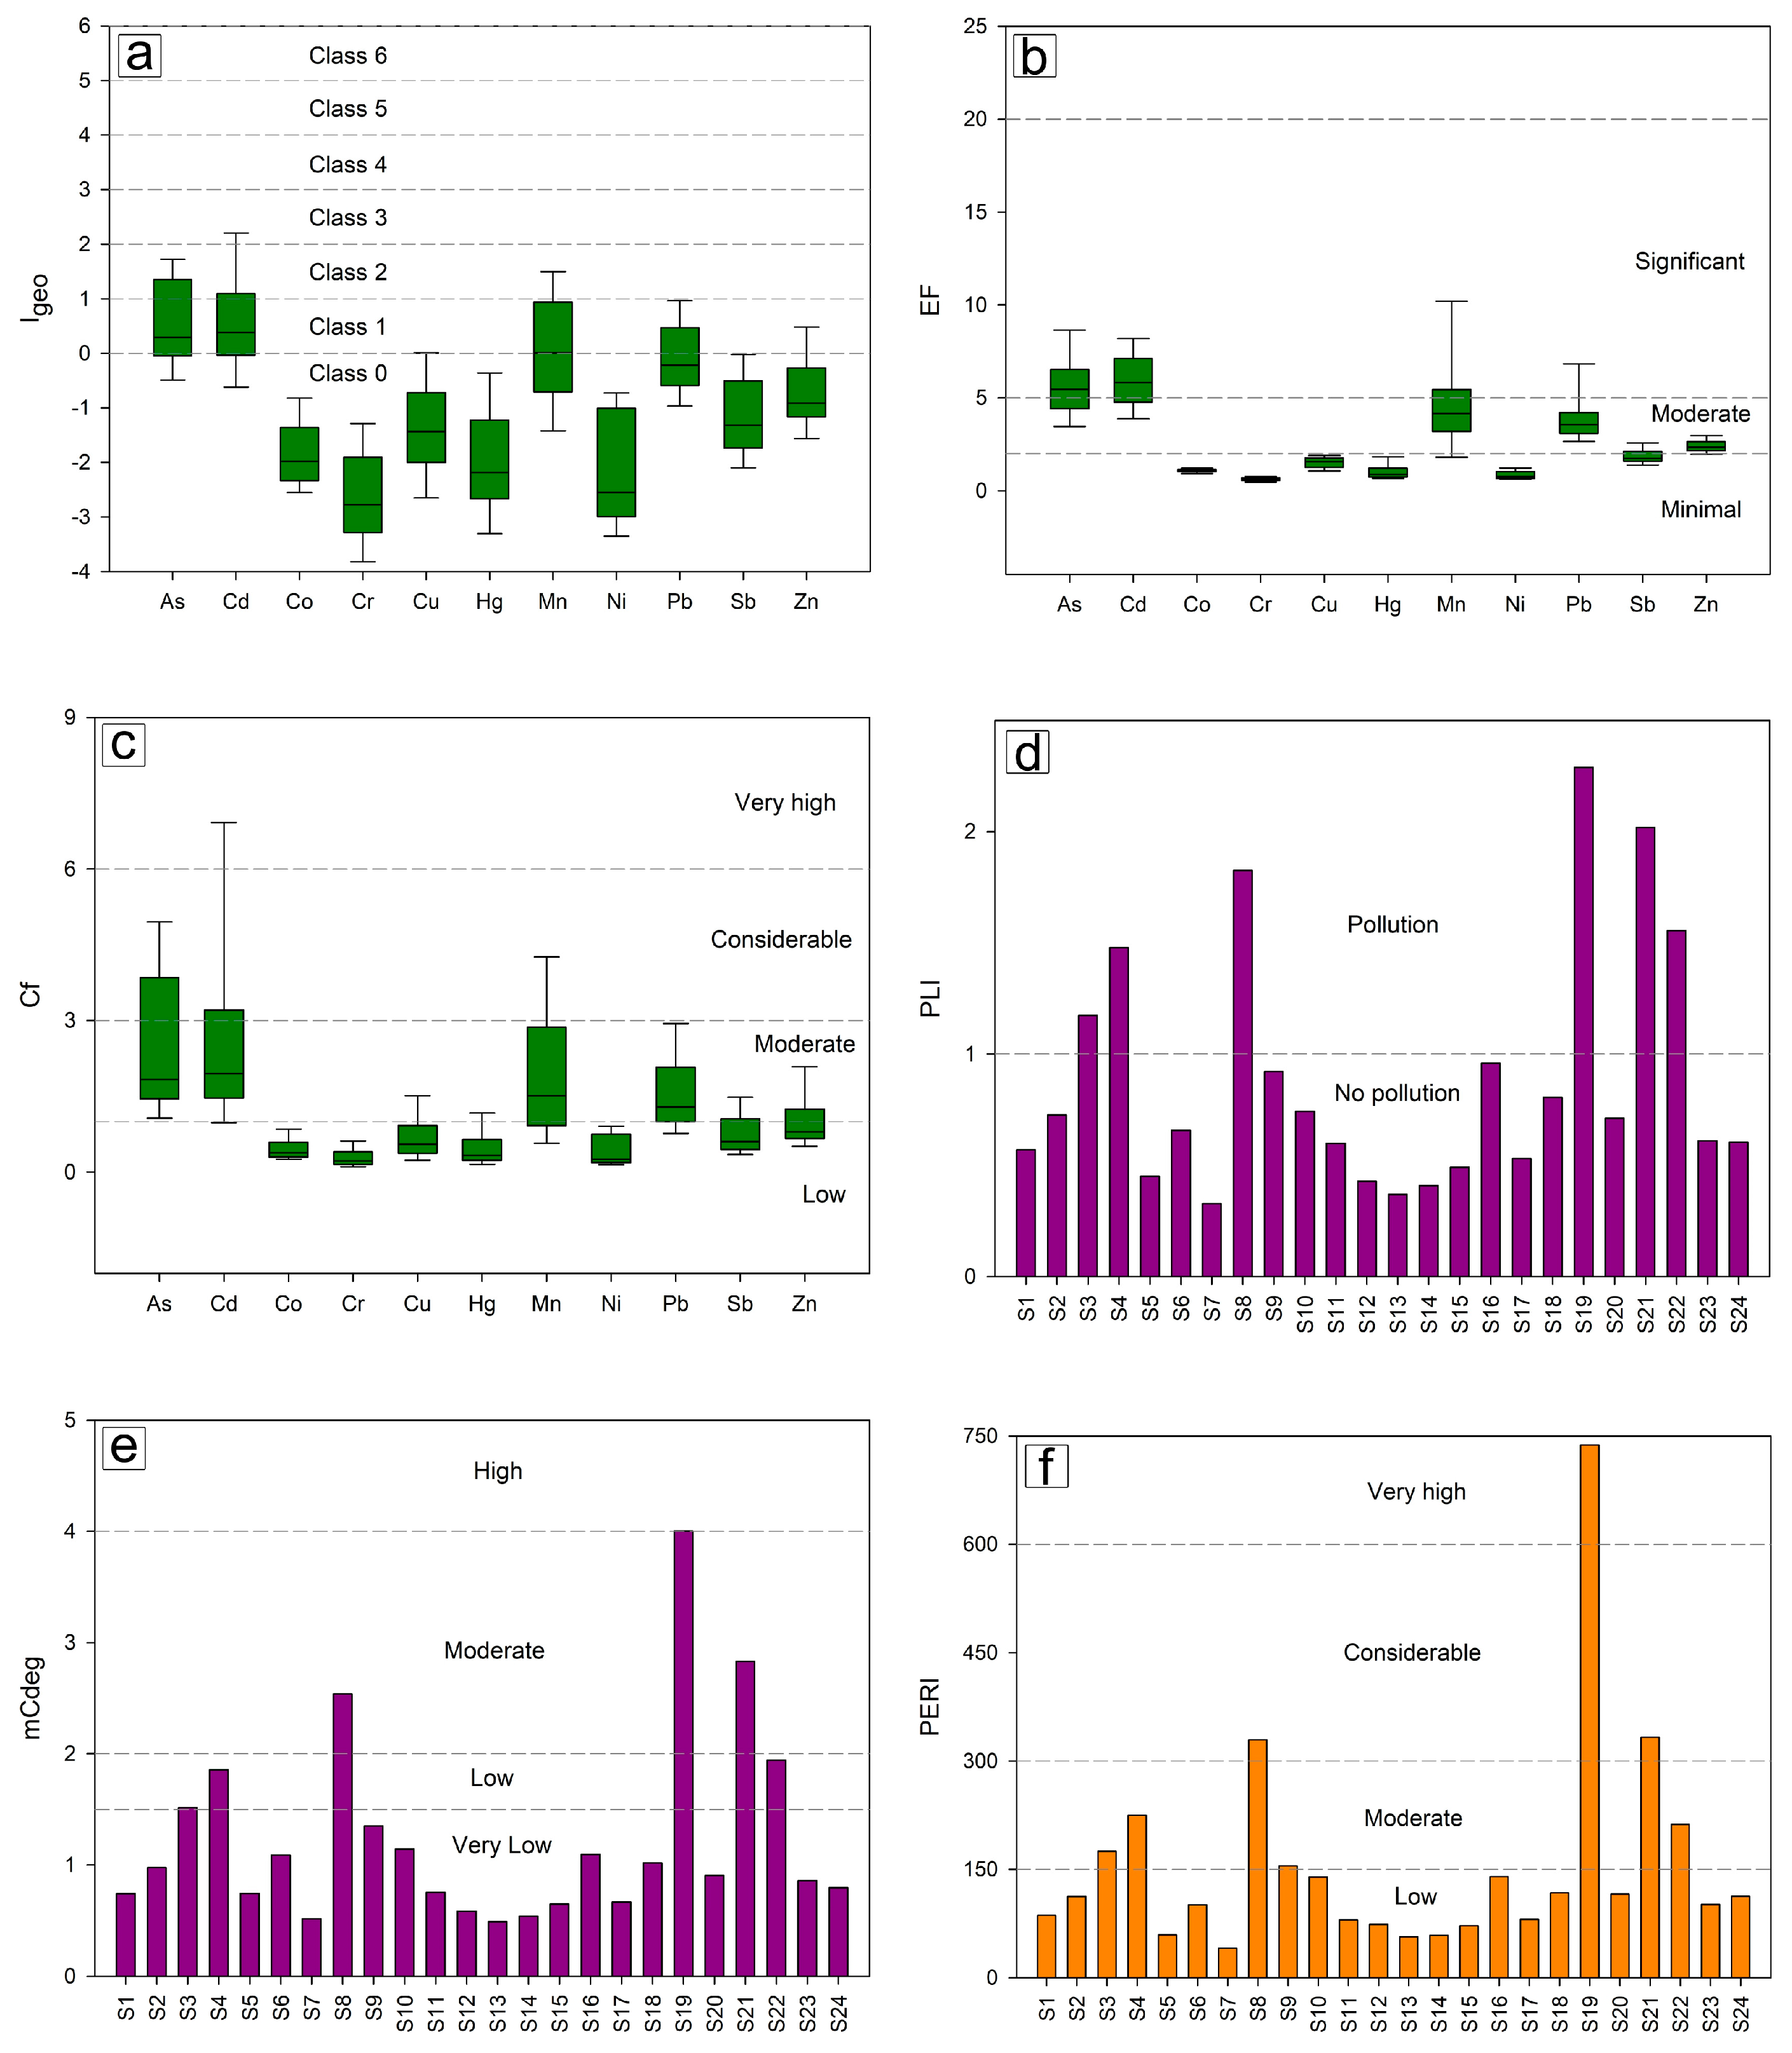
The single index values of Igeo, EF and Cf calculated for the Tunca River sediments are presented in Figure 2.
Figure 2.
Geochemical index values and classification categories for Tunca sediments: (a) Geoaccumulation Index (Igeo), (b) Enrichment Factor (EF), (c) Contamination Factor (Cf), (d) Pollution Load Index (PLI), (e) Modified Degree of Contamination (mCdeg), and (f) Potential Ecological Risk Index (PERI).
Mean values of Igeo decreased in the following order: Cd (0.59), As (0.48), Mn (0.11), Pb (−0.05), Zn (−0.73), Sb (−1.11), Cu (−1.38), Co (−1.85), Hg (−2.01), Ni (−2.22), and Cr (−2.67) (Figure 2). According to the Igeo classification scheme, Cd, As, and Mn fall within Class 1 (uncontaminated to moderately contaminated), while all other elements are within Class 0 (uncontaminated). The mean values of EF decreased in the following order: Cd (6.40), As (5.70), Mn (4.91), Pb (4.00), Zn (2.40), Sb (1.86), Cu (1.53), Co (1.09), Hg (1.08), Ni (0.88), and Cr (0.63) (Figure 2). According to the EF classification scheme, Sb, Cu, Co, Hg, Ni, and Cr are classified as “Minimal enrichment” since their values remain below the threshold of 2. In contrast, Mn, Pb, and Zn fall within the range of 2 to 5, indicating “Moderate enrichment,” while Cd and As exhibit values greater than 5, corresponding to a “Significant enrichment” level. Mean values of Cf decreased in the following order: Cd (3.18), As (2.45), Mn (2.08), Pb (1.72), Zn (1.04), Sb (0.79), Cu (0.70), Hg (0.49), Co (0.45), Ni (0.41), and Cr (0.28) (Figure 2). According to the Cf classification scheme, Sb, Cu, Hg, Co, Ni, and Cr fall below 1, indicating a “Low” contamination level. In contrast, As, Mn, Pb, and Zn are classified as “Moderate,” while Cd shows “Considerable” level of contamination.
Histograms obtained from PLI, mCdeg and PERI integrated indices are also shown in Figure 2. The PLI values calculated for the sediments exceed “1” at sites S3, S4, S8, S19, S21, and S22, indicating the presence of pollution, while all other sites exhibit values below 1, indicating no pollution (Figure 2). Based on the mCdeg values, sites S3, S4, and S22 exhibit “Low” contamination, while sites S8, S19, and S21 show “Moderate” contamination levels (Figure 2). No contamination is observed at the remaining sites. The PERI values, which are calculated by using toxic risk factors, indicate a “Moderate” ecological risk at sites S3, S4, S9, and S22, and a “Considerable” ecological risk at sites S8, S19, and S21 (Figure 2). PLI, mCdeg and PERI show similar trends between the upstream and downstream sections of the river defined by a decrease in the middle section. This is consistent with the concentration dilution effect in the middle section (Table 1).
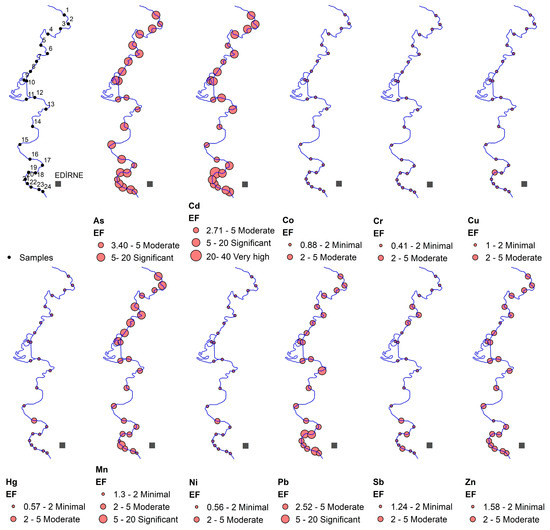
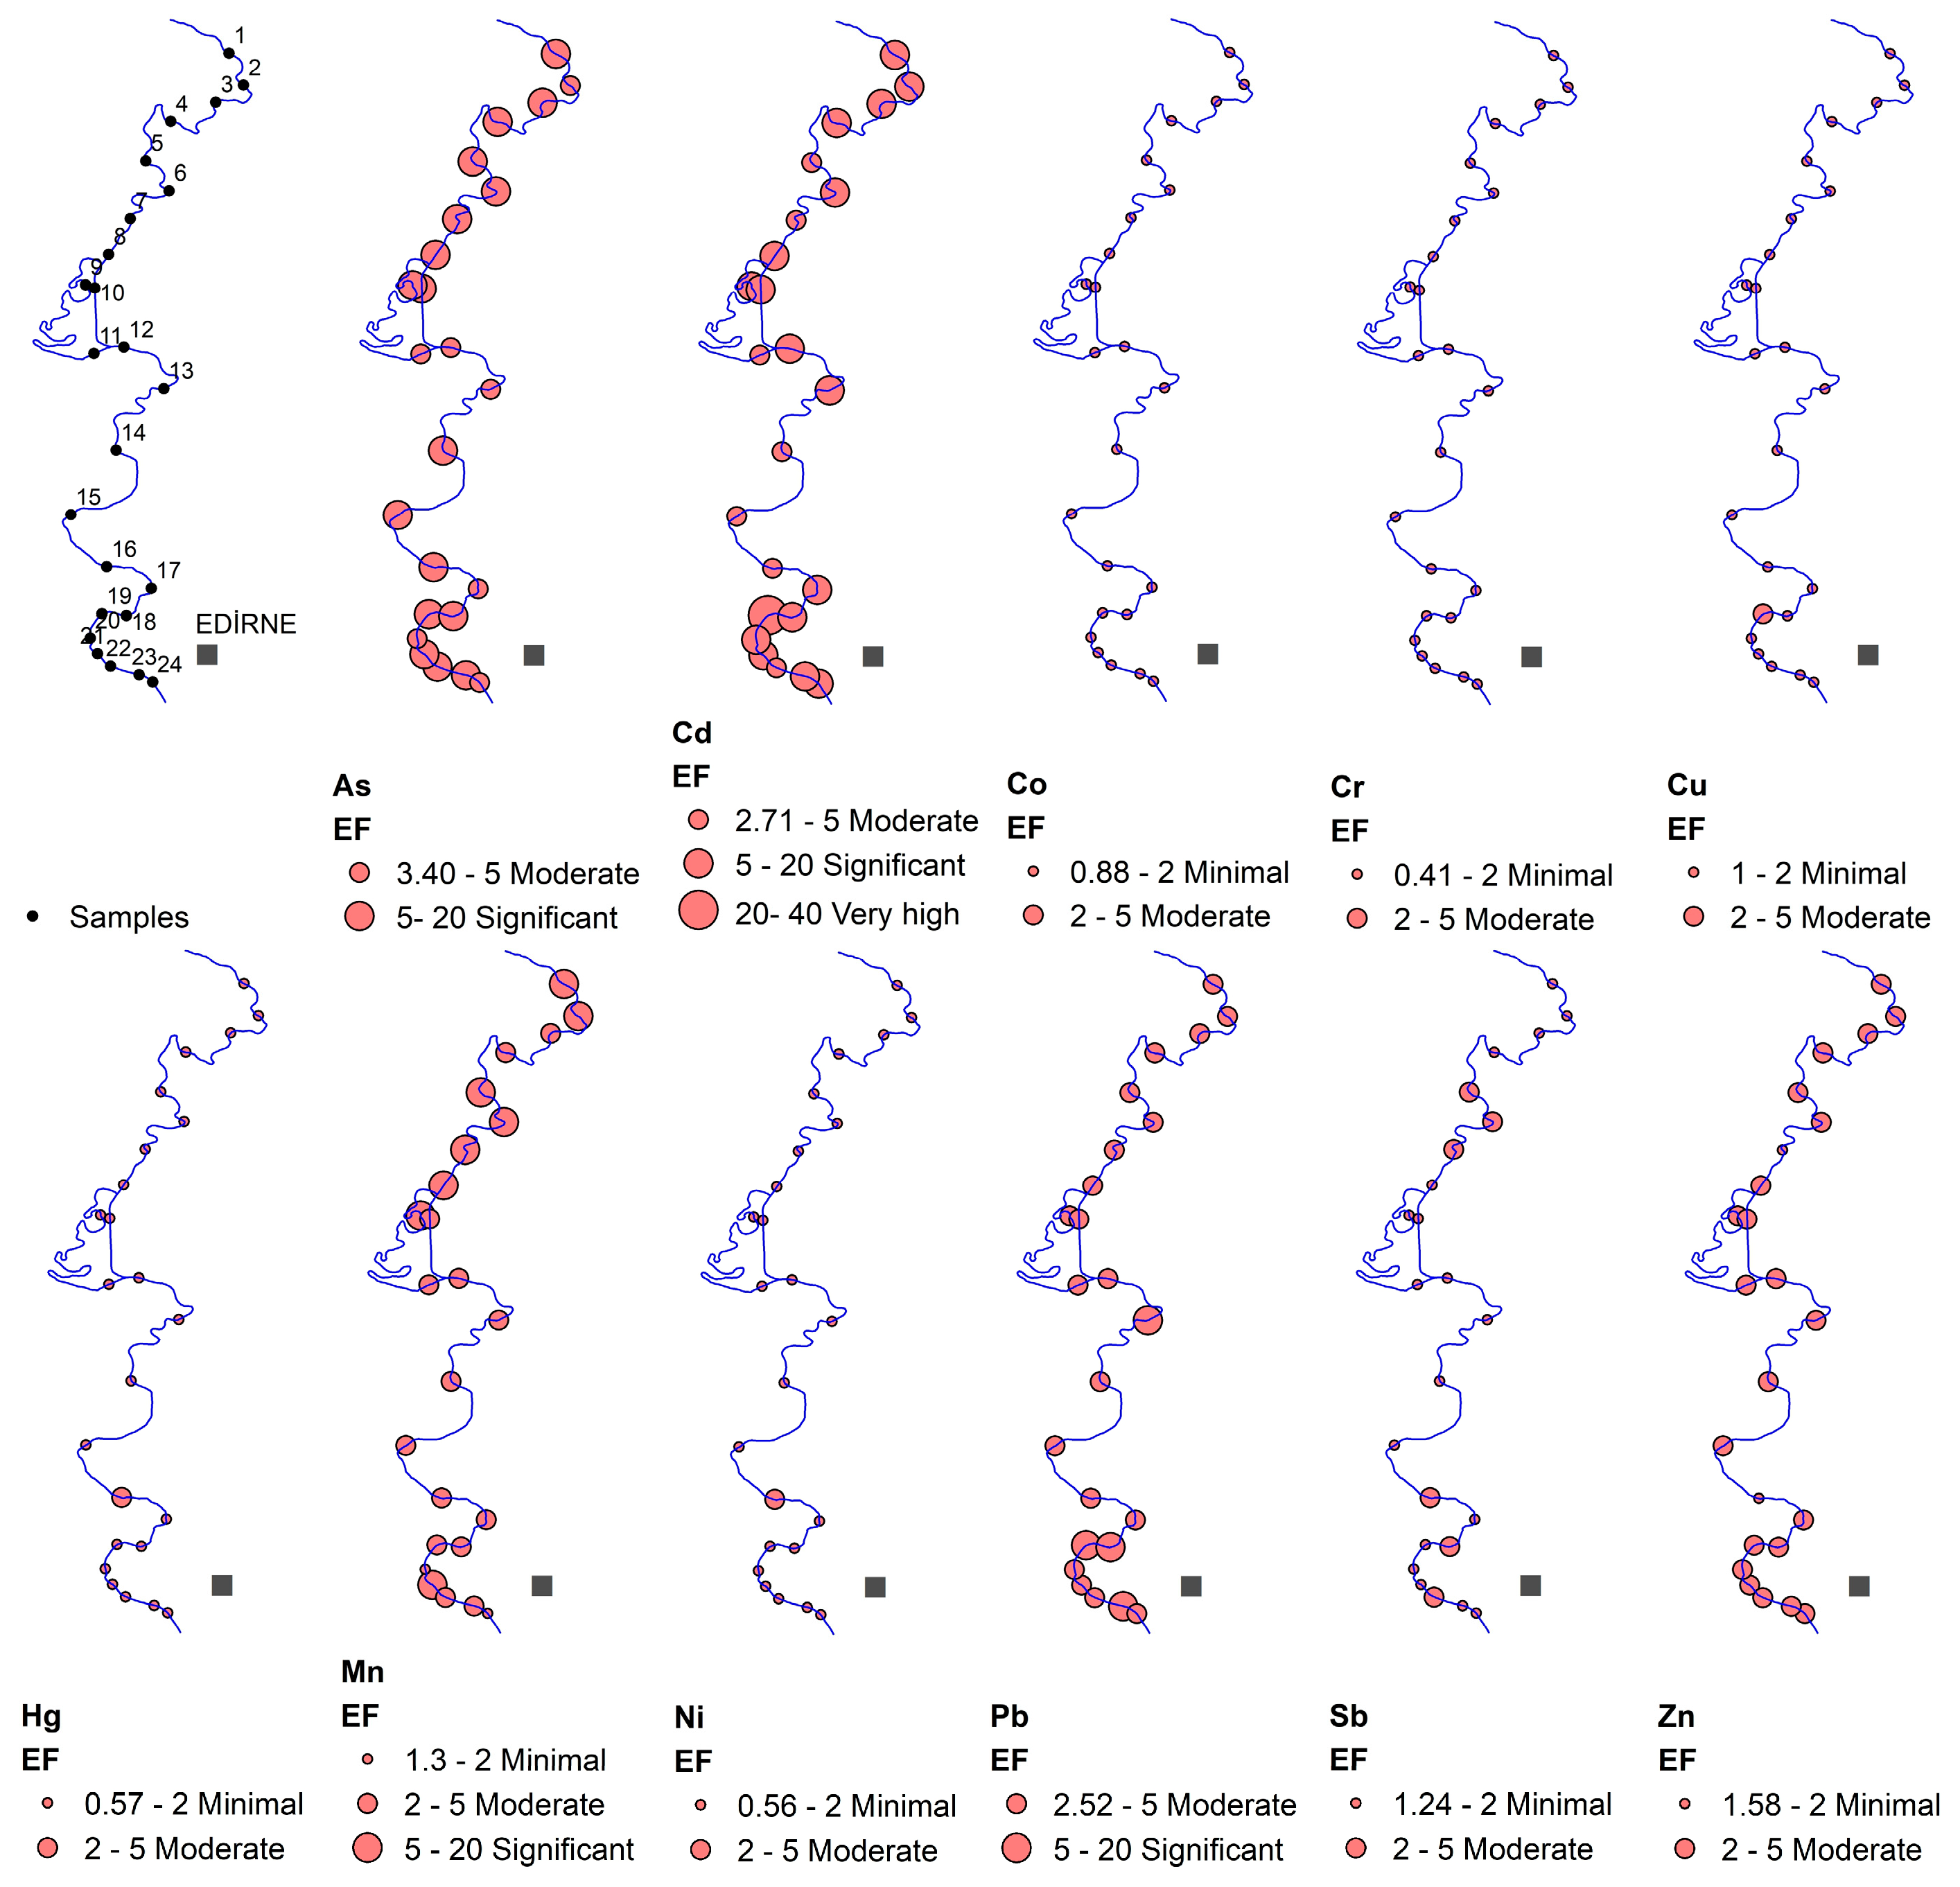
Spatial variations in EF values along the river are shown in Figure 3. As is predominantly classified as “Significant”, with seven sites, S2, S11, S13, S17, S20 and S24, showing “Moderate” contamination, and displays a generally uniform distribution along the river. Cd shows a similar pattern, with “Significant” enrichment at most sites, “Moderate” levels at S5, S7, S11, S13, S15, S16 and S22, and a single “Very high” value at S1. Co and Cr remain at “Minimal” levels throughout. Cu, Ni and Hg are also largely “Minimal”, each showing a single “Moderate” value at S19 for Cu and at S16 for both Ni and Hg. Mn exhibits greater variability, ranging from “Minimal” at S20 and S24 to “Significant” at eight sites, S1, S2, S5, S6, S7, S8, S9 and S21, with higher enrichment in upstream sections. Pb is mainly “Moderate”, with “Significant” levels at S13, S18, S19 and S23, and shows increased contribution in downstream section. Sb is mostly “Minimal”, except for six “Moderate” sites, S5, S6, S7, S16, S18 and S22. Zn is predominantly “Moderate”, with “Minimal” levels at S7 and S16, and is evenly distributed along the river.
Figure 3.
Spatial distribution maps of EF values.
3.3. Sediment Quality
The PTE concentrations of selected rivers from Türkiye and around the world are presented in Table 2. Comparison of sediment concentrations among these rivers reveals pronounced differences. These variations are thought to be related to the mineralogical composition of source rocks, the intensity of rock weathering, and levels of anthropogenic contamination [5]. Therefore, each river should be considered and evaluated within the framework of its specific geological, hydrological, and environmental conditions. In addition, as members of the MRS, the Tunca, Meriç and Ergene rivers may be compared specifically. In this framework, all the mean PTE concentrations in sediments of the Tunca River are higher than those in the Meriç River and lower than those in the Ergene River.
Table 2.
Mean PTE concentrations (ppm) measured in sediments from various rivers.
According to the comparison of PTE concentrations of Tunca River sediments with TEC and PEC threshold values, As, Cd, Cr, Cu, Hg, Ni, Pb, and Zn were found to remain below the TEC (Table 2). This indicates that no adverse toxic risk is expected for sediment-dwelling organisms. This is inconsistent with PERI classification, which is another tool used for measuring toxic risk. The main reason for this is that PERI is calculated using multiple metals and multiple toxic risk factors, while SQG values address individual metals.
3.4. Source Identification
In this section, the Pearson Correlation Coefficient (PCC), Hierarchical Cluster Analysis (HCA) and Principal Component Analysis (PCA) methods are introduced.
PCC is a statistical approach used to calculate correlation coefficients between variables. These coefficients can be used to evaluate potential genetic and geochemical relationships among variables [38]. As the absolute value of the correlation coefficient approaches +1 or −1, the strength of the relationship increases, whereas values approaching 0 indicate a weak relationship. Strong positive correlation coefficients indicate a high degree of similarity and co-variation between variables, while strong negative correlation coefficients indicate an inverse relationship and low similarity between variables [30].
The correlation coefficients obtained from the PCC analysis of the sediment samples are presented in Table 3. Coefficients between element pairs are generally strong to very strong and positive, whereas only the coefficients between Mn and the other metals exhibit negative values. This suggests that Mn may originate from a different source or may be governed by different geochemical processes compared to the other metals. In contrast, metal pairs showing strong positive correlations can be interpreted as having common genetic origins or similar geochemical behaviors.
Table 3.
Coefficients obtained from Pearson Correlation Coefficient (PCC) analysis and loadings of PC1 and PC2 obtained from Principal Component Analysis (PCA).
HCA is a multivariate statistical technique that aims to group variables within a dataset according to their degrees of similarity or dissimilarity. This grouping process is based on the stepwise aggregation of individuals or variables according to their relationships with one another, and the results are visually presented using dendrograms [30,39].
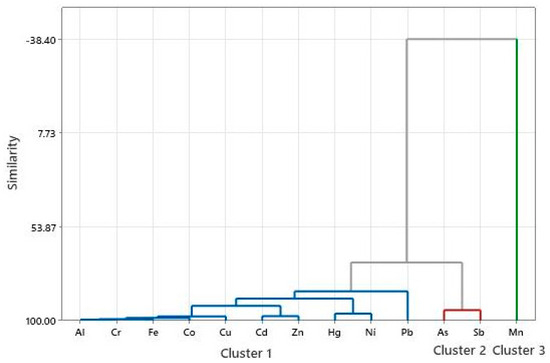
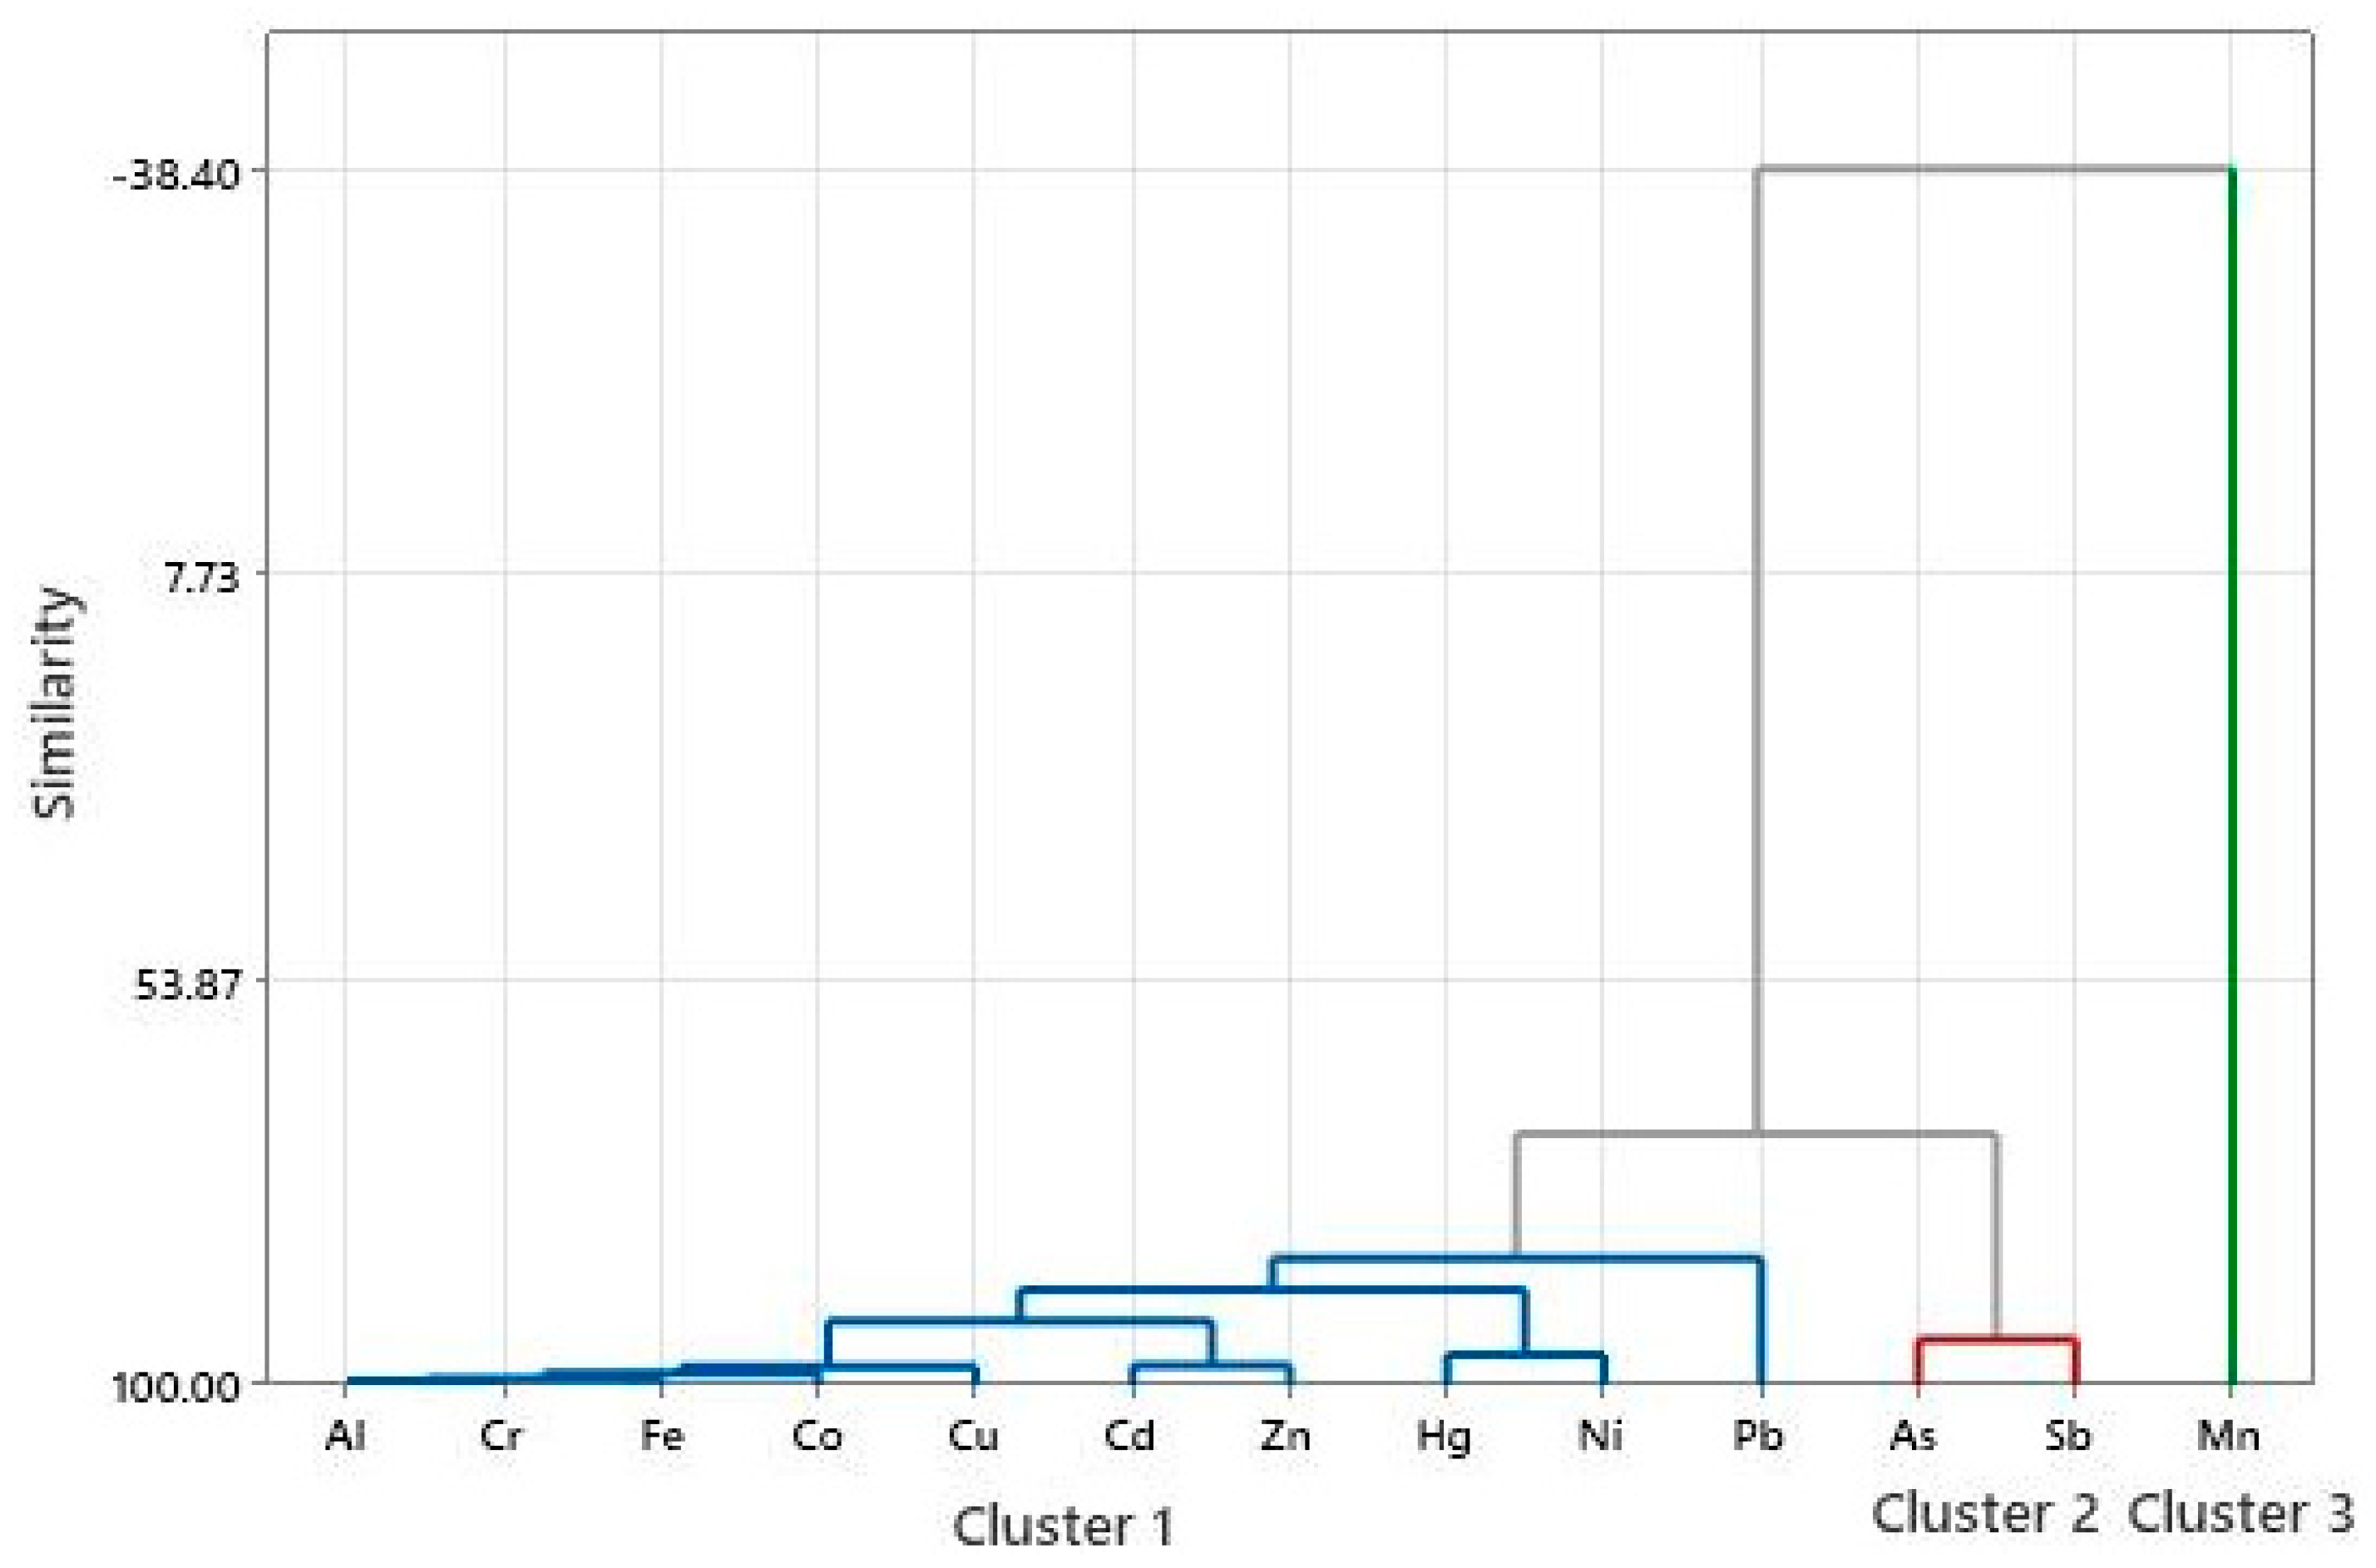
The dendrogram of the PTEs examined in this study is presented in Figure 4. Examination of the dendrogram reveals three main clusters, namely Cluster 1, Cluster 2, and Cluster 3, formed at the closest similarity distances among the PTEs. Cluster 1 consists of Al, Cr, Fe, Co, Cu, Cd, Zn, Hg, Ni, and Pb, whereas Cluster 2 includes As and Sb. Cluster 3 is composed solely of Mn. This clustering pattern indicates that the elements form distinct groups in terms of their sources and geochemical behaviors.
Figure 4.
Dendrogram showing the clustering tendency of the PTEs.
PCA reduces the dimensionality of a dataset by representing the data through a set of optimal components. This method enables the identification of the main factors influencing the dataset and contributes to a clearer understanding of the relationships among variables [1]. The Kaiser–Meyer–Olkin (KMO) test value of the data is 0.848 (KMO > 0.5), and Bartlett’s test of sphericity yields a significance value of 0.000 (p < 0.001), indicating that the data are suitable for PCA.
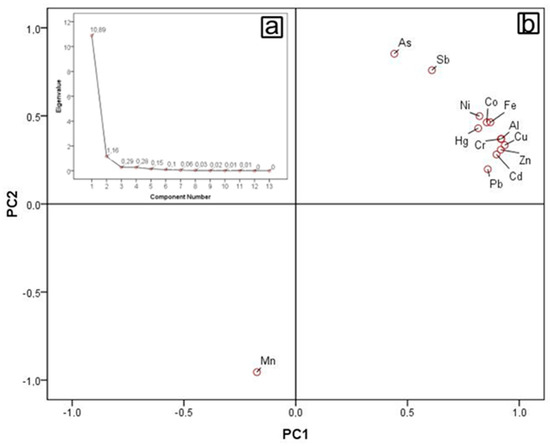
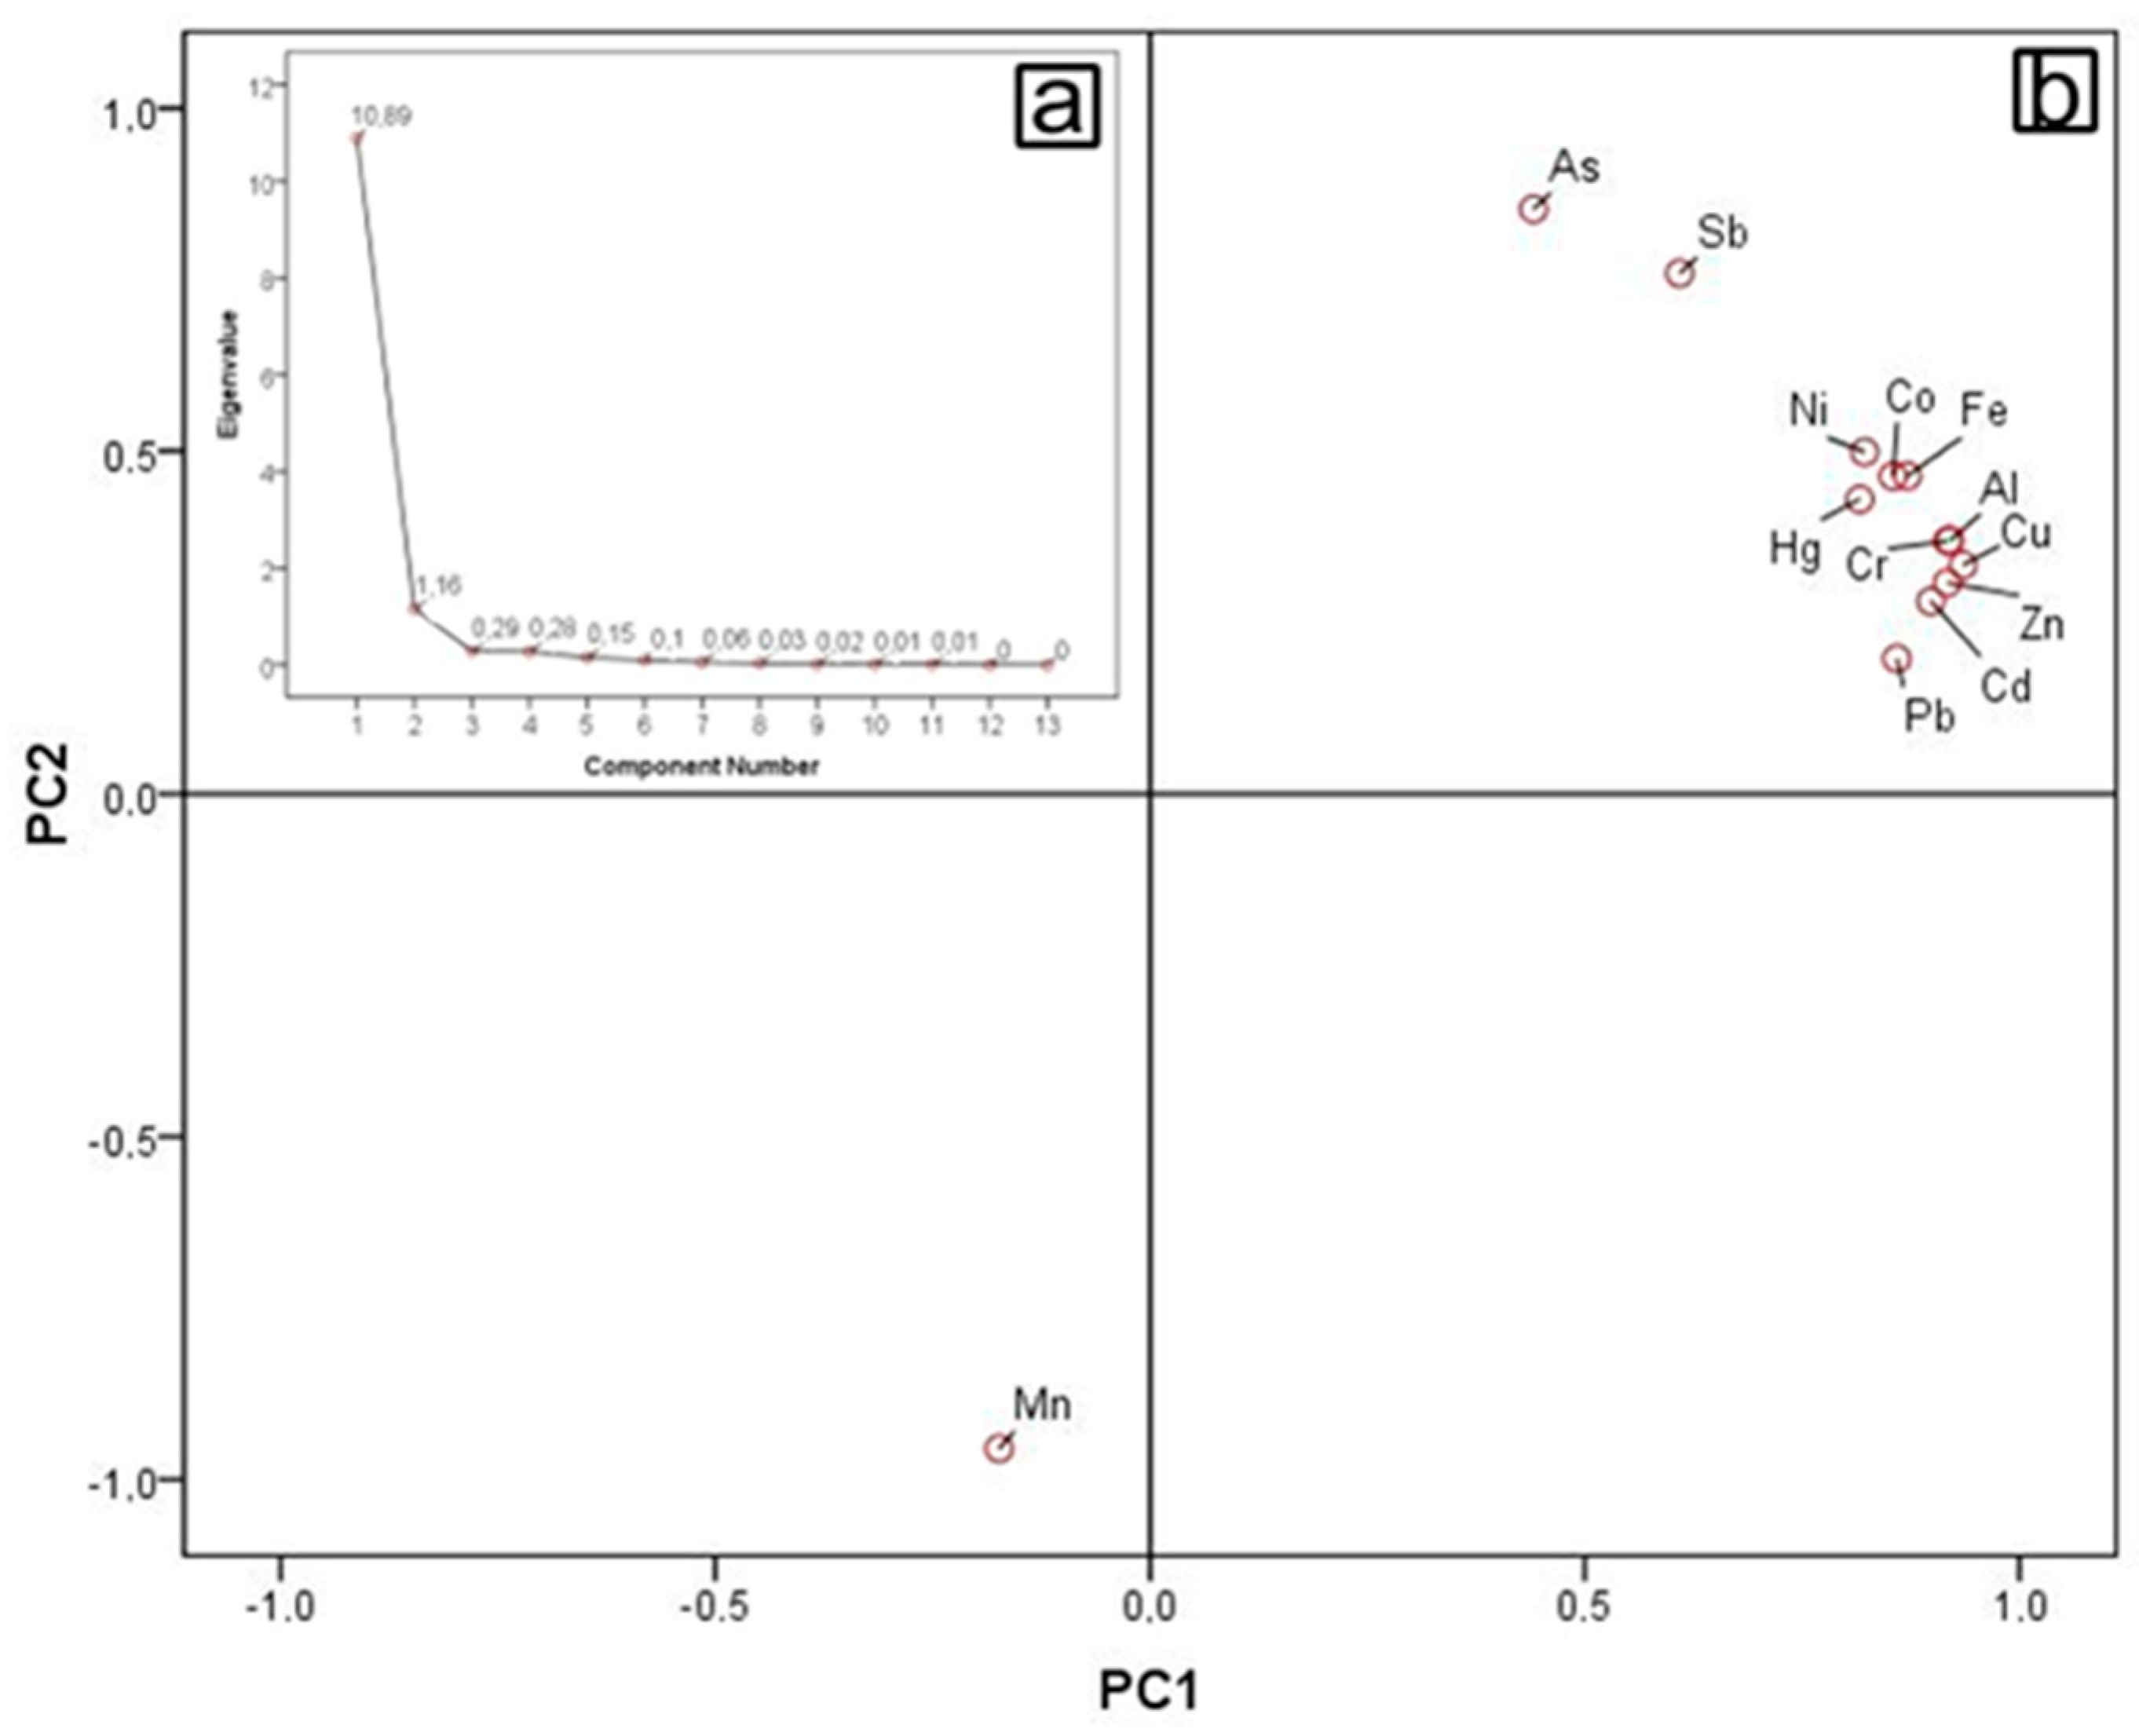
The PCA identified two principal components, First Principal Component (PC1) and Second Principal Component (PC2), with eigenvalues of 10.89 and 1.16, respectively (Figure 5). PC1 alone explains 64.43 percent of the total variance, while PC2 accounts for 28.28 percent. Cumulatively, these two components explain 92.71 percent of the total variance. PC1 is dominated by strong loadings (0.70<) for Cu (0.935), Cr (0.917), Zn (0.917), Cd (0.898), Pb (0.859), Co (0.855), Hg (0.817), and Ni (0.822). In contrast, Mn (−0.955), As (0.853), and Sb (0.759) exhibit strong loadings on PC2 (Table 3). These results indicate that the elements are influenced by two main factors associated with different sources.
Figure 5.
PCA results: (a) Scree plot; (b) Principal components plot.
Al and Fe, which are represented by PC1, are among the major rock-forming elements of the Earth’s crust and are defined as conservative elements [22,40,41]. These two elements have also been widely used as normalizing elements in many geochemical approaches [42]. Therefore, the strong positive loadings of Al and Fe, along with the elements influenced by PC1, suggest a geogenic origin for these elements. The fact that the same group of elements is clustered together in the HCA further supports this interpretation.
Because As and Sb possess toxic characteristics and are commonly associated with anthropogenic sources, PC2 is interpreted as a component representing anthropogenic influence [43]. Mn, which is represented by a strong negative loading on PC2 (−0.955), also appears to be influenced by anthropogenic sources in a manner like As and Sb. However, the negative loading of Mn indicates that this element may be affected by a different anthropogenic source or process than those controlling As and Sb.
Igeo, EF, and Cf indices indicated the accumulation of As, Cd, Mn, and Pb in sediments (Figure 2). Geostatistical analyses also revealed that Cd and Pb are of geogenic origin, while As and Mn are of anthropogenic origin. In the HCA, Pb joined the geogenic cluster at a relatively greater distance (Figure 4). This may indicate an anthropogenic Pb contribution. Evaluations that may coincide with this interpretation are discussed in the following section. Geogenic Cd may have accumulated as a result of the weathering of Cd-rich rocks. These rocks can be of various types, depending on their occurrence in the source area [44,45]. On the other hand, considering the agricultural activities around the river, agrochemicals can be suggested as a possible source of As [46]. In geostatistical analyses, the separation of Mn from other anthropogenic elements suggests that its origin may be related to activities such as atmospheric transport [47] or mining, unlike agrochemicals [48].
The possibility that PTEs accumulated in sediments may be transferred to agricultural products through irrigation practices constitutes a potential risk to human health. In addition, recreational activities and fishing increase the likelihood of human exposure to PTEs. Considering these potential risks. Comprehensive, evidence-based action plans are essential for protecting and sustainably managing the river ecosystem.
3.5. Pb Isotope Signatures
The 204Pb, 206Pb, 207Pb, and 208Pb isotope concentrations of the Tunca River sediment samples, along with the 206Pb/207Pb and 208Pb/206Pb ratios used in source identification studies, are presented in Table 4. The 206Pb/207Pb ratios, with a mean value of 1.19 ± 0.02, range from 1.18 to 1.25 ppm. Also, the 208Pb/206Pb ratios, with a mean value of 2.11 ± 0.04, vary between 2.07 and 2.22 ppm.
Table 4.
Isotope concentrations (ppm) and selected isotope ratios in the sediments.
The 206Pb/207Pb and 208Pb/206Pb ratios of natural sediments are approximately 1.20 and 2.05, respectively [49]. In contrast, anthropogenic sources are characterized by lower 206Pb/207Pb ratios and higher 208Pb/206Pb ratios [50]. Pb isotope concentrations are not fractionated by environmental and/or industrial processes, allowing them to retain their source signatures through to the final environment [51]. A well-documented application of Pb isotope ratios was presented by Kober, et al. [52] in a study conducted on sediment cores from Lake Constance in Central Europe. According to these authors, sediment layers showing increased 208Pb/206Pb ratios correspond to the mid-19th century, when industrial activities such as coal combustion, iron ore processing, and the use of leaded gasoline intensified. Toward the end of the 19th century, the implementation of environmental regulations, including restrictions on leaded gasoline, led to a decrease in 208Pb/206Pb ratios, and this decline was clearly recorded in the sedimentary sequence.
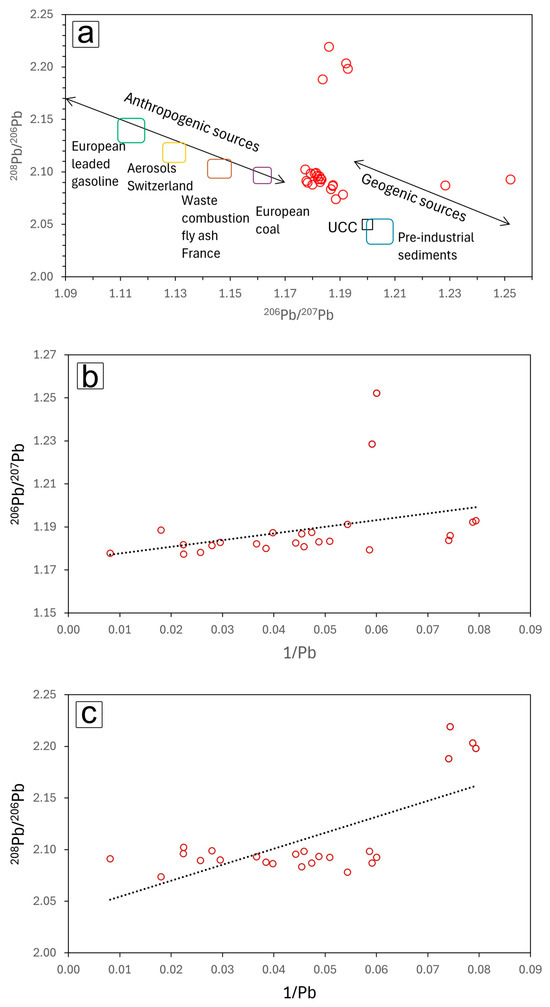
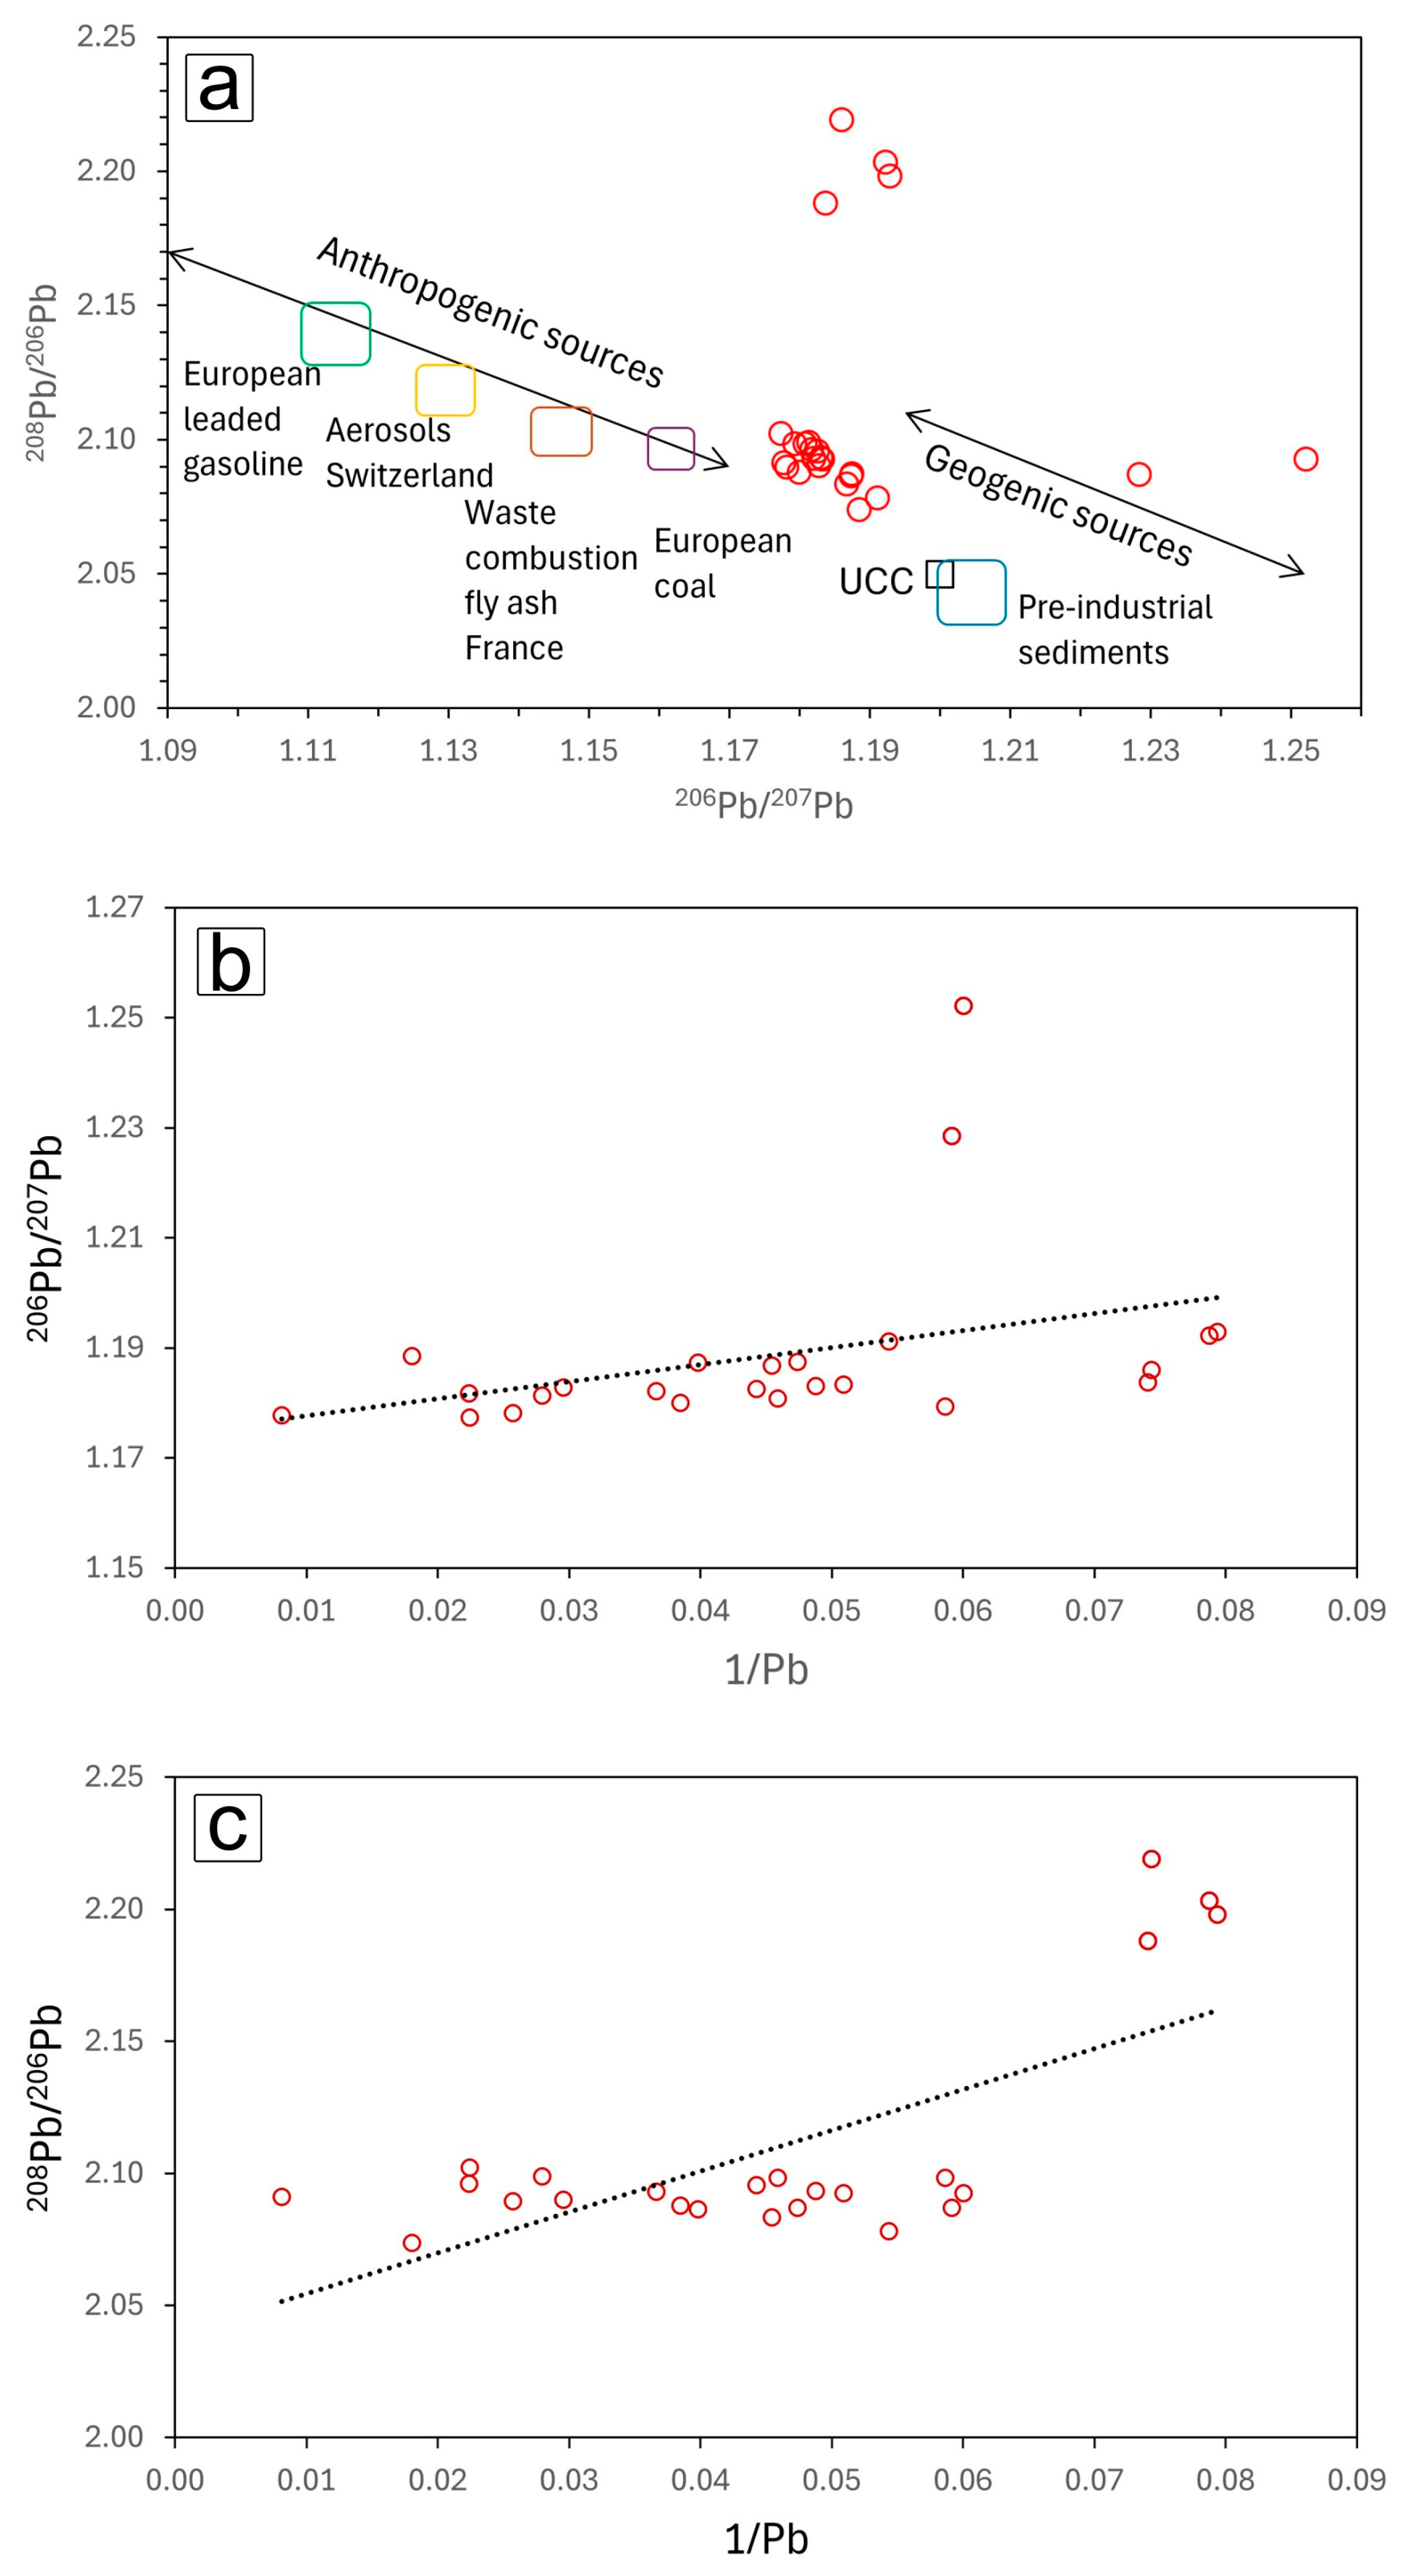
In order to trace the sources of Pb in the Tunca River sediments, a binary diagram with 206Pb/207Pb and 208Pb/206Pb isotope ratios on the axes was constructed (Figure 6). On this diagram, fields representing geogenic and anthropogenic sources compiled from previous studies were indicated [14,53,54,55,56,57]. Then, sediment samples were plotted onto this diagram to evaluate their relative positions with respect to these source fields.
Figure 6.
Pb isotope diagrams of the samples: (a) 208Pb/206Pb vs. 206Pb/207Pb, (b) 206Pb/207Pb vs. 1/Pb, and (c) 208Pb/206Pb vs. 1/Pb.
The points on the diagram were positioned to the left of the geogenic source field and to the right of the anthropogenic source field. They also followed the trend of isotope ratio changes between the source fields. This pattern indicates that the Pb content in sediments is not derived solely from geogenic sources but also includes contributions from anthropogenic inputs. A previous study in the region, which measured metal pollution in the Danube River and the MRB resulting from mining activities in Bulgaria, reported on the importance of the transboundary dispersal of metals [18]. The authors stated that metal concentration values associated with sediments measured in the Tunca and other transboundary rivers immediately upstream of Bulgaria’s borders with Turkey and Greece are concerningly high. Another study conducted in the far southeast of the Tunca River investigated whether metal accumulation occurred in soils and lichens via atmospheric transport [58]. This region has been significantly affected by intensive industrial activities and urbanization. The study noted that many PTEs, including Pb, showed an approximately tenfold increase in areas where industrial activities were carried out compared to clean areas. Based on these studies, it is considered that anthropogenic Pb concentrations in Tunca River sediments may be affected by both mining activities and atmospheric transport.
Moreover, the 206Pb/207Pb vs. 1/Pb and 208Pb/206Pb vs. 1/Pb diagrams were used to assess whether concentration-dependent variations are present (Figure 6). In these diagrams, the sample points define inclined regression lines that vary as a function of Pb concentration. Such inclined regression trends indicate that Pb concentrations are supplied by two distinct sources: in our situation, geogenic and anthropogenic [59,60]. In this context, the results obtained from the 206Pb/207Pb vs. 208Pb/206Pb diagram are further supported by these two diagrams.
4. Conclusions
This study indicates that As, Cd, Mn, and Pb, as well as total metal loads, contaminate sediments. Ni exhibited its highest concentration in the upstream section of the river, As and Co in the middle section, and Hg, Cd, Cr, Cu, Pb, Sb, and Zn in the downstream section. This suggests that contributions such as sewage disposal at the downstream section slightly elevated the concentrations. In addition, EF levels along the river were distributed uniformly, except for Mn, which was enriched in the upstream section.
Individual PTE concentrations are unlikely to have adverse biological effects on organisms inhabiting sediments. However, the increase in total metal loads indicates the potential for location-based ecological risks.
The results of the geostatistical analysis indicate that Cd, Co, Cr, Cu, Hg, Ni, Pb, and Zn are of geogenic origin, whereas As, Sb, and Mn are associated with anthropogenic sources. Isotope analyses further reveal that Pb concentrations in the sediments are influenced by anthropogenic inputs.
Funding
This research received no external funding.
Data Availability Statement
The original contributions presented in this study are included in the article. Further inquiries can be directed to the corresponding author.
Conflicts of Interest
The author declares no conflicts of interest.
References
- Ustaoğlu, F.; Yüksel, B.; Tepe, Y.; Aydın, H.; Topaldemir, H. Metal pollution assessment in the surface sediments of a river system in Türkiye: Integrating toxicological risk assessment and source identification. Mar. Pollut. Bull. 2024, 203, 116514. [Google Scholar] [CrossRef] [Scilit]
- Nieder, R.; Benbi, D.K. Potentially toxic elements in the environment—A review of sources, sinks, pathways and mitigation measures. Rev. Environ. Health 2024, 39, 561–575. [Google Scholar] [CrossRef] [Scilit]
- Nieder, R.; Benbi, D.K. Integrated review of the nexus between toxic elements in the environment and human health. AIMS Public Health 2022, 9, 758–789. [Google Scholar] [CrossRef] [Scilit]
- Hoang, H.-G.; Chiang, C.-F.; Lin, C.; Wu, C.-Y.; Lee, C.-W.; Cheruiyot, N.K.; Tran, H.-T.; Bui, X.-T. Human health risk simulation and assessment of heavy metal contamination in a river affected by industrial activities. Environ. Pollut. 2021, 285, 117414. [Google Scholar] [CrossRef] [Scilit] [PubMed]
- Hüseyinca, M.Y.; Küpeli, Ş. Assessment of accumulation, spatial distribution and sources of potentially toxic elements (PTEs) in sediments of a saline lake. J. Environ. Sci. Health Part A 2025, 60, 245–256. [Google Scholar] [CrossRef] [Scilit]
- Weissmannová, H.D.; Pavlovský, J. Indices of soil contamination by heavy metals—Methodology of calculation for pollution assessment (minireview). Environ. Monit. Assess. 2017, 189, 616. [Google Scholar] [CrossRef] [Scilit] [PubMed]
- MacDonald, D.D.; Ingersoll, C.G.; Berger, T.A. Development and Evaluation of Consensus-Based Sediment Quality Guidelines for Freshwater Ecosystems. Arch. Environ. Contam. Toxicol. 2000, 39, 20–31. [Google Scholar] [CrossRef] [Scilit] [PubMed]
- Cabral Pinto, M.M.S.; Silva, M.M.V.G.; Ferreira da Silva, E.A.; Dinis, P.A.; Rocha, F. Transfer processes of potentially toxic elements (PTE) from rocks to soils and the origin of PTE in soils: A case study on the island of Santiago (Cape Verde). J. Geochem. Explor. 2017, 183, 140–151. [Google Scholar] [CrossRef] [Scilit]
- Hüseyinca, M.Y.; Küpeli, Ş. Geochemistry of Upper Eocene-Oligocene sandstones from Tuzgölü Basin (Central Anatolia). Niğde Ömer Halisdemir Üniversitesi Mühendislik Bilim. Derg. 2022, 11, 157–169. [Google Scholar] [CrossRef] [Scilit]
- Horasan, B.Y.; Ozturk, A.; Tugay, O. Nb–Sr–Pb isotope analysis in soils of abandoned mercury quarry in northwest Black Sea (Turkey), soil and plant geochemistry, evaluation of ecological risk and its ımpact on human health. Environ. Earth Sci. 2021, 80, 488. [Google Scholar] [CrossRef] [Scilit]
- de Almeida Ribeiro Carvalho, M.; Botero, W.G.; de Oliveira, L.C. Natural and anthropogenic sources of potentially toxic elements to aquatic environment: A systematic literature review. Environ. Sci. Pollut. Res. 2022, 29, 51318–51338. [Google Scholar] [CrossRef] [Scilit]
- Ustaoğlu, F.; Islam, M.S. Potential toxic elements in sediment of some rivers at Giresun, Northeast Turkey: A preliminary assessment for ecotoxicological status and health risk. Ecol. Indic. 2020, 113, 106237. [Google Scholar] [CrossRef] [Scilit]
- Komárek, M.; Ettler, V.; Chrastný, V.; Mihaljevič, M. Lead isotopes in environmental sciences: A review. Environ. Int. 2008, 34, 562–577. [Google Scholar] [CrossRef] [Scilit]
- Cai, Y.; Han, Z.; Lu, H.; Zhao, R.; Wen, M.; Liu, H.; Zhang, B. Spatial-temporal variation, source apportionment and risk assessment of lead in surface river sediments over ∼20 years of rapid industrialisation in the Pearl River Basin, China. J. Hazard. Mater. 2024, 464, 132981. [Google Scholar] [CrossRef] [Scilit] [PubMed]
- Bird, G. Provenancing anthropogenic Pb within the fluvial environment: Developments and challenges in the use of Pb isotopes. Environ. Int. 2011, 37, 802–819. [Google Scholar] [CrossRef] [Scilit]
- Tombul, F. Water management in Maritsa river basin within the frame of international agreements. Anadolu Univ. J. Sci. Technol. A Appl. Sci. Eng. 2015, 15, 147–155. [Google Scholar] [CrossRef] [Scilit]
- Tokatlı, C.; Islam, A.R.M.T. Spatial–temporal distributions, probable health risks, and source identification of organic pollutants in surface waters of an extremely hypoxic river basin in Türkiye. Environ. Monit. Assess. 2023, 195, 435. [Google Scholar] [CrossRef] [Scilit] [PubMed]
- Bird, G.; Brewer, P.A.; Macklin, M.G.; Nikolova, M.; Kotsev, T.; Mollov, M.; Swain, C. Dispersal of Contaminant Metals in the Mining-Affected Danube and Maritsa Drainage Basins, Bulgaria, Eastern Europe. Water Air Soil Pollut. 2010, 206, 105–127. [Google Scholar] [CrossRef] [Scilit]
- Tokatli, C.; Ustaoğlu, F. Health risk assessment of toxicants in Meriç River Delta Wetland, Thrace Region, Turkey. Environ. Earth Sci. 2020, 79, 426. [Google Scholar] [CrossRef] [Scilit]
- McLennan, S.M. Relationships between the trace element composition of sedimentary rocks and upper continental crust. Geochem. Geophys. Geosystems 2001, 2, 1021–1045. [Google Scholar] [CrossRef] [Scilit]
- Müller, G. Index of Geoaccumulation in Sediments of the Rhine River. GeoJournal 1969, 2, 108–118. [Google Scholar]
- Sutherland, R.A. Bed sediment-associated trace metals in an urban stream, Oahu, Hawaii. Environ. Geol. 2000, 39, 611–627. [Google Scholar] [CrossRef] [Scilit]
- Hakanson, L. An ecological risk index for aquatic pollution control.a sedimentological approach. Water Res. 1980, 14, 975–1001. [Google Scholar] [CrossRef] [Scilit]
- Abrahim, G.M.S.; Parker, R.J. Assessment of heavy metal enrichment factors and the degree of contamination in marine sediments from Tamaki Estuary, Auckland, New Zealand. Environ. Monit. Assess. 2008, 136, 227–238. [Google Scholar] [CrossRef] [Scilit]
- Tomlinson, D.L.; Wilson, J.G.; Harris, C.R.; Jeffrey, D.W. Problems in the assessment of heavy-metal levels in estuaries and the formation of a pollution index. Helgoländer Meeresunters. 1980, 33, 566–575. [Google Scholar] [CrossRef] [Scilit]
- Yuan, W.; Balajiang, G.; Dang, Y.; Xie, J.; Zhao, W.; Cong, Y.; Ai, S. Spatial distribution, pollution assessment and source identification of heavy metals in Yarlung Zangbo River, Tibet. Process Saf. Environ. Prot. 2025, 202, 107768. [Google Scholar] [CrossRef] [Scilit]
- Kowalska, J.B.; Mazurek, R.; Gąsiorek, M.; Zaleski, T. Pollution indices as useful tools for the comprehensive evaluation of the degree of soil contamination—A review. Environ. Geochem. Health 2018, 40, 2395–2420. [Google Scholar] [CrossRef] [Scilit] [PubMed]
- Sarı, E.; Cukrov, N.; Frančišković-Bilinski, S.; Kurt, M.A.; Hallı, M. Contamination assessment of ecotoxic metals in recent sediments from the Ergene River, Turkey. Environ. Earth Sci. 2016, 75, 1051. [Google Scholar] [CrossRef] [Scilit]
- Tokatli, C. Sediment quality of Ergene River Basin: Bio–ecological risk assessment of toxic metals. Environ. Monit. Assess. 2019, 191, 706. [Google Scholar] [CrossRef] [Scilit]
- Yüksel, B.; Ustaoğlu, F.; Tokatli, C.; Islam, M.S. Ecotoxicological risk assessment for sediments of Çavuşlu stream in Giresun, Turkey: Association between garbage disposal facility and metallic accumulation. Environ. Sci. Pollut. Res. 2022, 29, 17223–17240. [Google Scholar] [CrossRef] [Scilit] [PubMed]
- Varol, M.; Şen, B. Assessment of nutrient and heavy metal contamination in surface water and sediments of the upper Tigris River, Turkey. Catena 2012, 92, 1–10. [Google Scholar] [CrossRef] [Scilit]
- Dundar, M.S.; Altundag, H.; Eyupoglu, V.; Keskin, S.C.; Tutunoglu, C. Determination of heavy metals in lower Sakarya river sediments using a BCR-sequential extraction procedure. Environ. Monit. Assess. 2012, 184, 33–41. [Google Scholar] [CrossRef] [Scilit]
- Cüce, H.; Kalipci, E.; Ustaoglu, F.; Baser, V.; Türkmen, M. Ecotoxicological health risk analysis of potential toxic elements accumulation in the sediments of Kızılırmak River. Int. J. Environ. Sci. Technol. 2022, 19, 10759–10772. [Google Scholar] [CrossRef] [Scilit]
- Jaskuła, J.; Sojka, M. Assessment of spatial distribution of sediment contamination with heavy metals in the two biggest rivers in Poland. Catena 2022, 211, 105959. [Google Scholar] [CrossRef] [Scilit]
- Haghnazar, H.; Belmont, P.; Johannesson, K.H.; Aghayani, E.; Mehraein, M. Human-induced pollution and toxicity of river sediment by potentially toxic elements (PTEs) and accumulation in a paddy soil-rice system: A comprehensive watershed-scale assessment. Chemosphere 2023, 311, 136842. [Google Scholar] [CrossRef] [Scilit] [PubMed]
- Cao, Y.; Lei, K.; Zhang, X.; Xu, L.; Lin, C.; Yang, Y. Contamination and ecological risks of toxic metals in the Hai River, China. Ecotoxicol. Environ. Saf. 2018, 164, 210–218. [Google Scholar] [CrossRef] [Scilit]
- Islam, M.S.; Hossain, M.B.; Matin, A.; Islam Sarker, M.S. Assessment of heavy metal pollution, distribution and source apportionment in the sediment from Feni River estuary, Bangladesh. Chemosphere 2018, 202, 25–32. [Google Scholar] [CrossRef] [Scilit]
- Ye, Z.; Chen, J.; Liang, Z.; Wu, P.; Li, R.; Gopalakrishnan, G. Contamination, fraction, and source apportionment of heavy metals in sediment of an industrialized urban river in China. Environ. Res. 2024, 262, 119936. [Google Scholar] [CrossRef] [Scilit]
- Hüseyinca, M.Y.; Küpeli, Ş. Mineralogy and Geochemistry of Sediments from Lake Tuz. Hittite J. Sci. Eng. 2021, 8, 329–338. [Google Scholar] [CrossRef] [Scilit]
- Buat-Menard, P.; Chesselet, R. Variable influence of the atmospheric flux on the trace metal chemistry of oceanic suspended matter. Earth Planet. Sci. Lett. 1979, 42, 399–411. [Google Scholar] [CrossRef] [Scilit]
- Álvarez-Vázquez, M.Á.; Farinango, G.; Prego, R. Uranium as reference element to estimate the background of “Anthropocene” sensitive trace elements in sediments of the land-ocean continuum (Ulla-Arousa, NW Iberian Atlantic Margin). Cont. Shelf Res. 2023, 261, 105021. [Google Scholar] [CrossRef] [Scilit]
- Ho, H.H.; Swennen, R.; Cappuyns, V.; Vassilieva, E.; Van Tran, T. Necessity of normalization to aluminum to assess the contamination by heavy metals and arsenic in sediments near Haiphong Harbor, Vietnam. J. Asian Earth Sci. 2012, 56, 229–239. [Google Scholar] [CrossRef] [Scilit]
- Wilson, M.A.; Burt, R.; Indorante, S.J.; Jenkins, A.B.; Chiaretti, J.V.; Ulmer, M.G.; Scheyer, J.M. Geochemistry in the modern soil survey program. Environ. Monit. Assess. 2008, 139, 151–171. [Google Scholar] [CrossRef] [Scilit]
- Kubier, A.; Wilkin, R.T.; Pichler, T. Cadmium in soils and groundwater: A review. Appl. Geochem. 2019, 108, 104388. [Google Scholar] [CrossRef] [Scilit]
- Liu, Y.; Xiao, T.; Perkins, R.B.; Zhu, J.; Zhu, Z.; Xiong, Y.; Ning, Z. Geogenic cadmium pollution and potential health risks, with emphasis on black shale. J. Geochem. Explor. 2017, 176, 42–49. [Google Scholar] [CrossRef] [Scilit]
- Kumar, S.; Singh, R.; Venkatesh, A.S.; Udayabhanu, G.; Singh, T.B.N. Assessment of Potentially Toxic Elements Contamination on the Fertile Agricultural Soils Within Fluoride-Affected Areas of Jamui District, Indo-Gangetic Alluvial Plains, India. Water Air Soil Pollut. 2022, 233, 39. [Google Scholar] [CrossRef] [Scilit]
- Markiv, B.; Expósito, A.; Ruiz-Azcona, L.; Santibáñez, M.; Fernández-Olmo, I. Environmental exposure to manganese and health risk assessment from personal sampling near an industrial source of airborne manganese. Environ. Res. 2023, 224, 115478. [Google Scholar] [CrossRef] [Scilit] [PubMed]
- Dey, S.; Tripathy, B.; Kumar, M.S.; Das, A.P. Ecotoxicological consequences of manganese mining pollutants and their biological remediation. Environ. Chem. Ecotoxicol. 2023, 5, 55–61. [Google Scholar] [CrossRef] [Scilit]
- Erel, Y.; Veron, A.; Halicz, L. Tracing the transport of anthropogenic lead in the atmosphere and in soils using isotopic ratios. Geochim. Et Cosmochim. Acta 1997, 61, 4495–4505. [Google Scholar] [CrossRef] [Scilit]
- Sun, J.; Yu, R.; Hu, G.; Su, G.; Zhang, Y. Tracing of heavy metal sources and mobility in a soil depth profile via isotopic variation of Pb and Sr. Catena 2018, 171, 440–449. [Google Scholar] [CrossRef] [Scilit]
- Cheng, H.; Hu, Y. Lead (Pb) isotopic fingerprinting and its applications in lead pollution studies in China: A review. Environ. Pollut. 2010, 158, 1134–1146. [Google Scholar] [CrossRef] [Scilit]
- Kober, B.; Wessels, M.; Bollhöfer, A.; Mangini, A. Pb isotopes in sediments of Lake Constance, Central Europe constrain the heavy metal pathways and the pollution history of the catchment, the lake and the regional atmosphere. Geochim. Et Cosmochim. Acta 1999, 63, 1293–1303. [Google Scholar] [CrossRef] [Scilit]
- Monna, F.; Aiuppa, A.; Varrica, D.; Dongarra, G. Pb Isotope composition in lichens and aerosols from eastern Sicily: Insights into the regional impact of volcanoes on the environment. Environ. Sci. Technol. 1999, 33, 2517–2523. [Google Scholar] [CrossRef] [Scilit]
- Cicchella, D.; De Vivo, B.; Lima, A.; Albanese, S.; McGill, R.A.R.; Parrish, R.R. Heavy metal pollution and Pb isotopes in urban soils of Napoli, Italy. Geochem. Explor. Environ. Anal. 2008, 8, 103–112. [Google Scholar] [CrossRef] [Scilit] [PubMed]
- Doucet, F.J.; Carignan, J. Atmospheric Pb isotopic composition and trace metal concentration as revealed by epiphytic lichens: An investigation related to two altitudinal sections in Eastern France. Atmos. Environ. 2001, 35, 3681–3690. [Google Scholar] [CrossRef] [Scilit]
- Teutsch, N.; Erel, Y.; Halicz, L.; Banin, A. Distribution of natural and anthropogenic lead in Mediterranean soils. Geochim. Et Cosmochim. Acta 2001, 65, 2853–2864. [Google Scholar] [CrossRef] [Scilit]
- Hansmann, W.; Köppel, V. Lead-isotopes as tracers of pollutants in soils. Chem. Geol. 2000, 171, 123–144. [Google Scholar] [CrossRef] [Scilit]
- Hanedar, A. Assessment of airborne heavy metal pollution in soil and lichen in the Meric-Ergene Basin, Turkey. Environ. Technol. 2015, 36, 2588–2602. [Google Scholar] [CrossRef] [Scilit]
- Zhang, M.; Tang, L.; Ji, H. Elements and Pb isotopic composition as evidence for contaminant-metal dispersal in surficial soil and sediment of drinking water source in Beijing, China. Sci. Total Environ. 2022, 837, 155682. [Google Scholar] [CrossRef] [Scilit]
- Négrel, P.; Petelet-Giraud, E. Isotopic evidence of lead sources in Loire River sediment. Appl. Geochem. 2012, 27, 2019–2030. [Google Scholar] [CrossRef] [Scilit]

Disclaimer/Publisher’s Note: The statements, opinions and data contained in all publications are solely those of the individual author(s) and contributor(s) and not of MDPI and/or the editor(s). MDPI and/or the editor(s) disclaim responsibility for any injury to people or property resulting from any ideas, methods, instructions or products referred to in the content. |
© 2026 by the author. Licensee MDPI, Basel, Switzerland. This article is an open access article distributed under the terms and conditions of the Creative Commons Attribution (CC BY) license.