


Abstract
The growing global demand for mineral resources is challenging mining operations to maintain productivity while processing lower-grade ores and increasingly complex deposits. This study presents an integrated framework that leverages machine learning (ML) and high-fidelity simulation to model and support scenario-based decision-making for the blasting–crushing–SAG (Semi-Autogenous Grindin) milling chain using a calibrated flowsheet. Using publicly available data from the Barrick Cortez Mine (Nevada, USA), more than three million operational scenarios were generated using the Integrated Extraction Simulator (IES) to capture system variability and sensitivity. Machine learning meta-models, built using Random Forest and XGBoost methods, were trained on the simulated data and achieved coefficients of determination (R2) exceeding 0.90 across all key outputs, including P20, P50, P80, and mass flow rates at different operational stages. The meta-models accurately reproduced plant-scale behaviour while reducing computational requirements by several orders of magnitude compared with full-scale simulations. SHapley Additive exPlanations (SHAP) analysis revealed that blast-hole diameter, explosive energy parameters, screen cut-size, crusher feed characteristics, and SAG mill operating conditions are the dominant factors impacting downstream particle size distributions. The proposed framework enables near-real-time evaluation of “what-if” operational scenarios and provides transparent, quantitative decision-support for integrated mine-to-mill optimisation.
1. Introduction
The mining industry comprises complex, interconnected operations that are crucial for delivering the raw materials used in a wide range of downstream products and industries. Every stage from exploration and extraction to processing and delivery has a direct impact on the efficiency, sustainability, and profitability of the entire value chain. However, traditional management approaches often rely on siloed systems and disconnected decision-making, which can result in inefficiencies and missed opportunities to improve performance. In response to these challenges, mine-to-mill optimisation has emerged as a holistic strategy that seeks to integrate mining and milling processes to maximise overall value. Valery et al. [1] discussed a comprehensive optimisation strategy for mining operations that integrates mine and mill processes to maximise profitability. They noted that the production, efficiency, and cost benefits of mine-to-mill optimisation will become more critical in the future as the mining industry faces growing challenges with decreasing feed grades and increasing cost pressures. In 1998, Morrison [2] investigated the energy efficiency of different comminution circuits by implementing simulation techniques. The most efficient setups were identified in this study by comparing the performance of various circuit configurations. Scott et al. [3] focused their research on rock mass characteristics, blasting, excavation, crushing and milling performance, all of which are required to improve ‘mine-to-mill’ optimisation. The overall benefits are more likely to be observed as longer-term trends in performance rather than immediate responses to short-term changes. Using a combination of case studies, literature reviews, and empirical data, the study analysed the impacts of intense blasting on downstream comminution benefits. The results highlighted the potential economic benefits of optimising rock-breakage processes, with substantial increases in mill throughput and reductions in milling energy consumption.
In 2008, Coetzee et al. [4] applied Model Predictive Control (MPC) to optimise a run-of-mine ore milling circuit. Their methodology was to design the MPC framework to achieve the objective of reducing the variability in the product particle size which leads to increased recovery of gold from downstream processes. Blast fragmentation models and their impacts on comminution circuits were reviewed by Esen et al. [5], with the emphasis on the importance of 10 mm fines for mill throughput. The models were validated in their study with new data sets and applied in two mine-to-mill projects. Their case studies demonstrated that the throughput increased significantly due to improved fragmentation. Kanchibotla et al. [6] focused their study on optimising the drilling and blasting (D&B) process to enhance milling efficiency and determine the impact of blasting on the value chain. The study included baseline and validation trials, together with simulations to improve mill throughput and reduce energy consumption. The results showed an increase in SAG mill throughput and reductions in specific energy consumption. The impacts of optimised blasting on downstream processes shows that the increased throughput from baseline to validation was mainly due to reduced ore hardness, followed by finer Run of Mine) ROM fragmentation from more intense blasting and tighter pebble crusher Closed Side Settings.
In 2015, Adebayo et al. [7] investigated the impact of blast-hole drilling deviation on muck-pile loading costs at the Hwange Colliery Mine, Zimbabwe. The excavation costs for different bucket capacities were analysed, and the results showed a strong correlation between extra loading cost and blast-hole deviation, with significant variations in drilling and excavation costs. Xingwana [8] focused on tracking ore loss and dilution to enhance the integration of mining and milling processes in deep gold mines where ore movement through detailed tracking reports was monitored, and the survey data were analysed. The results provided an enhanced understanding of ore movement and helped to identify key factors that influence ore loss and dilution. In 2017, Beyglou et al. [9] focused their study on improving loading and crushing efficiencies at the Aitik Mine by optimising blast-induced fragmentation. In their study, field trials target specific fragmentation classes to find the most economical blast design. The results showed how to achieve higher loading and crushing efficiencies and more cost-effective milling by correlating target fragmentation with crusher and mill operations.
In 2018, Dotto et al. [10] analysed the effects of fragmentation size distributions on truck and shovel productivity. In their study, they noted that the fragmentation size distribution affects shovel production in terms of digability and fill factor. In addition, digability impacts the loading time and the energy used in loading and, subsequently, truck productivity is also affected by payload, loading time and waiting time at the loader. Esen et al. [11] conducted a drill to mill plant optimisation project at the Pustynnoye Gold Mine to increase mill throughput and improve overall mine performance. They used in situ orebody characterisation. As a result, the project achieved a 16.2% increase in crusher throughput and an 11.6% increase in mill throughput, along with improvements in fragmentation, wall control, dig rates, and operational efficiency. Park et al. [12] used drilling performance to improve rock-breakage efficiencies. Based on the results of their experiments, models were developed to predict rock-breakage efficiencies during crushing and grinding. By using this technique, blast designs that include the comminution energy consumption and efficiency in downstream rock-breakage processes can be obtained. Rafeeian et al. [13] used the mine-to-mill process to identify and rank parameters that have an impact on blasting fragmentation. Statistical analysis and design of experiments (DOE) were used to help them determine the significance of parameters such as specific charge and hole diameter. The results highlighted the importance of specific charge in the crushing process, which was ranked the highest among the input parameters. Faramarzi et al. [14] implemented the Extended Drop Weight Test (ExDWT) to study the ore heterogeneity and its impacts on comminution circuits. They also used simulations to evaluate the impacts of ore competence variability on SAG mill performance. Their results showed significant throughput fluctuations due to ore variability and noted the importance of optimal sampling strategies to accurately represent ore domains. The Grade Engineering concept and the Integrated Extraction Simulator (IES) were implemented in Amini et al. [15] in which neural networks were employed to develop a fully integrated value chain model for economic evaluation and mine planning. The results showed significant insights into optimising the value chain and identifying low-risk high-value scenarios. Ghahramanieisalou and Sattarvand [16] noted that the integration of digital twins (DT) in mining engineering can help optimise productivity and enhance efficiency. Their study emphasised that DT is an innovative technology that can be used for data storage, simulation and analysis, as well as a visualisation platform. The study discussed the benefits of using DT in several applications, including fleet management, mine-to-mill optimisation and geotechnical assessment. Additionally, Amini et al. [17] developed neural-network meta-models using the IES-ModelNet workflow to emulate an IES flowsheet response for rapid evaluation of resource block-model scenarios, achieving substantial speed-up relative to the phenomenological simulation.
Hosseini et al. [18] integrated strategic and tactical mine planning to improve the overall value chain performance using a multi-objective grey wolf optimisation (MOGWO) approach and data-driven models. The application of MOGWO demonstrated significant efficiency and profitability improvements. Navarro et al. [19] obtained key parameters for the production process of structural canga (CE), compact jaspillite (JC), highly compact jaspillite (JAC) and extremely compact jaspillite (JEC) and presented an economic analysis of a mine-to-crusher model for an open-pit truck-less iron ore mine in northern Brazil, where operating costs for drilling, blasting, loading and primary crushing were modelled to correlate blasting design data to particle size distributions. Finally, in Hanhiniemi [20], the relationship between ball-mill throughput and classification efficiency was examined in detail.
Building on this foundation, the present study differs by targeting an integrated fragmentation-to-grinding chain of operations in which blast fragmentation descriptors are explicitly propagated through screening, crushing, stockpiling, and SAG milling in a single linked IES flowsheet. The developed surrogates are trained to predict multi-stage, multi-output responses (PSD metrics P20/P50/P80 and mass flow rates across stages) and are complemented by SHAP-based interpretability to quantify parameter influences and cross-stage sensitivities.
While traditional approaches have significantly improved various aspects of mining operations, recent research and industry practices point to the application of artificial intelligence as a powerful next step.
With ML-based systems, mining companies can optimise their operations by analysing and integrating data from different sources. Table 1 summarises the applications of machine learning (ML) and its subset in various areas of mining operations.
Table 1.
Applications of artificial intelligence (AI) and machine learning (ML) in mining engineering.
In particular, optimisation at the integrated system-level of the entire mining process (from mining to comminution) is still not commonly applied in the industry. Past optimisations were often siloed (focusing on one stage or one process at a time) or lacked advanced AI techniques for analysing complex interdependencies. Based on our comprehensive literature review, the research gaps that were identified in this area include: (1) the limited availability of computationally efficient and explainable decision-support frameworks that combine an integrated calibrated flowsheet with ML-based surrogate/meta-models to enable rapid scenario screening across linked mine-to-mill stages (e.g., fragmentation-to-comminution) without repeatedly executing high-fidelity simulations; (2) limited applications of modern AI and machine learning techniques for predictive modelling and optimisation; and (3) a gap for smart decisions between orebody characteristics and the selection of consistently applied operational parameters in practice, which can result in more reactive rather than proactive operating settings, particularly when historical data are noisy. To address these challenges, a systematic, data-driven approach that leverages advanced simulation tools and machine learning techniques is adopted in this study by developing an integrated ML-based surrogate (meta-)model for the modelled mine-to-mill comminution chain, enabling rapid scenario screening and decision-support within the calibrated domain. The meta-model approach uses a simulator to generate vast amounts of scenario-based data and then trains ML models on this data to capture key relationships and sensitivities. The meta-model can then be used to provide near-real-time predictions and optimisation insights without having to always seek solutions from computationally expensive simulations. Consequently, the entire mining operation can remain in its optimal state and become more effective and efficient by following a “knowledge-based” mine-to-mill data-driven decision-support framework. This study advances mine-to-mill optimisation in several keyways. While earlier mine-to-mill studies have typically focused on isolated stages, such as blasting or milling, the framework developed in this study integrates the entire chain from blasting to screening, crushing, stockpiling and SAG milling within a single simulation environment. In contrast to prior studies, which often rely on limited site trials or simplified models, the Integrated Extraction Simulator (IES) from Orica was employed to generate a high-fidelity digital representation of the Cortez Mine Complex flowsheet. In addition to this, meta-models trained on more than three million simulations enable robust prediction of downstream performance under a wide range of operational settings. SHapley Additive exPlanations (SHAP) analysis was applied to provide transparent and quantitative insights into the relative importance of parameters across multiple mining stages. Together, these elements extend prior IES-based surrogate modelling by focusing on integrated upstream fragmentation propagation, multi-stage PSD prediction, and explainability across linked unit operations, which are essential for practical scenario screening and operational decision-support.
To clarify how this study addresses these gaps: (i) a calibrated IES base-case is used to generate a large scenario dataset and develop surrogate/meta-models for rapid estimation, enabling efficient scenario screening without repeatedly running the full simulation; (ii) the interpretability/sensitivity analysis (e.g., SHAP) is used to quantify the influence of key inputs on the predicted outputs within the modelled chain; and (iii) the surrogate/meta-model is positioned as a complement to the established mine-to-mill and metallurgical modelling workflows by using an accelerator for screening and decision-support within the calibration domain rather than an independent replacement for the parent model
In practical operations, high-fidelity, calibrated simulation models are often too computationally intensive to be executed repeatedly for frequent “what-if” scenario assessments. For this reason, meta-models (surrogate models) are widely used to approximate simulation outputs with negligible runtime overhead. In this study, the developed ML-based surrogates enable near-real-time evaluation, rapid scenario screening, and operational decision-support, providing quick estimations and fast responses to changing inputs while preserving consistency with the underlying calibrated simulation framework used for training.
Although model interpretation and sensitivity analyses are presented at the individual process level for clarity, the proposed optimisation framework operates at the system level. All simulations and machine learning meta-models are constructed using full-chain data in which upstream parameters, such as blasting design and rock properties, directly propagate through screening, crushing, stockpiling, and SAG milling. Consequently, predicted outputs and optimisation insights represent the cumulative response of the integrated mine-to-mill system rather than isolated unit operations. The stage-wise analyses are therefore employed as an interpretability tool to explain how local decisions influence downstream performance, not as independent or disconnected optimisation exercises.
The remainder of this paper is structured as follows. Section 2 presents the methodology, including the case study and data sources, development and calibration of the IES flowsheet, scenario generation and sampling strategy, machine learning model training and validation metrics, and the SHAP interpretability approach. Section 3 presents the validation of the model and scenarios. Section 4 reports the results, including the simulation–data agreement, predictive performance of the meta-models, and the SHAP-based ranking of influential parameters across the mine-to-mill chain. Section 5 discusses the implications of these results for integrated mine-to-mill decision-making and highlights limitations and transferability considerations. Section 6 concludes the paper and outlines directions for future work.
2. Methodology
The methodology for this research involves an integrated, end-to-end approach that combines real operational data, high-fidelity simulation, and machine learning to develop a predictive meta-model of the mine-to-mill system. This meta-model is trained on millions of simulated scenarios and enables rapid, real-time predictions without the need for repeated full simulations. To ensure transparency and interpretability, SHapley Additive exPlanations (SHAP) analysis is applied to quantify the influence of input parameters and identify the key drivers of system performance. The key steps in this approach are: (1) data acquisition and case study definition, (2) building and validating a simulation model for the operation, (3) conducting large-scale scenario simulations (sensitivity analysis) to generate training data, (4) training and evaluating machine learning models (meta-models) based on the simulation data, and (5) interpreting the meta-models to identify important drivers and gain insights for operation optimisations. These steps are described in detail below.
2.1. Case Study and Data Acquisition
To ensure the practical significance of the research, the Cortez Gold Complex (specifically the Wenban pit at the Barrick’s Cortez operation, Nevada, USA) was chosen as the case study. This site was selected because of the availability of detailed published data and reports on its geology, mine plan, and processing operations. In particular, the technical reports of Fiddes et al. [55] for the Cortez Mine and the PhD thesis of Hanhiniemi [56] were referenced extensively and include the process flow diagrams, production rates, equipment specifications, and rock characteristics. Key aspects of the Cortez/Wenban orebody and operations include gold ore with moderate hardness, drilling-and-blasting in the open-pit, feed to the primary crusher, followed by SAG (semi-autogenous grinding) milling and downstream recovery processes. The process flow diagram for the ore handling and grinding circuit was extracted from the report and used as the blueprint for our simulation model.
The process flow diagram of the Cortez gold mine begins with the blasting stage. The extracted rocks are then transported to a primary crusher, and the crushed materials are fed directly into a SAG mill, which operates in a closed loop with a SAG screen and a cone crusher. The next stage involves a sump where the output from the SAG mill is mixed with water. This slurry is subsequently pumped to hydro cyclones and a ball mill, for further grinding and size reduction.
2.2. Simulations
2.2.1. Simulation Background
Modelling of mineral processing plants was established by the JKMRC as one of the pioneer developers in the early 1970s [57]. Since then, models were regularly developed and improved for other processes in the mining value chain, such as flotation and blast fragmentation [58]. Process modelling methodologies have also been developed by other research and commercial entities, in the form of equations or specialised commercial software such as METSIM [59], MODSIM [60], SysCAD [61], CEET [62], FLEET [63], JKSimMet [64], and JKSimFloat [65].
2.2.2. Process Simulation with IES
Given the objectives of this study, a simulation platform capable of modelling the entire mine-to-mill chain and quickly evaluating a large number of scenarios is required. The Integrated Extraction Simulator (IES) is chosen as the core simulation tool, as it is a cutting-edge platform designed for end-to-end mining-process simulations.
The IES allows the user to construct a customised flowsheet of unit process models. For this case study, the flowsheet in IES includes the following linked units: blasting, screening, primary crusher (jaw), stockpile and SAG mill. Each unit in IES is underpinned by a model that can be either physics-based or data-driven as described in the following paragraphs:
- (1)
- Blasting module: The Kuz–Ram fragmentation model was parameterised using site-specific burden, spacing, hole diameter, explosive density, and velocity of detonation. Fragmentation curves were calibrated against Split-Desktop photo-analysis of muck piles to ensure realistic feed distributions.
- (2)
- Screening stage: A single-deck screen split blast-induced materials into over-size and under-size material fractions according to the cut-size (D50) and efficiency parameter (Alpha). Screen parameters were gathered from the mining site based on real screen specifications.
- (3)
- Primary crusher: A jaw crusher model received over-size materials from the screening stage. Its breakage function and throughput capacity were set based on equipment specifications reported in the Cortez technical report, ensuring the matching of throughput with operational ranges.
- (4)
- Stockpile: The stockpile was simulated as a buffer and blending unit, capturing residence time effects and smoothing feed fluctuations. Material flow and particle size distributions in the stockpile were validated against reported site data.
- (5)
- SAG mill circuit: The SAG mill received materials from the stockpile via a sump with added water. Mill behaviour was controlled by critical speed, load percentage, and water content. The mill operated in a closed circuit with a discharge screen and a pebble crusher, replicating the actual comminution loop. Outputs were compared against measured SAG mill product size distributions for calibration.
The fully connected flowsheet enabled the propagation of material characteristics from the blast face to the SAG mill, ensuring that upstream design changes directly influenced downstream performance. The model was iteratively calibrated at each stage until simulated size distributions and mass balances aligned with the available plant data. Figure 1 shows the schematic diagram of this flowsheet implemented in the IES platform.
Figure 1.
Cortez mine process flow diagram.
Before proceeding to large-scale simulations, a calibration and validation of the implemented IES model against actual operating data was performed. This step is crucial to ensure the accuracy and credibility of the simulation model. Several adjustments were made iteratively: the output from the blast fragmentation model was compared to post-blast muck-pile size measurements obtained via the image analysis of actual muck-pile photos using the Split-Desktop software [56]. Once validated, the IES model is used as a “safe sandbox” to conduct extensive numerical experiments that would be impractical to conduct in an actual operation.
2.2.3. Blasting Simulation
A comprehensive set of photographs were collected from post-blasting muck piles, which were then analysed to derive the particle size distribution as mentioned above [56].
These data were then fed into the IES platform to enable the simulation of the blasting operation, resulting in a detailed and realistic model of the process. A comparison of predicted outcomes from simulation and real data is shown in Figure 2.
Figure 2.
Blasting muck-pile data vs. IES prediction.
2.2.4. Stockpile Simulation
In the IES flowsheet, the stockpile product was estimated as a blend of two incoming streams: (i) the crusher product and (ii) the under-size material from the screen. The simulator combined the particle size distributions (PSDs) of these two sources according to their relative mass flow rates, generating a homogenised PSD that represents the stockpile feed. This blending approach ensured that the stockpile did not act as a simple pass-through, but rather as a buffer that mixed materials from different time steps and smoothed short-term fluctuations in feed quality. As a result, the PSD of the reclaimed stockpile materials reflected both the fines passing through the screen and the coarser fractions retained and broken in the crusher. The simulated stockpile PSD was validated against site-reported measurements at the reclaim point. Figure 3 shows a comparison between actual and predicted particle size distributions within the stockpile. This curve highlights the effectiveness of the screening and crushing process in achieving the desired particle sizes. Throughout this paper, On-Screen (OS) denotes the screen over-size stream (material retained on the screen), Under-Screen (US) denotes the screen under-size stream (material passing through the apertures), and Crusher outputs refer to the crusher product stream discharged after comminution. These definitions are applied consistently across all figures and tables to avoid ambiguity.
Figure 3.
Stockpile data vs. IES prediction.
2.2.5. SAG Mill Simulation
At the Cortez Gold Mine, the ore processing circuit included a semi-autogenous grinding (SAG) mill as the key part of the comminution process. The SAG mill received materials from a sump, which acted as a buffer to maintain a steady feed rate. After grinding, the resulting slurry was sent to a screen for further processing. As plant SAG mill survey data were not available for external validation, the SAG mill surrogate predictions were evaluated against the corresponding SAG mill discharge/screen stream outputs from the calibrated IES base-case flowsheet, with SAG feed conditions (mass flow rate and PSD) provided explicitly by upstream units and SAG operating settings fixed as per the base-case configuration. The performance of this circuit is shown in Figure 4 and Figure 5.
Figure 4.
SAG mill over-size product vs. IES Prediction.
Figure 5.
SAG mill under-size product vs. IES prediction.
Throughout this paper, P20, P50, and P80 refer to percentile particle sizes obtained from the cumulative particle size distribution (PSD) of a given material stream. Specifically, P20 is the particle size for which 20% of the stream mass is finer (i.e., 20% passing), P50 is the median particle size (50% passing), and P80 is the particle size for which 80% of the mass is finer (80% passing). These percentile sizes are key descriptors of a PSD curve and are reported in mm; they are not defined by, nor do they require, a reference screen aperture size. In contrast, the screen parameter D50 in this work represents the screen cut-size (aperture-related separation size) that governs partitioning between over-size and under-size streams. Accordingly, increases in upstream P80 indicate a shift toward a coarser feed distribution (coarse tail), which can increase the proportion of material retained as over-size relative to the cut-size, but P80 should not be interpreted as the maximum fragment size.
3. Interpretation and Validation of Scenarios
Once the simulation models are validated, a sensitivity analysis is conducted by systematically varying the variables at each stage to assess their individual and collective impacts on the overall system performance. This involves running simulations of a vast number of scenarios to explore the effects of changes in parameters such as mineral characteristics, blast design, and grinding circuit variables. For our simulation platform, the flowchart of the modelled mining system showing all the inputs and outputs for each stage is illustrated in Figure 6.
Figure 6.
Flow chart of the modelled mining system.
Output values vary substantially across scenarios and stages; consequently, the focus is on trend-based interpretation within the defined input ranges (Table 2) rather than reporting exhaustive descriptive statistics for every output variable.
Table 2.
Summary of the input features at different stages used for training and prediction of outputs.
A total of three million simulation scenarios were generated in IES to capture the variability and sensitivity of the mine-to-mill system. Parameter ranges were defined based on published technical data for the Cortez mine and typical operating windows reported in the literature. For example, blasting variables such as burden, spacing, hole diameter, explosive density, and velocity of detonation were varied within practical site limits. Rock properties, including unconfined compressive strength (UCS) and Young’s Modulus, were also incorporated. Note that within the Kuz–Ram-type fragmentation formulation used here, the effects of UCS/elastic modulus are only indirectly considered via empirical rock-factor terms. The capability for the prediction of fines is known to be limited and, therefore, the relationships should be interpreted as model- and calibration-domain-dependent, particularly in highly jointed or weak rock masses. Downstream parameters included screen cut-size (D50) and sharpness (Alpha), crusher close-side setting, SAG mill load, speed, and water content. Sampling was performed using a randomised grid approach that combined elements of full-factorial exploration with random sampling to ensure broad coverage of the parameter space without the prohibitive cost of a strict full-factorial design. This approach generated a diverse and balanced dataset suitable for training machine learning models.
Before running large-scale simulations, the IES flowsheet was carefully calibrated and validated against actual operating data from the Cortez mine. Blasting fragmentation models were benchmarked using Split-Desktop image analysis of muck piles, Crusher and Screen outputs were compared with site-reported size distributions, and SAG mill discharge curves were cross-checked with published plant data. Calibration was iterative: model parameters were adjusted until the simulated particle size distributions and mass flows closely matched observed values. Only after this validation step was complete was the simulator used as a “digital twin” environment for extensive scenario generation. This ensured that the simulated outputs were realistic and credible representations of plant behaviour.
3.1. Algorithms
Machine learning (ML), a branch of artificial intelligence (AI), enables systems to learn patterns and make predictions from data without being explicitly programmed. Unlike traditional statistical methods, ML algorithms can handle complex, multi-dimensional problems and uncover hidden relationships between input (independent) and output (dependent) variables [66]. As mentioned earlier, in addition to the simple Linear Regression analysis, three ML-based algorithms, namely Random Forest (RF), Decision Tree (DT), and eXtreme Gradient Boosting (XGBoost), were used in this study to evaluate their performance in predicting the outputs of our mine-to-mill system. These algorithms are briefly explained below.
3.1.1. Decision Tree (DT) Algorithm
The Decision Tree algorithm is based on heuristics, such as the greedy approach, where the tree is constructed gradually, and locally optimal decisions are made at the construction of each node [67]. A Decision Tree is a tree-like model where internal nodes represent features of the dataset, branches indicate decision rules, and leaf nodes show the final outcomes or classifications. While leaf nodes signify the end results and do not branch further, decision nodes are used to split the data based on different criteria and can lead to multiple branches.
A Decision Tree is built by recursively splitting the dataset based on the best variable selected using a specific criterion such as variance reduction, mean squared error, mean absolute deviation, or information gain chosen according to the nature of the data. The data are divided into two subsets at each split, forming child nodes, and this process continues until a predefined stopping condition is met, such as reaching a maximum tree depth or a minimum number of samples. Once the tree is fully constructed, it undergoes pruning to remove nodes that do not significantly improve prediction performance, helping to reduce overfitting and enhance generalisation on unseen data.
3.1.2. Random Forest (RF) Algorithm
Random Forest (RF) is a popular supervised machine learning algorithm used for both classification and regression tasks. It operates by building multiple Decision Trees on different subsets of the dataset and then combining their predictions to produce the final result. This ensemble approach helps reduce the risk of overfitting and enhances the overall prediction accuracy of the model.
The algorithm builds multiple Decision Trees using a technique termed bootstrap aggregation, or bagging, where each tree is trained on a randomly sampled subset of the data. At each split within a tree, only a random subset of features is considered, which promotes diversity among the trees and reduces their correlation. The trees grow recursively until a specified stopping condition such as maximum depth or minimum samples per leaf is met. For prediction, a new observation is passed through all trees, and the final output is the average of their predictions in regression tasks. To achieve optimal performance, several hyperparameters must be tuned, including the number of trees, tree depth, minimum samples for splitting, minimum leaf size, and the number of features considered at each split [67,68].
3.1.3. Linear Regression
Linear Regression is one of the most basic and widely used machine learning techniques for predictive analysis. It is a statistical method that models the relationship between a dependent (or output) variable and one or more independent (or input) variables using a linear approach. In LR, the relationships are modelled using linear predictor functions, with unknown model parameters estimated from the data [69,70,71]. The general structure of a multivariate Linear Regression is as follows:
where represents the dependent variable, and , , …, are the independent variables. The terms , , , …, are the regression coefficients, and e stands for the error term. The model is typically trained using methods such as Ordinary Least Squares (OLS), which works by minimising the total squared difference between the predicted and actual values of the dependent variable. Each coefficient indicates how much is expected to change with a one-unit increment in the corresponding value, assuming all other variables remain the same [72,73].
3.1.4. eXtreme Gradient Boosting (XGBoost) Algorithm
eXtreme Gradient Boosting (XGBoost) is a well-known and powerful machine learning (ensemble learning) algorithm that combines multiple weak Decision Trees to create a robust predictive model, which has been used for a variety of purposes in engineering [74,75,76]. It is a sequential learning technique where each new tree is built to correct the errors made by the previous one. Unlike the RF algorithm, which selects splits randomly, XGBoost focuses on improving prediction accuracy by adjusting to residual errors. At each iteration, the model updates weights, giving more importance to incorrectly predicted instances and less to correctly predicted ones. This process continues through multiple iterations, with the performance of the model better refined at each step [77,78].
The XGBoost method is based on the Gradient Boosting Decision Tree (GBDT) structure. However, in contrast to GBDT, the XGBoost objective function has a regularisation term that protects against overfitting.
Additionally, in contrast to Gradient Boosted Decision Trees (GBDT), which uses only the first-order derivative of the loss function, XGBoost incorporates both the first and the second-order derivatives by applying a second-order Taylor expansion of the objective function. Due to its built-in regularisation, XGBoost is more effective in preventing overfitting compared to other models.
The main hyperparameters used for the machine learning algorithms implemented in this study are shown in Table 3, and include Linear Regression, Decision Tree, Random Forest, and XGBoost. These parameters were selected based on model suitability for the specific prediction tasks within each mining stage. Key configuration options such as the number of estimators, tree depth, learning rate, regularisation terms, and data sampling strategies were tailored to balance model complexity and predictive accuracy. Highlighting these hyperparameters allows for reproducibility and provides insight into the relative flexibility and control offered by each method.
Table 3.
Defined hyperparameters for ML algorithms.
3.2. Model Validation
In this study, the coefficients of determination (R2) is used to assess the prediction accuracy of the proposed models. The mathematical expressions for the performance indicators are provided below:
where , , , and are, respectively, the sum of the squares of the residuals, the total sum of squares of the deviations from the average of true values, the measured/real output, and the predicted output.
Using this performance indicator, the accuracy of the developed machine learning models can be evaluated.
To avoid over-reliance on a single goodness-of-fit statistic, we report R2 alongside absolute error metrics (e.g., MAE/RMSE) and examine prediction behaviour across the output range to identify potential bias or extrapolation risk. RMSE and MAE are other accuracy metrics that are used in this study to provide a robust comparison among different algorithms. The accuracy metrics of the different algorithms for all stages are shown in Table 4.
Table 4.
Performance comparison of machine learning algorithms (LR, DT, RF, XGB) across mining stages using R2, RMSE, and MAE.
Figure 7 presents a comparative analysis of the prediction performance (R2 values) of four machine learning algorithms—Linear Regression, Decision Tree, Random Forest, and Gradient Boosting—across multiple stages of the mining processes modelled. For each output metric (P20, P50 and P80), the R2 values indicate the goodness-of-fit of the model. All ML models show excellent accuracy of more than 90 percent; however, Gradient Boosting consistently delivers the highest R2 scores in the majority of cases, particularly in blasting and SAG mill predictions, demonstrating superior prediction accuracy. Random Forest also performs well, especially in the crushing and screening stages. In contrast, Decision Tree and Linear Regression show relatively poorer performance across most processes, with Linear Regression being the least accurate in modelling the complex, non-linear relationships in this dataset. Overall, the models demonstrated strong prediction performance, with accuracy exceeding 90% for outputs such as P20, P50, P80 and mass flow, indicating that the simulation framework and scenario design were both robust and reliable.
Figure 7.
R2 values obtained for Blasting, On-Screen, Under-Screen, Crusher, and SAG mill outputs using different algorithms.
The performance of all machine learning models was evaluated using a combination of training/testing splits and k-fold cross-validation to ensure both robustness and generalisability. The dataset of simulated scenarios was randomly divided into 80% training and 20% testing subsets. Models were trained on the training set, while predictive performance was assessed on the held-out test set. In addition, a 5-fold cross-validation was applied during hyperparameter tuning to avoid overfitting and to confirm that performance was consistent across different partitions of the data. For all models, the average R2 values for both training and testing datasets exceeded 90% percent, indicating strong agreement between predicted and simulated outputs across all stages, particularly for outputs with complex non-linear dependencies. This performance is attributed to their built-in regularisation, and resistance to overfitting, making them suitable for high-dimensional data.
4. Results
In this study, the four ML models were selected for their ability to handle complex relationships between mining variables, their resilience to overfitting, and their demonstrated effectiveness in industrial process optimisations. To enhance model interpretability, SHapley Additive exPlanations (SHAP) analysis was applied. For clarification, it is necessary to explain briefly the interpretation of SHAP (SHapley Additive exPlanations) plots. SHAP values quantify the contribution of each input feature to the model output relative to a baseline prediction. Positive/negative SHAP values indicate whether a feature increases or decreases the predicted KPI for a given sample. Each plot ranks the model input variables (features) according to their relative influence on the predicted output. The order of the features on the vertical axis reflects their importance, with the most influential parameters at the top. Each point on the plot corresponds to one simulated scenario, with the colour scale (red to blue) indicating whether the feature value is high (red) or low (blue). The horizontal position of each point represents the SHAP value, which quantifies the impact of that feature on the model prediction: positive SHAP values shift the output upward (e.g., towards coarser PSDs), while negative values shift it downward (e.g., towards finer PSDs). The spread of values along the x-axis shows the variability of the impact of the corresponding feature, with wider spreads indicating stronger or more variable influence on the outcome.
In simple terms, the plots show not just which parameters are the most critical, but also how changes in those parameters (low vs. high values) influence the outputs (P20, P50, P80, or mass flow).
The SHAP summary plots (see Figure 8a–c) for Blasting P20, P50 and P80 illustrate the influences of different input parameters on the prediction of blasting fragmentation sizes. Among the most influential parameters, the blast-hole diameter shows a strong impact on P20, meaning that larger blast holes produce finer materials. This is because larger holes hold more explosives, increasing the energy intensity per unit volume of rocks and resulting in more effective breakage near the blast hole. In addition, both velocity of detonation (VOD) and explosives density exhibit a strong negative correlation with P20. Physically, higher VOD explosives create faster and more intense shockwaves that propagate more effectively through the rock, enhancing fracture development and leading to finer fragmentation. Similarly, higher explosive densities (higher powder factor) provide more energy per unit volume of rocks, increasing the intensity of rock breakage and reducing the resulting fragment sizes. The influences of spacing and burden are also significant, but in contrast to the aforementioned parameters, larger values lead to higher P20. This is expected because increasing burden and/or spacing increases the rock volume covered per blast hole, thereby reducing the explosive energy delivered per unit rock mass (i.e., lowering the powder factor, PF, for a given charge design and hole diameter). A lower PF typically results in coarser fragmentation, all else being equal. The unconfined compressive strength (UCS) of the rock has a direct physical impact on rock fragmentation. Stronger rocks with higher UCS require more energy to break and are therefore more resistant to fragmentation, typically resulting in larger fragments and a higher P20 value. Young’s Modulus, although less dominant, shows a subtle trend where rocks with higher stiffness tend to increase P20 slightly, likely because stiffer materials absorb and transmit energy more efficiently, reducing the intensity of localised fractures.
Figure 8.
SHAP summary plots for (a) P20, (b) P50 and (c) P80 of the blasting process.
For the Blasting P50, it is influenced primarily by energy concentration and geometric confinement. The SHAP plot shows that larger hole diameters push the SHAP values strongly to the left, signalling a fall in P50 and therefore a finer median fragmentation size. Physically, the explosive energy inside a larger blast hole is spread over more rocks, increasing local pressure and expanding finer breakage. Higher explosive density drives the SHAP values leftward, lowering P50, which is because denser explosives pack more energy per unit length, producing stronger shock waves and finer fragments. Geometric controls follow this regime in that greater burden and spacing both add positive SHAP contributions because there are more unbroken rocks surrounding each charge, leading to decreased energy overlap hence larger fragments. Rock properties appear further down the list as stiffer rocks with higher Young’s Modulus absorb more of the shock energy and push P50 up slightly, while VOD and UCS appear to have only a modest leverage, indicating that once the 50% passing threshold is reached, further energy increases, or rock strength variations have secondary effects compared with the charge geometry and explosive density.
For the coarser tail represented by Blasting P80, the same physical principles can be observed. The hole diameter variable again dominates, and wider holes exhibit stronger negative SHAP swing, confirming that fine fragments are produced when energy is increased inside the blast hole. The burden variable overtakes blast-hole spacing as the second driver, because the distance to the free face primarily controls the blasting confinement and rock movement. A larger burden creates higher confinement and favours the formation of larger fragments, hence a higher P80. The explosive density is influential and its negative SHAP values show that high-density charges help to produce finer materials.
Figure 9a–c show the impact of blast-induced materials on the On-Screen particle size distributions. Figure 9a clearly shows that Blasting P20 has the strongest influence on On-Screen P20 where the finest 20% of the blasted materials can contribute predominantly to the lower end of the On-Screen particle size distribution. Since Blasting P80 represents coarser fragments that almost always remain on the screen regardless of changes, its impact on On-Screen P20 is minimal and mostly constant. However, variables such as D50 and Blasting P50 still exert some influence. D50 determines the screen’s cut-off size, so changes in D50 can slightly shift the boundary at which particles transition from passing through to being retained. Because Blasting P50 often aligns closely with this cut-off, its influence appears as a more gradual shift in the mid-range of the distribution, rather than a dominant control on the fine tail unlike Blasting P20.
Figure 9.
SHAP summary plots for On-Screen (a) P20, (b) P50, (c) P80.
The SHAP plots for On-Screen P50 and P80 clearly show that Blasting P80 is the most influential variable, and this aligns with the physical logic of screening. Since On-Screen P50 and On-Screen P80 represent the middle and upper tails of the On-Screen size distribution, they are most affected by the coarse fraction of the incoming feed. Blasting P80 defines the largest fragments generated during blasting, which are more likely to remain on the screen. As a result, higher values of Blasting P80 shift the retained size distribution toward coarser values, increasing both On-Screen P50 and On-Screen P80. In contrast, variables such as D50, Alpha, and Blasting P50 have only minor effects because they primarily influence finer to mid-sized materials, which do not strongly control the upper tail of the size distribution of the retained stream. Thus, the model correctly identifies Blasting P80 as the dominant factor shaping the coarser ends of the On-Screen size spectrum.
Figure 10a–c indicate a clear hierarchy of drivers for the Under-Screen size distribution. The screen aperture size (D50) exerts the greatest influence because it defines the physical aperture through which all materials must pass. Increasing D50 allows progressively coarser fragments to pass to the Under-Screen stream, thereby shifting Under-Screen P20, Under-Screen P50 and Under-Screen P80 to larger sizes, whereas reducing D50 has the opposite effect. Once the screen cut-off size (D50) is fixed, the availability of fine particles passing through the screen is primarily governed by Blasting P20. This is because particles smaller than the Blasting P20 size make up the majority of the sub-D50 fraction. Therefore, higher Blasting P20 values result in a greater quantity of fines, which in turn raises the Under-Screen size percentiles. Blasting P50 impacts the Under-Screen size distribution when its corresponding particle size is close to the screen aperture size. In this case, abundant mid-size materials increase the likelihood of borderline fragments passing the aperture, especially when D50 is relatively large, therefore modestly raising Under-Screen P50 and, to a lesser extent, Under-Screen P80.
Figure 10.
SHAP summary plots for Under-Screen (a) P20, (b) P50, and (c) P80.
The SHAP plots for the crusher (see Figure 11a–c) show that the size of the over-size materials coming from the screen is the most critical parameter for evaluating the Crusher output particle size. When the incoming median size (On-Screen P50) is large, the larger rocks within the feed tend to grind against each other more effectively, generating additional fines during crushing. As a result, the particle size corresponding to Crusher P20 becomes smaller, reflecting the increase in fine output. However, if the fine tail of the feed (On-Screen P20) is already coarse, the crusher receives fewer fines to begin with, and the Crusher P20 increases indicating a coarser product in the fine range. A high On-Screen P20 tends to make larger size materials enter the chamber, so the product P50 and P80 shifts to the right even considering the breakage. When the On-Screen P50 is large, the crusher gets a greater proportion of “medium-large” rocks that all must be crushed down to pass through the crusher. These rocks break down into smaller fragments, so the new midpoint of the product size distribution (Crusher P50 and P80) shifts downward and becomes finer. For On-Screen P80, when it increases, more oversized materials enter the crusher. These large size rocks take up space in the chamber and may take several compressions to break, so mid-size fragments receive fewer crushing impacts and pass through the crusher more easily.
Figure 11.
SHAP summary plots for (a) P20, (b) P50, (c) and P80 of Crusher outputs.
For the SAG mill (Figure 12a–c), the SHAP analysis reveals that internal operational settings have significantly greater influences than feed characteristics on the SAG mill performance. For SAG mill P20, mill speed is the most important factor, followed by the amounts of load and water. When the mill rotates at a very high speed the rocks spend less interacting with each other, so the finest 20% of the product becomes coarser and the value of P20 increases. A fuller mill or higher water content (i.e., more dilute slurry) has the opposite effect and produces smaller P20 values, because they allow longer interaction time between materials inside the mill. For SAG mill P50, mill load (percentage) is the dominant factor. A higher charge increases breakage energy and produces finer particles (lower P50). Rotation speed has a dual effect: moderate speeds grind more efficiently (reducing P50), but excessive speed causes premature discharge, increasing P50. Water also contributes; modestly increased water lowers P50 slightly by improving material flow and reducing viscosity, which enhances grinding. For SAG mill P80, mill speed dominates by a wide margin. Higher speeds lift coarse particles higher up the shell, leading to stronger impacts and more breakage. This reduces the coarse tail, lowering P80. The higher mill power increases the breakage energy, allowing rocks to grind to a finer size. More water lowers slurry viscosity, allowing particles and media to move more freely and collide with greater energy. This increases fines production and reduces P20, P50, and P80, provided the water addition does not shorten residence time excessively.
Figure 12.
SHAP summary plots for (a) P20, (b) P50, (c) and P80 of SAG mill outputs.
5. Discussions
Understanding the influences of key input parameters on particle size distributions at different mining stages is crucial for the optimisation of operations from the mine to SAG mill. The SHAP plots and analyses presented above provide valuable insights into the relative importance of different parameters, but they do not actually reveal the complex non-linear relationships between input parameters and output size distributions. In this section, surface plots are used to visualise some of the key relationships. These plots help uncover intricate relationships and operational boundaries, offering a more comprehensive understanding of the combined impacts of certain parameters on the particle size distribution and throughput. This level of detail supports decision-making for parameter setting in operations and scenario optimisations.
The calibrated IES base-case flowsheet provides a high-fidelity reference response for the integrated mine-to-mill chain of operations modelled in this study, whereas the developed meta-/surrogate models are trained to emulate that response within the simulated operating domain. The surrogate is therefore not a replacement for the parent model. Rather, it acts as a computational accelerator that enables rapid estimation and large-scale scenario screening. This allows practitioners to evaluate many combinations of blast and comminution settings efficiently and to prioritise a small subset of promising scenarios for detailed simulation and/or plant evaluation, instead of repeatedly executing the time-consuming full model for every “what-if” query. The approach is most reliable within the calibration/training ranges and inherits base-case assumptions. Accordingly, it should be applied for screening and decision-support, with periodic updating as operating conditions and orebody knowledge evolve.
Figure 13, Figure 14, Figure 15, Figure 16, Figure 17, Figure 18, Figure 19 and Figure 20 provide decision-support response maps that translate the surrogate predictions into practical implications for mine-to-mill optimisation within the modelled chain of operations (blasting → crushing/screening → stockpiling → SAG milling). These figures highlight trade-offs and operating windows and show how upstream fragmentation levers propagate to downstream KPIs, including PSD descriptors and circuit mass flow/throughput proxies, supporting the identification of settings that are more likely to meet target size distributions while sustaining throughput and indicating where constraints may arise within the chain. Recovery/metal yield is not reported because downstream recovery units were outside the surrogate-modelling scope of this manuscript; incorporating ball milling/classification dynamics and recovery KPIs is a future extension of the framework reported.
Figure 13.
Influences of explosive density on rock fragmentation across varying burdens and blast-hole spacings. (a) P20, (b) P50, (c) P80.
Figure 14.
Impacts of UCS on rock fragmentation across different burdens and blast-hole spacings. (a) P20, (b) P50, (c) P80.
Figure 15.
Impacts of the velocity of detonation on rock fragmentation across different explosive densities and blast-hole diameters. (a) P20, (b) P50, (c) P80.
Figure 16.
Impacts of blast-induced material size on On-Screen size distributions for different D50s. (a) P20, (b) P50, (c) P80.
Figure 17.
Impacts of Blasting P20 and P50 on Under-Screen size distributions for different D50s. (a) P20, (b) P50, (c) P80.
Figure 18.
Impacts of On-Screen P50 on the size distributions of Crusher outputs at different explosive densities and blast-hole diameters. (a) P20, (b) P50, (c) P80.
Figure 19.
Impacts of water content, mill critical speed and mill load on particle size distributions of SAG mill outputs. (a) P20, (b) P50, (c) P80.
Figure 20.
Impacts of size distributions of stockpiles on the size distributions of SAG mill outputs. (a) P20, (b) P50, (c) P80.
5.1. Size Distributions of Material at Blasting Stage
Figure 13 illustrates the influence of explosive density on rock fragmentation across varying burdens and blast-hole spacings. The three subplots respectively present the predicted P80, P50 and P20 values under explosive densities of 0.9 (green), 1.0 (red) and 1.1 (grey) g/cm3. Across all fragmentation metrics, a decrease in explosive density generally leads to coarser fragmentation because it reduces explosive energy per unit rock mass. This does not imply changes in explosive shock or gas characteristics, which depend on explosive type. In addition, the plots demonstrate that both burden and spacing significantly affect fragmentation outcomes, with larger burdens and blast-hole spacings generally producing coarser fragments due to the increase in gaps in energy overlap and the reduced interaction of stress waves between adjacent holes. The combined effects of burden, spacing, and explosive density underscores the importance of optimising explosive parameters to achieve desirable fragmentation for downstream processes.
The impacts of different burdens, spacings and UCSs on the blasting fragmentations are shown in Figure 14. However, based on the SHAP analysis in the previous section, the influence of UCS for P80 and P50 is negligible, but P20 is sensitive to UCS (30, 50, and 70 MPa). Higher UCS means the rock is harder to break and so the same explosive energy produces less fines and larger fragments. Other effects of burden and blast-hole spacing on rock fragmentations are covered in the previous section.
As shown in Figure 15, the impacts of the velocity of detonation (VOD) on P20 is evident because a higher VOD means the explosive reaction occurs more rapidly, producing stronger and more abrupt shock waves that initiate cracks more efficiently in the rock. This high-energy impact leads to more extensive micro-fracturing and better fragmentation, especially in the near-field zone around the blast-hole. As a result, rocks are broken into smaller fragments. However, the only parameters that have effects on P50 and P80 are explosive density and blast-hole diameter in the way that increasing the density of the charge and the blast-hole diameter leads to a reduction in the size of the blasted materials. Hence a higher explosive charge density means more explosive per unit length of the hole, leading to stronger shock waves and higher gas pressure, hence enhanced rock fracturing. Similarly, a larger blast hole diameter allows for a greater total explosive charge (increased local explosive density), increasing the energy locally available to break the rock. This increased energy improves the intensity and the reach of crack formation and propagation, resulting in finer fragmentations.
5.2. Size Distributions of Materials After Screening
The size distributions of the On-Screen and Under-Screen outputs after screening are analysed in this section. Figure 16 illustrates the impact of key variables (based on SHAP analysis) on the On-Screen size distributions. As the physical meaning of different characteristics of blast-induced materials and their impact on the screened product was discussed in the previous section, only the surface plots of the On-Screen and Under-Screen product sizes in relation to combined variables are shown here.
The impacts of key variables specifically D50, Blasting P20, and Blasting P50 on the Under-Screen particle size distributions, as revealed by SHAP analysis, are illustrated in Figure 17. Among these, Blasting P20 shows a strong and consistent influence, indicating that the fine fraction of the blasted material plays a critical role in shaping the Under-Screen product. In contrast, Blasting P50 exhibits minimal impact, suggesting that the median size of the blast feed does not significantly affect the screen’s output distribution. The effect of D50 remains dominant, as it defines the screen’s cut-off size and thus directly controls which particles pass through. Together, these results highlight the importance of fine generation during blasting and its downstream influence on screening performance.
5.3. Size Distributions of Crusher Products
The effects of the On-Screen particle size distribution on the Crusher outputs are shown in Figure 18, where it can be seen that the impacts of On-Screen P50 are significantly more compared with the other two parameters.
5.4. Size Distributions of SAG Mill Outputs
Figure 19 shows the predicted particle size distribution outputs of P20, P50 and P80 as functions of mill critical speed and mill load at three different water content levels of 65%, 70% and 75%. It can be seen that increasing the mill critical speed generally results in coarser product sizes for P20 and P50 in contrast to P80. Mill load has a moderate influence, with higher loads tending to slightly decrease particle sizes. Water content notably affects the outcomes. Higher water content (e.g., 70–75%, corresponding to more dilute slurry conditions) consistently leads to finer particle sizes compared with lower water content (e.g., 65%, thicker slurry). This effect is most evident in the P20 plot, where the differences are more pronounced, albeit less significantly, in the P80 plot.
Figure 20 illustrates the impact of the particle size distributions of the stockpiles (On-Screen and Under-Screen products of the screening process) on the size distributions of the SAG mill outputs. It is clearly evident that, as the particle size of the stockpile materials increases, the particle size of the final product from the SAG mill also increases, indicating a direct relationship between the particle sizes of the inputs and SAG mill output products.
6. Conclusions
The meta-model developed in this study demonstrated exceptional predictive performance, achieving R2 coefficient values exceeding 90% across all key process outputs, including fragmentation percentiles and mass flow. This high level of accuracy underscores the robustness and generalisability of the machine learning framework trained on millions of simulation scenarios. Importantly, the meta-model significantly reduces the need for repeated high-fidelity simulations, enabling near-real-time prediction of system responses under various input conditions. This shift from simulation-based to prediction-based optimisation drastically lowers computational requirements while preserving decision quality, making the framework highly suitable for integration into live operational environments or digital twin systems.
In this study, an integrated, ML-based meta-modelling framework to simulate and optimise the mine-to-mill processes from blasting to SAG mill in terms of particle size distributions was developed and validated. Leveraging real-world data from the Cortez Gold Mine and using the Integrated Extraction Simulator (IES) platform, over three million scenarios were simulated to identify key operational parameters. SHapley Additive exPlanations (SHAP) were applied to quantify the influence of each input parameter, offering transparent insights detailing the characteristics of the system. In the blasting stage, SHAP analysis confirmed that geometric and energetic factors dominate fragmentation outcomes. Hole diameter was consistently the most influential factor across all three output percentiles (P20, P50, P80), with larger diameters producing finer fragmentation due to higher explosive loading and energy intensity per unit rock volume. Explosive density and velocity of detonation (VOD) showed strong negative correlations with particle sizes, particularly P20 and P50, as denser and faster explosives generate more effective shock waves and enhance fracturing. Conversely, larger burden and blast-hole spacing values were associated with coarser fragmentation. For the screening process, the model highlighted that both feed characteristics and screen design parameters jointly determine the material separation. The aperture size of the screen (D50) was the most dominant driver of the Under-Screen particle size distribution. As D50 increased, progressively coarser particles were able to pass the screen, raising Under-Screen P20, Under-Screen P50, and Under-Screen P80 values. For the On-Screen stream, Blasting P80 was the key driver, particularly for On-Screen P50 and On-Screen P80. The crusher performance was governed by the size distribution of the On-Screen feed stream. Internal operational parameters had the most significant impact on the SAG mill stage. Mill rotation speed dominated across all particle size percentiles, especially P80, by altering the dynamics of rock-lift and impact energy. The amounts of load and water content were also critical; higher load improved breakage by increasing charge mass and interaction frequency, while optimal water levels facilitated most effective slurry movement and grinding efficiency. Feed characteristics were comparatively less influential at this stage.
While this study focuses on the Cortez Mine, the framework is designed to be general and transferable to other mining operations. The core workflow combining calibrated IES simulations, large-scale scenario generation, and machine learning meta-modelling can be applied to different ores, equipment, and circuit configurations. These interpretations are strictly limited to the simulation-derived dataset and parameter ranges used in this study and may not be directly transferable to other operations or historical datasets without site-specific calibration, retraining, and validation.
The proposed meta-model offers a practical pathway for supporting real-time decision-making across the mining value chain. By enabling near-instant predictions of downstream responses, the framework allows engineers to evaluate “what-if” scenarios without relying on time-consuming simulations. For example, blast design parameters such as burden, spacing, and hole diameter can be adjusted to deliver finer fragmentation that improves mill throughput, while operators can simultaneously assess crusher close-side settings or SAG mill speed and water addition to maintain grind size at minimum energy cost. This capacity to rapidly explore multiple operating alternatives ensures that decisions can be made proactively within daily or shift-based planning horizons, rather than retrospectively. As a result, operations are able to balance competing objectives such as fragmentation quality, throughput, energy efficiency, and cost with far greater agility than traditional trial-and-error approaches.
There are limitations to its applicability. Because the surrogate/meta-models are trained on outputs generated from a calibrated steady-state base-case flowsheet, their predictive validity is inherently linked to the base model structure, calibration quality, and assumptions. In a multi-stage integrated chain of operations, estimation errors may propagate downstream, particularly when intermediate outputs (e.g., PSD descriptors) are used as inputs to subsequent stages. In addition, the surrogates are most reliable within the calibration/training domain and may degrade when extrapolated to new ore types, operating regimes, or equipment configurations not represented in the training data. Consequently, periodic updating/retraining is recommended as operating conditions evolve, and orebody knowledge improves.
In future work, the meta-modelling framework will be extended to incorporate additional downstream processes, including the SAG mill discharge screens, hydro cyclones, and ball mills, providing a more comprehensive digital representation of the comminution circuit. Furthermore, detailed resource data, such as ore block characteristics and spatial heterogeneity, will be integrated into the modelling pipeline. This advance will enable the development of a fully connected digital twin of the entire mining system, linking orebody properties to final processing outcomes and facilitating more intelligent, resource-informed operational strategies.
Author Contributions
Conceptualization, P.N.; Methodology, P.N.; Validation, P.N.; Formal analysis, P.N.; Investigation, P.N.; Writing—original draft, P.N.; Writing—review & editing, C.X. and P.D.; Supervision, C.X. and P.D. All authors have read and agreed to the published version of the manuscript.
Funding
The research reported here was supported by the Australian Research Council Industrial Transformation Training Centre for Integrated Operations for Complex Resources (project number IC190100017) and funded by universities, industry, and the Australian Government.
Data Availability Statement
The codes used in this study are available in a private GitHub repository (https://github.com/Pouyanobahar/DATA accessed on 11 December 2025) and can be accessed upon request. This ensures transparency and enables replication or further development of the presented methodologies. All mine-site data and equipment specifications were obtained from the thesis by Hanhiniemi [56].
Conflicts of Interest
The authors declare no conflict of interest.
References
- Valery, K.A.; Duffy, A.; Jankovic, A.; Tabosa, E. Complete optimisation from mine-to-mill to maximise profitability. Gold Technol. 2016, 32, 62–67. [Google Scholar]
- Morrison, R.D.; Morrell, S. Comparison of comminution circuit energy efficiency using simulation. Miner. Metall. Process. 1998, 15, 22–25. [Google Scholar] [CrossRef] [Scilit]
- Scott, A.; Morrell, S.; Clark, D. Tracking and Quantifying Value from ‘Mine to Mill’ Improvement. In Australasian Institute of Mining and Metallurgy Publication Series; Australasian Institute of Mining and Metallurgy: Brisbane, QLD, Australia, 2002; pp. 77–84. [Google Scholar]
- Coetzee, L.C.; Craig, I.K.; Kerrigan, E.C. Nonlinear Model Predictive Control of a run-of-mine ore milling circuit. IFAC Proc. 2008, 41, 10620–10625. [Google Scholar] [CrossRef] [Scilit]
- Esen, S. Fragmentation modelling and the effects of ROM fragmentation on comminution circuits. In Proceedings of the 23rd International Mining Congress and Exhibition of Turkey, IMCET, Antalya, Turkey, 16–19 April 2013; Volume 2013, pp. 251–260. [Google Scholar]
- Kanchibotla, S.S.; Vizcarra, T.G.; Musunuri, S.A.R.; Tello, S.; Hayes, A.; Moylan, T. Mine to Mill Optimisation at Paddington Gold Operations. In Proceedings of the SAG Conference 2015, Vancouver, BC, Canada, 20–24 September 2015; pp. 1–13. [Google Scholar]
- Adebayo, B.; Akande, J.M. Effects of blast-hole deviation on drilling and muck-pile loading cost. Int. J. Sci. Res. Innov. Technol. 2015, 2, 64–73. [Google Scholar]
- Xingwana, L. Monitoring ore loss and dilution for mine-to-mill integration in deep gold mines: A survey-based investigation. J. S. Afr. Inst. Min. Metall. 2016, 116, 149–160. [Google Scholar] [CrossRef] [Scilit]
- Beyglou, A. Target fragmentation for efficient loading and crushing—The Aitik case. J. S. Afr. Inst. Min. Metall. 2017, 117, 1053–1062. [Google Scholar] [CrossRef] [Scilit]
- Dotto, M.S.; Pourrahimian, Y. Effects of Fragmentation Size Distribution on Truck-Shovel Productivity. 2018. Available online: https://api.semanticscholar.org/CorpusID:231707378 (accessed on 1 December 2025).
- Esen, S.; Daniel, M.; Dzhalolov, B.; Bachramov, B.; Geronimo, J.; Kalmatayev, A. Drill-to-Mill Plant Optimization at Altynalmas Pustynnoye Gold Mine. In Proceedings of the SAG Conference 2019, Vancouver, BC, Canada, 22–26 September 2019. [Google Scholar]
- Park, J.; Kim, K. Use of drilling performance to improve rock-breakage efficiencies: A part of mine-to-mill optimization studies in a hard-rock mine. Int. J. Min. Sci. Technol. 2020, 30, 179–188. [Google Scholar] [CrossRef] [Scilit]
- Rafeeian, N.; Taji, M.; Nikkhah, A. Mine to mill optimisation in Sarcheshmeh copper mine, Kerman, Iran. In Proceedings of the Helsinki Conference Proceedings, Helsinki, Finland, 13–14 June 2019; pp. 169–183. [Google Scholar]
- Faramarzi, F.; Kanchibotla, S.S.; Morrison, R. Simulating the impact of ore competence variability on process performance -Case study of a large copper mine. In Proceedings of the SAG Conference 2019, Vancouver, BC, Canada, 22–26 September 2019. [Google Scholar]
- Amini, E.; Becerra, M.; Bachmann, T.; Beaton, N.; Shapland, G. Development and Reconciliation of a Mine Operation Value Chain Flowsheet in IES to Enable Grade Engineering and Process Mass Simulations for Scale-up and Strategic Planning Analysis. Min. Metall. Explor. 2021, 38, 721–730. [Google Scholar] [CrossRef] [Scilit]
- Ghahramanieisalou, M.; Sattarvand, J. Applications of Digital Twin Technology in Productivity Optimization of Mining Operations. In Proceedings of the APCOM 2023 Proceedings: Intelligent Mining: Innovation, Vision, and Value, Rapid City, SD, USA, 25–28 June 2023. [Google Scholar]
- Amini, E.; Koh, E.J.Y.; Becerra, M.; Jarad, C.; Beaton, N. Development of Machine Learning Models using IES-ModelNet application for fast simulation of operation response to blocks of the resource block model. In Proceedings of the 26th World Mining Congress (WMC 2023), Brisbane, QLD, Australia, 26–29 June 2023; World Mining Congress: Brisbane, QLD, Australia, 2023. ISBN 978-0-646-87565-1. [Google Scholar]
- Hosseini, S.; Mousavi, A.; Monjezi, M.; Khandelwal, M. Mine-to-crusher policy: Planning of mine blasting patterns for environmentally friendly and optimum fragmentation using Monte Carlo simulation-based multi-objective grey wolf optimization approach. Resour. Policy 2022, 79, 103087. [Google Scholar] [CrossRef] [Scilit]
- Torres, V.F.N.; Figueiredo, J.R.; De La Hoz, R.C.; Botaro, M.; Chaves, L.S. A Mine-to-Crusher Model to Minimize Costs at a Truckless Open-Pit Iron Mine in Brazil. Minerals 2022, 12, 1037. [Google Scholar] [CrossRef] [Scilit]
- Hanhiniemi, J.; Heo, J. Digital Solutions to Evaluate Ball Mill Circuit Recirculating Load and Performance. In Proceedings of the MEI Comminution 2023, Cape Town, South Africa, 17–20 April 2023. [Google Scholar]
- Rigol-Sanchez, J.P.; Chica-Olmo, M.; Abarca-Hernandez, F. Artificial neural networks as a tool for mineral potential mapping with GIS. Int. J. Remote Sens. 2003, 24, 1151–1156. [Google Scholar] [CrossRef] [Scilit]
- Setyadi, H.; Widodo, L.E.; Notosiswoyo, S.; Saptawati, P.; Ismanto, A.; Hardjana, I. GIS modeling using fuzzy logic approach in mineral prospecting based on geophysical data. AIP Conf. Proc. 2016, 1711, 070002. [Google Scholar] [CrossRef] [Scilit]
- Harris, D.; Pan, G. Mineral favorability mapping: A comparison of artificial neural networks, logistic regression, and discriminant analysis. Nat. Resour. Res. 1999, 8, 93–109. [Google Scholar] [CrossRef] [Scilit]
- Rodriguez-Galiano, V.; Sanchez-Castillo, M.; Chica-Olmo, M.; Chica-Rivas, M. Machine learning predictive models for mineral prospectivity: An evaluation of neural networks, random forest, regression trees and support vector machines. Ore Geol. Rev. 2015, 71, 804–818. [Google Scholar] [CrossRef] [Scilit]
- Acosta, I.C.C.; Khodadadzadeh, M.; Tusa, L.; Ghamisi, P.; Gloaguen, R. A Machine Learning Framework for Drill-Core Mineral Mapping Using Hyperspectral and High-Resolution Mineralogical Data Fusion. IEEE J. Sel. Top. Appl. Earth Obs. Remote Sens. 2019, 12, 4829–4842. [Google Scholar] [CrossRef] [Scilit]
- Rahman, A.; Shahriar, M.S.; Timms, G.; Lindley, C.; Davie, A.B.; Biggins, D.; Hellicar, A.; Sennersten, C.; Smith, G.; Coombe, M. A machine learning approach to find association between imaging features and XRF signatures of rocks in underground mines. In Proceedings of the 2015 IEEE SENSORS, Busan, Republic of Korea, 1–4 November 2015; IEEE: New York, NY, USA, 2015; pp. 1–4. [Google Scholar] [CrossRef] [Scilit]
- Hood, S.B.; Cracknell, M.J.; Gazley, M.F. Linking protolith rocks to altered equivalents by combining unsupervised and supervised machine learning. J. Geochem. Explor. 2018, 186, 270–280. [Google Scholar] [CrossRef] [Scilit]
- Díez-Pastor, J.F.; Jorge-Villar, S.E.; Arnaiz-González, Á.; García-Osorio, C.I.; Díaz-Acha, Y.; Campeny, M.; Bosch, J.; Melgarejo, J.C. Machine learning algorithms applied to R aman spectra for the identification of variscite originating from the mining complex of G avà. J. Raman Spectrosc. 2020, 51, 1563–1574. [Google Scholar] [CrossRef] [Scilit]
- Bangian, A.; Ataei, M.; Sayadi, A.R.; Gholinejad, A. Fuzzy analytical hierarchy processing to define optimum post mining land use for pit area to clarify reclamation costs. Gospod. Surowcami Miner./Miner. Resour. Manag. 2011, 27, 145–168. [Google Scholar]
- Alipour, A.; Khodaiari, A.A.; Jafari, A.J.; Tavakkoli-Moghaddam, R. Production scheduling of open-pit mines using genetic algorithm: A case study. Int. J. Manag. Sci. Eng. Manag. 2020, 15, 176–183. [Google Scholar] [CrossRef] [Scilit]
- Chicoisne, R.; Espinoza, D.; Goycoolea, M.; Moreno, E.; Rubio, E. A new algorithm for the open-pit mine production scheduling problem. Oper. Res. 2012, 60, 517–528. [Google Scholar] [CrossRef] [Scilit]
- Jélvez, E.; Morales, N.; Askari-Nasab, H. A new model for automated pushback selection. Comput. Oper. Res. 2020, 115, 104456. [Google Scholar] [CrossRef] [Scilit]
- Jélvez, E.; Morales, N.; Nancel-Penard, P.; Cornillier, F. A new hybrid heuristic algorithm for the Precedence Constrained Production Scheduling Problem: A mining application. Omega 2020, 94, 102046. [Google Scholar] [CrossRef] [Scilit]
- Guo, H.; Nguyen, H.; Vu, D.-A.; Bui, X.-N. Forecasting mining capital cost for open-pit mining projects based on artificial neural network approach. Resour. Policy 2021, 74, 101474. [Google Scholar] [CrossRef] [Scilit]
- Nourali, H.; Osanloo, M. A regression-tree-based model for mining capital cost estimation. Int. J. Min. Reclam. Environ. 2020, 34, 88–100. [Google Scholar] [CrossRef] [Scilit]
- Paduraru, C.; Dimitrakopoulos, R. Responding to new information in a mining complex: Fast mechanisms using machine learning. Min. Technol. 2019, 128, 129–142. [Google Scholar] [CrossRef] [Scilit]
- Bazzazi, A.A.; Osanloo, M.; Karimi, B. A new fuzzy multi criteria decision making model for open pit mines equipment selection. Asia-Pacific J. Oper. Res. 2011, 28, 279–300. [Google Scholar] [CrossRef] [Scilit]
- Ortiz, C.E.A.; Curi, A.; Campos, P.H. The use of simulation in fleet selection and equipment sizing in mining. In Mine Planning and Equipment Selection; Drebenstedt, C., Singhal, R., Eds.; Springer International Publishing: Cham, Switzerland, 2014; pp. 869–877. [Google Scholar]
- Nobahar, P.; Pourrahimian, Y.; Koshki, F.M. Optimum Fleet Selection Using Machine Learning Algorithms—Case Study: Zenouz Kaolin Mine. Mining 2022, 2, 528–541. [Google Scholar] [CrossRef] [Scilit]
- Faradonbeh, R.S.; Armaghani, D.J.; Monjezi, M. Development of a new model for predicting flyrock distance in quarry blasting: A genetic programming technique. Bull. Eng. Geol. Environ. 2016, 75, 993–1006. [Google Scholar] [CrossRef] [Scilit]
- Monjezi, M.; Rezaei, M.; Yazdian, A. Prediction of backbreak in open-pit blasting using fuzzy set theory. Expert Syst. Appl. 2010, 37, 2637–2643. [Google Scholar] [CrossRef] [Scilit]
- Shams, S.; Monjezi, M.; Majd, V.J.; Armaghani, D.J. Application of fuzzy inference system for prediction of rock fragmentation induced by blasting. Arab. J. Geosci. 2015, 8, 10819–10832. [Google Scholar] [CrossRef] [Scilit]
- Ghasemi, E.; Amini, H.; Ataei, M.; Khalokakaei, R. Application of artificial intelligence techniques for predicting the flyrock distance caused by blasting operation. Arab. J. Geosci. 2014, 7, 193–202. [Google Scholar] [CrossRef] [Scilit]
- Nobahar, P.; Faradonbeh, R.S.; Almasi, S.N.; Bastami, R. Advanced AI-Powered Solutions for Predicting Blast-Induced Flyrock, Backbreak, and Rock Fragmentation. Min. Metall. Explor. 2024, 41, 2099–2118. [Google Scholar] [CrossRef] [Scilit]
- Park, S.; Choi, Y.; Park, H. Optimization of truck-loader haulage systems in an underground mine using simulation methods. Geosystem Eng. 2016, 19, 222–231. [Google Scholar] [CrossRef] [Scilit]
- Moradi-Afrapoli, A.; Upadhyay, S.; Askari-Nasab, H. Truck dispatching in surface mines—Application of fuzzy linear programming. J. S. Afr. Inst. Min. Metall. 2021, 121, 1–8. [Google Scholar] [CrossRef] [Scilit]
- de Carvalho, J.P.; Dimitrakopoulos, R. Integrating Production Planning with Truck-Dispatching Decisions through Reinforcement Learning While Managing Uncertainty. Minerals 2021, 11, 587. [Google Scholar] [CrossRef] [Scilit]
- Cook, R.; Monyake, K.C.; Hayat, M.B.; Kumar, A.; Alagha, L. Prediction of flotation efficiency of metal sulfides using an original hybrid machine learning model. Eng. Rep. 2020, 2, e12167. [Google Scholar] [CrossRef] [Scilit]
- Jahedsaravani, A.; Marhaban, M.H.; Massinaei, M. Prediction of the metallurgical performances of a batch flotation system by image analysis and neural networks. Miner. Eng. 2014, 69, 137–145. [Google Scholar] [CrossRef] [Scilit]
- Bonifazi, G.; Serranti, S.; Volpe, F.; Zuco, R. Characterisation of flotation froth colour and structure by machine vision. Comput. Geosci. 2001, 27, 1111–1117. [Google Scholar] [CrossRef] [Scilit]
- Nayak, D.; Das, D.; Behera, S.; Prasad, S. Monitoring the fill level of a ball mill using vibration sensing and artificial neural network. Neural Comput. Appl. 2020, 32, 1501–1511. [Google Scholar] [CrossRef] [Scilit]
- Horn, Z.C.; Auret, L.; McCoy, J.T.; Aldrich, C.; Herbst, B.M. Performance of Convolutional Neural Networks for Feature Extraction in Froth Flotation Sensing. IFAC-PapersOnLine 2017, 50, 13–18. [Google Scholar] [CrossRef] [Scilit]
- Pu, Y.; Szmigiel, A.; Chen, J.; Apel, D.B. FlotationNet: A hierarchical deep learning network for froth flotation recovery prediction. Powder Technol. 2020, 375, 317–326. [Google Scholar] [CrossRef] [Scilit]
- Pu, Y.; Szmigiel, A.; Apel, D.B. Purities prediction in a manufacturing froth flotation plant: The deep learning techniques. Neural Comput. Appl. 2020, 32, 13639–13649. [Google Scholar] [CrossRef] [Scilit]
- Fiddes, C.; Olcott, J.; Webber, T. Technical Report on the Cortez Complex, Lander and Eureka Counties; Nevada Bureau of Mines and Geology: Reno, NV, USA, 2020. [Google Scholar]
- Hanhiniemi, J.J. Techno-Economic Multicomponent Analysis of Comminution Using Minerals Processing Simulators. Ph.D. Thesis, The University of Queensland, Brisbane, QLD, Australia, 2023. [Google Scholar] [CrossRef] [Scilit]
- Napier-Munn, T.J.; Morrell, S.; Morrison, R.D.; Kojovic, T. Mineral Comminution Circuits: Their Operation and Optimisation; Julius Kruttschnitt Mineral Research Centre, University of Queensland: Brisbane, QLD, Australia, 1996. [Google Scholar]
- McKee, D.J.; Napier-Munn, T.J. The status of comminution simulation in Australia. Miner. Eng. 1990, 3, 7–21. [Google Scholar] [CrossRef] [Scilit]
- Bartlett, J.; Holtzapple, A.; Rempel, C. A Brief Overview of the Process Modeling/Simulation and Design Capabilities of Metsim. In Proceedings of the Conference of Metallurgists Proceedings, Vancouver, BC, Canada, 28 September–1 October 2014. [Google Scholar]
- Ford, M.A.; King, R.P. The simulation of ore-dressing plants. Int. J. Miner. Process. 1984, 12, 285–304. [Google Scholar] [CrossRef] [Scilit]
- Razavimanesh, A.; Tade, M.; Rumball, J.; Pareek, V. Steady-State Simulation of Hybrid Nickel Leaching Circuit Using Syscad. Chem. Prod. Process Model. 2006, 1. [Google Scholar] [CrossRef] [Scilit]
- Kosick, G.; Dobby, G.; Bennett, C. CEET (Comminution Economic Evaluation Tool) for comminution circuit design and production planning. In Proceedings of the 2001 SME Annual Meeting, Denver, CO, USA, 26–28 February 2001; pp. 26–28. [Google Scholar]
- Dobby, G.; Kosick, G.; Amelunxen, R. A Focus on Variability Within the Orebody for Improved Design of Flotation Plants; Canadian Institute of Mining, Metallurgy and Petroleum: Montreal, QC, Canada, 2002. [Google Scholar]
- Morrison, R.D.; Richardson, J.M. JKSimMet: A simulator for analysis, optimisation and design of comminution circuits. In Proceedings of the Mineral Processing Plant Design Practice and Control: Proceedings, Vancouver, BC, Canada, 20–24 October 2002; SME: Society for Mining, Metallurgy and Exploration: Vancouver, BC, Canada, 2002; pp. 442–460. [Google Scholar]
- Harris, M.C.; Runge, K.C.; Whiten, W.J.; Morrison, R.D. JKSimFloat as a practical tool for flotation process design and optimisation. In Proceedings of the Mineral Processing Plant Design Practice and Control Conference, Vancouver, BC, Canada, 20–24 October 2002; Society for Mining Metallurgy & Exploration: Vancouver, BC, Canada, 2002; pp. 31–40. [Google Scholar]
- Hurwitz, D.K.J. Machine Learning for Absolute Beginners; CreateSpace Independent Publishing Platform: Redmond, WA, USA, 2018. [Google Scholar]
- Strobl, C.; Boulesteix, A.-L.; Zeileis, A.; Hothorn, T. Bias in random forest variable importance measures: Illustrations, sources and a solution. BMC Bioinform. 2007, 8, 25. [Google Scholar] [CrossRef] [Scilit]
- Breiman, L. Random Forests. Mach. Learn. 2001, 45, 5–32. [Google Scholar] [CrossRef] [Scilit]
- Shalev-Shwartz, S.; Ben-David, S. Understanding Machine Learning: From Theory to Algorithms; Cambridge University Press: Cambridge, UK, 2013; p. 9781107057. [Google Scholar] [CrossRef] [Scilit]
- Shaffiee Haghshenas, S.; Shirani Faradonbeh, R.; Mikaeil, R.; Shaffiee Haghshenas, S.; Taheri, A.; Saghatforoush, A.; Dormishi, A. A new conventional criterion for the performance evaluation of gang saw machines. Measurement 2019, 146, 159–170. [Google Scholar] [CrossRef] [Scilit]
- Su, X.; Yan, X.; Tsai, C.-L. Linear regression. Wiley Interdiscip. Rev. Comput. Stat. 2012, 4, 275–294. [Google Scholar] [CrossRef] [Scilit]
- Maulud, D.; Abdulazeez, A.M. A Review on Linear Regression Comprehensive in Machine Learning. J. Appl. Sci. Technol. Trends 2020, 1, 140–147. [Google Scholar] [CrossRef] [Scilit]
- Theobald, O. Machine Learning for Absolute Beginners, 2nd ed.; Packt Publishing Limited: Birmingham, UK, 2017. [Google Scholar]
- Chandrahas, N.S.; Choudhary, B.S.; Teja, M.V.; Venkataramayya, M.S.; Prasad, N.S.R.K. XG Boost Algorithm to Simultaneous Prediction of Rock Fragmentation and Induced Ground Vibration Using Unique Blast Data. Appl. Sci. 2022, 12, 5269. [Google Scholar] [CrossRef] [Scilit]
- Chen, M.; Liu, Q.; Chen, S.; Liu, Y.; Zhang, C.-H.; Liu, R. XGBoost-Based Algorithm Interpretation and Application on Post-Fault Transient Stability Status Prediction of Power System. IEEE Access 2019, 7, 13149–13158. [Google Scholar] [CrossRef] [Scilit]
- Raschka, S.; Mirjalili, V. Python Machine Learning; Packt Publishing Limited: Birmingham, UK, 2019; Volume 69. [Google Scholar]
- Chen, T.; Guestrin, C. XGBoost. In Proceedings of the 22nd ACM SIGKDD International Conference on Knowledge Discovery and Data Mining, San Francisco, CA, USA, 13–16 August 2016; ACM: New York, NY, USA, 2016; pp. 785–794. [Google Scholar] [CrossRef] [Scilit]
- Friedman, J.H. Greedy function approximation: A gradient boosting machine. Ann. Stat. 2001, 29, 1189–1232. [Google Scholar] [CrossRef] [Scilit]
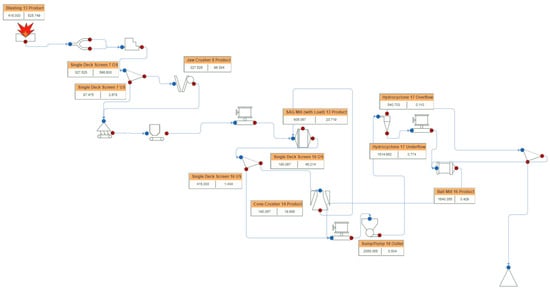
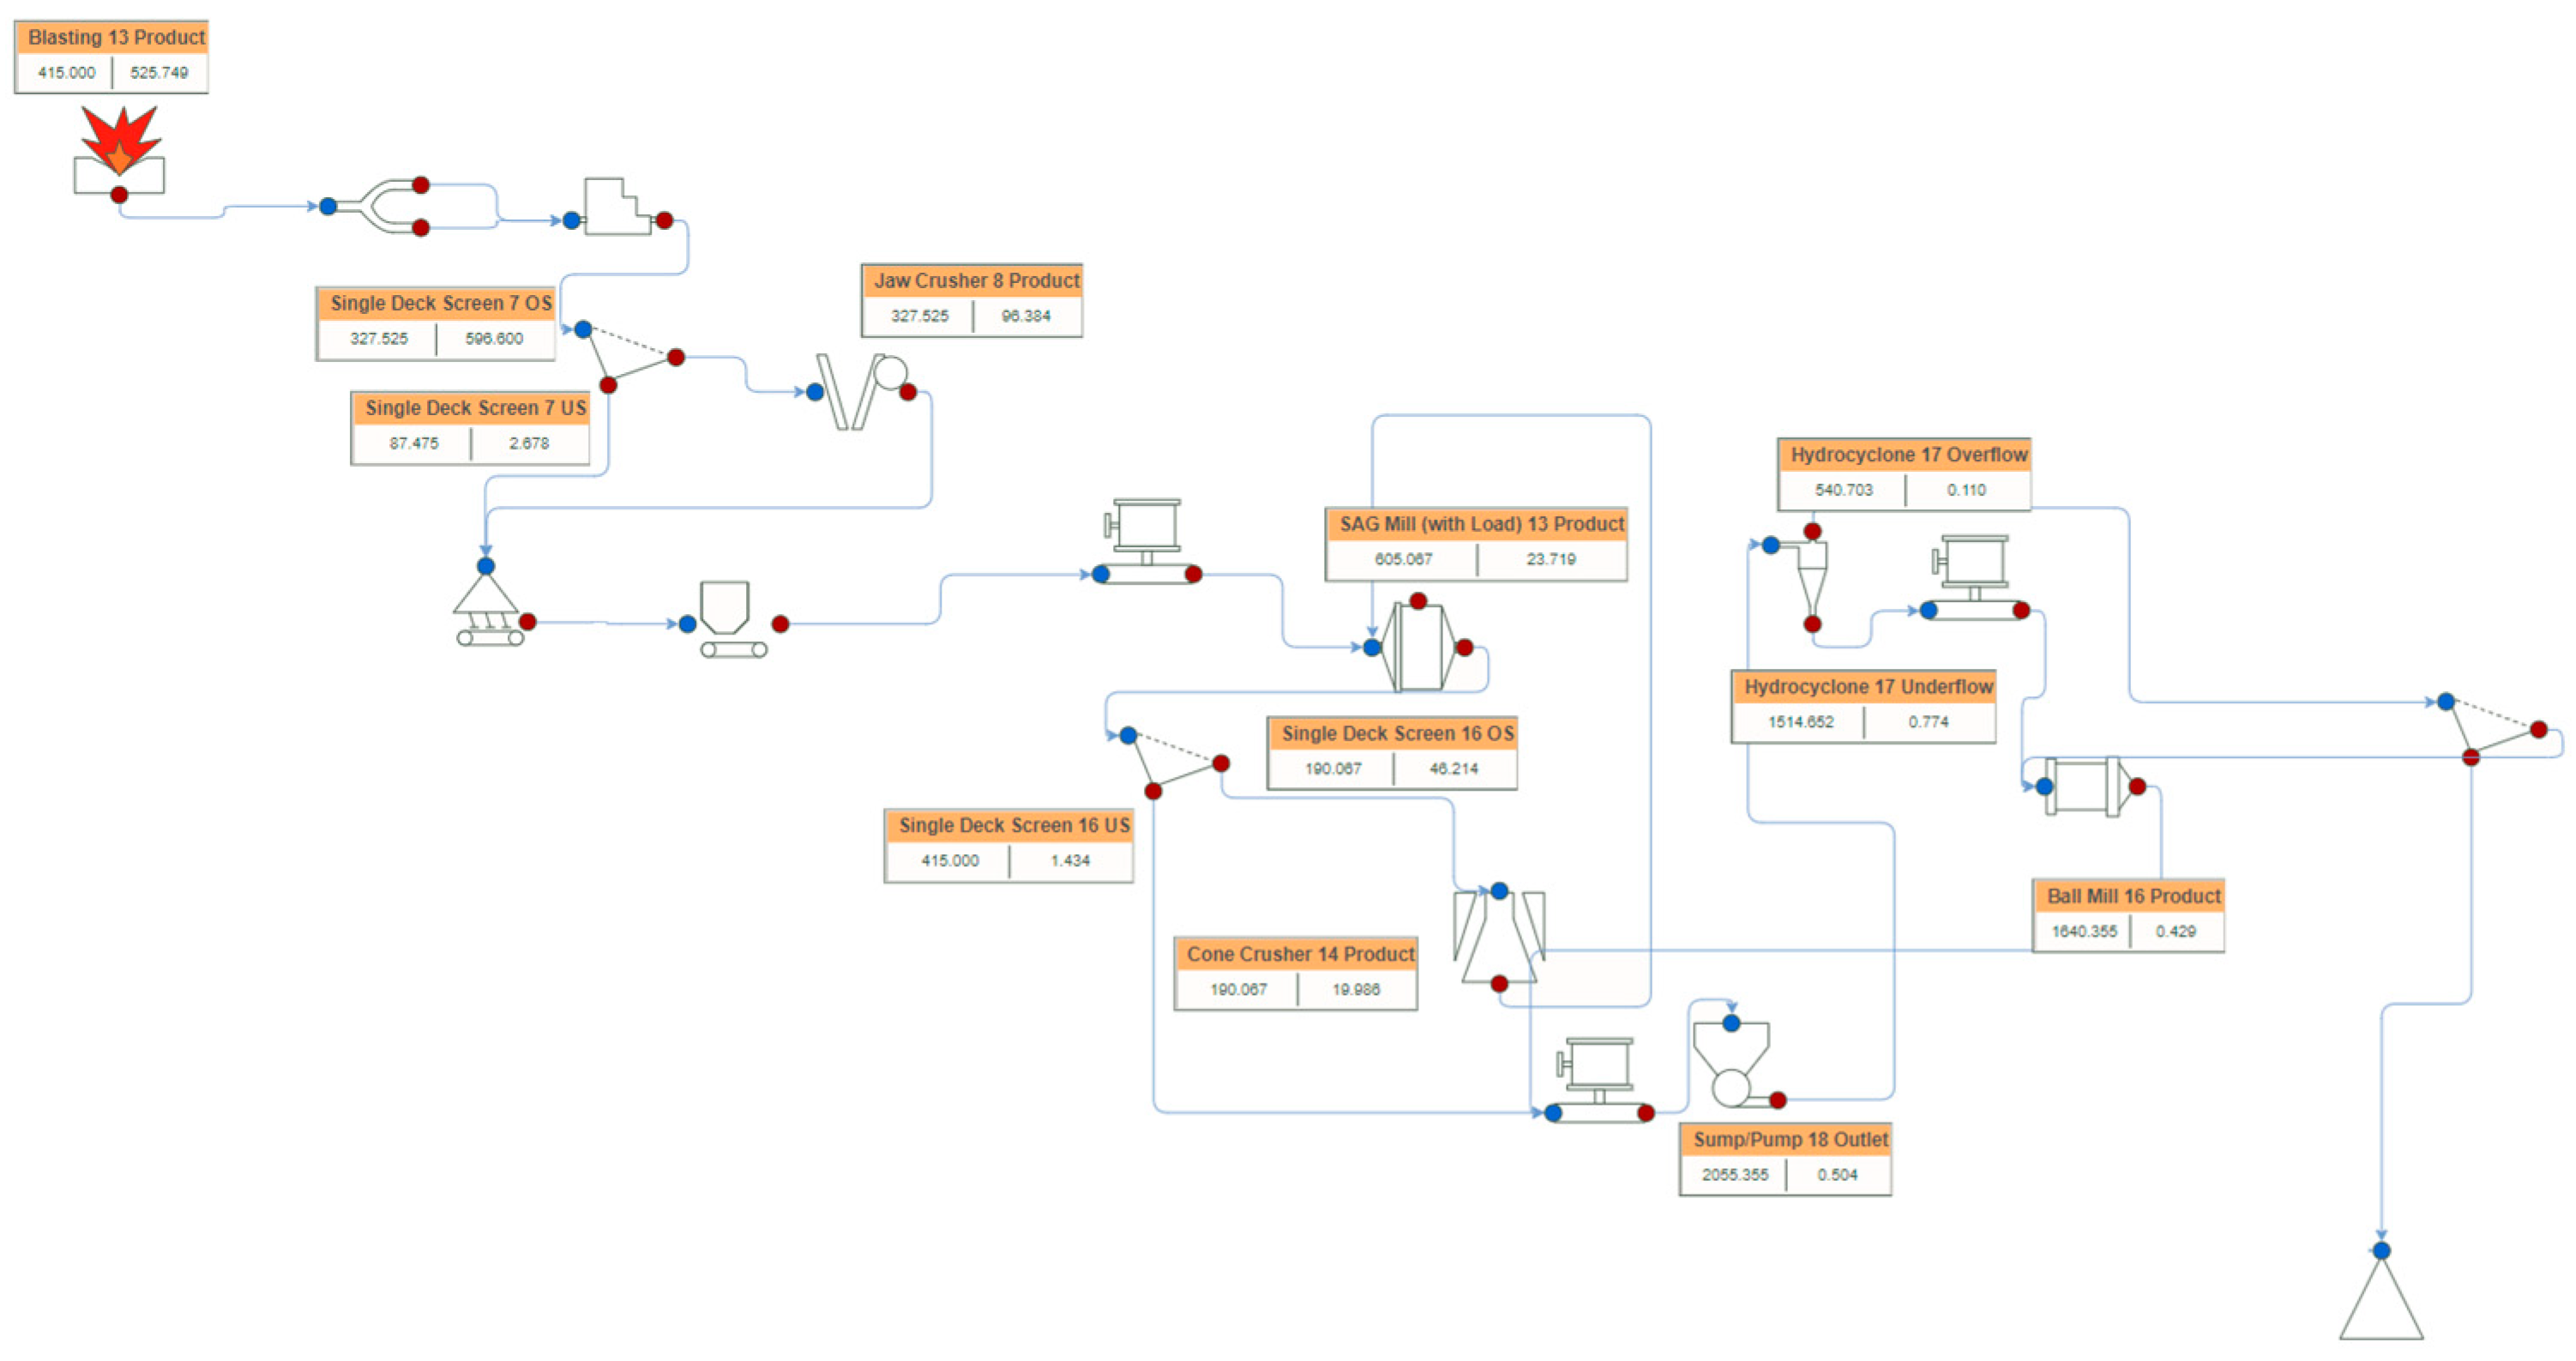
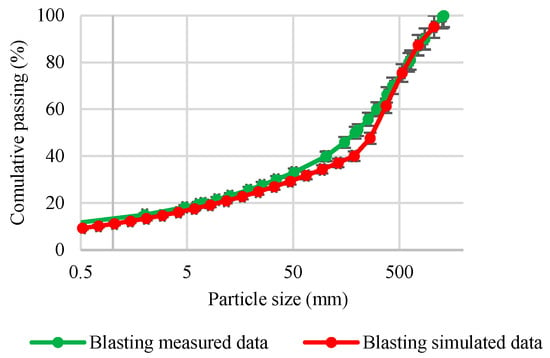
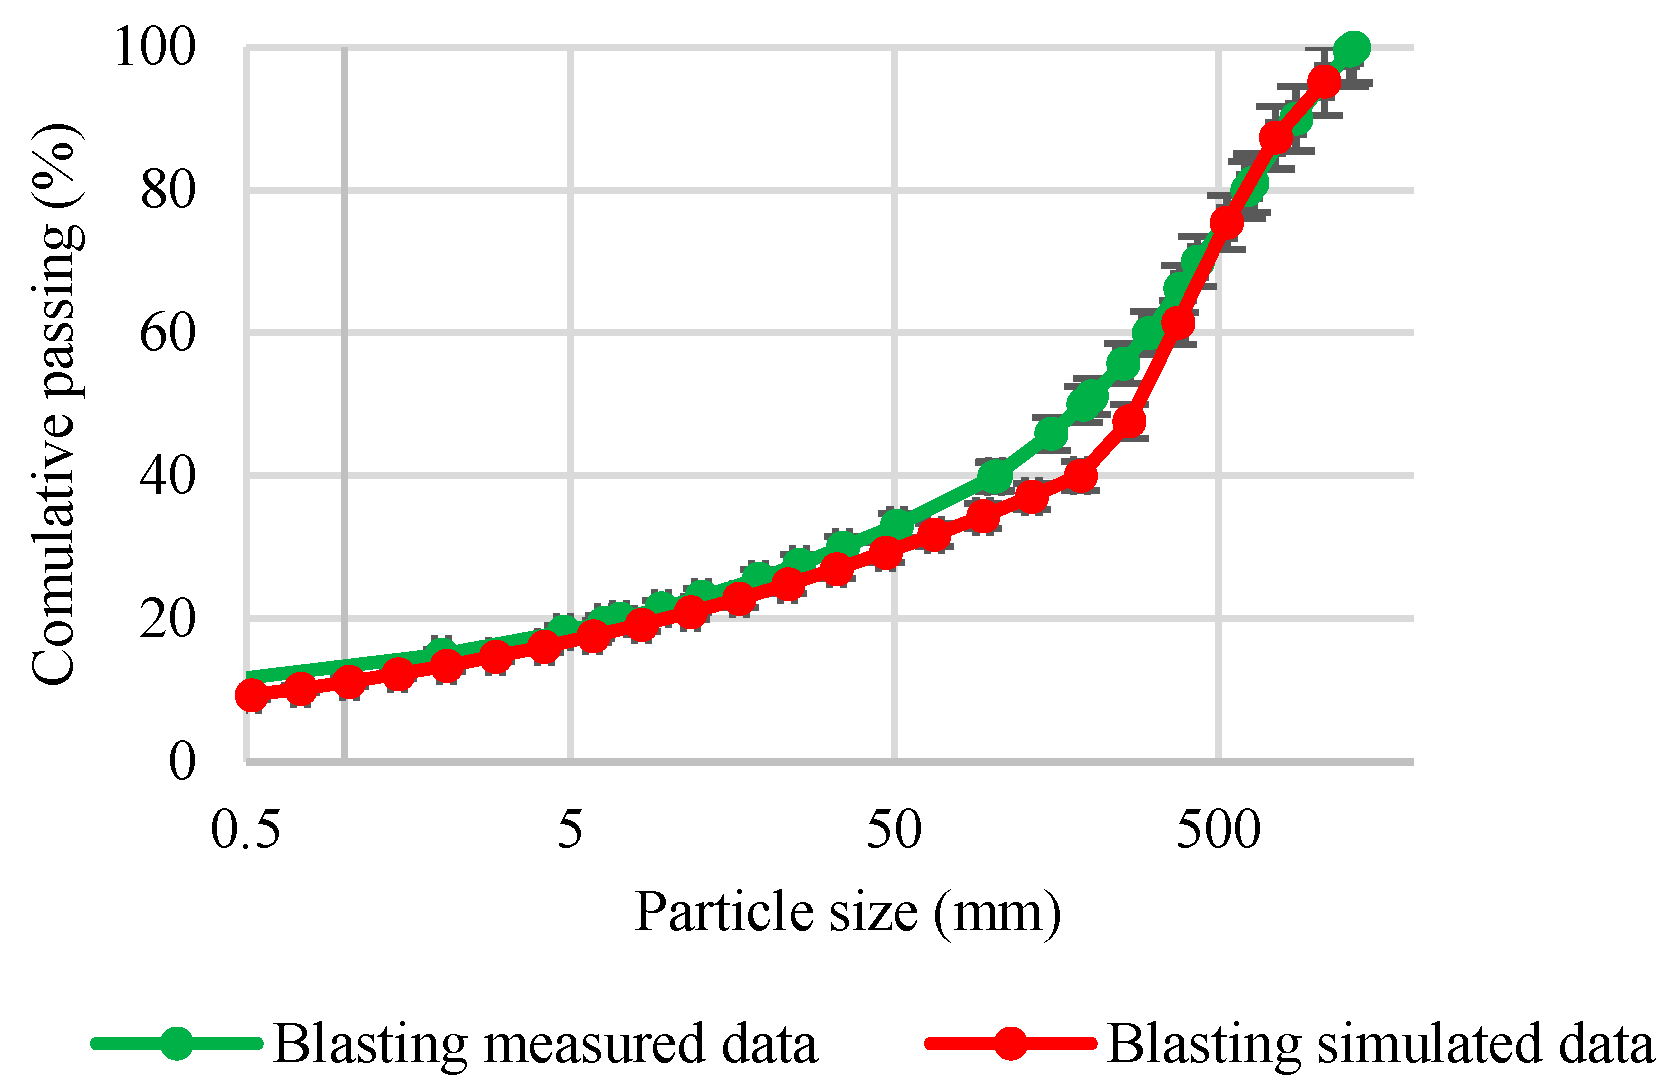
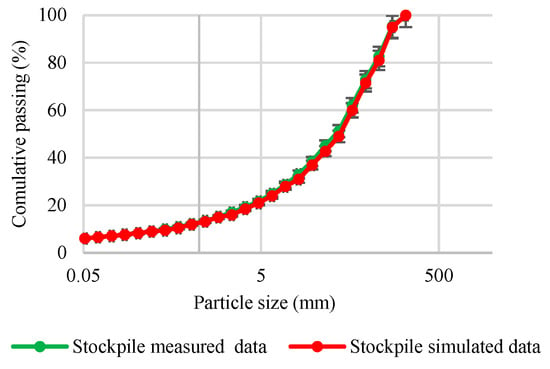
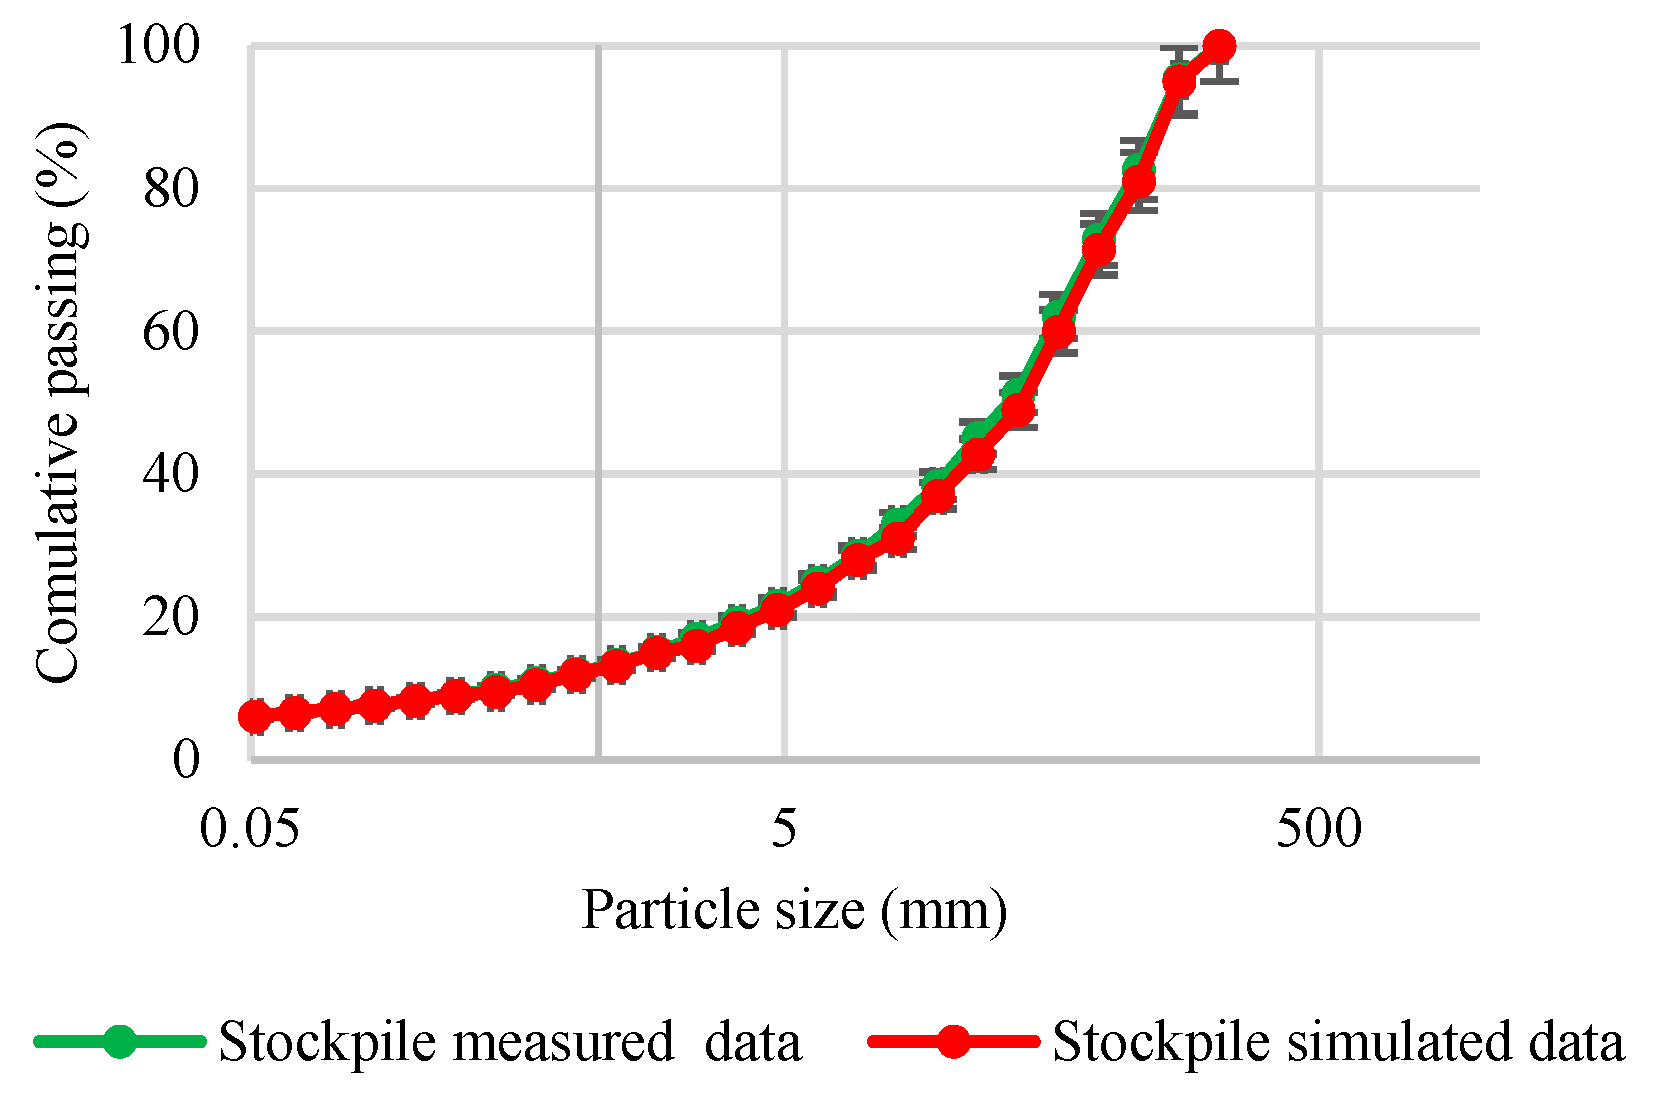
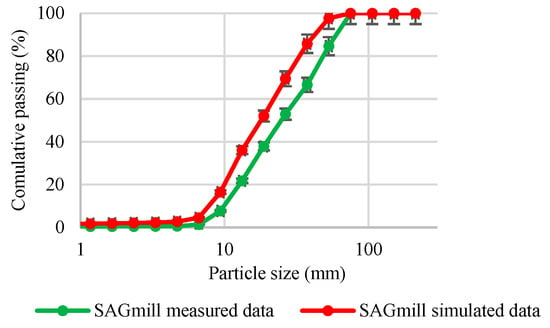
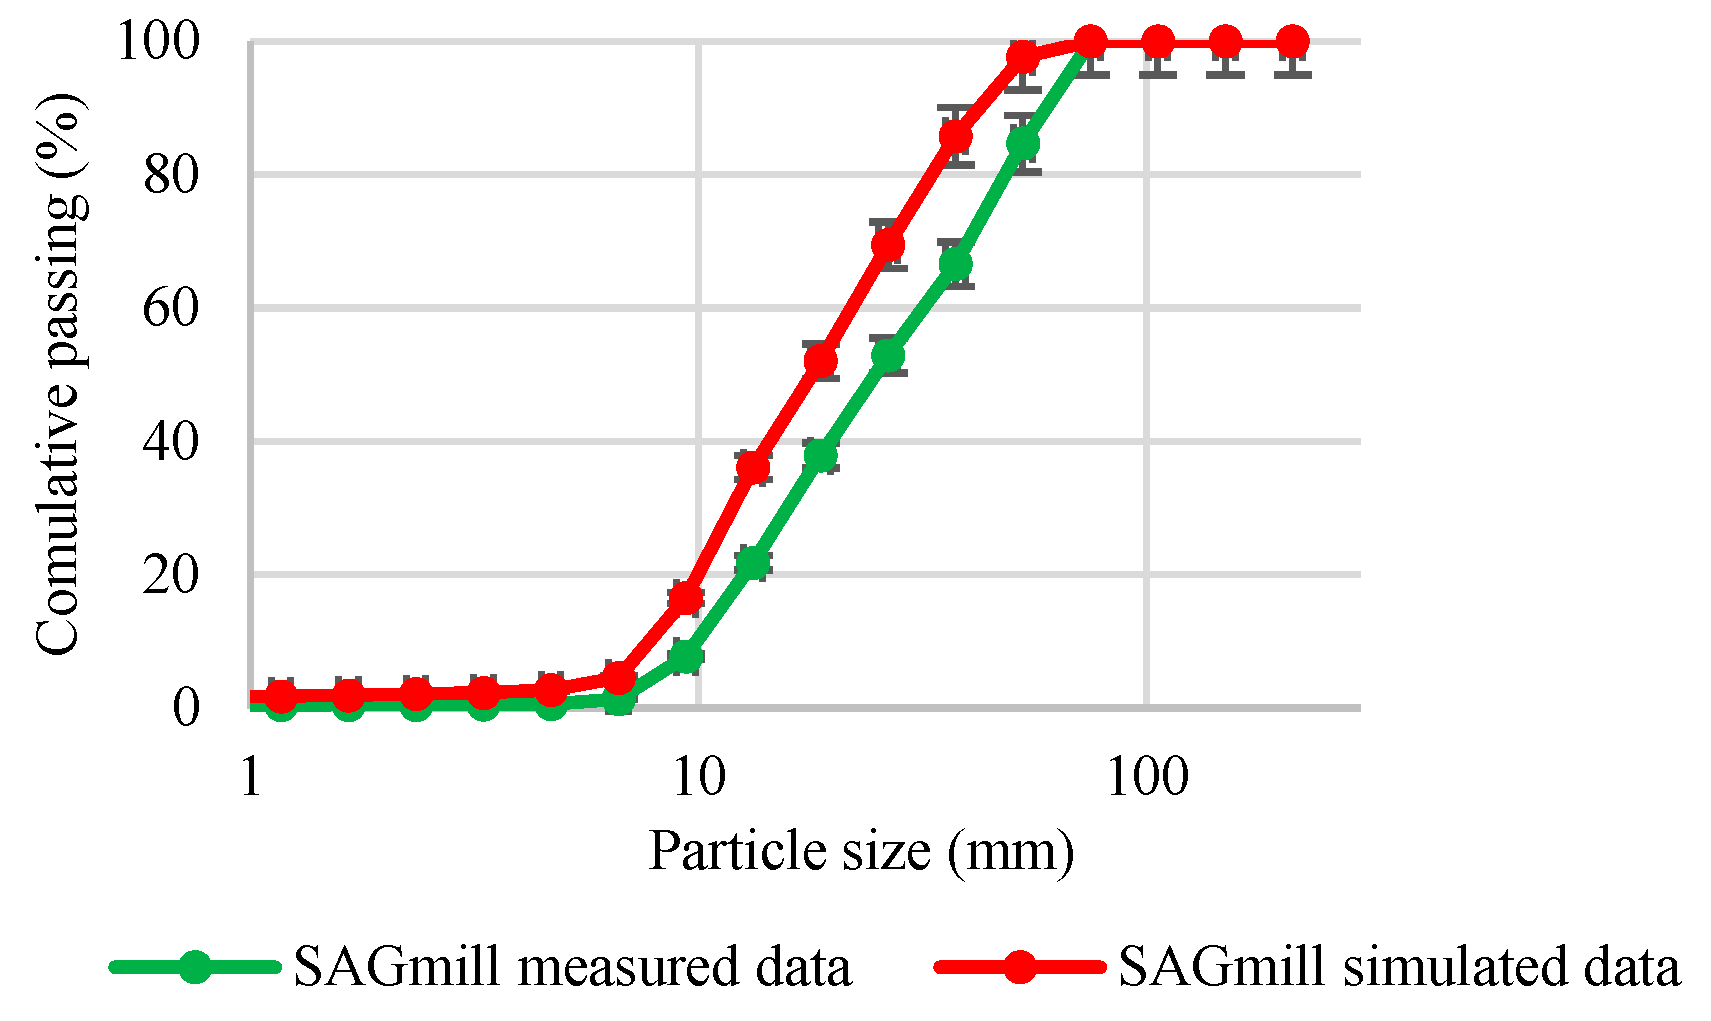
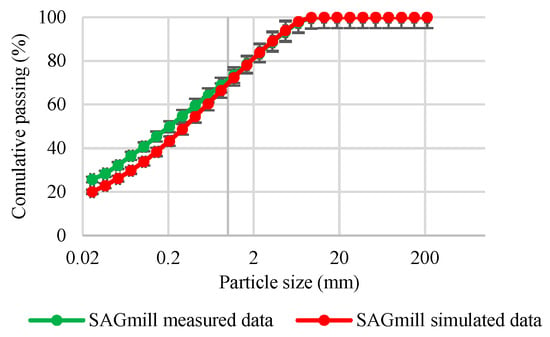
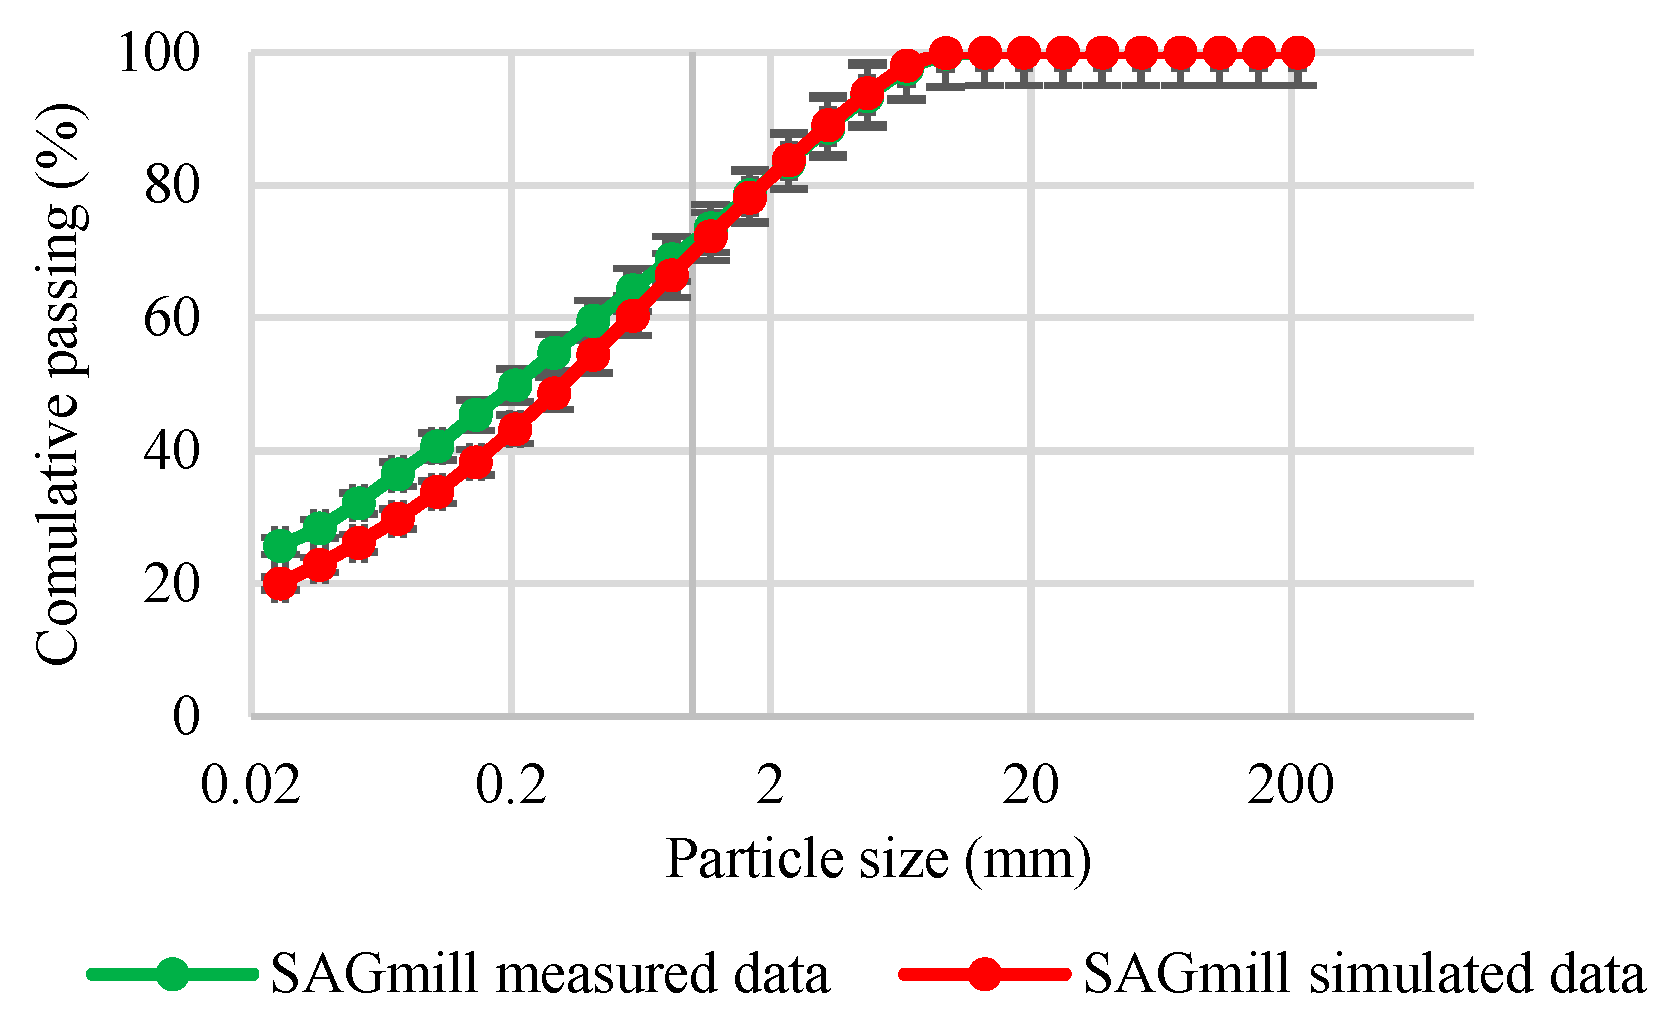
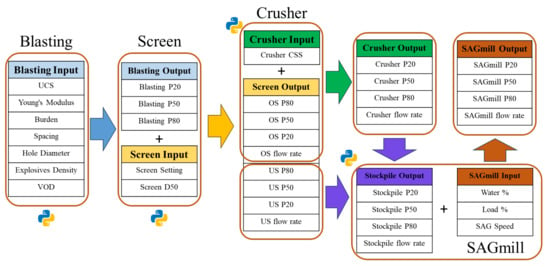
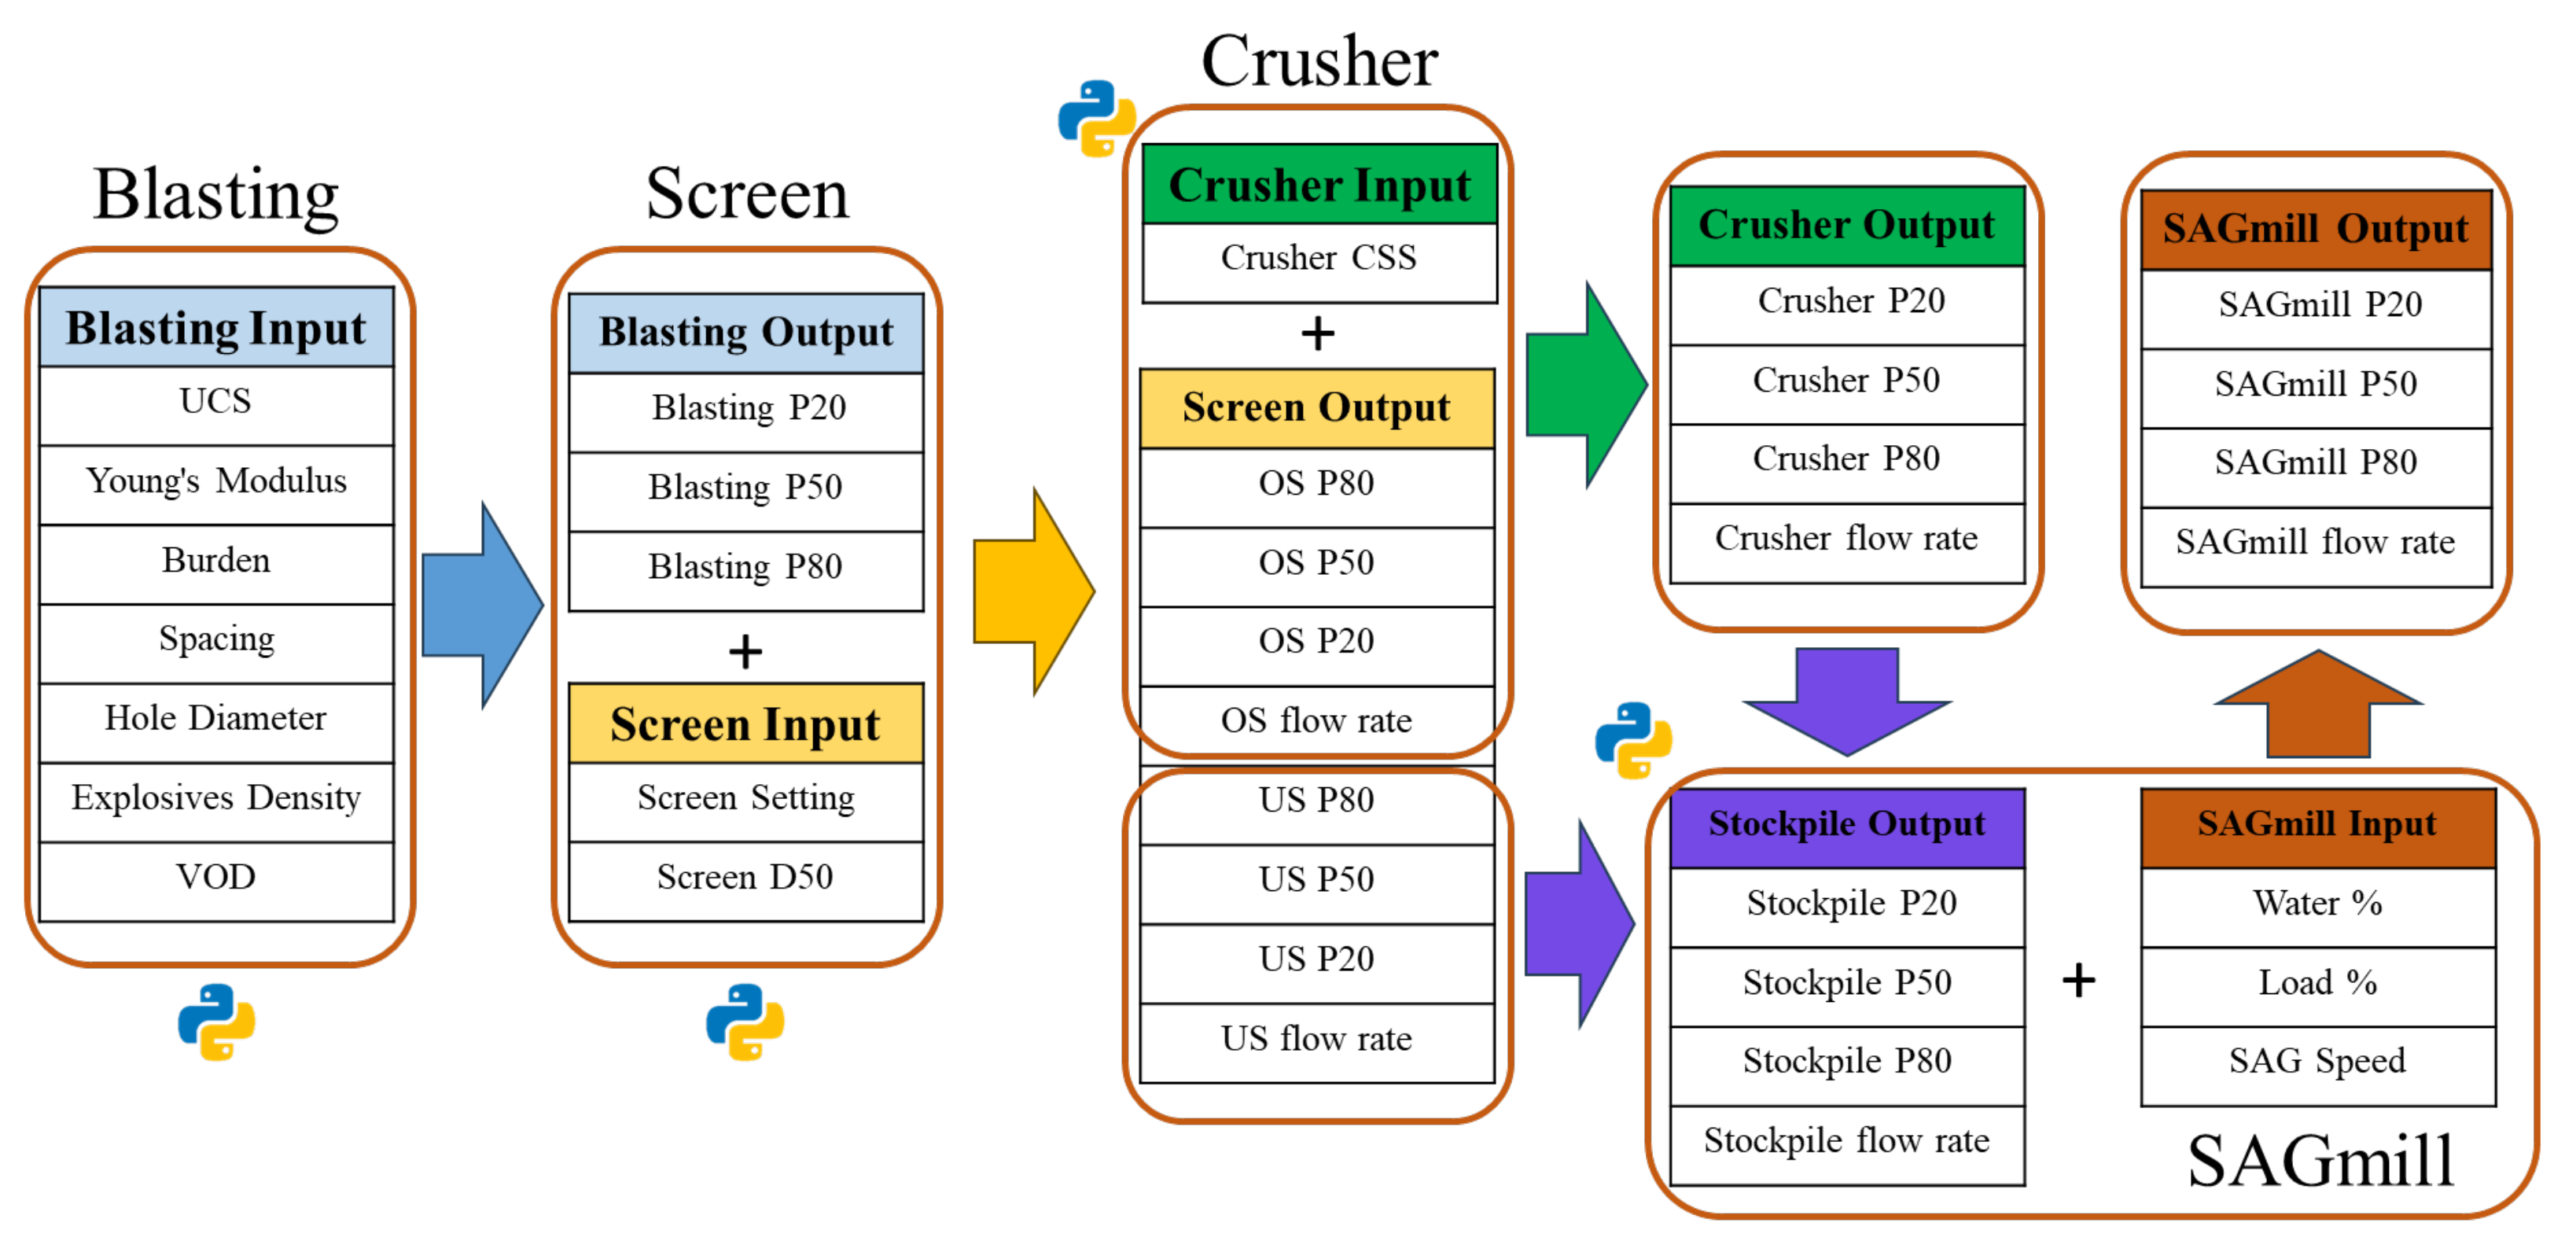
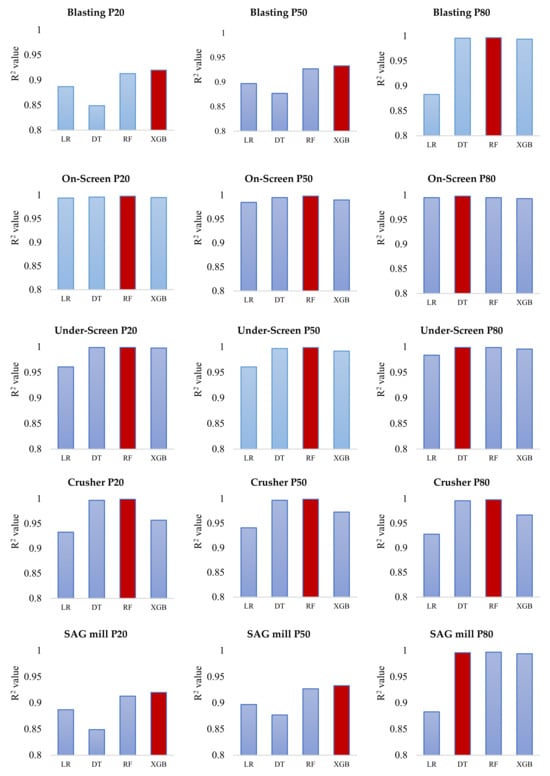
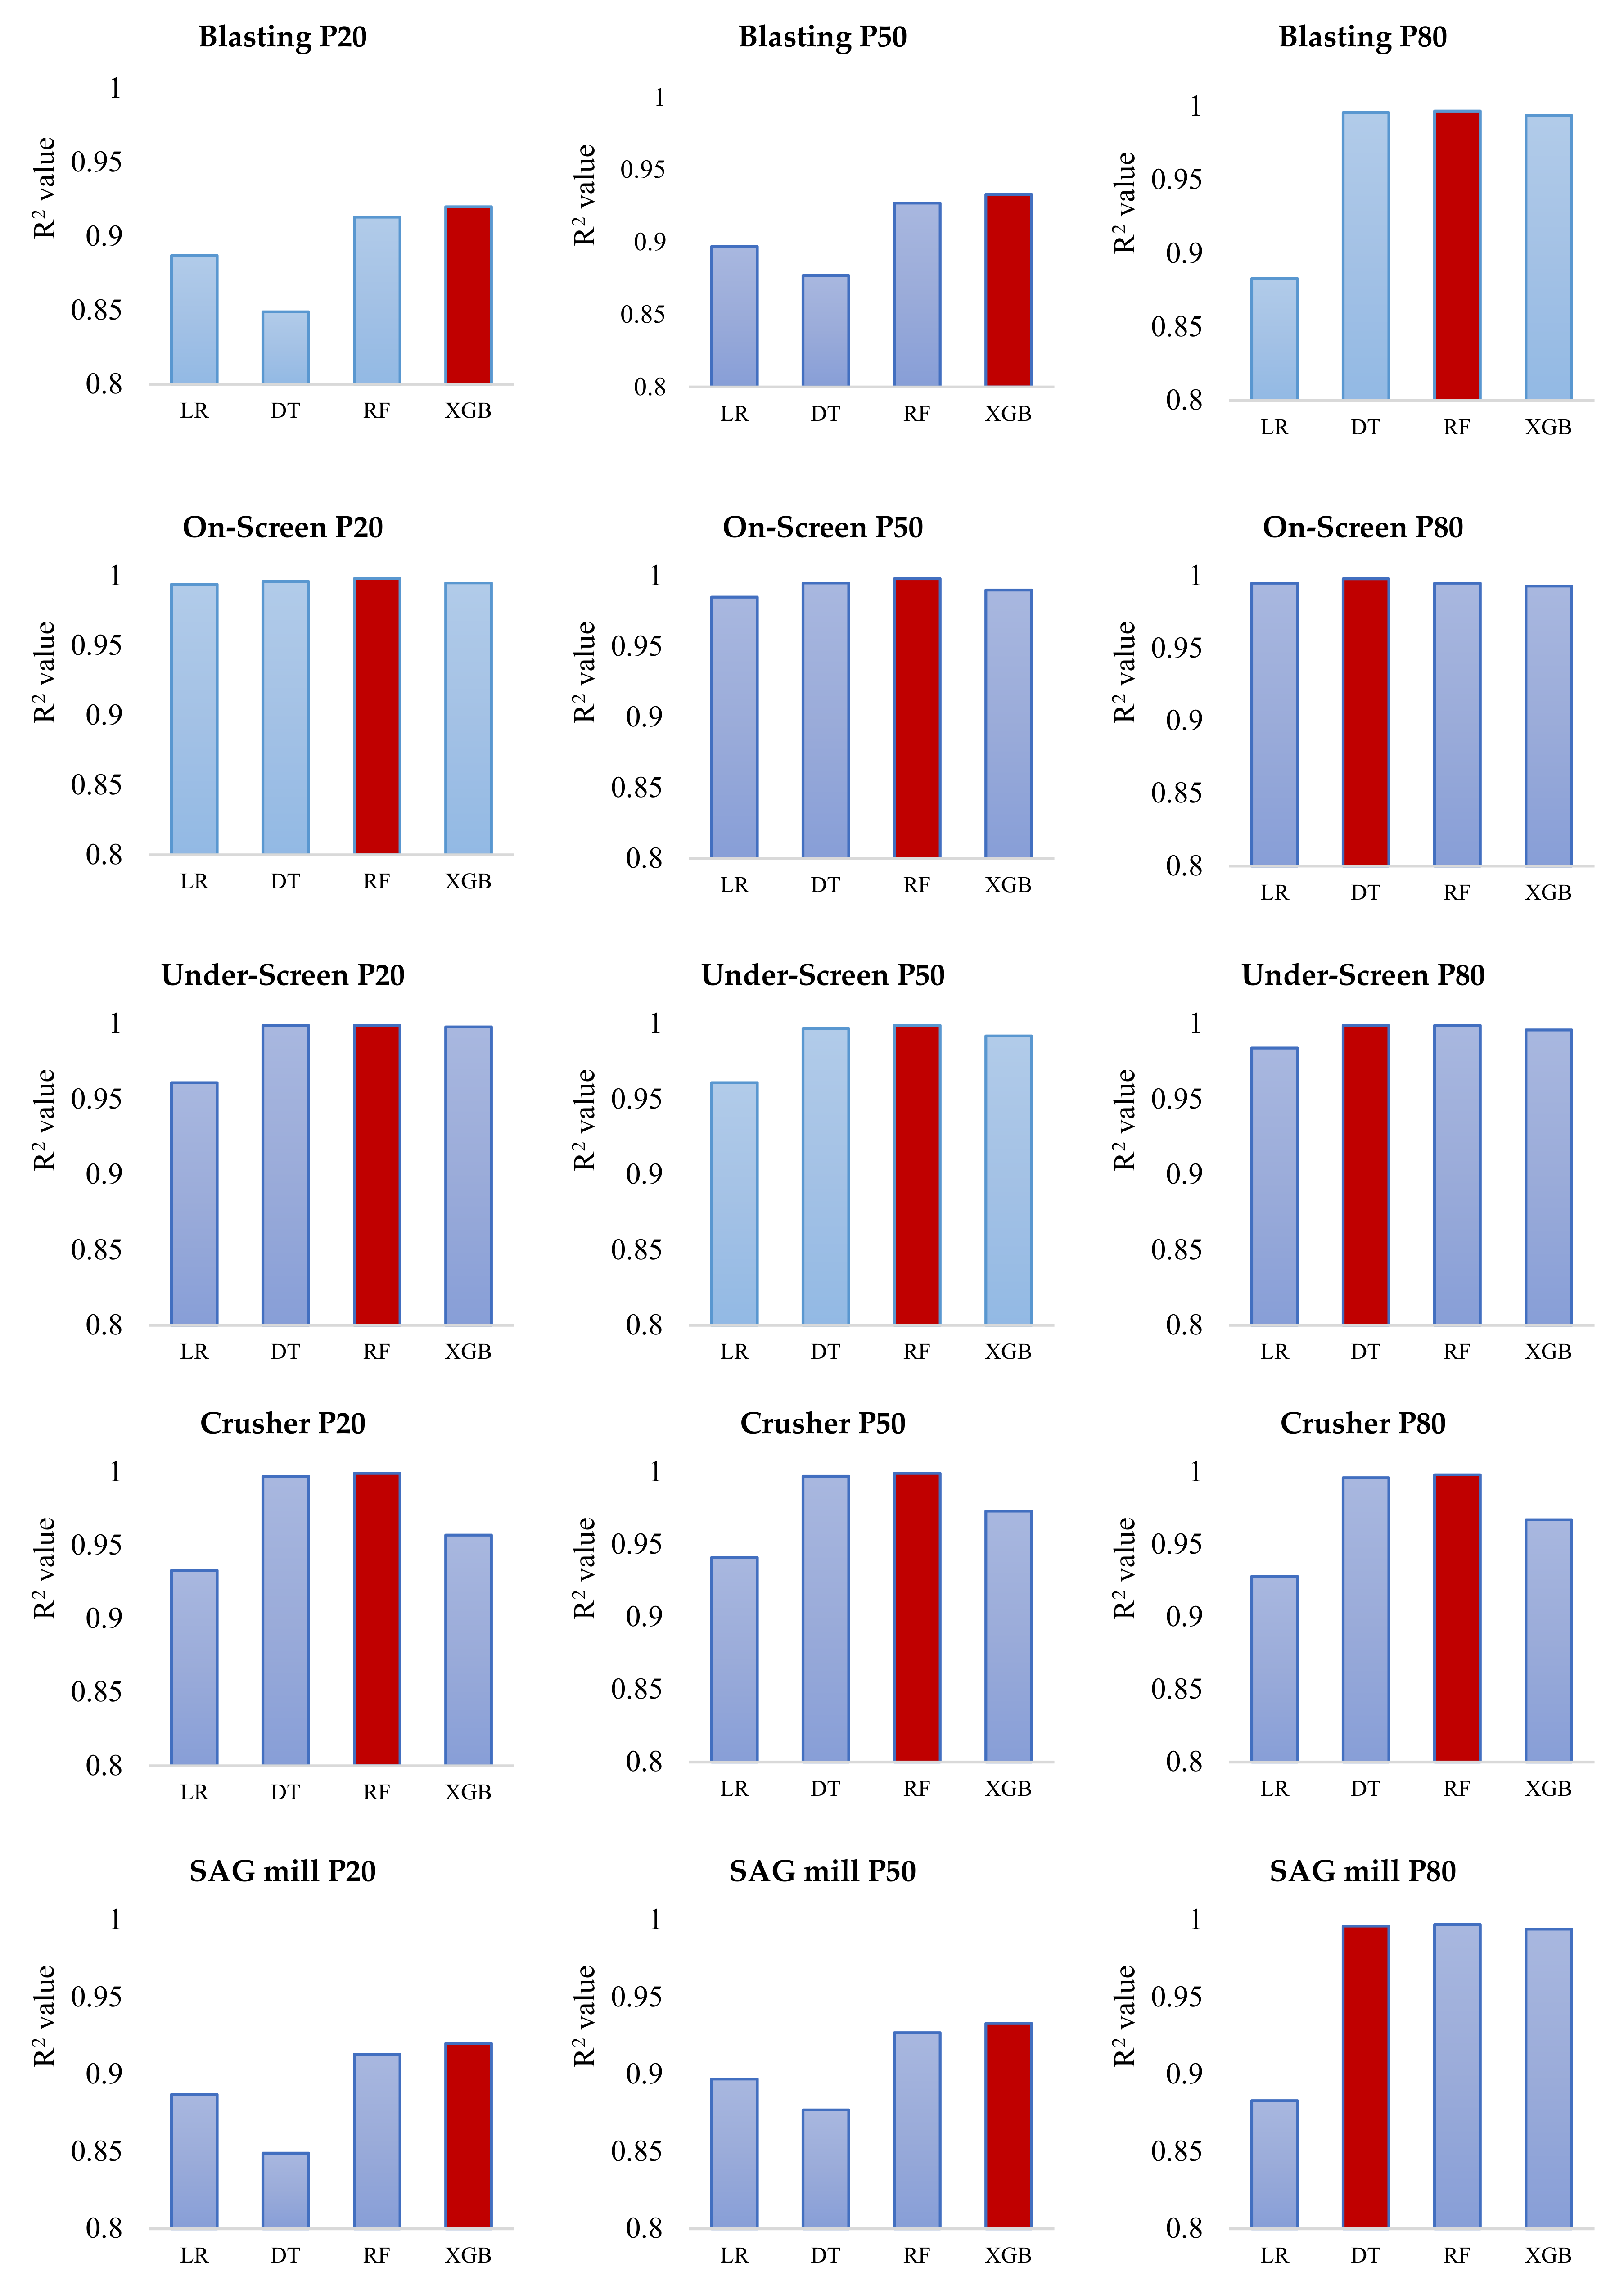
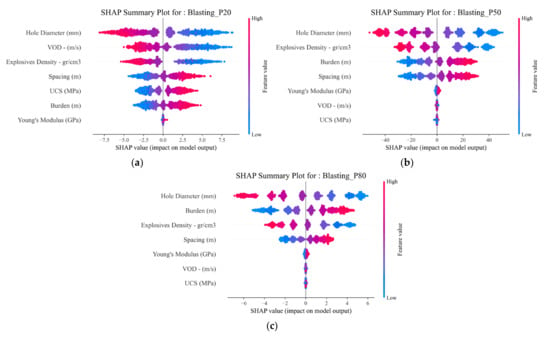
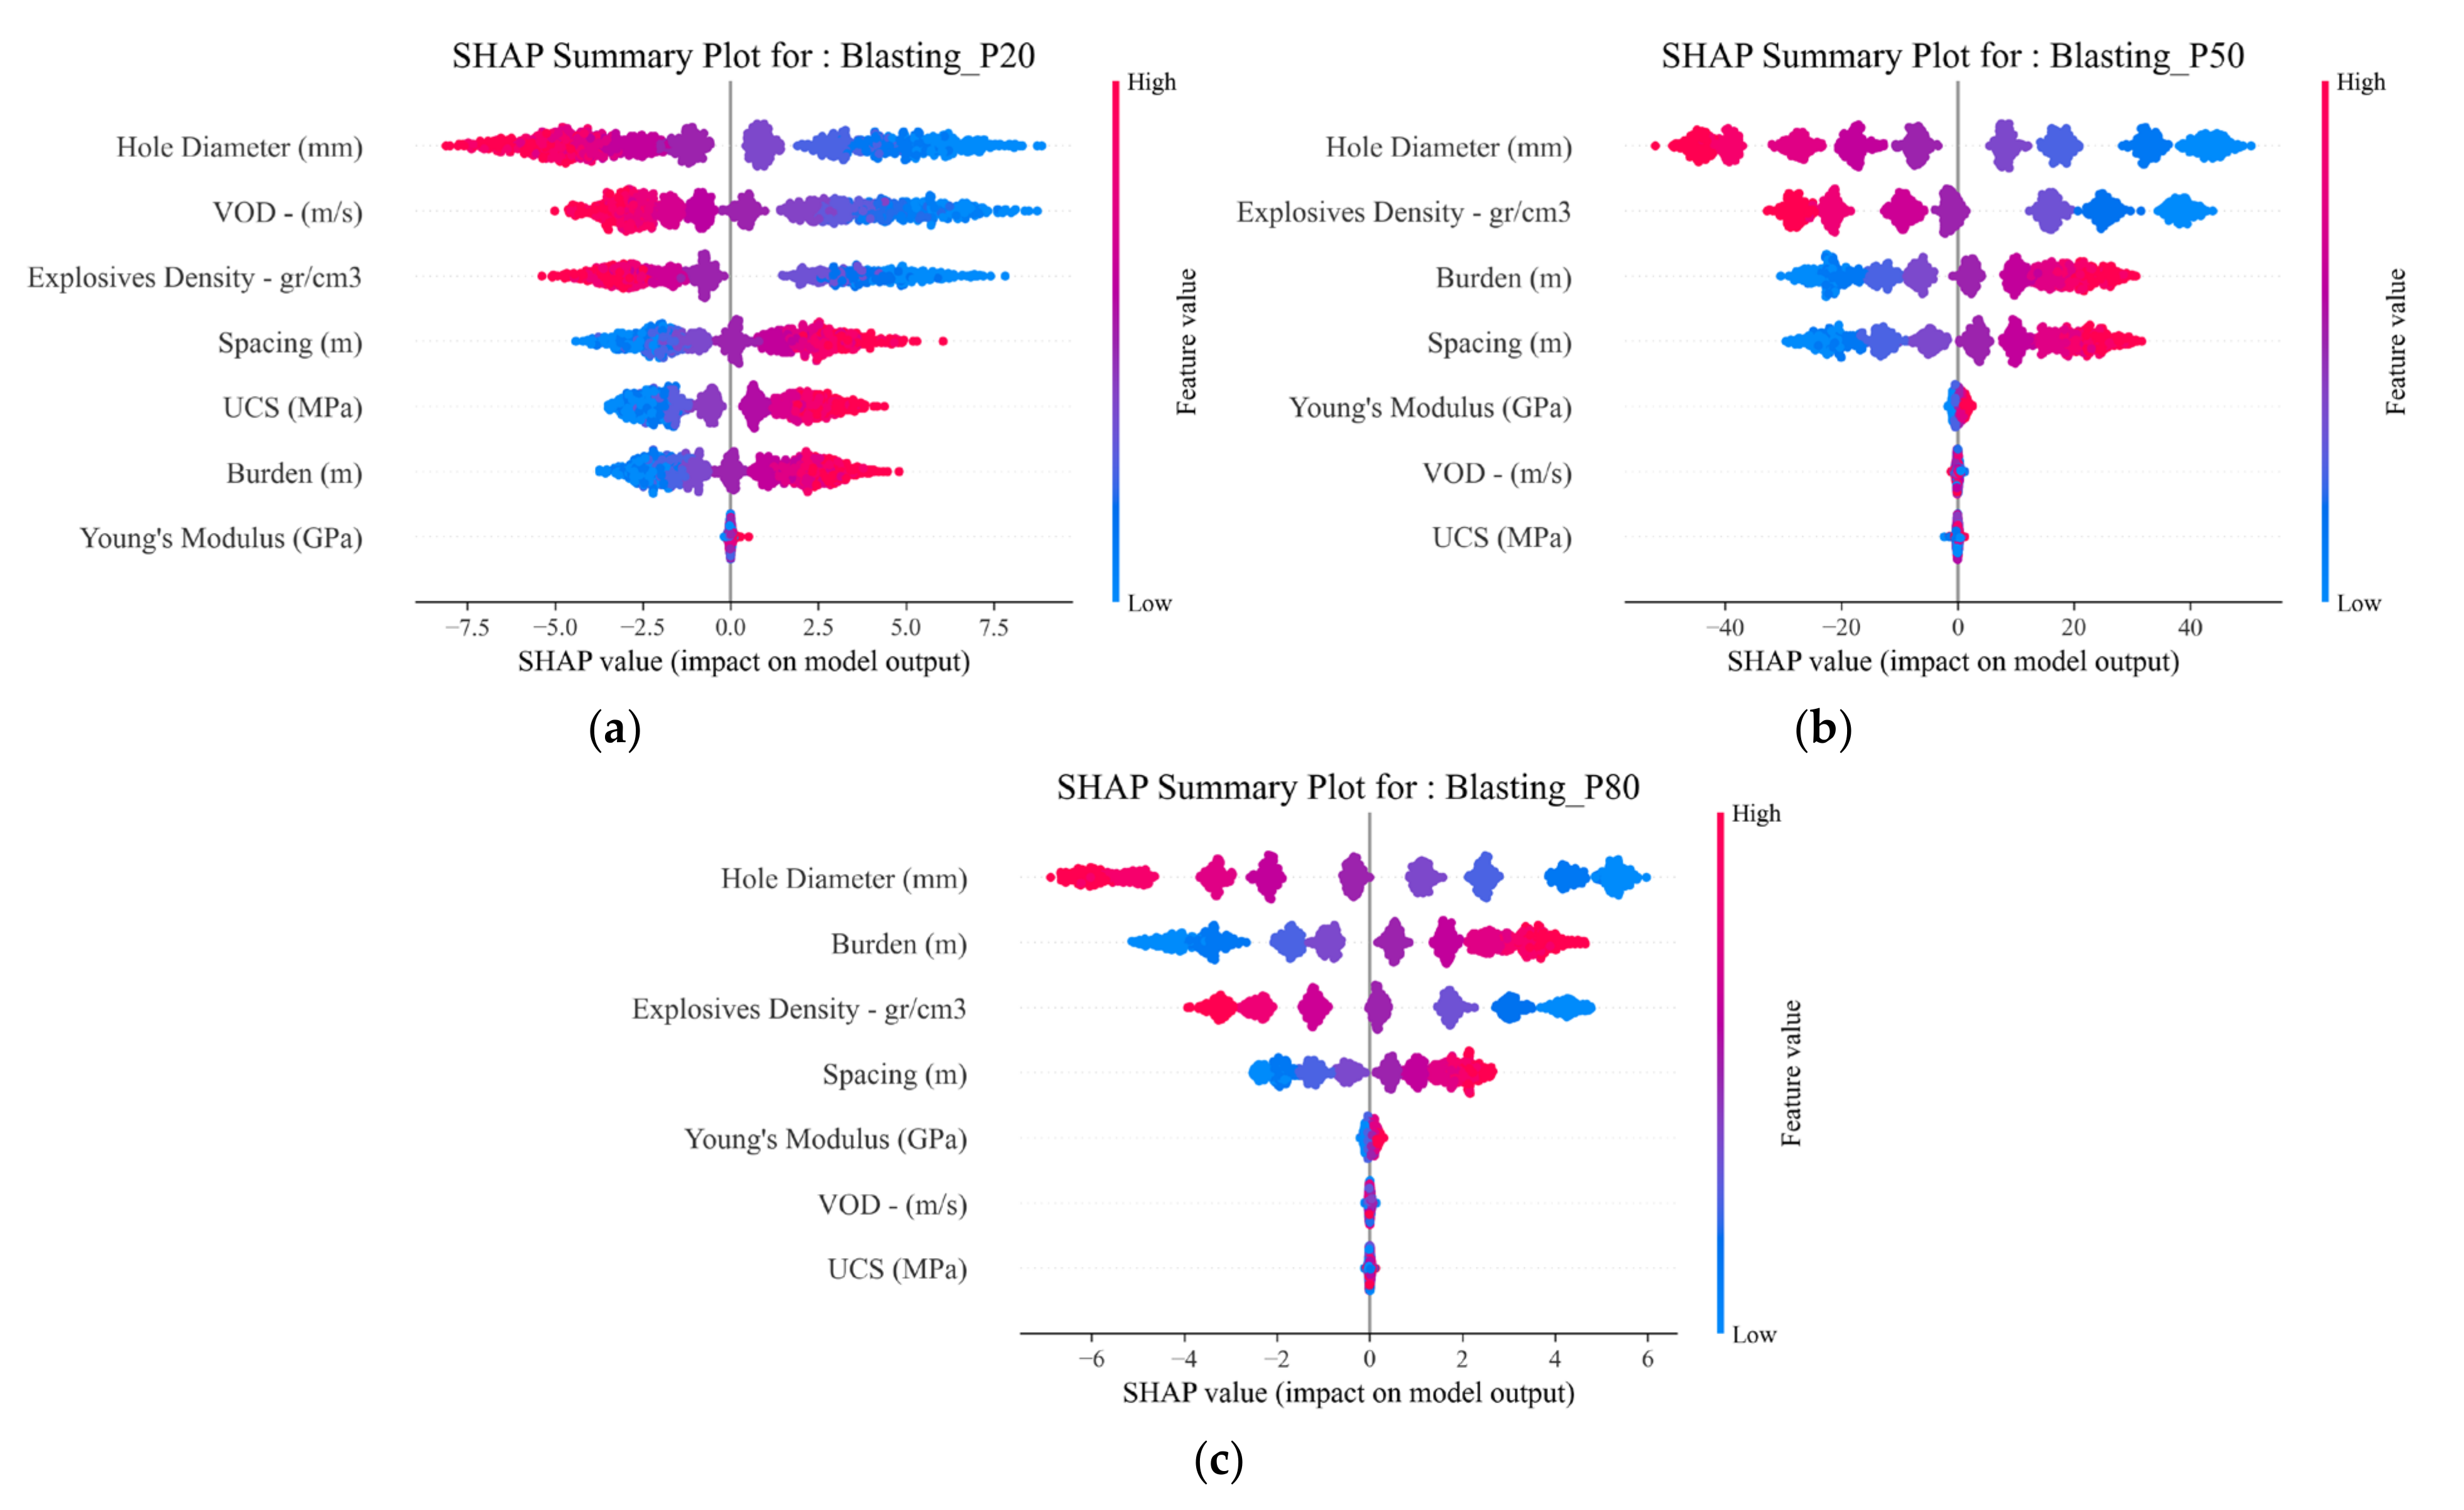
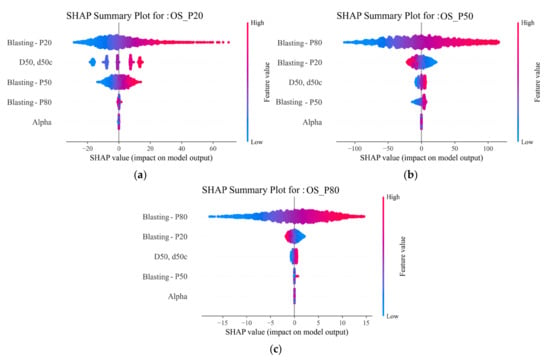
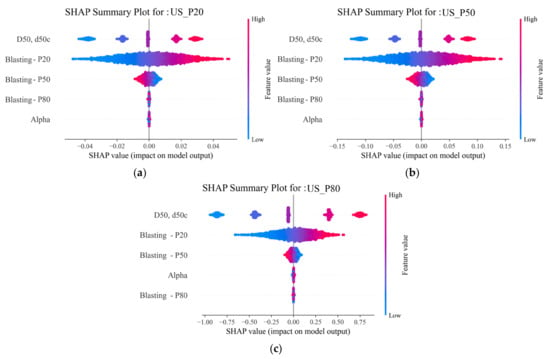
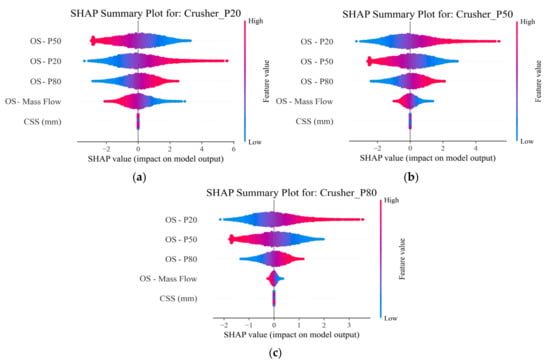
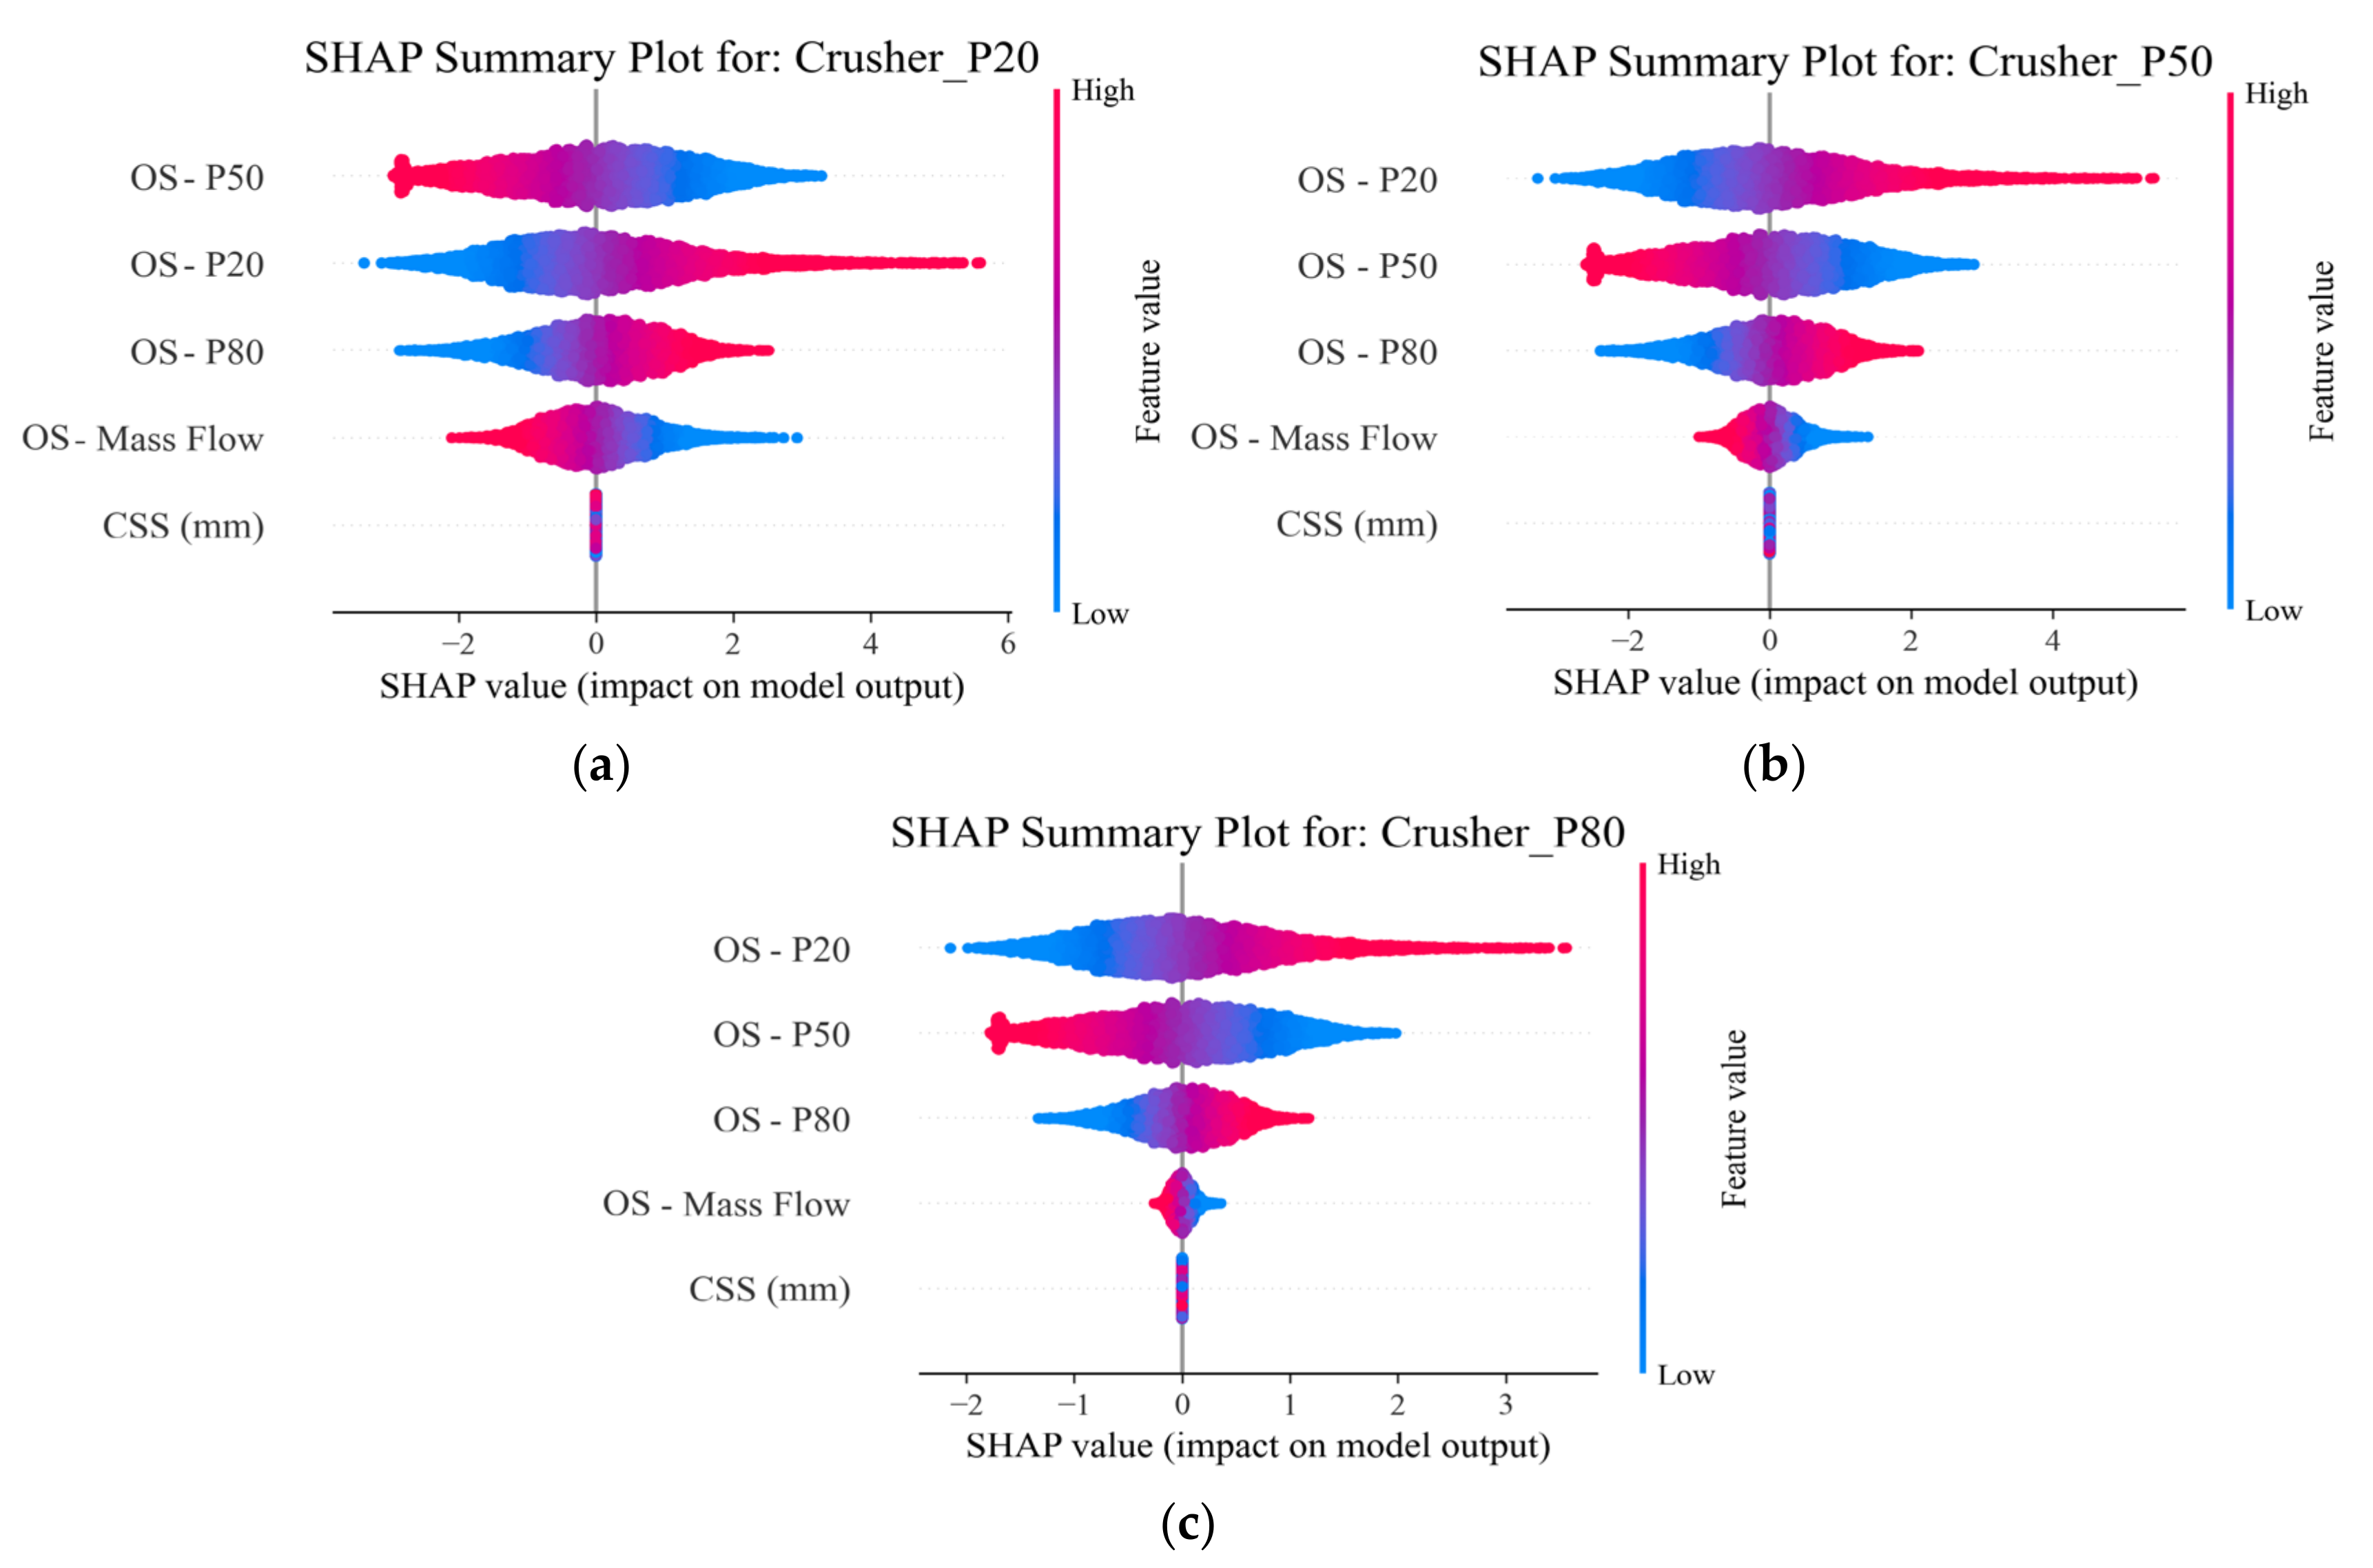
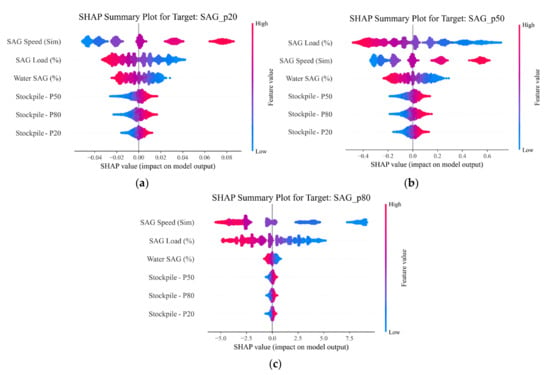
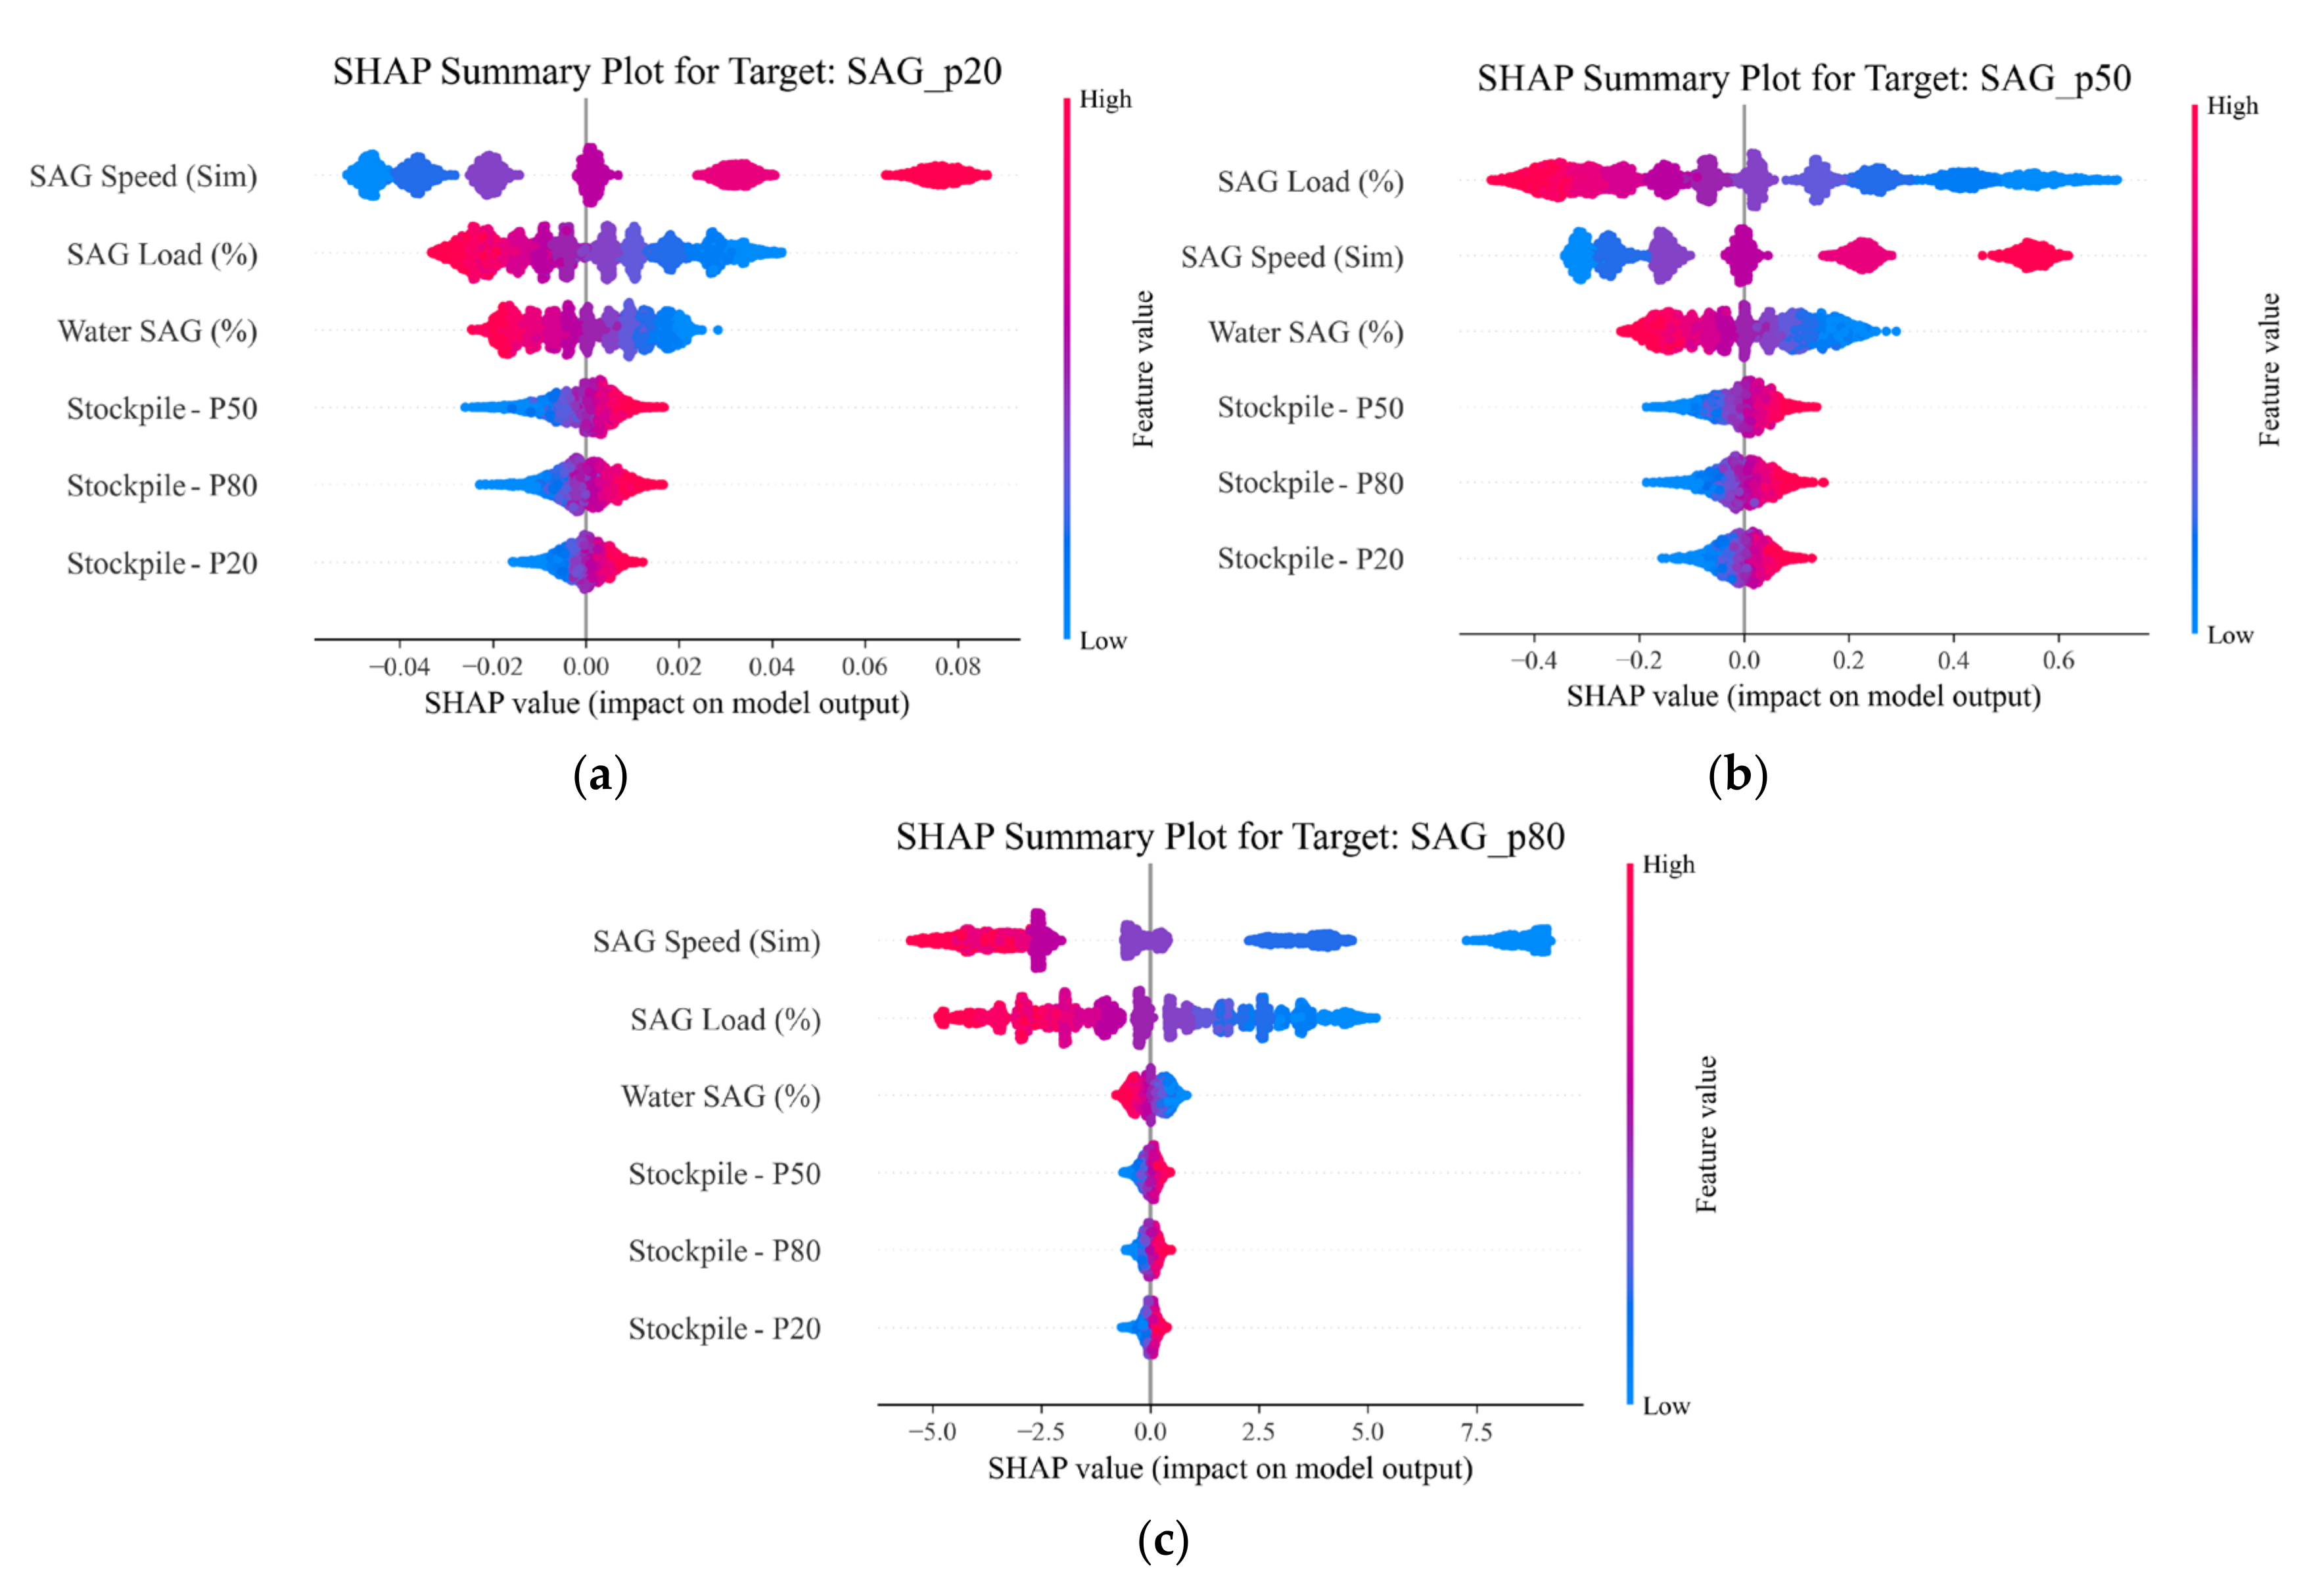
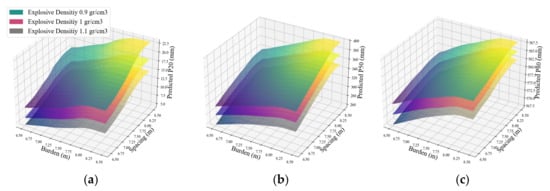
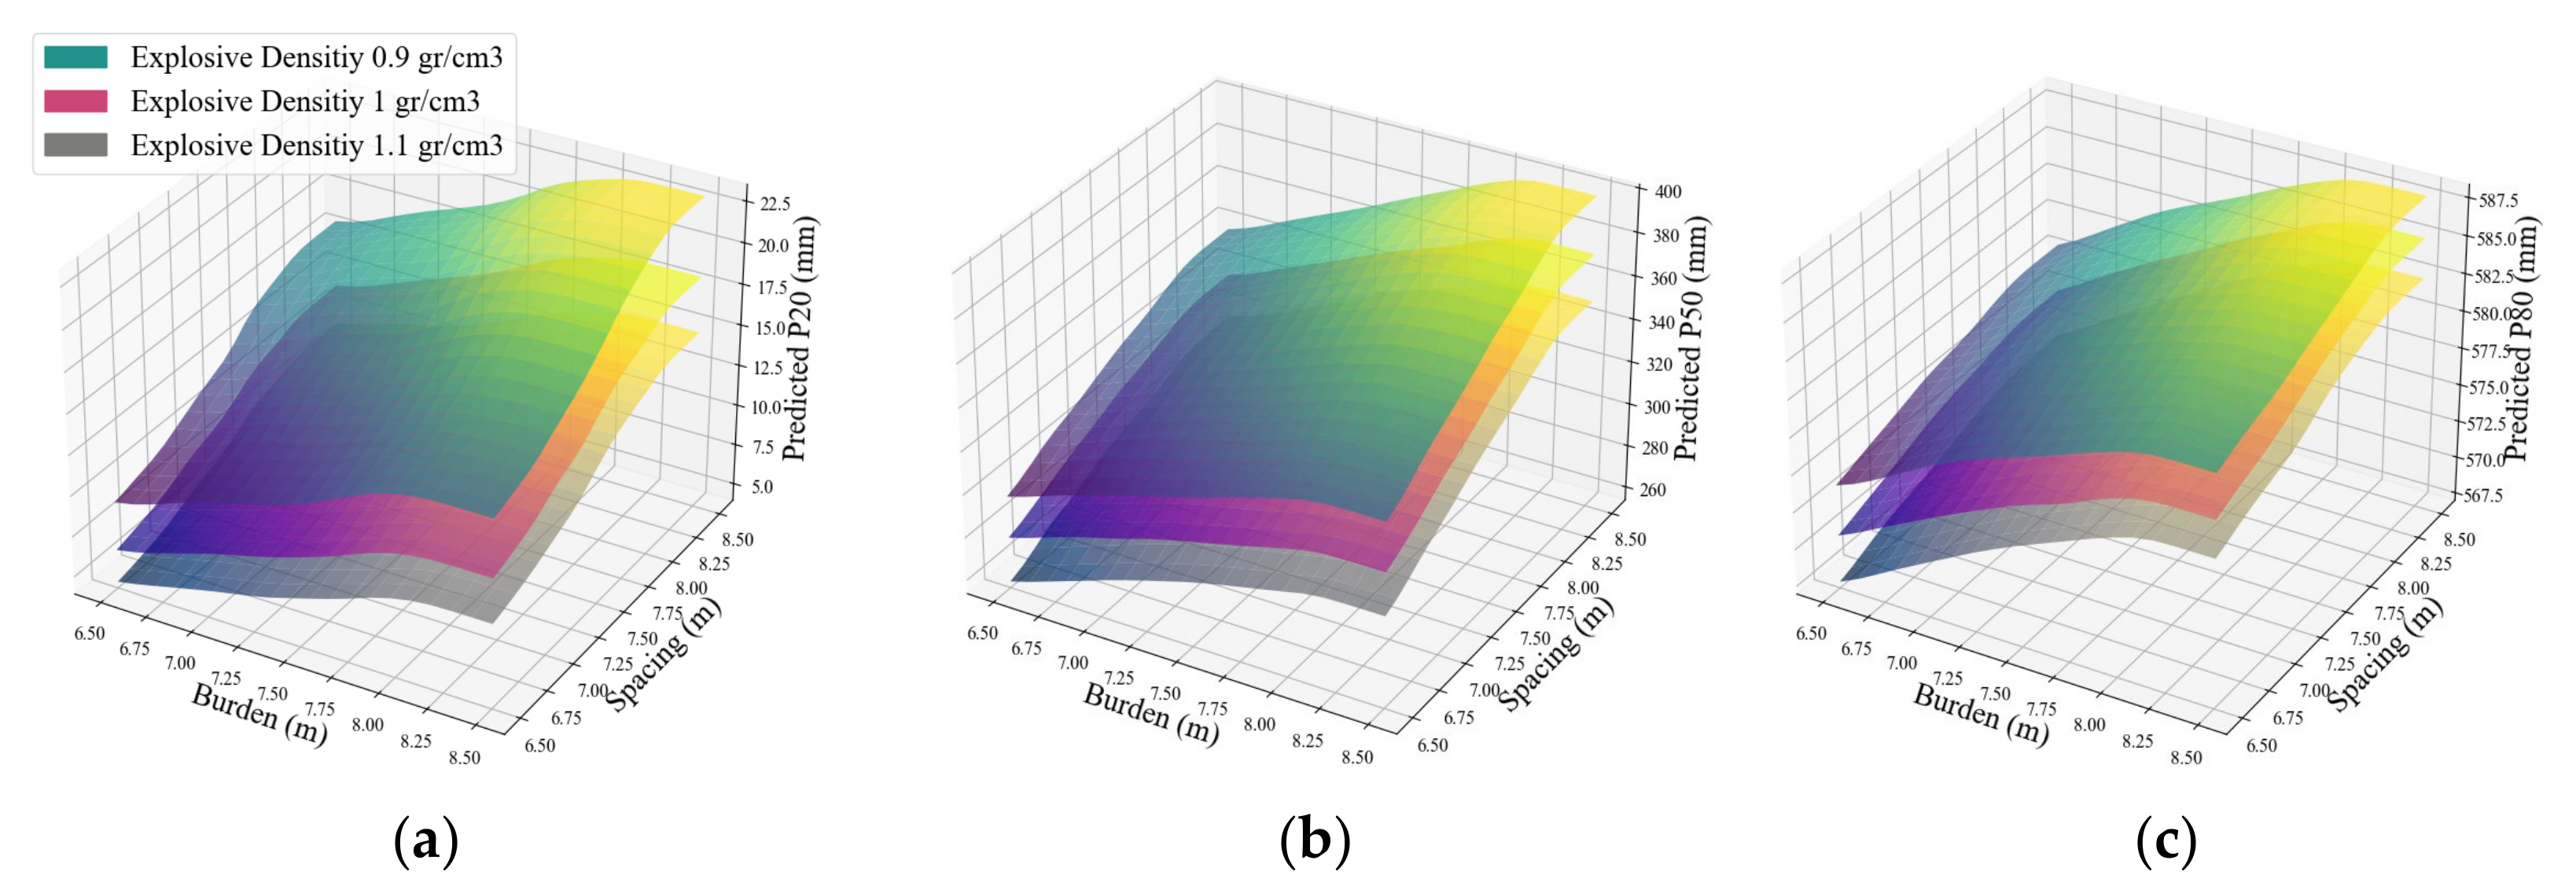
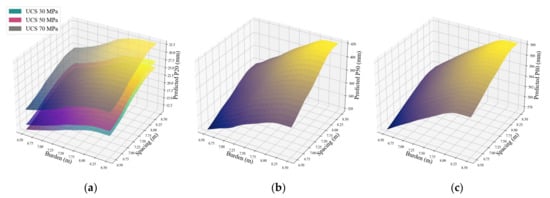
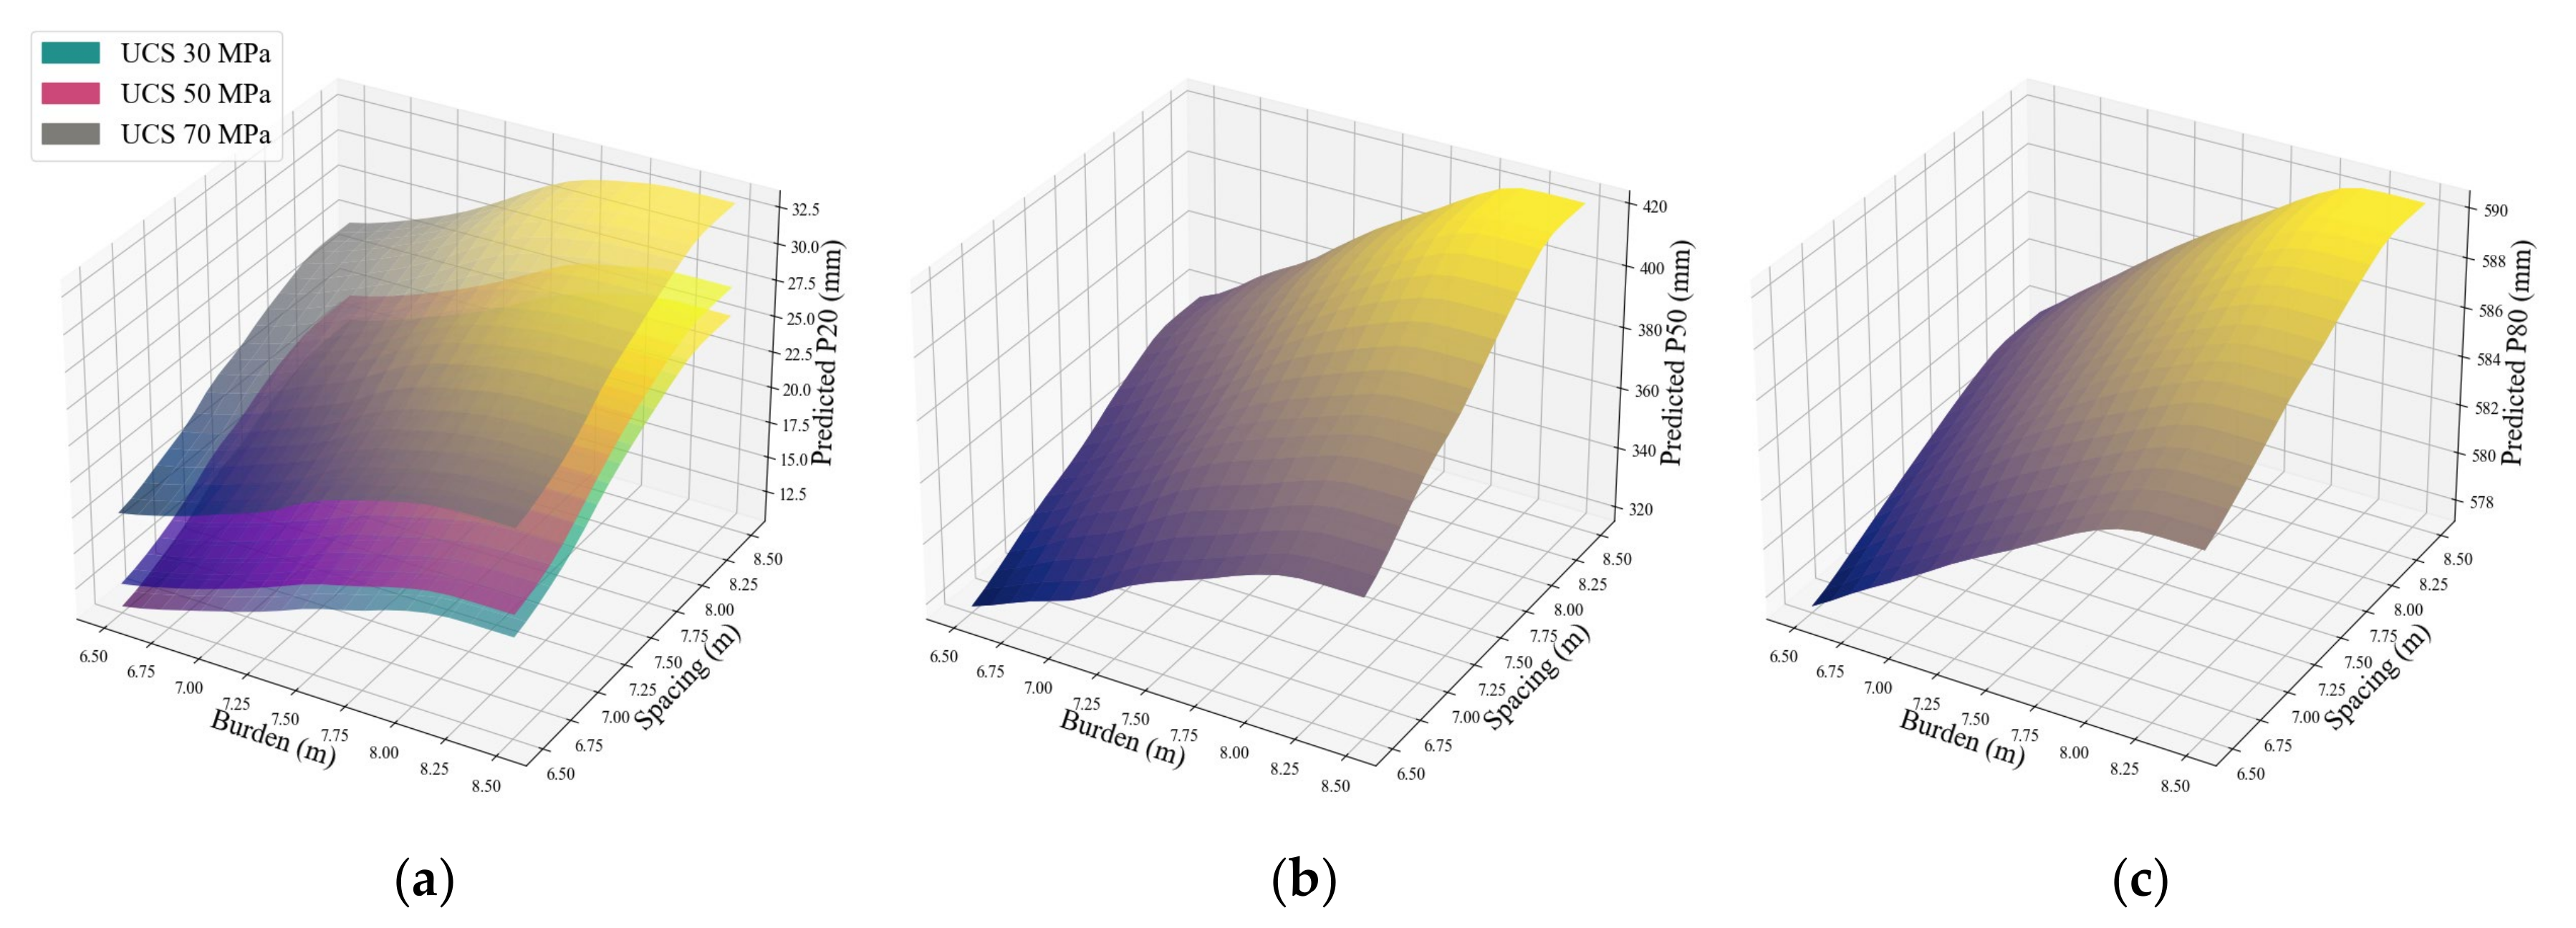
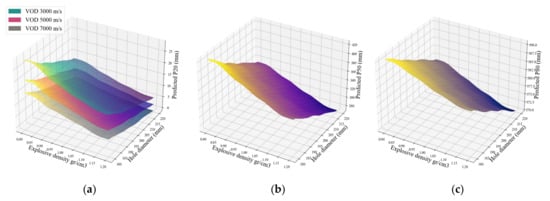
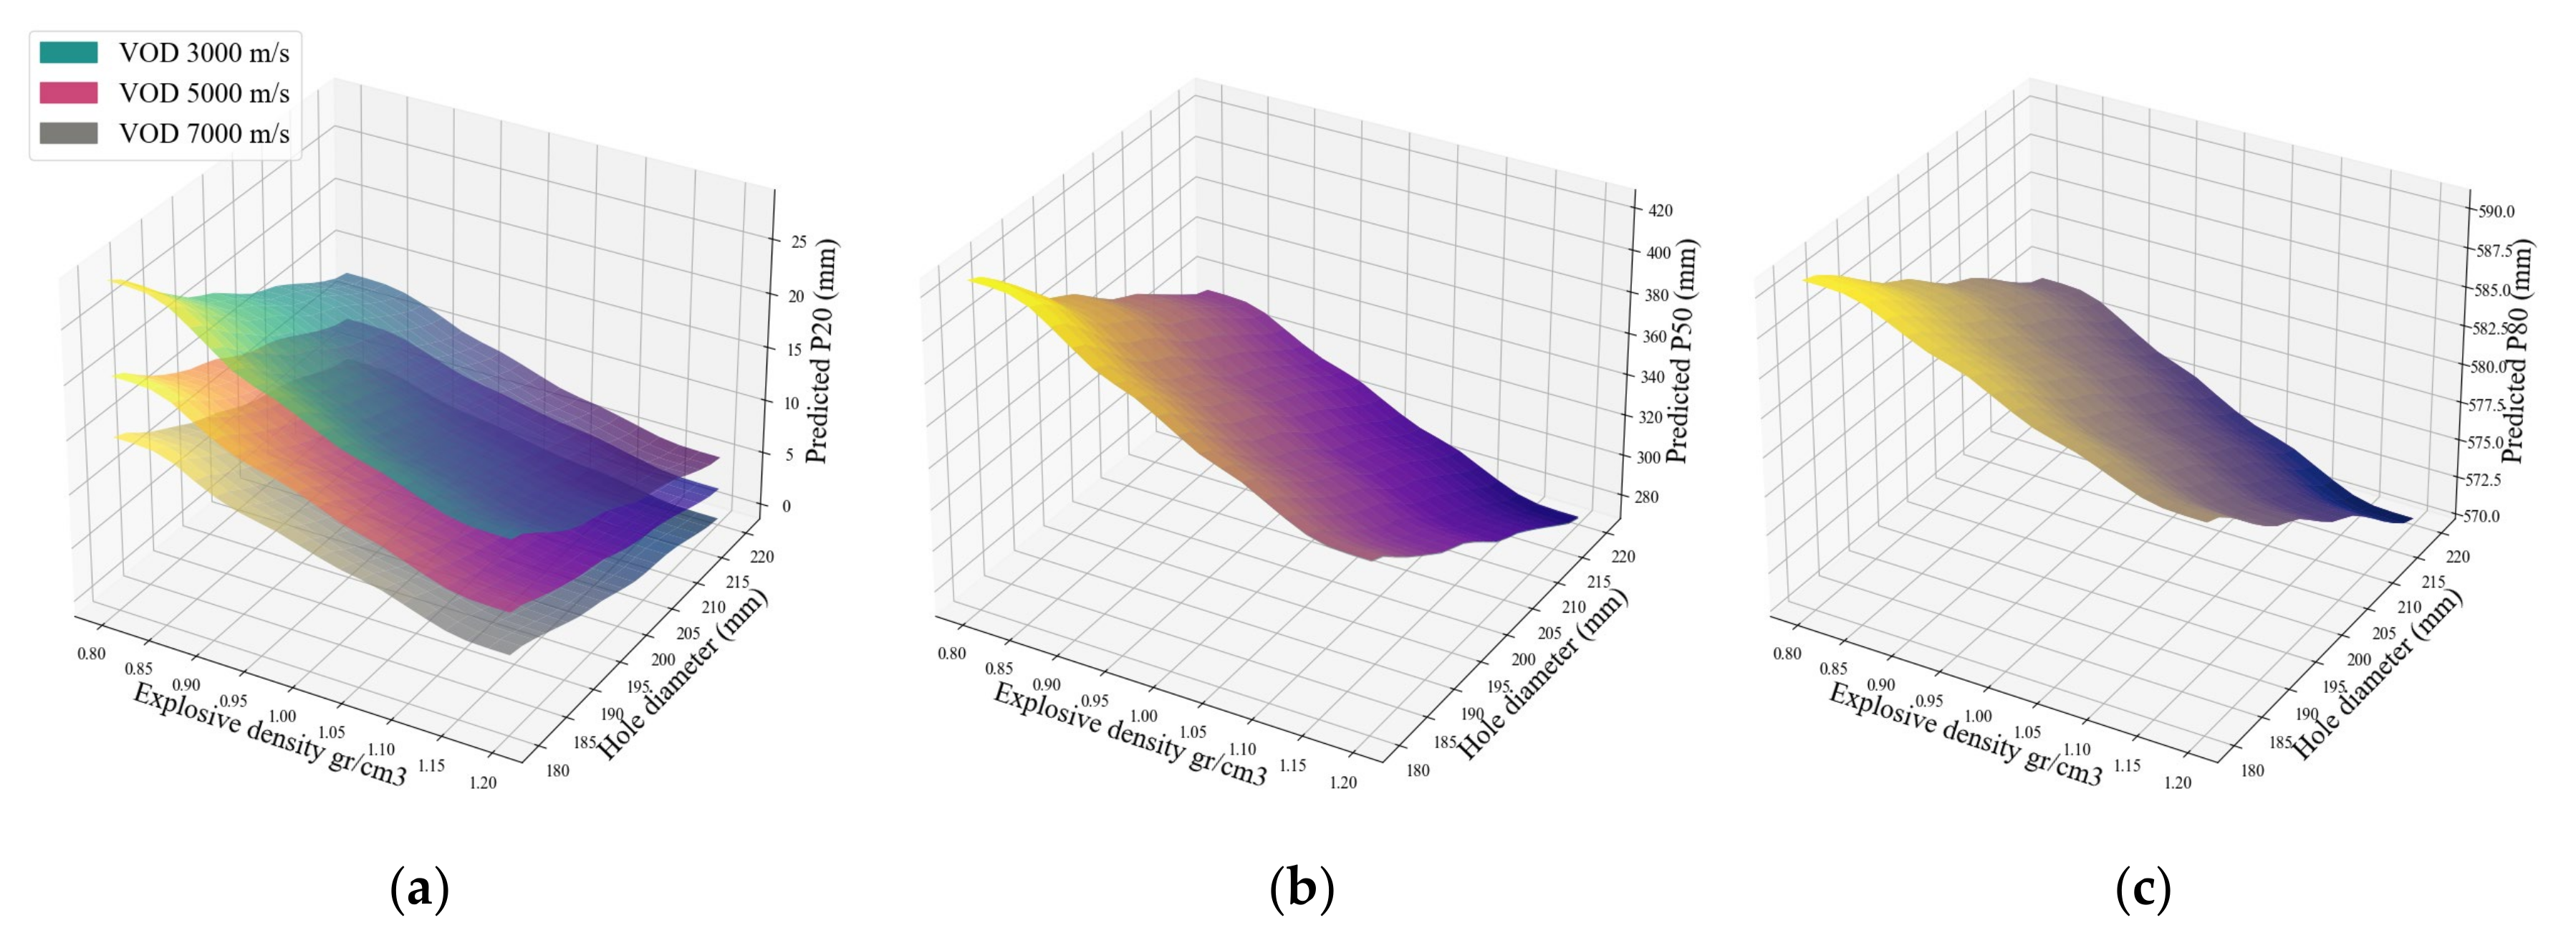
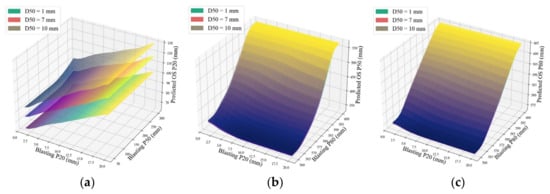
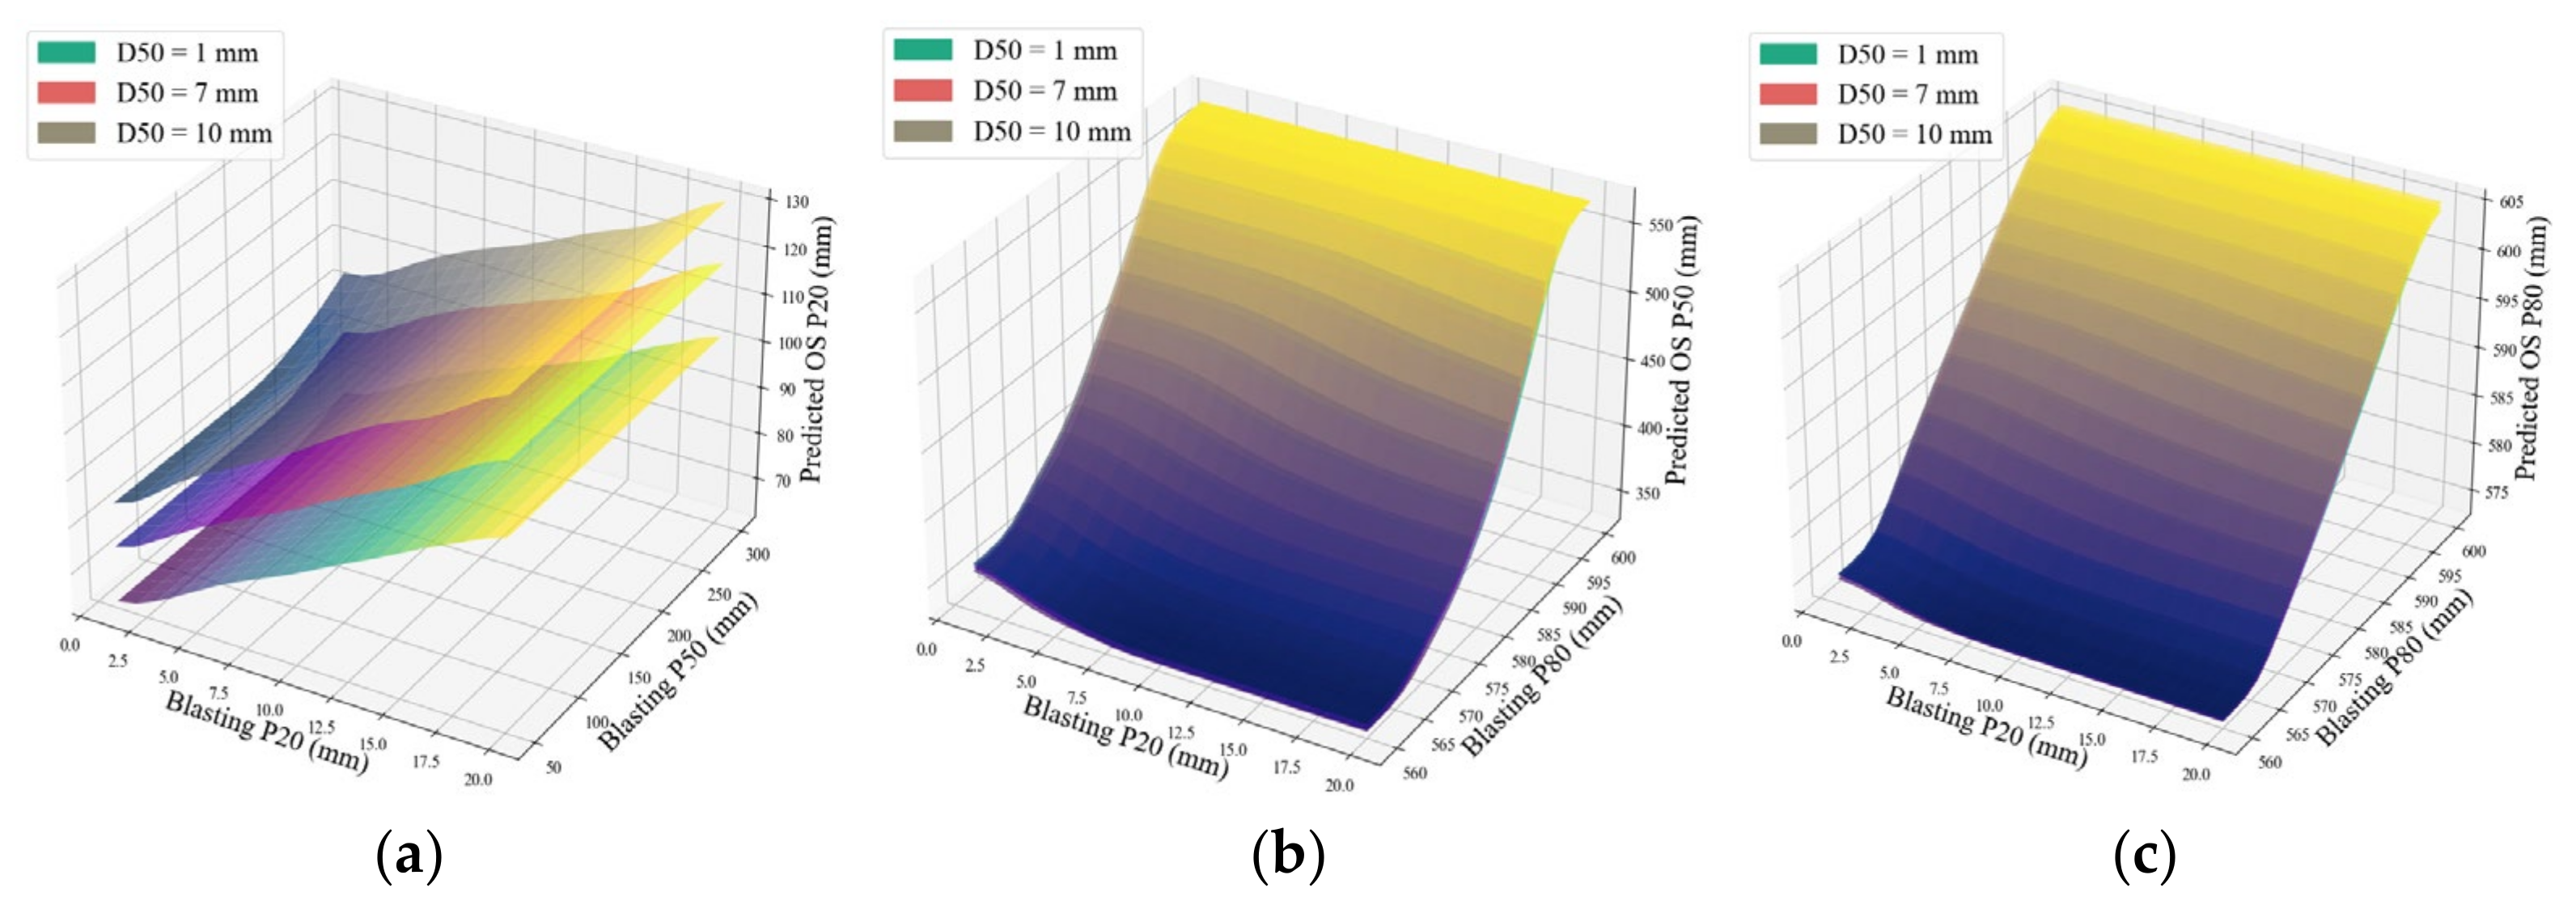
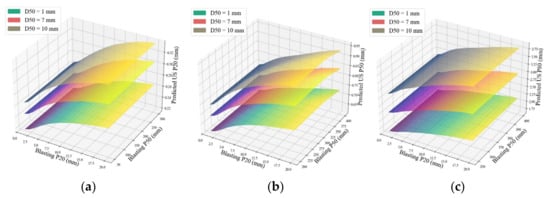
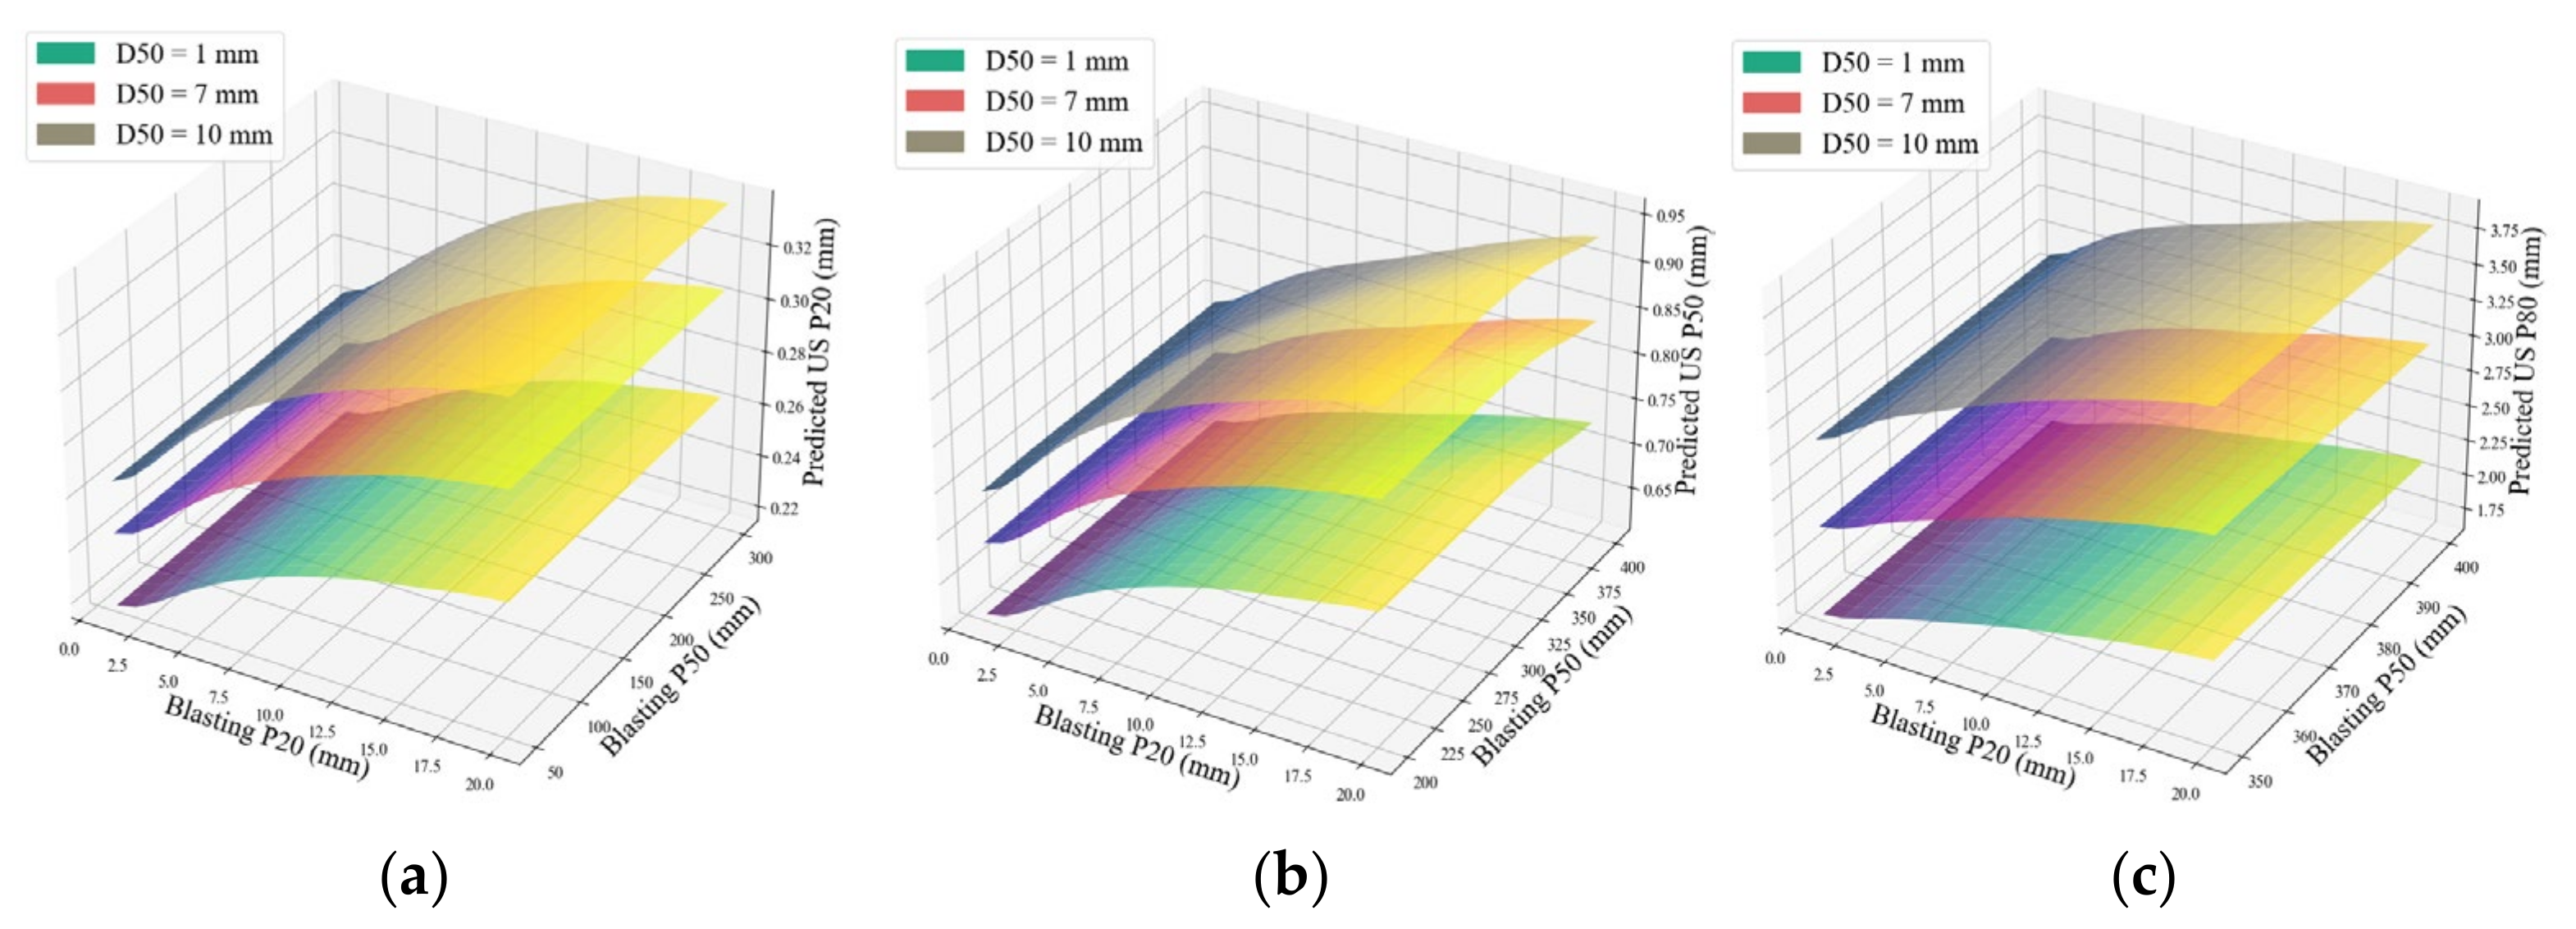
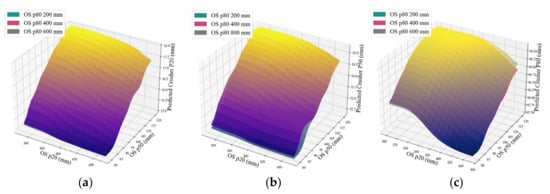
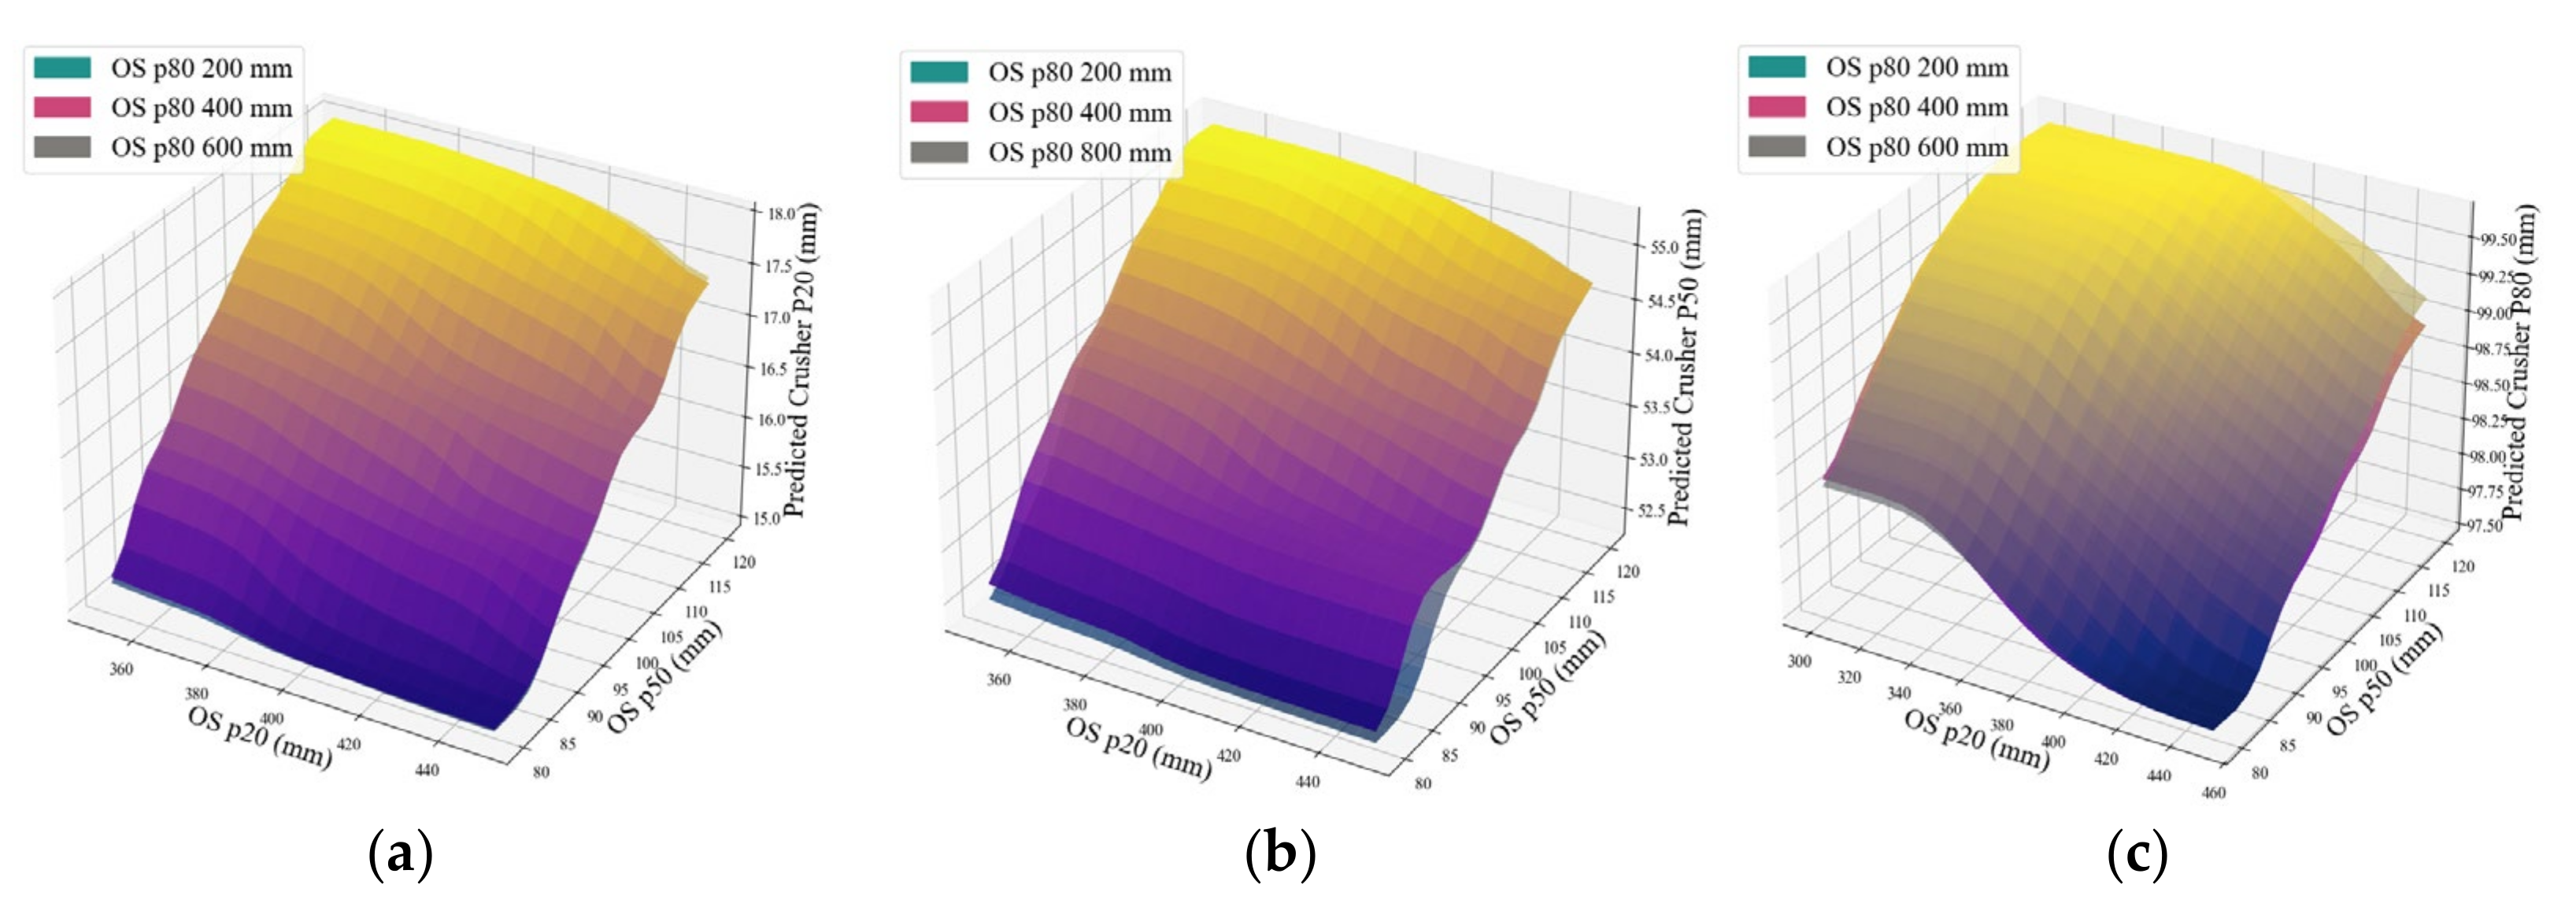
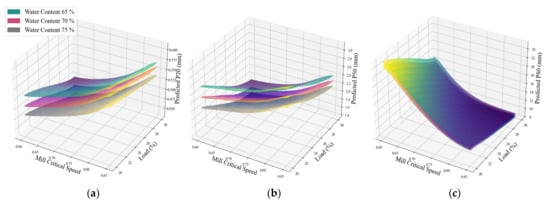
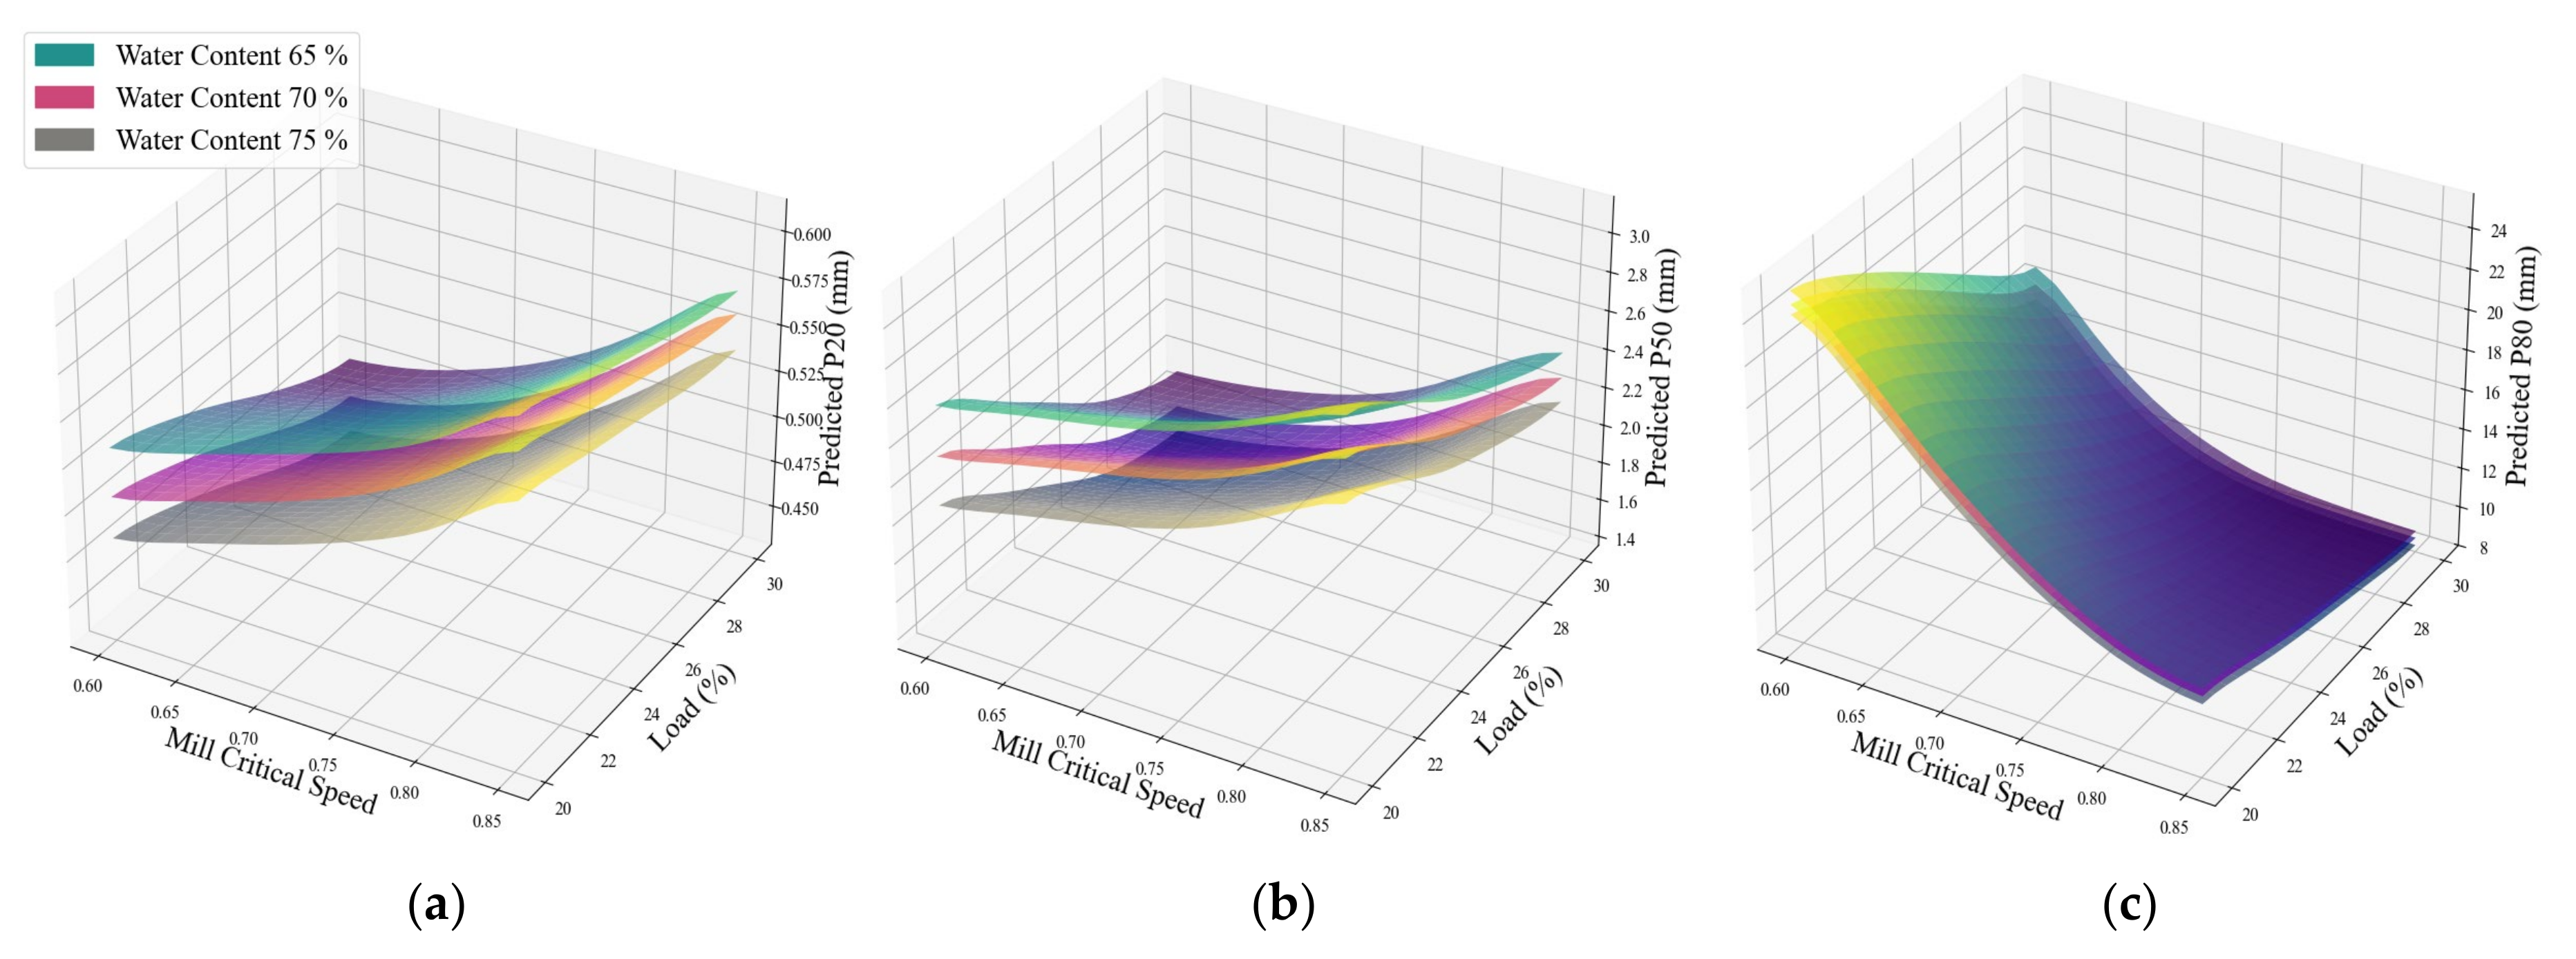
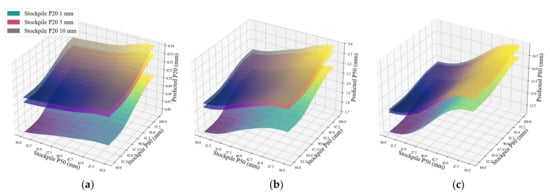
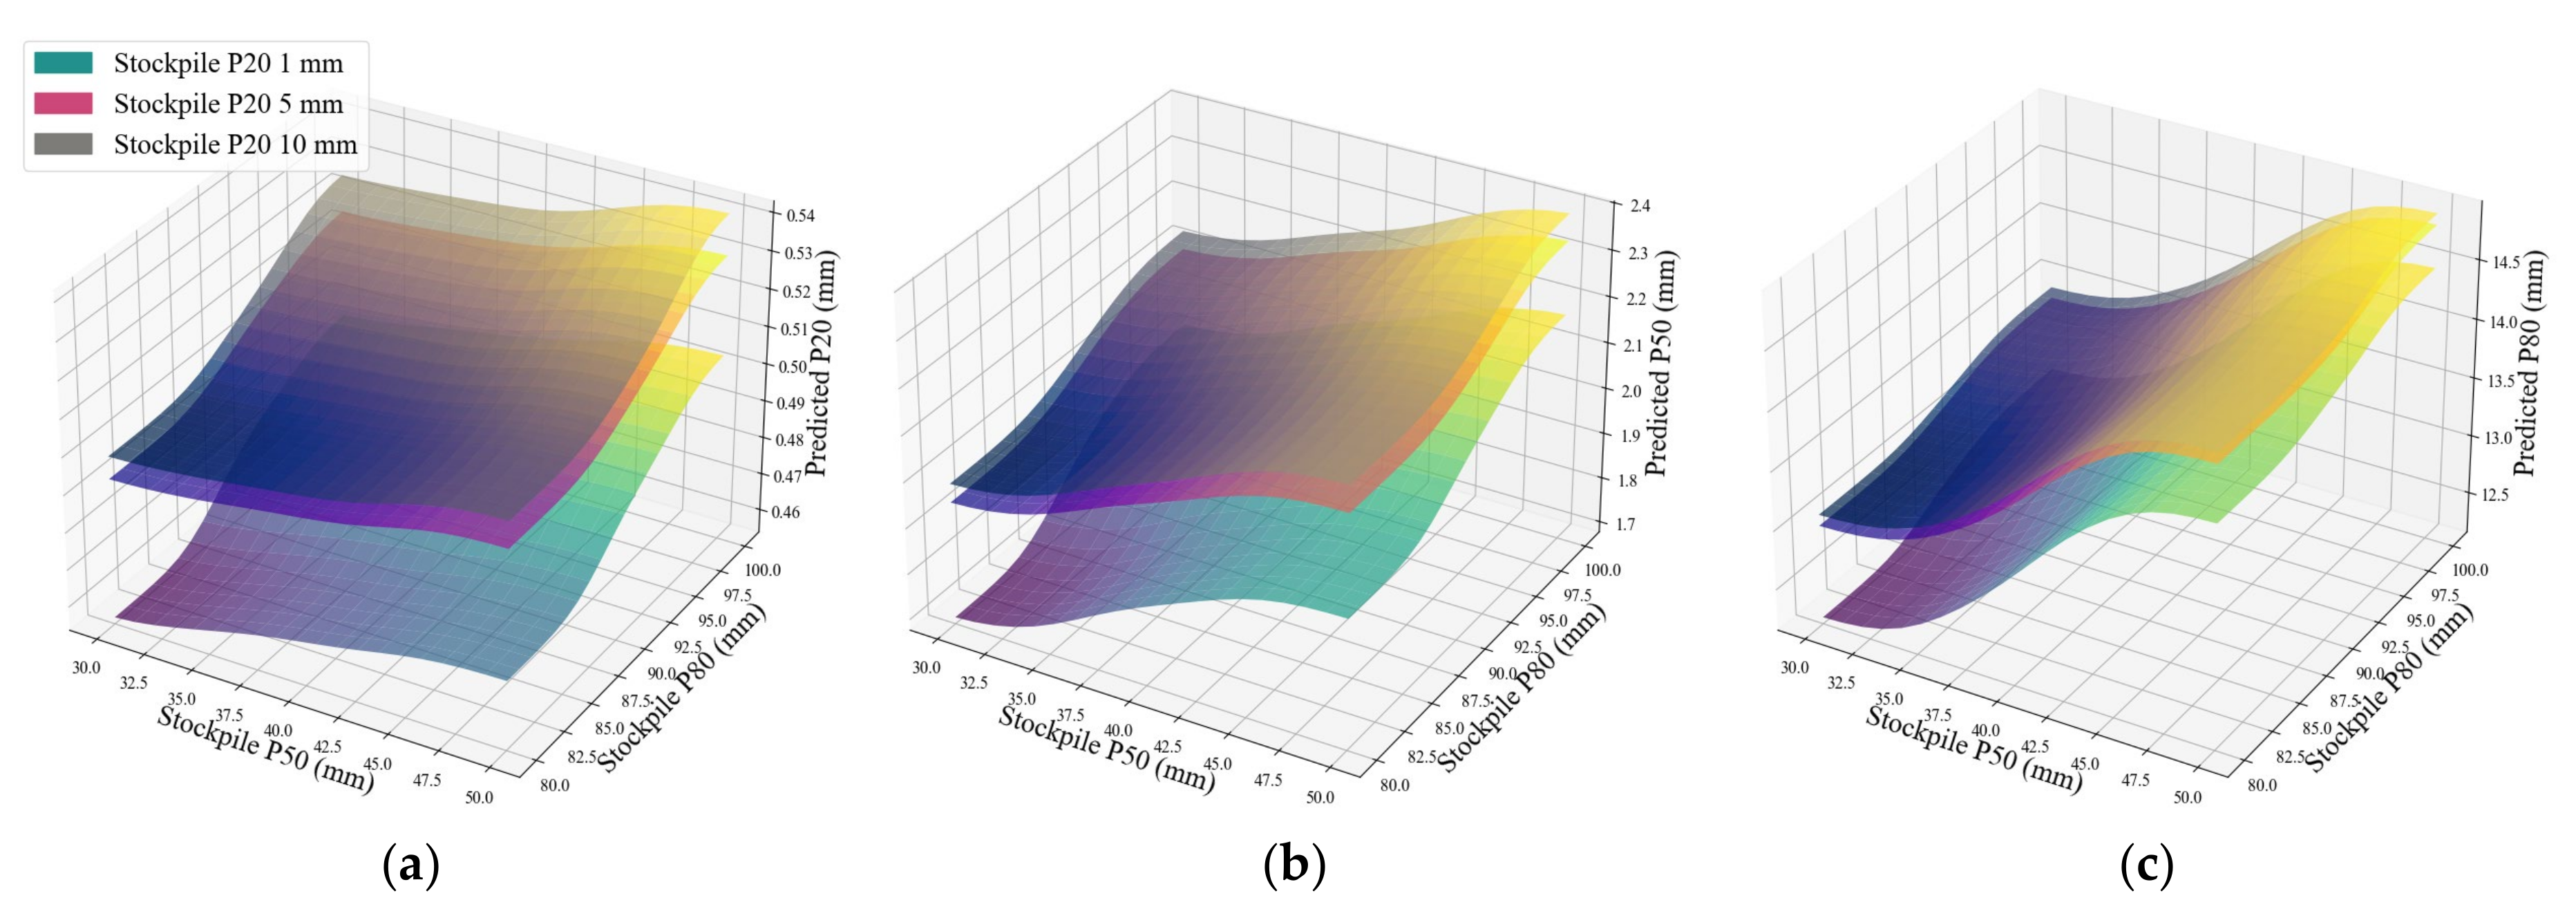

Disclaimer/Publisher’s Note: The statements, opinions and data contained in all publications are solely those of the individual author(s) and contributor(s) and not of MDPI and/or the editor(s). MDPI and/or the editor(s) disclaim responsibility for any injury to people or property resulting from any ideas, methods, instructions or products referred to in the content. |
© 2026 by the authors. Licensee MDPI, Basel, Switzerland. This article is an open access article distributed under the terms and conditions of the Creative Commons Attribution (CC BY) license.