


Abstract
Soil contamination by potentially toxic elements (PTEs) is a growing environmental concern, particularly in agricultural regions where soil quality directly affects crop safety and human health. This study evaluates PTE concentrations and ecological risks in agricultural soils of Hautat Sudair, central Saudi Arabia, using contamination indices, multivariate statistics, and GIS-based spatial modeling supported by RS-derived land use/land cover (LULC) mapping. The results show that the mean concentrations of Ni (35.97 mg/kg) and Mn (1230 mg/kg) exceed international thresholds in several locations, while Pb (8.34 mg/kg), Cr (33.00 mg/kg), Zn (60.09 mg/kg), and As (4.25 mg/kg) remain within permissible limits in most samples. Contamination indices, including the Enrichment Factor (EF), Contamination Factor (CF), and Geo-Accumulation Index (Igeo), highlight hotspot behavior, with isolated sites showing elevated concentrations approaching screening levels (e.g., Pb up to 32.0 mg/kg and Cr up to 52.0 mg/kg), whereas Ni and Mn exhibit the most pronounced local enrichment. The Pollution Load Index (PLI) varies from 0.24 to 0.80, indicating low to moderate contamination levels, while the Risk Index (RI) ranges from 10.43 to 41.38, signifying low ecological risk. Multivariate statistical analyses, including correlation matrices and principal component analysis (PCA), reveal that Ni, Cr, and Mn share a common source, possibly linked to anthropogenic inputs and natural geological background. Kaiser–Meyer–Olkin (KMO) and Bartlett’s test confirm the adequacy of the dataset for PCA (KMO = 0.797; χ2 = 563.845, p < 0.001). Spatial distribution maps generated using GIS and RS highlight contamination hotspots, reinforcing the necessity for periodic monitoring. By integrating indices, multivariate patterns, and spatial context, this study provides a replicable, research-driven framework for interpreting PTE controls in arid agricultural soils.
1. Introduction
The contamination of agricultural soils with potentially toxic elements (PTEs) poses potential risks to food safety, human health, and ecosystem stability, making it a growing environmental concern [1]. Two primary categories of sources are typically recognized for PTEs in soils: natural geogenic sources, which are largely controlled by parent rock weathering, and anthropogenic sources, which include industrial emissions, mining, excessive fertilizer use, and wastewater irrigation [2,3,4]. Because PTEs are non-degradable and persist in soils where they may bioaccumulate in crops, their long-term ecological and human health effects, including neurotoxicity, organ damage, and carcinogenicity, are well documented [5,6,7]. Therefore, the assessment of PTE enrichment in agricultural soils is critical to identifying areas at risk of contamination, evaluating their sources, and proposing effective mitigation strategies. Contamination indices have been widely utilized to quantify levels of PTE soil contamination and estimate the ecological risks associated with it, including the Pollution Load Index (PLI), Geo-accumulation Index (Igeo), and Potential Ecological Risk Index (RI) [8,9]. These indices provide a valuable evaluation of contamination severity and potential environmental risks, enabling policymakers and researchers to develop appropriate land management practices to safeguard agricultural productivity and food security. However, contamination indices alone provide limited insight into the underlying processes that shape PTE distributions. This limitation is particularly relevant in arid agroecosystems, where soil formation, hydrology, and land-use practices differ markedly from humid temperate environments.
Multivariate statistical analysis has become a valuable method for determining the origins and spread of PTEs in soil, complementing pollution indices. To distinguish between natural- and human-sourced PTEs, researchers often employ statistical techniques such as correlation matrices, principal component analysis (PCA), and hierarchical cluster analysis (HCA) [10,11]. By applying PCA, researchers can simplify complex datasets and identify key factors driving PTE variation. Meanwhile, correlation analysis and clustering techniques group metals with similar distribution patterns and sources, providing insight into their origins [11,12]. These statistical methods improve the accuracy of contamination assessments and help identify specific contamination sources, including industrial activities, auto emissions, and agricultural runoff [13,14]. Combining pollution indices with advanced statistical methods provides a more comprehensive understanding of PTE contamination in agricultural soils, enabling more effective risk management and mitigation strategies. As the need for sustainable agriculture and environmental protection grows, using these methods is essential for preventing soil degradation and maintaining soil health and productivity over the long term.
Geographic Information System (GIS) and Remote Sensing (RS) technologies are key tools for mapping and evaluating the risk of PTE contamination in agricultural soils, offering spatial visualization, trend analysis, and predictive modeling to identify contamination sources [15]. GIS combines various data sources, such as soil samples, land use, hydrology, and industrial activity, to pinpoint spatial patterns and hotspots of PTE contamination with high accuracy [16]. Meanwhile, RS uses satellite imagery and spectral analysis to identify indicators of soil contamination, enabling large-scale monitoring of agricultural land with minimal fieldwork [17]. By combining GIS and RS, researchers can apply spatial interpolation techniques like Kriging and Inverse Distance Weighting (IDW) to estimate PTE concentrations in unsampled areas, enabling thorough risk assessments and informed decision-making for soil management [18,19]. Additionally, integrating advanced machine learning algorithms and geostatistical models with GIS improves the accuracy of PTE contamination maps, allowing policymakers to develop targeted remediation strategies [20]. In arid regions, where field sampling may be limited and soil properties vary sharply over short distances, the integration of GIS/RS with geochemical and statistical analyses is especially valuable for revealing spatial controls on PTE enrichment. In the present study, RS is used primarily for LULC mapping to contextualize potential anthropogenic pressure; direct reflectance-based proxies (e.g., soil/vegetation spectral indices linked to metal concentrations) are not applied and are suggested for future work.
Several studies have been conducted in central Saudi Arabia in order to assess the levels, sources, and risks associated with PTE contamination in agricultural soils [1,7,15,21]. Research studies have been conducted in various regions to assess PTE contamination in soils. For example, a study in Al Majma’ah area examined the distribution, health risks, and sources of contamination of As, Pb, Ni, Zn, and Fe in soil samples from 34 farms [21]. Another study in the Al Uyaynah–Al Jubailah region found high levels of Al, Fe, Zn, Cr, and Pb in soils of marine origin, posing potential ecological risks [20]. Additionally, a study conducted in the Al Ghat Governorate used GIS and multivariate analysis to evaluate PTE concentrations in agricultural soils [15]. The investigation revealed that Fe, Al, Mn, and Zn were the most abundant metals, with certain areas showing significant enrichment factors for specific PTEs. These studies collectively reveal substantial spatial variability in PTE contamination across central Saudi Arabia, underscoring the importance of ongoing monitoring and region-specific mitigation strategies to protect soil health and ensure long-term agricultural sustainability.
However, despite this growing body of research, no study has examined the agricultural soils of Hautat Sudair, a rapidly developing and intensively cultivated region, using an integrated combination of contamination indices, multivariate statistics, and GIS/remote sensing. Furthermore, previous assessments in central Saudi Arabia have primarily been descriptive; few have tested explicit hypotheses regarding the relative influence of geogenic vs. anthropogenic factors on PTE distributions in arid agricultural systems. Accordingly, this study addresses the following scientific questions: (i) Do PTE concentrations in the study area primarily reflect lithogenic inputs associated with local stratigraphy, or do agricultural practices contribute measurable enrichment? (ii) Can multivariate statistical patterns be used to distinguish natural geochemical controls from localized anthropogenic signatures? (iii) How do spatial distribution models generated through GIS/RS improve understanding of contamination pathways in arid-zone agroecosystems?
By framing the investigation around these research questions and integrating multiple analytical frameworks, this study advances the scientific understanding of PTE behavior in arid agricultural soils rather than serving merely as a regional contamination survey. Thus, the present study aims to (i) quantify PTE contamination levels in agricultural soils of Hautat Sudair, (ii) evaluate geogenic and anthropogenic controls using multivariate/statistical and geospatial approaches, and (iii) assess associated ecological risks to provide a scientifically grounded framework for sustainable soil management in arid regions.
2. Materials and Methods
2.1. Study Area
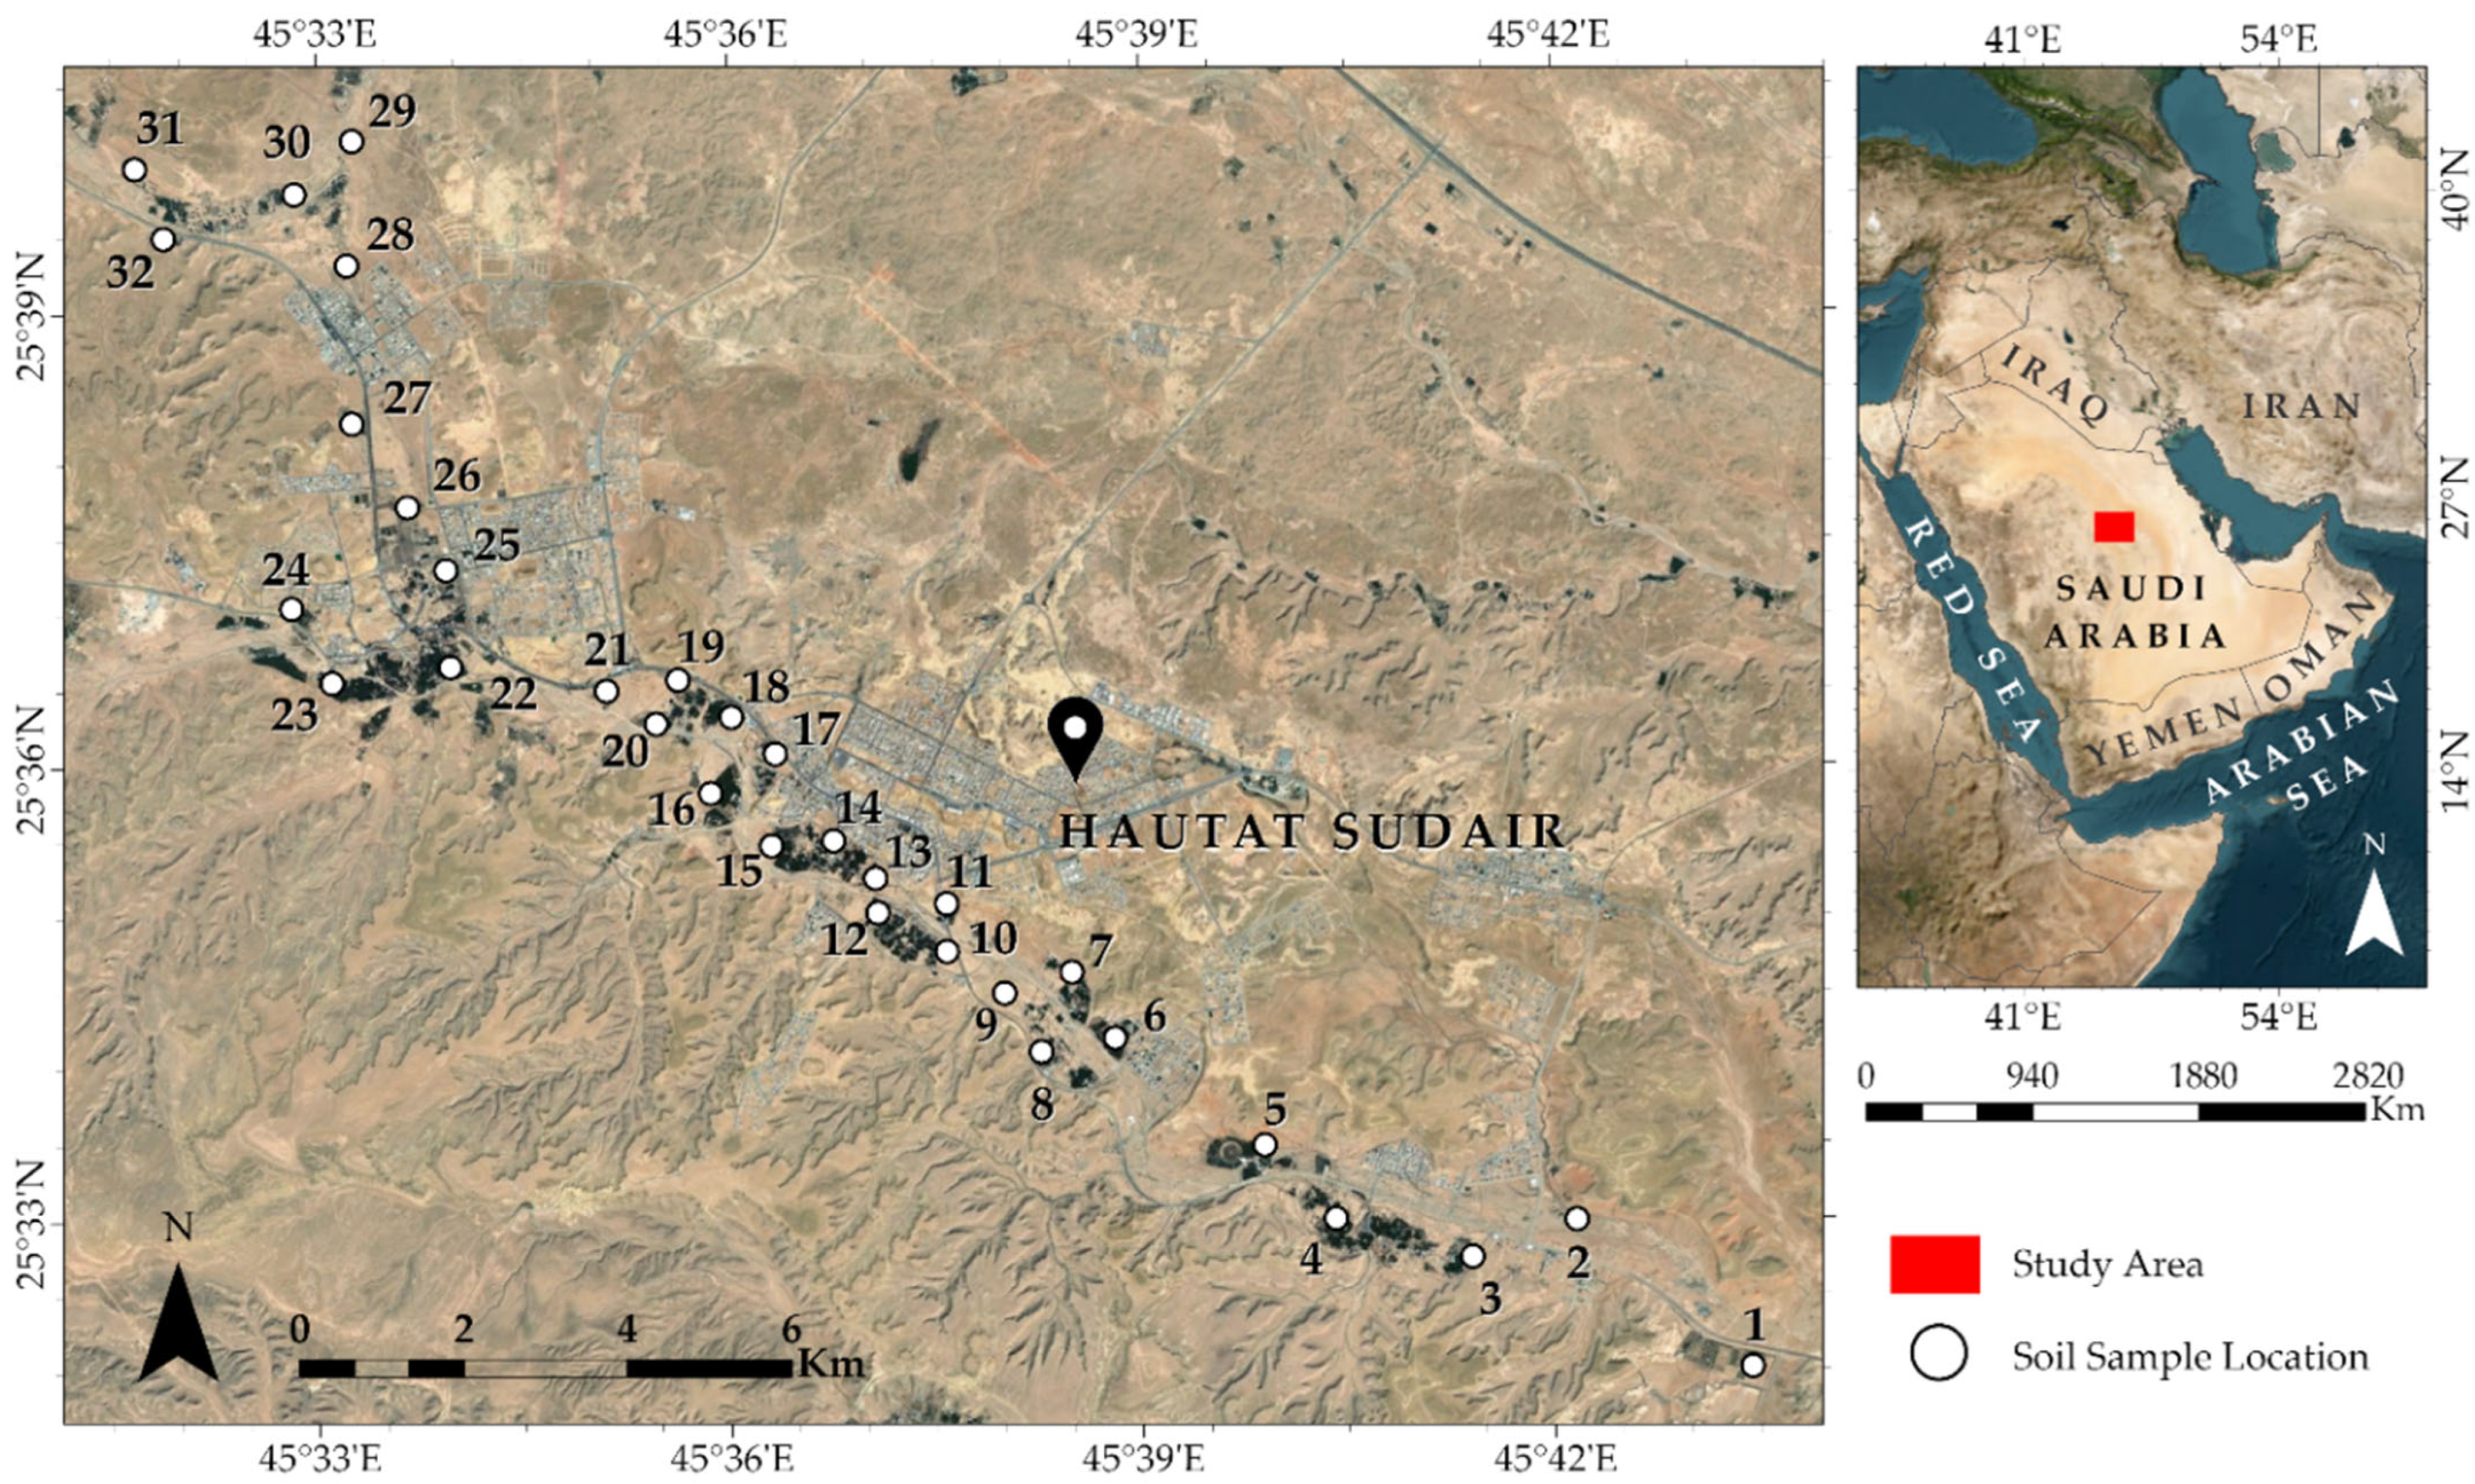
The Hautat Sudair city is located at 25°35′42″ N, 45°38′02″ E, approximately 140 km northwest of Riyadh, Saudi Arabia (Figure 1). In addition to being a historical destination, the city of Sudair is also famous for its farming activities due to both its fertile soil and favorable climate, as well as availability of water for irrigation. Various varieties of dates, wheat, and barley constitute the main crops. Vegetables are also locally grown and marketed, including tomatoes, squash, and cucumbers. Investments in the area have been mainly directed towards the agricultural sector with major irrigation projects and related services being established. However, Sudair still relies mainly on two sources for water: groundwater and desalination of seawater. Groundwater supplies in the Saudair area come from two aquifers namely the Wasia Sandstone and the Aruma Group. Desalinated water is sourced from desalination plants along the Red Sea coast. Non-potable water sources have recently been considered, including rainwater harvesting and wastewater treatment.
Figure 1.
Location map of the study area and sampling sites (Source: Esri, Vantor, Earthstar Geographics, and the GIS User Community).
2.2. Sampling and Analytical Methods
Thirty-two soil samples were collected from a depth of 0–30 cm using a plastic hand shovel, with three subsamples combined to create a representative composite sample. These samples were stored in plastic bags in an icebox to preserve them. The samples were then processed by drying at 100 °C and grinding to a uniform particle size, with many being sieved to 63 µm. The samples were analyzed for PTEs like aluminum, arsenic, cobalt, chromium, copper, iron, manganese, nickel, lead, vanadium, and zinc using Inductively Coupled Plasma-Atomic Emission Spectrometry (ICP-AES) at ALS Geochemistry Lab in Jeddah, Saudi Arabia. A 0.50 g sample was digested with aqua regia for 45 min at 60–120 °C, then filtered and diluted to 50 mL, following established protocols [21]. The ICP-AES was calibrated using certified multi-element standards matching the soil samples’ acid matrix to ensure accuracy.
In order to validate the method’s accuracy, Certified Reference Materials (CRMs) with known compositions and matrix-matched to soil were analyzed alongside the samples. These CRMs were sourced from reputable producers, including the National Institute of Standards and Technology (NIST) and Sigma-Aldrich, which supply ALS-certified laboratories worldwide. To ensure the accuracy of the results, duplicate samples or splits were analyzed to check for precision and reproducibility, providing a measure of the laboratory’s performance and the reliability of the data obtained from the ICP-AES analysis.
2.3. Satellite Image and Statistical Analyses
Landsat images were retrieved from the USGS Earth Explorer, specifically Landsat 5 TM from 9 June 1995, and Landsat 8 OLI from 8 June 2024, both with a 30 m spatial resolution. These images were analyzed to study land use and land cover (LULC) changes over time. Using ArcGIS Pro (https://www.arcgis.com/home/webmap/viewer.html?webmap=52bdc7ab7fb044d98add148764eaa30a, accessed on 14 January 2026) (Esri, Vantor, Earthstar Geographics, and the GIS User Community), a supervised pixel-based classification was conducted, utilizing the Support Vector Machine (SVM) classifier. This method effectively distinguishes land cover classes by projecting data into a higher-dimensional space. The Support Vector Machine (SVM) was selected for its ability to handle challenges such as spectral overlap, noise, and variations in training sample sizes, ultimately leading to improved classification accuracy. The classification accuracy was assessed through cross-validation, yielding overall accuracies of 92% for 1995 and 88% for 2024, which validated the reliability of the classification process. Multivariate statistical techniques, including hierarchical cluster analysis (HCA), Pearson’s correlation matrix, and principal component analysis (PCA), were used to examine the potential sources and distribution patterns of PTEs. These analyses were conducted using IBM SPSS Statistics 29 and OriginPro 2023b software.
2.4. Indices Calculations
To evaluate the degree of metal and metalloid contamination and potential ecological risks in the studied soils, several contamination indices were calculated, including the Enrichment Factor (EF), Geo-accumulation Index (Igeo), Contamination Factor (CF), Pollution Load Index (PLI), and Potential Ecological Risk Index (RI) [8,22,23].
2.4.1. Enrichment Factor (EF)
The EF is used to determine whether an element’s concentration in soil results from natural geological processes or anthropogenic influences. It is calculated as:
where M is the concentration of the examined element in the sample, and X is the concentration of a reference element (commonly Fe, due to its natural abundance and stability in soils). The background ratio (M/X) background represents natural crustal levels, typically based on average shale values [24].
EF = (M/X) sample/(M/X) background
2.4.2. Geo-Accumulation Index (Igeo)
The Igeo, proposed by Müller [22], assesses the degree of element enrichment in soils relative to background concentrations:
where Cn is the measured concentration of the element in the soil, Bn is its background concentration, and the constant 1.5 accounts for possible natural variations in background values.
Igeo = log2 (Cn/(1.5 × Bn))
2.4.3. Contamination Factor (CF)
The CF evaluates the level of contamination by comparing the measured element concentration to its background value:
CF = Cn/Bn
2.4.4. Pollution Load Index (PLI)
The PLI provides an overall assessment of contamination for all studied elements, integrating the CF values:
where CF1, CF2, …, CFn are the contamination factors for each element, and n is the number of elements analyzed.
PLI = (CF1 × CF2 × CF3 × … × CFn)^(1/n)
2.4.5. Potential Ecological Risk Index (RI)
The RI evaluates the overall potential ecological risk posed by the analyzed elements, incorporating their toxicity response factors:
where Tri is the toxic response factor for each element, and Cfi is its contamination factor. The toxic response factors used in this study were: Zn = Co = 1, Cr = 2, Ni = 6, Cu = Pb = 5, and As = 10 [8,25].
RI = Σ (Tri × Cfi)
3. Results and Discussion
3.1. Soil Characteristics and Spatial Distribution of PTEs
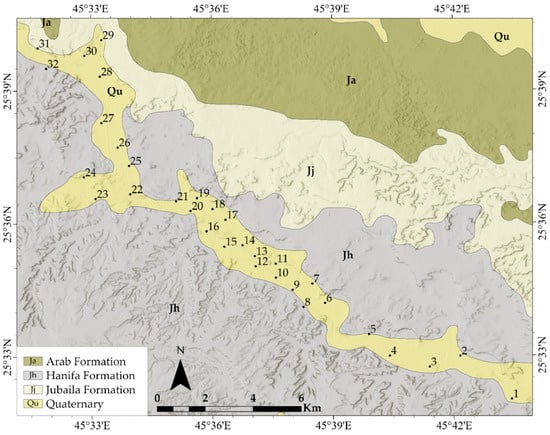
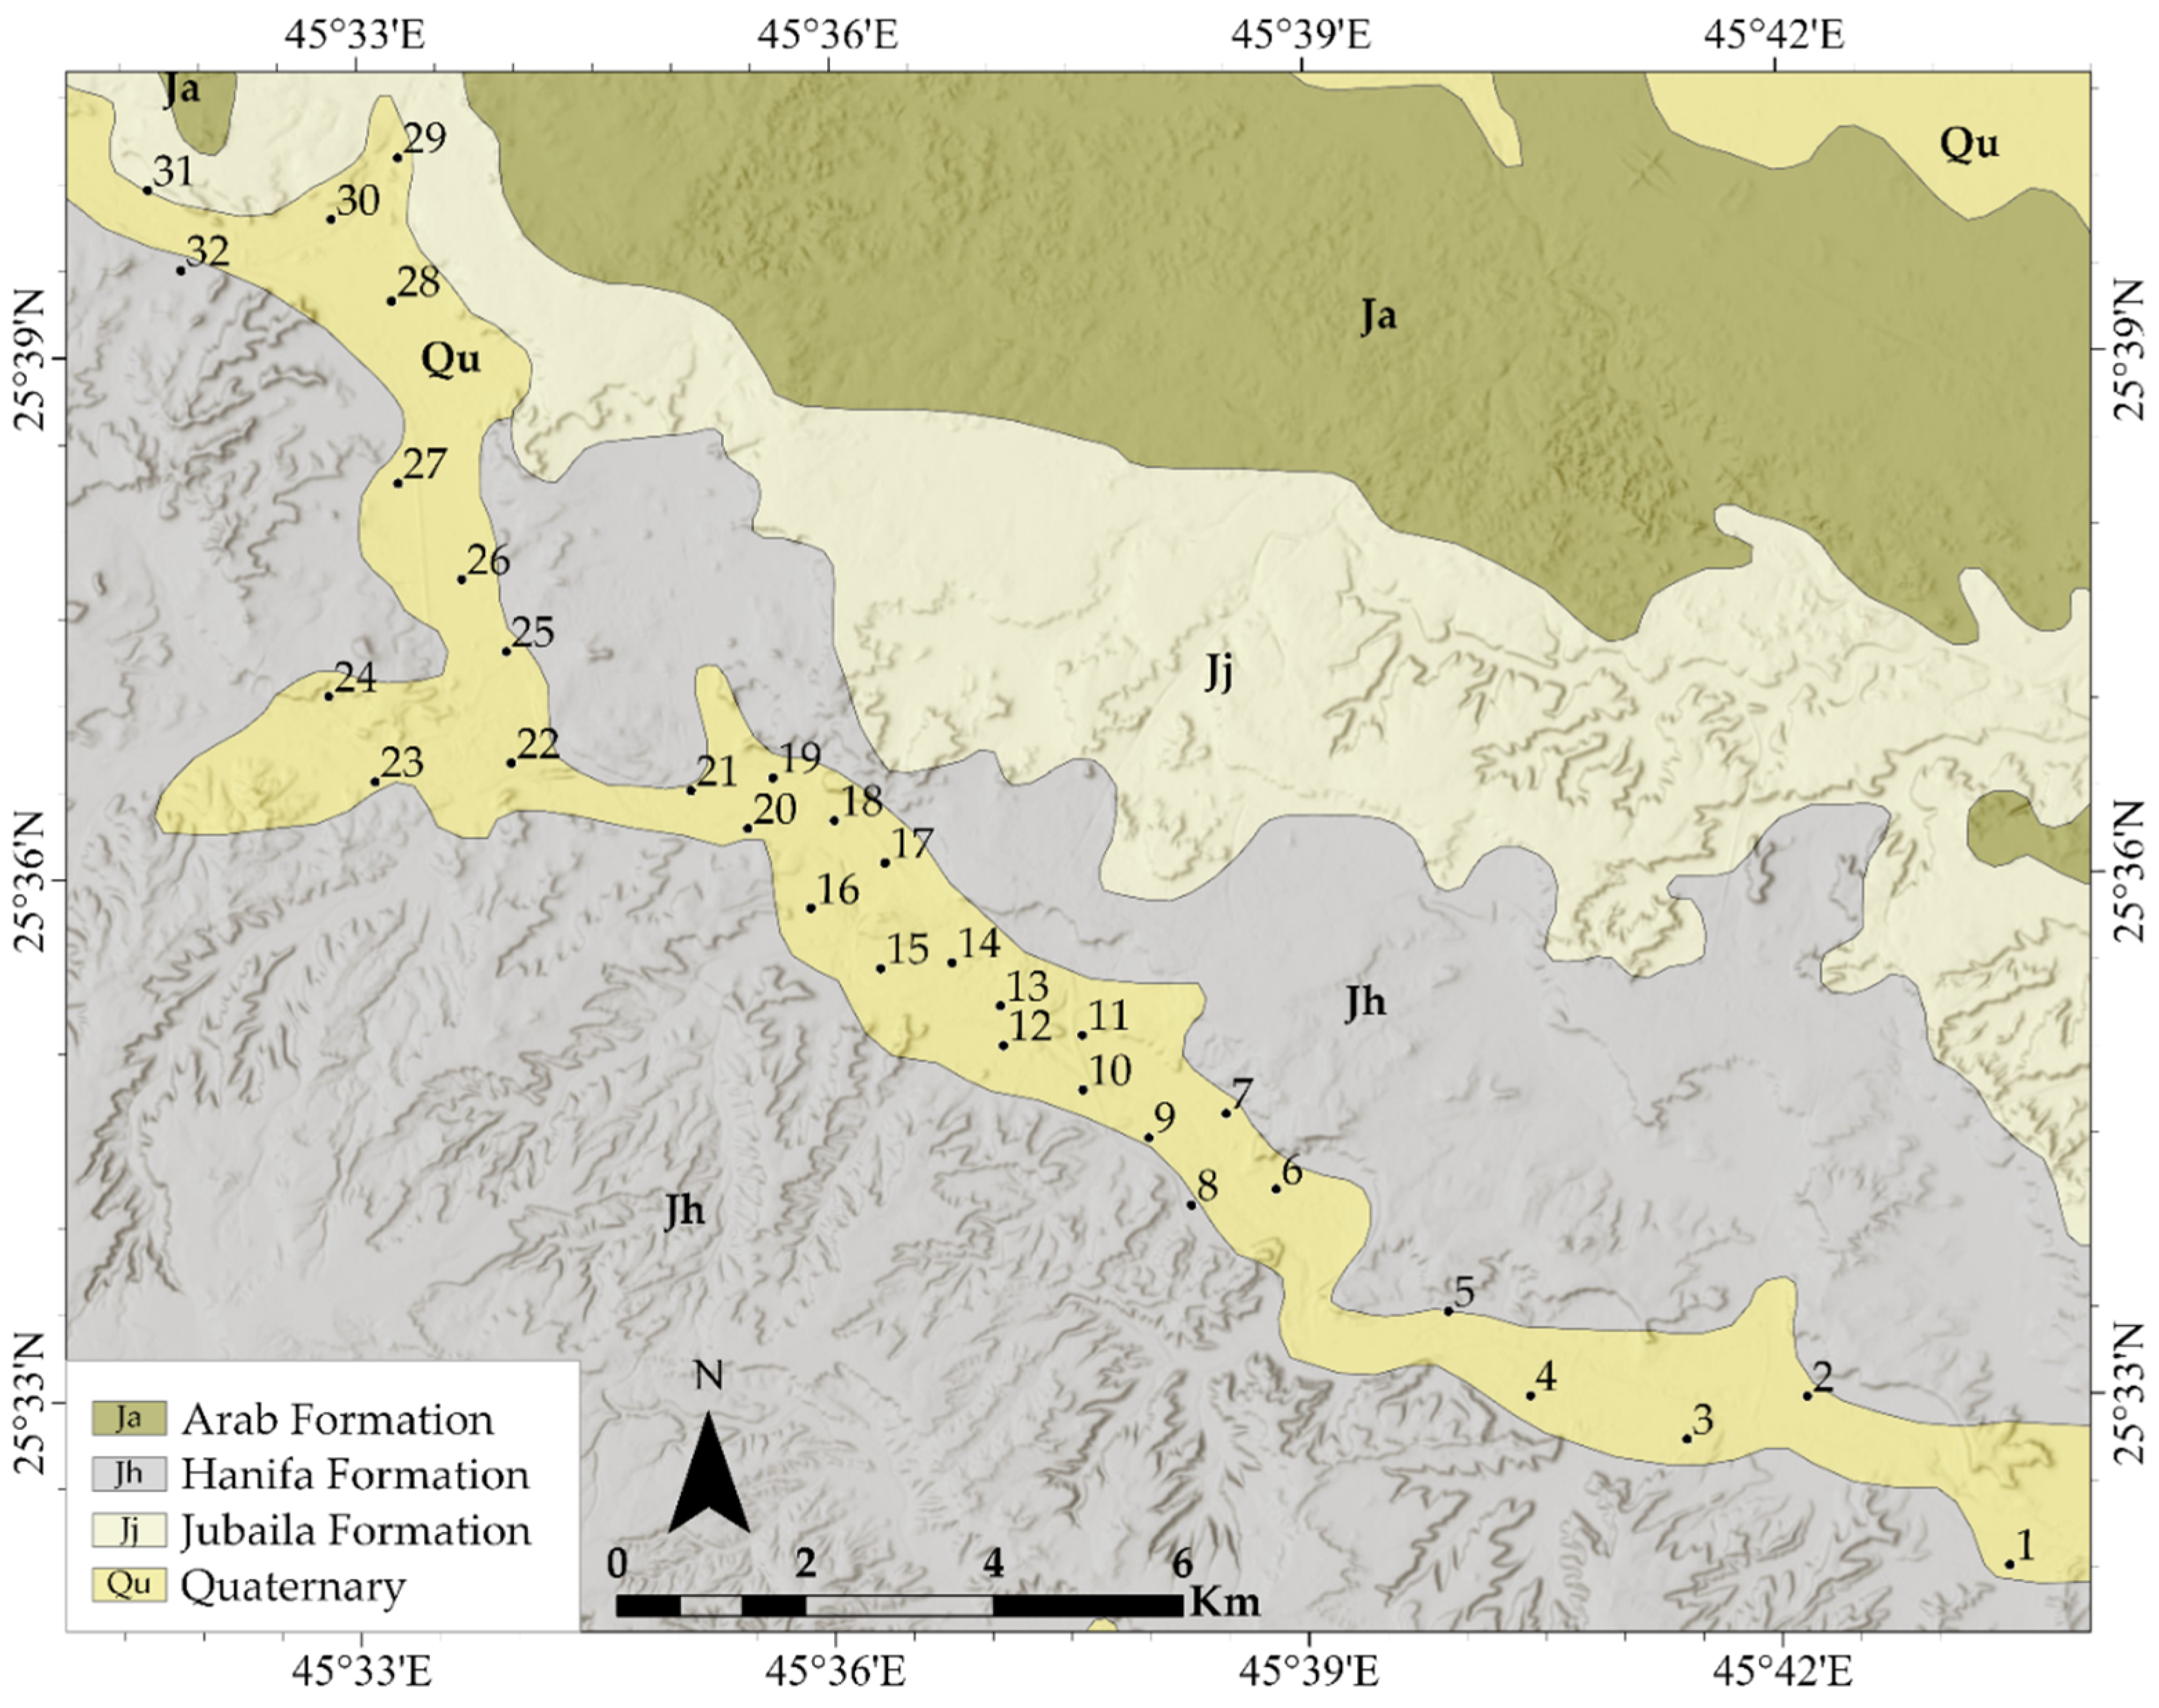
The geological map in Figure 2 shows that the area’s sedimentary layers are composed of a combination of Jurassic and Quaternary deposits, indicating changes in depositional environments over time. The Jurassic deposits primarily comprise a combination of marine carbonates and siliciclastics from the Oxfordian Hanifa Formation, the Kimmeridgian Jubaila and Arab formations [26,27,28,29]. The Quaternary deposits which include almost all the investigated soils are composed of unconsolidated surficial silt, sands, and gravels. The majority of the agricultural soils (78.13%) in the Hautat Sadair are of Calciorthids and Torrifluvents, while the Torriorthents and Calciorthids represent 21.87% [30,31]. Calciorthids are characterized by textures that range from sandy to loamy and are distinguished by the accumulation of secondary carbonates, forming a calcic horizon. In contrast, Torrifluvents are layered Entisols that form in alluvial sediments deposited by intermittent streams. Torriorthents, in comparison, are typically found on slopes undergoing active erosion, where they develop in resistant materials, residuum, or colluvium. These soils are generally shallow, have low clay content, and exhibit textures that vary from sandy to sandy loam.
Figure 2.
Sampling location and stratigraphic lithology of the study area.
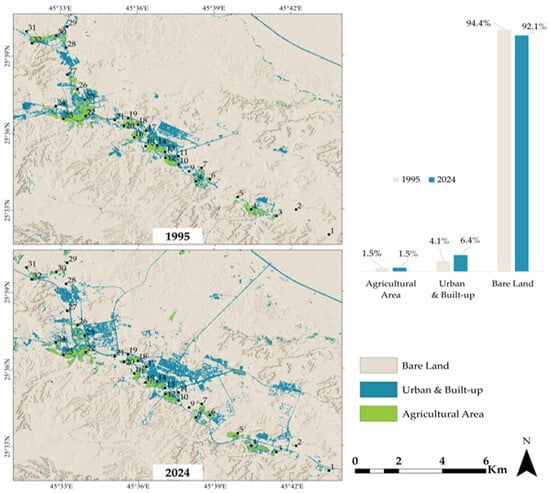
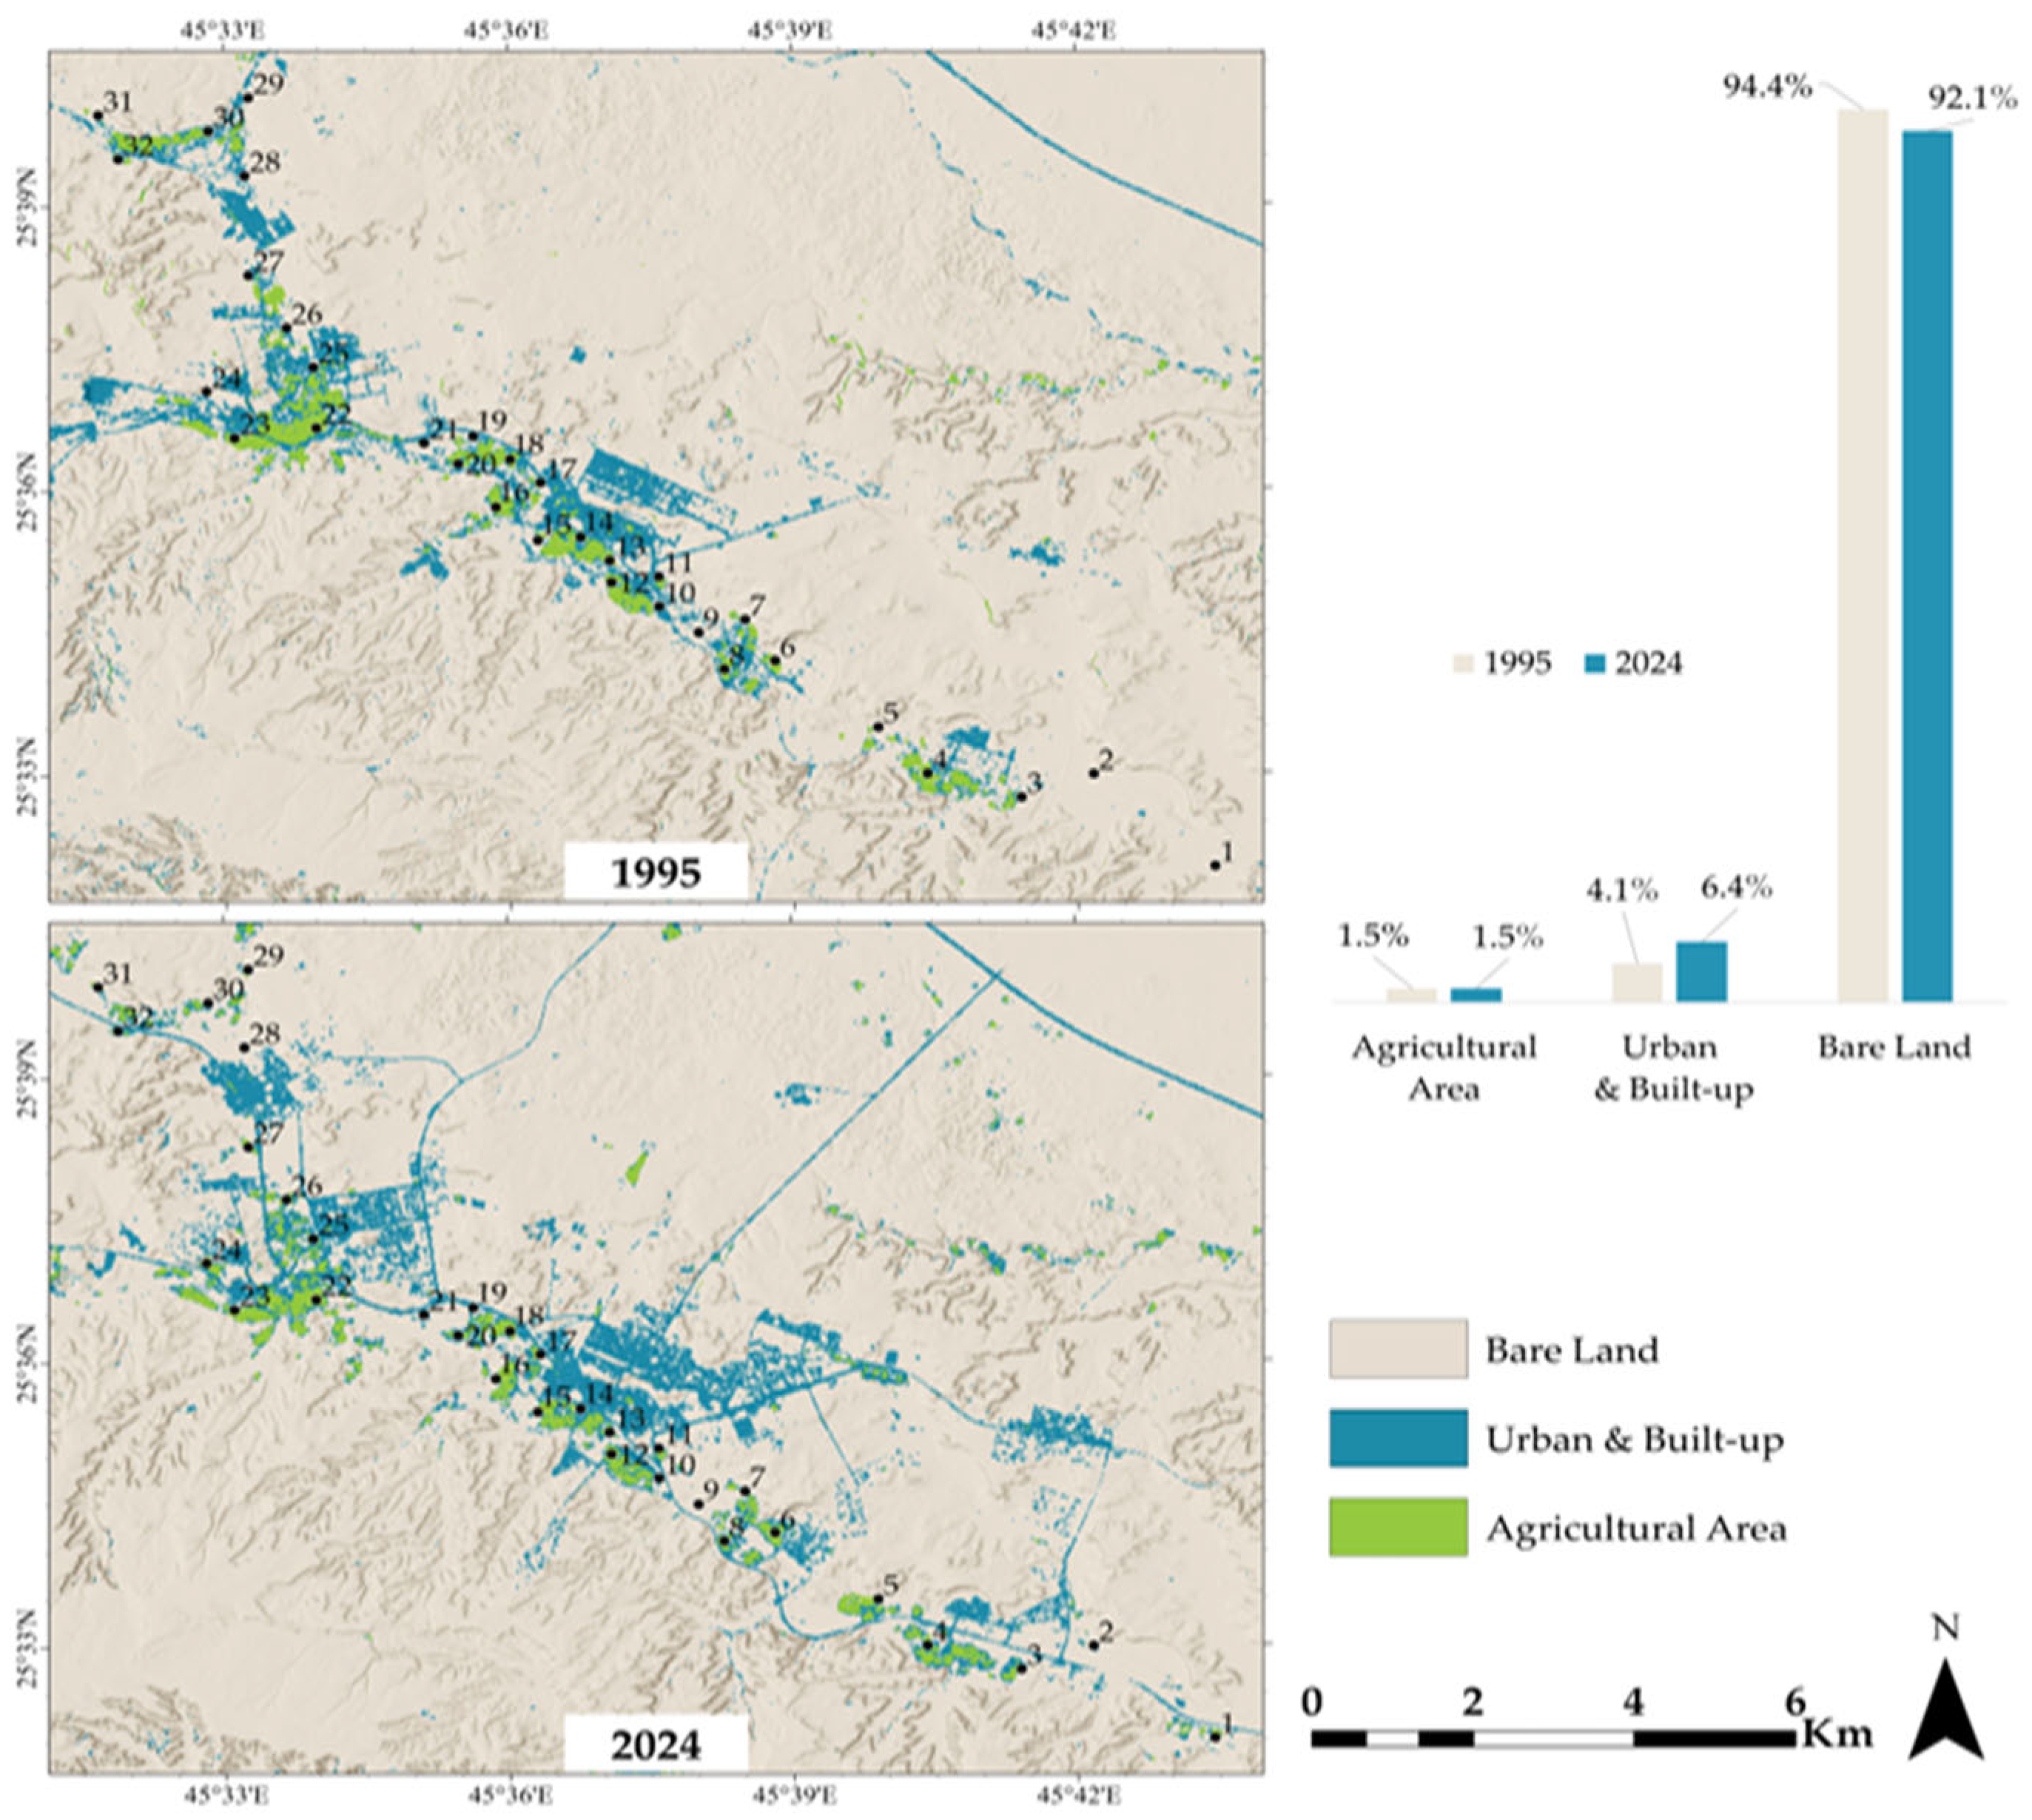
The LULC (Land Use/Land Cover) maps are utilized to track changes in landscapes over time. Figure 3 depicts the land use in the study region, comparing four categories during a 29-year period from 1995 to 2024: bare lands, urban and built-up lands, and agricultural fields. By 2024, urban and built-up areas which made up roughly 4.1% (14.6 km2) of the total area in 1995, had slightly increased to 6.4% (22.9 km2). Clearly, this increase in the percentage of this category came at the expense of a decrease in bare land areas (from 94.4 to 92.1%). However, the agricultural areas are nearly unchanged (5.4 km2, 1.5%) from 1995 to 2024.
Figure 3.
Comparison between LULC for the study area in 1995 and 2024.
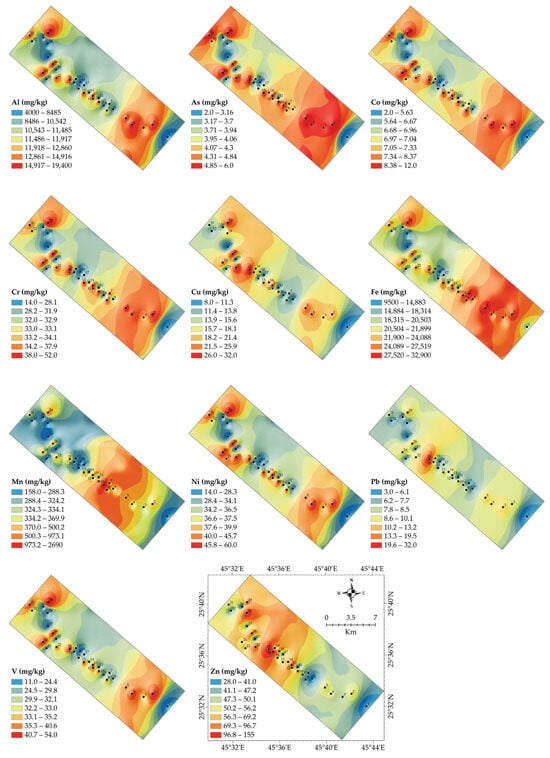
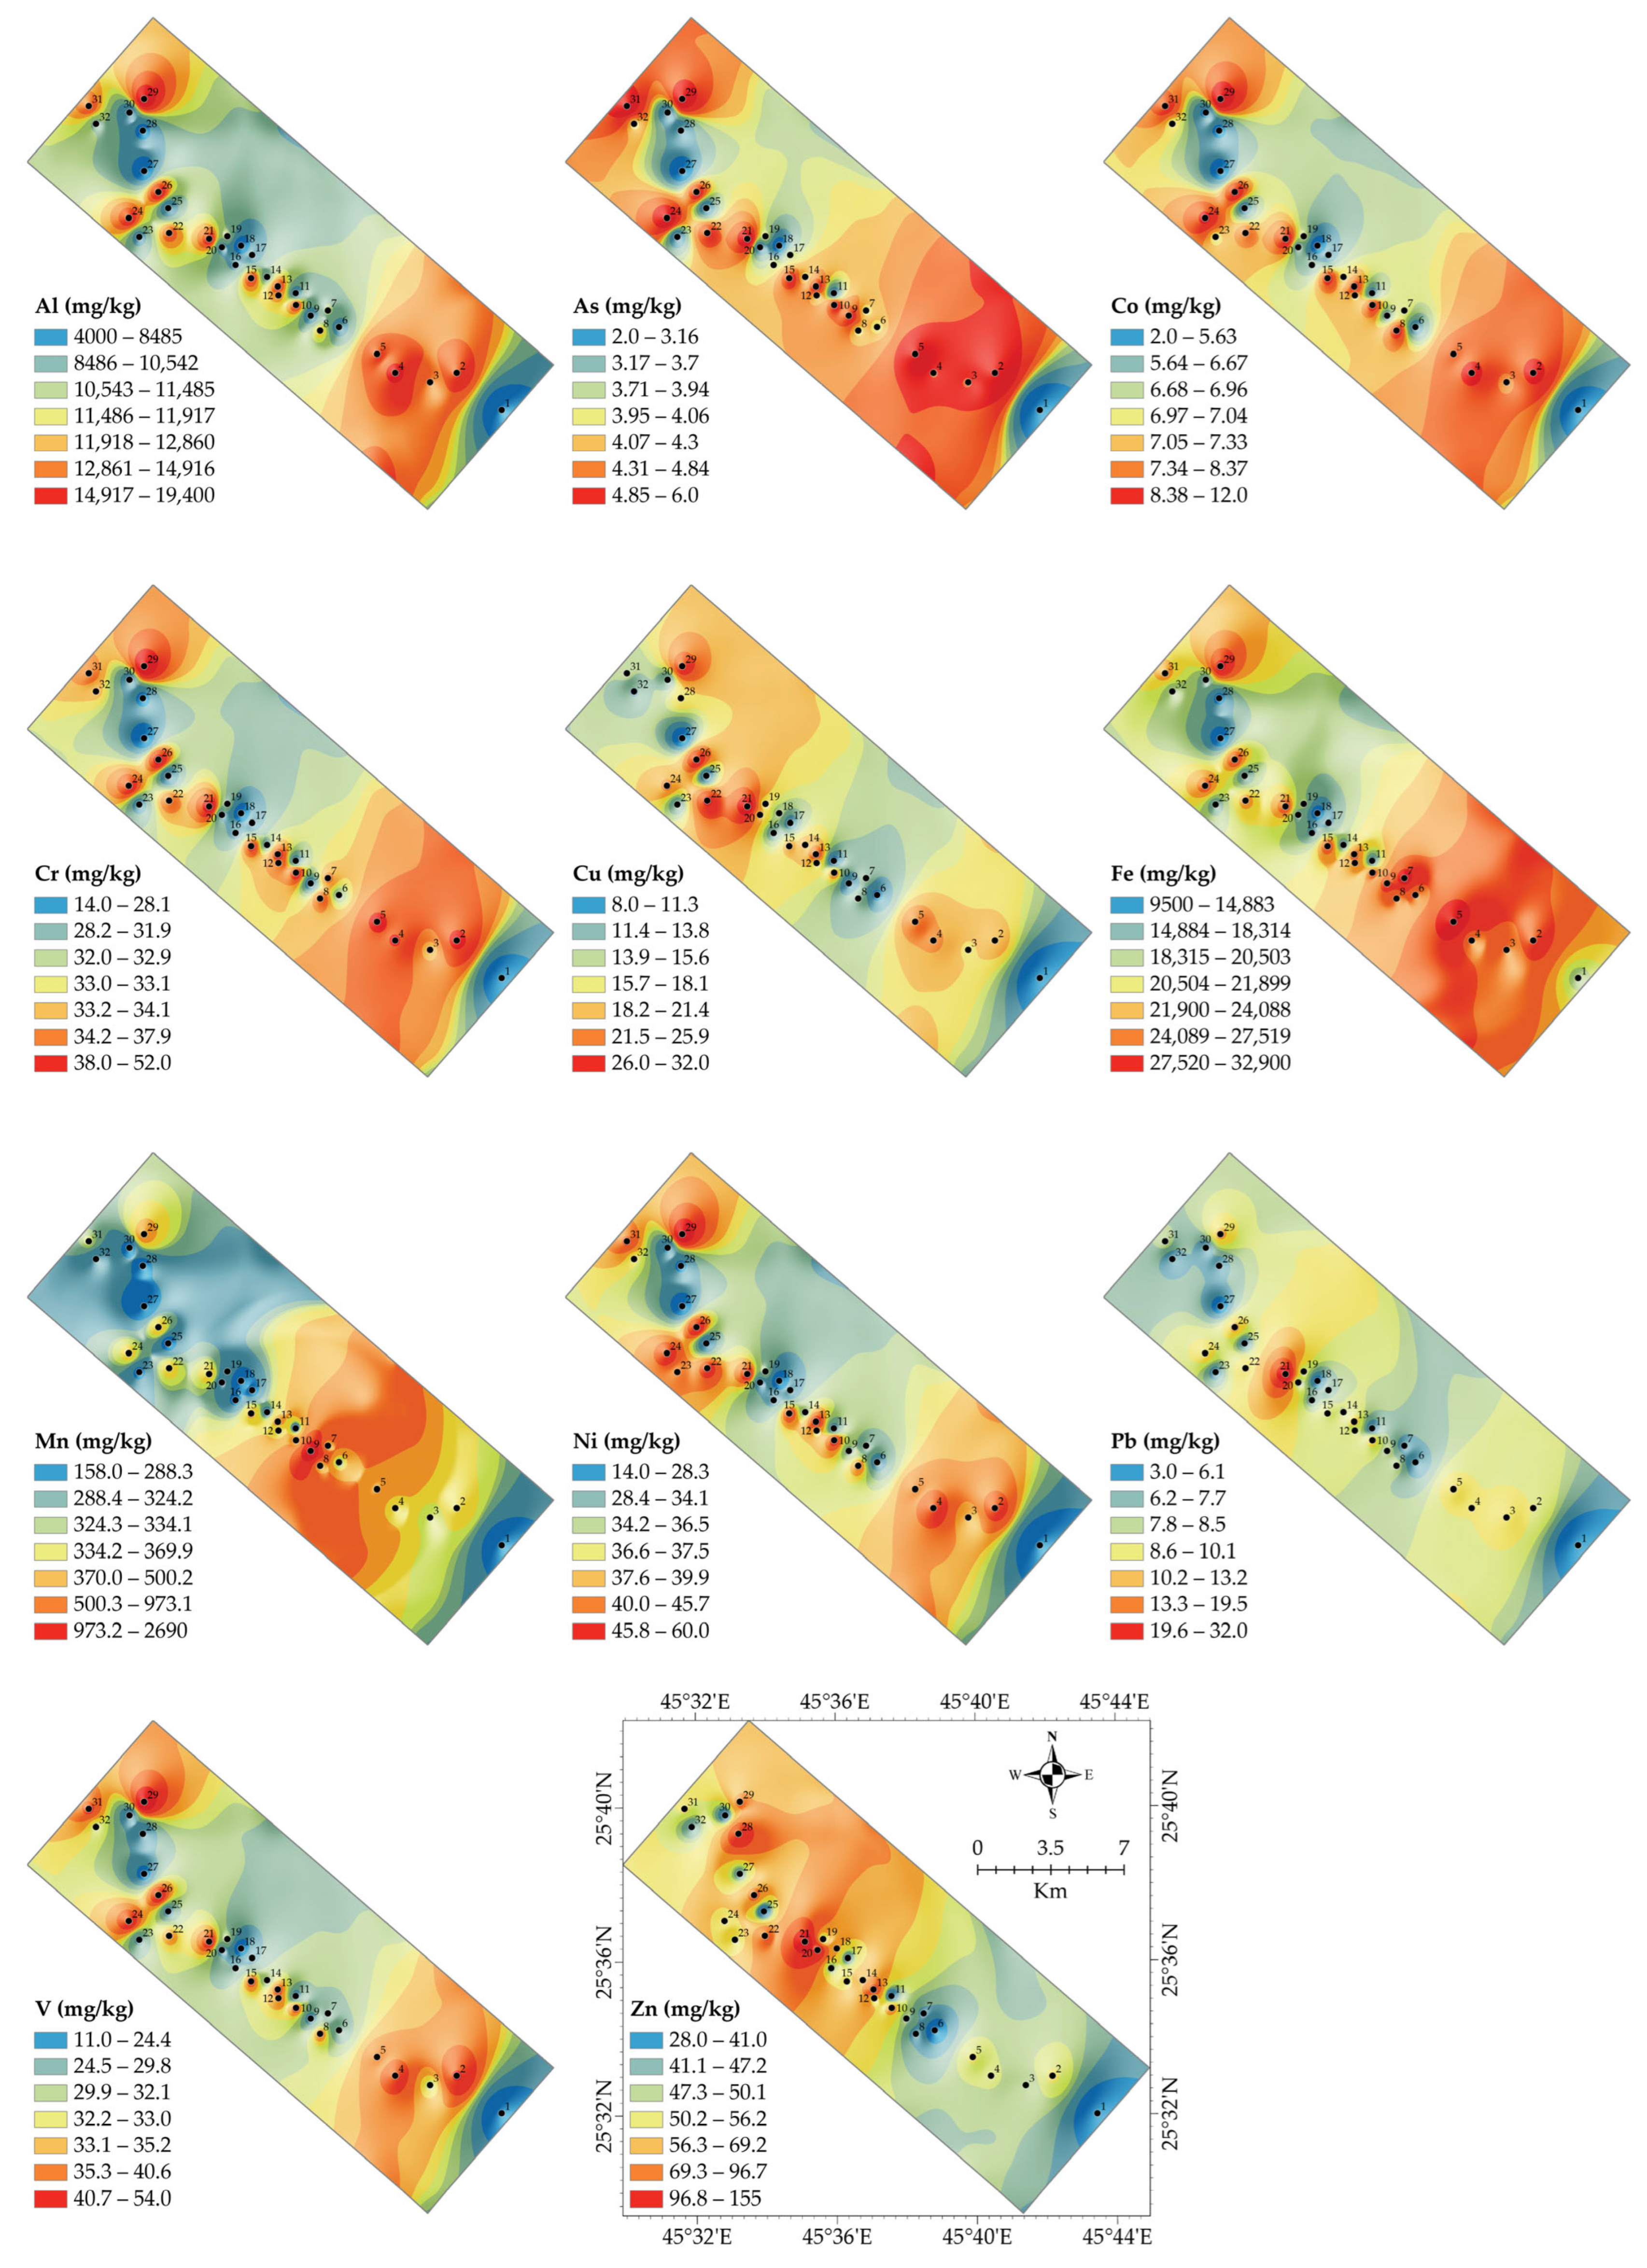
The spatial distribution of PTEs in soils offers valuable information on contamination sources, potential ecological risks, and environmental impacts [1]. Table S2 presents the concentration of PTEs (mg/kg in Hautat Sudair soil, while Figure 4 illustrates the spatial distribution of PTEs in the investigated soils. Concentrations of Al range from 4000 to 19,400 mg/kg, with higher values found in the eastern and southeastern regions. Al mainly originates from the natural weathering of aluminosilicate minerals, with little to no impact from human activities, as noted by [2]. Levels of Fe range between 1940 and 32,900 mg/kg, with hotspots in the central and eastern sections. Fe distribution is closely tied to the soil’s parent material, and its high concentrations are attributed to natural enrichment rather than contamination [32,33]. Mn concentrations vary from 284.2 to 2690 mg/kg, with notable hotspots in the northwestern and southeastern parts. Mn can accumulate in the environment due to either human activity such as industrial and vehicular emissions or natural geochemical processes, as noted by [3]. Levels of As range from 2.70 to 6.0 mg/kg, with higher concentrations in the northeastern area. Arsenic contamination can originate from various sources, including the use of pesticides, mining operations, and industrial activities [34]. Concentrations of Pb range from 3.2 to 32.0 mg/kg, with hotspots in the central and southwestern areas. Lead (Pb) contamination is strongly associated with vehicular emissions and the historical use of leaded gasoline [35]. The observed values suggest moderate Pb contamination in certain areas, warranting further evaluation to assess potential health risks. Levels of Ni vary between 24.2 and 76.5 mg/kg, with elevated concentrations in the southern and northeastern zones. Nickel contamination can stem from metal processing and natural rock weathering, as reported by [36]. While Ni is essential for plant growth, excessive levels can be toxic to biota and pose environmental concerns.
Figure 4.
Spatial distribution of the PTEs in Hautat Sudair soil.
Chromium ranges from 14.2 to 52 mg/kg, with hotspots in the eastern and central zones. Cr contamination is often linked to industrial activities such as metal plating, leather tanning, and industrial discharges [37]. Co ranges from 8.0 to 32 mg/kg, and higher values are detected in the northeastern section. Co can enter soils through industrial and vehicular sources. Elevated levels may impact soil microbial activity and plant uptake [3]. Copper values vary between 11.5 and 29.9 mg/kg, with higher concentrations in the central areas. Cu contamination commonly arises from the use of agricultural fungicides, mining activities, and industrial emissions, as noted by [2]. Concentrations of vanadium range from 30.4 to 92.3 mg/kg, with hotspots in the southern part. V originates from sources including coal combustion, industrial emissions, and natural mineral weathering. Thus, elevated levels of this element may suggest anthropogenic contamination [32]. Zinc Levels range from 49.6 to 147 mg/kg, with higher concentrations in the central and northeastern regions. Zn is commonly used in vehicular components, galvanized materials, and agricultural fertilizers, which makes it a significant indicator of anthropogenic contamination [37].
The analysis of PTE concentrations in the Hautat Sudair soil samples indicates that most metal levels are within internationally accepted limits, although a few exceptions warrant further attention. Arsenic levels in the soil exceed the US EPA residential standard of 0.39 mg/kg, yet remain below the WHO/FAO limit of 20 mg/kg, suggesting a need for ongoing monitoring due to potential sources such as pesticide use [38]. Cobalt concentrations are within the natural background range [39], while chromium levels (14.00–52.00 mg/kg) remain below the WHO/FAO limit of 100 mg/kg but approach the US EPA residential threshold of 23 mg/kg, particularly in sample S29 (52 mg/kg), suggesting localized accumulation from industrial or agricultural sources [35]. Copper and zinc levels remain well below their respective WHO/FAO limits of 100 mg/kg and 300 mg/kg, with Zn in S21 (155 mg/kg) possibly linked to fertilizer application [37]. Nickel concentrations indicate potential concern, as sample S29 (60 mg/kg) exceeds the WHO/FAO safe limit of 50 mg/kg, suggesting industrial or vehicular sources [33]. Lead levels are within the WHO/FAO threshold of 50 mg/kg and the US EPA residential limit of 400 mg/kg, indicating no significant risk of contamination. Manganese levels show high variation, with sample S9 (2690 mg/kg) indicating potential plant toxicity due to geogenic factors or fertilizer overuse [3]. Iron concentrations (9500–32,900 mg/kg) are naturally abundant in soil and do not pose contamination concerns. Vanadium levels are within global background values [3], suggesting a minimal risk of contamination. While most PTEs are within safe limits, elevated levels of Mn in sample S9, Ni in sample S29, and Cr in some samples necessitate further investigation and possible mitigation strategies.
3.2. Risk Assessment of PTEs
The results of the three key indices (EF, Igeo, and CF) in Table 1 indicate that PTEs generally fall within low contamination categories. However, specific elements show moderate to high enrichment in certain locations. The findings are benchmarked against international contamination standards and prior research to provide context on potential risks and implications [3,40].
Table 1.
Minimum, maximum, and average values of the contamination indices.
3.2.1. Enrichment Factors (EF)
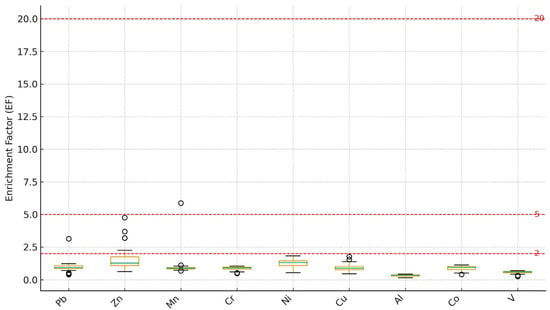
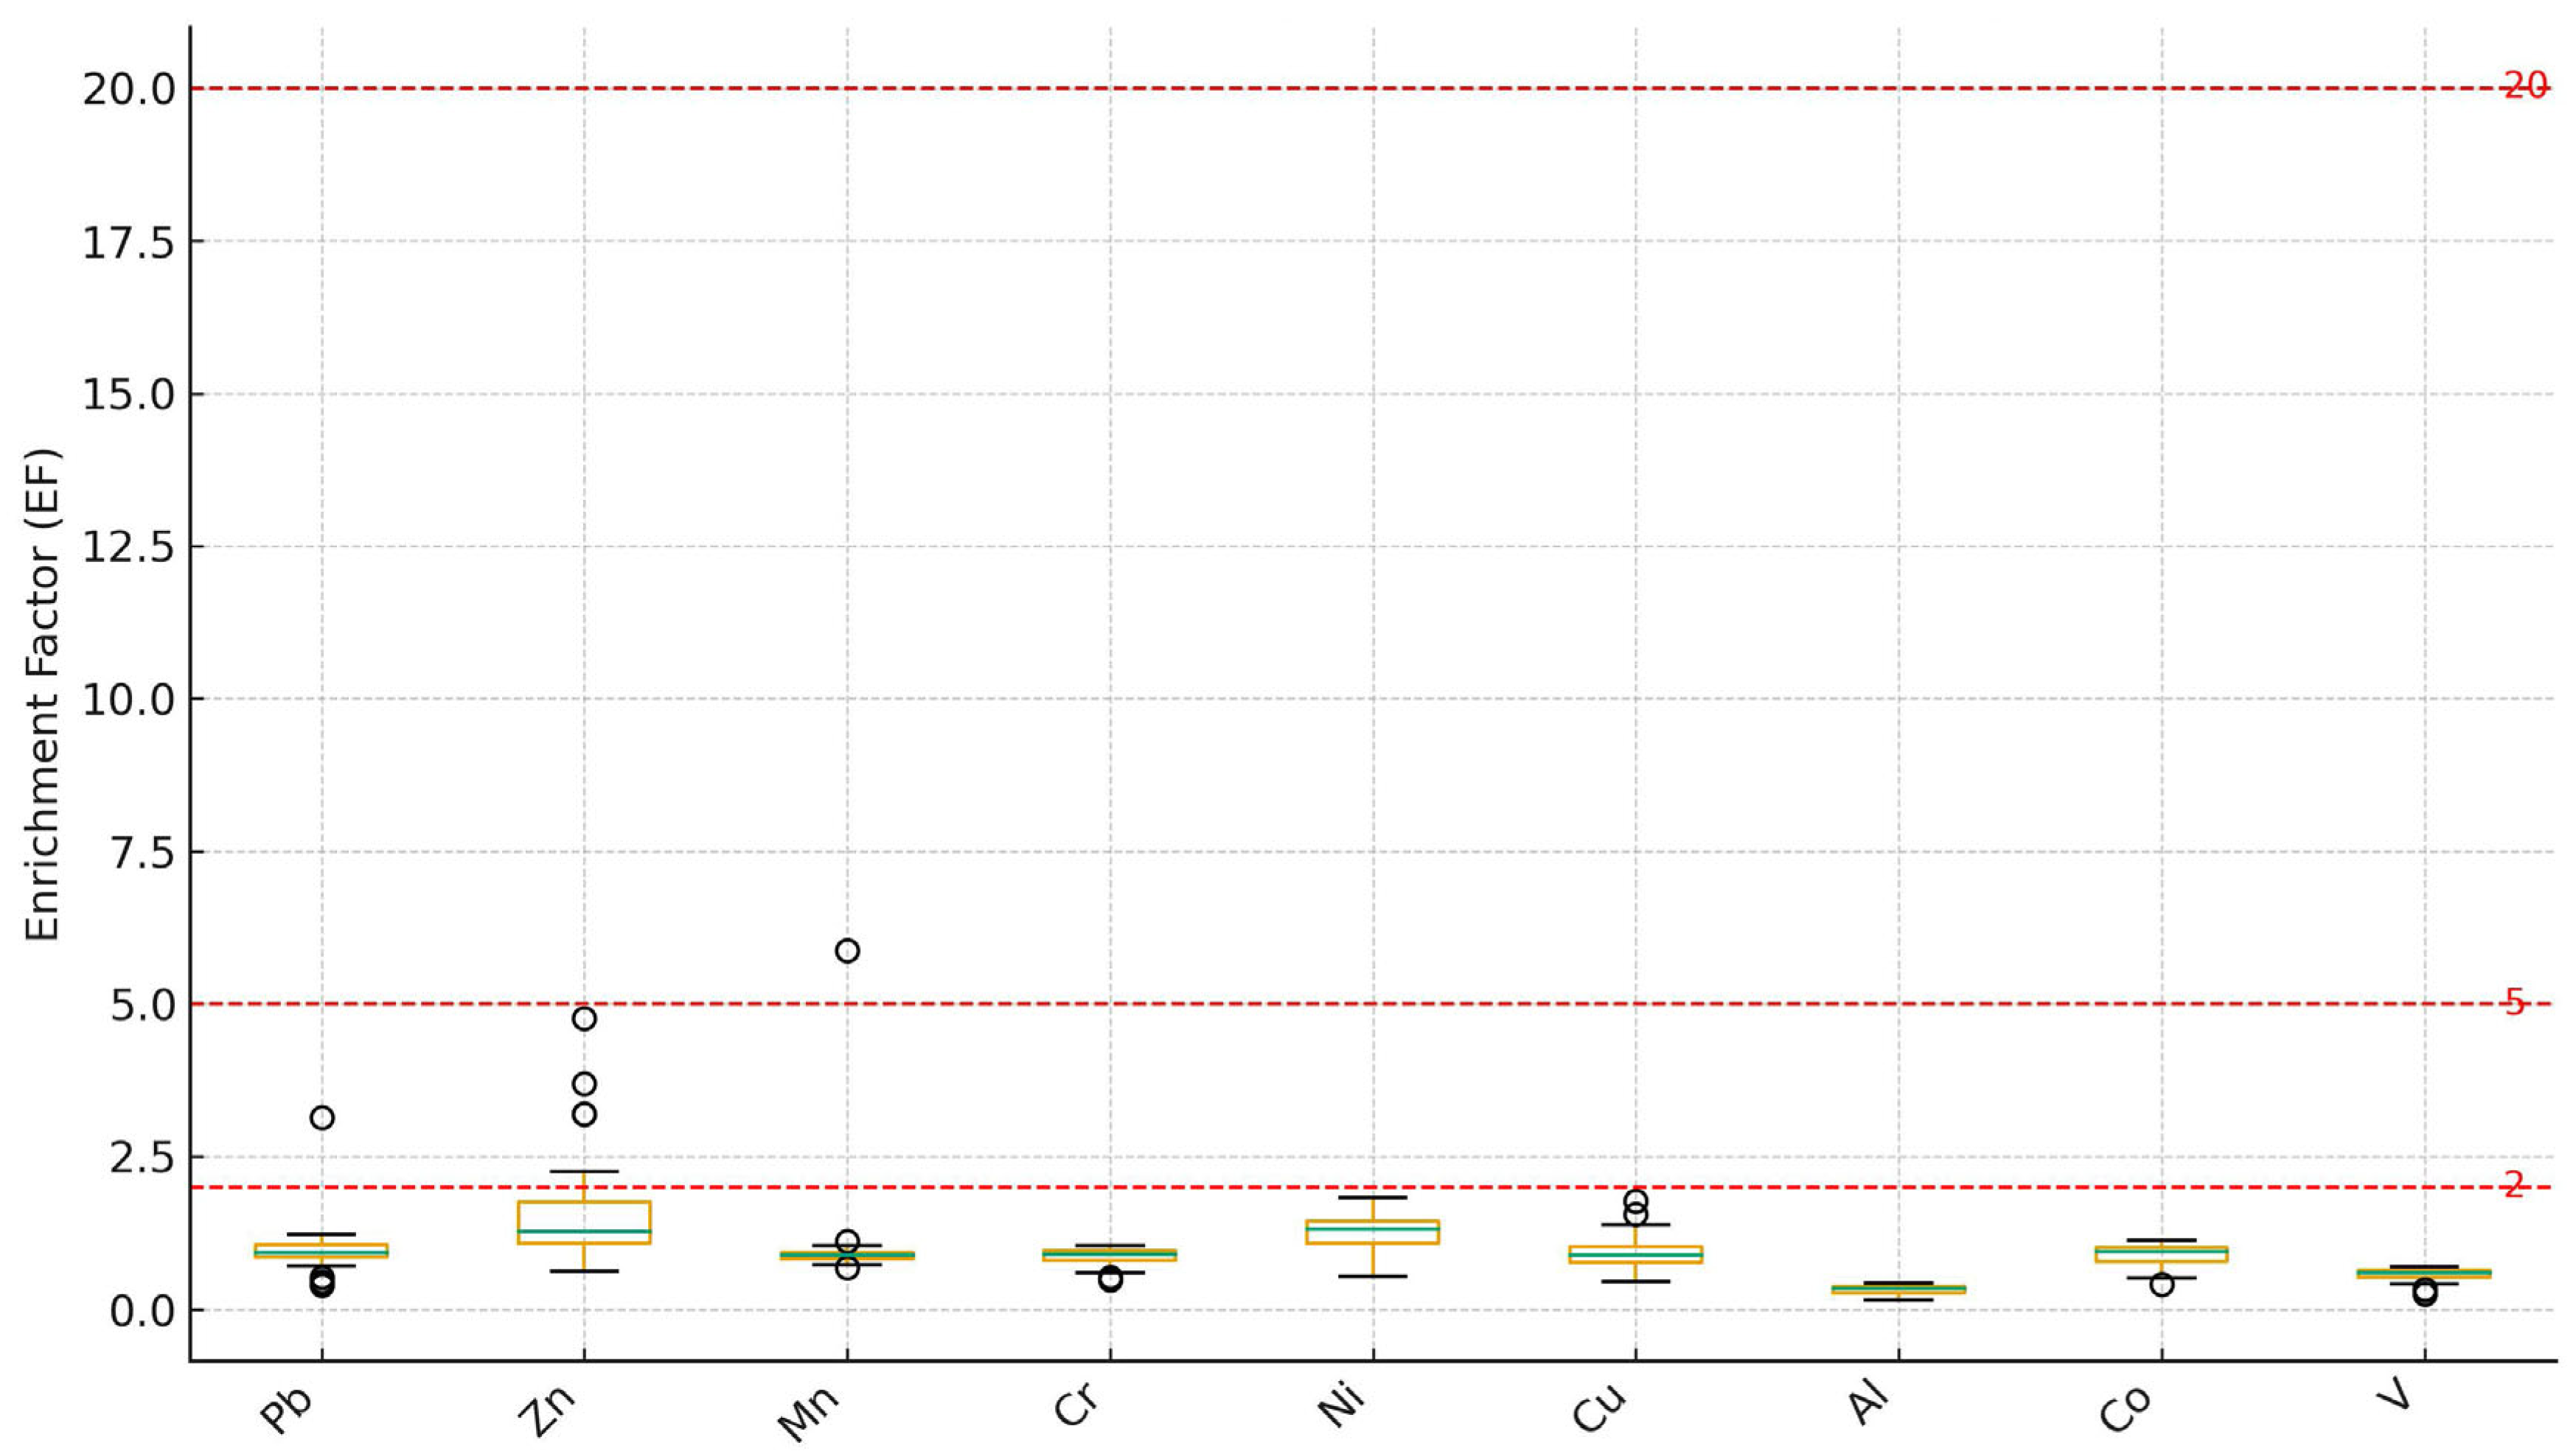
The EF is a diagnostic index employed to differentiate between natural (geogenic) and anthropogenic contributions of elements in soils. EF values close to 1 generally indicate a lithogenic origin, whereas values exceeding 1.5 suggest potential anthropogenic influence [41,42]. In the present study, EF values for Pb, Zn, and Mn ranged from 0.40–3.13, 0.63–4.76, and 0.69–5.88, respectively, with corresponding mean values of 1.03, 1.67, and 1.17. The elevated EF values of Pb (>3.0) observed in a few samples indicate moderate enrichment, likely related to residual effects of historical pesticide use and vehicular emissions [37,43]. Zinc exhibited slightly higher enrichment (EF > 1.5) in some samples, implying limited anthropogenic contributions possibly from phosphate fertilizers and agrochemical inputs commonly applied in cultivated soils [35,39]. Manganese, with isolated EF values exceeding 5.0, suggests localized enrichment possibly linked to fertilizer additives, as Mn is widely used as a micronutrient in agricultural practices. In contrast, Ni, Cr, and Cu generally exhibited EF values below 2, confirming that these metals primarily originate from the natural parent material, while V and Al remained close to unity, further reinforcing their geogenic source.
Bioavailability and arid-soil controls (pH, carbonates, and redox). Although total concentrations and enrichment indices indicate localized Mn and Ni enrichment, the ecological relevance depends on the bioavailable fraction, which is strongly regulated by arid-soil properties. Calcareous soils typical of central Saudi Arabia often exhibit high pH and abundant CaCO3, conditions that promote adsorption and precipitation of many metals (including Ni and Pb) onto carbonates and Fe/Mn oxides, thereby reducing the labile pool measured by chelating extractants such as DTPA. In addition, Mn is redox-sensitive; changes in soil moisture and aeration can shift Mn between in-soluble oxides and more mobile reduced forms, producing hotspots in total Mn without implying uniformly high biological availability. Therefore, the low overall RI/PLI values are consistent with a system dominated by geo-genic background and limited mobility, but site-specific follow-up (pH, CaCO3, redox potential, and bioavailable/extractable fractions) is recommended to refine ecological relevance of localized hotspots.
The box plots of EF values (Figure 5) illustrate that most elements fall below the moderate enrichment threshold (EF = 2), indicating predominantly geogenic contributions. Slightly elevated EF values for Pb and Zn (EF ≈ 3–4) in a limited number of samples suggest localized anthropogenic inputs, potentially linked to agricultural activities, vehicular emissions, or fertilizer application. Mn exhibits a broader distribution with occasional outliers approaching EF ≈ 5, reflecting both natural enrichment and minor agricultural influence. The narrow interquartile ranges and low medians across most elements support the inference that the Hautat Sudair soils demonstrate that geogenic processes dominate the metal concentrations, with only minor, spatially confined anthropogenic inputs consistent with the characteristics of arid agroecosystems [43].
Figure 5.
Box plots of EF values for PTEs in agricultural soils of the Hautat Sudair area, with reference thresholds.
3.2.2. Geoaccumulation Index (Igeo)
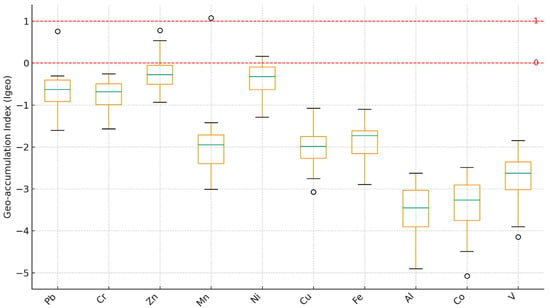
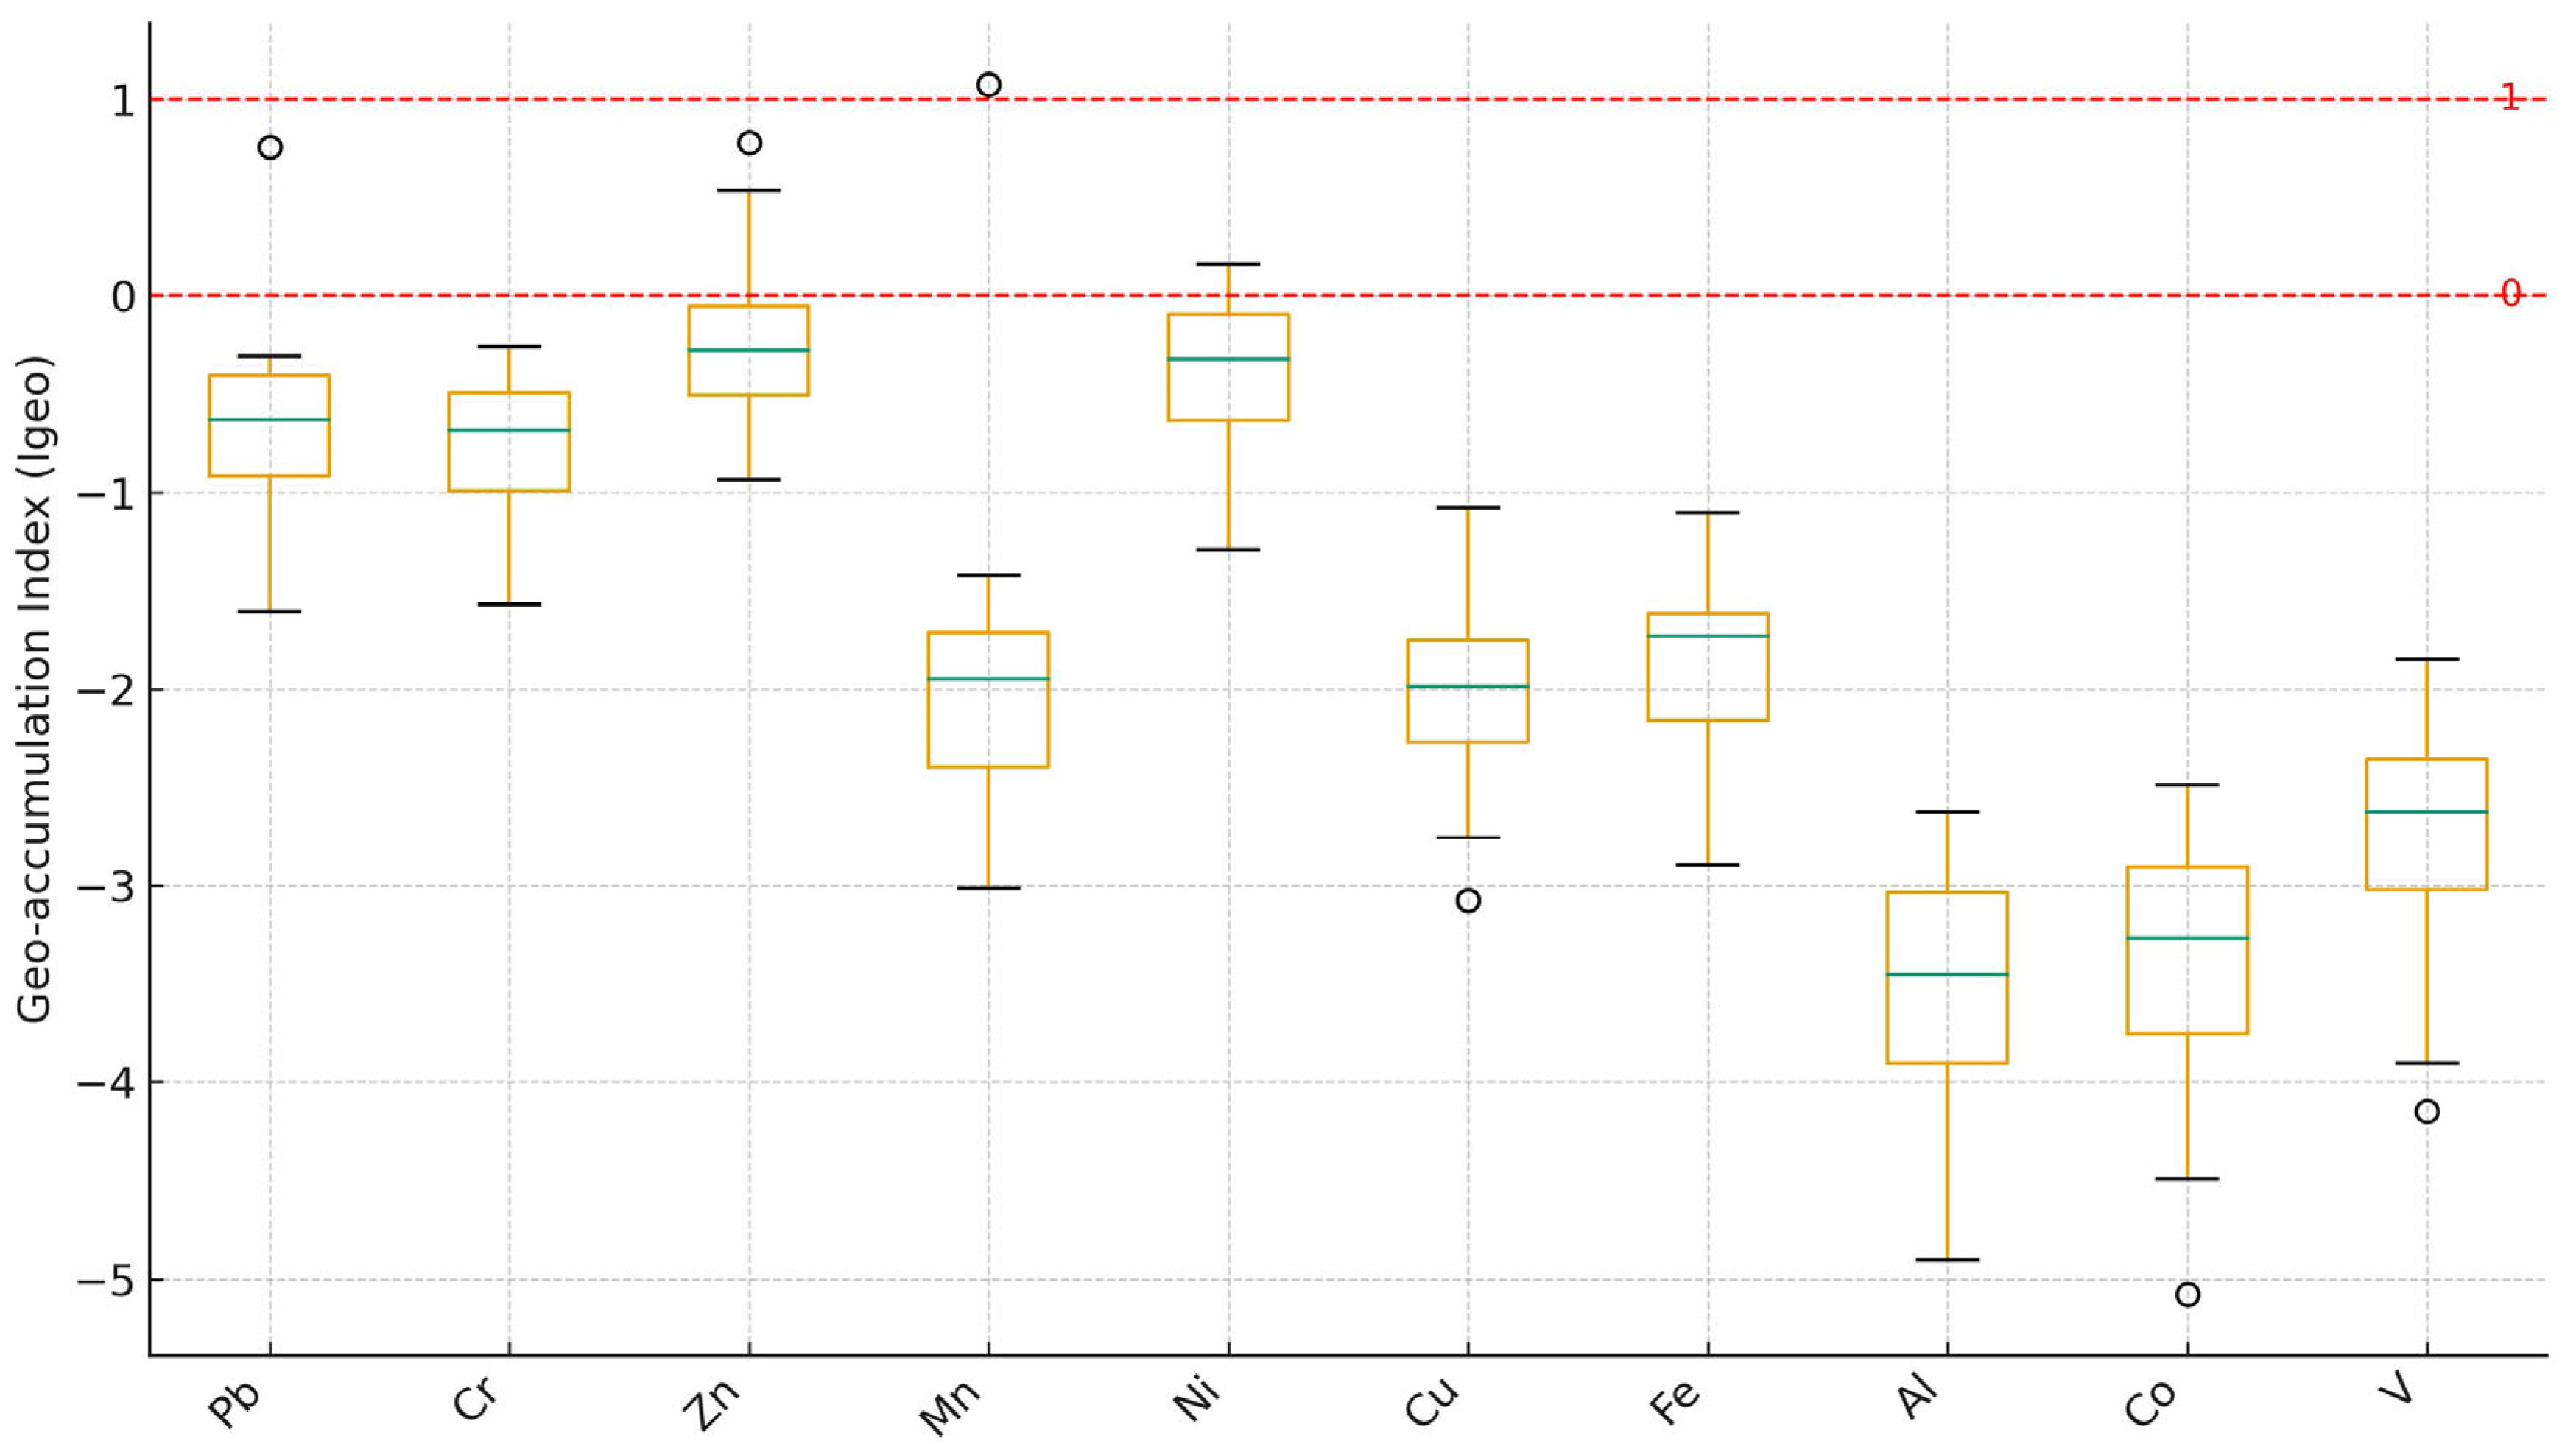
The Igeo, introduced by Müller [22], is a widely used metric for assessing metal accumulation in soils relative to background concentrations. It classifies contamination into seven categories, ranging from uncontaminated (Igeo ≤ 0) to extremely contaminated (Igeo > 5) (Table S1). In the present study, most PTEs display negative Igeo values, indicating that the soils are largely uncontaminated to moderately contaminated. Manganese exhibited the highest Igeo value (1.08), suggesting moderate enrichment in a few samples, consistent with its elevated EF values and possible inputs from agricultural activities or fertilizer use [22,35,44]. Iron showed slightly positive Igeo values (0.20–0.70), implying minor accumulation that may result from localized anthropogenic inputs, despite its natural abundance in soils.
The distribution of Igeo values (Figure 6) shows that the majority of elements fall within the ‘uncontaminated’ category (Igeo < 0), with only isolated samples exhibiting slightly positive values for Ni and Mn. These low-positive values indicate minor enrichment at specific locations rather than widespread contamination. The narrow interquartile ranges support the conclusion that anthropogenic impacts are spatially limited. These minor deviations correspond with samples that also show slightly elevated EF and CF values, reinforcing the interpretation that anthropogenic influence is minimal and spatially confined [42]. Comparable findings have been reported for semi-arid agricultural regions, where soil metal content is primarily controlled by parent material, with marginal contributions from surface agricultural inputs [3,33,42].
Figure 6.
Box plots of Igeo values for PTEs, with reference thresholds.
3.2.3. Contamination Factor (CF)
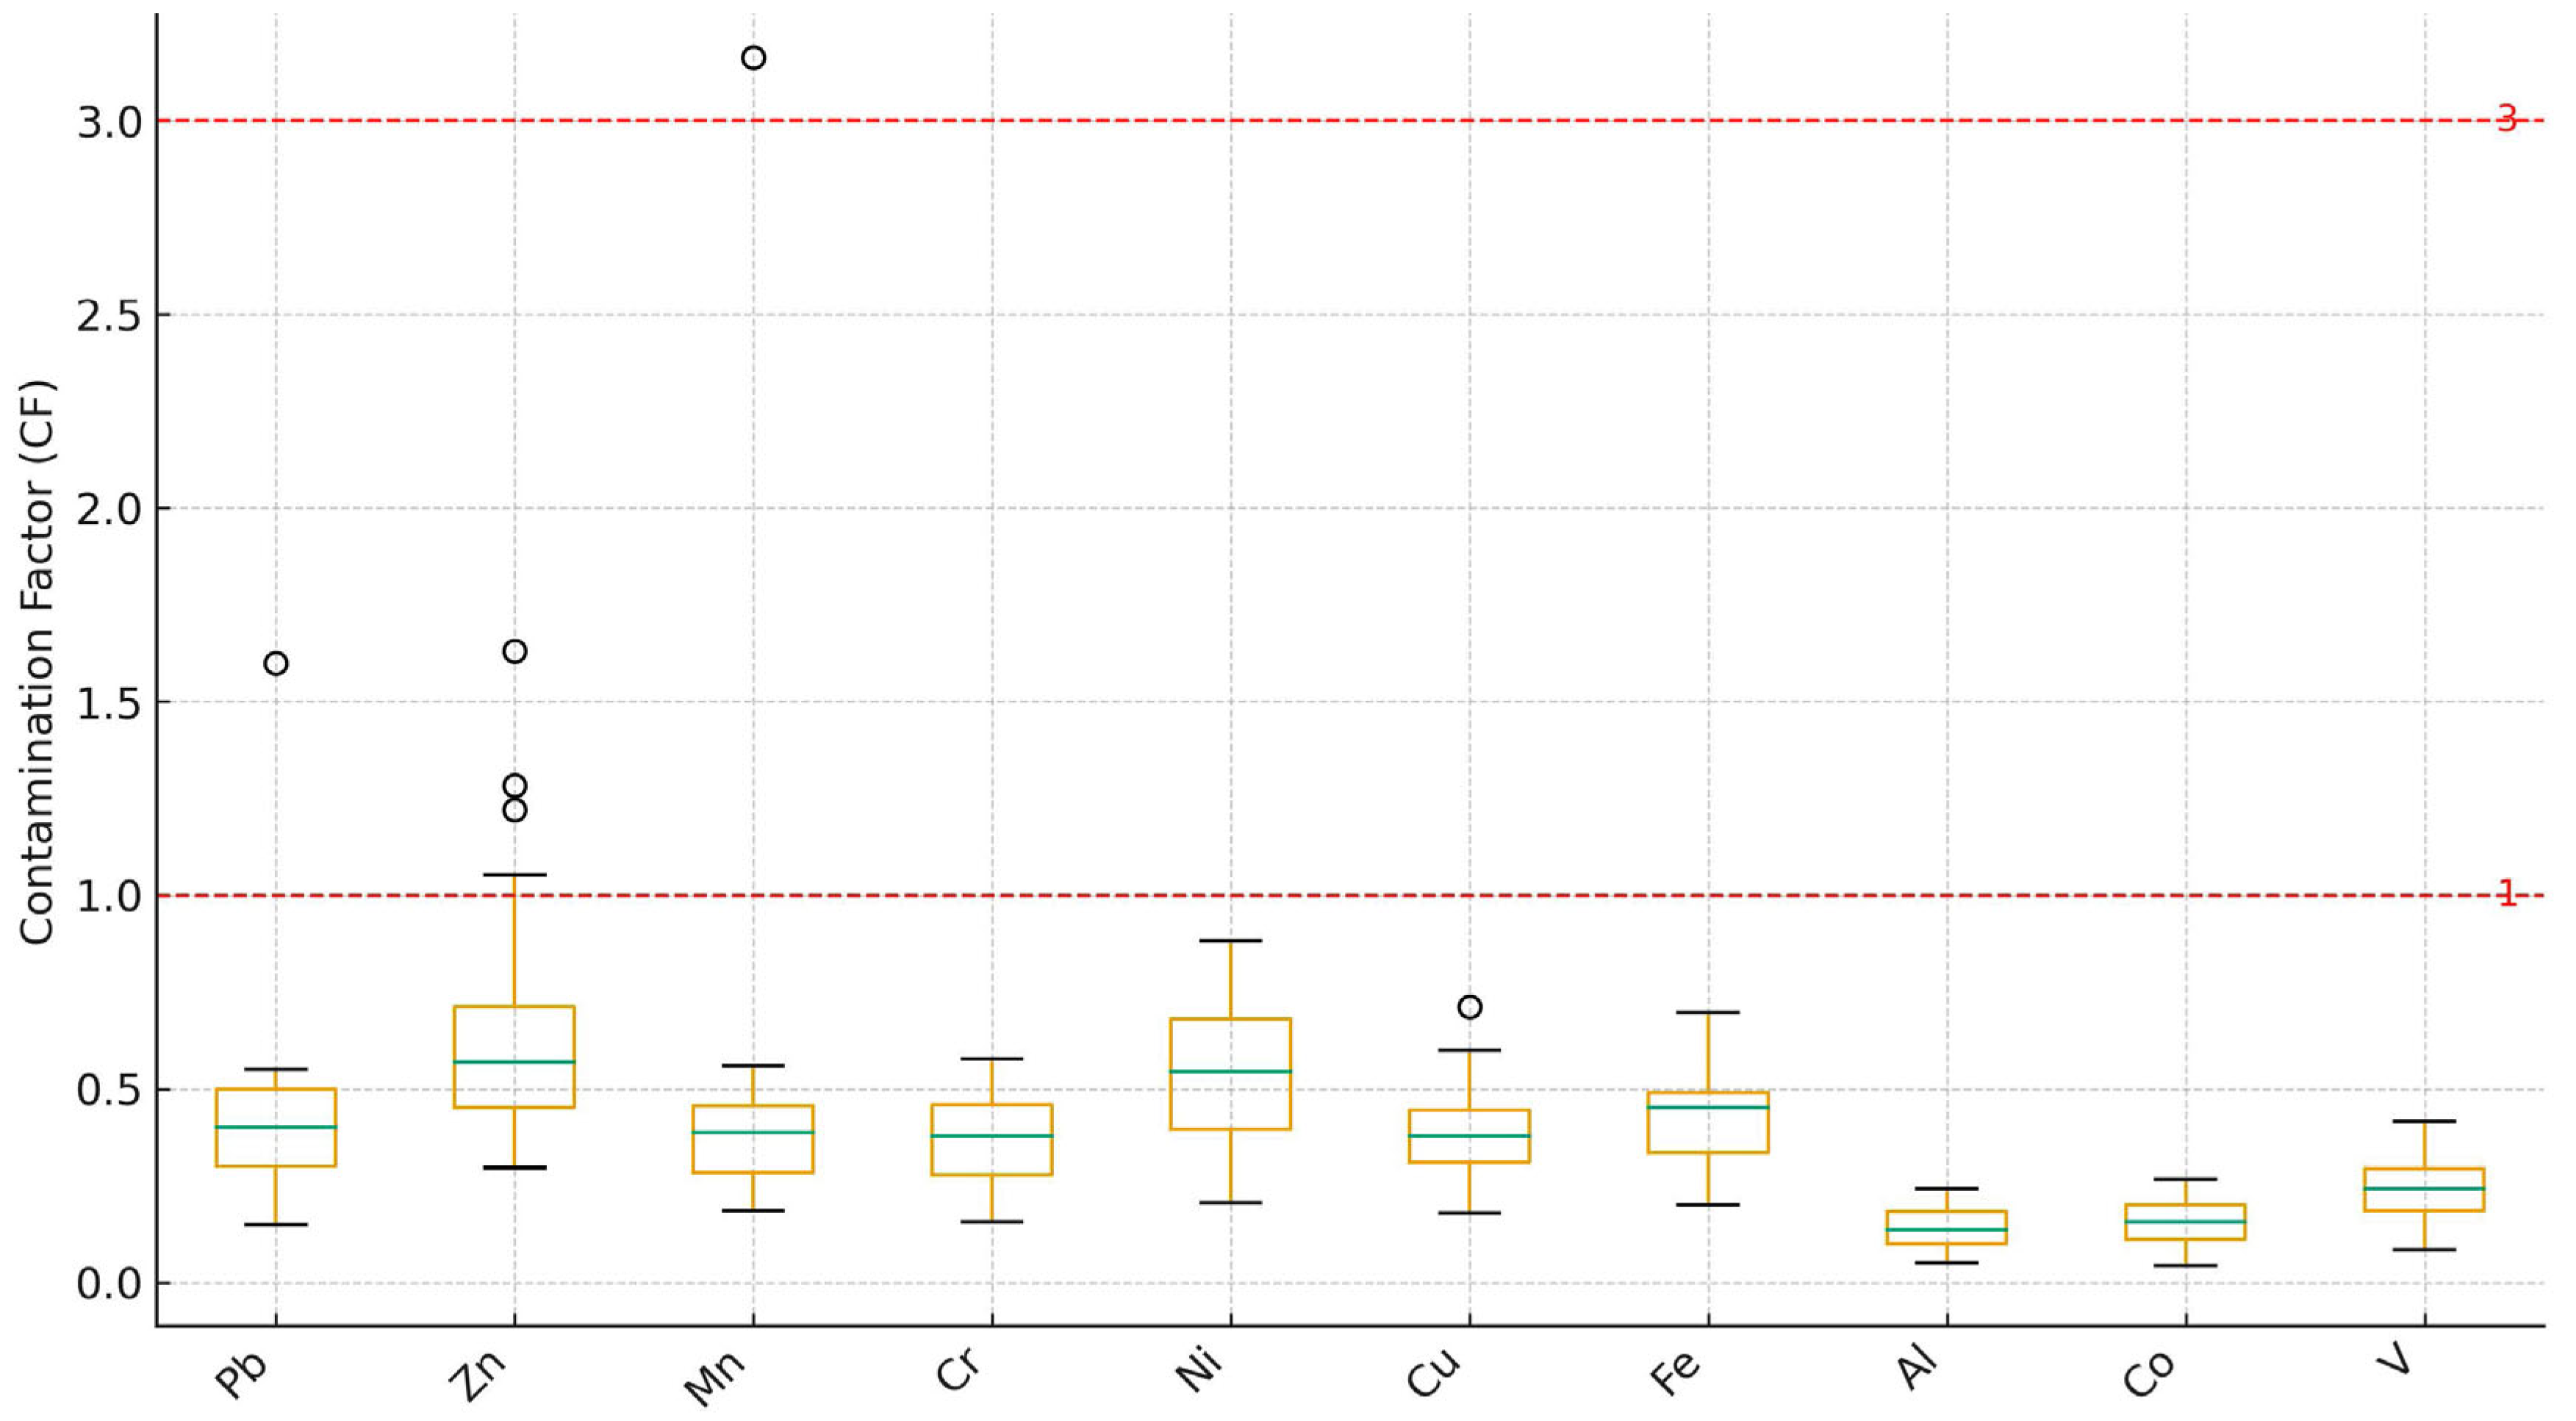
The CF is a widely applied index used to quantify the extent of potentially toxic element (PTE) accumulation in soils relative to background concentrations [8]. It provides a simple ratio between the measured concentration of each element and its corresponding reference or baseline level, thereby offering insight into the degree of anthropogenic influence. CF values < 1 denote low contamination, values from 1 to 3 indicate moderate contamination, 3–6 represent considerable contamination, and >6 suggest very high contamination [33,42].
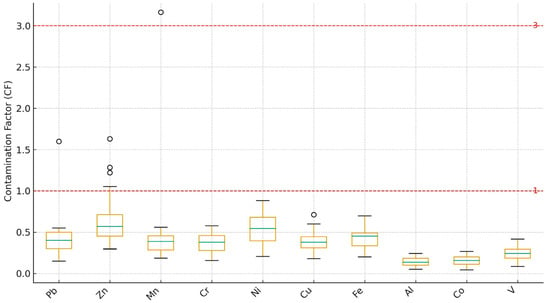
In the present study, most PTEs, including Pb, Zn, Cr, Ni, Cu, As, Co, V, and Al, exhibit CF values below 1, confirming minimal contamination and a predominantly geogenic origin. Manganese displays the highest CF, reaching 3.16 in some samples, which suggests considerable localized contamination and aligns with enrichment trends observed in both EF and Igeo indices. Lead shows a CF range of 0.15–1.60, with isolated locations, mainly in the northern and central parts of the study area, exceeding CF = 1, indicating moderate contamination. Such elevations are likely associated with anthropogenic inputs such as vehicular emissions, industrial discharges, and residual effects of lead-based agricultural amendments [3,35]. Nevertheless, the majority of the region shows CF < 1, demonstrating that Pb levels remain within natural background concentrations. These findings are consistent with previous research indicating that lead tends to persist in soils near urban and roadside zones but rarely reaches levels requiring remediation in agricultural settings [43].
The CF box plots (Figure 7) confirm that contamination levels across the study area are generally low (CF < 1). Limited elevations in Ni and Mn (CF ≈ 1.5–2) reflect localized enrichment possibly related to agrochemical inputs. The low variability and absence of significant outliers indicate that natural background conditions are the dominant control on trace element concentrations. These patterns mirror those observed in other arid agricultural regions, where trace metal concentrations are largely controlled by geogenic factors and limited human influence [44].
Figure 7.
Box plots of CF values for PTEs in agricultural soils, with reference thresholds.
3.2.4. Pollution Load Index (PLI) and Potential Ecological Risk Index (RI)
The Pollution Load Index (PLI) and Potential Ecological Risk Index (RI) are key metrics for evaluating PTE contamination levels and associated environmental risks in ecosystems [8,9]. The findings show variations in the levels of contamination and ecological risks, offering clues about potential contamination sources and associated environmental consequences. The PLI values in this study range from 0.24 to 0.80, with an average PLI of approximately 0.47, indicating no significant PTE contamination in the study area (Table S2). The highest PLI value (0.80) is observed at S21, suggesting a relatively higher contamination level compared to other sites, likely due to localized contamination sources such as agricultural inputs [45]. The lowest PLI value (0.24) at S1 suggests minimal contamination, reflecting background metal levels with little anthropogenic influence [3]. Most samples show PLI values below 1, reinforcing the conclusion that PTE contamination in the study area is generally low. However, monitoring is necessary in areas with relatively higher PLI values (e.g., S21, S29, S26) to prevent further contamination. The RI values in this study range from 10.43 to 41.38, with an average RI of 23.84, indicating an overall low ecological risk. The highest RI value (41.38 at S21) suggests that this site has a moderately elevated ecological risk, possibly due to localized contamination from agricultural activities [32]. The lowest RI value (10.43 at S1) reflects minimal ecological risk, suggesting a dominance of natural geochemical processes over anthropogenic contributions [32]. Since all RI values are below 150, the HM contamination in the study area does not pose a significant ecological risk. However, areas with higher RI values (S21, S29, S22, S26) require attention to mitigate potential long-term impacts on soil health and ecosystem stability.
3.2.5. Sediment Quality Guidelines (SQG)
The distribution of PTE concentrations in Hautat Sudair agricultural soil samples was assessed using the SQGs (Table 2), which categorize contamination levels into three ranges: below the Effects Range Low (ERL), between ERL and Effects Range Median (ERM), and above ERM [46,47]. These guidelines assess the potential environmental risks linked to metal contamination in soil and sediment. Cu levels in the samples have a mean concentration of 17.22 mg/kg, which falls well below the ERL threshold of 34 mg/kg. Since all samples (100%) remain below ERL, Cu contamination is minimal and unlikely to pose any ecological threats [48]. Similarly, As, Cr, and Pb exhibit mean concentrations of 4.25 mg/kg, 33.00 mg/kg, and 8.34 mg/kg, respectively, all of which remain below their respective ERL values of 8.2 mg/kg (As), 81 mg/kg (Cr), and 46.7 mg/kg (Pb). With 100% of the samples falling below the ERL, these elements are not considered hazardous in the studied soils. Zn shows a mean concentration of 60.09 mg/kg, which is significantly lower than its ERL of 150 mg/kg, with only one sample (3.12%) slightly approaching this threshold. Thus, Zn contamination is minimal and does not present ecological concerns [49].
Table 2.
Distribution of samples in the ranges established by the SQG according to the PTE levels (mg/kg).
Nickel is the only metal with a substantial portion of samples exceeding the ERL threshold. With a mean concentration of 35.97 mg/kg, only 9.38% of samples remain below the ERL of 20.9 mg/kg, while 84.37% fall between the ERL and ERM (51.6 mg/kg), and 6.25% exceed the ERM, indicating localized contamination risks. Elevated Ni levels, particularly in samples surpassing the ERM, could be attributed to industrial contamination, vehicular emissions, or natural soil composition [33]. High levels of Ni can harm plants and aquatic life, so areas with elevated concentrations may require further study and possible remediation efforts [35]. Most PTEs in the soil samples are below the ERL, suggesting minimal contamination and low ecological risk. However, Ni contamination in certain samples requires closer monitoring, as prolonged exposure to high concentrations may pose environmental and health concerns. Soil management strategies like phytoremediation or controlled agriculture can help reduce risks linked to high Ni levels in specific areas [37].
3.3. Potential Sources of PTEs
The mineralogical composition of the underlying rocks in the Sudair area, comprising shale, mudstone, limestone, and dolomite, plays a crucial role in influencing the concentrations of the reported PTEs in agricultural soil samples. Clay-rich lithologies such as shale and mudstone contain minerals capable of adsorbing Pb, Zn, Cu, and Ni [3,50]. Carbonate rocks (limestone and dolomite) can incorporate Mn, Co, and V through structural substitution processes [51,52]. Understanding these mineralogical–geochemical relationships is essential for accurately assessing contamination risks and designing appropriate mitigation strategies [53].
Several PTEs (Pb, Zn, Cr, Ni, Cu, Fe, Al, As, Mn, Co, and V) exhibit affinities for specific mineral phases, which influence their environmental availability and potential mobility. For example, Pb is commonly associated with galena within shale and mudstone [54], whereas Mn can substitute for Ca in calcite or dolomite [52]. Evaluating measured concentrations relative to geological background levels or regulatory thresholds (e.g., [3,55]) provides valuable insight into the extent, origin, and environmental implications of the detected PTEs.
The correlation matrix reveals relationships between different PTEs in the soil samples, helping in identifying potential sources and patterns of contamination. Correlation coefficients indicate the degree of association between elements, which helps to infer potential sources (natural vs. anthropogenic), geochemical behaviors, and environmental implications [3]. Strong positive correlations (r > 0.7) suggest a common source or similar geochemical behavior, while weak or negative correlations indicate different sources or mobility patterns [32]. Al, As, Co, Cr, Ni, and V show strong positive correlations (r > 0.88, p < 0.01), indicating a common geogenic origin (Table 3). These metals are likely derived from natural lithogenic sources, such as the weathering of parent rock materials [20]. Their high correlation suggests minimal anthropogenic influence. The strong positive correlations between Co-Cr (r = 0.958), Cr-V (r = 0.969), and Ni-Co (r = 0.971) suggest co-occurrence in soil-forming minerals, typically found in the nearby rocks and lateritic soils [2]. Fe also shows significant correlations with Cr (r = 0.806) and As (r = 0.776), which is indicative of the strong geochemical association of these elements with iron oxides and hydroxides in soils [32]. Cu has a strong positive correlation with Pb (r = 0.760) and Zn (r = 0.734), implying possible anthropogenic contributions, such as agricultural inputs (fertilizers and pesticides), or vehicular emissions [45]. Importantly, statistical co-variation alone does not constitute direct evidence of specific sources (e.g., fertilizers or traffic); therefore, source attributions in this study are expressed as probable and would benefit from ancillary data (fertilizer composition/application rates, irrigation inputs, and distance to roads/urban areas).
Table 3.
Correlation matrix for PTEs of soil samples.
Pb shows moderate correlation with Fe (r = 0.402, p < 0.05) and strong correlation with Cu (r = 0.760) and Zn (r = 0.677), suggesting that Pb is influenced by anthropogenic activities such as urbanization, traffic emissions, and agricultural inputs [35]. Zn displays a weak correlation with Fe (r = 0.081) and Mn (r = −0.009), suggesting different mobility and retention mechanisms in the soil [3]. Zn is highly influenced by organic matter and pH changes, which can lead to its differential distribution compared to other metals. Mn shows weak or negligible correlations with most metals, e.g., Mn-Co (r = 0.093), Mn-Cr (r = 0.022), suggesting that it follows a distinct geochemical pathway. Unlike Fe, which strongly binds PTEs through oxide formation, Mn oxides often have different mobility and solubility behaviors in varying redox conditions [2]. This may explain why Mn does not correlate strongly with other metals. The moderate correlation of Mn with Fe (r = 0.348) suggests some co-occurrence but lower affinity, likely due to Mn’s higher redox sensitivity compared to Fe [3].
The Kaiser–Meyer–Olkin (KMO) test and Bartlett’s test of sphericity determine if data is suitable for factor analysis, helping researchers understand PTE contamination patterns in soil [56]. The KMO value obtained for the 32 agricultural soil samples is 0.797 (Table 4), which falls within the acceptable range (0.7–0.9), indicating that the dataset is adequate for principal component analysis (PCA) and factor analysis [57]. The obtained KMO value indicates that the data is suitable for multivariate statistical analyses to determine contamination sources and potential human contribution to PTEs accumulation in the soil [58]. Additionally, Bartlett’s test of sphericity yielded a highly significant result (χ2 = 563.845, df = 55, p < 0.001), confirming that the correlation matrix is not an identity matrix and that the dataset contains significant relationships among PTEs [56]. This result validates the appropriateness of PCA for extracting meaningful factors that explain HM variability in the soil samples. The significance of Bartlett’s test indicates that the dataset possesses sufficient multicollinearity, which is crucial for identifying underlying contamination sources, such as industrial emissions, agricultural inputs, or natural geogenic contributions [59]. A suitable KMO value and significant Bartlett’s test result indicate that PCA can effectively reduce data complexity and identify distinct contamination sources, aiding in the interpretation of soil contamination patterns.
Table 4.
KMO and Bartlett’s Test of the investigated PTEs.
Principal Component Analysis (PCA) is a statistical method that simplifies complex datasets by reducing dimensions while preserving key information, helping identify patterns and relationships [60]. The loading matrix presented here reveals the contribution of each HM to three PCs (Table S3), providing insights into their possible sources, geochemical behavior, and contamination origins. PC1 is the dominant component, accounting for 68.54% of the total variance, indicating that the majority of the metals share a common source. The PTEs strongly loading on PC1 include Al = 0.972, As = 0.921, Co = 0.966, Cr = 0.975, Ni = 0.953, V = 0.961, and Fe = 0.778, clearly indicating a shared geogenic origin [3]. These relationships align with the geological composition of the region, where Jurassic and Quaternary sediments provide a natural source for many trace metals. The high loadings of Cr, Co, Ni, and V in PC1 align with findings that these metals are commonly associated with nearby rocks, indicating a natural origin [2]. Fe (0.778) also contributes significantly to PC1, supporting the notion that iron oxides play a major role in the geochemical stabilization of PTEs in soils [32]. The high variance explained by PC1 suggests minimal anthropogenic interference for these metals, reinforcing the geogenic source hypothesis [61].
PC2 accounts for 13.74% of the variance and is characterized by high loadings of Cu (0.447), Pb (0.477), and Zn (0.792). These elements are commonly associated with anthropogenic activities, such as agricultural inputs (fertilizers, pesticides) [45]. The high Zn loading (0.792) and moderate Pb loading (0.477) suggest potential urban contamination, possibly from traffic emissions and industrial activities [35]. The moderate negative Fe loading (−0.421) may indicate that Fe oxides are not as strongly associated with anthropogenic sources as with natural ones [3]. This separation of geogenic and anthropogenic signatures, achieved through multivariate analysis, represents a significant methodological advancement for soil studies in arid regions, where such distinctions are often obscured by strong lithogenic backgrounds. PC3, which explains 9.85% of the variance, has a strong Mn loading (0.878). This finding highlights a novel insight: Mn cycling in arid soils appears to be strongly governed by redox-sensitive processes rather than direct anthropogenic inputs [2]. The moderate Pb (0.281) and Zn (0.305) loadings in PC3 may suggest some influence of redox fluctuations on the mobility of these metals [3]. Since Mn commonly occurs in different oxidation states and is highly mobile under changing redox conditions, its unique association with PC3 indicates that local environmental conditions (e.g., water saturation, organic matter degradation) might be influencing its distribution [61].
To address how the integrated framework increases scientific rigor, we explicitly connect three evidence layers: (i) contamination indices (EF/CF/Igeo/PLI/RI) quantify enrichment magnitude and risk categories; (ii) correlation/PCA identify element groupings that likely share controlling processes; and (iii) GIS interpolation localizes hotspots and relates them to spatial context (e.g., LULC and potential pressure zones). Where these layers converge (e.g., Pb-Zn showing elevated EF/CF, grouping in PC2, and co-located spatial hotspots), the interpretation of localized anthropogenic influence becomes more robust than any single method alone. Conversely, when PCA indicates lithogenic clustering and indices remain low, results support geogenic dominance rather than pollution.
4. Conclusions
This study demonstrated that agricultural soils in the Hautat Sudair area exhibit low to moderate contamination by selected PTEs, particularly Ni and Mn, with most elements remaining within international safety limits. The overall contamination pattern derived from multiple indices (EF, Igeo, CF, PLI, and RI) indicates that geogenic sources dominate, with localized anthropogenic inputs likely related to agricultural practices. The integration of GIS and remote sensing provided an additional layer of novelty by identifying contamination hotspots that correspond to land-use patterns, soil types, and hydrological pathways. From a management perspective, the findings emphasize the need for periodic soil quality assessments and sustainable agricultural practices to prevent further accumulation of metals and metalloids. Future studies should focus on long-term temporal monitoring and the assessment of bioavailability of elements to better evaluate potential ecological risks.
The dataset (n = 32) provides a statistically acceptable first-order characterization, but the heterogeneous lithology and land-use types of the study area imply that spatial interpolation uncertainty may be non-trivial at fine scales. Accordingly, hotspot maps should be interpreted as screening outputs rather than definitive boundaries. In addition, RS in this study was applied to LULC classification only; reflectance-based proxies or soil spectral indices directly linked to metal concentrations were not implemented and are recommended for future work. Finally, while indices (PLI/RI) are useful comparative tools, they may be less sensitive in settings with high natural geochemical background; locally derived background values and bioavailability/speciation measurements would strengthen future risk assessment.
Supplementary Materials
The following supporting information can be downloaded at: https://www.mdpi.com/article/10.3390/min16010093/s1, Table S1: Classification of the contamination indices utilized in this study; Table S2: Concentration of PTEs (mg/kg), and the results of PLI and RI in Hautat Sudair soil; Table S3: Loading matrix of PCs and the total variance explained by each PC.
Author Contributions
Conceptualization, A.S.E.-S. and M.H.A.-H.; methodology, A.S.E.-S.; validation, A.S.E.-S. and M.H.A.-H.; formal analysis, A.S.E.-S.; investigation, A.S.E.-S. and M.H.A.-H.; resources, M.H.A.-H.; writing—original draft preparation, A.S.E.-S. and M.H.A.-H.; writing—review and editing, A.S.E.-S., M.H.A.-H. and S.S.A.; visualization, N.R.; supervision, A.S.E.-S.; project administration, M.H.A.-H.; funding acquisition, M.H.A.-H. All authors have read and agreed to the published version of the manuscript.
Funding
This research was funded by the Ongoing Research Funding program (ORF-2025-781), King Saud University, Riyadh, Saudi Arabia.
Data Availability Statement
The data are contained within the article.
Acknowledgments
The authors appreciate the funding received from the Ongoing Research Funding program (ORF-2025-781), King Saud University, Riyadh, Saudi Arabia.
Conflicts of Interest
The authors declare no conflicts of interest.
References
- Alharbi, T.; Nour, H.E.; El Sorogy, A.S.; Al Kahtany, K.; Giacobbe, S.; Alarifi, S.S. Evaluation of health risks and heavy metals toxicity in agricultural soils in Central Saudi Arabia. Environ. Monit. Assess. 2025, 197, 419. [Google Scholar] [CrossRef] [Scilit]
- Rayhan Uddin, R.; Hopke, P.K.; Impe, J.V.; Sannigrahi, S.; Salauddin, M.; Cummins, E.; Nag, R. Source identification of heavy metals and metalloids in soil using open-source Tellus database and their impact on ecology and human health. Sci. Total Environ. 2024, 953, 175987. [Google Scholar] [CrossRef] [Scilit]
- Kabata-Pendias, A. Trace Elements of Soils and Plants, 4th ed.; CRC Press, Taylor & Francis Group, LLC.: Boca Raton, FL, USA, 2011; p. 505. [Google Scholar]
- Kahal, A.Y.; El-Sorogy, A.S.; Meroño de Larriva, J.E.; Shokr, M.S. Mapping soil contamination in arid regions: A GIS and multivariate analysis approach. Minerals 2025, 15, 124. [Google Scholar] [CrossRef] [Scilit]
- Rodríguez-Eugenio, N.; McLaughlin, M.; Pennock, D. Soil Pollution: A Hidden Reality; Food and Agriculture Organization of the United Nations (FAO): Rome, Italy, 2018; Available online: https://www.fao.org/3/I9183EN/i9183en (accessed on 16 November 2025).
- Jaishankar, M.; Tseten, T.; Anbalagan, N.; Mathew, B.B.; Beeregowda, K.N. Toxicity, mechanism, and health effects of some heavy metals. Interdiscip. Toxicol. 2014, 7, 60–72. [Google Scholar] [CrossRef] [Scilit]
- El-Sorogy, A.S.; Al Khathlan, M.H. Assessment of potentially toxic elements and health risks of agricultural soil in Southwest Riyadh, Saudi Arabia. Open Chem. 2024, 22, 20240017. [Google Scholar] [CrossRef] [Scilit]
- Hakanson, L. An ecological risk index for aquatic pollution control. A sedimentological approach. Water Res. 1980, 14, 75–1001. [Google Scholar] [CrossRef] [Scilit]
- Tomlinson, D.L.; Wilson, J.G.; Harris, C.R.; Jeffrey, D.W. Problems in the assessment of heavy metal levels in estuaries and the formation of a pollution index. Helgol. Meeresunters. 1980, 33, 566–575. [Google Scholar] [CrossRef] [Scilit]
- Reimann, C.; Filzmoser, P. Normal and lognormal data distribution in geochemistry: Death of a myth. Consequences for the statistical treatment of geochemical and environmental data. Environ. Geol. 2000, 39, 1001–1014. [Google Scholar] [CrossRef] [Scilit]
- Facchinelli, A.; Sacchi, E.; Mallen, L. Multivariate statistical and GIS-based approach to identify heavy metal sources in soils. Environ. Pollut. 2001, 114, 313–324. [Google Scholar] [CrossRef] [Scilit]
- El-Sorogy, A.S.; Alharbi, T.; Almadani, S.A.; Shoaib, S.; Rikan, N.; Meroño de Larriva, J.E.; Shokr, M.S. An integrated GIS–statistical approach to assess soil contamination in Al-Muzahmiya, Saudi Arabia: Implications for food security. Front. Sustain. Food Syst. 2025, 9, 1695962. [Google Scholar] [CrossRef] [Scilit]
- Duan, K.; Li, Y.; Yang, W.; Lin, Y.; Rao, L.; Han, C. Risk Assessment of Heavy Metal Pollution in Agricultural Soils Around Industrial Enterprises in Lanzhou, China: A Multi-Industry Perspective Promoting Land Sustainability. Sustainability 2025, 17, 5343. [Google Scholar] [CrossRef] [Scilit]
- Shokr, M.S.; Mustafa, A.-r.A.; Alharbi, T.; Meroño de Larriva, J.E.; El-Sorogy, A.S.; Al-Kahtany, K.; Abdelsamie, E.A. Integration of VIS–NIR spectroscopy and multivariate technique for soils discrimination under different land management. Land 2024, 13, 2056. [Google Scholar] [CrossRef] [Scilit]
- El-Sorogy, A.S.; Al-Kahtany, K.; Alharbi, T.; Al Hawas, R.; Rikan, N. Geographic information system and multivariate analysis approach for mapping soil contamination and environmental risk assessment in arid regions. Land 2025, 14, 221. [Google Scholar] [CrossRef] [Scilit]
- Alzahrani, H.; El-Sorogy, A.S.; Okok, A.; Shokr, M.S. GIS- and Multivariate-Based Approaches for Assessing Potential Environmental Hazards in Some Areas of Southwestern Saudi Arabia. Toxics 2024, 12, 569. [Google Scholar] [CrossRef] [Scilit]
- Wang, Y.; Zou, B.; Zuo, X.; Zou, H.; Zhang, B.; Tian, R.; Feng, H. A remote sensing analysis method for soil heavy metal pollution sources at site scale considering source-sink relationships. Sci. Total Environ. 2024, 946, 174021. [Google Scholar] [CrossRef] [Scilit]
- Deng, Y.; Jiang, L.; Xu, L.; Hao, X.; Zhang, S.; Xu, M.; Zhu, P.; Fu, S.; Liang, Y.; Yin, H.; et al. Spatial distribution and risk assessment of heavy metals in contaminated paddy fields—A case study in Xiangtan City, southern China. Ecotoxicol. Environ. Saf. 2019, 171, 281–289. [Google Scholar] [CrossRef] [Scilit]
- Xu, Y.; Li, P.; Zhang, Z.; Gu, Y.; Xiao, L.; Liu, X.; Wang, B. Integrating machine learning for enhanced spatial prediction and risk assessment of soil heavy metal(loid)s. Environ. Pollut. 2025, 383, 126919. [Google Scholar] [CrossRef] [Scilit]
- El-Sorogy, A.S.; Al-Kahtany, K.; Alharbi, T.; Alarifi, S.S. Distribution patterns, health hazards, and multivariate assessment of contamination sources of As, Pb, Ni, Zn, and Fe in agricultural soils. J. King Saud Univ. Sci. 2024, 36, 103489. [Google Scholar] [CrossRef] [Scilit]
- Reimann, C.; de Caritat, P. Distinguishing between natural and anthropogenic sources for elements in the environment: Regional geochemical surveys versus enrichment factors. Sci. Total Environ. 2005, 337, 91–107. [Google Scholar] [CrossRef] [Scilit]
- Müller, G. Index of geoaccumulation in sediments of the Rhine River. Geol. J. 1969, 2, 108–118. [Google Scholar]
- Weissmannová, H.D.; Pavlovský, J. Indices of soil contamination by heavy metals—Methodology of calculation for pollution assessment (minireview). Environ. Monit. Assess. 2017, 189, 616. [Google Scholar] [CrossRef] [Scilit]
- Turekian, K.K.; Wedepohl, K.H. Distribution of the elements in some major units of the earth’s crust. Geol. Soc. Am. 1961, 72, 175–192. [Google Scholar] [CrossRef] [Scilit]
- Youssef, M.; Al Otaibi, S.; El-Sorogy, A.S. Distribution, source, and contamination of heavy metals in coastal sediments of Jeddah, Red Sea, Saudi Arabia. Bull. Environ. Contam. Toxicol. 2024, 113, 12. [Google Scholar] [CrossRef] [Scilit]
- Powers, R.W.; Ramirez, L.F.; Redmond, C.D.; Elberg, E.L.J.R. Geology of the Arabian Peninsula, Sedimentary Geology of Saudi Arabia. U.S. Geol. Surv. Prof. Pap. 1966, 560, 147. [Google Scholar]
- El-Asmar, H.M.; Assal, E.M.; El-Sorogy, A.S.; Youssef, M. Facies analysis and depositional environments of the Upper Jurassic Jubaila Formation, Central Saudi Arabia. J. Afr. Earth Sci. 2015, 110, 34–51. [Google Scholar] [CrossRef] [Scilit]
- El-Sorogy, A.S.; Almadani, S.A.; Al-Dabbagh, M.E. Microfacies and diagenesis of the reefal limestone, Callovian Tuwaiq Mountain Limestone Formation, Central Saudi Arabia. J. Afr. Earth Sci. 2016, 115, 63–70. [Google Scholar] [CrossRef] [Scilit]
- Tawfik, M.; Al-Dabbagh, M.E.; El-Sorogy, A.S. Sequence stratigraphy of the late middle Jurassic open shelf platform of the Tuwaiq Mountain Limestone Formation, Central Saudi Arabia. Proc. Geol. Assoc. 2016, 127, 395–412. [Google Scholar] [CrossRef] [Scilit]
- Ministry of Environment, Water and Agriculture (MEWA). General Soil Map of the Kingdom of Saudi Arabia (Soil Atlas); Department of Lands Investment Management: Riyadh, Saudi Arabia, 1986. (In Arabic)
- Al-Dosary, N.M.N. Evaluation of soil characteristics for agricultural machinery management and cropping requirements in Al-Aflaj Oasis, Saudi Arabia. Sustainability 2022, 14, 7991. [Google Scholar] [CrossRef] [Scilit]
- Zhang, H.; Reynolds, M.; Chen, W. Heavy metal contamination in agricultural soils: A review of sources, indicators, and assessment models. Environ. Pollut. 2018, 234, 283–295. [Google Scholar]
- Nriagu, J.O. Nickel in the Environment; John Wiley & Sons: New York, NY, USA, 1980. [Google Scholar]
- Bhattacharya, P.; Welch, A.H.; Stollenwerk, K.G.; McLaughlin, M.J.; Bundschuh, J.; Panaullah, G. Arsenic in the environment: Biology and chemistry of arsenic. Sci. Total Environ. 2007, 379, 109–120. [Google Scholar] [CrossRef] [Scilit]
- Wuana, R.A.; Okieimen, F.E. Heavy metals in contaminated soils: A review of sources, chemistry, risks, and best available strategies for remediation. ISRN Ecol. 2011, 2011, 402647. [Google Scholar] [CrossRef] [Scilit]
- Agency for Toxic Substances and Disease Registry (ATSDR). Toxicological Profile for Nickel; U.S. Department of Health and Human Services, Public Health Service: Atlanta, GA, USA, 2005.
- Adriano, D.C. Trace Elements in Terrestrial Environments: Biogeochemistry, Bioavailability, and Risks of Metals; Springer: New York, NY, USA, 2001. [Google Scholar]
- Smedley, P.L.; Kinniburgh, D.G. A review of the source, behavior and distribution of arsenic in natural waters. Appl. Geochem. 2002, 17, 517–568. [Google Scholar] [CrossRef] [Scilit]
- Kabata-Pendias, A.; Mukherjee, A.B. Trace Elements from Soil to Human; Springer: Berlin/Heidelberg, Germany, 2007. [Google Scholar]
- US EPA. Soil Screening Levels for Contaminants; United States Environmental Protection Agency: Washington, DC, USA, 2021.
- Sutherland, R.A. Bed sediment-associated trace metals in an urban stream, Oahu, Hawaii. Environ. Geol. 2000, 39, 611–627. [Google Scholar] [CrossRef] [Scilit]
- Barbieri, M. The Importance of Enrichment Factor (EF) and Geoaccumulation Index (Igeo) to Evaluate the Soil Contamination. J. Geol. Geophys. 2016, 5, 237. [Google Scholar] [CrossRef]
- Tomczyk, P.; Wdowczyk, A.; Wiatkowska, B.; Szymańska-Pulikowska, A. Assessment of heavy metal contamination of agricultural soils in Poland using contamination indicators. Ecol. Indic. 2023, 156, 111161. [Google Scholar] [CrossRef] [Scilit]
- Arooj, S.; Naz, S.; Qaisar, A.; Satti, S.; Razzaq, A.; Alhidary, I.; Khan, R.U.; Tufarelli, V. Estimation of Heavy Metals Enrichment and Geo-Accumulation Associated with Habitat Quality from Selected Wildlife Parks. Soil Sediment Contam. Int. J. 2024, 34, 1–18. [Google Scholar] [CrossRef] [Scilit]
- Al-Taani, A.A.; Nazzal, Y.; Howari, F.M.; Yousef, A.; Al-Rawabdeh, A.M. Contamination Assessment of Heavy Metals in Agricultural Soil, in the Eastern Sector of Jordan. Toxics 2021, 9, 53. [Google Scholar] [CrossRef] [Scilit]
- Long, E.R.; MacDonald, D.D.; Smith, S.L.; Calder, F.D. Incidence of adverse biological effects within ranges of chemical concentrations in marine and estuarine sediments. Environ. Manag. 1995, 19, 81–97. [Google Scholar] [CrossRef] [Scilit]
- Long, E.R.; Ingersoll, C.G.; MacDonald, D.D. Calculation and uses of mean sediment quality guideline quotients: A critical review. Environ. Sci. Technol. 2006, 40, 1726–1736. [Google Scholar] [CrossRef] [Scilit]
- MacDonald, D.D.; Ingersoll, C.G.; Berger, T.A. Development and evaluation of consensus-based sediment quality guidelines for freshwater ecosystems. Arch. Environ. Contam. Toxicol. 2000, 39, 20–31. [Google Scholar] [CrossRef] [Scilit]
- Buchman, M.F. NOAA Screening Quick Reference Tables; NOAA OR&R Report 08-1; NOAA: Seattle, WA, USA, 2008. [Google Scholar]
- Alloway, B.J. Heavy Metals in Soils: Trace Metals and Metalloids in Soils and Their Bioavailability; Springer: Dordrecht, The Netherlands, 2013. [Google Scholar]
- O’Day, P.A.; Veblen, D.R.; Rivera, N. X-ray absorption spectroscopic study of Pb sorption on montmorillonite. Environ. Sci. Technol. 2005, 39, 2147–2154. [Google Scholar]
- Veiga, M.M.; Angelier, J.; Sylla, M. Heavy metal contamination in soils and plants in the vicinity of the Ni-Co mine in Nwako, Mali. J. Geochem. Explor. 2016, 165, 1–11. [Google Scholar]
- Reeder, R.J.; Nugent, M.; Tait, C.D.; Morris, D.E.; Beck, L.W. Coprecipitation of uranium(VI) with calcite: Mechanisms and applications. Geochim. Cosmochim. Acta 2006, 70, 4657–4672. [Google Scholar]
- Sposito, G. The Chemistry of Soils; Oxford University Press: Oxford, UK, 2008. [Google Scholar]
- USEPA. Soil Screening Guidance for Radionuclides; United States Environmental Protection Agency: Washington, DC, USA, 2016.
- Bartlett, M.S. Tests of significance in factor analysis. Br. J. Stat. Psychol. 1950, 3, 77–85. [Google Scholar] [CrossRef] [Scilit]
- Kaiser, H.F. An index of factorial simplicity. Psychometrika 1974, 39, 31–36. [Google Scholar] [CrossRef] [Scilit]
- Hair, J.F.; Black, W.C.; Babin, B.J.; Anderson, R.E. Multivariate Data Analysis, 8th ed.; Cengage Learning: Boston, MA, USA, 2019. [Google Scholar]
- Balabanova, B.; Stafilov, T.; Andonovska, K.B. Application of principal component analysis in the assessment of essential and toxic metals in vegetable and soil from polluted and referent areas. Bulg. J. Agric. Sci. 2015, 21, 536–544. [Google Scholar]
- Jolliffe, I.T.; Cadima, J. Principal component analysis: A review and recent developments. Philos. Trans. R. Soc. A Math. Phys. Eng. Sci. 2016, 374, 20150202. [Google Scholar] [CrossRef] [Scilit] [PubMed]
- Reimann, C.; de Caritat, P. Establishing geochemical background variation and threshold values for 59 elements in Australian surface soil. Sci. Total Environ. 2017, 578, 633–648. [Google Scholar] [CrossRef] [Scilit] [PubMed]


Disclaimer/Publisher’s Note: The statements, opinions and data contained in all publications are solely those of the individual author(s) and contributor(s) and not of MDPI and/or the editor(s). MDPI and/or the editor(s) disclaim responsibility for any injury to people or property resulting from any ideas, methods, instructions or products referred to in the content. |
© 2026 by the authors. Licensee MDPI, Basel, Switzerland. This article is an open access article distributed under the terms and conditions of the Creative Commons Attribution (CC BY) license.