


Abstract
Elastic wave scattering in polycrystalline materials has been a long-lasting topic in seismology and physical acoustics. Numerous analytical scattering models have been reported for polycrystals with random grain orientations. However, the elastic wave scattering in polycrystals with a preferred grain orientation (crystallographic texture) has not been well studied. This study develops a general ultrasonic scattering model that correlates the scattering coefficients and attenuation coefficients with orientation distribution coefficients (ODCs) for polycrystalline materials with a crystallographic texture. These models are valid for aggregates of triclinic grains with arbitrary texture symmetry. Since different terminologies for orientation distribution functions (ODFs) are adopted in quantitative texture analysis, the relations between different terminologies are also summarized in this study. Furthermore, for two special cases—hexagonal polycrystalline materials with a fiber texture and cubic polycrystalline materials with orthotropic texture symmetry—explicit expressions for the ultrasonic backscattering coefficient through ODCs are derived. The explicit relationship between ultrasonic backscattering and ODCs not only manifests how the individual texture coefficients impact ultrasonic scattering but also makes it possible to determine ODCs up to the eighth order experimentally from ultrasonic scattering measurements. This type of forward model also can be applied to the microstructure characterization of textured polycrystals.
1. Introduction
Elastic wave backscattering is of great importance in semiology [1], medical imaging and non-destructive evaluation [2]. One well-known characteristic related to scattering is the differential cross-section or scattering coefficient. When the scattered wave is opposite to the incident wave, this phenomenon is called backscattering. Extensive studies have been reported about the modeling of the elastic wave backscattering coefficient in various media, such as human tissue and polycrystalline media. For polycrystalline media, backscattering carries important information about the microstructure [3,4] and stress [5], and it has been applied for microstructure characterization.
Generally, natural and man-made polycrystalline materials, such as rocks and engineering alloys, present some texture—namely, the crystallites (grains) in the polycrystalline aggregate, have a preferred crystallographic orientation [6]. The texture can cause anisotropic material properties, and its impact on material properties has been quantified through the orientation distribution function (ODF), which is a probability density function describing the crystal orientation distribution in 3D space. The most widely used ODF in semiology and materials engineering is in the form of generalized spherical harmonics [7,8], and the coefficients for the generalized spherical harmonics are called orientation distribution coefficients (ODCs).
The correlation between the elastic wave velocity and ODCs has been investigated by others [9,10]; however, the relation between ultrasonic backscattering and ODCs has not been well studied yet. One recent backscattering coefficient model for polycrystals accounted for texture impacts [11]; however, it adopted a simple-form ODF to illustrate the texture’s effect on the backscattering coefficient, instead of the generalized spherical harmonics ODF. Another study [12] reported the relation between backscattering and ODCs for hexagonal polycrystalline materials with a fiber texture; however, it is limited to backscattering in the symmetric axes of a textured hexagonal polycrystalline material. This study aims to correlate ultrasonic scattering coefficients with ODCs under the weak scattering assumption (spatial variation in elastic constants is small [13]) for a general case, namely a polycrystal of triclinic grains in an ellipsoidal shape with arbitrary texture symmetry. It also derives explicit backscattering coefficients using ODCs for two specified cases, namely a polycrystal of hexagonal grains with a basal fiber texture and an aggregate of cubic grains with orthotropic texture symmetry, since these two types of texture are common in the materials industry [14].
This paper is structured as follows. In Section 2, the theoretical background regarding different orientation distribution functions and the relations between different ODF terminologies are discussed. This is followed by the general ultrasonic scattering models for scattering and attenuation coefficients expressed by ODCs. In Section 3, the explicit equations for the ultrasonic backscattering coefficient in two specific cases, namely a polycrystal of cubic grains with an orthotropic texture and an aggregate of hexagonal grains with a {0001} basal fiber texture, are addressed. Computation examples and a discussion are given in Section 4. Finally, concluding remarks are drawn.
2. Relation Between Ultrasonic Scattering and Orientation Distribution Functions
This section will address the ultrasonic scattering in textured polycrystalline materials. Firstly, the mathematic function for texture description, the ODF, is introduced. Then, the relation between the scattering coefficient and texture coefficient is established.
2.1. Relation Mathematical Descriptions of Macroscopic Texture and Orientation Distribution Functions
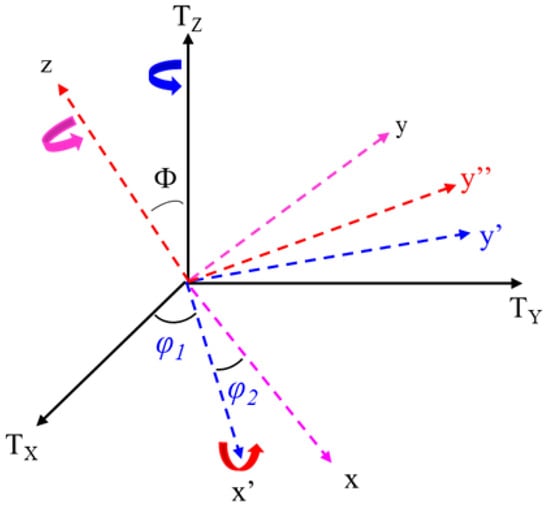
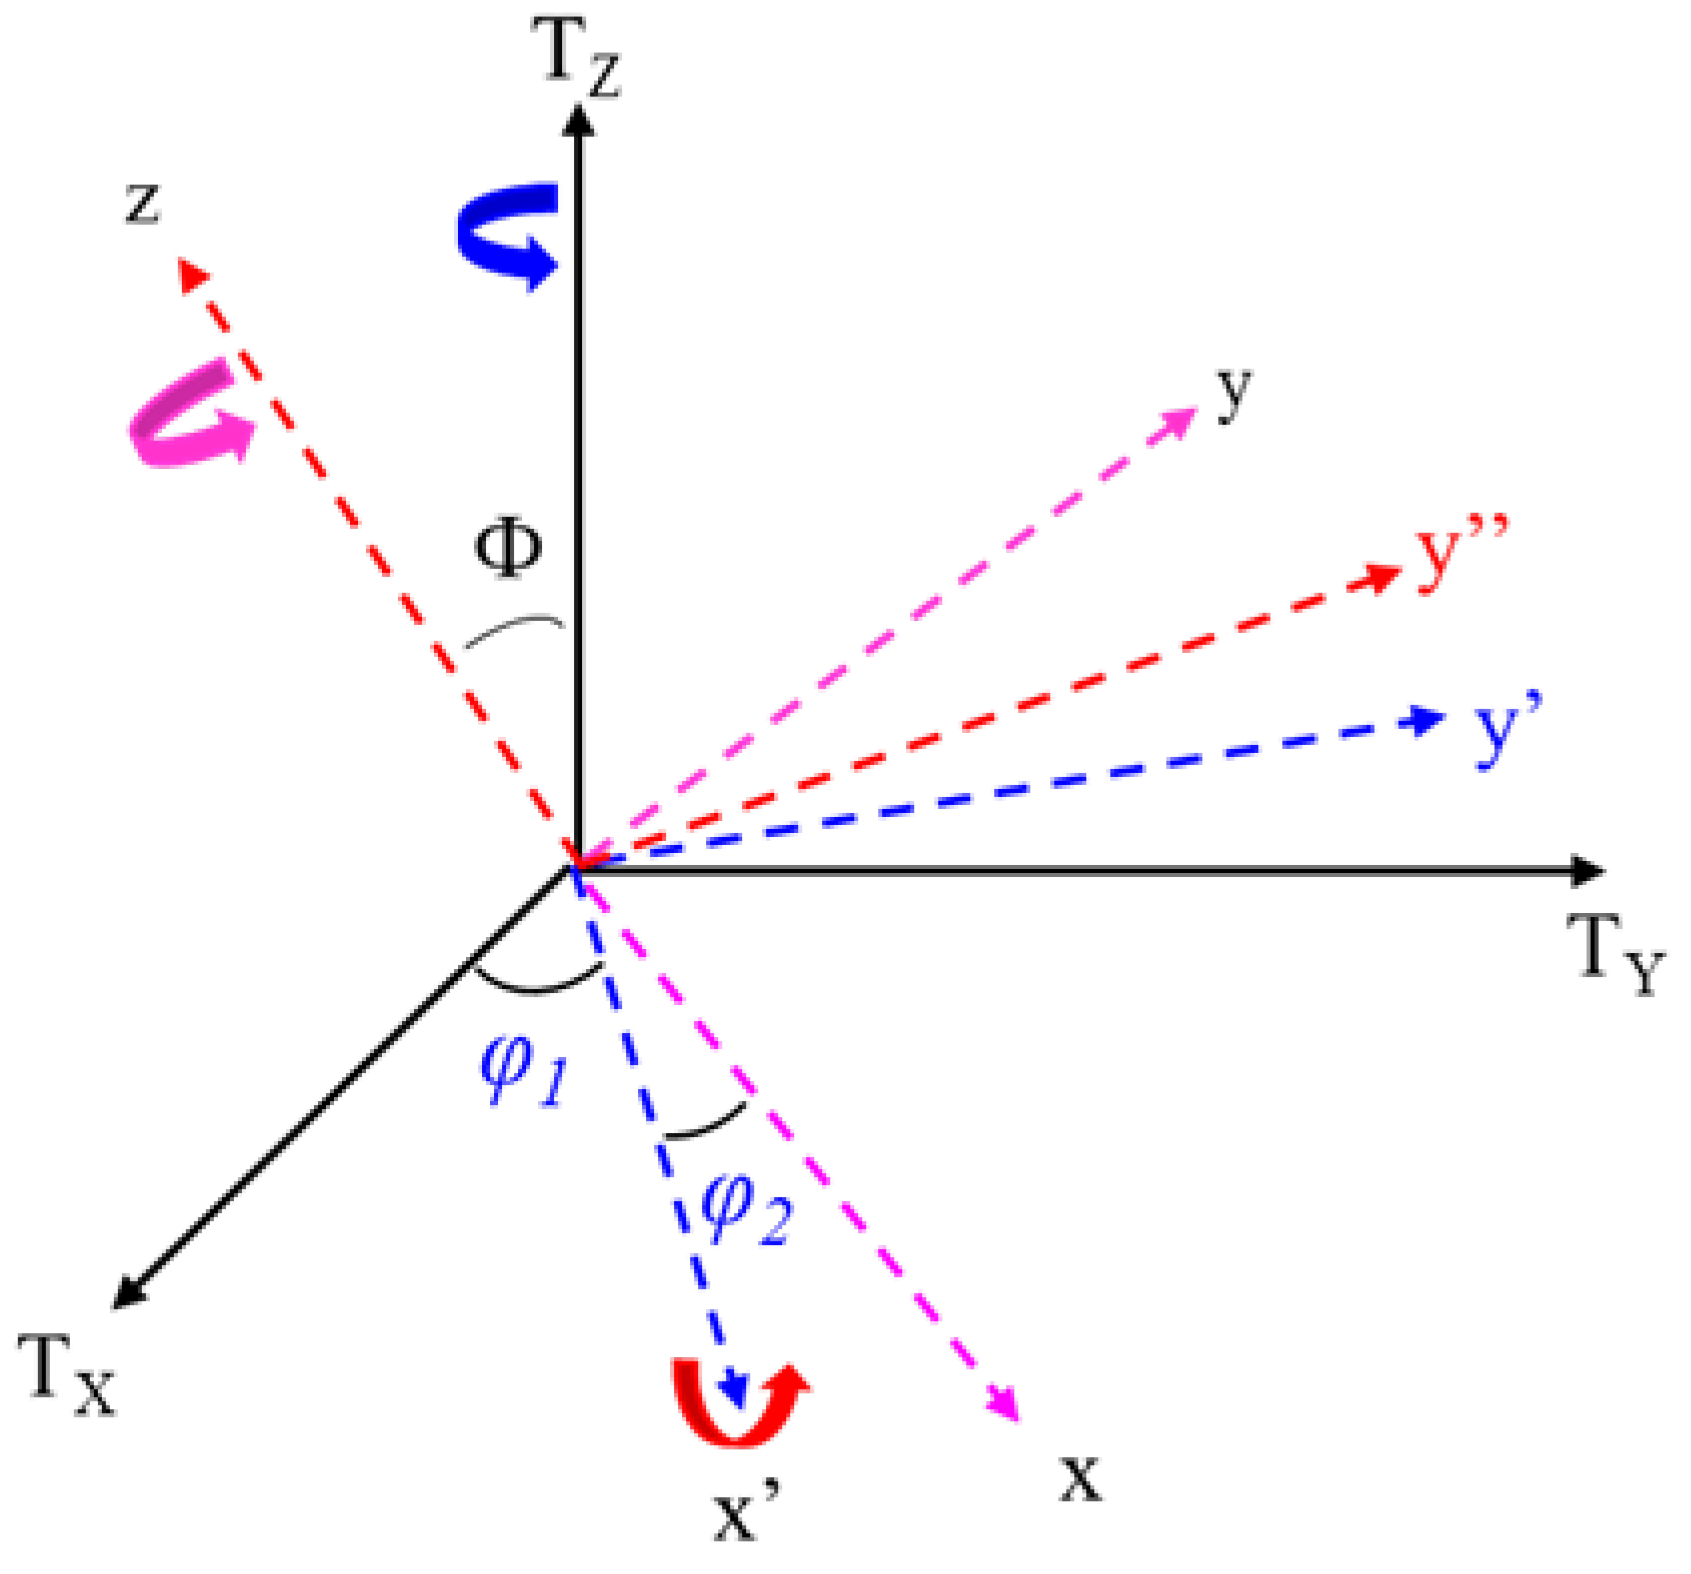
To quantify the statistical crystallographic orientation distribution of crystallites in 3D space, the orientation distribution function in generalized spherical harmonics form is widely used as a measure of the texture extent. Well-known ODF terminologies include Roe’s notation [8], Bunge’s convention [7], and Matthies’s definition [15]. Each terminology defines three Euler rotation angles; however, the rotation sequence in each terminology is different. For example, the Euler rotation angels and rotation sequence in Bunge’s convention [7] are shown in Figure 1. The definition of Euler rotation angles in Bunge’s terminology is as follows [7]: first, rotate about the axis though the angle ; then, rotate about the axis by the angle ; finally, rotate about z axis through the angle .
Figure 1.
The definition of Euler rotation angles in Bunge’s terminology [7]: first, rotate about the axis though the angle ; then, rotate about the axis by the angle ; finally, rotate about the axis through the angle .
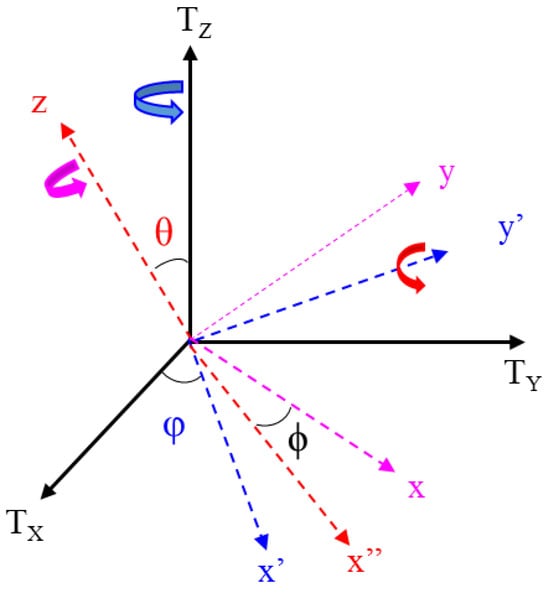
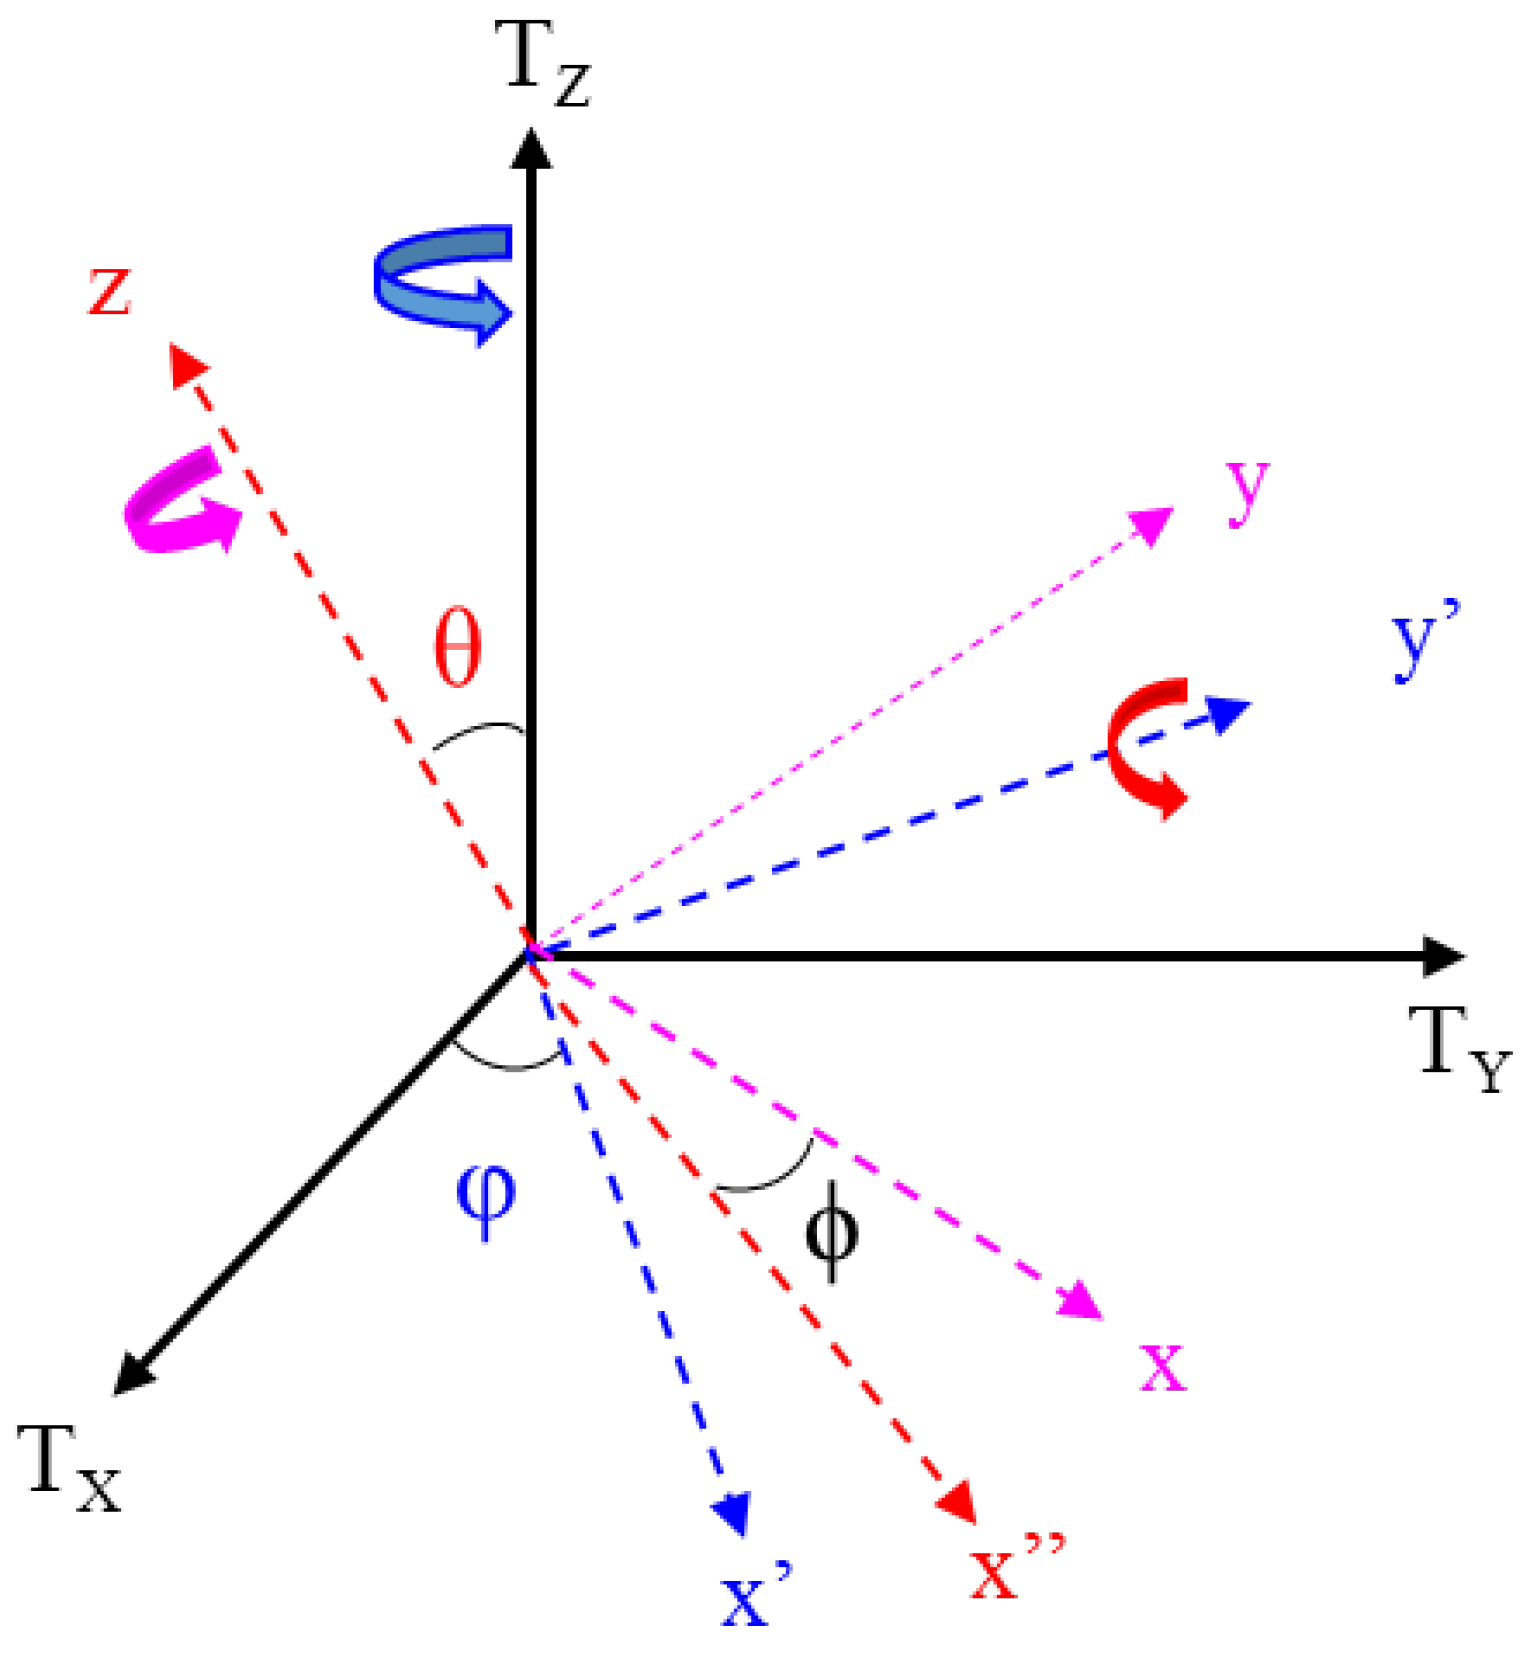
Meanwhile, these angle rotations in Roe’s definition [8] are depicted in Figure 2. The definition of Euler rotation angles in Roe’s terminology is as follows [8]: first, rotate about the axis though the angle ; then, rotate about the axis by the angle ; finally, rotate about the axis through the angle .
Figure 2.
The definition of Euler rotation angles in Roe’s terminology [8]: first, rotate about the axis though the angle ; then, rotate about the axis by the angle ; finally, rotate about the axis through the angle .
As explained in Ref. [15], Matthies’s rotation sequence is identical to Roe’s, but different symbols are employed for the three Euler angles. A summary of the Euler angles and rotation sequences for the different terminologies [6,7,15] is given in Table 1, and interested readers should refer to Refs. [6,7] for more details.
Table 1.
Euler angles and rotation sequences for different terminologies [6,7,15].
The mathematical expression of the ODF in Roe’s notation [8] is
where are the rotation angles in Roe’s convention (see Figure 2). The definition of Euler rotation angles in Roe’s terminology is as follows [8]: first, rotate about the axis though the angle ; then, rotate about the axis by the angle ; finally, rotate about the axis through the angle .
Index numbers l, m and n are integers, , represents the ODCs and denotes generalized spherical harmonics (its expression is given in Ref. [8]). When the ODF is known, one also can determine the ODCs using the following equation [16]:
Alternatively, the ODF in Bunge’s terminology [7] is
where are the rotation angles in Bunge’s convention (see Figure 1). The definition of Euler rotation angles in Bunge’s terminology is as follows [7]: first, rotate about the axis though the angle ; then, rotate about the axis by the angle ; finally, rotate about the z axis through the angle . denotes the ODCs and denotes generalized spherical harmonics (see Ref. [7]).
The reintroduction of quantitative texture analysis occurred in the 1980s. Matthies [17] first reported the ghost phenomenon in texture analysis, which is caused by non-zero odd-order texture coefficients. However, non-zero odd-order texture coefficients do not affect the mechanical properties of a polycrystal due to grain symmetry [7]. A new form of ODF proposed by Matthies [15] contains a D-function:
where are the rotation angles defined by Matthies [15], denotes the texture coefficients, and the D-function (see Ref. [15] for the explicit equation for the D-function). The D-function in Equation (4) is related to Bunge’s and Roe’s , and their relations will be discussed later. Although the ODFs in Roe’s and Bunge’s notations have been widely used to predict effective polycrystalline properties, such as elasticity and magnetism, the ODF in Matthies’s convention has also been adopted by numerous authors to calculate effective elastic moduli, such as in Ref. [18].
Other forms of ODFs also can be seen in the literature, such as the Gaussian ODF [19] and the hyperspherical harmonics ODF [20]. The Gaussian ODF in Ref. [19] presents continuous texture variation, and it provides a simpler expression for fiber texture. Such a 1D Gaussian ODF has been used for ultrasonic backscattering modeling in Refs. [21,22] and further extended to 3D forms for ultrasonic scattering modeling in Refs. [11,23,24]. The hyperspherical harmonics ODF in Ref. [20] provides an intuitive interpretation of angle rotation and texture visualization. However, the ultrasonic scattering model in this work only accounts for generalized spherical harmonics ODFs.
2.2. Relations Between Different Terminologies for ODFs
Although there are three conventions of Euler rotation (Roe, Bunge and Matthies), they are related to each other. As explained in Ref. [7], to reach the same local coordinates x-y-z as in Bunge’s convention, the following set of Roe’s rotation angles should be used:
The relation between Roe and Matthies’s rotation angles is .
Moreover, the generalized spherical harmonics in different notations are correlated. According to Ref. [7], the conversion between Bunge’s and Roe’s notation is
The relation between Roe’s and Matthies’s D-function has been reported in Refs. [25,26]:
One also can correlate texture coefficients , and when using different ODFs to describe the same textured polycrystal, as explained in Ref. [27]. The relation between Roe’s and Bung’s has been derived in Ref. [27] as follows:
The conversion between Matthies’s and Roe’s notations was reported in Refs. [25,26]:
Therefore, when the ODF for a textured polycrystal in one notation is known, one can convert it to another convention according to the equations above.
2.3. General Relations Between Ultrasonic Scattering Coefficients and ODCs
In the 1980s, ultrasonic scattering in textured cubic polycrystalline materials with orthotropic texture symmetry was studied by Hirsekorn [28,29] based on perturbation theory, and the ODF in Bunge’s notation was adopted in Hirsekorn’s studies [28,29] to quantitatively describe the macrotexture. Years later, Turner [30] derived the scattering-induced attenuation in terms of the Dyson equation, and the explicit attenuation coefficient was obtained for aggregates of cubic crystals with a transversely isotropic texture [30] (the [001] axes of cubic grains are perfectly aligned). Yang and Rokhlin [31] established the explicit relation between the ultrasonic scattering coefficient and the attenuation coefficient, and they further developed the backscattering model for cubic polycrystal aggregates with a fiber texture [22]. Recently, the ultrasonic backscattering model in Ref. [22] was generalized to orthotropic aggregates with an arbitrary texture in Ref. [23] and eventually extended to textured aggregates of triclinic constituents with arbitrary texture symmetry [11]. However, a Gaussian ODF was employed in these backscattering models [11,22,23] for illustration purposes, instead of considering an experimental ODF determined from texture measurements in Bunge’s or Roe’s convention [7,8]. Therefore, these backscattering models [11,22,23] cannot be practically applied to predict the backscattering coefficient of a polycrystal with known ODCs that are retrieved from texture measurements.
To correlate the ODCs with general backscattering models, the key is the effective elastic moduli and elastic constant covariance of a textured medium. Following Refs. [11,23], this study uses the Voigt reference medium for ultrasonic scattering modeling. To calculate the effective elastic constants of a textured polycrystalline material, one can use the Reuss average and self-constant method, as well as the Voigt average. However, for elastic scattering modeling in polycrystalline materials, the wave attenuation model in Voigt’s average gives reasonable results, as seen in Ref. [31]. Moreover, a recent study [32] has reported that the Voigt reference medium is more suitable for elastic wave scattering. Define and as the effective elastic constants of the whole aggregate via the Voigt average, and one can apply the ODF in Roe’s convention for calculation:
where is the elastic constant tensor of a single crystallite (after rotation by ) in the global coordinates --, and is the ODF in Roe’s notation. The elastic constant tensor in global coordinates-- is related to those in local crystal coordinates x-y-z by the following rotation matrix [11,33]:
where is the transpose of the rotation matrix , which is expressed by Roe’s Euler angles as [8]
Note that Equation (10) for effective elastic moduli is applicable to aggregates of triclinic crystallites with arbitrary texture symmetry. As stated in Ref. [8], due to texture symmetry and crystallite symmetry, some ODCs () in Roe’s ODF must be zero. For example, the non-zero for hexagonal crystallite aggregates with an orthotropic texture are , , , , , , , and (). The non-zero for other cases also can be found according to Ref. [8].
Since the reference medium of the polycrystal is known, following Refs. [11,13,30], the elastic constant fluctuation at a certain point is defined as and the two-point correlation function is defined as . However, the backscattering coefficient for a polycrystal is in a statistical sense (see Refs. [11,22,23,28,29,34]), and only its ensemble average or the mean is of importance. Under the assumption of an independent orientation among neighboring grains (see Refs. [11,22,23,34]), the following relation holds: . Here, is the ensemble average of elastic constant covariance, and it is the core of scattering modeling. Note that Einstein summation is adopted in the covariance. is the spatial two-point correlation function, and it will be discussed below. The covariance of the elastic constant fluctuation can be calculated through the following formula [11,23,28]:
where the eight-rank tensor for covariance of the elastic constant should be calculated through the ODF in generalized spherical form by the following equation:
where is the ODF in Roe’s notation. Equations (13) and (14) are applicable to aggregates of triclinic crystallites with arbitrary texture symmetry. Obviously, the covariance is merely governed by the crystallite elastic constants and texture.
According to Refs. [11,23,24,30], the inner product, a factor related to the propagation directions and polarization vectors of the incidence wave and scattering wave, is defined as
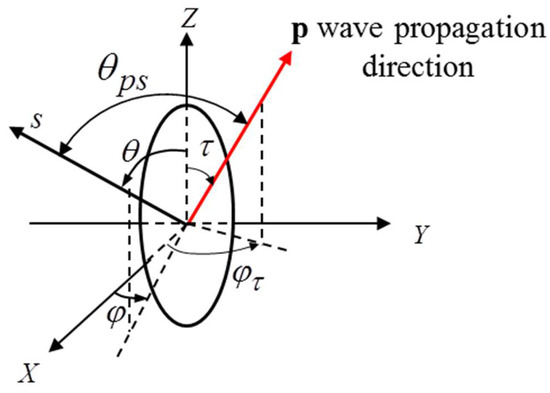
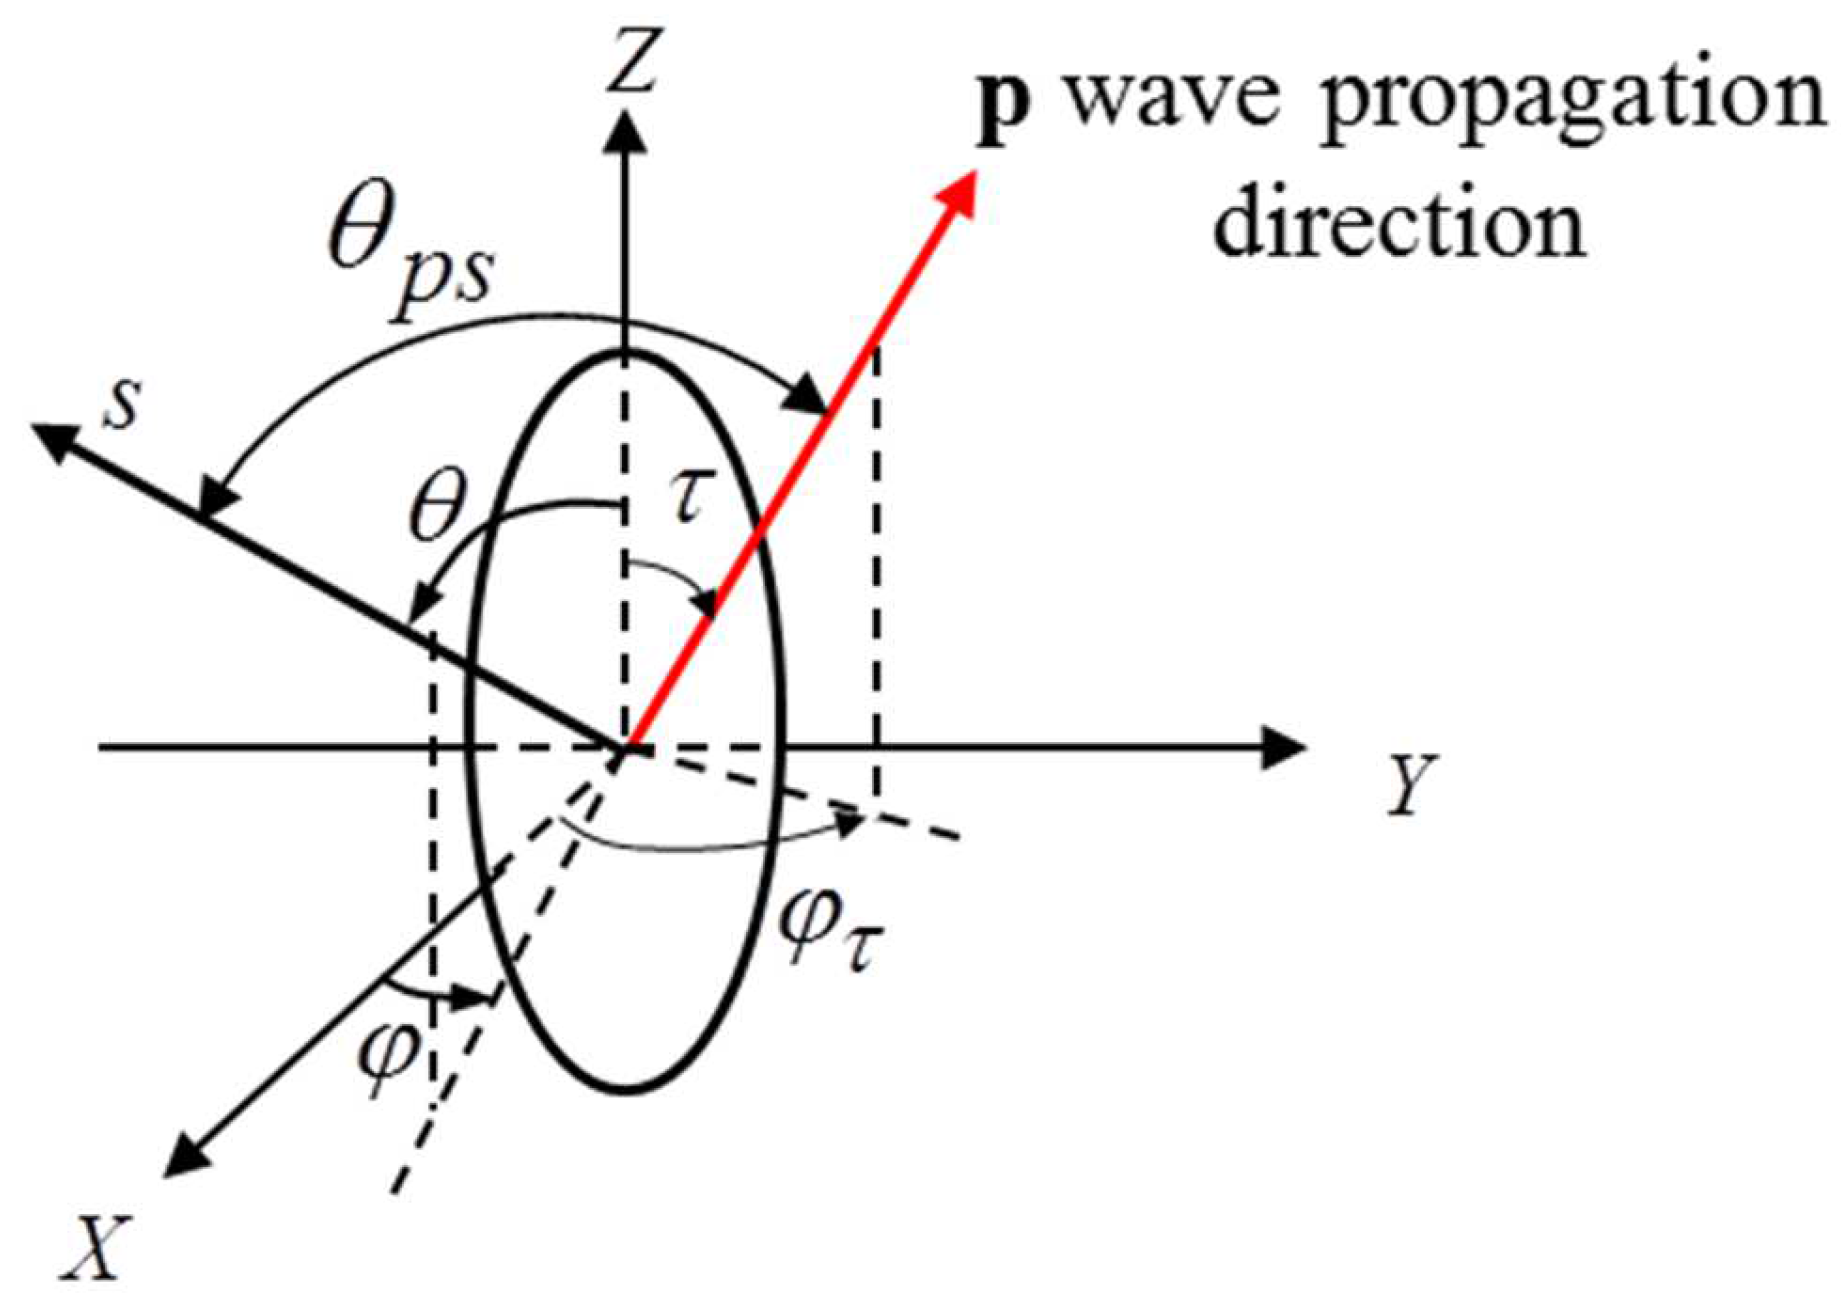
where is the wave propagation direction of an incidence wave (see Figure 3). The wave propagation direction is and the scattering direction is in polycrystalline materials consisting of uniform ellipsoidal grains. The three main axes of ellipsoidal grains are and . denotes the scattering direction of a scattered wave, as shown in Figure 3.
Figure 3.
Wave propagation direction p(τ,Φτ) and scattering direction s(θ,Φ) in polycrystalline materials consisting of uniform ellipsoidal grains. Three main axes of ellipsoidal grains are aX, aY and aZ.
u denotes the polarization vector of an incidence wave, and stands for the polarization vector of a scattered wave. The phase velocities and and polarization vectors and (eigenvectors) in a textured polycrystal are determined by Christoffel’s equation [35]:
Since a textured polycrystalline material is anisotropic, generally, there are three wave modes for both an incidence wave and a scattered wave, namely quasi-longitudinal (QL), transverse fast (TF) and transverse slow (TS).
For a polycrystal composed of ellipsoidal grains with intercept lengths in a Poisson distribution, the three mean semi-principal radii are shown in Figure 3. For general purposes, the coordinate for ellipsoidal grains is assumed to be independent of the crystallographic texture coordinate in the following theoretical model derivation, while the grain elongation direction would be aligned with the crystallographic texture coordinate in practical textured metal components such as extruded and rolled steels. The wave propagation direction is and the scattering direction is in polycrystalline materials consisting of uniform ellipsoidal grains. The three main axes of an ellipsoidal grain are and , and the spatial two-point correlation function () that addresses the probability of two points falling within the same grain is in the form of an exponential function [23,36]:
Moreover, its spatial Fourier transform, , is given as [11,36,37]
where is a vector governed by incidence wave and scattered wave , and the wavenumbers and . For a polycrystal composed of ellipsoidal grains with intercept lengths in a non-Poisson distribution (for example, mixed columnar grains and equiaxed grains), the spatial two-point correlation function can be generalized by adding up multiple exponential terms, as in Ref. [38]; however, this is beyond the scope of this study, and only one term for the exponential spatial two-point correlation function is used throughout this paper for simplification.
After relating the ultrasonic velocity and inner product with the ODF in Roe’s notation, the scattering coefficient (scattering cross-section per unit volume) for a textured aggregate of triclinic ellipsoidal grains is
where M stands for the wave mode (quasi-longitudinal, transverse fast or transverse slow) for an incidence wave with a velocity , and N denotes the mode of a scattered wave with a velocity . Thus, Equation (19) gives the scattering coefficients for nine scattering scenarios. In the backscatter direction, and the backscattering coefficient is . In many cases, including the experiments in [36,39], researchers use the backscattering amplitude instead.
Another important characteristic associated with scattering is scattering-induced attenuation, which happens because scattering events take place in every direction in the 3D space and acoustic energy is scattered out of the wave beam [2,13,40,41]. The summation of the scattering energy over all directions produces the attenuation. Following attenuation modeling under the framework of Born approximation in Ref. [24], the attenuation coefficient in a given wave propagation direction in a textured polycrystal is
where stands for quasi-transverse fast mode, denotes quasi-transverse slow mode, and the three components of the attenuation coefficient due to scattering mode conversion are [24]
where the inner products and two-point correlation function have the same definition as those in Equation (18). The relation between the inner product and ODCs and the numerical calculation of the inner product have been discussed in the previous sections. As can be seen from Equation (21), integration over all scattering angles results in the attenuation coefficient.
In summary, general models for the scattering coefficients and attenuation coefficients related to ODCs () in Roe’s notation have been established in this section. One also can adopt the ODFs in Bunge’s notation or Matthies’s notation to obtain general scattering models using the corresponding ODFs; this will not be repeated here. Explicit expressions for the scattering and attenuation coefficients by ODCs are difficult to obtain, and this will not be attempted below; however, we will give explicit backscattering coefficients for two cases: aggregates of hexagonal crystallites with a fiber texture and polycrystals of cubic grains with orthotropic texture symmetry.
3. Explicit Ultrasonic Scattering Coefficients for Textured Polycrystals
3.1. Explicit Backscattering Coefficient for Hexagonal Polycrystalline Materials with Basal Fiber Texture
In this section, the general scattering model will be specified for hexagonal crystal aggregates with a {0001} basal texture, and explicit equations for the QL-QL backscattering coefficient will be obtained using the ODF in Roe’s convention. This explicit equation has practical applications in the determination of texture coefficients and microstructure characterization.
For aggregates of hexagonal crystallites with a {0001} basal texture, the c-axes of hexagonal crystallites are somewhat aligned with the axis (see Figure 2). The definition of Euler rotation angles in Roe’s terminology is adopted [8]. Namely, we first rotate about the axis though the angle ; then, rotate about the axis by the angle ; finally, rotate about the axis through the angle .
According to Ref. [8], the non-zero for a hexagonal crystallite aggregate with a {0001} fiber texture are ,,,, and (). Therefore, the ODF in Roe’s convention could be simplified as
Here, we consider ODCs up to the eighth order, since the covariance employed in the backscattering model is an eight-order tensor and the order of ODCs should match the tensor rank [25]. Otherwise, large truncation errors may arise. For polycrystal aggregates of hexagonal crystallites with a {0001} basal texture, the macroscopic elastic constants of the aggregate from Equation (10) are
where , and are the effective elastic moduli for a macroscopic isotropic hexagonal polycrystal aggregate. Their relations with single-crystal elastic constants are , and .
Symbols and are defined as
One should note that the Voigt notation is used here to contract the subscripts from ijkl to MN for both the single-crystal elastic constants and effective elastic constants. Higher-order ODCs (>fourth) are not involved in determining the effective elastic constants; however, they do affect the backscattering and scattering-induced attenuation (which will be explained below). Ref. [25] proves that, for any texture symmetry, the effective moduli only depend on ODCs no larger than the fourth order. Physically, this occurs due to crystallite symmetry and sample symmetry. As with the ghost phenomenon discovered by Mathies [17], some odd-order ODCs do affect the pole figure pattern but not the macroscopic properties.
Ref. [42] reports the effective elastic constants for aggregates of hexagonal crystallites with orthotropic texture symmetry using the Voigt averaging method. Our results are consistent with those in Ref. [42] when degenerating orthotropic texture symmetry to transversely isotropic texture symmetry. Another finding is that the effective elastic constants in Equation (21) do not require higher than the fourth order. One explanation is that the order of texture coefficients is bounded between 0 and 4 for fourth-rank effective moduli (either the Voigt or Reuss averaging methods), as explained in Refs. [25,43].
After the effective elastic constants of the whole aggregate are known, one can determine the phase velocities V and polarization vectors of the incidence wave and backscattered wave via Christoffel’s equation:
The incidence wave propagation direction and the backscattered wave direction . After solving Christoffel’s equation, the quasi-longitudinal (QL) velocity in the wave propagation direction or backscatter direction is obtained:
where , and are defined as
From Christoffel’s equation, the velocities of two quasi-transverse waves (transverse fast (FT) and transverse slow (ST)) in the wave propagation direction or backscatter direction are derived:
The determination of the exact polarization vector for a quasi-longitudinal incidence wave is complicated. Instead, an approximated polarization vector can be found in Ref. [44]:
where . Equation (27) indicates that the incidence wave and its polarization vector have different polar angles (the same at symmetry axes) but identical azimuthal angles. Our further investigation indicates that such an approximated polarization vector has a discrepancy of less than 3.8% from the exact solution for hexagonal polycrystalline materials, such as titanium [31], zirconium [45] and magnesium [31]. Thus, Equation (27) is a reasonable approximation.
QL-QL backscattering, which can be determined in ultrasonic immersion tests, is of great importance for texture determination and microstructure characterization. Moreover, it implies that a scattered wave propagates in the opposite direction of an incidence wave, and the following relations hold:, . Therefore, the QL-QL backscattering coefficient in a specific wave propagation direction can be rewritten as
where the wavenumber and velocity are direction-dependent, and the inner product is . When the wave propagates along the texture symmetry axes, the inner product can be simplified as
where explicit equations for and are given in Appendix A. For arbitrary wave propagation, the explicit equation for inner product is complex, so an approximated form is obtained instead (assuming that the polarization vector is parallel to the wave propagation direction for a QL wave, as in Ref. [11]):
where the expressions for are given in Appendix B. This assumption is suitable for common hexagonal polycrystalline materials, such as titanium, magnesium, zirconium and their alloys, because these materials have relatively low anisotropy [46]. Thus far, the explicit expression for the backscattering coefficient using ODCs has been achieved. Although the ODF in Roe’s notation is used in the derivation, one can replace it with Bunge or Matthies’s notations to obtain the explicit expression using or .
3.2. Explicit Backscattering Coefficient for Cubic Polycrystalline Materials with Orthotropic Texture
For aggregates of cubic crystallites with orthotropic texture symmetry, the independent non-zero texture ODCs are,,, and , and other non-zero ODCs are related to these coefficients.
According to Ref. [8], the ODCs (no larger than the eighth order) adhere to the following relations:
Meanwhile, the corresponding full expression of the ODF is given in Appendix C.
Following Equation (10), the final results regarding the effective elastic constants obtained via Voigt averaging for textured cubic polycrystalline materials are
Here, ; ; ; . The results regarding the effective elastic constants are consistent with those in Refs. [47,48].
From Equations (13) and (14), the covariances of the elastic constants for cubic polycrystals with orthotropic texture symmetry are
where is the Kronecker delta, and.
The backscattering coefficient is
Wave propagation in the X direction:
Wave propagation in the Y direction:
Wave propagation in the Z direction:
In an arbitrary wave propagation direction, is a function of , , , , , , . More general cases for the effective elastic constants can be found in Ref. [48].
However, the models above are developed under Born approximation. They are not suitable for strong scattering conditions, such as very high ultrasonic frequencies, crystallites of huge sizes and extremely strong anisotropic crystals. Considering that the typical ultrasonic frequency range is 0.1 MHz to 25 MHz in non-destructive testing, these models are still useful for practical applications. Determining the exact applicable range is beyond the scope of this study.
4. Computational Results and Discussion
This section will describe the computational results in terms of the backscattering and attenuation coefficients for different polycrystalline materials with experimentally determined ODCs that have been reported in the literature.
4.1. Computational Example Using General Scattering Model
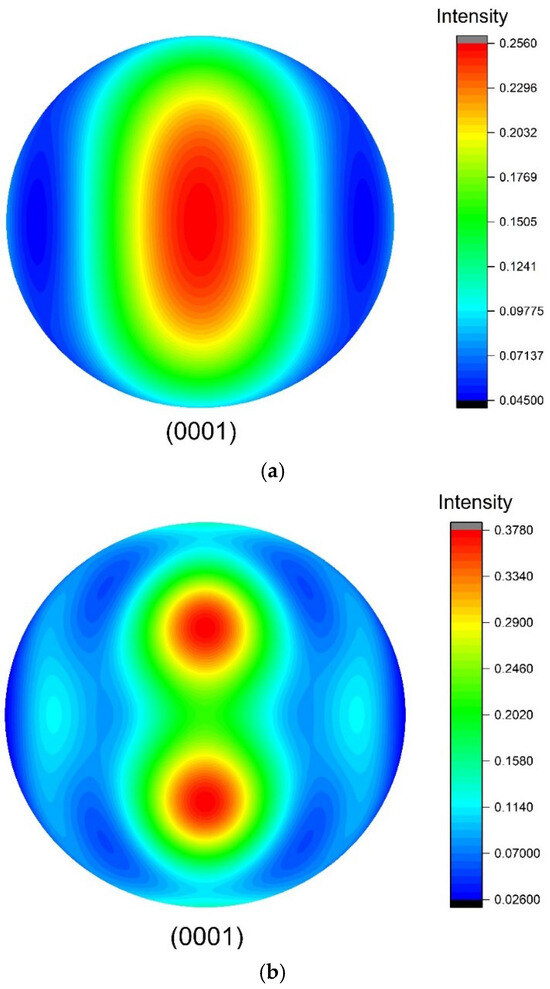
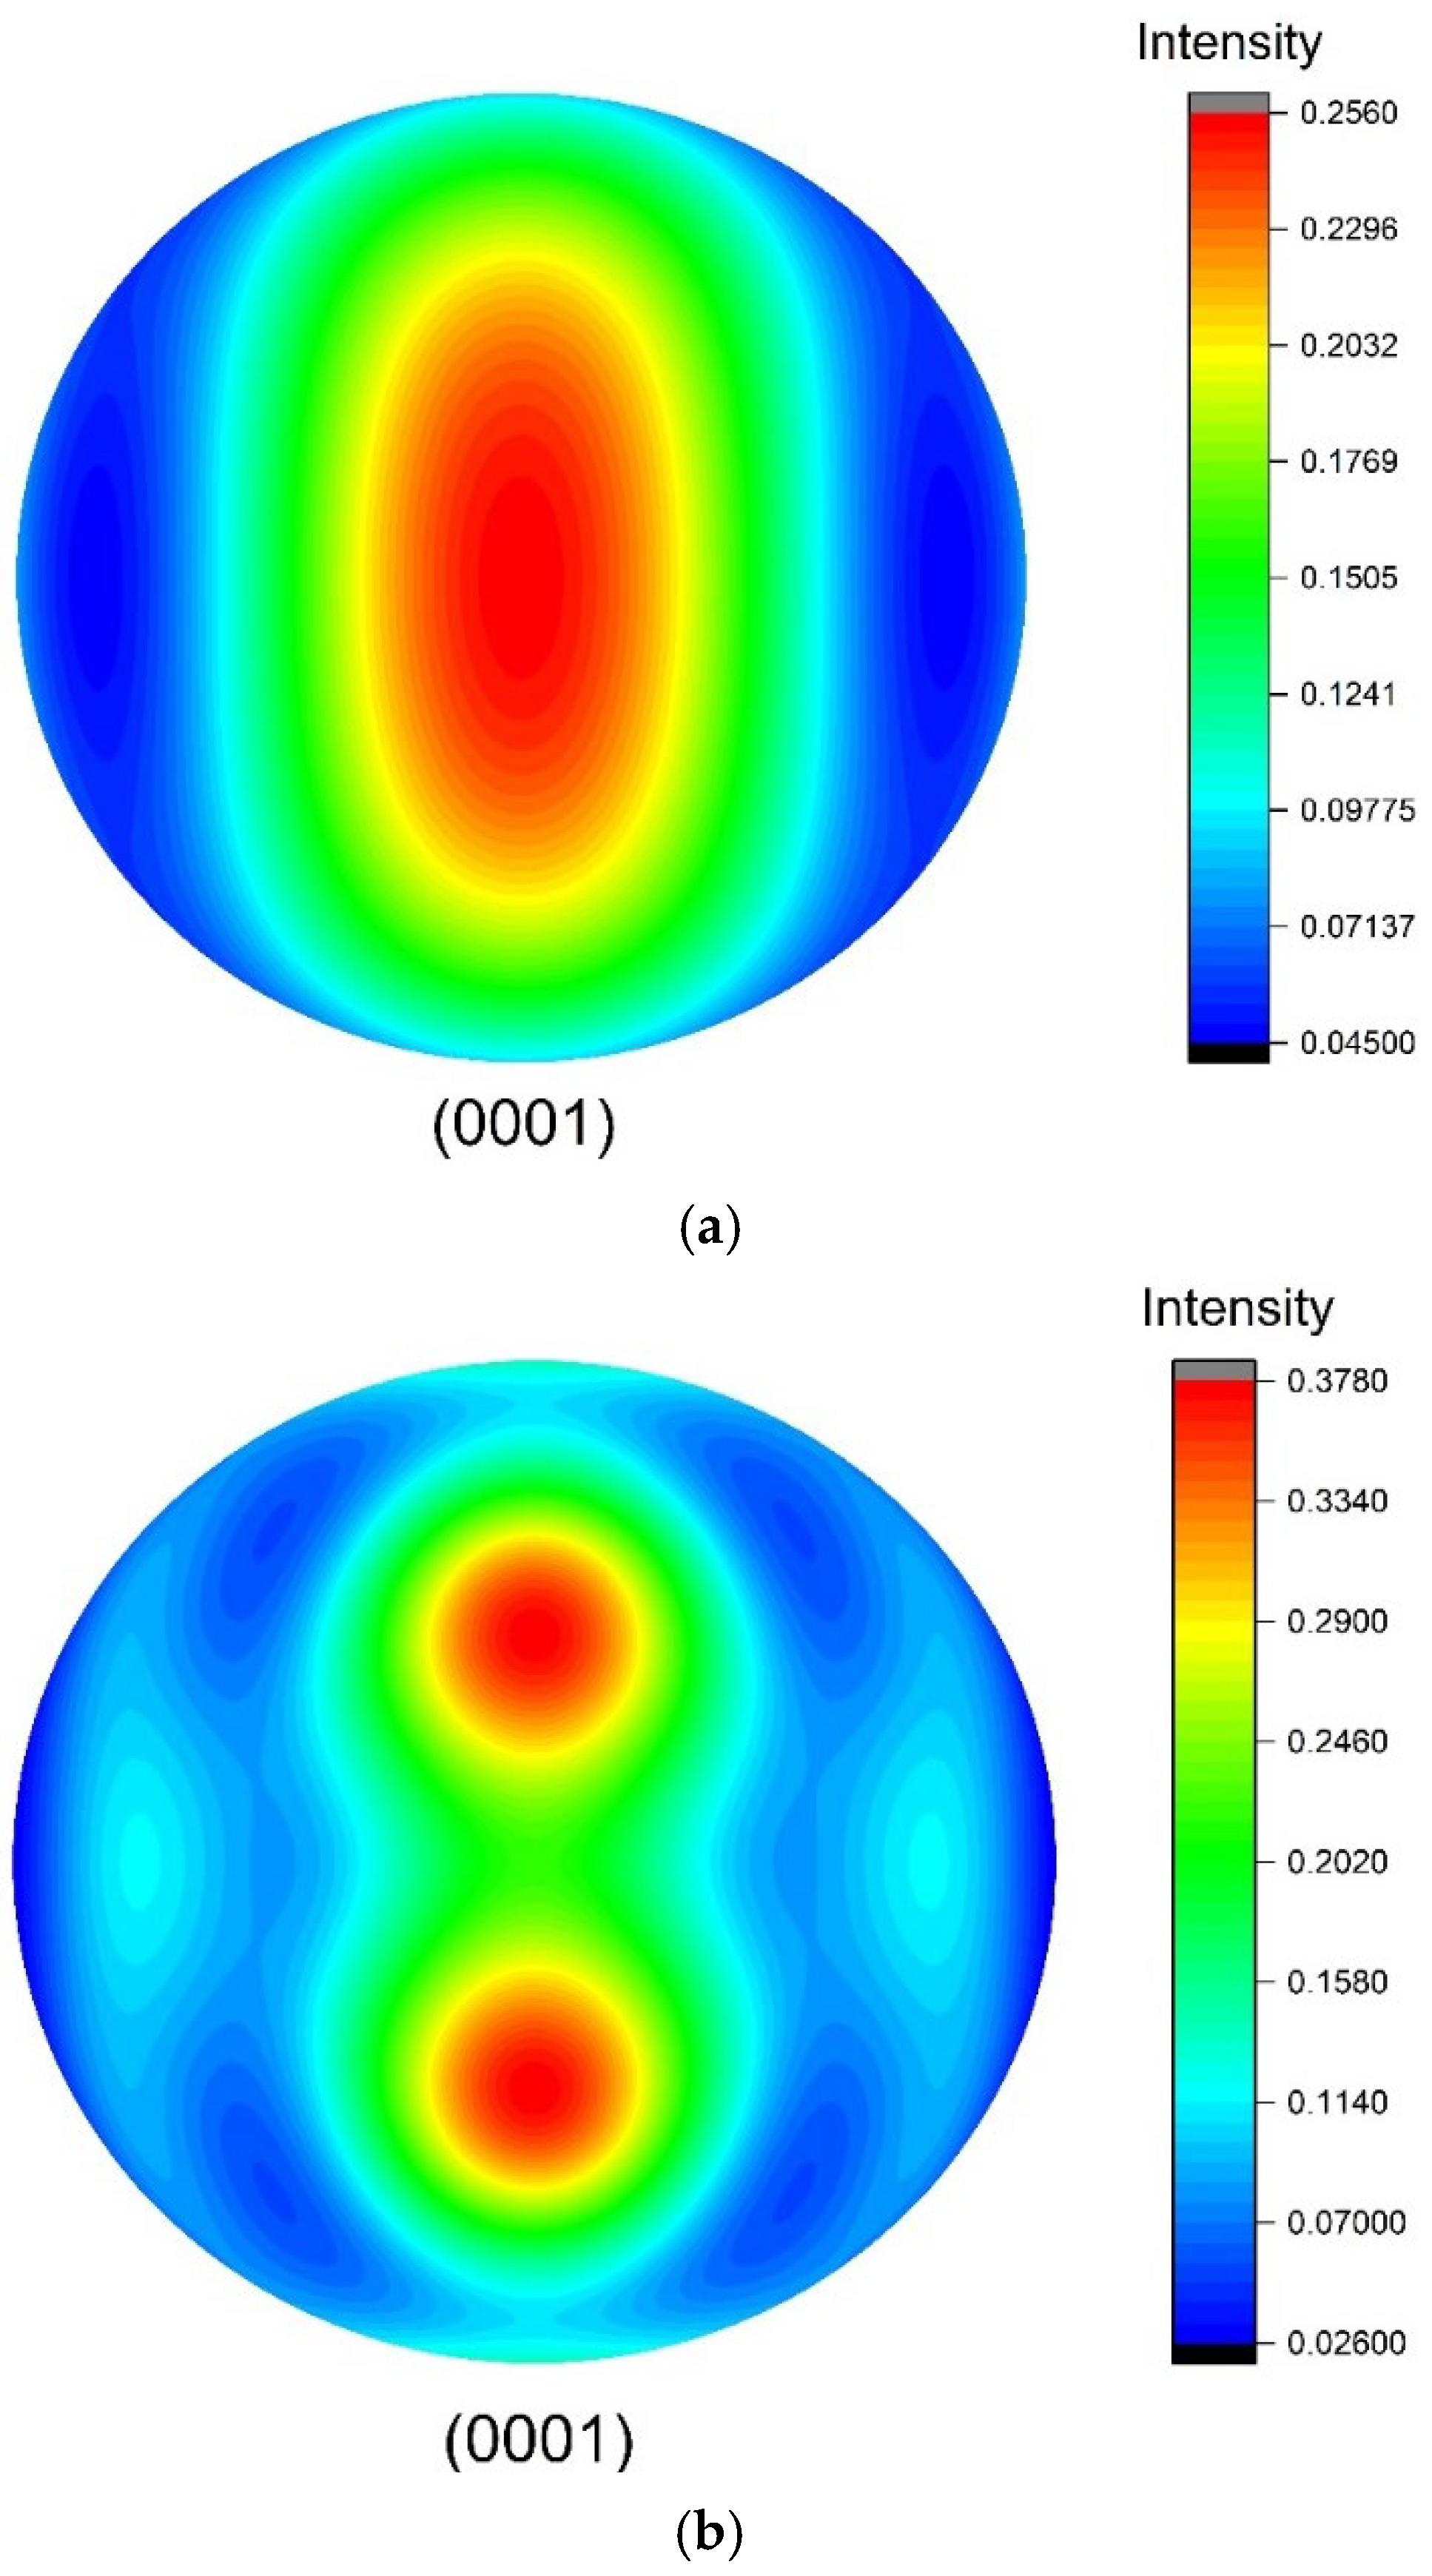
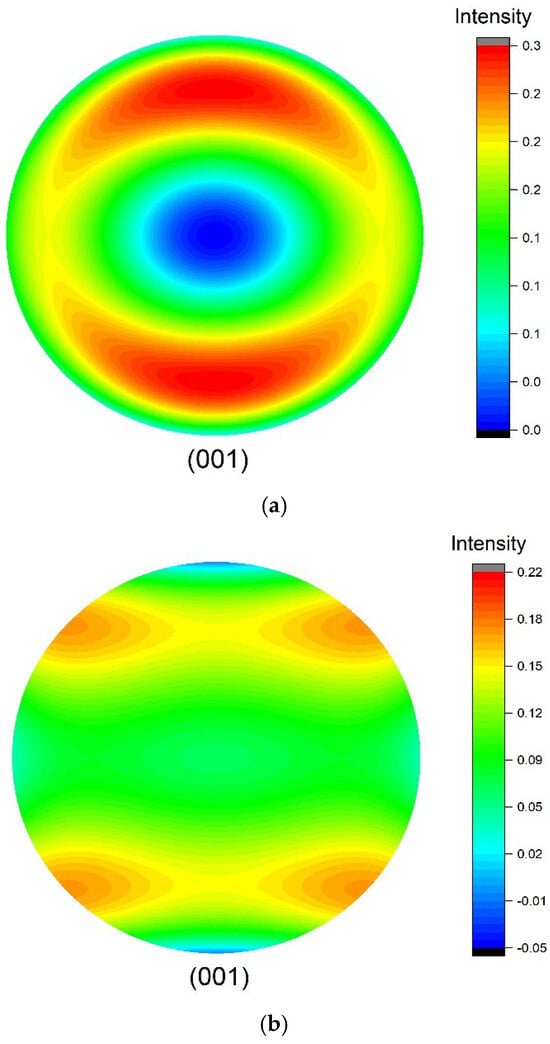
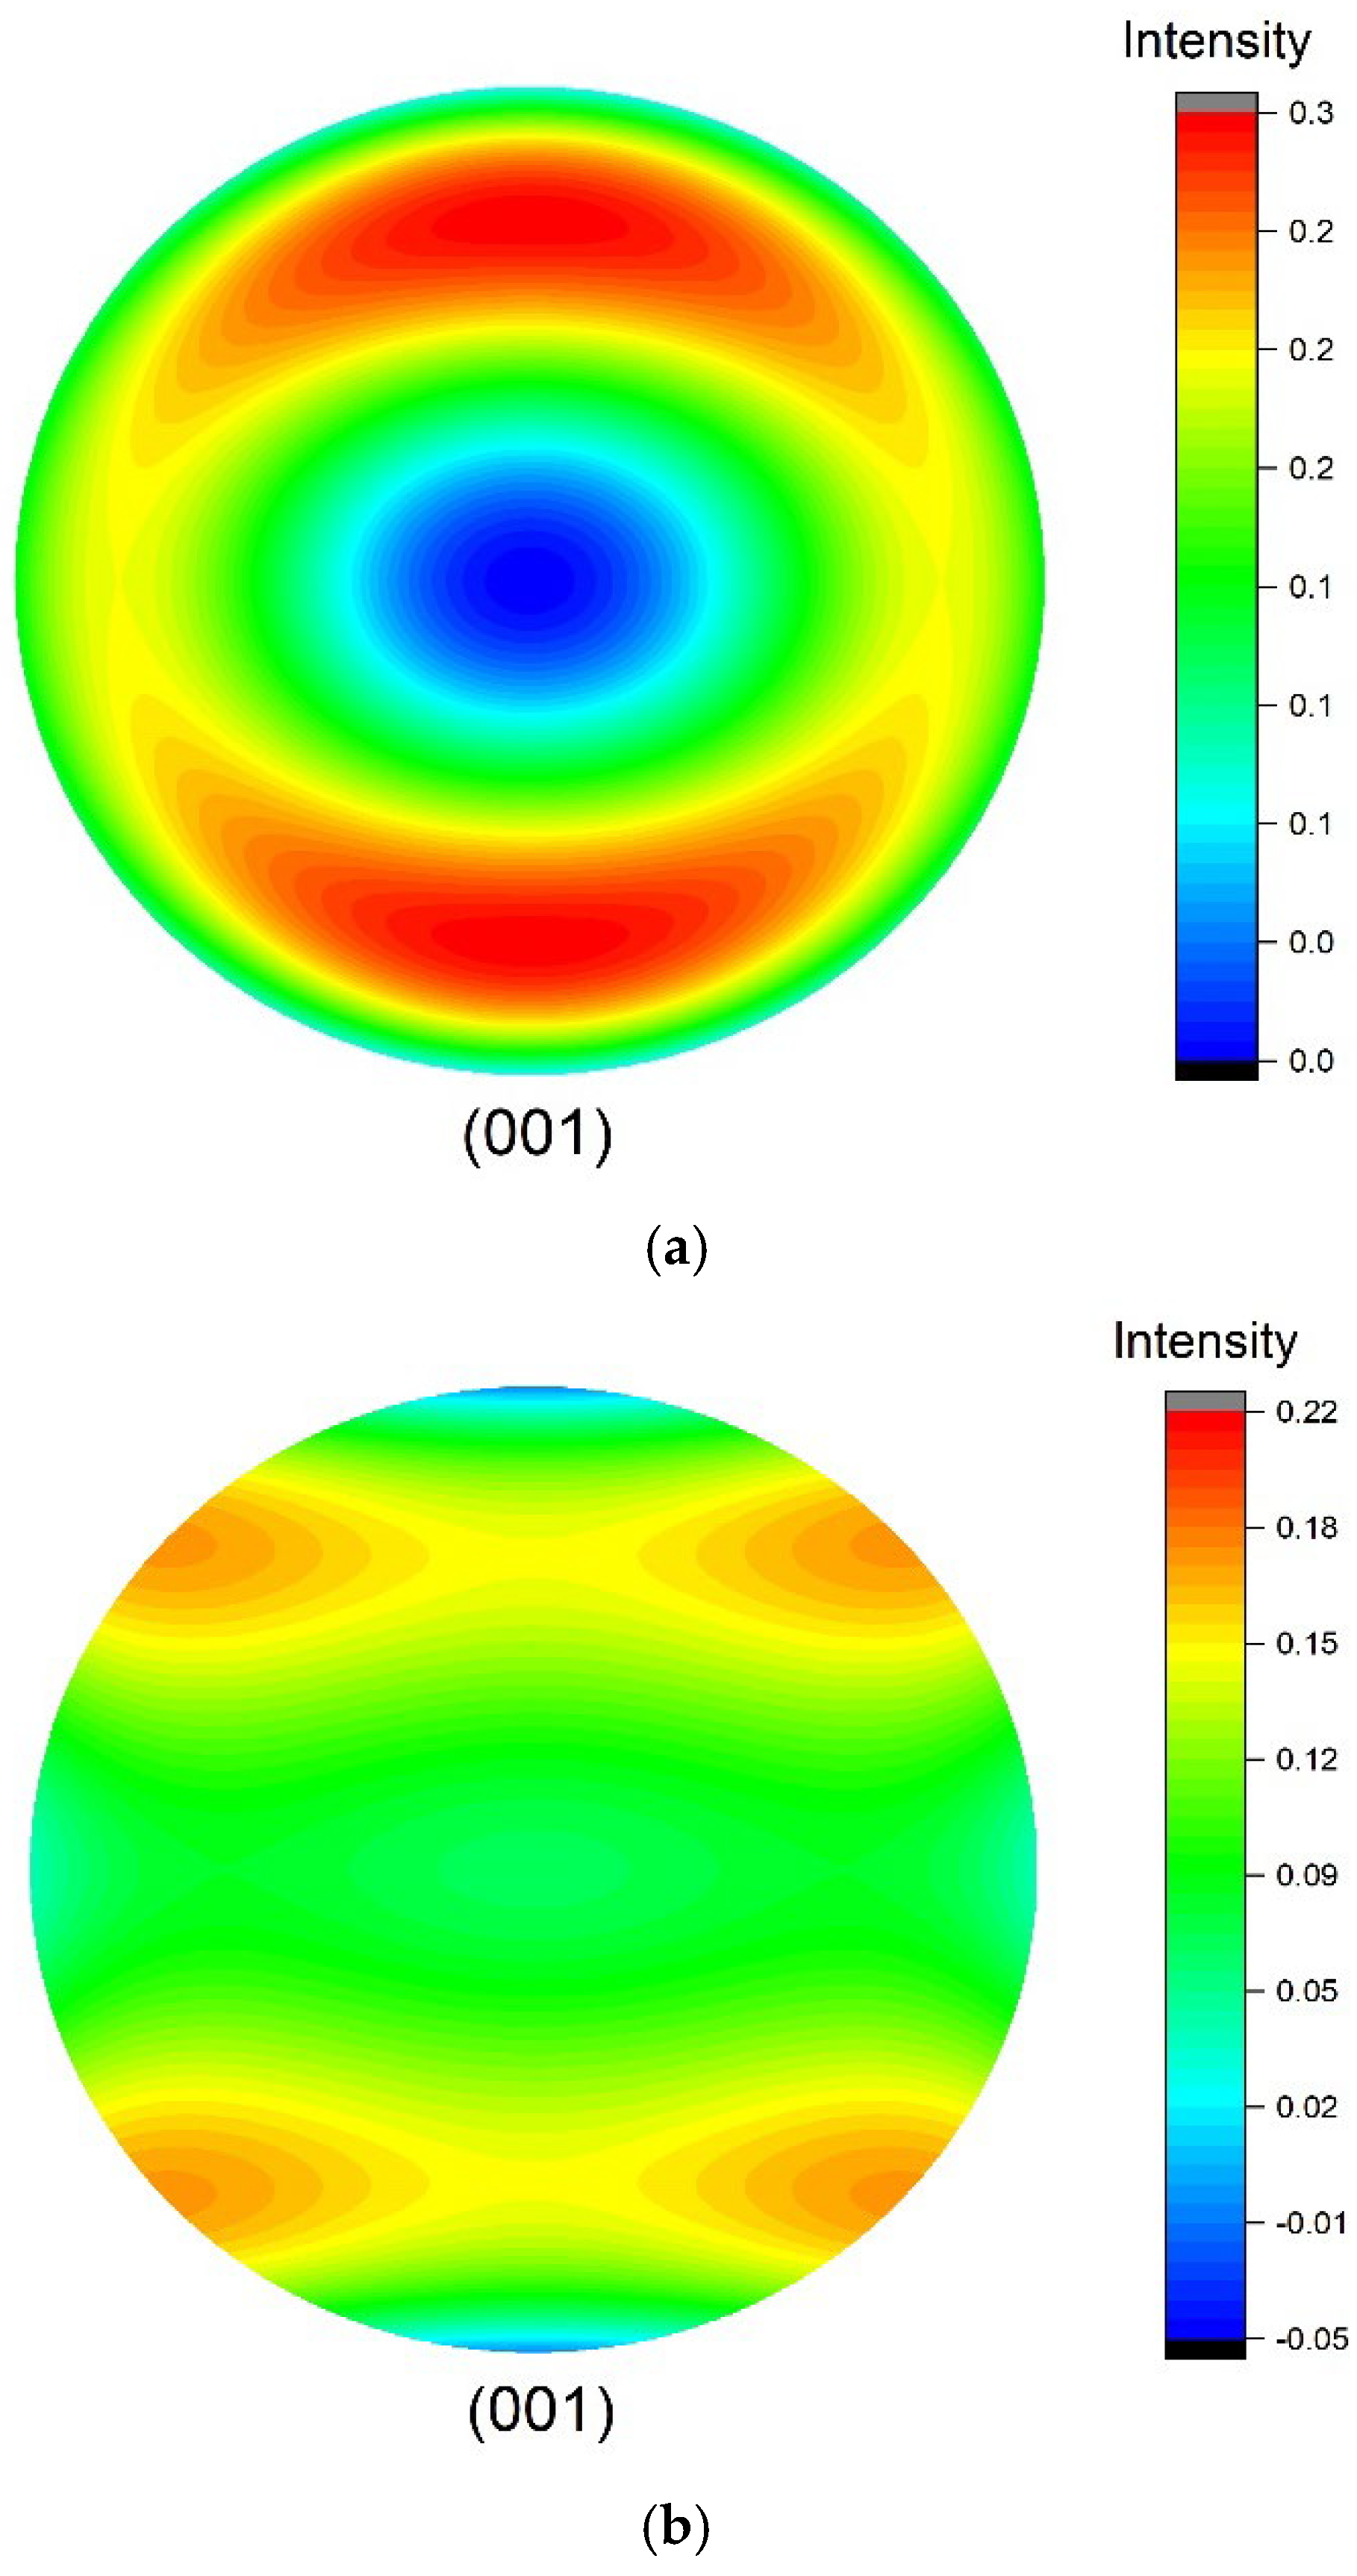
Here, one zirconium polycrystal with orthotropic texture symmetry is used as an example for backscattering and attenuation calculation. Its single-crystal elastic constants, which have been given in [45], are c11 = 144, c12 = 74, c13 = 67.0, c33 = 166, c44 = 33.0, c66 = 35.0 in GPa, and its density is 6.52 g/cm3. Assume that this zirconium polycrystal is composed of equiaxed grains with mean sizes and an orthotropic symmetric texture. The texture coefficients and ODCs are from Ref. [12], and the corresponding (0001) pole figure is plotted in Figure 4 to visualize the ODF. The pole figure is a well-known tool for texture analysis and visualization in materials science, and the detailed formula for calculating the pole figure from ODCs in Roe’s notation has been reported in Ref. [8]. In Figure 4, pole figures from ODCs at different truncation levels ( and ) are also shown to demonstrate the impact of truncation on the pole figure pattern. Physically, the figure shows the distribution density of the c-axes of individual hexagonal crystallites in a projected plane [8,49]. The pole figure with higher-order ODCs in Figure 4b shows a finer pattern than in Figure 4a; however, ODCs higher than the fourth order do not affect the effective elastic constants.
Figure 4.
Calculated (0001) pole figures from ODCs reported in Ref. [12] at different truncations for a zirconium polycrystal with orthotropic texture symmetry: (a) l ≤ 4 and (b) l ≤ 8.
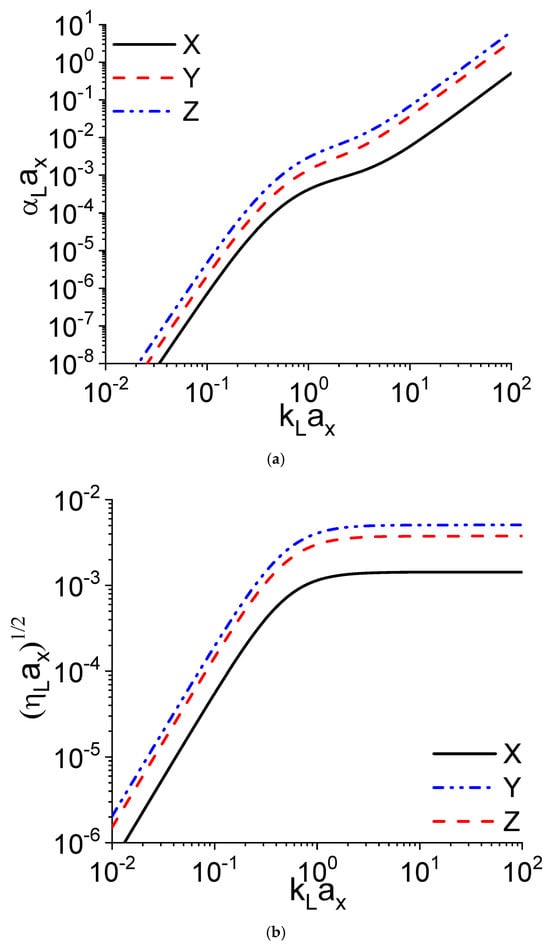
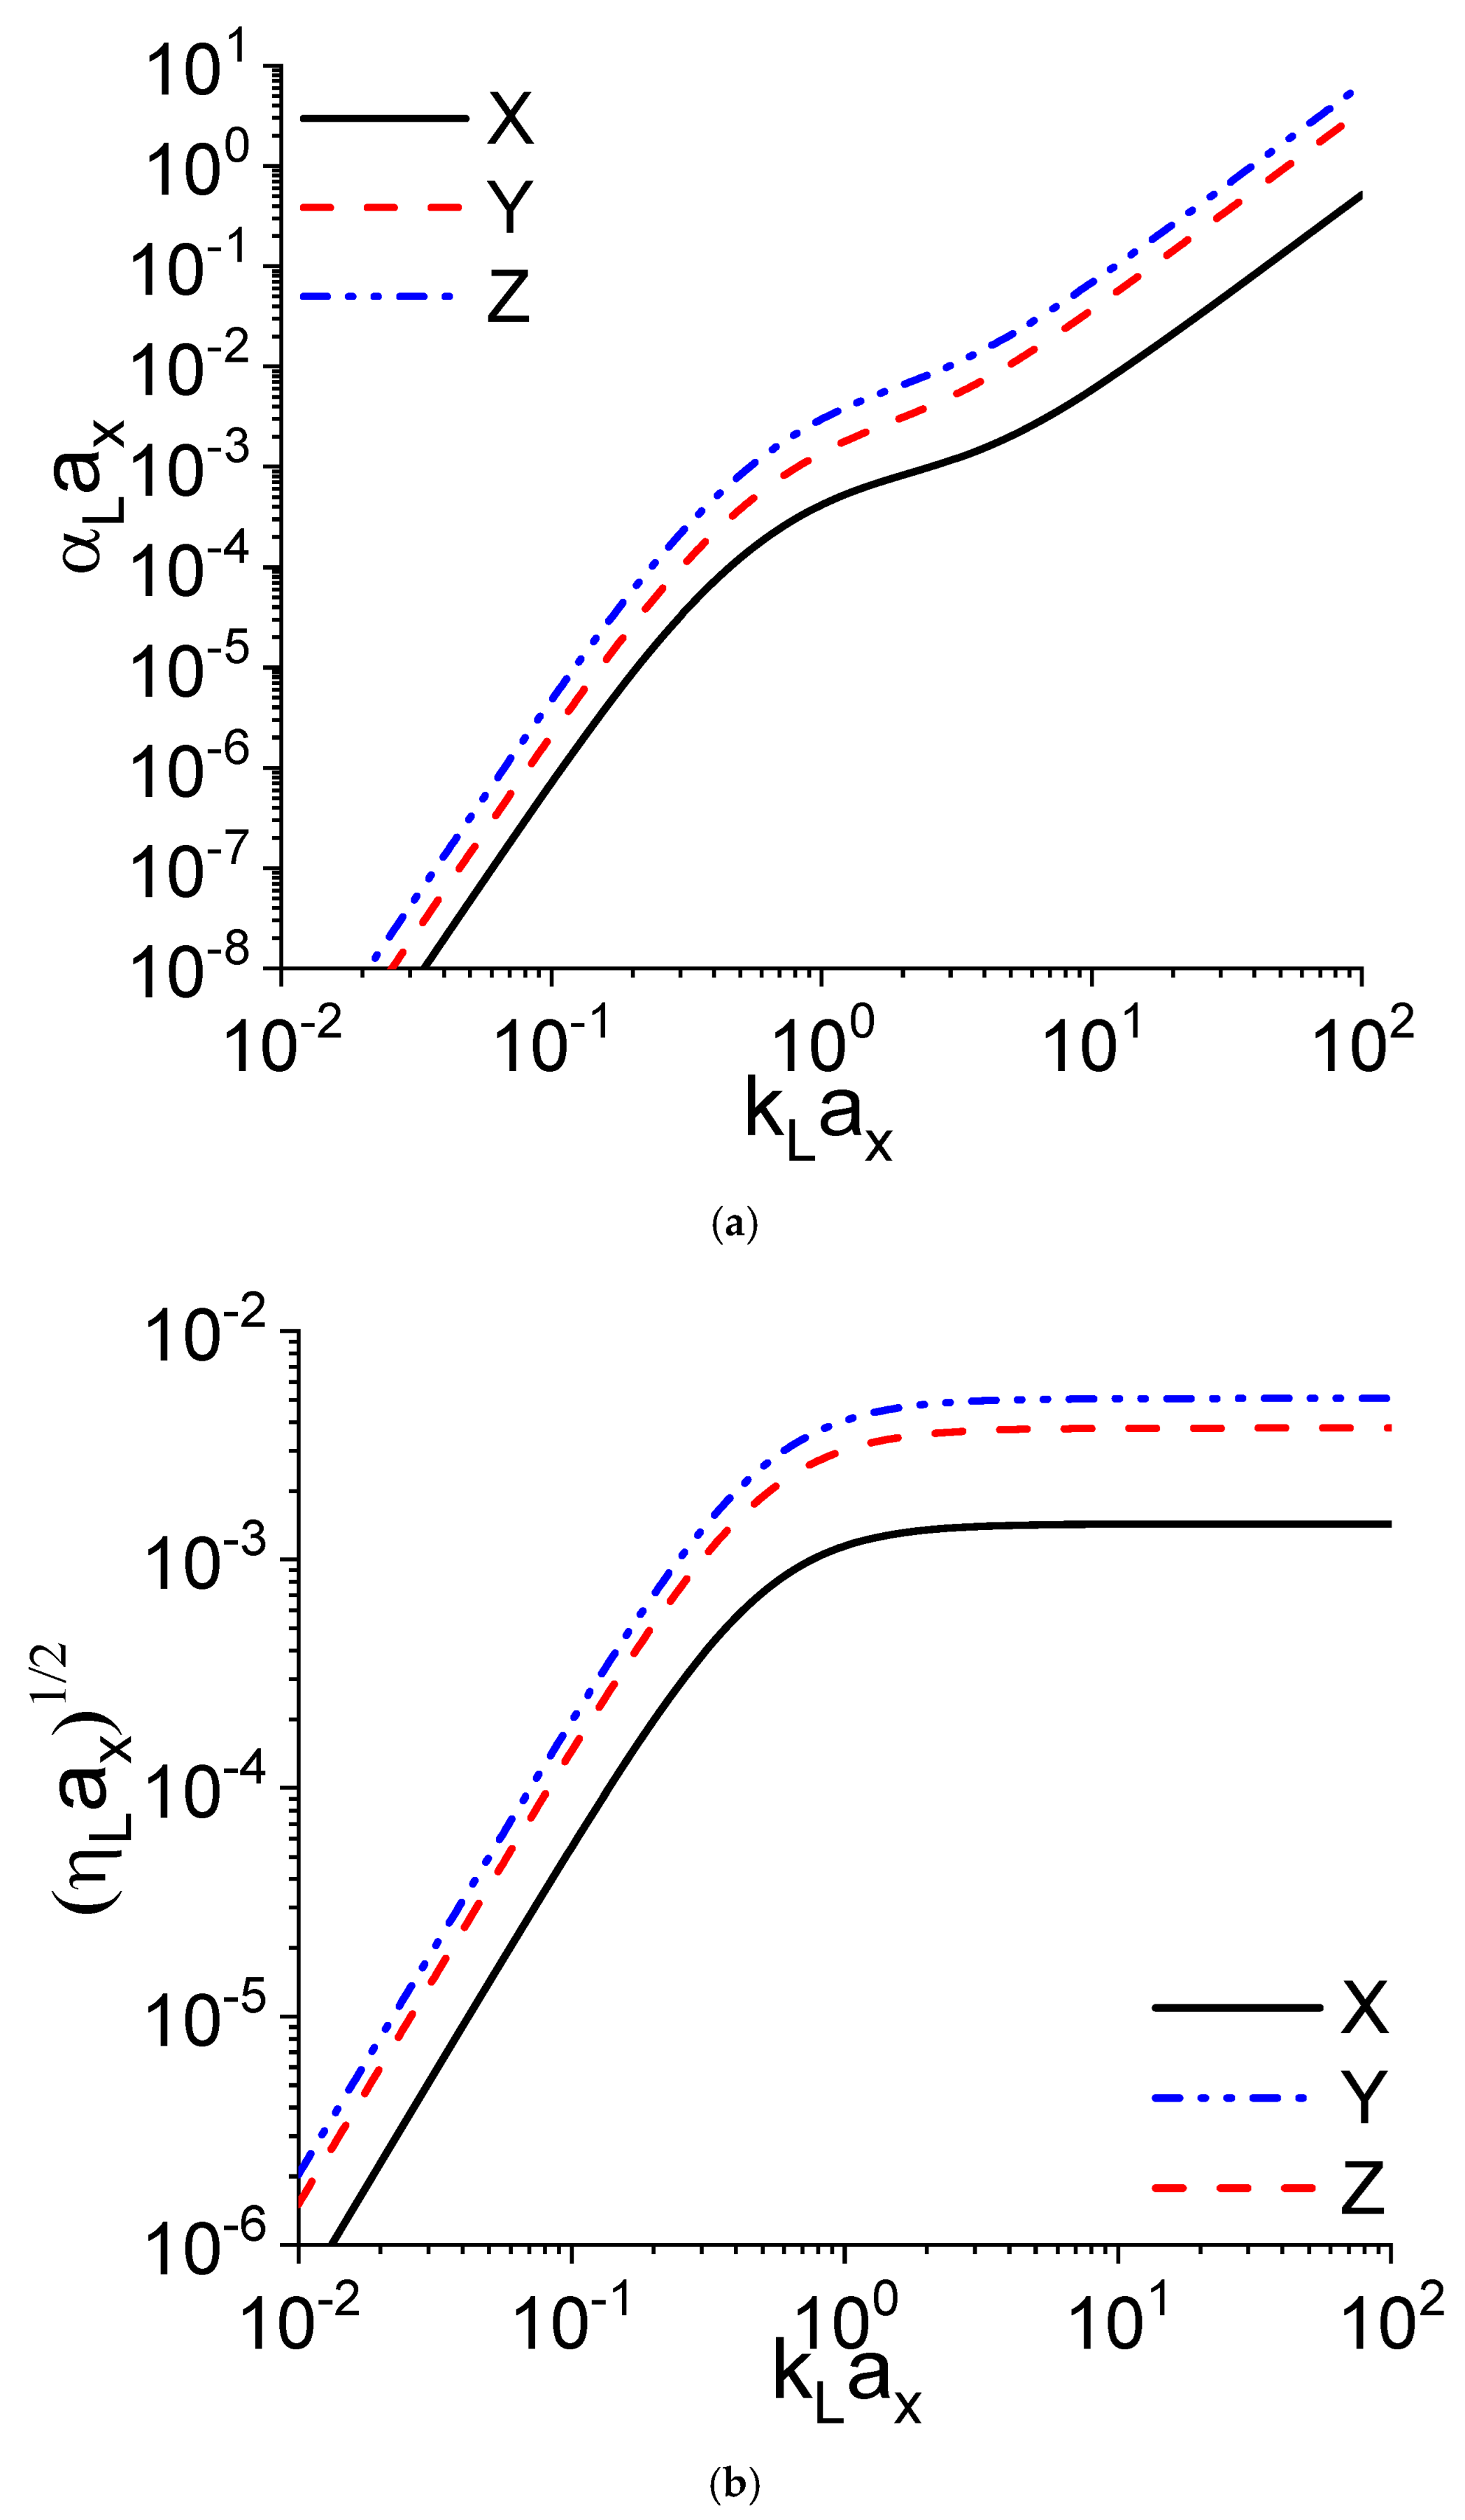
Furthermore, the backscattering amplitude and attenuation coefficient along the three main axes versus the frequency are calculated via Equations (19) and (20) and shown in Figure 5, where the backscattering amplitude, attenuation coefficient and frequency are normalized by the grain size. Since this zirconium polycrystal consists of equiaxed grains, Figure 5 purely illustrates the texture impact on backscattering and attenuation. Figure 5a,b are consistent, since the scattering in the X direction is the strongest, while the scattering in the Z direction is the weakest. The L-L backscattering coefficients for X, Y and Z in Figure 5b reach a plateau after a certain frequency, but this is not the case for the attenuation coefficient (Figure 5a), because the attenuation coefficient is a combination of L-L scattering and L-T scattering, as explained in Equation (21).
Figure 5.
Texture impact on attenuation coefficient and backscattering amplitude for a zirconium polycrystal with equiaxed grains: (a) normalized attenuation coefficients and (b) normalized L-L backscattering coefficients along the three texture coordinate axes using ODCs .
4.2. Aggregate of Cubic Crystallites with Transverse Isotropy Texture
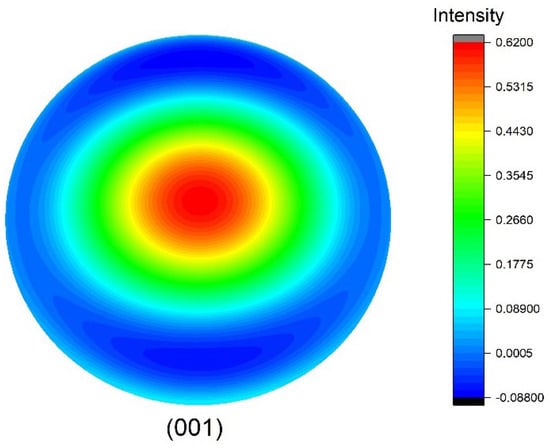
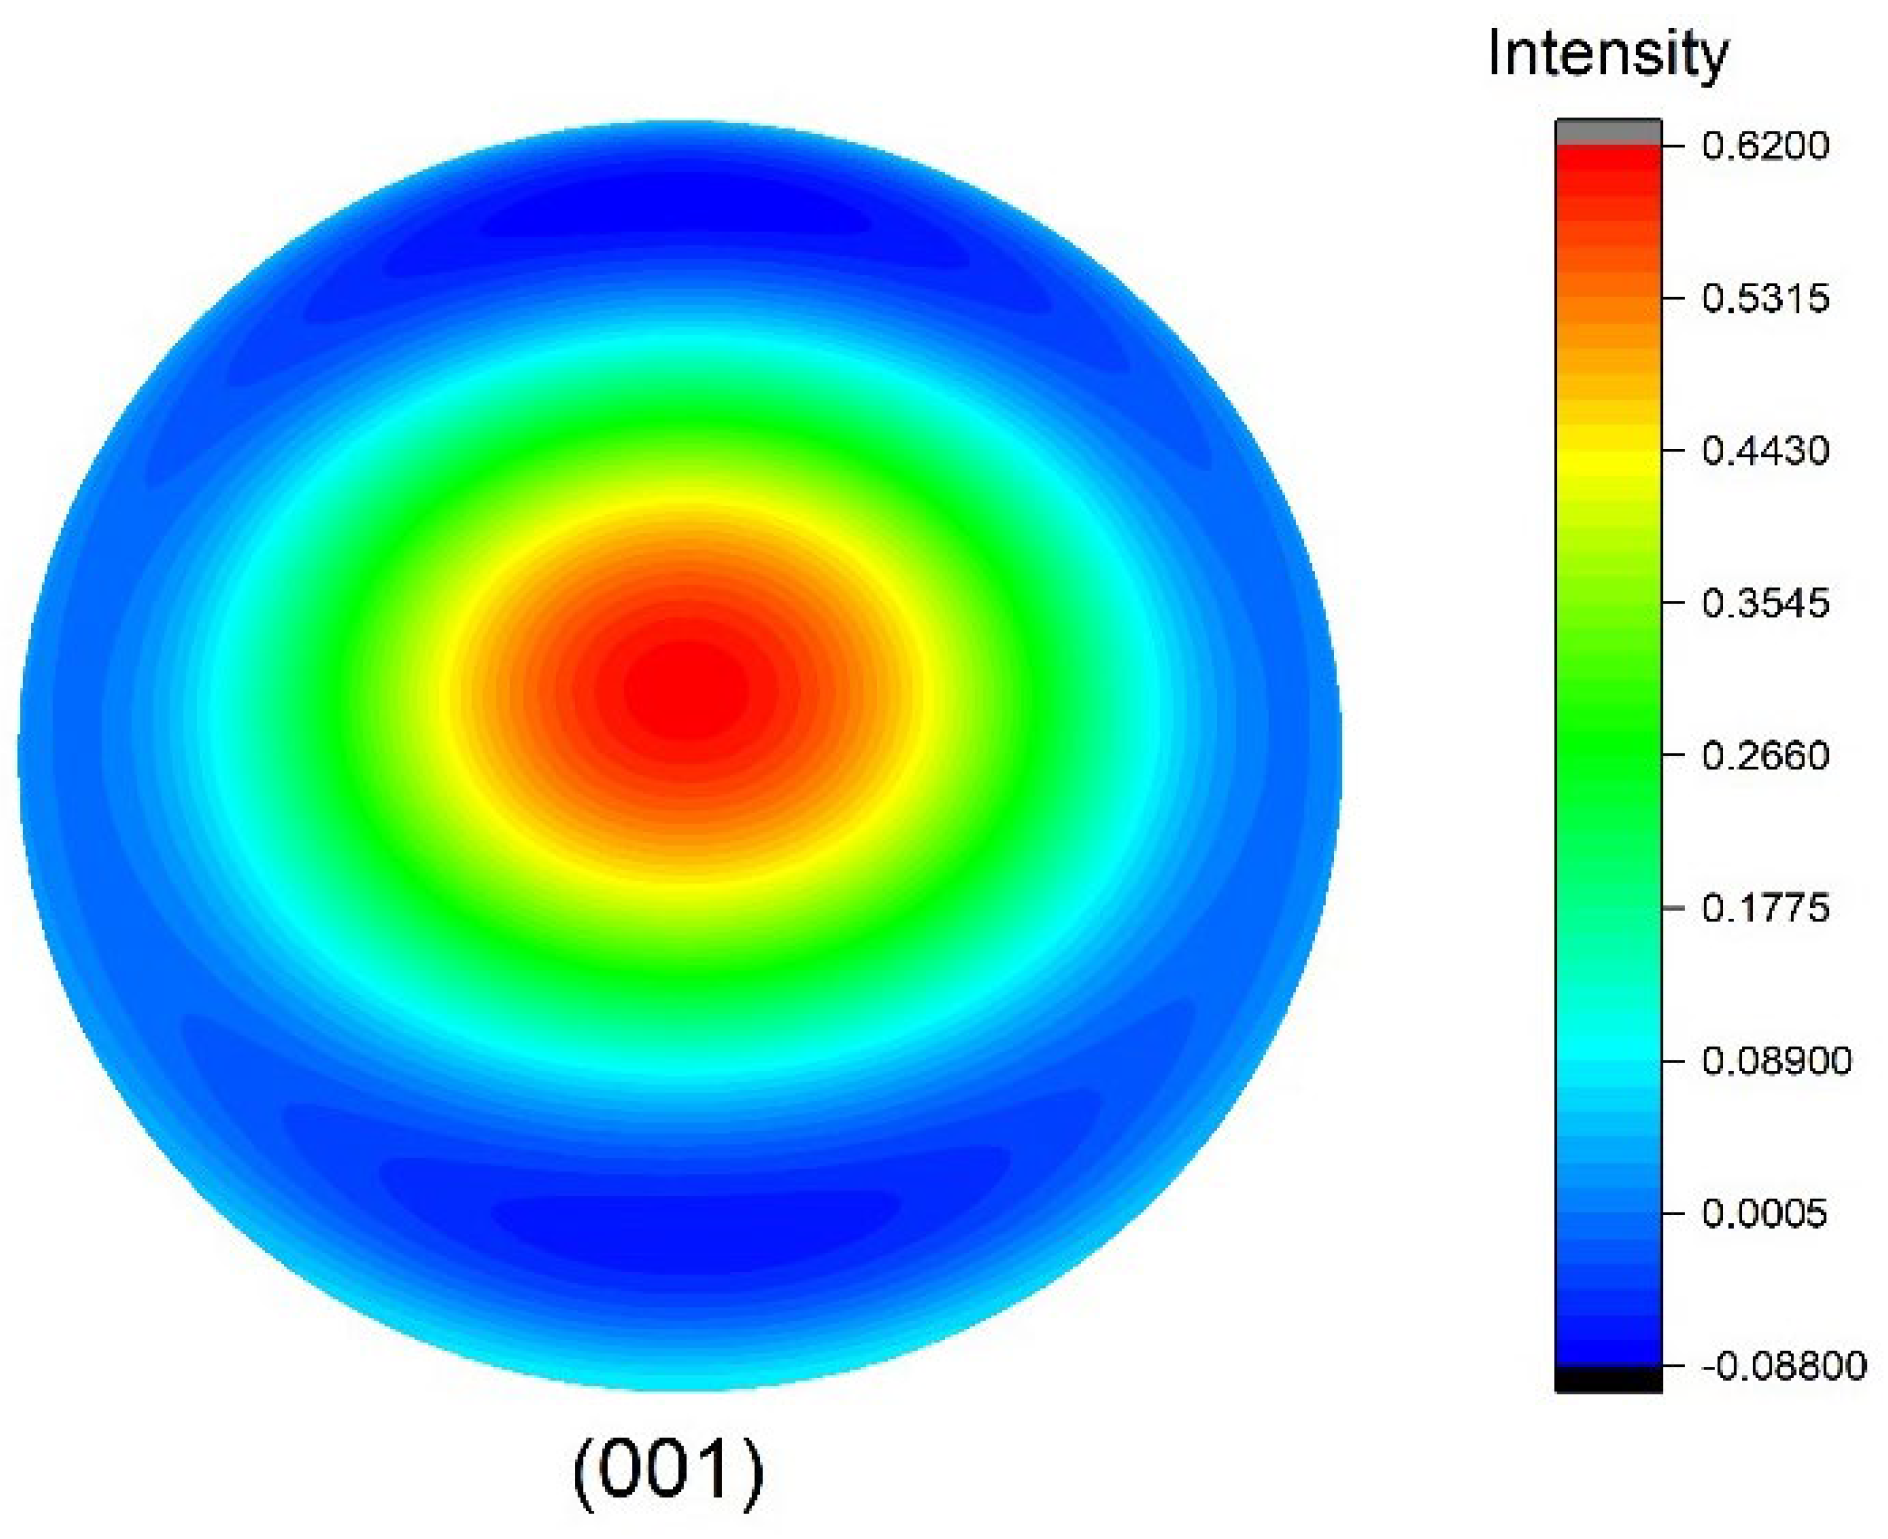
One example of a cubic polycrystalline material with a transverse isotropy texture is given in Ref. [50], and it is a Ni-based alloy. According to Ref. [50], the ODF coefficients , , are 6.30, 0 and 0. The corresponding pole figure for the (001) component is shown in Figure 6, and it can be seen that the patten is close to an axisymmetric distribution, which indicates transverse isotropy. This can be further confirmed by the effective elastic constants (they are not listed here but one can refer to Ref. [50]).
Figure 6.
Calculated pole figure (001) for Ni-based alloy sample with transverse isotropy texture.
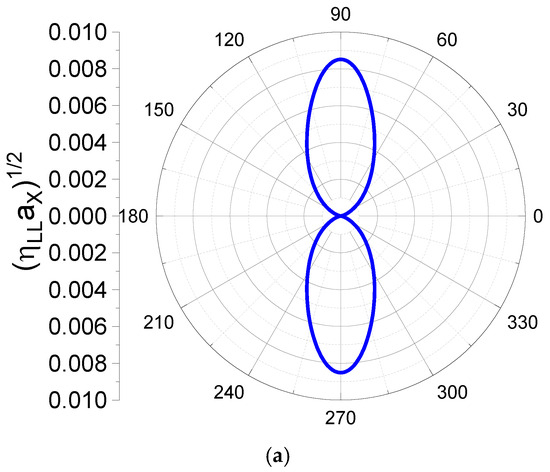
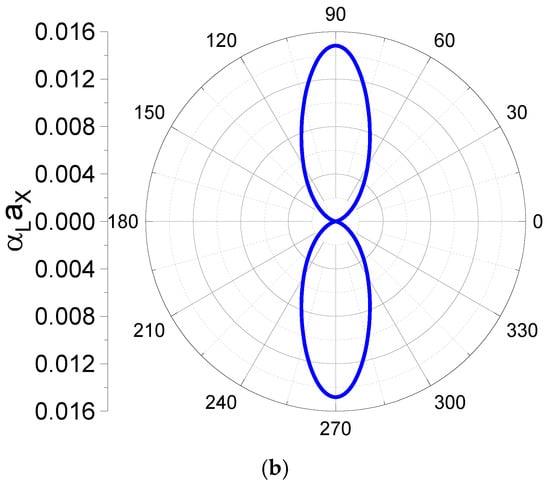
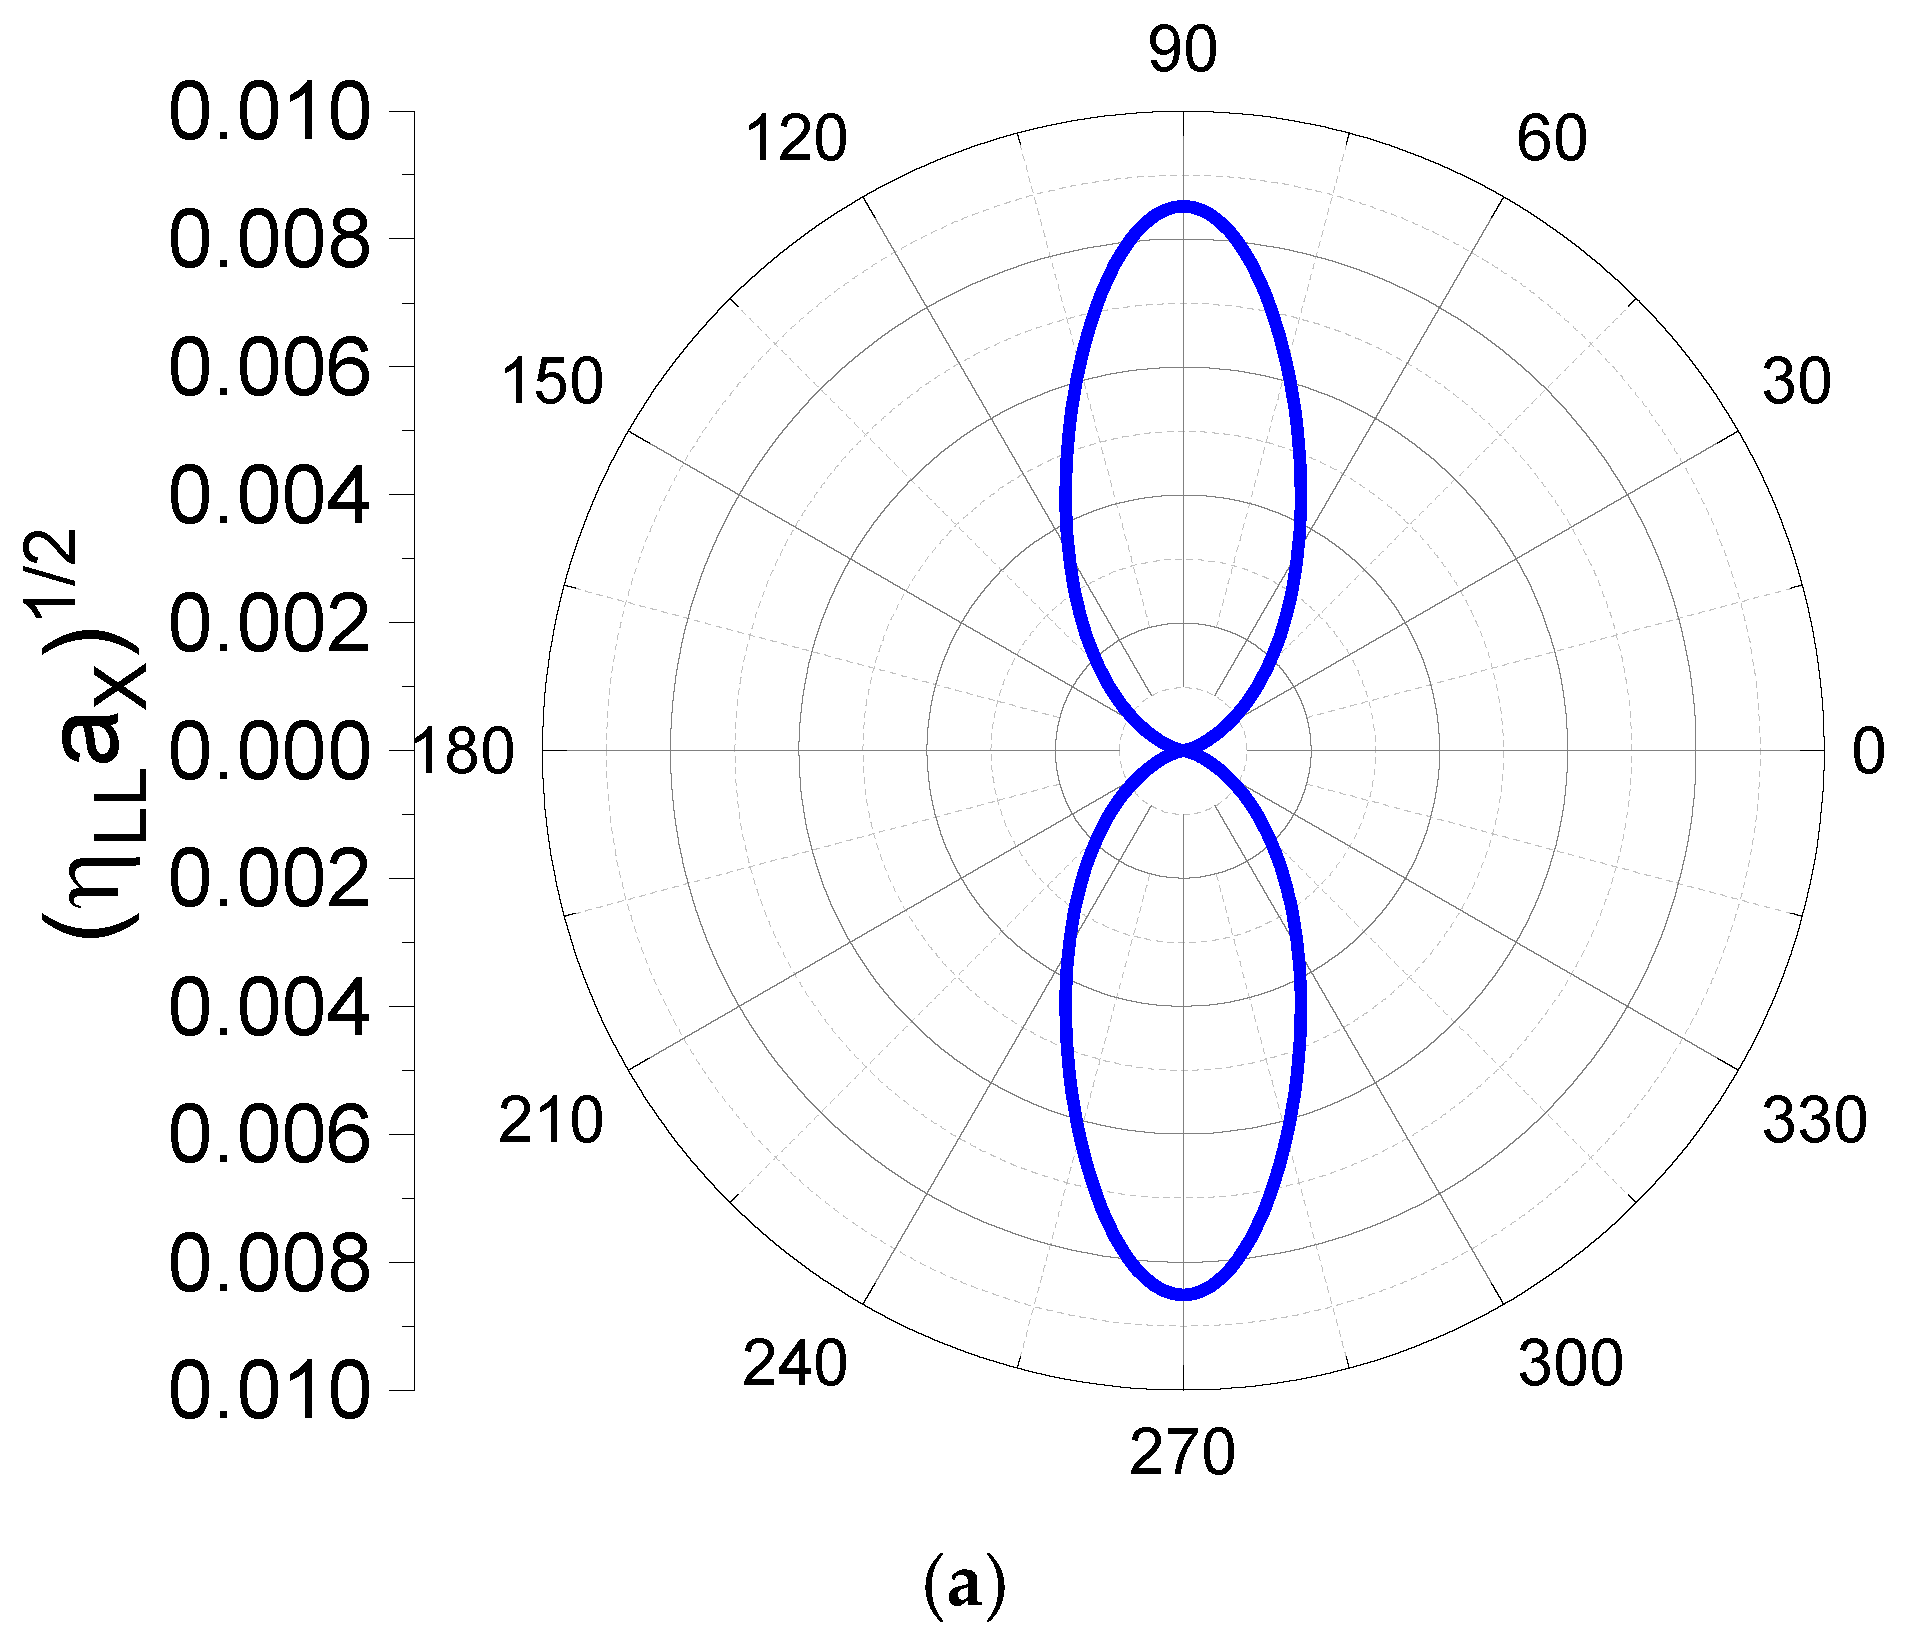
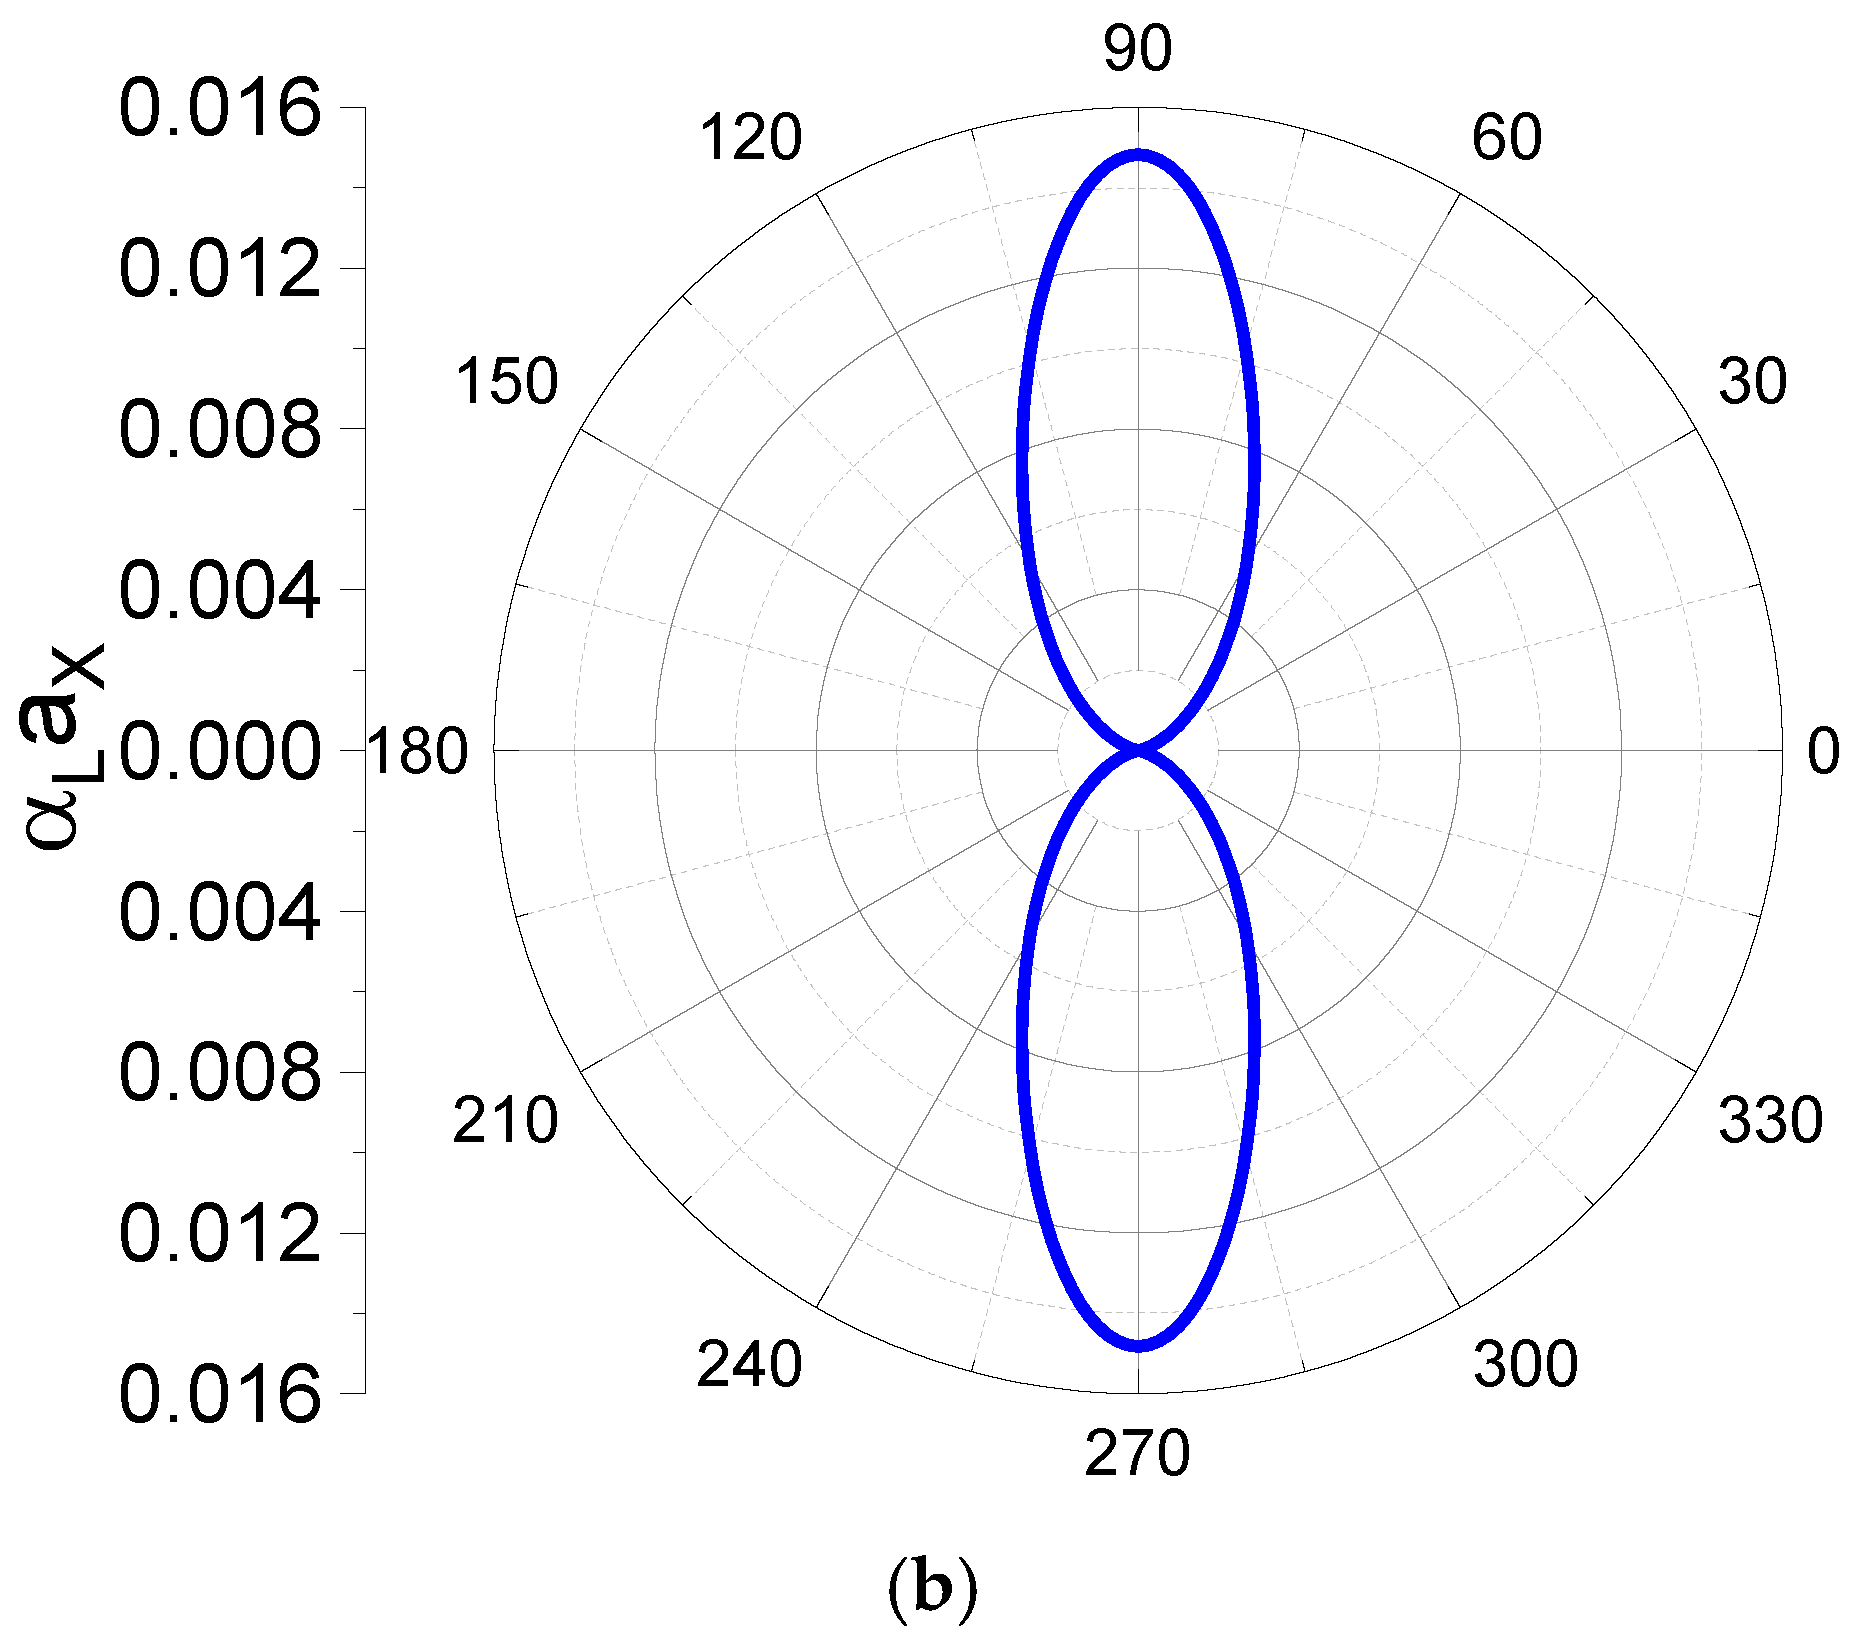
To demonstrate the texture effect, it is assumed that statistically equiaxed grains exist in this textured cubic polycrystalline material and the grain radius is 10 μm. Based on the ODCs, single-crystal elastic constants and grain geometry, the normalized L-L backscattering amplitude at 10 MHz and the normalized longitudinal wave attenuation along the X-Z plane are calculated and depicted in Figure 7. In Figure 7, zero degrees corresponds to the Z direction (refer to the coordinates in Figure 3), and it is the direction where ultrasonic scattering is the weakest, because the grain <001> axes are aligned in this direction, causing the smallest disturbance to ultrasonic wave propagation. Additionally, the patterns for the normalized attenuation coefficient and normalized backscattering amplitude are similar, which is consistent with the texture component in the sample.
Figure 7.
Polar plots of normalized backscattering amplitude and attenuation coefficient for Ni-based alloy material with transverse isotropy texture at 10 MHz in the X-Z plane: (a) backscattering results and (b) attenuation results.
4.3. Aggregate of Cubic Crystallites with Orthotropic Texture
Other textured polycrystals with cubic grains considered in this section are derived from Ref. [51], and they are annealed and cold-rolled phosphorus steels. The elastic constants of the phosphorus steel crystallite from Ref. [51] are given in Table 2. They both have an orthotropic texture and their ODCs are given in Roe’s notation; these were determined in Ref. [51] and are listed in Table 3. Based on the single-crystal elastic constants and ODCs, the calculated effective elastic constants for each case, obtained using Equation (33), are listed in Table 4.
Table 2.
Single-crystal elastic constants of iron (in GPa).
Table 3.
Texture coefficients of a steel sheet from Ref. [50].
Table 4.
Texture-weighted averages of the elastic stiffness constants of phosphorus steel (in GPa).
The calculated effective elastic constants are consistent with Ref. [51]. Based on the effective Cij for both annealed steel and cold-rolled steel, one can observe that the crystallographic texture in the cold-rolled steel is not as strong as in the annealed steel, since the C11, C22 and C33 are closer or less anisotropic in cold-rolled steel. The corresponding pole figures for the (001) texture component are shown in Figure 8, where the annealed steel and cold-rolled steel display different texture information.
Figure 8.
Calculated pole figures showing (001) texture component for two steel samples from Ref. [51]: (a) annealed steel and (b) cold-rolled steel.
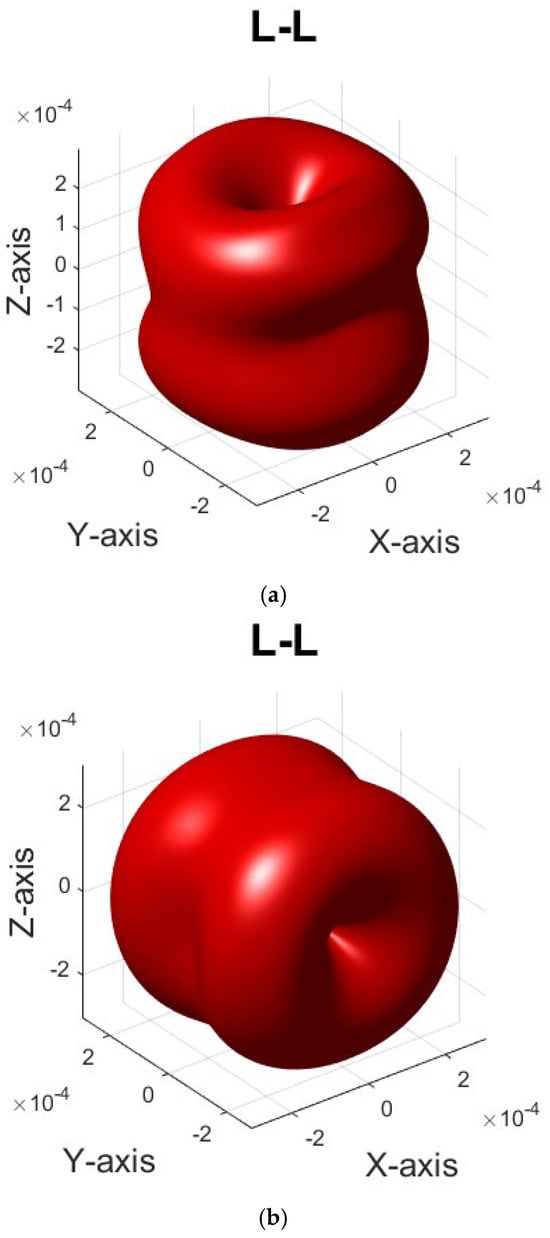
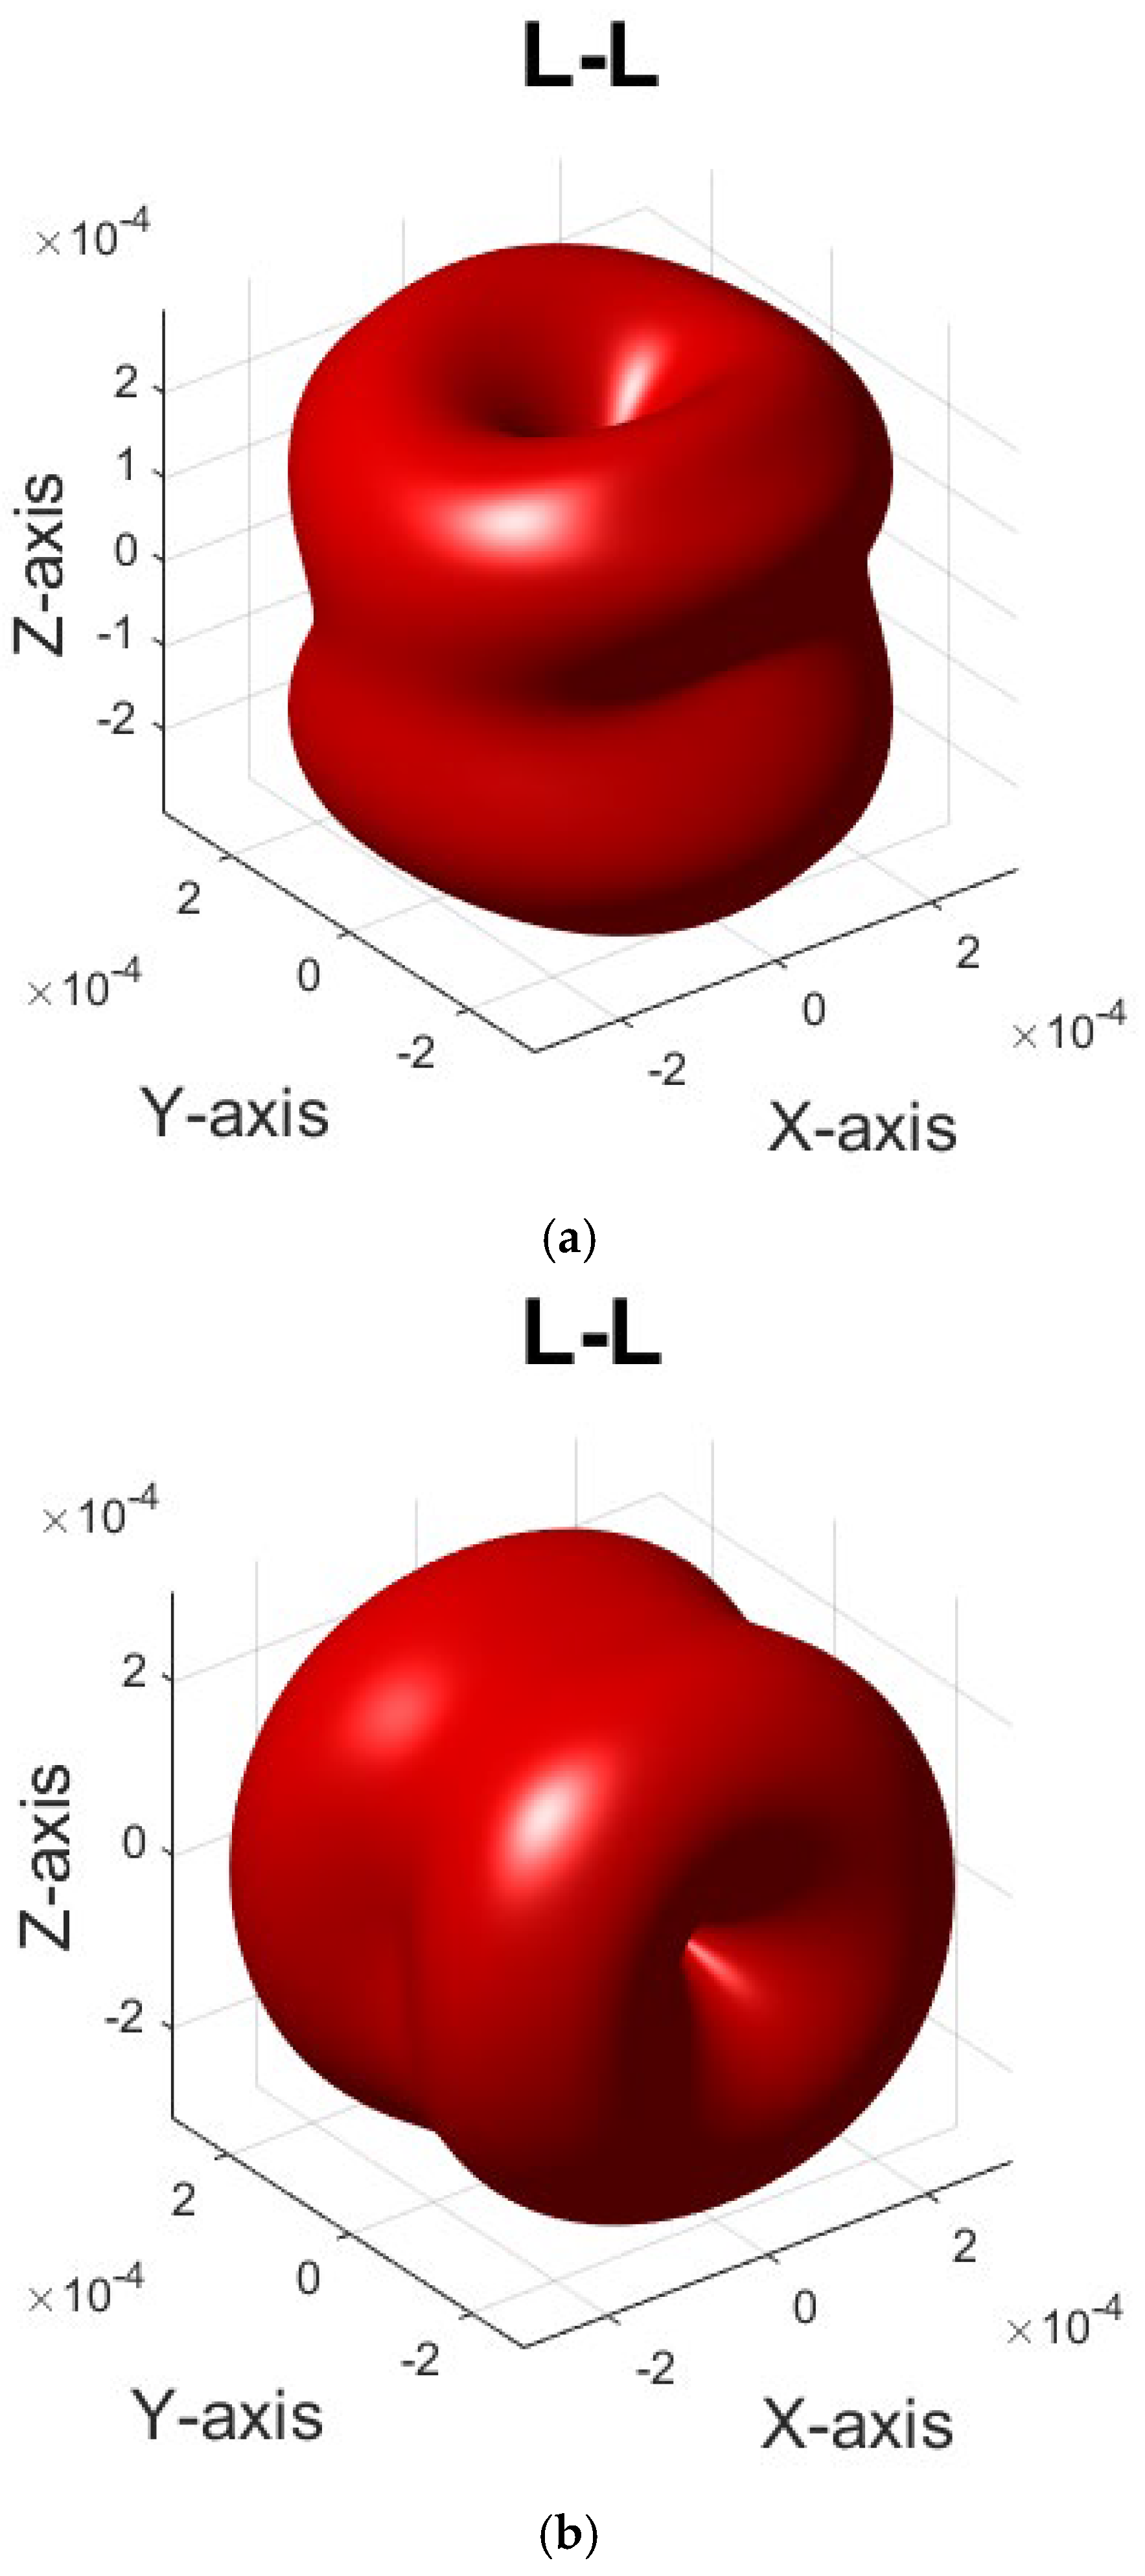
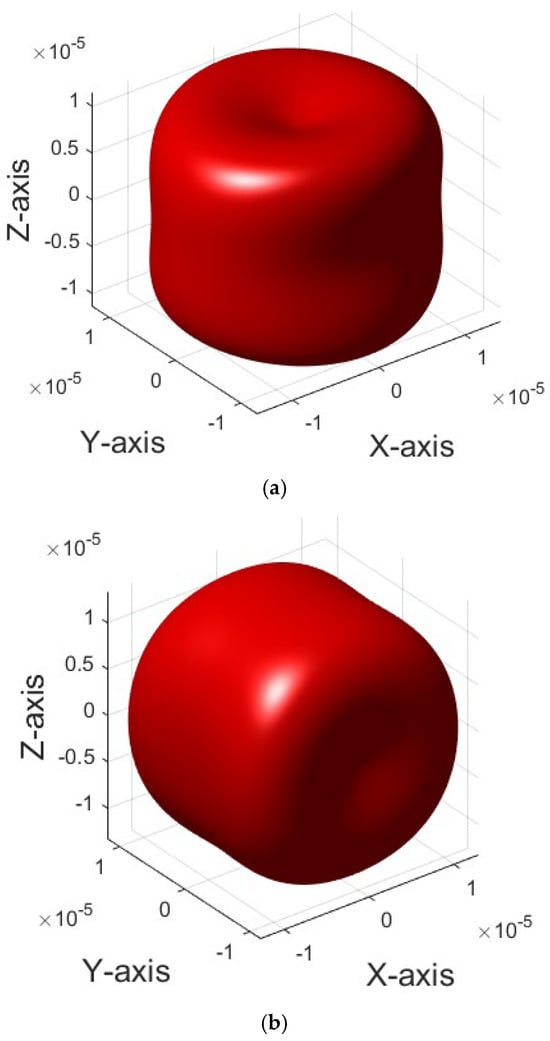
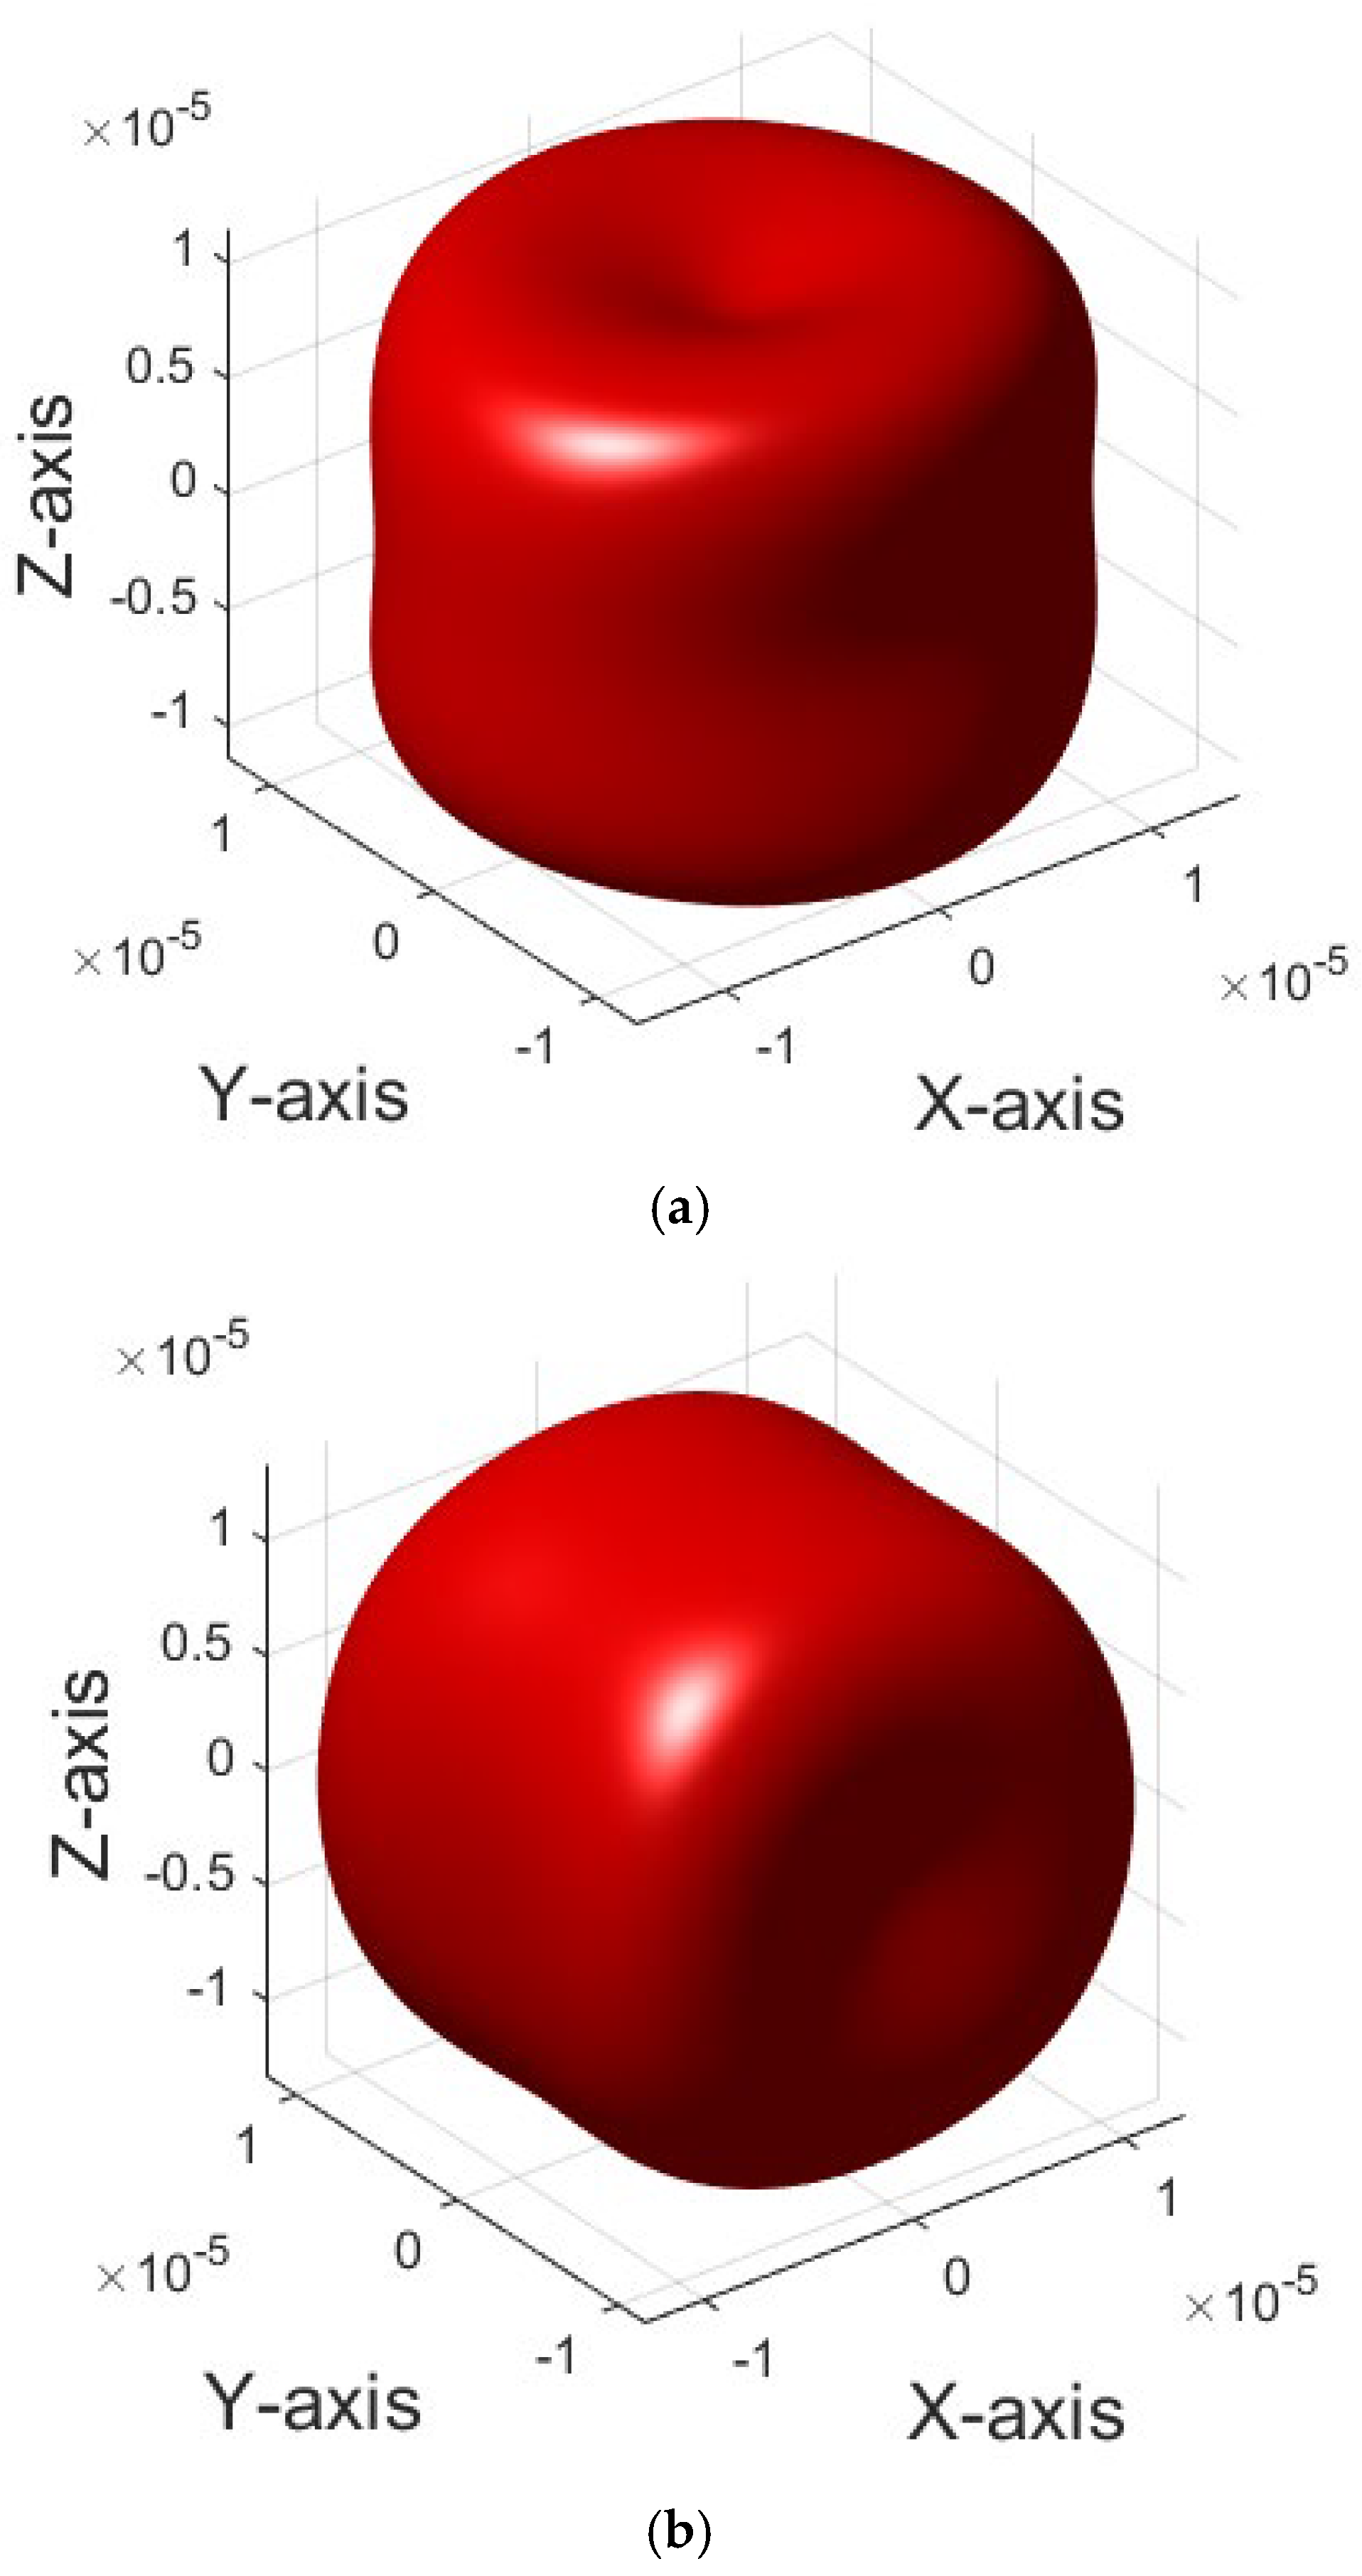
Assuming equiaxed grains and a mean grain radius of 10 μm, the corresponding L-L backscattering amplitudes in 3D space for the annealed and cold-rolled steels are calculated and shown in Figure 9. Due to the different texture components, the L-L backscattering is the weakest along the Z direction in the annealed steel, while the L-L backscattering is the weakest in the Y direction in the cold-rolled steel. Furthermore, the attenuation coefficients for both cases are calculated and shown in Figure 10. The attenuation coefficient pattern in 3D space is somewhat consistent with the backscattering pattern for each case. However, the attenuation coefficient pattern shows a weaker texture effect than the backscattering amplitude because it is the summation of L-L scattering and L-T scattering. For an extreme case, the grain orientations are perfectly aligned in one direction; L-L backscattering will be zero, while L-T scattering will not.
Figure 9.
Normalized backscattering amplitude at 10 MHz for two steel samples: (a) annealed steel and (b) cold-rolled steel.
Figure 10.
A 3D plot of the normalized attenuation coefficients at 10 MHz for two steel samples: (a) annealed steel and (b) cold-rolled steel.
5. Conclusions
General models for ultrasonic backscattering and attenuation using ODCs for textured polycrystalline materials have been derived. For common textured engineering materials, namely hexagonal polycrystalline materials with a fiber texture and cubic polycrystalline materials with orthotropic texture symmetry, explicit expressions of the ultrasonic backscattering coefficient through ODCs have been derived, and they analytically correlate ultrasonic scattering with ODCs for textured polycrystalline materials, being valuable for the ultrasonic determination of high-order ODCs from scattering. Moreover, these models possess high computation efficiency. Computation examples have also been given to demonstrate the texture effect on the ultrasonic backscattering amplitude and ultrasonic attenuation coefficient for textured hexagonal polycrystalline materials and cubic polycrystalline materials. The findings show that the crystallographic texture determines the ultrasonic scattering anisotropy.
In future studies, these models will be validated via comparisons to experiments or using the finite element method. Compared to experiments, finite element modeling can provide more precise results, which makes it more suitable for verification. These models can also be used to solve inverse problems for microstructural characterization. Inverse model development and the experimental implementation of microstructural characterization will be addressed in a future study.
Funding
This research received no external funding.
Data Availability Statement
The original contributions presented in this study are included in the article. Further inquiries can be directed to the corresponding author.
Conflicts of Interest
The author declares no conflicts of interest.
Appendix A. Elastic Constant Covariance Expressed Through ODCs
The explicit expression for the term is
where
The explicit expression for the term is
where
If the hexagonal crystal aggregate has no macrotexture, all would become zero and , which is the same form as reported in Refs. [23,31].
Appendix B. Coefficients in Equation (32)
Appendix C. Full Expansion of ODF
References
- Kuperman, W.A.; Montagner, J.; Tourin, A. Imaging of Complex Media with Acoustic and Seismic Waves; Springer Science & Business Media: Berlin/Heidelberg, Germany, 2002. [Google Scholar]
- Thompson, B.R. Elastic-Wave Propagation in Random Polycrystals: Fundamentals and Application to Nondestructive Evaluation; Springer: Berlin/Heidelberg, Germany, 2002; pp. 233–257. [Google Scholar]
- Han, Y.K.; Thompson, R.B. Ultrasonic backscattering in duplex microstructures: Theory and application to titanium alloys. Metall. Mater. Trans. A 1997, 28, 91–104. [Google Scholar] [CrossRef] [Scilit]
- Lobkis, O.I.; Rokhlin, S.I. Characterization of polycrystals with elongated duplex microstructure by inversion of ultrasonic backscattering data. Appl. Phys. Lett. 2010, 96, 161905. [Google Scholar] [CrossRef] [Scilit]
- Kube, C.M.; Du, H.; Ghoshal, G.; Turner, J.A. Stress-dependent changes in the diffuse ultrasonic backscatter coefficient in steel: Experimental results. J. Acoust. Soc. Am. 2012, 132, L43–L48. [Google Scholar] [CrossRef] [Scilit]
- Kocks, U.F.; Tomé, C.N.; Wenk, H. Texture and Anisotropy: Preferred Orientations in Polycrystals and Their Effect on Materials Properties; Cambridge University Press: Cambridge, UK, 2000. [Google Scholar]
- Bunge, H. Texture Analysis in Materials Science: Mathematical Methods; Elsevier: Amsterdam, The Netherlands, 2013. [Google Scholar]
- Roe, R.J. Description of crystallite orientation in polycrystalline materials. III. General solution to pole figure inversion. J. Appl. Phys. 1965, 36, 2024–2031. [Google Scholar] [CrossRef] [Scilit]
- Lan, B.; Lowe, M.J.; Dunne, F.P. A generalized spherical harmonic deconvolution to obtain texture of cubic materials from ultrasonic wave speed. J. Mech. Phys. Solids 2015, 83, 221–242. [Google Scholar] [CrossRef] [Scilit]
- Sayers, C.M. Ultrasonic velocities in anisotropic polycrystalline aggregates. J. Phys. D Appl. Phys. 1982, 15, 2157. [Google Scholar] [CrossRef] [Scilit]
- Li, J.; Rokhlin, S.I. Elastic wave scattering in random anisotropic solids. Int. J. Solids Struct. 2016, 78, 110–124. [Google Scholar] [CrossRef] [Scilit]
- Yalda-Mooshabad, I.; Thompson, R.B. Influence of texture and grain morphology on the two-point correlation of elastic constants: Theory and implications on ultrasonic attenuation and backscattering. Rev. Prog. Quant. Nondestruct. Eval. 1995, 14, 1939–1946. [Google Scholar]
- Weaver, R.L. Diffusivity of ultrasound in polycrystals. J. Mech. Phys. Solids 1990, 38, 55–86. [Google Scholar] [CrossRef] [Scilit]
- Walpole, L.J. Orthotropically textured elastic aggregates of cubic crystals. J. Mech. Phys. Solids 1987, 35, 497–517. [Google Scholar] [CrossRef] [Scilit]
- Matthies, S. Some remarks on theoretical developments in quantitative texture analysis and on the optimal calculation of harmonic quantities with high precision. Textures Microstruct. 1988, 8, 115–129. [Google Scholar] [CrossRef] [Scilit]
- Li, J.Y. The effective electroelastic moduli of textured piezoelectric polycrystalline aggregates. J. Mech. Phys. Solids 2000, 48, 529–552. [Google Scholar] [CrossRef] [Scilit]
- Matthies, S. On the reproducibility of the orientation distribution function of texture samples from pole figures (ghost phenomena). Phys. Status Solidi 1979, 92, K135–K138. [Google Scholar] [CrossRef] [Scilit]
- Huang, M.; Man, C. Explicit bounds of effective stiffness tensors for textured aggregates of cubic crystallites. Math. Mech. Solids 2008, 13, 408–430. [Google Scholar] [CrossRef] [Scilit]
- Cho, J.; Rollett, A.D.; Oh, K.H. Determination of volume fractions of texture components with standard distributions in Euler space. Metall. Mater. Trans. A 2004, 35, 1075–1086. [Google Scholar] [CrossRef] [Scilit]
- Mason, J.K.; Schuh, C.A. Hyperspherical harmonics for the representation of crystallographic texture. Acta Mater. 2008, 56, 6141–6155. [Google Scholar] [CrossRef] [Scilit]
- Yang, L.; Turner, J.A.; Li, Z. Ultrasonic characterization of microstructure evolution during processing. J. Acoust. Soc. Am. 2007, 121, 50–59. [Google Scholar] [CrossRef] [Scilit]
- Yang, L.; Rokhlin, S.I. Ultrasonic backscattering in cubic polycrystals with ellipsoidal grains and texture. J. Nondestruct. Eval. 2013, 32, 142–155. [Google Scholar] [CrossRef] [Scilit]
- Li, J.; Yang, L.; Rokhlin, S.I. Effect of texture and grain shape on ultrasonic backscattering in polycrystals. Ultrasonics 2014, 54, 1789–1803. [Google Scholar] [CrossRef] [Scilit] [PubMed]
- Li, J.; Rokhlin, S.I. Propagation and scattering of ultrasonic waves in polycrystals with arbitrary crystallite and macroscopic texture symmetries. Wave Motion 2015, 58, 145–164. [Google Scholar] [CrossRef] [Scilit]
- Man, C.S. On the Constitutive Equations of Some Weakly-Textured Materials. Arch. Ration. Mech. Anal. 1998, 143, 77–103. [Google Scholar] [CrossRef] [Scilit]
- Man, C.; Huang, M. Identification of material parameters in yield functions and flow rules for weakly textured sheets of cubic metals. Int. J. Non-Linear Mech. 2001, 36, 501–514. [Google Scholar] [CrossRef] [Scilit]
- Esling, C.; Bechler-Ferry, E.; Bunge, H.J. Three-dimensional texture analysis after Bunge and Roe: Correspondence between the respective mathematical techniques. Texture Stress Microstruct. 1982, 5, 95–125. [Google Scholar] [CrossRef] [Scilit]
- Hirsekorn, S. The scattering of ultrasonic waves in polycrystalline materials with texture. J. Acoust. Soc. Am. 1985, 77, 832–843. [Google Scholar] [CrossRef] [Scilit]
- Hirsekorn, S. Directional dependence of ultrasonic propagation in textured polycrystals. J. Acoust. Soc. Am. 1986, 79, 1269–1279. [Google Scholar] [CrossRef] [Scilit]
- Turner, J.A. Elastic wave propagation and scattering in heterogeneous, anisotropic media: Textured polycrystalline materials. J. Acoust. Soc. Am. 1999, 106, 541–552. [Google Scholar] [CrossRef] [Scilit]
- Yang, L.; Lobkis, O.I.; Rokhlin, S.I. An integrated model for ultrasonic wave propagation and scattering in a polycrystalline medium with elongated hexagonal grains. Wave Motion 2012, 49, 544–560. [Google Scholar] [CrossRef] [Scilit]
- Van Pamel, A.; Sha, G.; Rokhlin, S.I.; Lowe, M.J. Finite-element modelling of elastic wave propagation and scattering within heterogeneous media. Proc. R. Soc. A Math. Phys. Eng. Sci. 2017, 473, 20160738. [Google Scholar] [CrossRef] [Scilit]
- Kube, C.M.; Turner, J.A. Acoustic attenuation coefficients for polycrystalline materials containing crystallites of any symmetry class. J. Acoust. Soc. Am. 2015, 137, L476–L482. [Google Scholar] [CrossRef] [Scilit]
- Ghoshal, G.; Turner, J.A.; Weaver, R.L. Wigner distribution of a transducer beam pattern within a multiple scattering formalism for heterogeneous solids. J. Acoust. Soc. Am. 2007, 122, 2009–2021. [Google Scholar] [CrossRef] [Scilit]
- Rokhlin, S.; Chimenti, D.; Nagy, P. Physical Ultrasonics of Composites; Oxford University Press: Oxford, UK, 2011. [Google Scholar]
- Lobkis, O.I.; Yang, L.; Li, J.; Rokhlin, S.I. Ultrasonic backscattering in polycrystals with elongated single phase and duplex microstructures. Ultrasonics 2012, 52, 694–705. [Google Scholar] [CrossRef] [Scilit] [PubMed]
- Arguelles, A.P.; Kube, C.M.; Hu, P.; Turner, J.A. Mode-converted ultrasonic scattering in polycrystals with elongated grains. J. Acoust. Soc. Am. 2016, 140, 1570–1580. [Google Scholar] [CrossRef] [Scilit]
- Van Pamel, A.; Sha, G.; Lowe, M.J.; Rokhlin, S.I. Numerical and analytic modelling of elastodynamic scattering within polycrystalline materials. J. Acoust. Soc. Am. 2018, 143, 2394–2408. [Google Scholar] [CrossRef] [Scilit]
- Margetan, F.J.; Thompson, R.B.; Yalda-Mooshabad, I. Backscattered microstructural noise in ultrasonic toneburst inspections. J. Nondestruct. Eval. 1994, 13, 111–136. [Google Scholar] [CrossRef] [Scilit]
- Papadakis, E.P. Ultrasonic attenuation caused by scattering in polycrystalline metals. J. Acoust. Soc. Am. 1965, 37, 711–717. [Google Scholar] [CrossRef] [Scilit]
- Stanke, F.E.; Kino, G.S. A unified theory for elastic wave propagation in polycrystalline materials. J. Acoust. Soc. Am. 1984, 75, 665–681. [Google Scholar] [CrossRef] [Scilit]
- Li, Y.; Thompson, R.B. Relations between elastic constants C ij and texture parameters for hexagonal materials. J. Appl. Phys. 1990, 67, 2663–2665. [Google Scholar] [CrossRef] [Scilit]
- Kube, C.M.; Turner, J.A. Estimates of nonlinear elastic constants and acoustic nonlinearity parameters for textured polycrystals. J. Elast. 2016, 122, 157–177. [Google Scholar] [CrossRef] [Scilit]
- Kube, C.M.; Turner, J.A. Acoustic nonlinearity parameters for transversely isotropic polycrystalline materials. J. Acoust. Soc. Am. 2015, 137, 3272–3280. [Google Scholar] [CrossRef] [Scilit]
- Hao, Y.J.; Zhang, L.; Chen, X.R.; Li, Y.H.; He, H.L. Phase transition and elastic constants of zirconium from first-principles calculations. J. Phys. Condens. Matter 2008, 20, 235230. [Google Scholar] [CrossRef] [Scilit] [PubMed]
- Sha, G. Explicit backscattering coefficient for ultrasonic wave propagating in hexagonal polycrystals with fiber texture. J. Nondestruct. Eval. 2018, 37, 51. [Google Scholar] [CrossRef] [Scilit]
- Hirao, M.; Aoki, K.; Fukuoka, H. Texture of polycrystalline metals characterized by ultrasonic velocity measurements. J. Acoust. Soc. Am. 1987, 81, 1434–1440. [Google Scholar] [CrossRef] [Scilit]
- Morris, P.R. Averaging fourth-rank tensors with weight functions. J. Appl. Phys. 1969, 40, 447–448. [Google Scholar] [CrossRef] [Scilit]
- Wang, Y.N.; Huang, J.C. Texture analysis in hexagonal materials. Mater. Chem. Phys. 2003, 81, 11–26. [Google Scholar] [CrossRef] [Scilit]
- Lhuillier, P.E.; Chassignole, B.; Oudaa, M.; Kerhervé, S.O.; Rupin, F.; Fouquet, T. Investigation of the ultrasonic attenuation in anisotropic weld materials with finite element modeling and grain-scale material description. Ultrasonics 2017, 78, 40–50. [Google Scholar] [CrossRef] [Scilit] [PubMed]
- Hu, H. Elastic properties of cold-rolled and annealed sheets of phosphorus steel having high normal plastic anisotropy. Texture Cryst. Solids 1970, 4, 111–127. [Google Scholar] [CrossRef] [Scilit]

Disclaimer/Publisher’s Note: The statements, opinions and data contained in all publications are solely those of the individual author(s) and contributor(s) and not of MDPI and/or the editor(s). MDPI and/or the editor(s) disclaim responsibility for any injury to people or property resulting from any ideas, methods, instructions or products referred to in the content. |
© 2026 by the author. Licensee MDPI, Basel, Switzerland. This article is an open access article distributed under the terms and conditions of the Creative Commons Attribution (CC BY) license.