


Abstract
The rapid expansion of new energy vehicles (NEVs) has intensified concerns over power battery safety, making consumer safety preferences an important driver of firms’ innovation and supply chain decisions. From the perspective of structural symmetry and structural asymmetry in supply chains, this study examines how consumer safety preferences shape innovation incentives and supply mode selection in the power battery supply chain. A game-theoretic framework is developed to analyze four representative supply modes characterized by different degrees of decision power and structural asymmetry, including in-house production, sourcing from a dominant supplier, sourcing from a non-dominant supplier, and equity-based cooperation. Stackelberg and Nash game models are employed to derive equilibrium pricing, innovation effort, recycling decisions, and profit allocation outcomes. Numerical simulations further explore the interaction effects between consumer safety preferences and key cost factors. The results show that stronger consumer safety preferences consistently promote battery innovation and enhance overall supply chain profitability, while the distribution of innovation gains depends critically on the underlying supply structure. Supply mode selection exhibits threshold effects as safety preferences increase, and innovation and recycling decisions respond asymmetrically. Moreover, innovation costs significantly moderate the impact of safety preferences on innovation effort, with the strength of this interaction varying across symmetric and asymmetric supply modes. These findings highlight the role of structural asymmetry in shaping innovation incentives and provide insights for firms and policymakers seeking to design effective supply chain governance mechanisms under rising safety concerns.
1. Introduction
Against the backdrop of the global transition toward low-carbon energy systems, NEVs have emerged as a key pillar of sustainable transportation. With the rapid expansion of the NEV market and accelerated technological iteration, power batteries—often regarded as the “heart” of NEVs—have become a focal point of public and regulatory concern. Battery safety issues have gradually evolved from latent technical risks into an important factor influencing consumers’ vehicle purchase decisions [1,2,3]. Accordingly, improving the safety performance of power batteries has become a focal issue for policymakers, industry practitioners, and consumers alike. As a disruptive and innovation-intensive industry, the NEV sector relies heavily on technological innovation to alleviate consumers’ safety concerns and to stimulate market demand [4]. In recent years, the power battery supply chain has exhibited increasingly diversified organizational structures. On the one hand, battery suppliers focus on technological upgrades within the battery itself, enhancing safety performance through material innovation, optimized structural design, and advanced battery management systems [5]. On the other hand, driven by considerations of supply chain security and technological control, NEV manufacturers have gradually become more involved in battery innovation activities, giving rise to heterogeneous power battery supply modes [6]. Representative firms such as Tesla and BYD have pursued vertical integration by developing and manufacturing battery cells in-house, thereby establishing strong technological barriers [7]. In contrast, many emerging automakers rely on external procurement from specialized battery suppliers such as CATL and LG Energy Solution to reduce capital-intensive investment risks. Meanwhile, hybrid arrangements based on equity participation—exemplified by Volkswagen’s strategic investment in Gotion High-Tech—have gained momentum as a means to enhance technological coordination and supply chain resilience [8]. These heterogeneous supply chain structures reflect firms’ differentiated trade-offs among technological control, production cost, and risk exposure. However, as battery safety standards continue to tighten and consumer preferences evolve, the relative advantages of different supply modes are being reshaped. In-house production may enhance product consistency and safety assurance, but it entails substantial R&D expenditure and innovation risk. External procurement benefits from specialized division of labor and lower upfront investment, yet may suffer from quality transparency and traceability challenges. Equity-based cooperation can strengthen quality coordination while still facing difficulties related to knowledge transfer and benefit allocation [9]. Against this background, understanding how consumers’ preferences for battery safety feed back into firms’ innovation incentives and supply mode choices has become an increasingly important issue for both academia and industry.
In the literature on consumer preferences, existing studies have extensively documented the importance of perceived risk in shaping consumers’ purchase decisions for NEVs [10,11]. Most of this literature is grounded in consumer behavior theory or technology acceptance models, focusing on psychological determinants of purchase intention [12], behavioral willingness [13], or the role of policy-related factors [14]. From these perspectives, consumers’ adoption decisions are commonly explained through constructs such as perceived usefulness, perceived ease of use, and innovativeness [15]. However, these studies are predominantly demand-oriented and remain largely detached from supply chain decision-making. In particular, they seldom examine how consumer preferences translate into firms’ innovation incentives or supply strategy choices along the supply chain. Although battery safety risks have been recognized as a major source of consumers’ risk perception [16], existing studies typically treat battery safety as a sub-dimension within broader risk perception measures [12]. Relatively little attention has been paid to explicitly quantifying consumers’ preference intensity for battery safety and incorporating it as a structural parameter in demand functions for supply chain equilibrium analysis.
Research on innovation in power battery supply chains has primarily focused on the determinants of technological innovation, firms’ R&D strategies, and the role of policy incentives. Prior studies indicate that factors such as government subsidies [17], technological collaboration [18], and market competition [19] significantly influence firms’ innovation investment decisions, thereby affecting product quality and cost structures. One stream of the literature examines green or energy-saving innovation by NEV manufacturers, employing duopoly models or Stackelberg game frameworks to analyze equilibrium innovation outcomes. These studies highlight innovation costs [20], contractual arrangements [21], and policy environments [22] as key drivers of firms’ innovation decisions. Another stream of research concentrates on reverse logistics, cascade utilization, or recycling process innovation in the power battery supply chain [23,24]. This literature demonstrates that innovation not only affects product quality but also reshapes profit allocation among supply chain members. Nevertheless, most existing studies evaluate innovation outcomes in terms of environmental performance, emission reduction, or production efficiency. Comparatively little attention has been paid to battery safety performance, which represents a distinctive technological attribute characterized by high risk, high cost, and high sensitivity. More importantly, demand is commonly treated as exogenous in these innovation models, leaving unexplored the mechanisms through which consumer-side preferences influence firms’ innovation incentives via demand responsiveness.
The literature on supply chain structure and supply mode selection has investigated a wide range of organizational forms, including vertical integration, outsourcing, equity participation, and joint R&D. A substantial body of research emphasizes that differences in supply modes fundamentally reflect firms’ trade-offs among cost control, technological ownership, quality assurance, and market responsiveness [25]. For instance, vertical integration enhances firms’ control over critical technologies and mitigates knowledge leakage risks, but often entails substantial capital expenditure [26]. Outsourcing enables firms to exploit suppliers’ economies of scale, yet may give rise to quality opacity and coordination inefficiencies. Equity-based cooperation or joint R&D arrangements lie between these two extremes, facilitating resource sharing and innovation coordination through contractual or ownership-based mechanisms [8]. Despite these advances, existing studies have paid limited attention to the unique characteristics of safety-sensitive products such as power batteries. In particular, prevailing supply mode selection models rarely incorporate consumer preference factors into their analytical frameworks, thereby overlooking how shifts in consumer demand—especially those driven by safety concerns—may alter the relative attractiveness of alternative supply modes.
In summary, although existing studies have made important progress in understanding power battery innovation and supply mode selection, several critical gaps remain. First, while prior research has recognized the role of battery safety in shaping consumers’ purchase decisions, consumer safety preference has rarely been incorporated as an explicit and quantifiable demand parameter in analytical models of NEV supply chains. Second, power battery innovation is characterized by high cost, substantial technological uncertainty, and safety-related risk; however, the interaction between firms’ innovation decisions and consumer safety preferences has received limited attention in the innovation literature. Third, most studies on supply mode selection emphasize cost efficiency and coordination mechanisms, while largely overlooking how changes in consumer preferences—particularly safety-oriented preferences—may reshape firms’ optimal organizational choices.
Recent analytical work has begun to incorporate strategic supply chain governance and contracting mechanisms in NEV battery ecosystems. For instance, Lyu et al. [27] develop a Stackelberg game-theoretic model to analyze optimal battery procurement and supply configuration decisions under varying carbon policy regimes. Their study highlights how consumer-oriented service valuation and strategic sourcing choices shape demand, pricing, and profitability across supply chain members. Additionally, Zhao et al. [28] integrate ESG-related cost-sharing contracts into a closed-loop battery supply chain framework. They demonstrate that well-designed cooperative contracts can enhance mutual benefits and supply chain efficiency when consumer sensitivity and recycling pricing vary. These studies extend innovation decision models beyond traditional cost and quality dimensions by embedding contracting and governance mechanisms into analytical frameworks, underscoring the importance of multi-dimensional strategic choices in innovation-intensive and safety/ESG-sensitive supply chains.
More fundamentally, the existing literature on supply chain innovation is divided into two parallel streams: one focusing on demand-side factors such as consumer preferences and market sensitivity, and the other concentrating on supply-side characteristics including structural asymmetry, outsourcing arrangements, and ownership structures. These two perspectives are rarely integrated within a unified analytical framework. This separation is particularly problematic in power battery supply chains, where safety concerns strongly affect market demand and where asymmetric relationships between battery suppliers and NEV manufacturers are prevalent.
To bridge this gap, this study develops a game-theoretic model that explicitly links consumer safety preferences with multiple asymmetric supply chain structures, including in-house production, dominant supplier outsourcing, non-dominant supplier outsourcing, and equity-holding cooperation. By jointly analyzing innovation effort, pricing decisions, and profit allocation under different organizational modes, this study provides a demand–structure integrated perspective on innovation incentives in safety-sensitive supply chains. Specifically, this study seeks to answer the following research questions:
RQ1: How do consumer safety preferences influence power battery innovation efforts and overall supply chain profitability in the NEV market?
RQ2: As consumer safety awareness intensifies, how should manufacturers optimally choose among alternative supply modes, including in-house production, outsourcing, and equity-based cooperation?
RQ3: How do key parameters—such as the consumer safety preference coefficient, innovation cost coefficient, and recycling cost coefficient—interact with supply chain structure to shape firms’ strategic decisions and profit distribution?
Compared with existing analytical studies on NEV supply chains based on Stackelberg, Nash, or equity-holding structures, this paper makes the following specific contributions.
First, this study explicitly introduces consumer safety preference as a structural parameter in the demand function, rather than treating safety concerns as an exogenous background factor or an implicit component of perceived risk. This modeling approach enables a formal analysis of how demand-side safety awareness directly reshapes firms’ optimal pricing, innovation effort, and profit distribution, thereby extending conventional innovation incentive models in the context of safety-sensitive products.
Second, this paper develops a unified analytical framework that incorporates four representative supply chain power structures—in-house production, sourcing from a dominant supplier, sourcing from a non-dominant supplier, and equity-holding cooperation. Unlike most prior studies that focus on a single organizational form, our framework allows a systematic comparison of innovation incentives and equilibrium outcomes across symmetric and asymmetric decision environments. This unified setting reveals how the same increase in consumer safety preference can generate qualitatively different innovation responses and surplus allocation patterns under alternative power configurations.
Together, these contributions provide new theoretical insights into the interaction between demand-side safety preferences and supply-side structural asymmetry in innovation-intensive NEV battery supply chains.
2. Problem Description and Model Assumptions
2.1. Problem Description
For easy tracking, we first list notations, then provide the problem description, and finally present the demand functions and the profit functions in different scenarios. The notations involved in this paper are shown in Table 1, where stands for different supply modes of power battery.
Table 1.
Notation and variable definitions.
The scenario represents the in-house production mode, in which the NEV manufacturer is responsible for the research and development of power batteries through its internal supply division, oversees the manufacturing process internally, and undertakes the recycling and reuse of retired batteries from the market. The scenario denotes the models of purchasing power batteries externally under different power positions. Battery suppliers are classified into different types based on various market conditions and evaluation indicators such as development scale, product competitiveness, and quality control. Respectively, In Scenario , the manufacturer purchases batteries from a more dominant battery supplier. The NEV manufacturer buys batteries from a more powerful battery supplier that has characteristics such as global market competitiveness, core technology barriers, large-scale production capacity, and high customer stickiness. In this case, the battery supplier acts as the leader, undertaking both R&D-driven innovation and battery recycling, while the manufacturer follows with subsequent decisions. In scenario , the manufacturer purchases batteries from a battery supplier that does not have a strong position. These suppliers typically have characteristics such as technology-following, focusing on niche markets or regional layout, and relying on differentiated competitive strategies. The NEV manufacturer and the battery supplier make decisions simultaneously, with the battery supplier conducting research and development, innovation, and recycling. The scenario denotes the equity-holding cooperation mode. The NEV manufacturer establishes a strategic partnership with the battery supplier through equity investment. The battery supplier is responsible for technological innovation through research and development, as well as for the recycling of retired batteries. Meanwhile, the manufacturer shares a certain proportion of the supplier’s R&D costs and the resulting profits.
Based on the preceding descriptions, we investigate a two-stage supply chain consisting of a power battery supplier (S) and an NEV manufacturer (M). Battery suppliers achieve technological innovation in power batteries by making certain efforts, supply power batteries to NEV manufacturers at a wholesale price , and recycle retired batteries on the market at a per-unit price . The supply chain structure under these four supply models is illustrated in Figure 1.
Figure 1.
Differentiated structure of the power battery supply chain for NEVs.
2.2. Model Assumptions
Assumption 1.
The safety performance of power batteries for NEVs is positively correlated with the innovation effort level of the battery supplier [29], and the innovation R&D cost input follows a quadratic cost function [30]. is the innovation R&D cost coefficient, representing the marginal difficulty of technological breakthroughs. This modeling assumption is consistent with both industry evidence and empirical findings in the NEV market. High-profile battery safety accidents and large-scale recalls have been shown to significantly depress vehicle sales and brand valuation, whereas safety improvements are often followed by demand recovery and market expansion. Recent empirical studies further document that perceived battery safety constitutes one of the most influential risk dimensions in consumers’ EV purchase decisions and significantly affects willingness to pay and adoption intentions [31]. Therefore, linking innovation effort to safety performance and, in turn, to market demand captures a realistic economic mechanism through which technological progress translates into consumer value in safety-sensitive industries.
Assumption 2.
Assuming that consumers are influenced by price preference and safety preference , the demand function for NEVs is . The linear demand function adopted in this study follows the standard specification widely used in supply chain integration and equity-holding studies in the NEV context, such as Ma et al. [9]. While the functional form is consistent with the literature, the present study extends it by explicitly incorporating consumer safety preference as a demand-side parameter. The parameter reflects the potential market size and is normalized to unity for analytical convenience. This normalization is without loss of generality, since the firms’ optimal pricing and innovation decisions, as well as the comparative performance of alternative supply modes, are primarily driven by consumers’ marginal responsiveness to price and safety (i.e., the slope parameters and ), rather than by the absolute scale of market demand. Economically, this implies that our analysis focuses on how changes in consumer behavior shape strategic interactions within the supply chain, instead of being mechanically influenced by market size. Moreover, by explicitly incorporating consumer safety preferences into the demand function, this study extends the conventional framework and allows demand-side risk perception to directly affect firms’ innovation incentives and supply mode choices.
Assumption 3.
Each NEV is equipped with 1 unit of power battery; the cost of battery production is , and the cost of vehicle manufacturing and assembly is . When manufacturers choose to produce their own batteries, they have to bear fixed operating costs , including sunk inputs such as production line construction and equipment depreciation. When the manufacturer chooses in-house battery production, it incurs a fixed operating cost [32], which includes sunk investments such as production line construction and equipment depreciation. This fixed cost arises exclusively under the in-house production mode and does not occur under alternative supply arrangements.
Assumption 4.
Retired batteries on the market are recycled by battery suppliers at a per-unit price and remanufactured to obtain value per unit for reuse. In line with existing studies [33] and to streamline the analytical process, we define the net expression . The reuse value of retired batteries is denoted by , while the recycling cost is modeled by the function , where represents the recycling rate. The parameter captures the cost sensitivity of recycling operations and is referred to as the recycling cost coefficient.
Assumption 5.
Given that the cost of technological innovation is typically high, we assume that the relevant parameters satisfy . The condition is imposed to ensure the concavity of firms’ profit functions with respect to the innovation effort, thereby guaranteeing the existence and uniqueness of interior optimal solutions. Mathematically, this condition guarantees that the second-order condition for profit maximization is satisfied so that the innovation decision problem is well-behaved and admits a stable equilibrium. Economically, this assumption implies that the marginal cost of improving battery safety weighted by consumers’ price sensitivity is sufficiently large relative to the marginal demand expansion induced by safety improvements . In other words, although higher battery safety increases market demand, its effect is not strong enough to induce unbounded innovation incentives or corner solutions. This reflects a realistic market setting in which safety-oriented technological progress is costly and subject to diminishing returns, preventing firms from excessively increasing innovation effort in response to consumer safety preferences alone. Therefore, this assumption not only ensures analytical tractability but also captures an economically plausible balance between demand expansion and innovation cost in the NEV battery industry.
Assumption 6.
To ensure economic plausibility and maintain internal consistency of the model, we impose the condition:
The parameter restrictions specified in this assumption are imposed to guarantee the existence of economically meaningful interior equilibrium solutions and the stability of firms’ optimal decisions under different supply modes. These conditions ensure that equilibrium prices, innovation effort, market demand, and profits remain strictly positive and finite, thereby excluding degenerate cases such as zero production, negative prices, or unbounded innovation incentives. From an economic perspective, these constraints reflect a realistic market environment in which battery suppliers and NEV manufacturers operate under moderate cost levels, limited market size, and bounded consumer responsiveness to price and safety attributes. In particular, they imply that neither consumer safety preference nor market competition is excessively strong relative to innovation and production costs, so that firms have incentives to invest in safety improvement while still facing effective cost discipline. Consequently, these parameter conditions not only facilitate analytical tractability but also capture the fundamental economic requirement that the NEV power battery market operates in a stable and sustainable regime, where firms’ strategic interactions lead to well-defined and implementable outcomes across different organizational structures.
Assumption 7.
In the equity-holding cooperation mode, the manufacturer’s shareholding ratio must not exceed 50%, thereby avoiding a shift in control rights and ensuring that the supplier retains independent decision-making power.
This restriction is consistent with the mainstream modeling practice in the equity-holding supply chain literature, where minority shareholding is adopted to represent strategic cooperation without transferring formal control rights. In this setting, the battery supplier remains an independent decision-maker in innovation and recycling, while the manufacturer participates only in profit sharing and partial cost internalization. Such arrangements are widely observed in practice in the form of strategic minority equity investments, technology alliances, or long-term cooperative partnerships, rather than mergers or vertical integration. We acknowledge that real-world arrangements such as joint ventures or controlling acquisitions (i.e., equity holdings exceeding 50%) may lead to fundamentally different governance structures. If control were transferred to the manufacturer, the supplier’s innovation and pricing decisions would no longer be fully independent, and the game structure would shift toward a centralized or hierarchical decision framework. In that case, innovation incentives would be driven more by internal coordination efficiency and organizational integration than by contractual or profit-sharing mechanisms, which lie beyond the scope of the present model.
3. Equilibrium Analyses on Stackelberg Games
In this section, we present the equilibrium decisions of different supply models.
3.1. Scenario : In-House Production Mode
In this scenario, power batteries are produced in-house by the NEV manufacturer. The internal battery division is responsible for innovation and R&D, as well as battery production. The battery supplier achieves technological innovation in power batteries well as the recycling and reuse of retired batteries. The decision process follows a single-stage optimization framework. The NEV manufacturer simultaneously determines the retail price of the NEV , the innovation effort devoted to power battery development , and the recycling rate , with the objective of maximizing its own profit. The manufacturer’s profit function is expressed as:
To verify the concavity of the manufacturer’s profit function with respect to its decision variables like retail price, innovation effort, and recycling rate, we examine the Hessian matrix of Equation (1), which is given by .
Since is negative definite under Assumptions 5 and 6, the profit function is strictly concave, and Equation (1) admits a unique maximum. By setting the first-order partial derivatives of with respect to equal to zero, we obtain a system of first-order conditions. Solving this system yields the optimal retail price , the optimal innovation effort level , and the optimal recycling rate . Substituting these optimal values into Equation (1) and simplifying leads to the following result.
Proposition 1.
In the scenario where the power battery is produced in-house by the NEV manufacturer, the optimal retail price of the NEV, the optimal level of innovation and R&D effort for the power battery, the optimal recycling rate, and the manufacturer’s maximum profit are determined as follows:
Proposition 1 indicates that higher battery production costs directly increase the optimal retail price of NEVs and simultaneously reduce both innovation effort and recycling intensity. This implies that cost control within in-house battery production plays a critical role not only in pricing decisions but also in sustaining long-term technological improvement and circular utilization performance.
3.2. Scenario : External Procurement Mode
In this scenario, NEV manufacturers procure power batteries from external suppliers. The suppliers are responsible for key decisions regarding battery innovation, production, and end-of-life recycling. Based on differences in market power, battery suppliers are further classified into two types: dominant suppliers, who occupy a leading position in the industry and influence decision-making unilaterally, and non-dominant suppliers, who operate under more balanced power structures.
Scenario : This scenario represents the case in which a leading power battery supplier, exemplified by firms such as CATL, holds a dominant upstream position in the current market. Such dominance is supported by a substantially larger installed capacity, strong bargaining power, and the ability to set prices ahead of downstream manufacturers. For analytical convenience, procurement from a battery supplier that has consistently maintained a market share exceeding 30% and occupies a dominant position in the supply chain is defined as sourcing from a dominant supplier.
In this study, a “dominant supplier” is operationally defined as an upstream battery supplier whose market share exceeds 30% in the relevant battery market. This threshold is introduced to provide an empirically grounded classification of supplier dominance and is consistent with the structural use of market-share thresholds in competition and market-power assessments, where a share above 30% is often considered indicative of a firm’s strong market position. Empirical research in industrial organization and competition policy further supports this threshold. For example, Feeny and Rogers [34] document that firm profitability tends to rise once market share exceeds 30%; this range is commonly associated with enhanced market power and stronger bargaining and pricing ability. Meanwhile, China’s Anti-Monopoly framework adopts an even higher presumption threshold for dominance, for example, a single firm exceeding 50% market share. This implies that the 30% cutoff used here is conservative and intended to capture “leading/first-tier” suppliers rather than legal dominance. This definition is also consistent with industry data. For example, CATL—used as an illustrative dominant supplier in our paper—accounted for about 45.48% of China’s EV power battery installed capacity in 2025 and remained the global leader with a market share of about 38.1% in 2025 based on international industry statistics. Therefore, the 30% threshold provides a transparent and data-backed criterion for distinguishing dominant suppliers from non-dominant suppliers in the NEV battery supply chain context.
The interaction between the dominant battery supplier and the NEV manufacturer is modeled as a Stackelberg game. The battery supplier acts as the leader and first determines its optimal wholesale price , innovation and R&D effort level , and recycling rate . Subsequently, the NEV manufacturer, acting as the follower, decides the retail price of the NEV . The corresponding profit functions are specified as follows:
Using backward induction, we first solve the NEV manufacturer’s decision problem. Taking the first-order derivative of Equation (7) with respect to , we obtain:
Furthermore, the second-order derivative satisfies:
which implies that is strictly concave in and admits a unique maximizer. Setting the first-order condition equal to zero yields the manufacturer’s optimal price response function:
Substituting Equation (8) into Equation (6), the battery supplier’s optimization problem can be formulated with respect to . The Hessian matrix of is:
Since is negative definite, a unique maximum exists. By substituting Equation (7) into Equation (6) and applying the first-order conditions for profit maximization (i.e., setting the partial derivatives to zero), the optimal wholesale price of the power battery , the optimal innovation effort level , and the optimal recycling rate can be derived. Substituting these results back into Equation (7) and simplifying yields Proposition 2.
Proposition 2.
In the case where the NEV manufacturer procures power batteries from a dominant battery supplier, the optimal retail price of the NEV, the optimal wholesale price of the power battery, the optimal level of innovation and R&D effort, and the optimal profits of both the manufacturer and the supplier are determined as follows:
Proposition 2 indicates that when the battery supplier holds a dominant upstream position, its wholesale pricing decision plays a central role in shaping both the manufacturer’s retail price and the overall innovation incentives in the supply chain. In particular, higher production or innovation costs on the supplier side are partially passed on to downstream manufacturers through increased wholesale prices, which in turn raise retail prices and may dampen market demand. This indicates that NEV manufacturers should carefully assess supplier cost structures and bargaining power when forming long-term procurement partnerships, especially in markets where a small number of suppliers dominate battery technology.
Scenario : To enhance supply chain stability and preserve bargaining flexibility, NEV manufacturers often adopt a diversified battery sourcing strategy. In practice, manufacturers deliberately cultivate and introduce battery suppliers outside the first-tier group in order to reduce dependence on a single dominant supplier and to mitigate potential upstream lock-in risks. Representative industry cases suggest that some leading NEV manufacturers, including XPeng and Li Auto, have sourced power batteries from EVE Energy as an alternative to CATL for selected vehicle models. Such diversification allows manufacturers to gain greater strategic flexibility in price negotiations and capacity allocation. Under this scenario, the interaction between the battery supplier and the NEV manufacturer is formulated as a Nash game. The two parties make their decisions simultaneously. Specifically, the battery supplier determines the wholesale price , the innovation and R&D effort level , and the recovery rate , while the NEV manufacturer decides the retail price of the NEV. The corresponding profit functions are specified as follows:
Using backward induction, we first solve the manufacturer’s pricing decision. Given , is strictly concave in , which ensures a unique best response. Substituting the manufacturer’s optimal pricing response into yields the supplier’s reduced-form problem. The Hessian matrix of the supplier’s profit function with respect to is:
Since is negative definite, the function admits a unique maximum. Taking the first-order partial derivatives of Equation (15) with respect to and setting them equal to zero, and substituting , we solve the system of equations to obtain the optimal retail price of the NEV , the optimal wholesale price of the power battery , the optimal innovation and R&D effort level , and the optimal recovery rate , Substituting these results into Equation (15) and simplifying yields Proposition 3.
Proposition 3.
In the scenario where an NEV manufacturer sources power batteries from a non-dominant supplier, the optimal retail price of the NEV, the optimal wholesale price of the power battery, the optimal level of innovation and R&D effort, and the optimal profits for both the manufacturer and the supplier are given as follows:
Proposition 3 indicates that the non-dominant supplier’s wholesale price and the manufacturer’s retail price adjust systematically with cost parameters, suggesting that diversifying toward non-dominant suppliers can improve the manufacturer’s bargaining flexibility and mitigate cost pass-through risks compared with relying on a single dominant supplier.
3.3. Scenario : Equity-Holding Cooperation Mode
To establish a stronger partnership and enhance competitive advantage, the NEV manufacturer and a non-dominant power battery supplier may form a more integrated supply chain [35]. In this arrangement, the development, production, and recycling of power batteries are undertaken by the battery supplier, while the NEV manufacturer holds a proportional equity stake in the supplier. Under this scenario, the battery supplier and the NEV manufacturer make their strategic decisions simultaneously. Specifically, both parties jointly determine the wholesale price of power batteries , the innovation and R&D effort level , and the recycling rate to maximize their respective profit functions, taking the other party’s decisions as given. The retail price of NEVs is subsequently determined based on the resulting equilibrium outcomes. Consequently, the manufacturer shares both the innovation costs and the supplier’s profits according to the following scheme:
Similarly, the Hessian matrix of with respect to is given by: .
Since is negative definite, a unique maximum exists. By setting the first-order partial derivatives of Equation (23) with respect to equal to zero and substituting , we derive the system of equations from which the optimal retail price of NEVs , the optimal wholesale price of power batteries , the optimal level of innovation effort , and the optimal recycling rate can be obtained. Substituting these results into Equation (23) and simplifying yields Proposition 4.
Proposition 4.
The optimal retail price of NEVs, the optimal wholesale price of power batteries, the optimal level of innovation and R&D efforts, and the optimal profit of manufacturers and suppliers are as follows:
Proposition 4 indicates that equity-holding cooperation partially aligns the incentives of manufacturers and battery suppliers by allowing the manufacturer to share both innovation costs and upstream profits. As a result, this organizational structure can moderate the supplier’s pricing behavior and strengthen innovation incentives, which is particularly valuable in markets where safety-sensitive technologies and high R&D costs amplify coordination inefficiencies.
4. Comparison and Analysis of Equilibrium Results
This section examines the effects of three key parameters—the consumer safety preference coefficient, the innovation cost coefficient, and the recycling cost coefficient—on the equilibrium outcomes under the four supply models. By computing the equilibrium decisions and evaluating the resulting profits of supply chain participants in each scenario, we compare the performance of different supply strategies and highlight their respective advantages and limitations.
Lemma 1.
(1)
(2) .
Lemma 1 indicates that a stronger consumer preference for battery safety expands market demand by increasing consumers’ willingness to pay for safer NEVs, thereby improving the profitability of both supply chain members. Since manufacturers directly face end-market demand and capture the full marginal revenue effect of safety improvements through retail pricing, their profits respond more strongly to changes in consumer safety preferences than those of battery suppliers, who benefit only indirectly via wholesale pricing adjustments.
Moreover, higher innovation effort enhances battery safety performance, which further stimulates market demand and feeds back into higher production volumes and revenues. This demand-expansion mechanism explains why technological innovation driven by safety considerations is consistently beneficial for both parties, while providing manufacturers with stronger incentives to invest in innovation.
Lemma 2.
(1)
(2) .
Lemma 2 indicates that stronger consumer concern for battery safety raises market demand for safer NEVs, thereby increasing the economic return to safety-oriented technological improvement. As a consequence, both manufacturers and suppliers are incentivized to intensify innovation activities, leading to higher equilibrium innovation effort across all supply modes. The improvement in safety performance relaxes effective price competition and enhances consumers’ willingness to pay, which allows manufacturers to charge higher retail prices. Upstream suppliers can, in turn, appropriate part of this demand expansion through higher wholesale prices, reflecting the value transmission mechanism embedded in the vertical pricing structure.
The recycling rate also increases when consumer safety awareness becomes stronger, because higher sales volumes and a larger installed base of batteries raise the economic value of end-of-life recovery. Nevertheless, innovation effort responds more strongly than recycling. The reason is that innovation directly determines battery safety performance and therefore directly affects consumers’ purchasing decisions, making it the primary channel through which firms monetize safety-related demand. By contrast, recycling influences profitability mainly through post-use value recovery and does not directly enter consumers’ utility from purchasing new vehicles. As a result, changes in consumer safety preferences generate a stronger and more immediate incentive for technological innovation than for recycling improvement under all supply chain structures.
Lemma 3.
.
Lemma 3 shows that, under all supply chain configurations, higher recycling costs are transmitted to the product market through the pricing system, leading to higher wholesale prices for power batteries and higher retail prices for NEVs. When recycling becomes more expensive, battery suppliers face a direct increase in operational costs associated with end-of-life battery treatment. To preserve profitability, suppliers adjust their wholesale prices upward, thereby passing part of the cost burden to downstream manufacturers. Manufacturers, in turn, incorporate the higher procurement cost into their pricing decisions, resulting in higher vehicle prices for consumers.
At the same time, rising recycling costs weaken firms’ incentives to invest in both technological innovation and recycling activities. Since innovation investment and recycling expenditures compete for limited financial resources, higher recycling costs crowd out funds that would otherwise be allocated to safety-oriented R&D. Moreover, when the marginal cost of recycling increases, the net economic return from recycling activities declines, reducing suppliers’ willingness to improve recovery efforts. Consequently, firms respond to higher recycling costs by scaling back innovation intensity and lowering the recycling rate, while relying more heavily on price adjustments to maintain overall profitability.
Lemma 4.
(1)
; while
(2) .
Lemma 4 indicates that, under certain conditions, an increase in recycling costs leads to a consistent decline in profits for all supply chain participants. This outcome reflects the fact that higher recycling costs raise the overall cost base of the supply chain and weaken the net profitability of battery-related operations, even after price adjustments are taken into account.
Moreover, the reduction in profits is more pronounced for battery suppliers than for NEV manufacturers. This asymmetry arises because battery suppliers are directly responsible for end-of-life battery management and therefore absorb the primary cost shock when recycling becomes more expensive. Although suppliers can partially pass these additional costs downstream by increasing wholesale prices, such cost transmission is incomplete due to demand sensitivity and competitive constraints. As a result, only part of the cost burden is shifted to manufacturers, while the remaining portion is borne by suppliers themselves.
In contrast, NEV manufacturers are affected mainly through higher procurement costs rather than direct recycling expenditures. Their profit reduction is therefore smaller in magnitude, as retail price adjustments allow them to offset part of the upstream cost increase. Consequently, rising recycling costs disproportionately erode the profitability of battery suppliers, while manufacturers experience a relatively milder decline.
5. Numerical Simulation Analysis
Based on the preceding analysis, this section employs numerical simulation analysis methods to elucidate the research findings, conducting comprehensive cross-validation of the proposed model using MATLAB 2022a software. The parameter design in this section draws on relevant studies [8,25]. These two studies provide detailed empirical and analytical settings for production costs, innovation costs, and recycling-related parameters in NEV and power battery supply chains and have been widely cited in the recent literature. In particular, following these studies and common industry observations, the cost of power batteries is assumed to account for approximately one-third of the total production cost of a new energy vehicle, which reflects the current cost structure in the NEV industry. Accordingly, the cost parameters of battery suppliers and NEV manufacturers are set to maintain this proportion. It should be noted that the numerical analysis aims to illustrate the comparative statics implied by the theoretical model rather than to provide exact quantitative predictions. Therefore, the qualitative patterns of pricing decisions, innovation effort, and profit distribution are primarily driven by the structural relationships of the model and remain robust under reasonable variations in parameter values. A summary of the parameter settings is provided in Table 2.
Table 2.
Related parameter design table.
5.1. Impact of Consumer Safety Preferences on Innovation Decisions for Power Batteries
As shown in Figure 2, the level of power battery innovation increases with rising consumer safety preferences across different supply chain power structures. This trend can be attributed to the fact that stronger safety preferences increase the marginal demand response to battery safety improvements, which raises the revenue gain generated by innovation activities. In response, both the NEV manufacturer and battery supplier have stronger incentives to invest in R&D in order to expand demand and improve market returns.
Figure 2.
Changes in battery innovation effort levels with consumer safety preferences.
Furthermore, Figure 2 illustrates the change in innovation effort, while Figure 3 reports the corresponding variation in total supply chain profit, showing that the rate of increase in both variables is highest under the in-house production model. In this scenario, the NEV manufacturer simultaneously determines the retail price and the innovation level and directly internalizes the demand-expansion effect brought by higher battery safety. In contrast, under external procurement modes, part of the innovation-generated value is redistributed through wholesale pricing between upstream and downstream firms, which weakens the effective return from innovation investment for the decision-maker. As a result, when consumer safety preferences increase, the in-house production model exhibits a stronger innovation response and a larger growth in total supply chain profit than the outsourcing-based structures.
Figure 3.
Changes in total supply chain profits with consumer safety preferences.
5.2. Impact of Consumer Safety Preferences on Total Supply Chain Profit
As illustrated in Figure 3, total supply chain profit increases with consumer safety preferences under all four supply modes, while the equity-holding cooperation mode yields the highest profit level over most of the parameter range. This pattern arises from the profit-sharing structure embedded in the equity-holding arrangement, where the NEV manufacturer partially internalizes the supplier’s innovation cost and revenue through equity participation. As a result, innovation decisions directly affect both parties’ payoffs, which strengthens the incentive to choose higher innovation levels and improves the efficiency of profit allocation within the supply chain.
When consumer safety preferences are relatively low, the marginal revenue generated by battery safety improvement remains limited. Under this condition, the centralized benefit-sharing mechanism in the equity-holding model allows innovation costs and returns to be distributed between the manufacturer and the supplier, reducing the financial burden borne by a single firm and leading to higher joint profitability than in the in-house production or outsourcing structures.
However, when consumer safety preferences exceed the threshold value of 0.7524, the profit curve of the in-house production model grows more rapidly. This occurs because the manufacturer directly controls both pricing and innovation decisions and captures the full marginal return from safety-driven demand expansion. In contrast, under the outsourcing and Nash-type sourcing structures, part of the innovation-generated surplus is transferred through wholesale pricing, which weakens the effective return to innovation. Consequently, at high levels of safety preference, full internalization of innovation benefits enables the in-house production model to surpass the non-cooperative sourcing configuration in terms of total supply chain profit.
As illustrated in Figure 4a,b, battery suppliers consistently achieve higher profits than NEV manufacturers only under the Stackelberg game configuration. This outcome stems from the suppliers’ dominant bargaining position as the first mover, which allows them to set the wholesale price and innovation decisions before manufacturers determine retail prices. By internalizing the manufacturers’ best-response behavior, suppliers can strategically adjust wholesale prices to extract a larger share of the channel surplus. In contrast, manufacturers, acting as followers, take wholesale prices as given and optimize only downstream pricing, which limits their ability to offset upstream cost pressures.
Figure 4.
Changes in profits of supply chain members with consumer safety preferences. (a) Changes in profits of NEV manufacturers with consumer safety preferences; (b) Changes in profits of battery suppliers with consumer safety preferences.
In both the Nash game and equity-holding cooperation modes, NEV manufacturers generally achieve higher profitability than battery suppliers. Under the Nash structure, pricing and innovation decisions are made simultaneously, which weakens the supplier’s ability to transfer costs downstream through strategic commitment. Under the equity-holding cooperation mode, part of the supplier’s profit is shared with the manufacturer through equity participation, directly reducing the supplier’s standalone profit while increasing the manufacturer’s total payoff. These structural features explain why manufacturers obtain higher profits than suppliers in these two scenarios.
As consumer safety preferences increase, the profitability of NEV manufacturers rises more significantly than that of battery suppliers. In the model, higher safety preference directly enlarges demand sensitivity to innovation effort, which primarily affects the retail market controlled by manufacturers through pricing decisions. Manufacturers therefore capture a larger marginal benefit from increased innovation-induced demand. At the same time, higher safety requirements raise suppliers’ innovation and production costs through the quadratic R&D and recycling cost terms, which dampen the growth rate of supplier profits. Consequently, the profit gap between manufacturers and suppliers widens as consumer safety preferences strengthen.
5.3. Impact of Innovation R&D Cost Coefficients on Power Battery Innovation Decisions
As illustrated in Figure 5, the level of power battery innovation decreases monotonically with an increase in the R&D cost coefficient. This pattern follows directly from the quadratic innovation cost term in the profit functions, which raises the marginal cost of innovation and weakens firms’ incentives to invest in R&D across all scenarios.
Figure 5.
Changes in battery innovation effort levels with innovation R&D cost coefficients.
The steepest decline is observed under the in-house production model, where NEV manufacturers independently undertake both battery R&D and vehicle system integration. In this case, the manufacturer bears the full innovation cost internally, without cost sharing or strategic risk transfer to upstream suppliers, making its optimal innovation decision more sensitive to changes in the R&D cost coefficient. Consequently, a higher value of leads to a sharper reduction in innovation effort.
Notably, the in-house production model consistently exhibits the highest level of innovation effort across all supply modes. This result arises because the manufacturer fully internalizes the demand-enhancing effect of battery innovation through the retail price channel, whereas in the outsourcing and cooperation modes, part of this benefit is either transferred to the supplier or diluted by strategic interaction. Therefore, despite being more sensitive to R&D cost increases, in-house production sustains a higher innovation level due to stronger marginal returns from innovation within an integrated decision framework.
5.4. Impact of Innovation R&D Cost Coefficients on Profits of the Power Battery Supply Chain
As illustrated in Figure 6, the total profit of the supply chain decreases at varying rates as the innovation cost coefficient increases. Among the four supply models, the in-house production model, where manufacturers independently undertake battery R&D and production, experiences the sharpest decline. This pattern follows directly from the decision structure of this model, in which the manufacturer internalizes the entire innovation cost and determines both the retail price and the innovation effort simultaneously. As R&D costs rise, the marginal return to innovation decreases more rapidly, leading to a stronger contraction in optimal innovation investment and, consequently, total supply chain profit.
Figure 6.
Changes in total supply chain profits with innovation R&D cost coefficients.
Once the R&D cost coefficient surpasses a critical threshold, the equity-holding cooperation mode consistently generates the highest total supply chain profit. This is because, under equity holding, innovation costs and operating profits are partially shared between the supplier and the manufacturer, which weakens the sensitivity of joint profit to increases in R&D expenditure and stabilizes innovation incentives.
In the Stackelberg game scenario, the battery supplier acts as the leader and sets the wholesale price before the manufacturer chooses the retail price. As innovation costs increase, the supplier optimally raises the wholesale price to transfer part of the cost burden downstream, which mitigates its own profit reduction but amplifies the profit decline faced by the manufacturer.
By contrast, in the Nash game scenario, both firms choose prices and innovation efforts simultaneously. The absence of a clear leader restricts unilateral cost transfer, so both parties absorb a larger share of the innovation cost increase, resulting in a more moderate but persistent decline in total supply chain profit.
As illustrated in Figure 7, the profits of NEV manufacturers exhibit a consistent downward trend as the innovation R&D cost coefficient increases. In contrast, battery suppliers experience rising profits under both the Nash game and equity-holding cooperation modes. This divergence arises from the symmetric decision-making structure in the Nash game and the profit-sharing mechanism embedded in the equity-holding arrangement. In both settings, suppliers’ pricing decisions directly internalize part of the innovation cost increase, while manufacturers, as downstream firms facing final consumer demand, absorb a larger share of the cost pressure through reduced margins.
Figure 7.
Changes in profits of supply chain members with innovation R&D cost coefficients. (a) Changes in profits of NEV manufacturers with innovation R&D cost coefficients. (b) Changes in profits of battery suppliers with innovation R&D cost coefficients.
In these two models, suppliers with technological advantages can adjust wholesale prices upward in response to higher R&D costs, whereas manufacturers’ retail pricing is constrained by demand sensitivity. As a result, part of the innovation cost burden is endogenously shifted upstream in the profit function of manufacturers, leading to a relative increase in suppliers’ profits.
In the equity-holding cooperation mode, this effect is further reinforced by the shared-profit structure, under which suppliers recover a portion of innovation expenditures through equity income, stabilizing their profitability when R&D costs rise. Consequently, while higher innovation costs weaken manufacturers’ profitability across all scenarios, suppliers benefit from the strategic position embedded in the Nash and equity-holding game structures, allowing their profits to remain stable or increase.
5.5. Interaction Effects of Consumer Preferences and Cost Factors on Innovation Decision
Although consumer safety preferences, innovation costs, and recycling costs are specified as independent exogenous parameters in the model, their simultaneous variation affects the equilibrium outcomes jointly. This gives rise to interaction responses in innovation decisions, which can be clearly illustrated through numerical simulations.
As illustrated in Figure 8a–d, the innovation effort of battery suppliers increases with consumer safety preferences across all supply chain modes, while exhibiting a clear downward shift as the innovation R&D cost coefficient rises. This pattern indicates that although safety-oriented demand consistently stimulates innovation, higher R&D costs significantly weaken firms’ ability to respond to such demand signals.
Figure 8.
Effects of consumer safety preferences on innovation effort under different innovation cost levels. (a) Effects of consumer safety preferences on innovation effort under different innovation cost levels in Model I; (b) Effects of consumer safety preferences on innovation effort under different innovation cost levels in Model O1; (c) Effects of consumer safety preferences on innovation effort under different innovation cost levels in Model O2; (d) Effects of consumer safety preferences on innovation effort under different innovation cost levels in Model N.
A closer comparison across supply modes reveals clear moderating differences. Under the self-production mode and the sourcing from a dominant supplier mode, innovation effort is more sensitive to rising innovation costs, and the stimulative effect of safety preferences is substantially weakened as R&D costs increase. In contrast, under the equity-holding cooperation mode and the sourcing from a non-dominant supplier mode, the decline in innovation effort with respect to innovation cost is relatively smaller, indicating that these supply structures partially alleviate cost pressure and enable firms to translate safety-driven demand signals into R&D investment more effectively.
5.6. Impact of Holding Ratios and Consumer Preferences on Power Battery Innovation Decisions
As illustrated in Figure 9, when consumer safety preferences are relatively low, variations in the manufacturer’s equity holding ratio exert minimal influence on the level of power battery innovation. However, as safety preferences intensify, higher equity holding ratios are associated with significantly greater innovation efforts. Importantly, across all equity holding levels, increases in consumer safety preferences consistently lead to substantial improvements in innovation. This indicates that market demand—captured by consumer safety preferences—plays a more fundamental role in driving battery innovation than ownership structure. In other words, the impetus for technological advancement primarily originates from demand-side signals rather than equity ties.
Figure 9.
Changes in battery innovation efforts in Model N with holding ratios and consumer safety preferences.
A comparison of the innovation trajectories under low and high equity holding ratios shows that a higher equity holding ratio strengthens the impact of consumer safety preferences on the level of power battery innovation. At low equity levels, NEV manufacturers exert limited influence over battery suppliers, who independently determine R&D strategies based on self-interest and individual market forecasts. In such cases, both parties operate in a relatively decentralized manner. As the equity holding ratio increases, however, a more integrated strategic alliance emerges, facilitating closer coordination and more efficient communication. This enhanced alignment enables both firms to respond more swiftly and cohesively to evolving consumer preferences in battery safety, thereby fostering higher levels of innovation.
5.7. Impact of Holding Ratios and Consumer Preferences on Profits of Supply Chain Members
As illustrated in Figure 10, an increase in the equity holding ratio enhances the profitability of NEV manufacturers while simultaneously diminishing the profits of battery suppliers. This inverse relationship stems from the shifting balance of power within the supply chain: as manufacturers acquire greater equity stakes, their decision-making authority expands, allowing them to implement strategies more closely aligned with their own interests. By contrast, battery suppliers face a reduction in bargaining power and growing constraints in areas such as pricing, innovation investment, and operational autonomy. This dynamic is further supported by the trends observed in Figure 5, which shows that the level of power battery innovation rises consistently with the equity holding ratio. While higher innovation enhances product competitiveness, it also elevates production costs—costs that are primarily borne by battery suppliers under this equity structure. Consequently, the increase in innovation effort, although strategically beneficial for the supply chain as a whole, imposes considerable financial pressure on upstream suppliers.
Figure 10.
Changes in the profits of supply chain members in Model N with holding ratios and consumer safety preferences.
6. Conclusions and Implications
6.1. Conclusions
This study examines the power battery supply chain in the NEV industry by explicitly incorporating consumer safety preferences into firms’ innovation and supply mode decisions. Focusing on four alternative battery supply modes, the analysis systematically compares innovation incentives and profit allocation mechanisms under different market conditions. By constructing a series of decision-making models involving battery suppliers and NEV manufacturers and applying Stackelberg and Nash game frameworks, the study investigates how consumer safety preferences and supply mode choices jointly shape optimal retail prices, wholesale prices, innovation effort levels, and equilibrium profits for supply chain participants. In addition, the interaction between consumer preferences and manufacturers’ equity participation is examined, and the key relationships among variables are further explored through numerical simulations. The main findings of this study can be summarized as follows:
First, consumer safety preference emerges as a central driver of battery innovation and supply chain performance. Regardless of the supply mode, an increase in consumer safety preference significantly enhances innovation effort in power batteries and improves overall supply chain profitability. Moreover, the manufacturer consistently benefits more than the battery supplier, indicating that downstream firms capture a larger share of the value generated by safety-driven innovation.
Second, supply mode selection exhibits a clear threshold effect with respect to consumer safety preference. When consumer safety preference remains relatively low, the cooperation mode yields the highest supply chain profit. Once safety preference exceeds a critical threshold, however, the in-house production mode becomes increasingly advantageous, with profits rising rapidly and surpassing those of alternative modes. In contrast, procurement from a dominant supplier consistently results in the lowest supply chain and manufacturer profits, highlighting that excessive reliance on a powerful upstream supplier weakens manufacturers’ bargaining position and limits their profit potential.
Third, innovation and recycling decisions respond asymmetrically to changes in consumer safety preferences, and innovation cost plays a reshaping role in supply mode performance. Across all recycling structures, innovation effort increases markedly as consumer safety preference intensifies, whereas the growth in recycling rates remains relatively limited. This indicates that consumer concern for safety primarily stimulates R&D investment rather than recycling activities, which are more strongly constrained by recycling costs, technological efficiency, and regulatory conditions. As innovation cost rises, overall innovation effort and total supply chain profit decline, with the magnitude of this decline varying across supply modes. While in-house production achieves the highest innovation effort, it is also the most sensitive to increases in innovation cost. By contrast, the cooperation mode exhibits greater resilience in terms of profit performance. Notably, under the Nash game and cooperation scenarios, battery suppliers’ profits may increase with higher innovation costs, which may be associated with suppliers gaining bargaining advantages through differentiated innovation and thereby shifting part of the cost burden to manufacturers or the market.
Fourth, increasing the manufacturer’s equity participation strengthens its strategic dominance but intensifies profit redistribution tensions within the supply chain. A higher equity share significantly promotes battery innovation and increases manufacturers’ profits, while simultaneously reducing suppliers’ profits. This result reveals a fundamental trade-off under equity-based cooperation: although such arrangements enhance innovation performance, insufficient compensation mechanisms may undermine suppliers’ long-term incentives to cooperate.
Beyond these numerical and managerial findings, this study also makes explicit theoretical contributions to the literature on supply chain innovation incentives. This paper extends conventional innovation incentive models by explicitly incorporating consumer safety preferences as a structural parameter in the demand function, rather than treating safety concerns as an exogenous or implicit factor. This modeling approach allows demand-side risk perception to directly affect firms’ optimal pricing and innovation decisions, thereby establishing a formal analytical link between consumer behavior and upstream R&D incentives in safety-sensitive industries. Furthermore, by embedding consumer safety preferences into supply chains with asymmetric power structures, this study disentangles how demand-side safety concerns interact with upstream–downstream bargaining positions to reshape innovation incentives and profit allocation. The results demonstrate that the same increase in safety preference can generate markedly different innovation responses and surplus distribution under Stackelberg, Nash, and equity-holding structures, highlighting the critical role of power asymmetry in mediating the effectiveness of safety-driven innovation incentives.
6.2. Implications
The findings of this study yield several important managerial and policy implications.
First, firms should align supply chain strategies with the evolution of consumer safety preferences and shift from pure competition toward collaborative innovation. As consumer safety preference intensifies, innovation investment and supply chain profitability increase, with manufacturers capturing a larger share of the gains. This underscores the dominant role of downstream firms in coordinating safety-oriented innovation. To respond effectively to rising safety expectations, manufacturers and suppliers should move beyond transactional relationships and establish collaborative mechanisms such as joint R&D platforms or data-sharing systems, enabling faster and more efficient responses to market demand while avoiding inefficiencies arising from strategic gaming. Specifically, under both the in-house production mode and the equity-holding cooperation mode, stronger safety preferences magnify the marginal returns to innovation, making coordinated R&D investment and information sharing particularly valuable for accelerating safety improvement while containing duplication costs.
Second, manufacturers should adopt a dynamic approach to supply mode selection and engage in forward-looking strategic planning. The results indicate that optimal supply modes vary across stages of consumer preference development. In the early stage, equity-based cooperation allows manufacturers to achieve profit maximization under relatively modest innovation requirements. Once consumer safety preference surpasses the critical threshold identified in the model, manufacturers should actively consider transitioning toward greater internalization of battery R&D and production. Concretely, this may involve increasing internal investment in battery engineering teams, securing long-term access to core materials and equipment, gradually scaling pilot in-house production lines, and reducing reliance on dominant external suppliers for safety-critical battery components. Importantly, this transition is also conditioned by innovation cost levels. When innovation costs are high, cooperative governance structures can partially mitigate cost constraints and preserve innovation incentives, whereas in-house production becomes more viable only when firms are able to effectively control or reduce R&D costs. Accordingly, manufacturers may benefit from initially securing supplier resources through equity participation and gradually expanding in-house R&D and production capabilities as safety requirements intensify, ultimately building a more autonomous and controllable technological system.
Third, firms should be cautious about the long-term risks associated with external procurement from dominant suppliers. The simulation analysis indicates that, under the considered parameter settings, sourcing from powerful upstream suppliers tends to generate lower profits for both manufacturers and the overall supply chain. For manufacturers heavily dependent on leading battery suppliers, this finding suggests that short-term reductions in R&D risk may come at the expense of long-term bargaining power and profit growth. Diversified sourcing strategies and the development of in-house capabilities are therefore essential to mitigating dependence on dominant suppliers.
Fourth, equity participation alone is insufficient to ensure stable upstream–downstream cooperation. Although equity-based cooperation effectively cushions the negative impact of rising innovation costs on supply chain profits, increasing equity shares reduces suppliers’ profit levels and may weaken their willingness to cooperate. This result directly reflects the model mechanism that higher equity shares strengthen manufacturers’ control over innovation decisions but weaken suppliers’ residual profit incentives under asymmetric bargaining structures. Manufacturers should therefore complement equity participation with appropriate compensation mechanisms, such as long-term purchase commitments, advance payments, or more balanced profit-sharing arrangements, to sustain suppliers’ innovation incentives and promote mutually beneficial outcomes.
Finally, public policy should simultaneously leverage market demand and firm-level incentives. While heightened consumer concern for safety strongly encourages innovation investment, its impact on battery recycling remains limited due to high costs, insufficient infrastructure, and technological barriers. The interaction effects identified in this study further suggest that demand-side preference upgrading alone may be insufficient to sustain innovation under high-cost pressures, highlighting the importance of cost-reducing policy instruments. Importantly, policy design should account for the asymmetrical power structures across different supply modes. In supply chains dominated by powerful battery suppliers, subsidies granted only to upstream firms may be partially absorbed through wholesale pricing and fail to stimulate effective downstream innovation. In such cases, targeted subsidies to manufacturers or joint subsidies conditional on cooperative R&D arrangements may better counterbalance upstream bargaining power. By contrast, in more symmetric or vertically integrated structures, uniform safety standards and performance-based innovation subsidies are more likely to promote safety improvement without distorting profit allocation. Accordingly, policymakers should strengthen support for battery recycling through subsidies for recycling network construction, unified technical standards, and incentives for inter-firm collaboration. In parallel, innovation subsidies and tax incentives can help reduce R&D burdens, allowing consumer safety demand to be more effectively translated into technological progress.
It should be noted that several practical constraints are abstracted from the current model and may affect the implementation of the above recommendations. First, capacity limitations and production ramp-up constraints may restrict firms’ ability to rapidly adjust supply modes or scale up in-house battery manufacturing. Second, intellectual property protection and concerns over knowledge leakage can limit the depth of technological collaboration and the feasibility of equity-based partnerships. Third, regulatory approval procedures, safety certification requirements, and environmental compliance standards may delay structural adjustments in battery supply chains. Finally, switching costs arising from long-term contracts, specialized equipment, and organizational routines may create path dependence, making supply mode transitions gradual rather than instantaneous. These factors suggest that the model’s implications should be interpreted as medium- to long-term strategic guidelines rather than short-term operational rules and that real-world implementation requires coordination with regulatory, contractual, and organizational considerations.
This study investigates the NEV power battery supply chain from the perspectives of consumer safety preferences and supply model selection, with a primary focus on battery safety performance and upstream R&D. The recycling stage, however, is treated in a relatively simplified manner. Future research could incorporate factors such as multi-level utilization of retired batteries, the value of cascade use, and the spatial configuration of recycling networks into a closed-loop supply chain framework, thereby enabling a deeper examination of the dynamic interactions between innovation and recycling.
Author Contributions
Conceptualization, C.J.; methodology, C.J. and J.Y.; software, J.Y.; validation, C.J. and J.Y.; formal analysis, C.J.; investigation, J.Y.; data curation, J.Y.; writing—original draft preparation, C.J. and J.Y.; writing—review and editing, C.J. and W.Q.; supervision, C.J.; project administration, C.J. and W.Q.; funding acquisition, C.J. All authors have read and agreed to the published version of the manuscript.
Funding
This research was funded by the General Program of the National Social Science Foundation of China (No. 24BGL218), Humanities and Social Science Fund of Ministry of Education of China (No. 22YJAZH033), Major Project of Philosophy and Social Science Research in Colleges and Universities of Jiangsu Province (No. 2021SJZDA134) and the Fundamental Research Funds for the Central Universities (No. JUSRP123137).
Data Availability Statement
Data will be made available upon request.
Conflicts of Interest
The authors declare no conflicts of interest.
References
- Tang, Z.Y.; Dong, X.Y.; Tian, Y.X.; Hao, J.L.; Zhou, Y. From incident to impact: Examining consumer resistance to electric vehicles using event systems theory and risk amplification. J. Retail. Consum. Serv. 2026, 90, 104654. [Google Scholar] [CrossRef] [Scilit]
- Naan, J.; Hun, K.S. Electric vehicle resistance from Korean and American millennials: Environmental concerns and perception. Transp. Res. Part D Transp. Environ. 2022, 109, 103387. [Google Scholar] [CrossRef] [Scilit]
- She, Z.Y.; Sun, Q.; Ma, J.J.; Xie, B.C. What are the barriers to widespread adoption of battery electric vehicles? A survey of public perception in Tianjin, China. Transp. Policy 2017, 56, 29–40. [Google Scholar] [CrossRef] [Scilit]
- Li, X.M.; Liu, Y.R.; Yang, J.J. Technological innovation and sales of new energy vehicles—An empirical test based on the theory of “innovation-driven demand”. J. Dalian Univ. Technol. (Soc. Sci.) 2022, 43, 31–41. [Google Scholar] [CrossRef]
- Luo, Z.F.; QIN, Y. Research on the innovation and optimization of smart manufacturing processes for new energy vehicle batteries. Energy Storage Sci. Technol. 2024, 13, 1751–1753. [Google Scholar] [CrossRef]
- Jin, Y.H. Research on the improvement of China’s new energy vehicle industry chain in the new development opportunity period. Econ. Rev. J. 2022, 1, 83–90. [Google Scholar] [CrossRef]
- Wang, G.; Guo, S.M.; Shi, X.L. Research on the evolution of technology transfer network of strategic emerging industries from the perspective of industrial chain innovation—A case study of lithium-ion power battery industry. Forum Sci. Technol. China 2024, 11, 81–90. [Google Scholar] [CrossRef]
- Liu, C.; Liu, J.; Wang, T.Y.; Song, Y.T.; Zheng, B.R. Different shareholding strategies on the operation decision of new energy vehicle supply chain. Chin. J. Manag. Sci. 2024, 32, 92–102. [Google Scholar] [CrossRef]
- Ma, L.; Liu, Y.J.; Yuan, Q. A research on the integrated strategy of new energy automobile manufacturing enterprise based on the shareholding strategy. Ind. Eng. J. 2022, 25, 10–20. [Google Scholar] [CrossRef]
- Fu, T.; Yu, S.Y.; Tan, S.Y. Peer effect matters for the adoption of new energy vehicles: Evidence from consumer sentiment analysis using Chat-GPT. Energy Econ. 2025, 148, 108692. [Google Scholar] [CrossRef] [Scilit]
- Hu, X.F.; Zhou, R.T.; Wang, S.Y.; Gao, L.; Zhu, Z.J. Consumers’ value perception and intention to purchase electric vehicles: A benefit-risk analysis. Res. Transp. Bus. Manag. 2023, 49, 101004. [Google Scholar] [CrossRef] [Scilit]
- Wang, Y.; Li, Y. An empirical research on the consumer’s purchase intention of new energy vehicles based on perceived risk and involvement. J. Appl. Stat. Manag. 2013, 32, 863–872. [Google Scholar] [CrossRef]
- Chen, K.; Gu, R.; Hu, J. Research on consumer purchase intention of new energy vehicles under the benefit-risk assessment framework. J. Nanjing Tech Univ. (Soc. Sci. Ed.) 2019, 18, 61–70+112. [Google Scholar] [CrossRef]
- Li, C.; Ye, L.L.; Wang, L.P. The influence of new energy vehicle consumption promotion policy on the purchase intention of potential consumers. Chin. J. Manag. Sci. 2021, 29, 151–164. [Google Scholar] [CrossRef]
- Xie, R.Y.; An, L.R. The influence mechanism of innovation characteristics on new energy vehicle consumer’s adoption intention: The moderating role of individual innovation. Mod. Econ. Sci. 2020, 42, 113–121. Available online: https://kns.cnki.net/kcms2/article/abstract?v=jmR62x_2o8Gikk00sNFTSzFhfN4tBzwmyPJ3hOTkXLPIzIhBLQsh2EveEvHIwrl2wixK-BcCgIRVYUbhTMkf4IGWmv_ZIXs6SJkZL4Ijety0JQQqhUBMfJjIc97RqWak8TiDhRdVwBBgN-MLiwG-_CLYUAUH6RmyL6BO197fLyo=&uniplatform=NZKPT (accessed on 28 January 2026).
- Bryla, P.; Chatterjee, S.; Ciabiada-Bryla, B. Consumer adoption of electric vehicles: A systematic literature review. Energies 2023, 16, 205. [Google Scholar] [CrossRef] [Scilit]
- Li, N.; Sun, L. Research on the differences in innovation and consumer purchasing behavior among new energy vehicle enterprises. J. Technol. Econ. 2025, 44, 15–24. [Google Scholar] [CrossRef]
- Cao, X.; Zhang, X.; Xing, Z.Y. Exploring the influence of social capital on innovation networks in emerging industries: The mediating role of knowledge sharing. Technol. Anal. Strateg. Manag. 2025, 37, 1868–1884. [Google Scholar] [CrossRef] [Scilit]
- Zhao, Q.Z.; Chen, H.; Zhang, L.H. Coopetition relationship research on new energy vehicle industry’s technology innovation: Basedon Lotka-Volterra population competition model analysis. J. Technol. Econ. 2024, 43, 47–59. [Google Scholar] [CrossRef]
- Liu, C.; Liu, J.; Shao, L.L.; Zheng, Y.F. Contract design to incentive supplier innovation under dual-credit policy. Chin. J. Manag. 2022, 19, 928–937. [Google Scholar] [CrossRef]
- Yenipazarli, A. To collaborate or not to collaborate: Prompting upstream eco-efficient innovation in a supply chain. Eur. J. Oper. Res. 2017, 260, 571–587. [Google Scholar] [CrossRef] [Scilit]
- Lin, Z.P.; Liao, L.L.; Cao, K.Y.; Xu, B. Eco-innovation in a competitive supply chain of new energy vehicles under government subsidies. Chin. J. Manag. 2025, 1–10. Available online: https://link.cnki.net/urlid/42.1725.C.20251024.1711.009 (accessed on 28 January 2026).
- Wang, W.B.; Zhang, M.X.; Guo, J.; Qi, J.Y. A recycling mode of power battery reverse supply chains from the perspective of process innovation. Ind. Eng. J. 2023, 26, 24–34. [Google Scholar] [CrossRef]
- Reimann, M.; Xiong, Y.; Zhou, Y. Managing a closed-loop supply chain with process innovation for remanufacturing. Eur. J. Oper. Res. 2019, 276, 510–518. [Google Scholar] [CrossRef] [Scilit]
- Sun, J.Y.; Long, Q.; Teng, C.X. Indigenous innovation vs. technology outsourcing: R&d strategy and contract design for green supply chain considering R&D capability. Chin. J. Manag. Sci. 2024, 1–23. [Google Scholar] [CrossRef]
- Zheng, G.G. Research on vertical integration and splitting of the automobile industry. Sci. Technol. Manag. Res. 2007, 8, 198–200+203. [Google Scholar]
- Ruxia, L.; Sobhan, A.; Li, Z.T. Strategic battery procurement in new energy vehicle supply chains. Int. J. Prod. Res. 2025, 63, 8540–8569. [Google Scholar] [CrossRef] [Scilit]
- Zhao, S.L.; Han, Y.; Zhou, Q.; Xia, X.Q. Collaborative management of battery manufacturer responsibility in electric vehicle production with ESG due diligence. J. Clean. Prod. 2025, 486, 144591. [Google Scholar] [CrossRef] [Scilit]
- Du, J.G.; Wang, W.X. Pricing decision of NEV battery swapping supply chain under different power structures. Soft Sci. 2024, 38, 124–133. [Google Scholar] [CrossRef]
- Lee, D. Who drives green innovation? A game-theoretic analysis of a closed-loop supply chain under different power structures. Int. J. Environ. Res. Public Health 2020, 17, 2274. [Google Scholar] [CrossRef] [Scilit]
- Jisu, K.; Dabin, J.; Rubal, D.; Prateek, B.; Hyun, L.J.; Euijin, K. How are major electric vehicle fires associated with purchase Intention? The moderating role of EV ownership experience in South Korea. Energy 2026, 342, 139571. [Google Scholar] [CrossRef] [Scilit]
- Fan, Z.P.; Chen, Z.W.; Zhao, X. Battery outsourcing decision and product choice strategy of an electric vehicle manufacturer. Int. Trans. Oper. Res. 2022, 29, 1943–1969. [Google Scholar] [CrossRef] [Scilit]
- Feng, Z.W.; Chen, Y.W.; Tan, C.Q. Choice of supplier development strategies choice in competitive electric vehicle supply chains with power battery recycling. J. Ind. Eng. Eng. Manag. 2024, 38, 235–250. [Google Scholar] [CrossRef]
- Feeny, S.; Rogers, M. The role of market share and concentration in firm profitability: Implications for competition policy. Econ Anal Policy 2000, 30, 115–132. [Google Scholar] [CrossRef] [Scilit]
- Liu, M.W.; Fan, W.P.; Xu, Y.S. Strategies of retailer’s equity holdings in manufacturer’s carbon-reducing investment under Cap and Trade. Ind. Eng. Manag. 2017, 22, 40–48. [Google Scholar] [CrossRef]
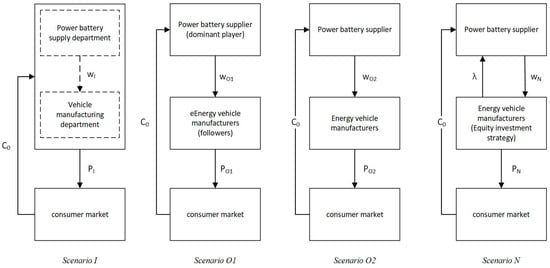
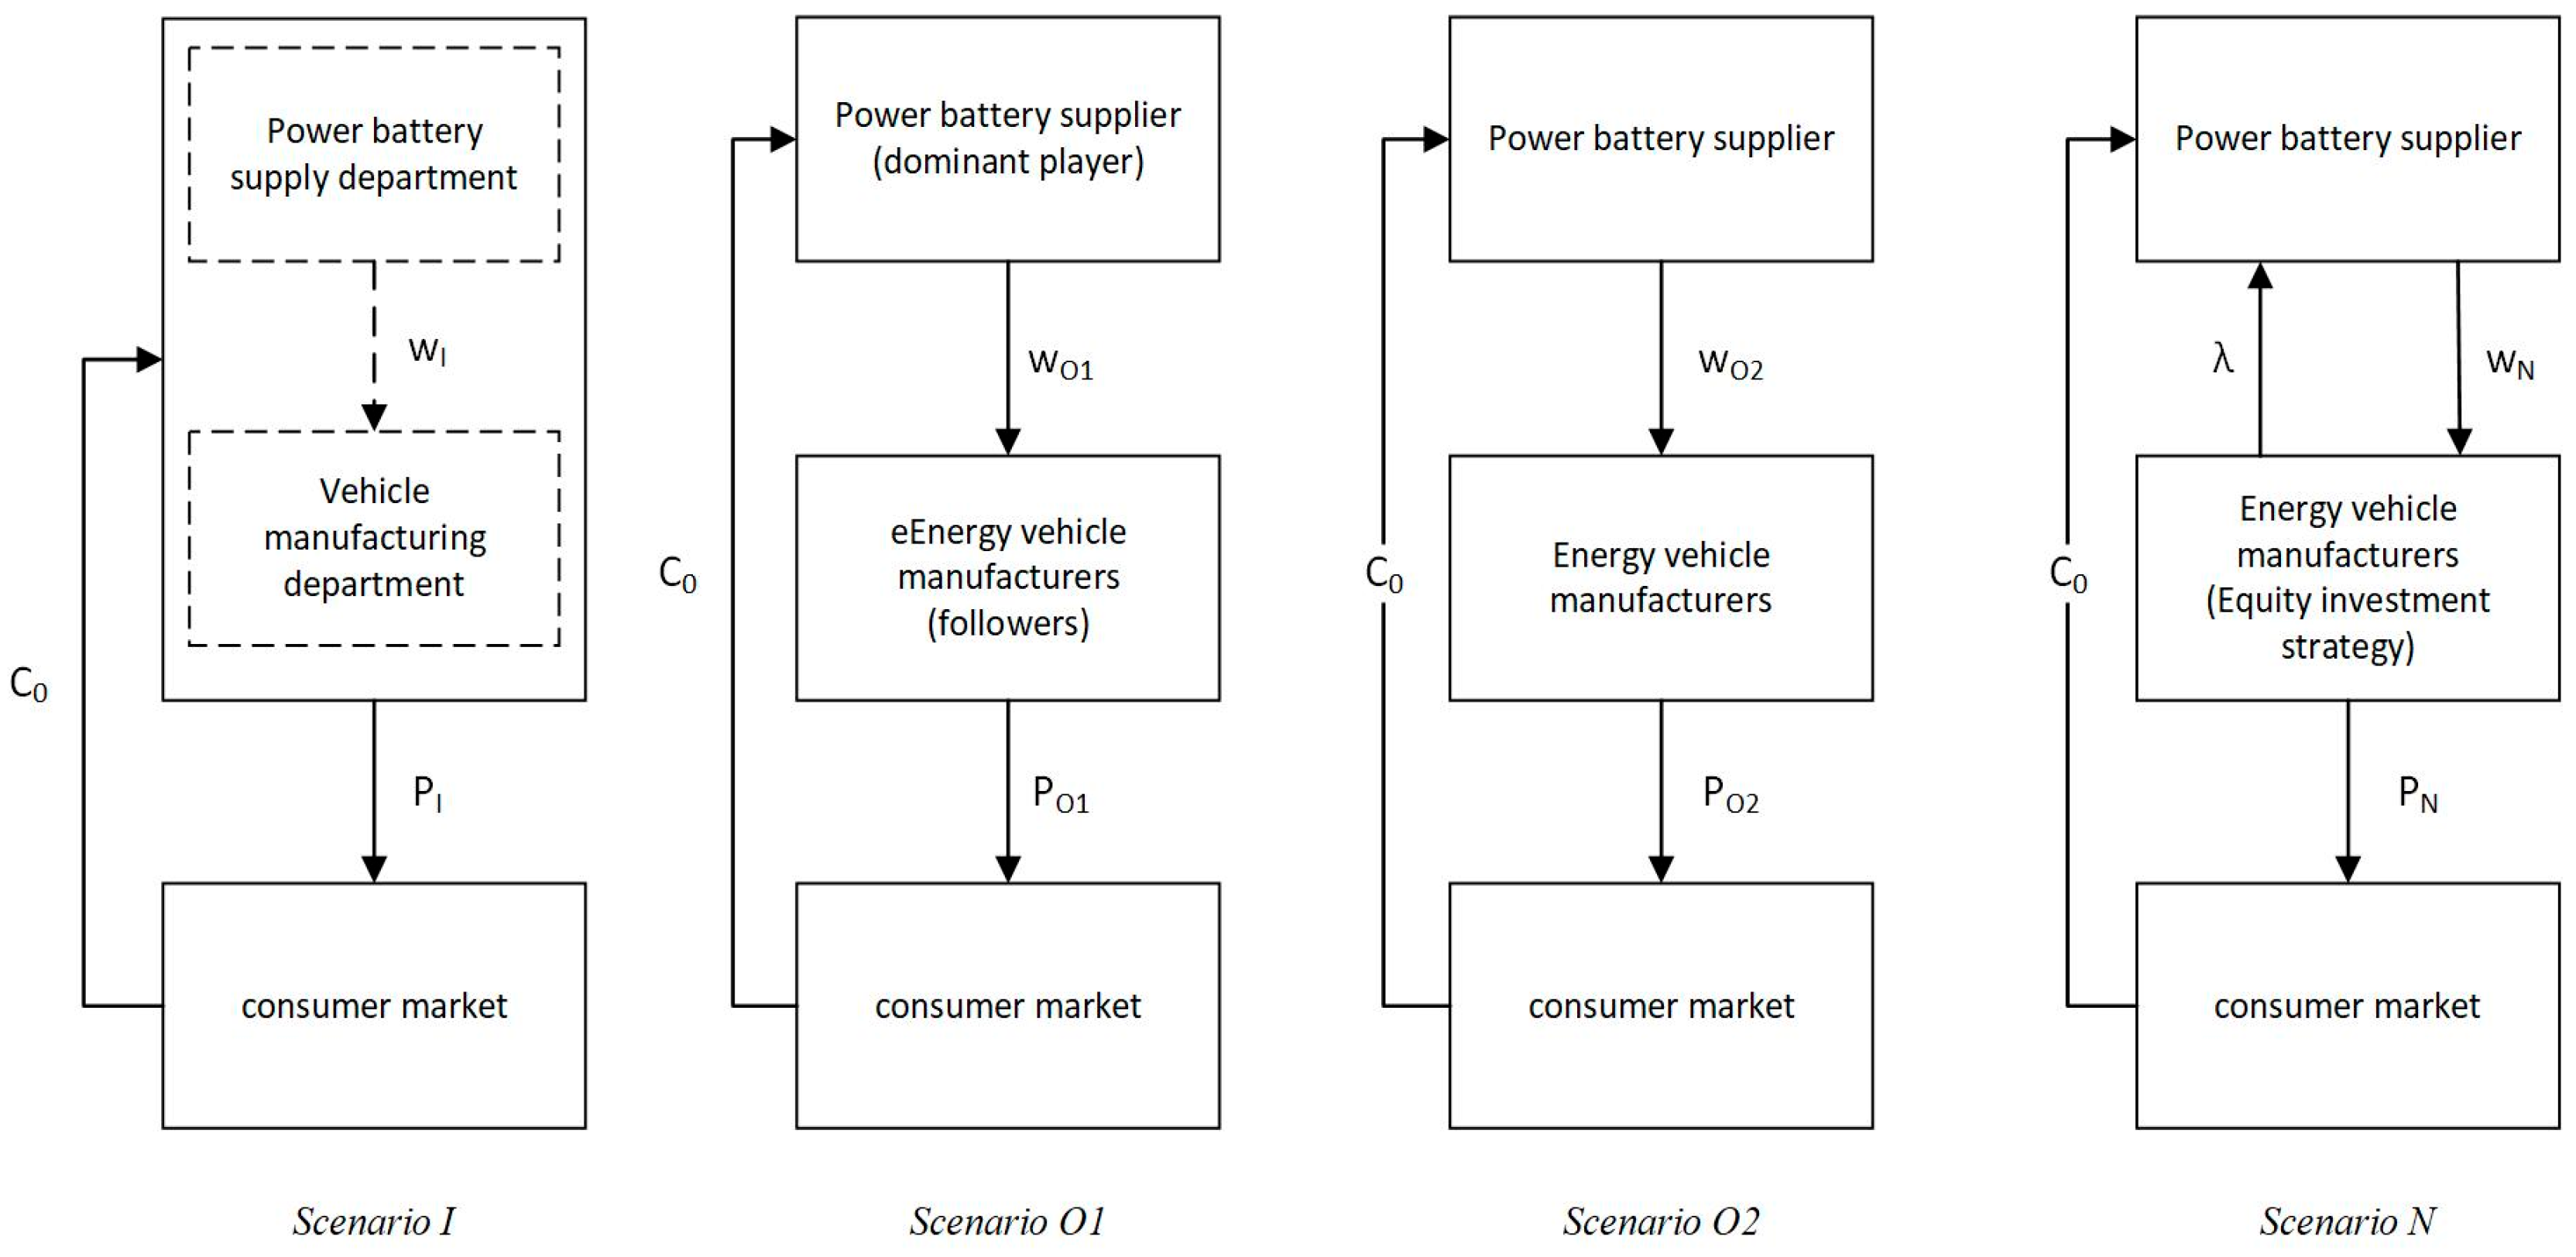
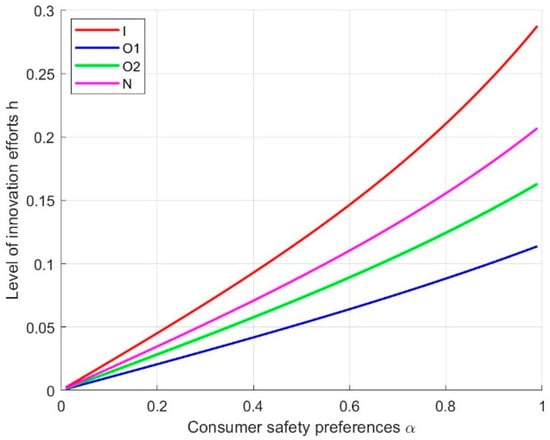
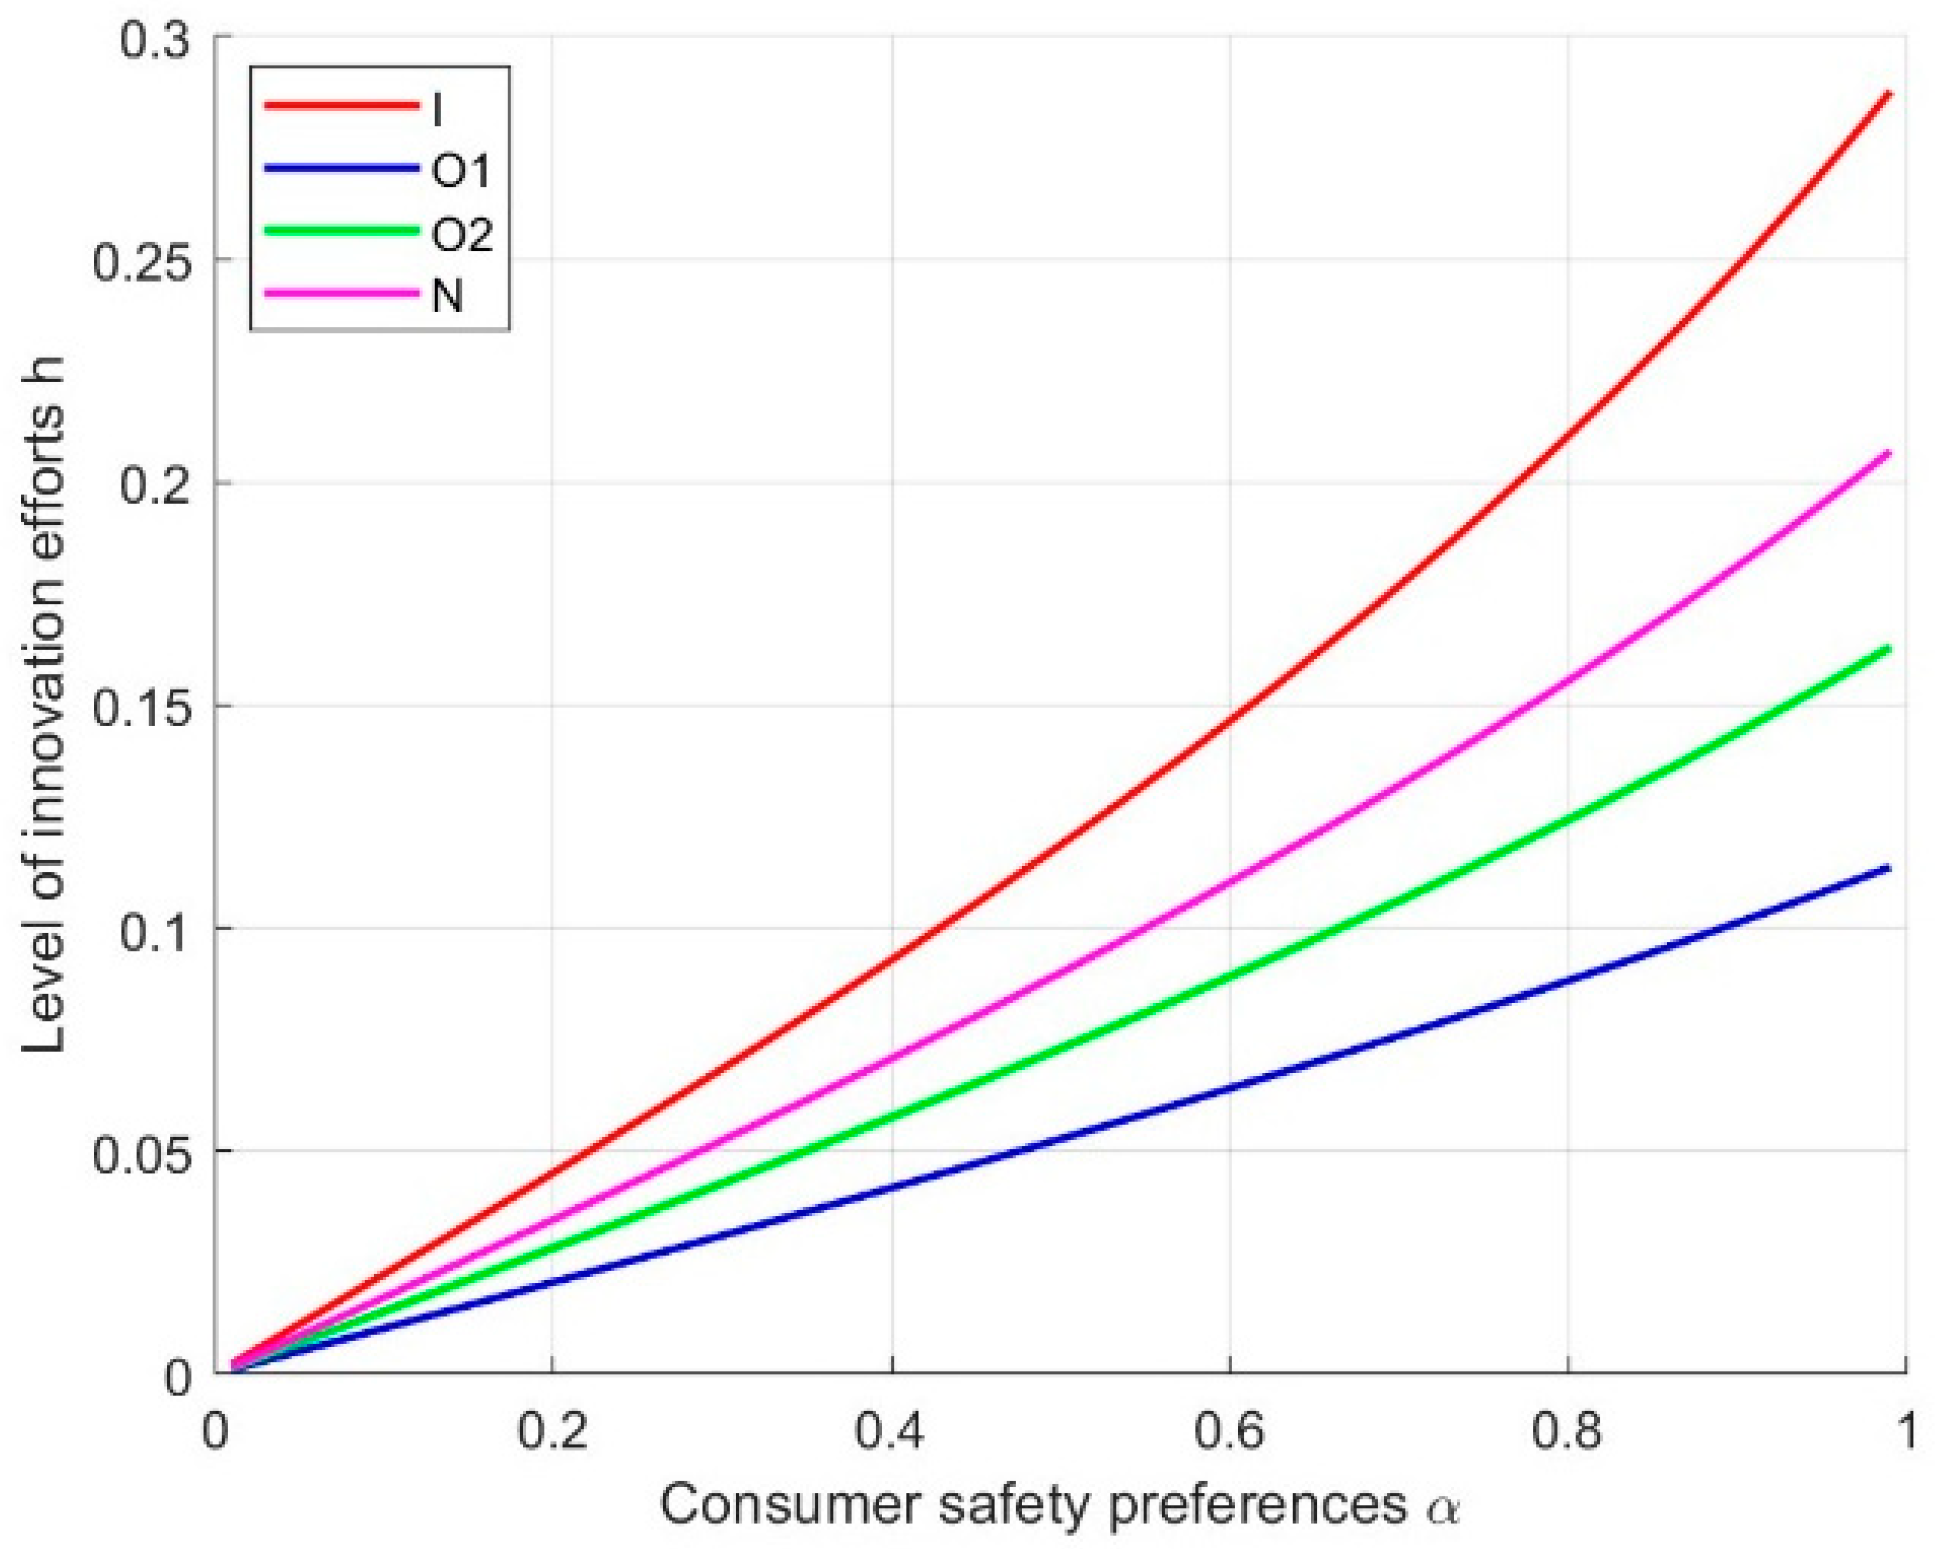
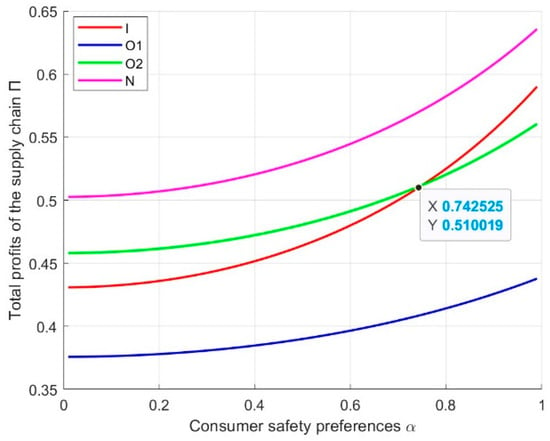
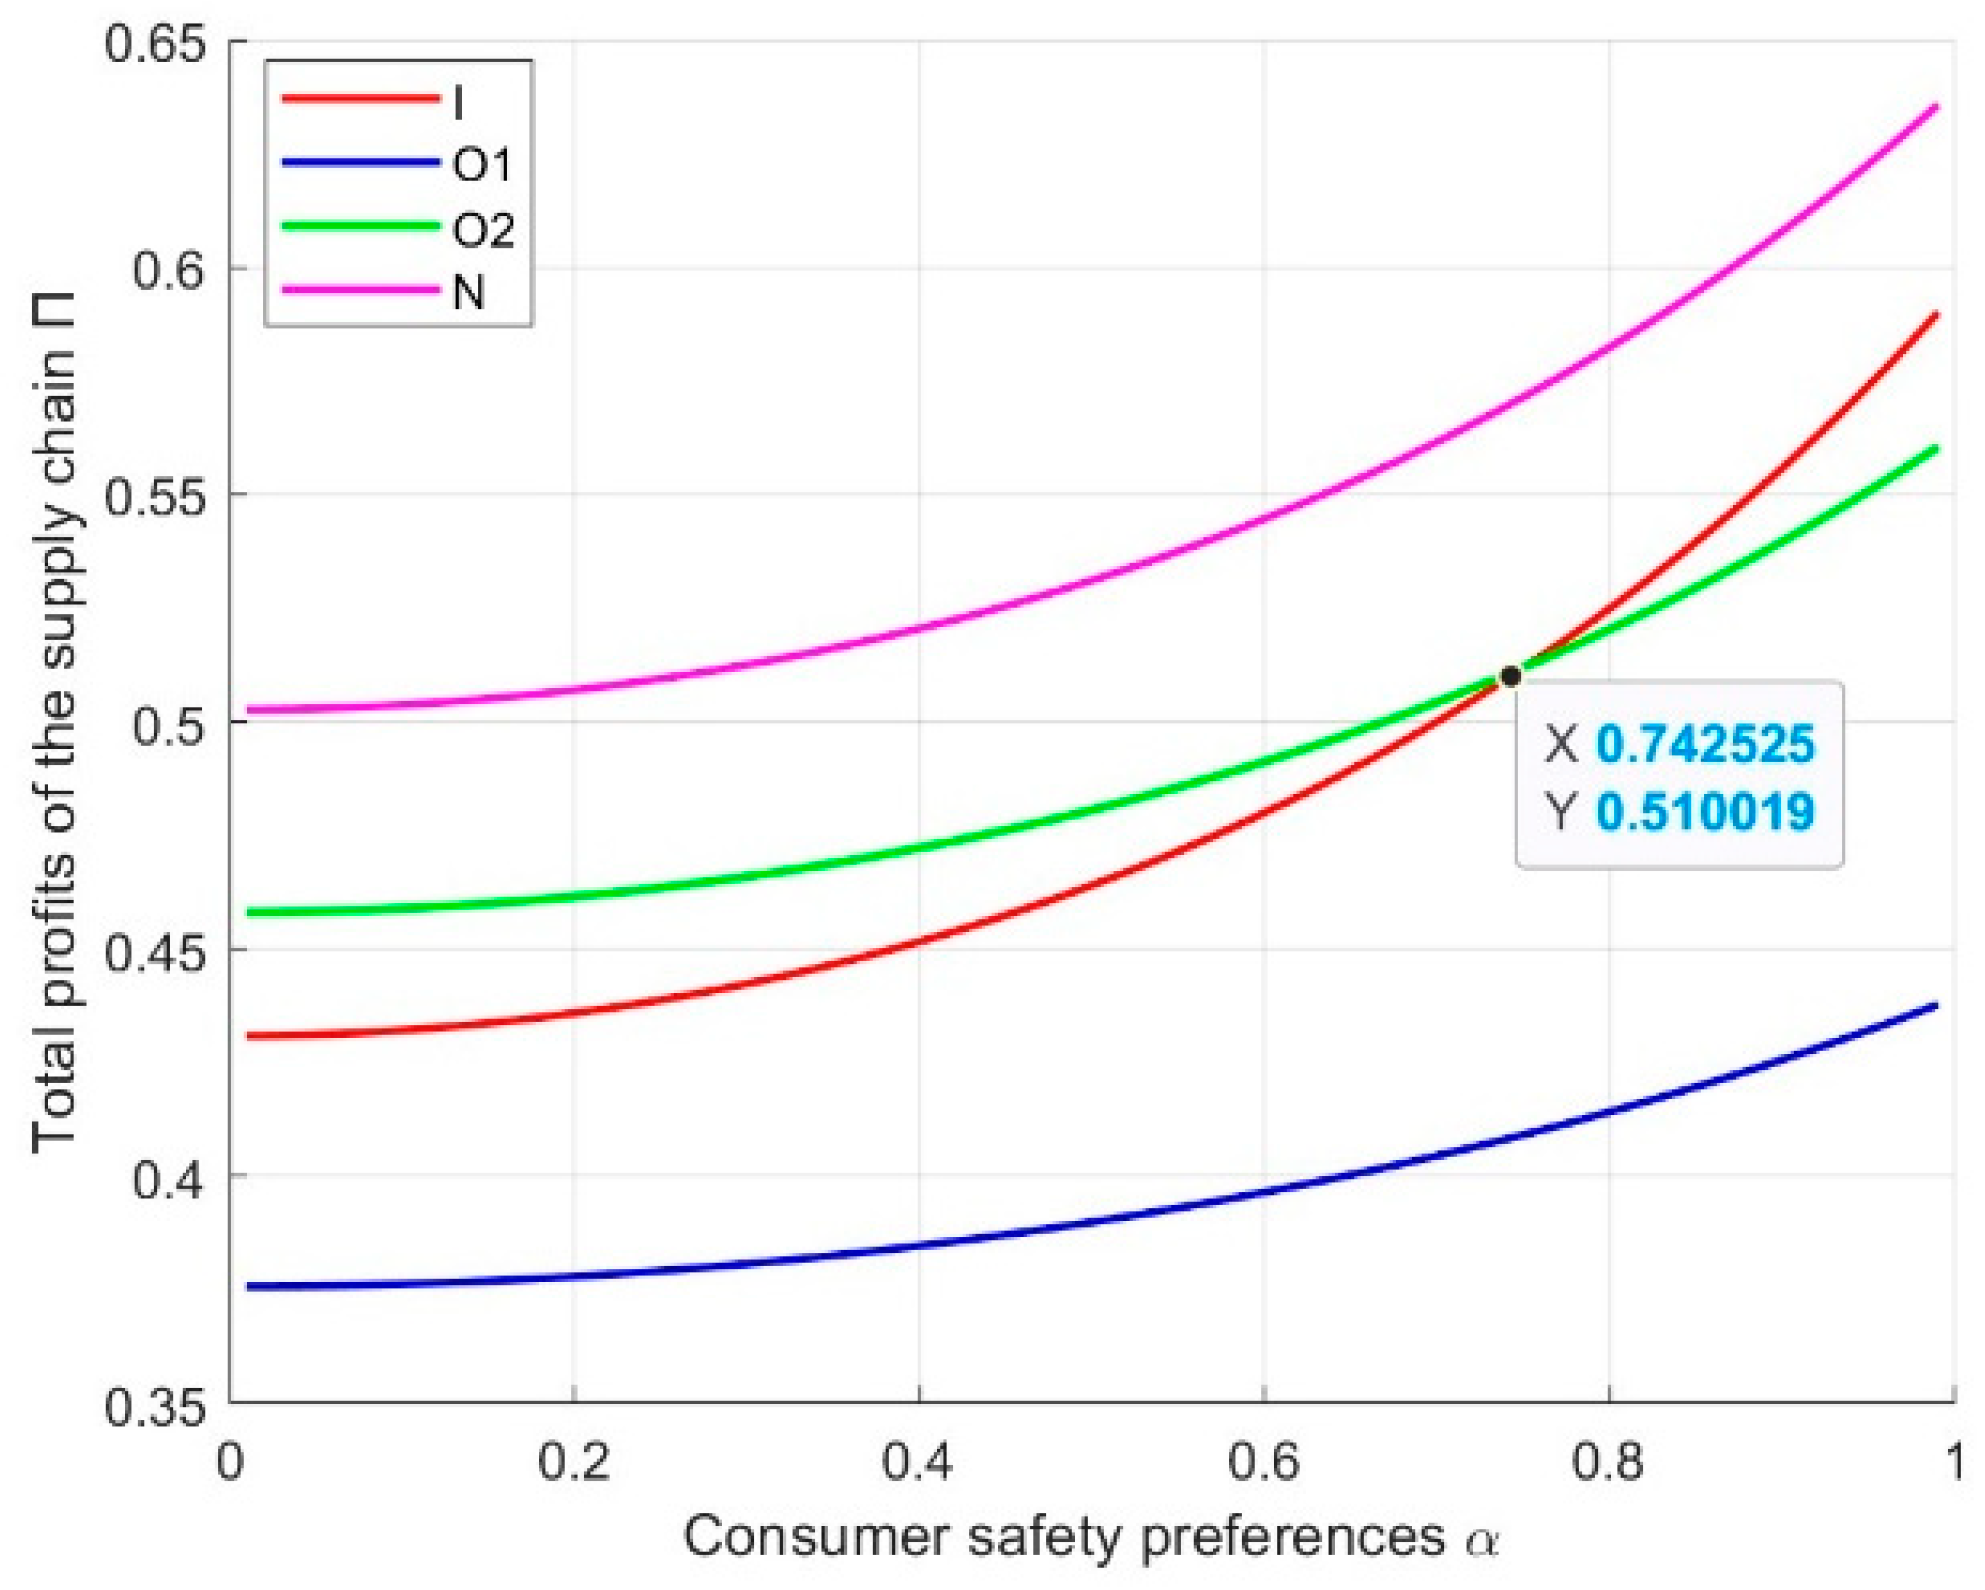
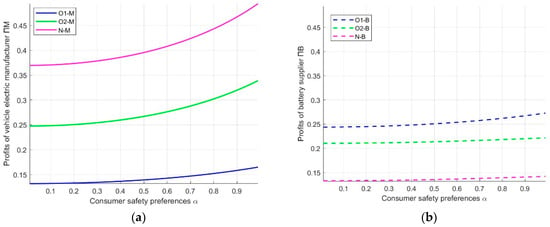
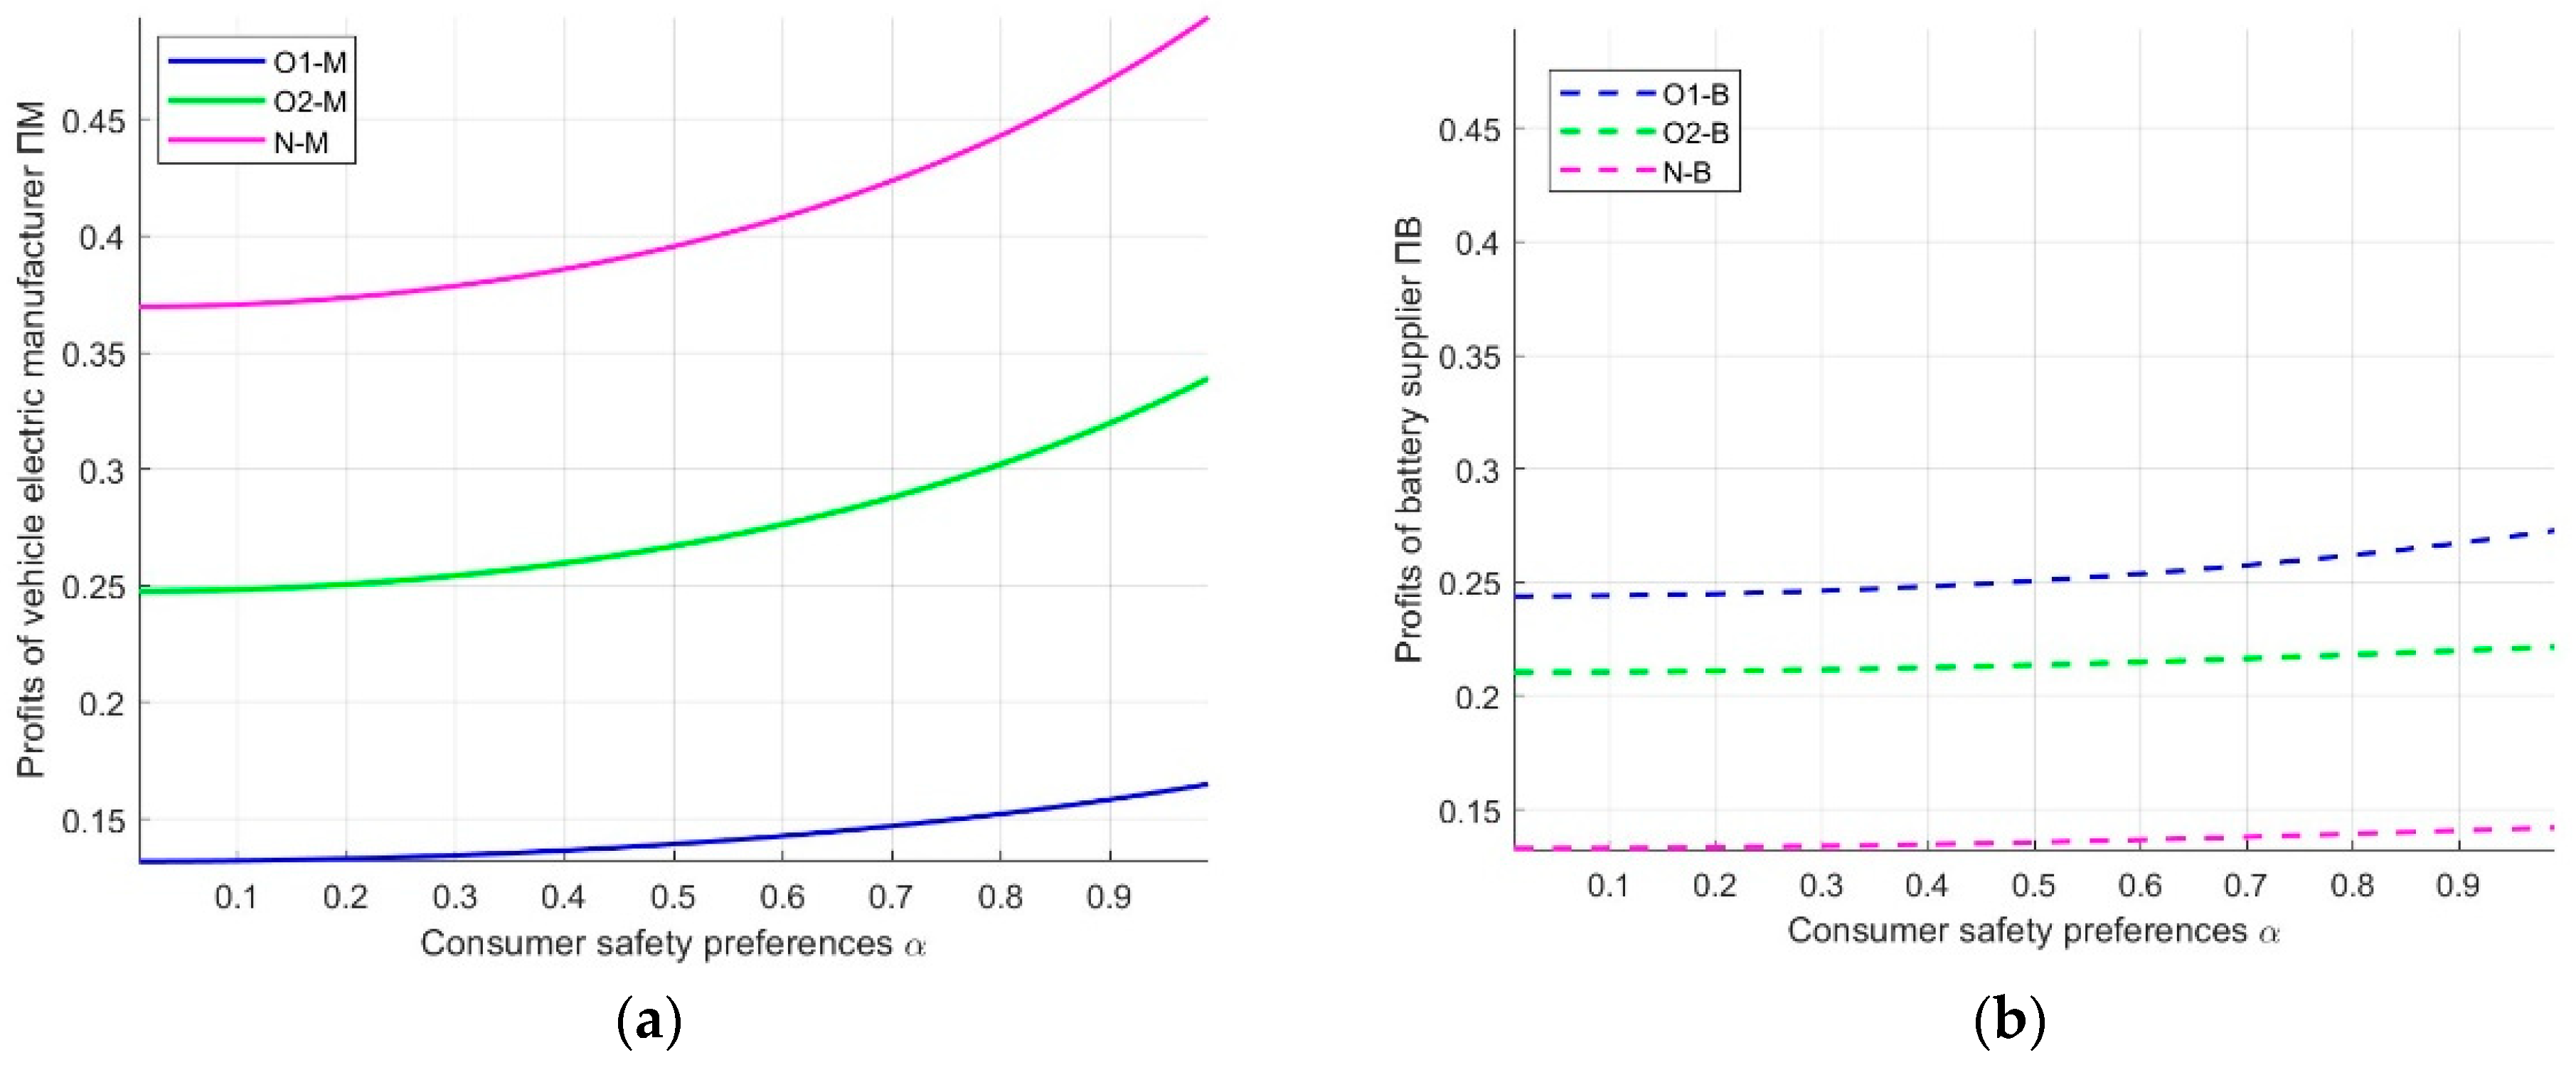
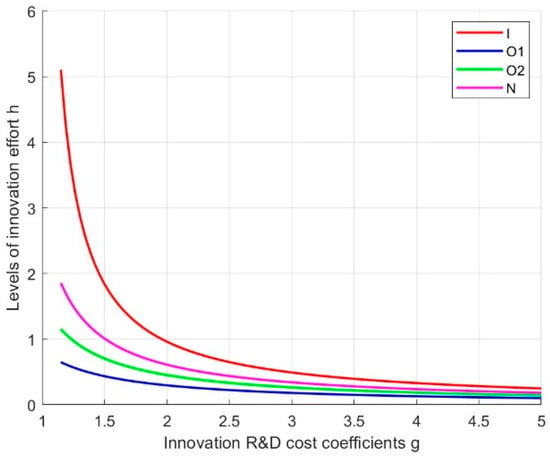
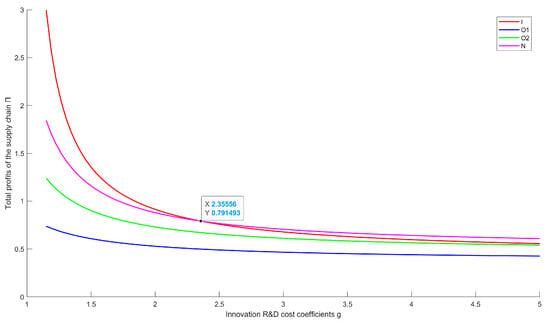
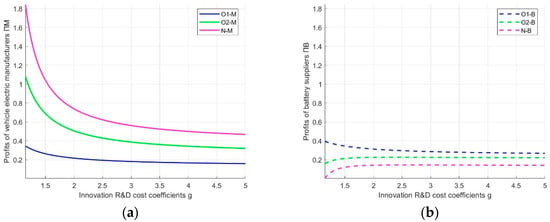
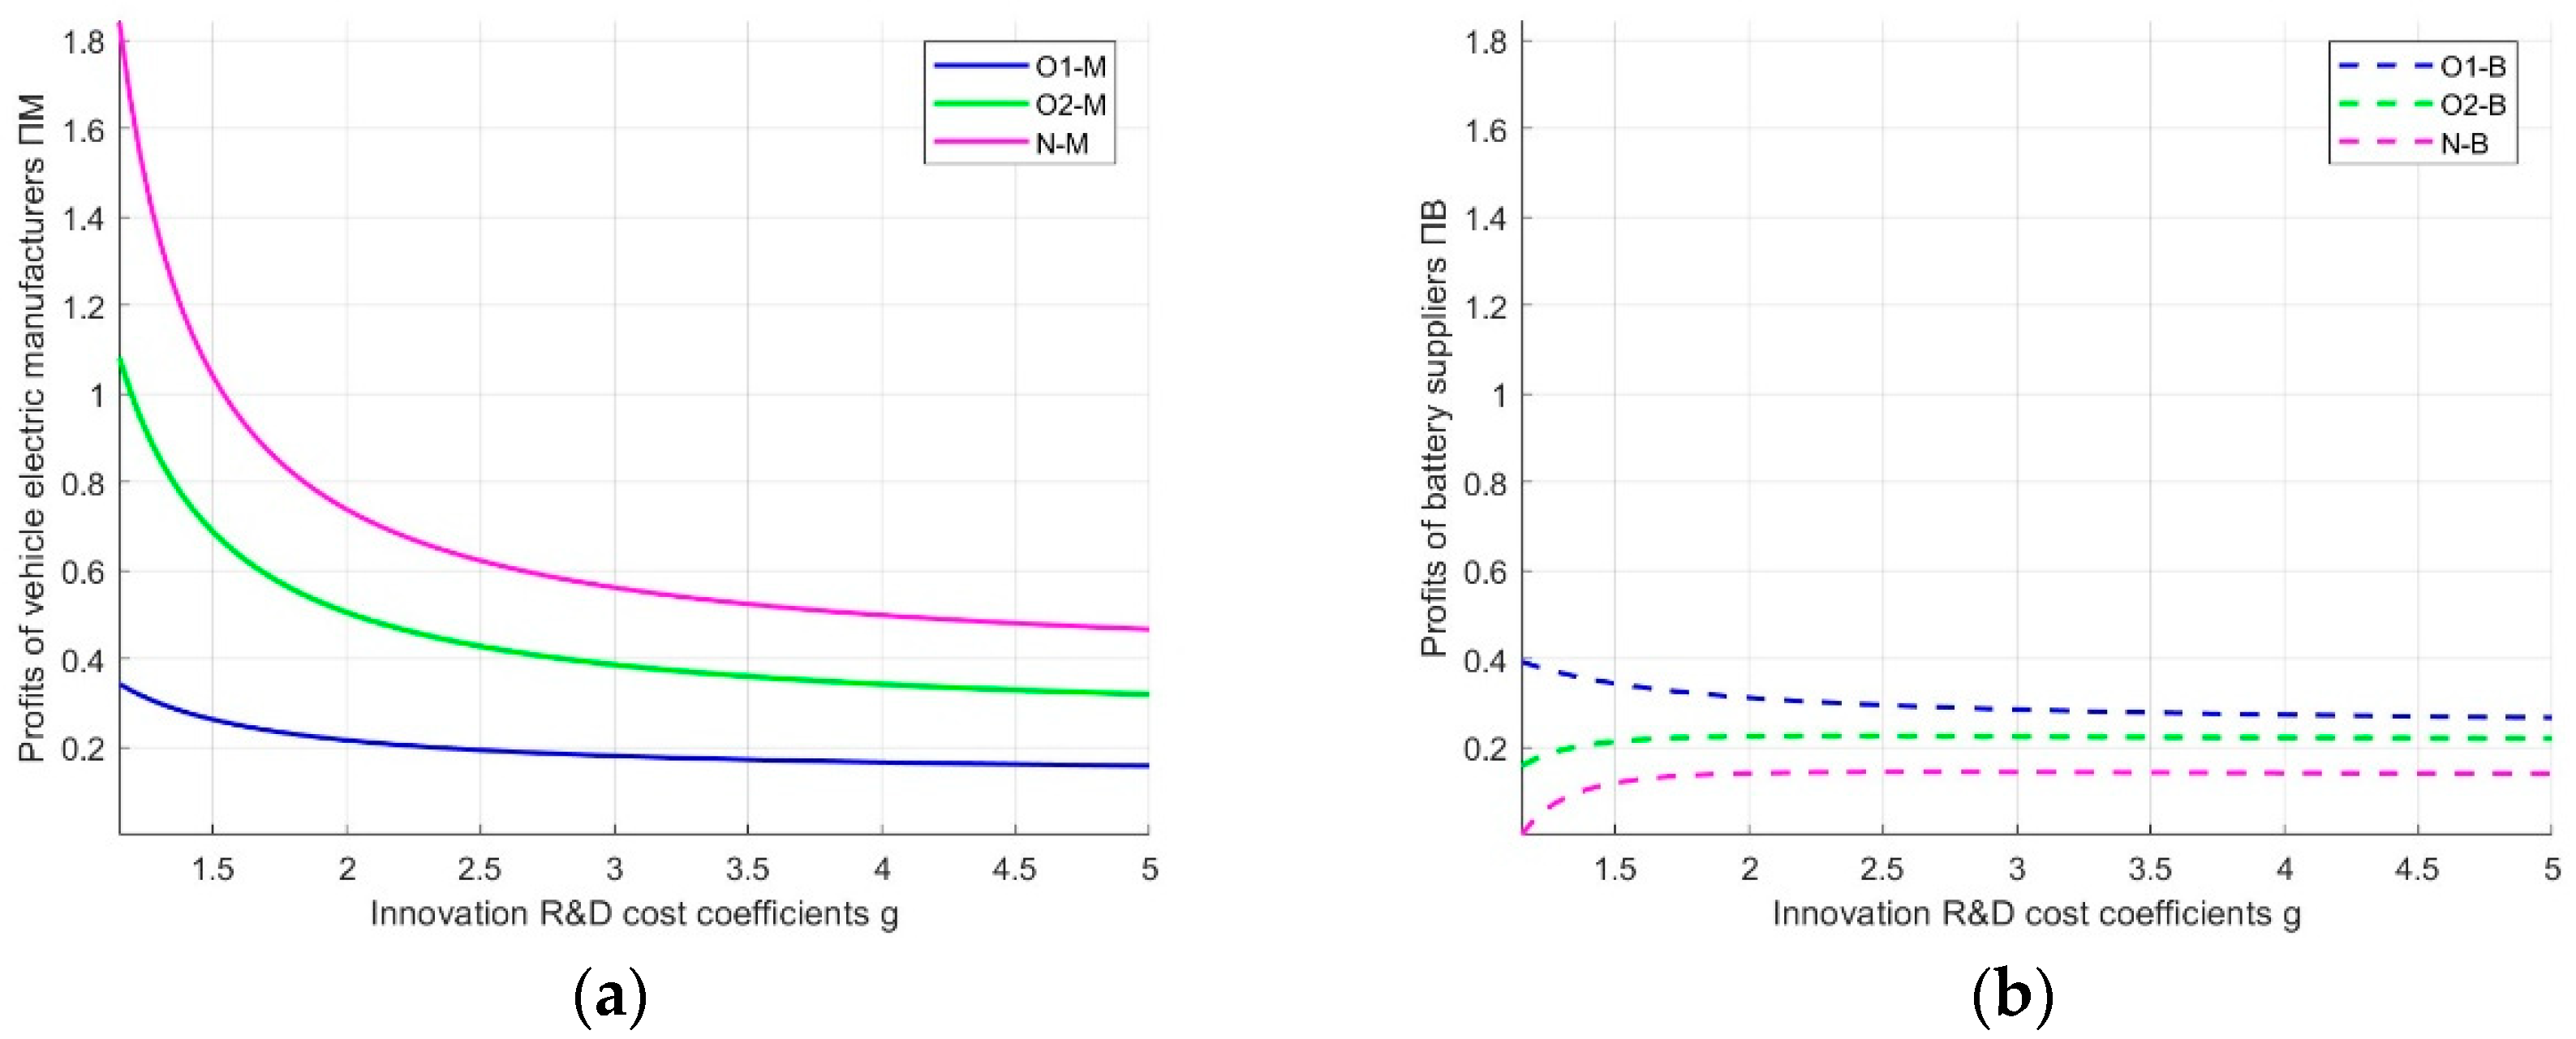
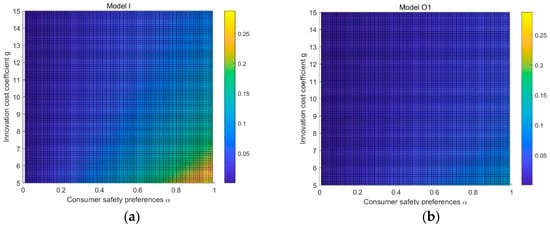
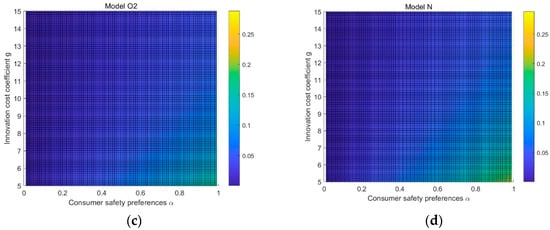
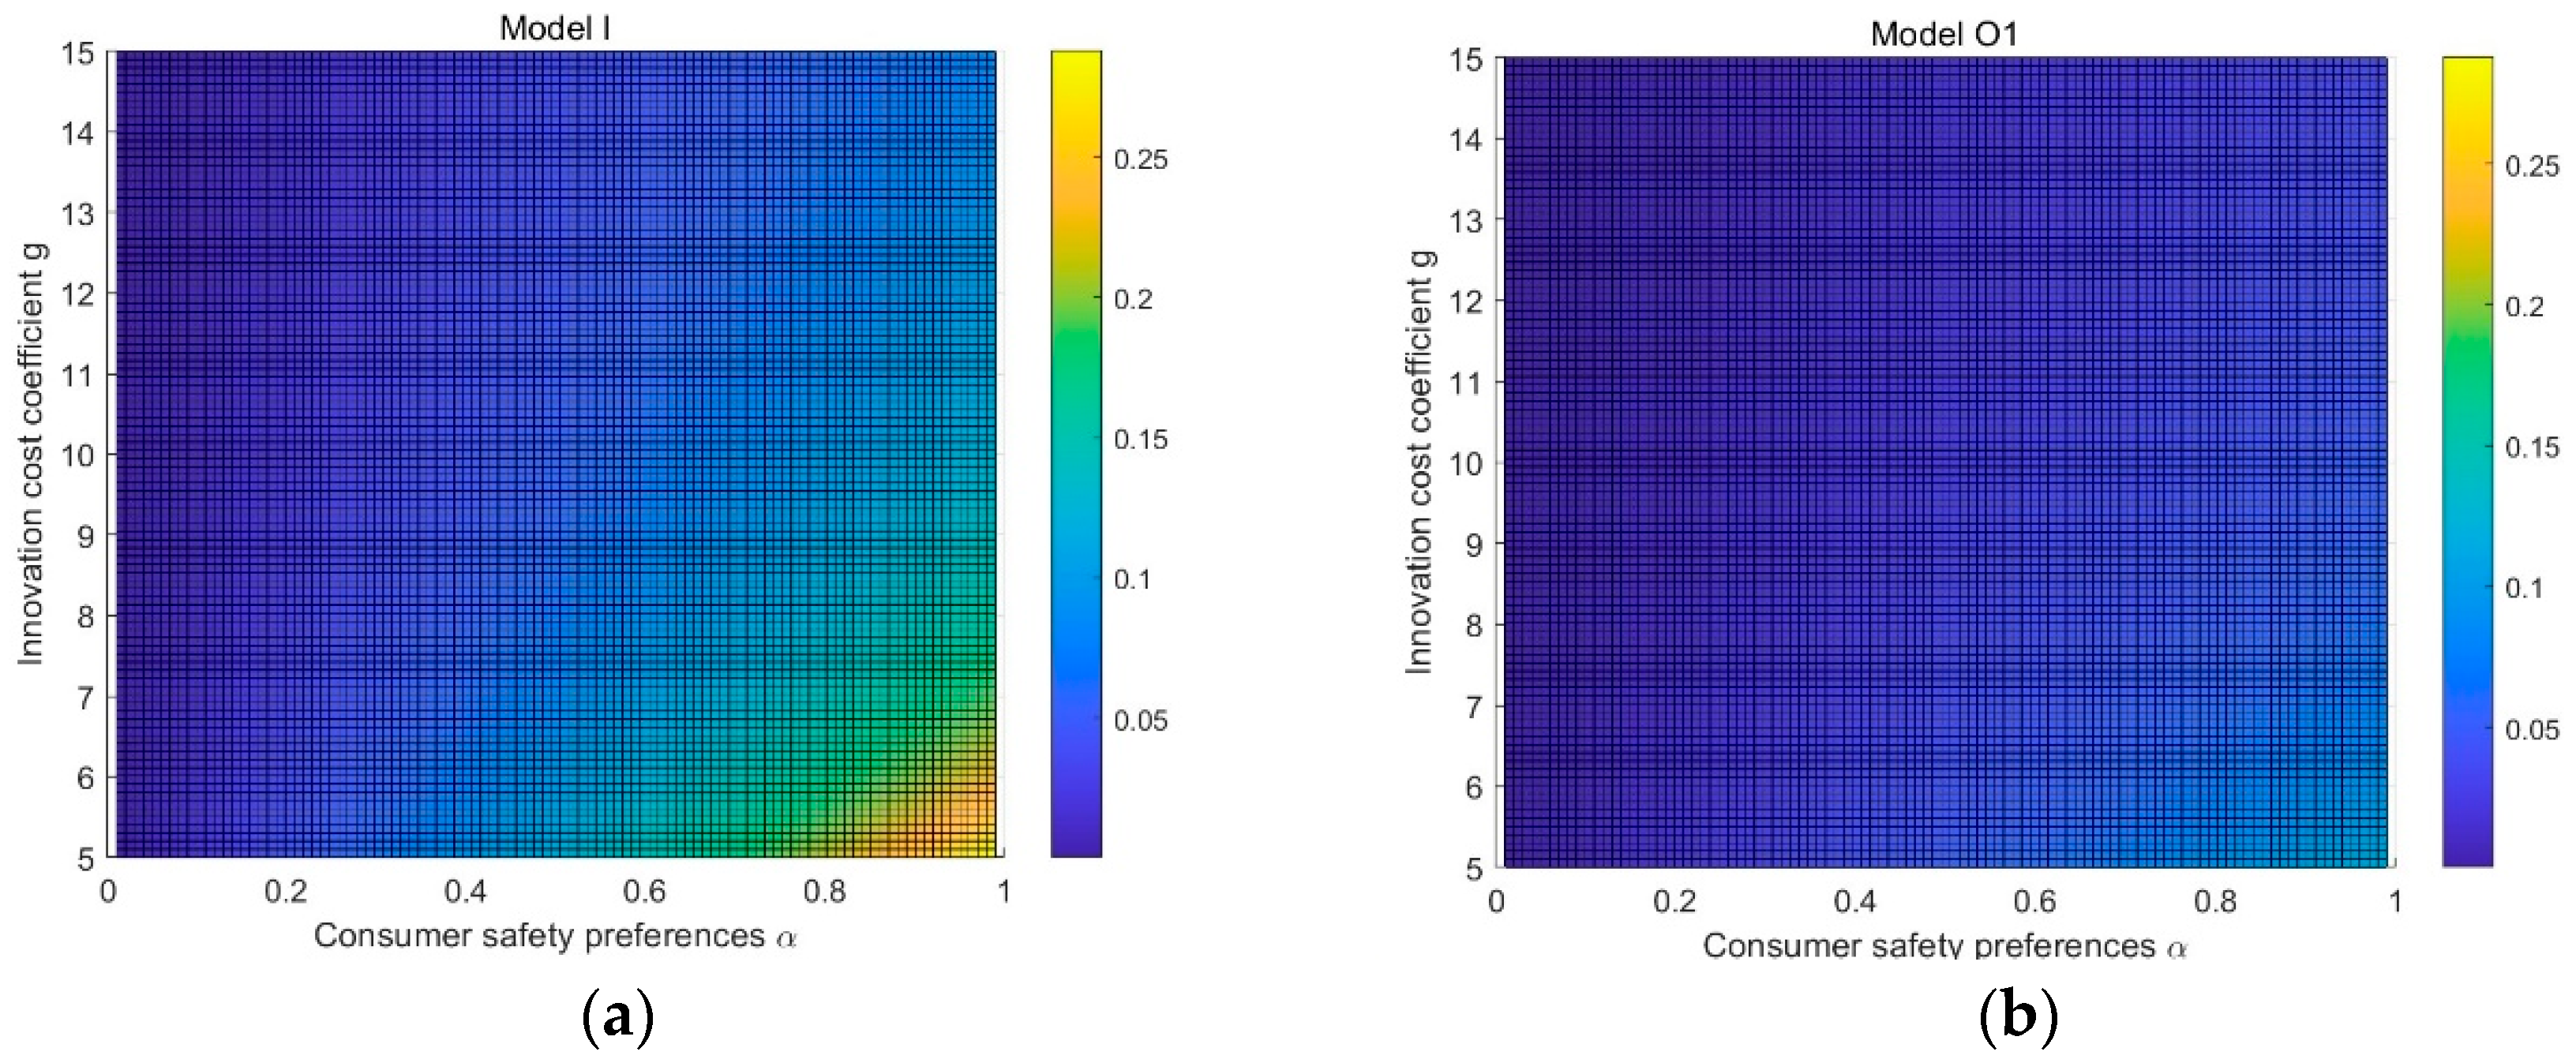
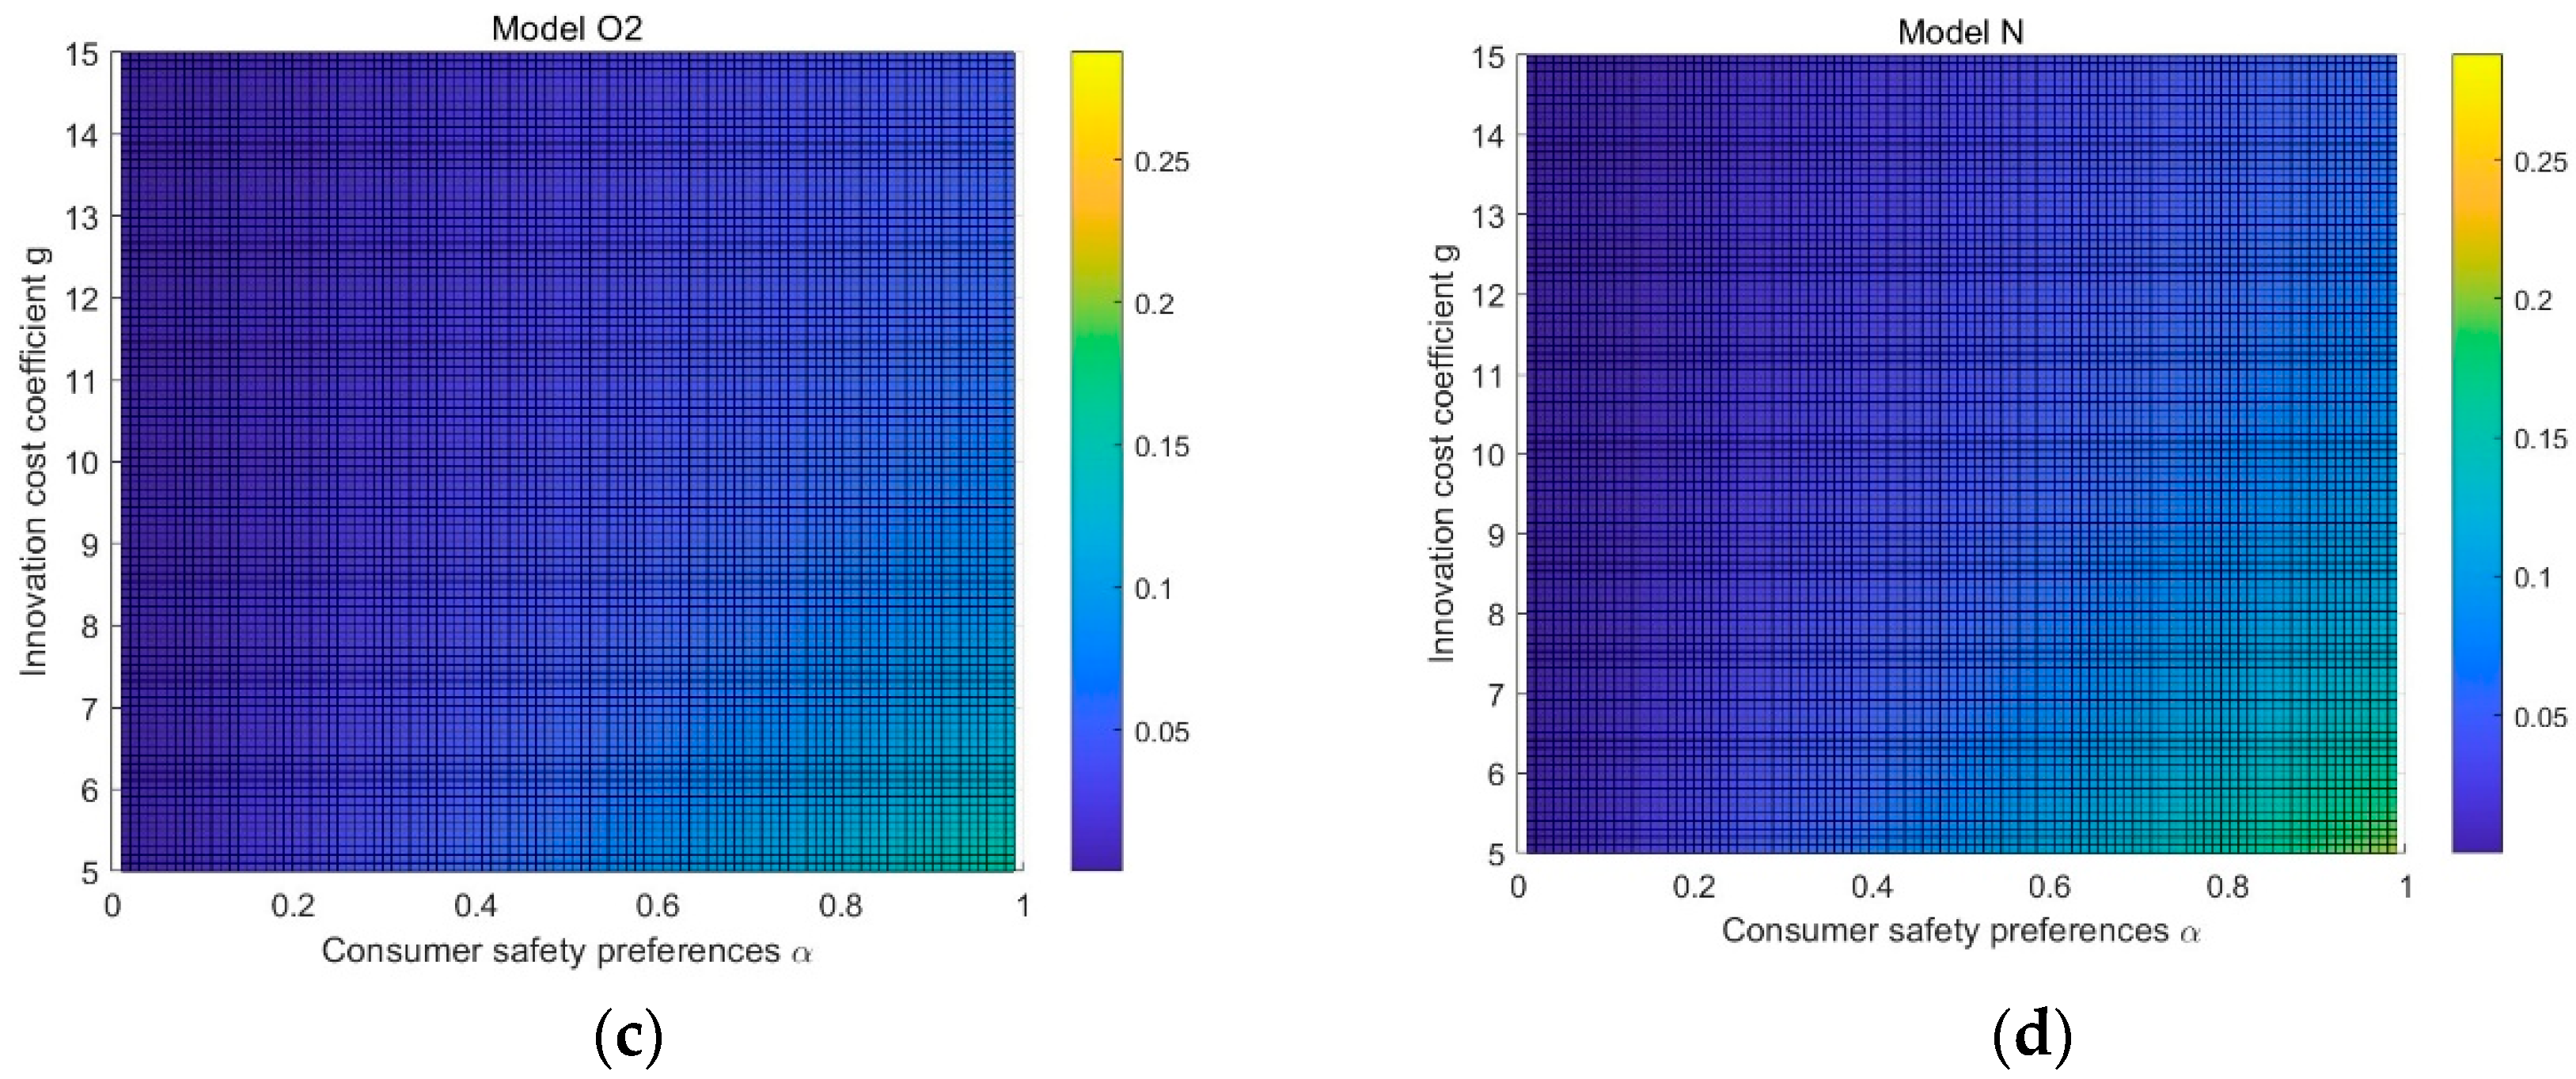
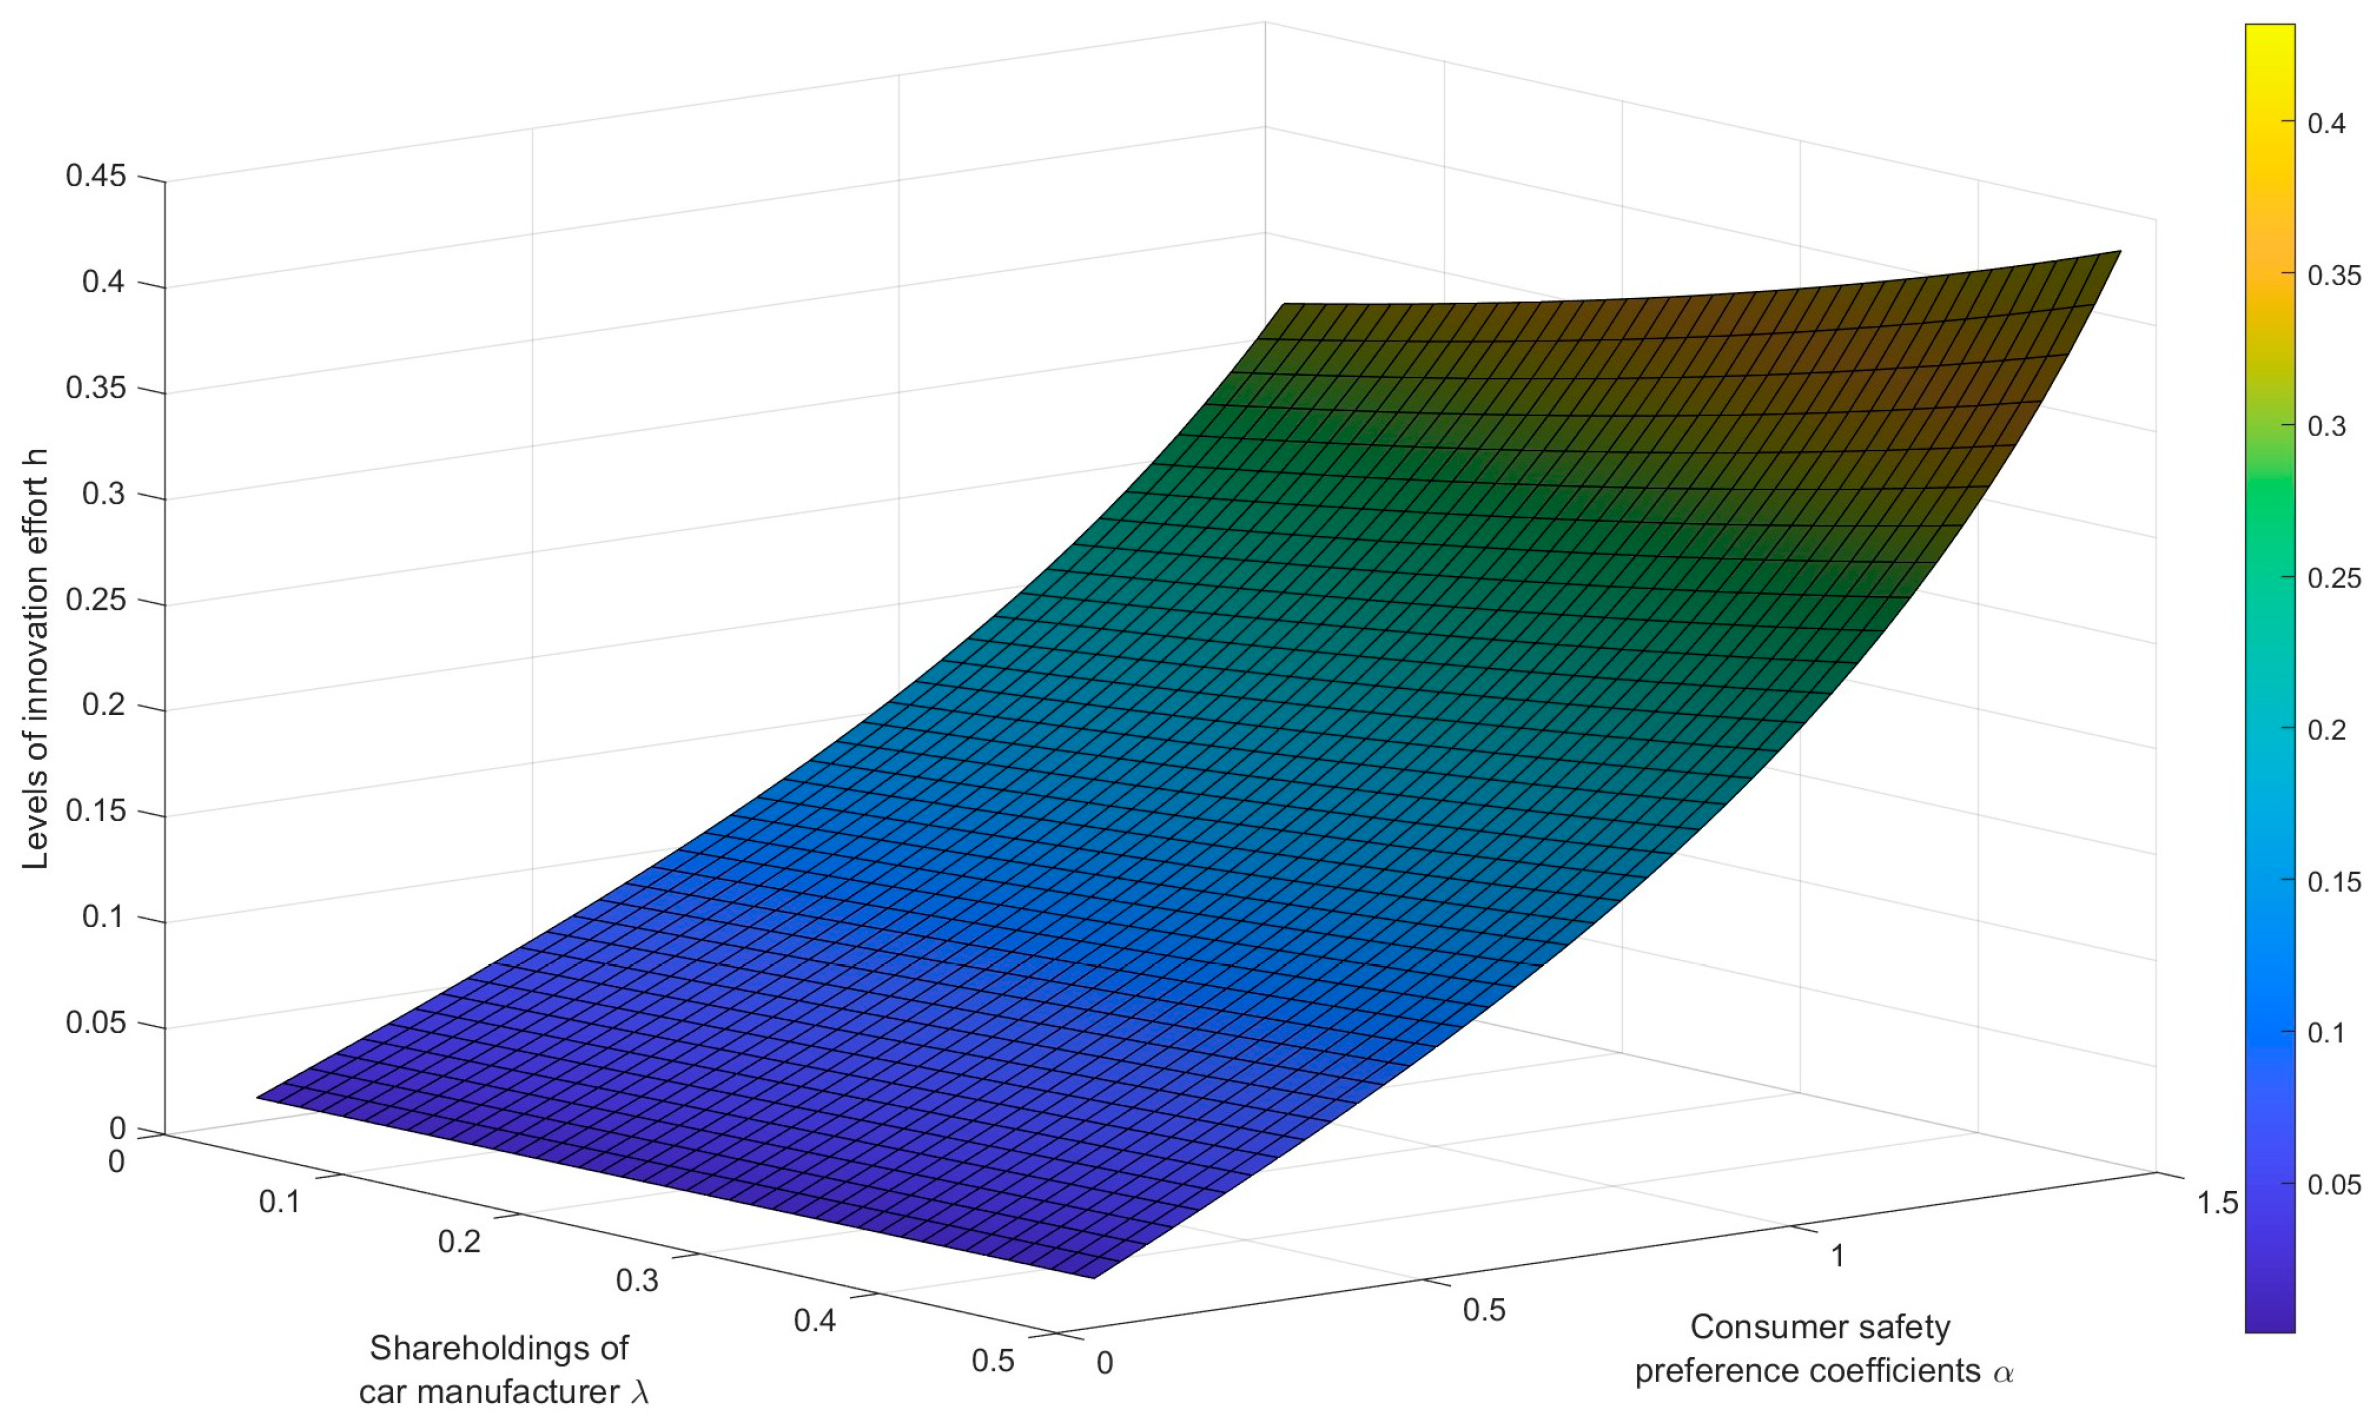
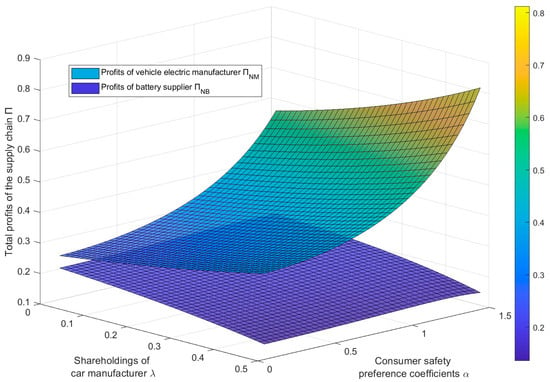
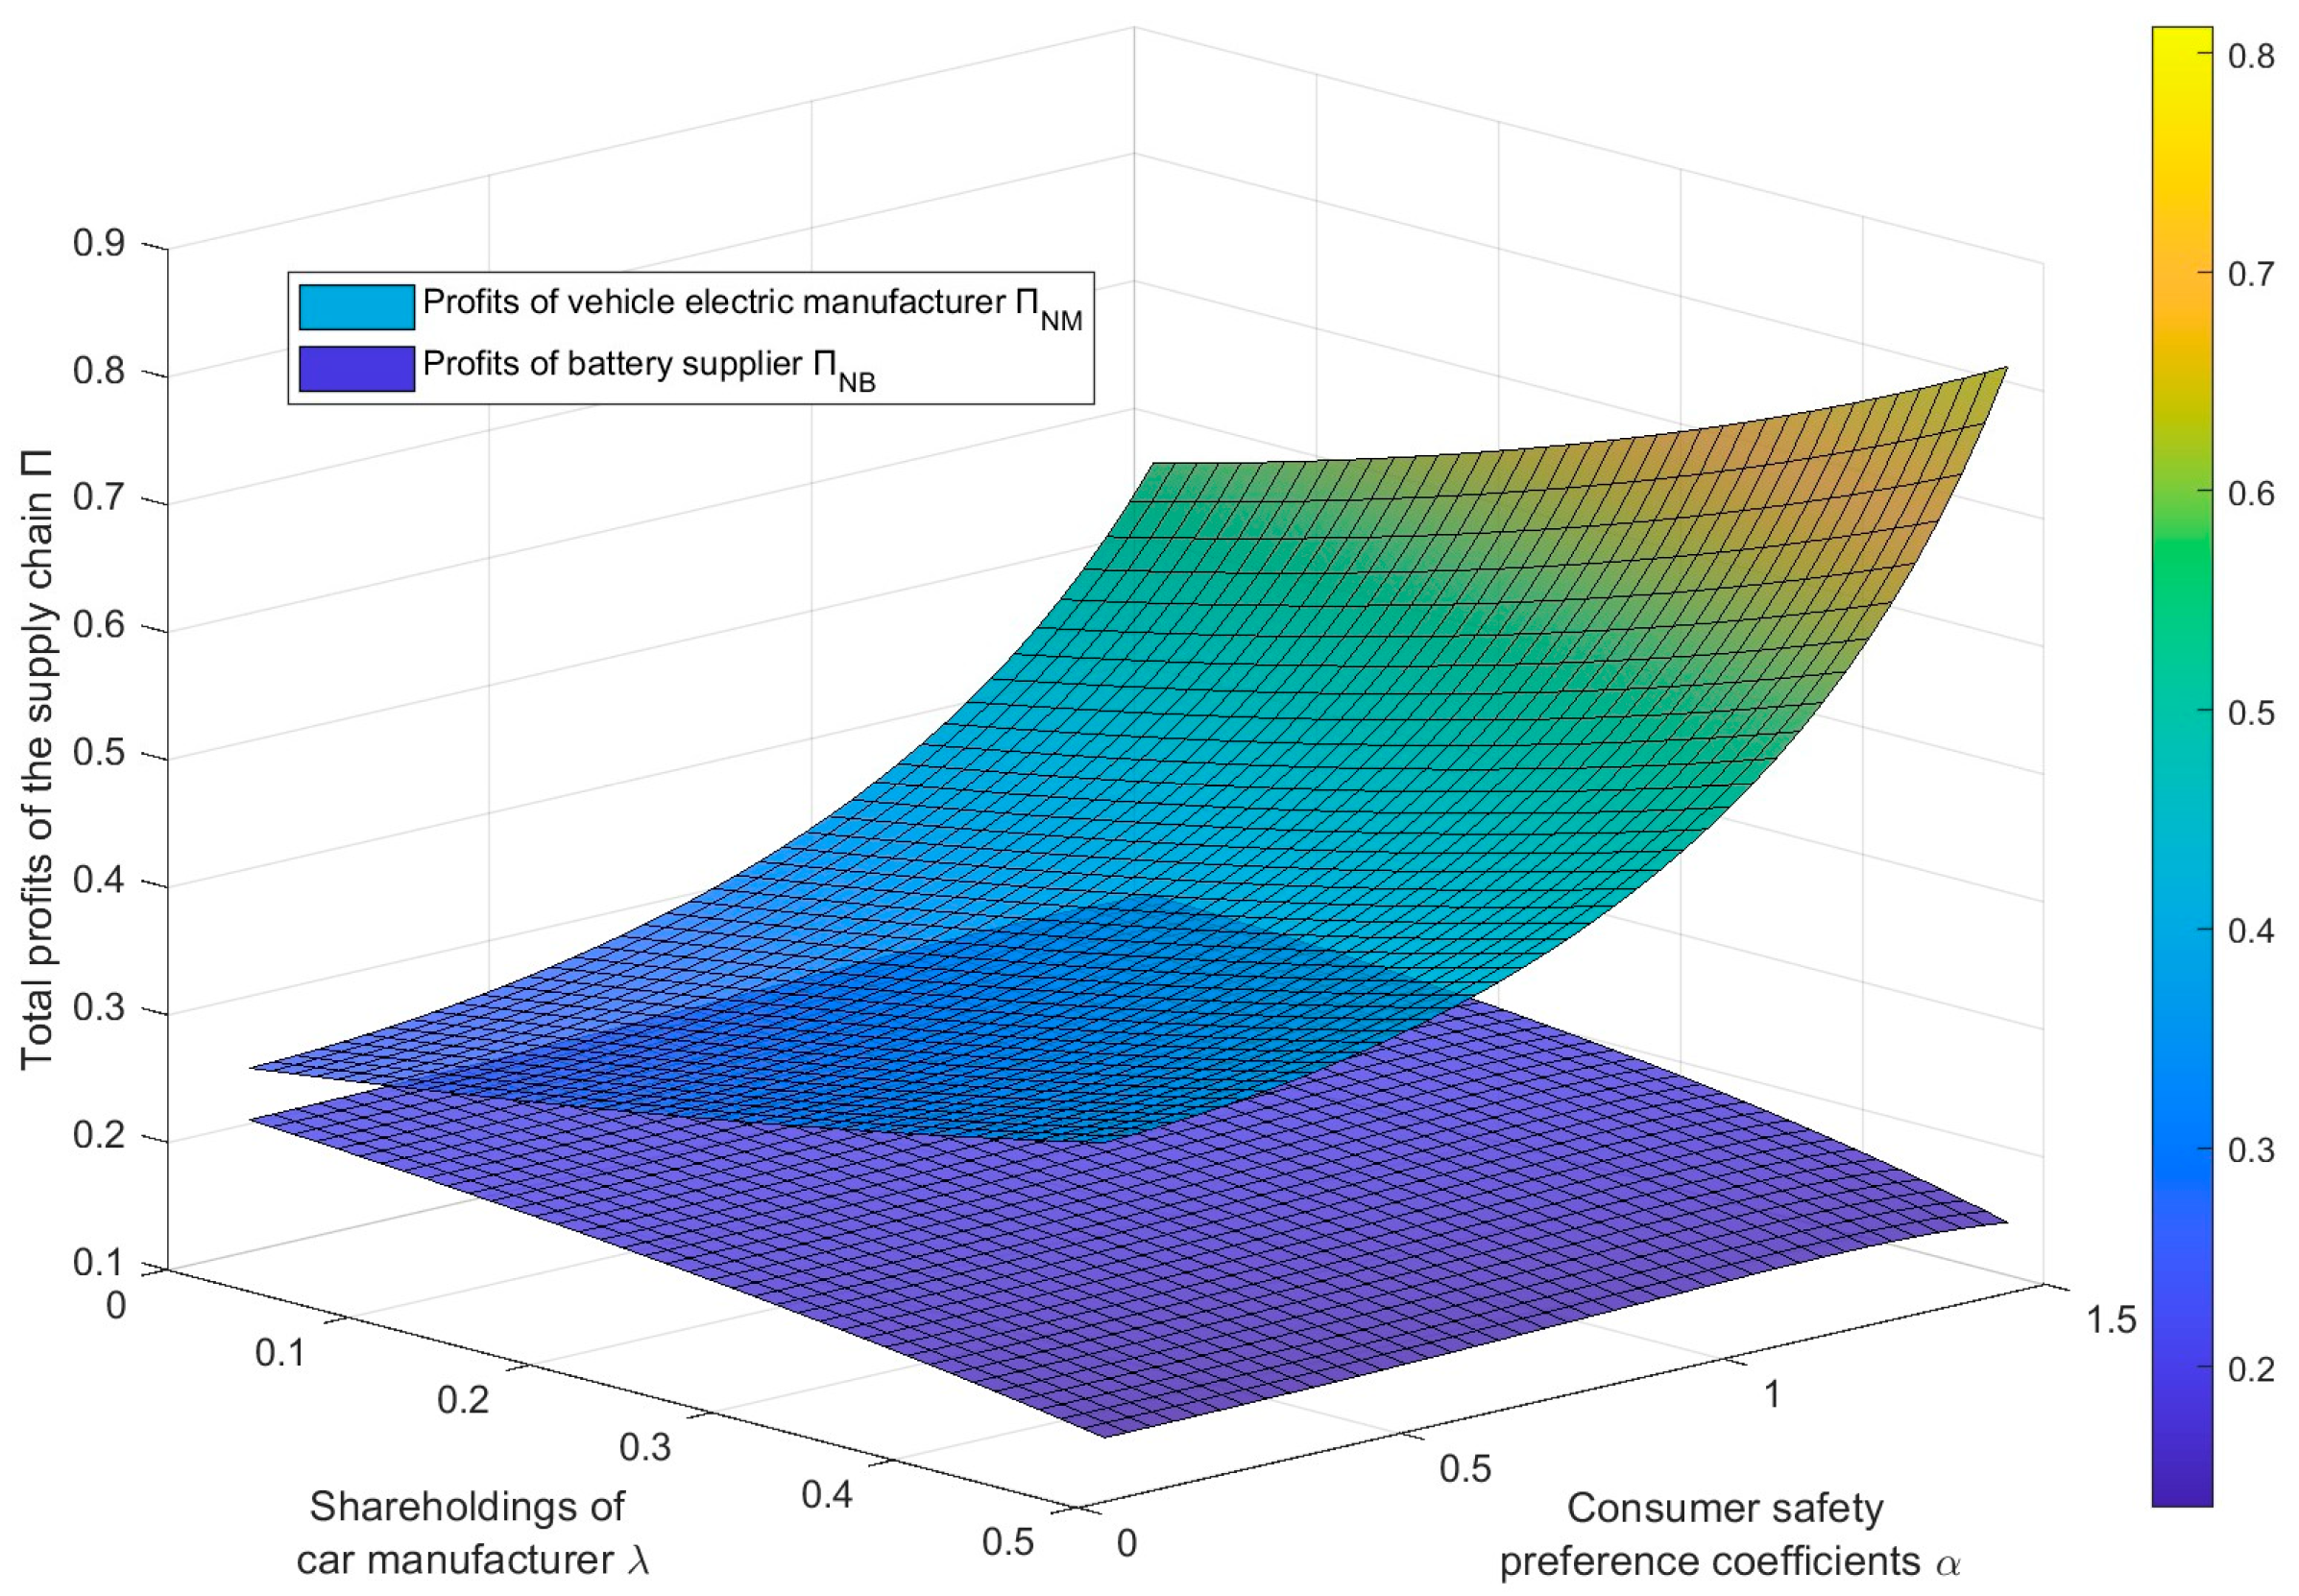

Disclaimer/Publisher’s Note: The statements, opinions and data contained in all publications are solely those of the individual author(s) and contributor(s) and not of MDPI and/or the editor(s). MDPI and/or the editor(s) disclaim responsibility for any injury to people or property resulting from any ideas, methods, instructions or products referred to in the content. |
© 2026 by the authors. Licensee MDPI, Basel, Switzerland. This article is an open access article distributed under the terms and conditions of the Creative Commons Attribution (CC BY) license.