


Abstract
At present, many secondary agricultural residues are landfilled or burned in the open field, leading to the loss of the valuable nutrients they contain. The valorization of agricultural biomass provides a promising route for resource recovery and circular bioeconomy development, allowing for symmetry in their reuse. Hydrothermal carbonization (HTC) offers a sustainable method for converting agricultural waste to both solid and liquid carbon-containing products. Since the liquid product is highly dilute, it is a challenge to apply it at large scales. In this work, a low-energy separation process, direct contact membrane distillation (DCMD), has been used to concentrate the liquid product from HTC of rice husks while recovering water from it. The effect of feed temperature on DCMD performance in terms of water recovery percentage and concentration factors for the fermentable sugars xylose and glucose was investigated at feed temperatures of 50 °C, 65 °C, and 80 °C. DCMD conducted at a feed temperature of 80 °C yielded the highest value for average water flux at 3.4 L/m2·h. DCMD at 80 °C also showed the highest water recovery (56.9%) compared to the lower temperatures, and concentrated xylose and glucose by 2.06 and 3.20 times, respectively3. Incremental flux measurements revealed evidence of limiting mechanisms, such as temperature and concentration polarization, with prolonged operation time. The results from this study thus establish an integrated HTC–DCMD system for efficient water recovery and the concentration of HTC liquor, thereby enhancing its potential for commercial use.
1. Introduction
Changes in the global climate have made imperative the need for technological transformations in using renewable wastes rather than extracting more fossil materials from the ground. In response to the need for a more circular economy, climate protection agencies have come forward with stringent control measures. The United States Environmental Protection Agency (U.S. EPA) has proposed a cellulosic biofuel production volume of 1.30 billion ethanol-equivalent gallons (equivalent to 1.30 billion RINs, where one RIN represents one ethanol-equivalent gallon) for 2026, aiming to increase it to 1.36 billion ethanol-equivalent gallons for 2027 [1]. Reports by the Intergovernmental Panel on Climate Change (IPCC) suggest that global greenhouse gas emissions, largely from fossil fuel combustion, be reduced by nearly 50% by 2030 [2,3]. Strategies to produce biofuels through sustainable pathways are therefore currently sought after. Such approaches allow the saccharides (sugars), formed as by-products by food crops from CO2, to be used in fermentation to produce biofuels. When used, biofuels generate CO2, thus causing symmetry in carbon movement. This process is in contrast to the use of fossil fuels, which remove organic carbon from under the Earth to produce CO2 in the atmosphere, an inherently asymmetric process.
Hydrothermal carbonization (HTC) is a technique that has gained widespread attention for converting various lignocellulosic biomass into energy-dense biofuels, thus promoting a more circular economy. The ability of HTC to use biomass without drying, as well as its relatively low thermal energy requirement in comparison to processes such as pyrolysis, gasification, and flash carbonization, makes it highly desirable for this purpose [4].
Various materials, such as corn stover, rice husks, municipal sewage sludge, wood chips, and many other forms of biological waste, have been explored as feedstocks and subjected to different operating conditions to observe the extent of achievable energy densification in the solid hydrochar produced [5,6]. A complete reaction mechanism for biomass processing by HTC has not yet been established; however, several attempts at constructing the possible stages of the reaction kinetics have been successfully completed [5]. These studies cumulatively suggest the fundamental reaction steps begin with the hydrolysis of cellulose, resulting in the formation of cellobiose and subsequent transformation to its monomeric forms: glucose and its isomer fructose. The monomers then undergo dehydration, causing the formation of hydroxymethylfurfural (HMF), which can either rehydrate to form formic and levulinic acid or polymerize to form hydrochar by condensation [7]. The presence of the intermediate and final organic derivatives has been confirmed in the aqueous phase product of HTC across various studies, thereby validating the proposed reaction pathways for the conversion of parent polymers, such as cellulose, hemicellulose, and lignin, into substances such as xylose, glucose, HMF, lactic acid, and formic acid [8]. However, the presence of these species is heavily condition-dependent, as observed for monomeric sugars, which show significant degradation with increasing reaction temperatures, particularly above 225 °C [8].
The carbon-rich aqueous product of HTC has the potential for applications such as the recovery of sugars, biogas production, or agricultural biostimulants; however, in reality, it has found very limited use in comparison to solid hydrochar. The large volume of the process water retained in the aqueous-phase product is a key reason for this limitation in research [9]. Additionally, the scalability of the coal-like hydrochar into industrial landscapes is also hindered due to the large volumes of process water required for continuous HTC operation [10]. While reuse of process water in the HTC process has therefore gained attention in multiple studies, a technique that effectively utilizes the potential of the aqueous phase product as a precursor for fuel and a recoverable water source has yet to be established [7,11,12]. The lack of research in this area makes the greater use of HTC asymmetric from a water reuse standpoint.
In this study, an attempt to address this research gap was made by employing a low-energy process, direct-contact membrane distillation (DCMD), to concentrate the dilute aqueous-phase product of HTC and convert it into a sugar-rich resource from the process waste, while simultaneously recovering water. This water recovery makes the process more symmetric. DCMD uses relatively low temperatures, does not require a vacuum, and is faster than evaporation using outdoor solar. This approach is intended to enhance the possibility of applying HTC in industries for treating secondary agricultural biomass, largely reducing by-product formation and attaining symmetry in a more circular economic system. DCMD relies on a vapor pressure difference across a hydrophobic membrane driven by an applied temperature gradient, enabling the rejection of non-volatile solutes such as sugars and organic acids. It has previously been used for desalination studies but, to the best of our knowledge, it has not yet been applied to examine the efficacy of concentrating the aqueous-phase product of HTC under different feed temperatures and the resulting permeate flux trends over prolonged time periods, making this study novel [13,14]. Unlike other widely used separation processes such as RO (reverse osmosis), DCMD performance is not as hindered by a decrease in the osmotic pressure of the feed solution (as concentration progresses) or by the drying of the membrane [15,16]. Additionally, it is also known to have the least fouling susceptibility in comparison to other membrane separation technologies, making it a suitable choice for this study [17].
We have systematically evaluated DCMD performance on a real aqueous-phase liquid derived from the HTC of rice husks at 200 °C. The liquid product resulting from HTC is known to mostly contain organic acids (such as formic acid, acetic acid, and lactic acid) and sugars (e.g., glucose, galactose, and mannose), which have the potential to affect the performance of treatment processes conducted on it [8]. The recalcitrant structure of rice husks is known to break down at this HTC reaction temperature, releasing monosaccharides such as glucose, xylose, galactose, and arabinose in the product solution [13]. After DCMD, performance metrics were evaluated, including average overall water flux, incremental flux, water recovery, and specific energy consumption per unit water volume produced, to show the efficacy of DCMD in concentrating the feed liquid and separating water. The sugars xylose and glucose were chosen for quantification in the scope of this study, as they have been found to be present in the most significant concentrations in the HTC liquid product from rice husks and have potential for fermentation [13]. Concentration factors for the sugars xylose and glucose were also quantified to assess the technical feasibility of integrating DCMD with HTC for comprehensive biomass valorization within a circular bioeconomy framework. This atypical take on HTC process water research may improve the knowledge of those attempting to scale up HTC to more sustainable levels using renewable waste by-products from food production.
2. Materials and Methods
2.1. Materials
The biomass chosen for the scope of this study was rice husks, acquired from Falcon Rice Mill Inc. (Crowley, LA, USA). Rice husks were sieved through a series of ASTM E11-compliant test sieves (Nos. 14, 20, 25, 40, and 80) from Gilson Company Inc. (Lewis Center, OH, USA) for aggregate particle size separation. The rice husks passing through No. 14 and retained on No. 20 (1.4 to 0.85 mm) were selected based on their optimal sizing for the HTC reaction. The solvent used to prepare the biomass for HTC was deionized (DI) water. The HTC feed solution was prepared by taking a 1:10 ratio of biomass/DI water, using 100 g of rice husks and 1000 mL of DI water for each HTC experiment. Nylon membrane discs with a pore size of 0.45 μm were purchased from Foxx Life Sciences (Salem, NH, USA). PTFE (polytetrafluoroethylene) and PVDF (polyvinylidene fluoride) filters were purchased for the DCMD process.
2.2. HTC Experiments
HTC experiments were conducted in a Parr reactor (Parr Instrument Company, Moline, IL, USA) to obtain a sugar-laden solution. Temperature and residence time optimizations were carried out prior to final experimental runs to establish the process conditions that yielded the maximum mass of liquid product. Standard conditions were fixed, keeping the temperature at 200 °C and setting a residence time of 15 min for each batch of experiments. Following HTC treatment, the product solution was allowed to reach room temperature through quenching. The solids were separated from the product solution using a vacuum filtration unit setup. The weight of the solid hydrochar before and after drying at 105 °C for 24 h was recorded. The weight of the liquid collected, its pH, and its conductivity values were also measured and recorded.
2.3. DCMD Experiments
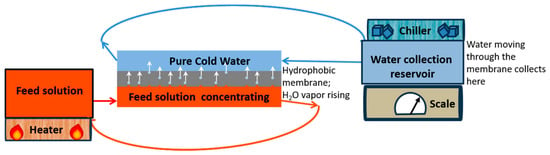
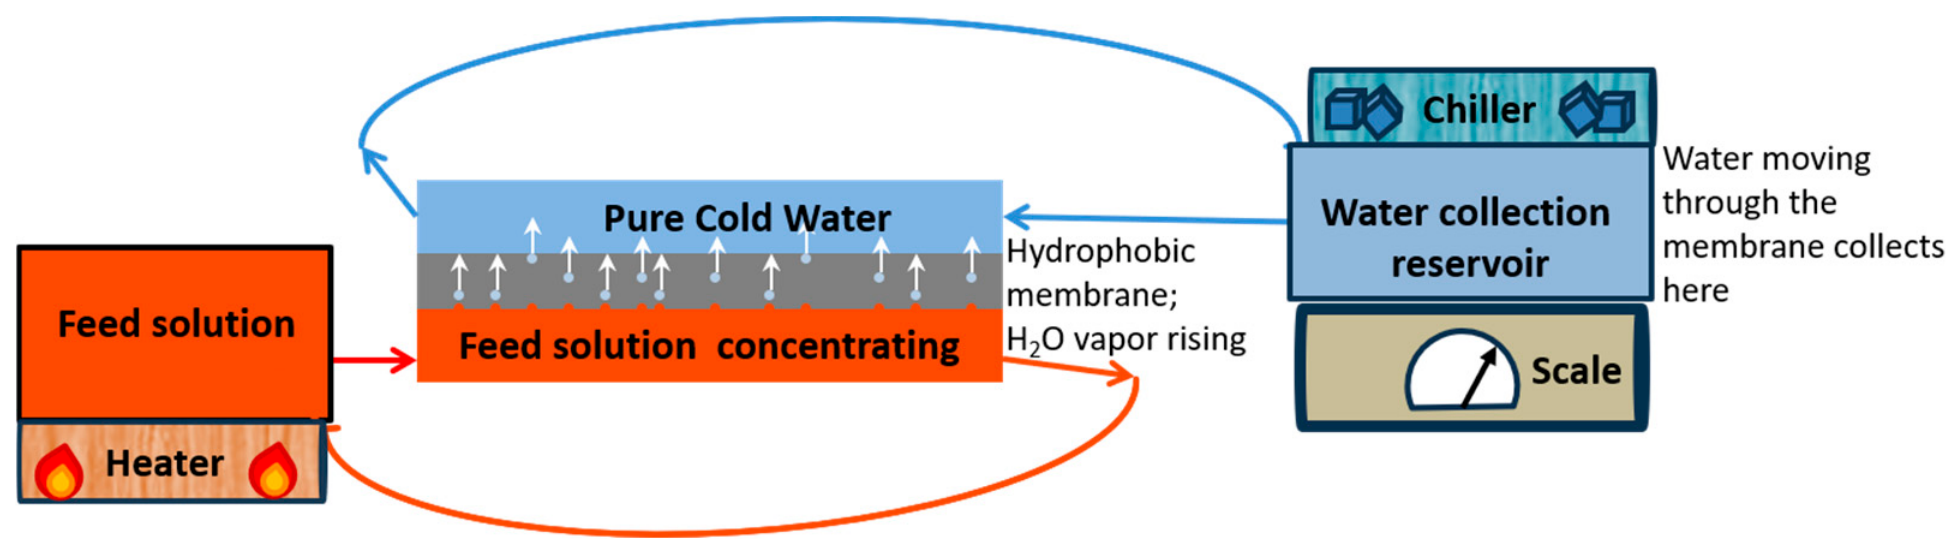
The crossflow membrane flux in the DCMD experiments conducted was measured using a bench scale in a DCMD test cell (S/N: 24595 unit, Sterlitech Corporation, Auburn, WA, USA). The membrane used for DCMD experiments consisted of a laminated flat-sheet polytetrafluoroethylene (PTFE) with spacers (PTFE Flat Sheet Membrane, Sepa, with CF (crossflow) Medium Foulant Spacer, PP (Polypropylene), Sterlitech, Kent, WA, USA). This membrane was chosen as it has been found to be successful in other DCMD studies [18]. The PTFE membrane was 145 mm × 97 mm, with a thickness of 64–127 µm, a surface coverage area of 0.014 m2, and a pore size of 0.45 µm. The contact angle was approximately 110° [19]. Fluid flow across the membrane was achieved using a Masterflex L/S Easy-Load II 77200–50 peristaltic pump system from Cole-Parmer Instrument Company (Vernon Hills, IL, USA). The temperature of the feed solution (HTC liquor) was maintained at either 50 °C, 65 °C, or 80 °C, and the temperature of the collector solution (water) was maintained at 0 °C. These experiments were conducted in triplicate for each set of DCMD experiments with a different temperature difference, over a total duration of 12 h. Little liquid remained after 12 h of the batch process, so longer durations were not investigated. The temperature gradients were regulated using a hot-water bath (VWR Scientific, model 1130A, Radnor, PA, USA) and a digital temperature controller containing a cold-water bath solution (model 9510, PolyScience, Niles, IL, USA). A 1000 mL feed solution was used for the feed side, and 200 mL of distilled water was used initially on the collector side in a 1 L collector reservoir. During the experiments, the feed and collector solution streams were continuously circulated across the surface of the membrane using tubes connecting them to the feed and collector reservoirs, while two peristaltic pumps were used to maintain a flow of 0.2 L/min. Water on the collection side was generated by water vapor crossing the membrane and increasing the volume of water in the collector reservoir. The collector flask with the water it contained was weighed at the beginning, 4 h after the start of DCMD, 8 h after the start of DCMD, and at 12 h for each DCMD experiment to find the mass of water generated by the process. A sample size of 50 mL of liquid from the feed side was taken at the beginning of the process and at 4 h, 8 h, and 12 h after the start of the DCMD process in order to assess the pH at room temperature (25 °C), conductivity, and the concentration of monosaccharides. The pH of these 50 mL samples was measured with an Orion Star A111 pH meter (Thermo Scientific, Waltham, MA, USA), and the conductivity was measured using an Ohaus Model ST20C-B conductivity meter (Parsippany, NJ, USA). The 50 mL samples and the water in the collector reservoir were stored at −18 °C prior to analysis using high-performance liquid chromatography (HPLC). A schematic of the DCMD process is shown in Figure 1.
Figure 1.
Schematic of the DCMD setup with two countercurrent streams separated by a hydrophobic membrane. Arrows show fluid movement except for the scale, which indicates mass.
The accumulation of water on the distillate side was a critical indication of the efficacy of the DCMD process, which was measured by the overall average flux of water, Jw:
where Jw is the flux of water in L/m2·h, V1 and V2 are the volumes of water in liters collected in the flask on the distillate side at time t1 and t2 (in hours), respectively, and Am is the working area of the membrane [20]. The incremental flux for the volume of water collected on the distillate side every four hours for twelve hours was also calculated using Equation (1).
Jw = (V1 − V2)/(Am(t1 − t2))
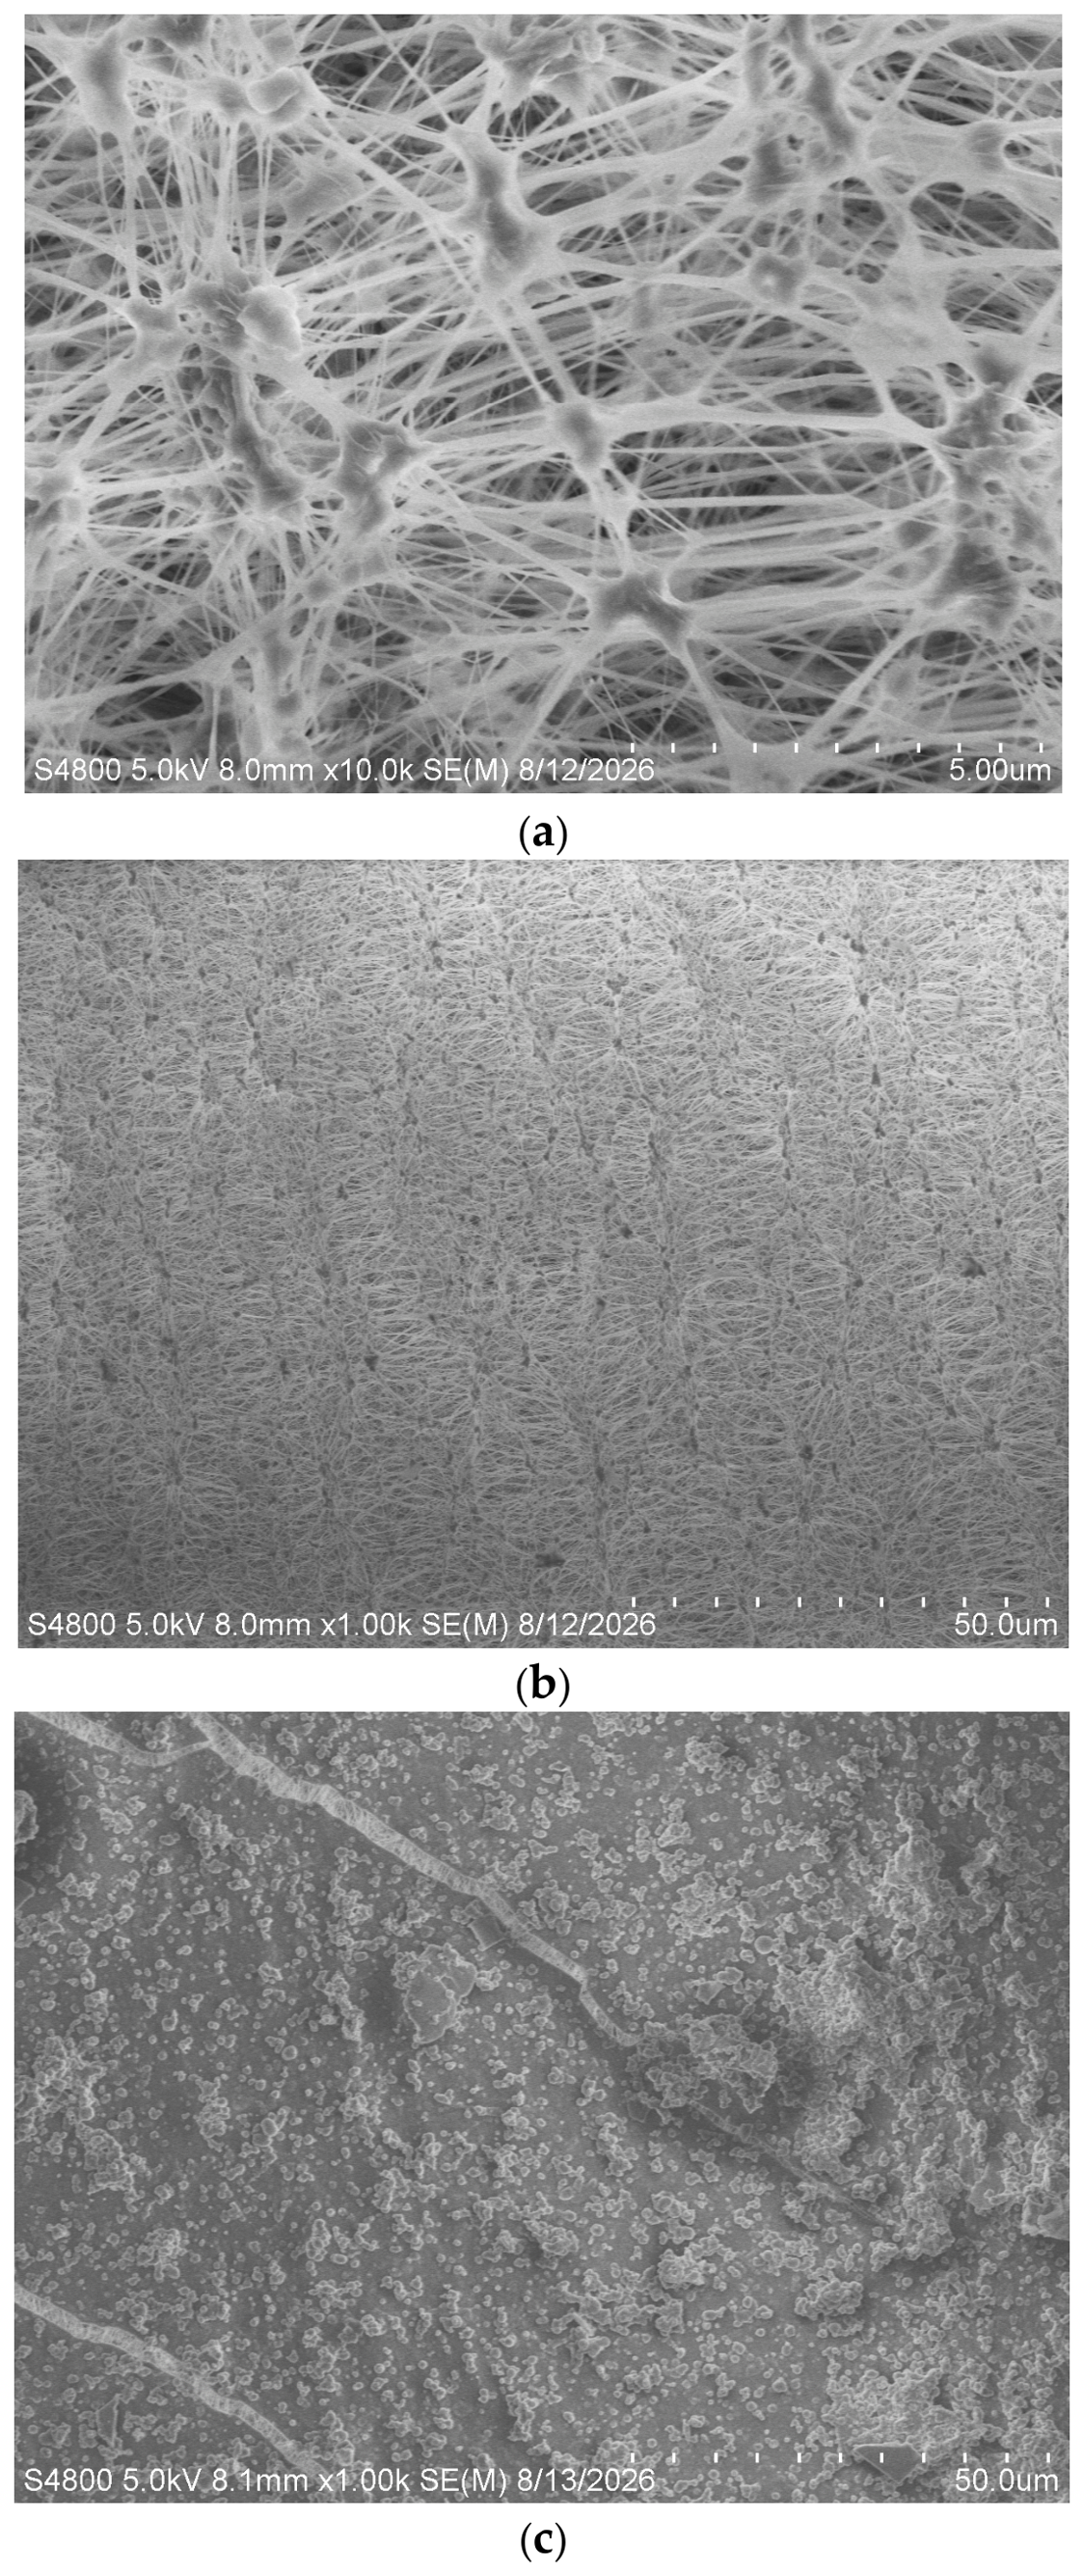
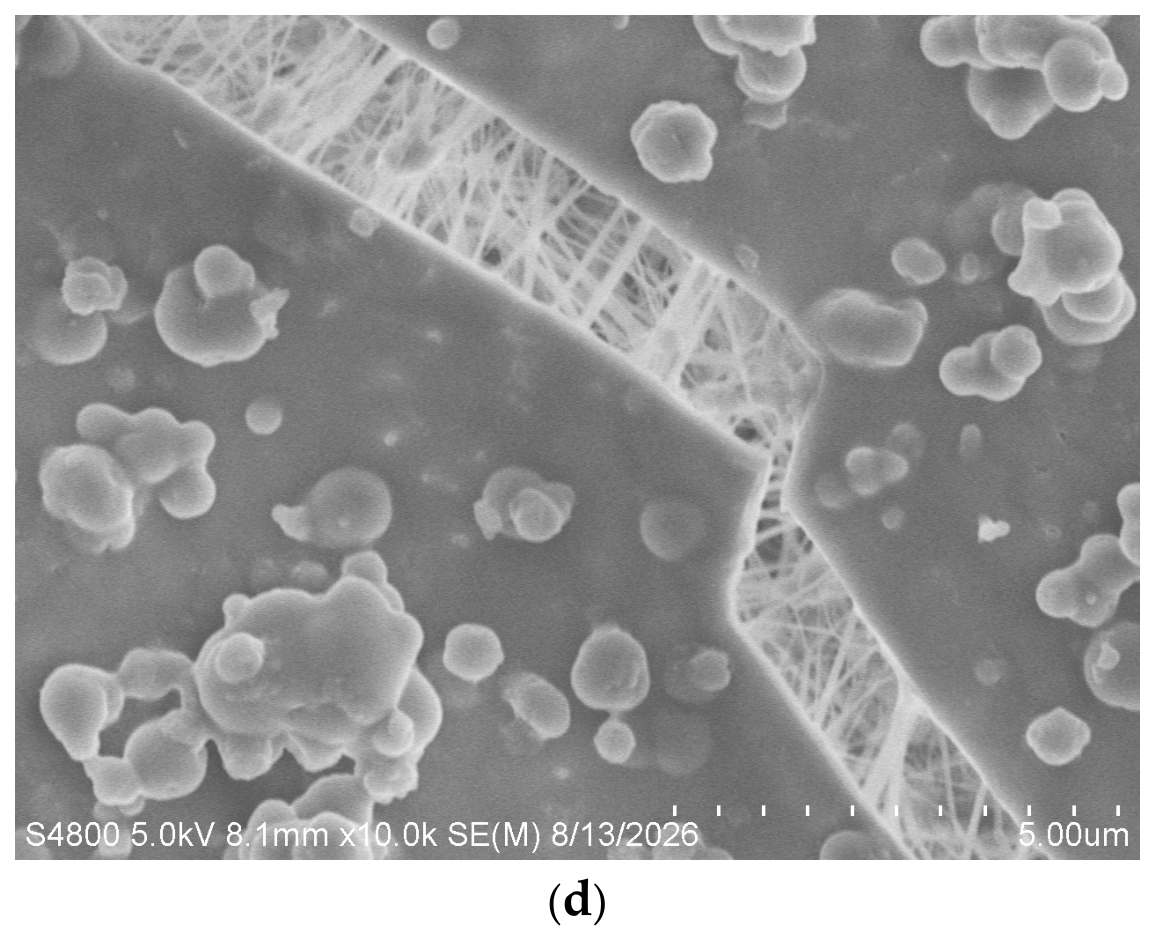
The PTFE membranes used for DCMD were examined using scanning electron microscopy (SEM) in the original and fouled conditions. The SEM technique was employed to observe evidence of fouling by organic species present in the HTC liquid on the membranes. Samples were sputter-coated with gold to ensure conductivity and imaged using a Bruker S-4800 SEM (Billerica, MA, USA) at an accelerating voltage of 5 kV with magnification of 1000–10,000 times for PTFE membranes in fouled and original conditions. Potential sources of experimental uncertainty include the areas chosen for SEM.
Energy-dispersive X-ray spectroscopy (EDS) was performed on the PTFE membranes along with SEM to compare the elemental composition of the pristine PTFE membrane and the morphological changes incurred after 12 h of DCMD operation. EDS spectra were acquired at a primary electron-beam energy of 10 kV and a take-off angle of 35° using the Bruker ESPRIT 2.0 system (Bruker Nano GmbH, Berlin, Germany). The analysis was used to identify changes in surface elemental composition and the presence of deposits following exposure to the HTC process liquid.
2.4. High-Performance Liquid Chromatography (HPLC)
The concentrated liquid obtained after treating the liquid product from HTC with DCMD was analyzed using HPLC to evaluate the effect of the secondary treatment and quantify the estimated increase in the concentration of monosaccharides in the solution. The HPLC instrument (Dionex UltiMate WPS-3000 UHPLC+ Series, ThermoFisher Scientific, Waltham, MA, USA) was equipped with a refractive index detector and a reversed-phase HyperREZ XP Carbohydrate Ca2+ separation column (300 mm × 7.7 mm, 8 µm particle size, ThermoFisher Scientific, Waltham, MA, USA). During the HPLC analysis, the column temperature was kept constant at 80 °C; the flow rate of the mobile-phase ultra-pure deionized water was 0.6 mL/min; and the volume injected for each sample was 20 µL. Calibration curves were obtained for both the monosaccharides glucose and xylose, over the range of concentrations from 50 ppm to 5000 ppm with R2 values of 0.99, prior to running solutions of the samples from the experiments in the column. The samples for HPLC analysis were prepared by first neutralizing them with CaCO3 to attain the acceptable pH range for the column of 5–9, from the initial sample range of pH 3.8–4.2, followed by filtering with 0.45 µm PTFE syringe filters (Simsii, Inc., 1268 Westridge Way NE, Issaquah, WA 98029, USA).
3. Results and Discussion
3.1. Ionic Conductivity
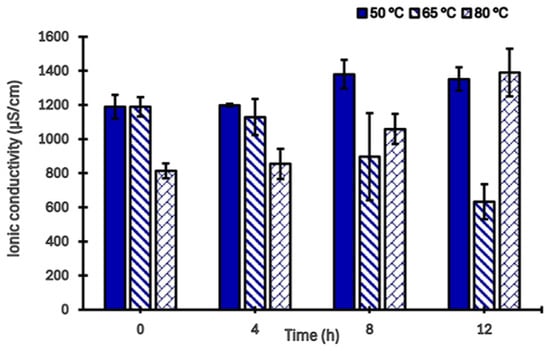
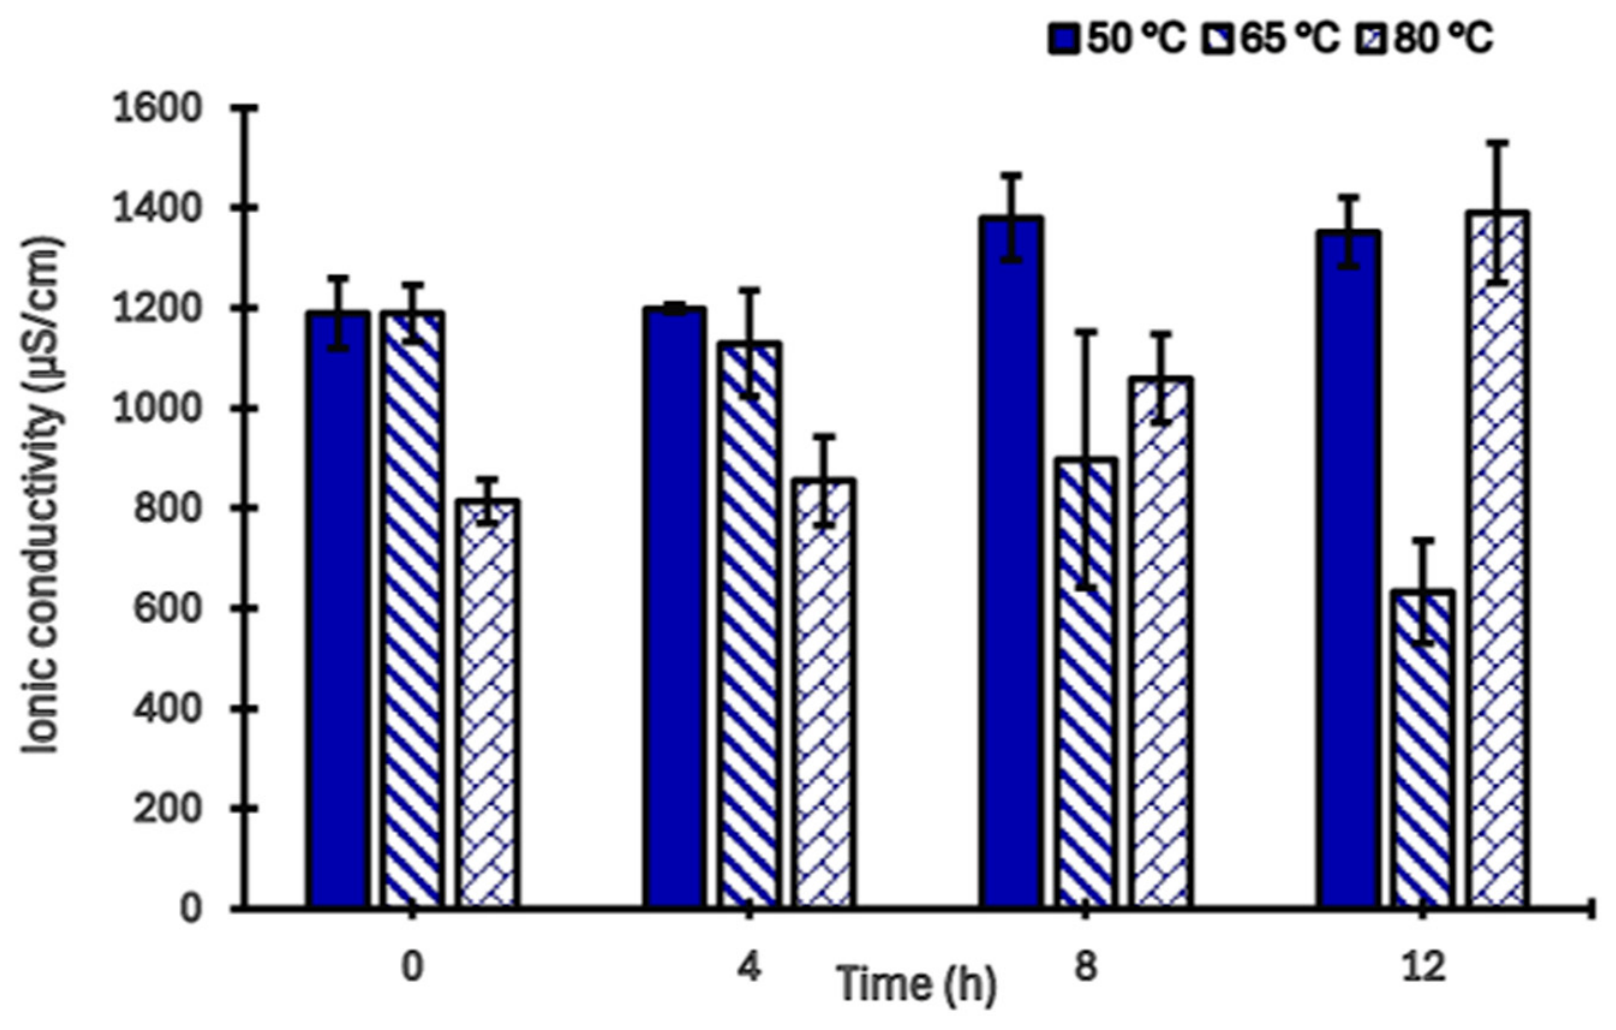
Figure 2 and Table S1 show the ionic conductivity of the feed-side samples as a function of time. Ionic conductivity has been shown to be a lumped indicator of the presence of commonly found organic species that generate ions in dissolved form, such as furfural, in the HTC liquor of biomass [21]. Therefore, the changes in ionic conductivity values in this process can be used to validate the accumulation of ionic species in the samples and thus the effective concentration of the liquid. Samples were collected during DCMD at time 0, 4, 8, and 12 h for feed temperatures of 50, 65, and 80 °C. Data points represent mean values across the triplicate experiments, and error bars indicate the standard error of the mean.
Figure 2.
Trend in the ionic conductivity of feed-side samples.
DCMD experiments conducted with a temperature difference of 50 °C showed a gradual increase in conductivity with time, starting from a mean value of 1189 µS/cm at 0 h and eventually reaching 1351 µS/cm at 12 h. The samples taken from DCMD conducted with a temperature difference of 65 °C initially had the same mean ionic conductivity as experiments with a temperature difference of 50 °C but depicted a decreasing trend over time. The samples exhibit relatively higher error bars, indicating higher fluctuations in conductivity for the set of experiments with a feed temperature of 65 °C. The mean ionic conductivity of the liquid on the feed side at 80 °C was 814 µS/cm at 0 h, which increased consistently over time and reached a final value of 1390 µS/cm at 12 h. The data obtained align with the theory that the feed temperature of the DCMD significantly influences the effective concentration of liquid in the feed side, with higher feed temperatures causing increased permeate flux and effective concentrations for the same experimental duration [22]. The composition of the feed solution used includes a mixture of compounds from HTC treatment, some of which can lower the surface tension or adsorb onto the hydrophobic membrane surface [23]. Adsorption of these surface-active compounds on the membrane can cause the membrane’s hydrophobicity to be reduced, as well as lowering its liquid entry pressure (LEP), which can ultimately lead to pore wetting [24].
Pore wetting causes liquid pathways to form inside the pores, allowing the transport of ionic species into the permeate, which can become the dominant mass transfer mechanism over vapor flux, leading to a decrease in ionic conductivity on the feed side over time. This could be a possible reason for the trend in results from samples of DCMD experiments with feed temperatures of 65 °C. When the feed side is maintained at 50 °C, the surface tension of the liquid is the highest compared to the liquid on the feed side of DCMD conducted at 65 °C and 80 °C, as organic liquids tend to exhibit a higher surface tension at lower temperatures [25]. As a result, the LEP, which is directly proportional to the surface tension of the liquid, is also higher at a feed temperature of 50 °C, thereby presenting conditions that allow for minimal chances of pore wetting and consequent ion leakage. This explains the increasing trend in ionic conductivity over time observed when feed temperatures were kept constant at 50 °C. The highest ionic conductivity was obtained for samples from DCMD conducted with a temperature difference of 80 °C between the feed and collector sides after a time of 12 h. At this temperature, the water vapor flux is considerably higher and evidently dominates over other mechanisms such as ion leakage, therefore giving the most effective performance for the DCMD on the biomass-derived HTC liquid product. This also corroborates the similar trends depicted in multiple studies on DCMD [26,27].
3.2. pH Values of HTC and DCMD Samples
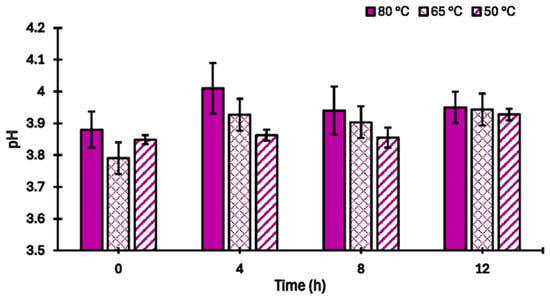
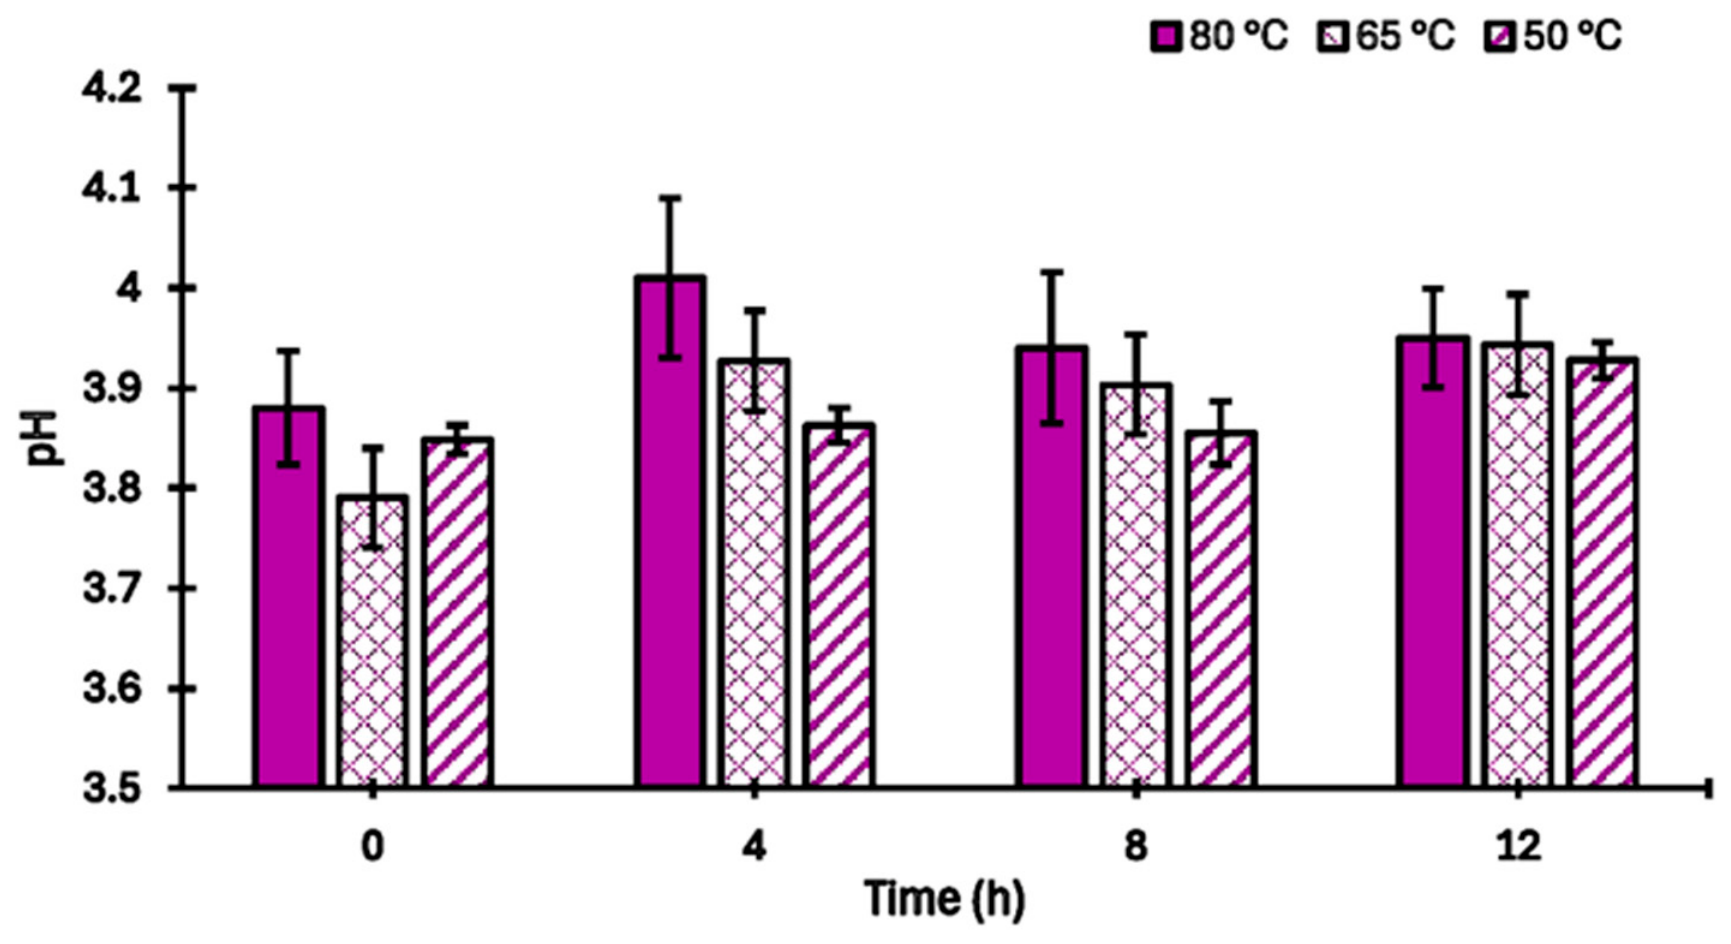
The changes in pH values of the liquid from the feed side of the DCMD conducted at feed temperatures of 50 °C, 65 °C, and 80 °C over the twelve hours of operation are shown in Figure 3 and in detail in Table S2. Samples were taken from the feed solution of DCMD conducted in triplicate at feed temperatures of 50 °C, 65 °C, and 80 °C at 0, 4, 8, and 12 h. Data points represent mean values across samples from the triplicate experiments, and error bars indicate the standard error of the mean. The samples taken at 0 h consisted of the raw HTC liquor and had a mean acidic pH of 3.79, which is consistent with the pH value of 3.59 for HTC liquor obtained from rice husks at 200 °C by Nakason et al. [28]. At this HTC temperature, the liquor is known to contain a relatively high concentration of acetic acid, among other organic species formed through the hydrolysis of hemicellulose, which contributes to the observed low pH [28]. For all DCMD experiments, the pH values increased by negligible amounts over time, showing occasional fluctuations. The error bars on the values for the experiments overlap, indicating that the effect of temperature is negligible on the pH values of the samples and suggesting that no major changes in chemical composition occurred due to DCMD.
Figure 3.
Average pH values of samples taken from the DCMD feed solution.
3.3. HTC Performance Analysis
The effect of HTC on biomass varies significantly with temperature, time, and the type of biomass [5,29]. As seen in the literature, lower residence times and reaction temperatures below 225 °C yield higher concentrations of soluble sugars in the liquid product, whereas higher temperatures and greater residence times subject the sugars to degradation and consequently increase the energy densification of the solid hydrochar product [8]. On the other hand, for rice husks, reaction temperatures as low as 180 °C result in relatively lower yields of sugars compared to HTC conducted at 200 °C [5]. The maximum yields obtained from the HTC experiments conducted in this study at 200 °C were averaged to obtain values of 2.02 g for glucose and 6.60 g for xylose per 100 g of rice husks. These yields are in the same order as those reported for similar HTC experiments, showing glucose and xylose to be the primary detectable monosaccharides extracted [13]. The concentration of xylose obtained was higher than glucose, following similar trends exhibited in previous studies. This can be explained by the fact that only the amorphous sections of the precursor polymer for glucose, cellulose, are hydrolyzed at 200 °C, while the crystalline section remains intact [30]. The most predominant component of rice husks, cellulose, hydrolyzes to glucose, and the hemicellulose present in them hydrolyzes to release xylose when the recalcitrant silica in the structure of the rice husks is successfully penetrated by water during HTC at 200 °C [13,31].
3.4. DCMD Performance Analysis
Previous research on DCMD suggests that if the permeate (cold water) inlet temperature is decreased, it will result in a higher transmembrane vapor pressure and thus higher permeate flux, until decreasing the permeate temperature further results in no further change [22]. Conversely, if the feed inlet temperature is increased, the vapor pressure of the feed solution increases exponentially, resulting in the driving force of the process—the transmembrane vapor pressure—increasing as well, as described by the Antoine equation (Equation (2)) [32,33].
where p is the vapor pressure, T is the temperature, and A, B, and C are component-specific constants.
Log10(p) = A − B/(C + T)
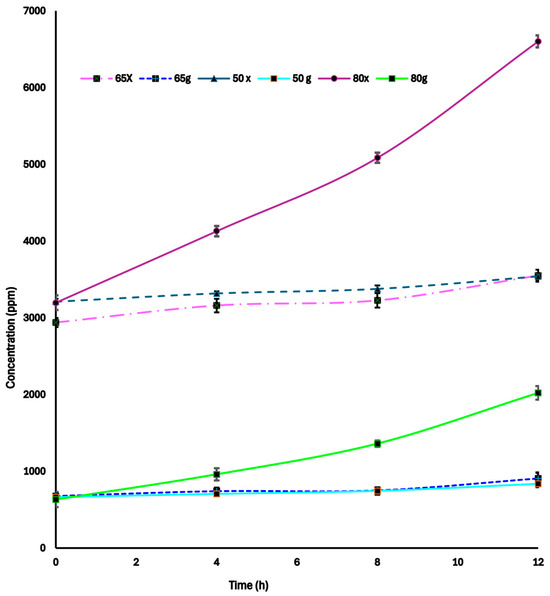
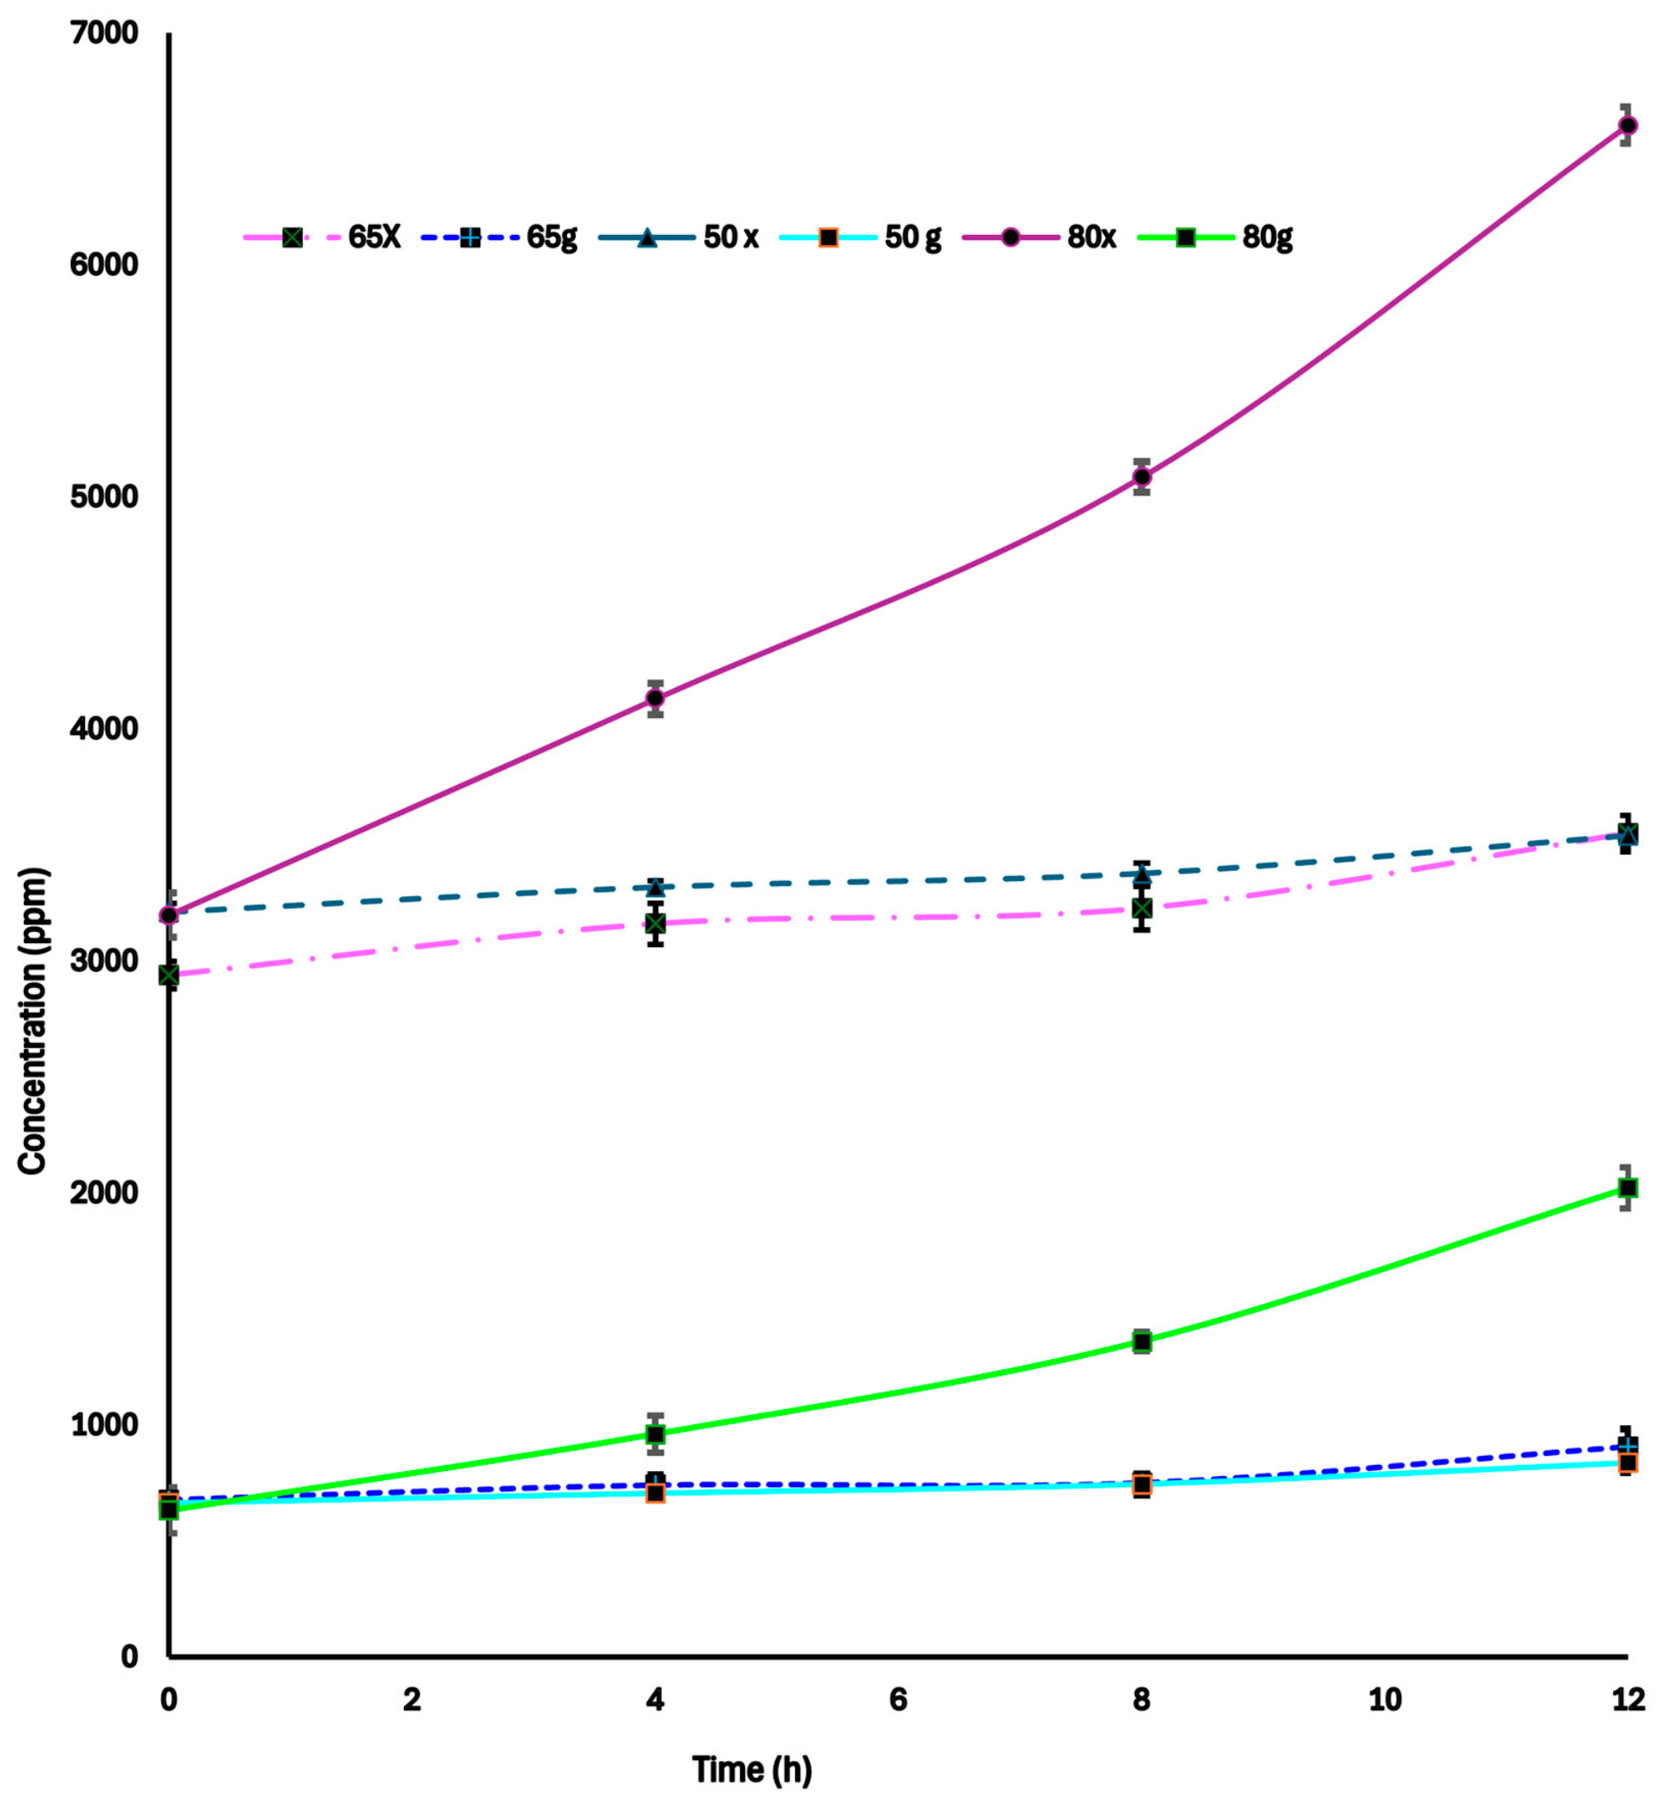
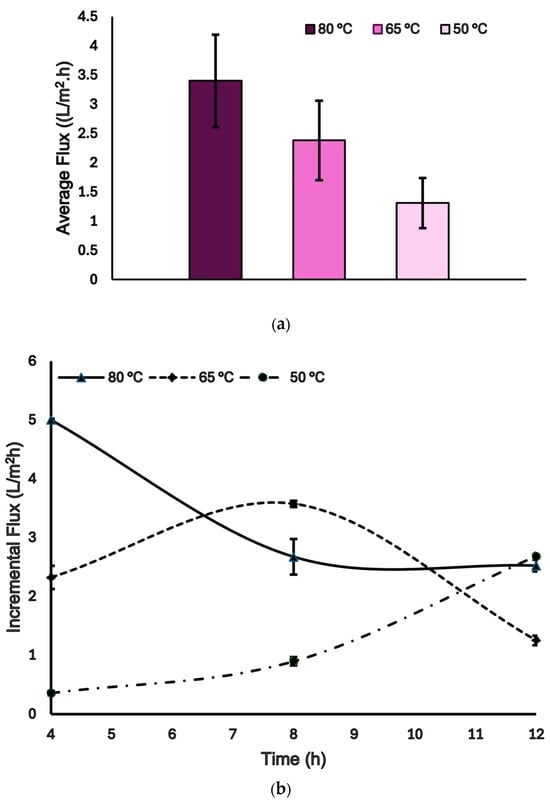
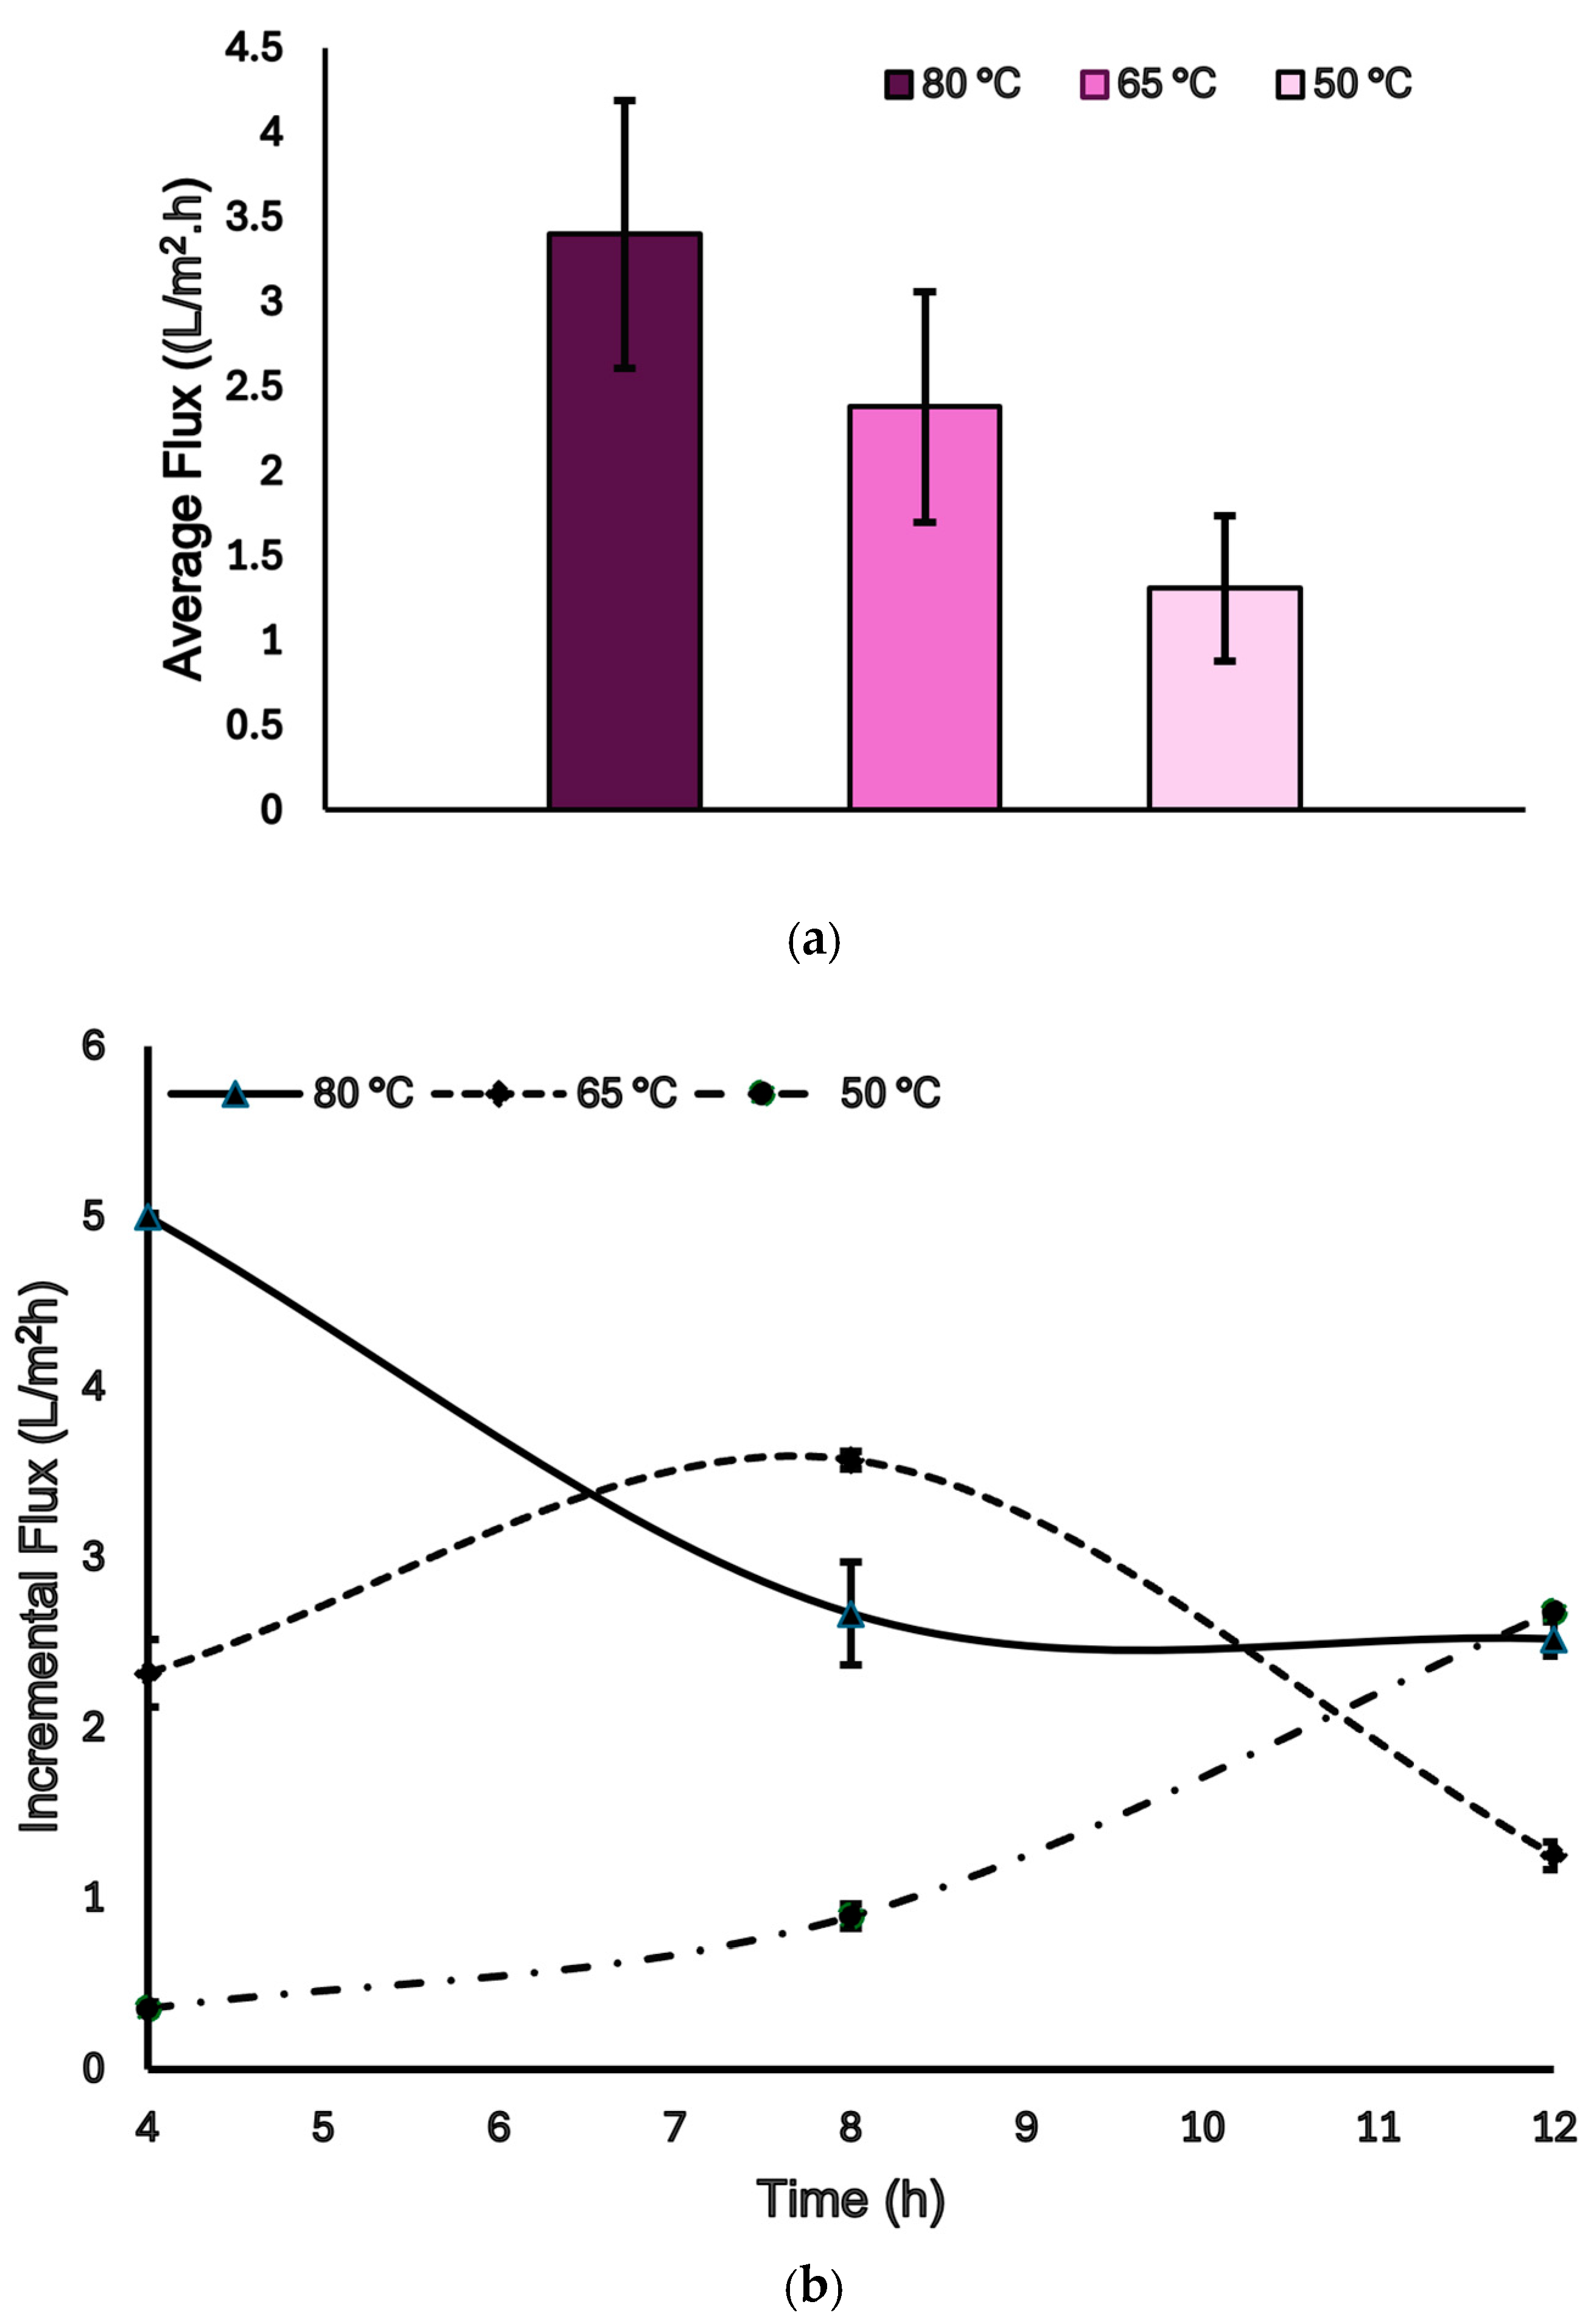
For this study, DCMD performance parameters, such as the permeate flux and concentration factor of fermentable sugars in the feed, were calculated to illustrate the effects of the resulting differences in driving force. Samples were analyzed in triplicate for feed temperatures of 50 °C, 65 °C, and 80 °C, respectively, at 0, 4, 8, and 12 h. Individual data points represent mean values in samples from the triplicate experiments, and error bars indicate the standard error of the mean. Water recovery was calculated by taking the total mass of permeate collected compared to the total mass of feed used, as a percentage, for each DCMD experiment. It is apparent in both Figure 4 and Table 1 that the process reached higher values for water recovery and fermentable sugar concentrations when the feed temperature was maintained at 80 °C, in comparison to feed temperatures of 65 °C and 50 °C. This temperature allows for more symmetry in water and sugar reuse. The exponential increase in vapor pressure with temperature explains these large differences in these values [32]. The concentration factor of the feed thus also increased notably, from 1.1 times for xylose and 1.26 times for glucose, for a temperature difference of 50 °C between the feed side and the distillate side, to 2.06 and 3.20 times, respectively, for a temperature difference of 80 °C. The average flux of water vapor for the total duration of the DCMD experiments was also noted to increase for higher feed temperatures, attaining a value of 1.31 L/m2 h for a temperature difference of 50 °C and 2.38 L/m2 h and 3.4 L/m2 h for temperature differences of 65 °C and 80 °C, respectively, as noted in Figure 5a. The specific energy consumption (SEC) values for these DCMD experiments relied on the permeate flux achieved and the feed temperatures. For a feed temperature of 50 °C, an SEC value of 28,879 kWh/m3 was found; for 65 °C, it was 22,589 kWh/m3; and for 80 °C, it was 159,937 kWh/m3, as shown in Table 2. This indicates that increasing the feed temperature enhanced the transmembrane driving force and permeate production, consequently resulting in a decreased energy demand per unit of permeate recovered, but only for lower temperatures. At 80 °C, the increased thermal energy requirement offset the effects of greater permeate production, resulting in a substantially higher SEC. This trend in energy efficiency observed can be important in the design of similar-scale DCMD experiments. SEC values in various studies on DCMD range from as low as 1 kWh/m3 to a high of 9000 kWh/m3, depending on several factors such as flow rate, feed temperature, the type of membrane, and equipment type [34,35,36]. Although the energy consumption of DCMD for the treatment of HTC process liquor is significantly higher than that reported for other membrane separation processes such as RO (3–10 kWh/m3) and vapor compression (7–19 kWh/m3), DCMD is more suitable for this application due to the several other advantages that it offers [35,36]. Improvements to the DCMD setup in this study, such as the use of an enclosed and thermally insulated water bath and a heat recovery loop, could substantially reduce heat losses to the surroundings and consequently decrease specific energy consumption, a prospect worthy of exploration in future studies.
Figure 4.
Concentration of the sugars xylose and glucose (ppm) in the DCMD feed solution.
Table 1.
Average flux of water and fermentable sugar concentration factors.
Figure 5.
(a) Average flux over 12 h for DCMD. (b) Incremental flux (flux accumulated during each 4 h of operation) for DCMD as a function of the 4 h time period.
Table 2.
Specific energy consumed (SEC) and percentage water recovery for DCMD experiments.
As observed in Figure 5b, for a feed temperature of 80 °C, the incremental flux decreases after the first 4 h until the end of the experiment. For a feed temperature of 50 °C, the incremental flux continued to increase throughout the 12 h period. The decrease in the incremental flux values of experiments conducted at feed temperatures of 80 °C and 65 °C, respectively, can be explained by temperature polarization, a phenomenon that occurs at high temperatures as more water vaporizes across the membrane, causing cooling effects from evaporation on the membrane interface. This lowers the feed temperature near the membrane interface and causes its temperature to vary from the bulk feed temperature, causing a decrease in driving force and consequently a decrease in permeate flux. Temperature polarization is known to be a major contributor to flux decreases in membrane distillation operations, causing a drop of up to 50–80% in flux values [29]. This effect is more evident for the 65 °C and 80 °C feed temperatures, thus indicating a possible dependence of flux on temperature. However, it is not apparent for 50 °C because of the lower vapor flux and consequent reduced simultaneous heat and mass transfer. These results are similar to frequently reported trends across studies on membrane distillation, in which temperature polarization is found to increase with increasing feed temperatures [22,32]. Francis et al. reported an initial flux decline followed by stabilization during DCMD of seawater, attributed to the establishment of steady thermal operating conditions, similar to the rise in incremental flux values observed in Figure 5b for all feed temperatures, where the interval flux increases between 4 and 8 h of operation [33]. However, after 8 h, there is a drop in incremental flux for both 80 °C and 65 °C due to the possible formation of a concentration boundary layer near the membrane surface from the accumulation of non-volatile species (such as sugars in the feed), leading to concentration polarization taking effect. At elevated temperatures and high water recovery, this locally increased solute concentration reduces the activity and vapor pressure of water at the membrane interface, thereby decreasing the effective transmembrane driving force and limiting further increases in permeate flux [37]. Interestingly, the key finding in these data dictates that the highest overall average permeate flux was obtained for a feed temperature of 80 °C, with minimum fluctuations in flux over time (and incremental flux values). This means that, at higher temperatures, the effects of temperature polarization and concentration polarization, while still present, have minimal influence on the high driving force incurred due to vapor flux at this temperature, allowing DCMD to reach optimum performance levels in terms of water recovery.
The water obtained through DCMD after 12 h of operation was found to have an ionic conductivity of 150.1 µS/cm, higher than the ionic conductivity of deionized water (which was originally used to prepare the samples for this study), measured as 76.4 µS/cm, but lower than tap water at 170.3 µS/cm. Future work should include more continuous operation. Additionally, as Figures S1–S3 reveal, other than a recurrent single peak, no other peaks were found in the HPLC chromatograms of the distillate samples obtained at feed temperatures of 80, 65, and 50 °C, demonstrating that the levels of the sugars xylose and glucose were lower than the detection limits of the HPLC Chromeleon software, as well as the near-complete rejection of these sugars by the membrane. The presence of other organic species, such as organic acids, intermediate compounds such as furan derivatives, or disaccharides, has not been verified in the permeate. Future work using other tests, such as total organic carbon analysis, should confirm the absence of other organic species.
3.5. SEM and EDS Analysis on DCMD Membranes
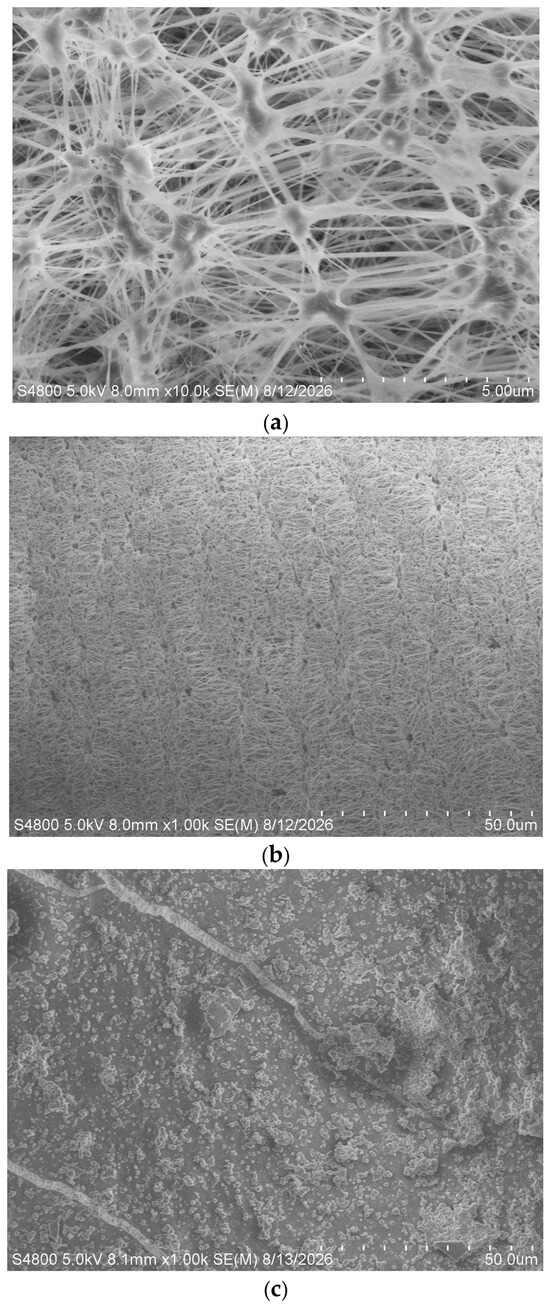
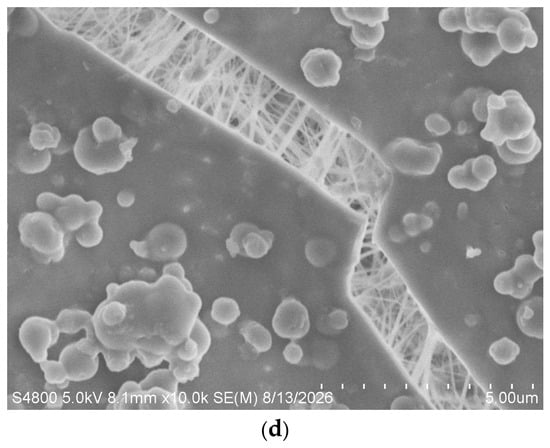
With any membrane-based separation, fouling can affect the effectiveness and surface of the membrane. The SEM micrographs in Figure 6 show the surface morphology of the pristine PTFE membrane and the changes incurred following 12 h of DCMD operation. Figure 6a shows the characteristic porous morphology of pristine PTFE at 10,000x magnification, including interconnected fibrils and nodes and visible irregular interstitial spaces forming pores. At 1000x magnification in Figure 6b, the continuous fibrillar polymeric network across the entire section of the membrane is apparent before use. Following 12 h of DCMD operation, distinct changes in the surface morphology of the same PTFE membrane are observed, as irregular deposits of the organic species appear to conceal the polymeric network, as shown in Figure 6c at 1000x magnification. At 10,000x magnification, Figure 6d shows the organic deposits on the membrane, distributed across the membrane surface in a heterogeneous pattern, indicating the development of a significant layer of fouling during the DCMD operation.
Figure 6.
(a) Pristine membrane at 10,000x magnification. (b) Pristine PTFE membrane at a magnification of 1000x. (c) The same PTFE membrane as in (a) after 12 h of DCMD operation at 1000x magnification. (d) The PTFE membrane after 12 h of DCMD operation, at 10,000x magnification.
These morphological changes in the PTFE membrane were further validated by the EDS elemental analysis conducted, as given in Table 3. The pristine PTFE membrane was composed of fluorine and carbon as the major constituents, with only a minor fraction of oxygen present in its structure. However, upon being subjected to DCMD for 12 h, the elemental composition shifted significantly, while the percentage of fluorine by weight decreased simultaneously. This confirms the formation of a coating of organic foulants on the membrane that is able to cover a considerable area of the PTFE membrane and hence affect its performance.
Table 3.
Elemental composition (wt%) of pristine membranes and membranes fouled by organic species from the HTC liquid after 12 h of DCMD operation.
Further research is needed to investigate a method to reduce and mitigate fouling on membranes used to separate water and concentrate the HTC process liquid for subsequent uses. The utility of employing a waste biomass product to yield the fuel needed to produce more agricultural crops is evident.
4. Conclusions
This study evaluated the technical feasibility of HTC with DCMD for the simultaneous concentration of biomass-derived aqueous products and recovery of water within a circular bioeconomy framework. The advantage of these combined processes is that they make the use of by-products from food production more symmetric in the environment, compared to their disposal by landfilling or open-field burning. HTC of rice husks at 200 °C successfully generated an aqueous-phase product primarily containing the fermentable sugars xylose and glucose. The aqueous phase was subsequently concentrated through DCMD using varying feed temperatures. The DCMD system performance exhibited a strong dependence on temperature, with higher feed temperatures producing substantially greater permeate flux, water recovery, and concentration factors of fermentable sugars due to an enhanced transmembrane vapor pressure driving force. The feed temperature of 80 °C yielded the highest average permeate flux and the greatest concentration factors for both xylose and glucose; however, it also had the highest specific energy consumption among the investigated conditions for DCMD. The trend of incremental flux over prolonged operation further suggests the simultaneous influence of temperature polarization and concentration polarization mechanisms on membrane performance. In addition, pH and ionic conductivity analyses indicate effective concentration of dissolved species in the feed solution with minimal alteration of the overall chemical characteristics of the HTC liquor during DCMD. Collectively, these findings highlight the potential of coupling HTC with DCMD as a symmetric sustainable strategy for resource recovery and the reduction of process waste, and therefore scalability for industrial applications in valorizing agricultural biomass.
Supplementary Materials
The following supporting information can be downloaded at: https://www.mdpi.com/article/10.3390/sym18111822/s1, Table S1: Ionic conductivities of samples taken from the feed side of DCMD at 0, 4, 8, and 12 h in µS/cm. The ionic conductivity values measured for the three sets of experiments for each feed temperature were averaged to obtain the mean value, and error bars were calculated using the formula for standard error; Table S2: pH of samples taken from the feed side of DCMD at 0, 4, 8, and 12 h. The pH values measured for the three sets of experiments for each feed temperature were averaged to obtain the mean value, and error bars were calculated using the formula for standard error; Figure S1: HPLC chromatogram constructed from raw data in HPLC Chromeleon software for water obtained through DCMD after 12 h, value (µRIU) against time in minutes; Figure S2: HPLC chromatogram constructed from raw data in HPLC Chromeleon software for water obtained through DCMD after 12 h, value (µRIU) against time in minutes; Figure S3: HPLC chromatogram constructed from raw data in HPLC Chromeleon software for water obtained through DCMD after 12 h, value (µRIU) against time in minutes.
Author Contributions
Conceptualization, J.G.L. and Z.F.T.; methodology, Z.F.T., M.T., R.K.B. and S.E.E.; software, Z.F.T.; validation, Z.F.T., M.T., R.K.B. and S.E.E.; formal analysis, Z.F.T.; investigation, Z.F.T., M.T., R.K.B. and S.E.E.; resources, J.G.L.; data curation, Z.F.T.; writing—original draft preparation, Z.F.T.; writing—review and editing, J.G.L., Z.F.T., M.T., R.K.B. and S.E.E.; visualization, J.G.L. and Z.F.T.; supervision, J.G.L.; project administration, J.G.L.; funding acquisition, J.G.L. All authors have read and agreed to the published version of the manuscript.
Funding
This research was funded by NASA LaSPACE (LEQSF(2020-24)-LaSPACE PO-0000280094) and NSF E-RISE RII: Louisiana Bioelectric Fuel Incubator (BEFi) (FAIN 2446177 PO-0000314952).
Data Availability Statement
All relevant data are provided in the article or in the Supporting Information. The raw data supporting the conclusions of this article will be made available by the authors upon request.
Acknowledgments
The authors gratefully acknowledge the help of the Biomass Team undergraduates at Louisiana Tech University.
Conflicts of Interest
The authors declare no conflicts of interest. The funders had no role in the design of the study; in the collection, analyses, or interpretation of data; in the writing of the manuscript; or in the decision to publish the results.
Abbreviations
The following abbreviations are used in this manuscript:
| CF | Crossflow |
| DCMD | Direct-contact membrane distillation |
| DI | Deionized |
| EDS | Energy-dispersive X-ray spectroscopy |
| HMF | Hydroxymethylfurfural |
| HPLC | High-performance liquid chromatography |
| HTC | Hydrothermal carbonization |
| IPCC | Intergovernmental Panel on Climate Change |
| PP | Polypropylene |
| PTFE | Polytetrafluoroethylene |
| PVDF | Polyvinylidene fluoride |
| RIN | Ethanol-equivalent gallon |
| RO | Reverse osmosis |
| SEC | Specific energy consumption |
| SEM | Scanning electron microscopy |
References
- U.S. Environmental Protection Agency. Proposed Renewable Fuel Standards for 2026 and 2027. Available online: https://www.epa.gov/renewable-fuel-standard/proposed-renewable-fuel-standards-2026-and-2027 (accessed on 12 May 2026).
- Masson-Delmotte, V.; Zhai, P.; Pörtner, H.O.; Roberts, D.; Skea, J.; Shukla, P.R.; Pirani, A.; Moufouma-Okia, W.; Péan, C.; Pidcock, R.; et al. Global Warming of 1.5 °C: An IPCC Special Report on the Impacts of Global Warming of 1.5 °C Above Pre-Industrial Levels and Related Global Greenhouse Gas Emission Pathways, in the Context Of Strengthening the Global Response to the Threat of Climate Change, Sustainable Development, and Efforts to Eradicate Poverty; Cambridge University Press: Cambridge, UK, 2022; pp. 1–616. [Google Scholar]
- Lee, H.; Romero, J. IPCC, 2023: Summary for Policymakers; IPCC: Geneva, Switzerland, 2023.
- Kalderis, D.; Kotti, M.S.; Méndez, A.; Gascó, G. Characterization of hydrochars produced by hydrothermal carbonization of rice husk. In Solid Earth; Copernicus Publications: Göttingen, Germany, 2014; pp. 477–483. [Google Scholar]
- Lynam, J.G.; Reza, M.T.; Yan, W.; Vásquez, V.R.; Coronella, C.J. Hydrothermal carbonization of various lignocellulosic biomass. Biomass Convers. Biorefin. 2015, 5, 173–181. [Google Scholar] [CrossRef] [Scilit]
- Zhang, Y.; Jiang, Q.; Xie, W.; Wang, Y.; Kang, J. Effects of temperature, time and acidity of hydrothermal carbonization on the hydrochar properties and nitrogen recovery from corn stover. Biomass Bioenergy 2019, 122, 175–182. [Google Scholar] [CrossRef] [Scilit]
- Stemann, J.; Putschew, A.; Ziegler, F. Hydrothermal carbonization: Process water characterization and effects of water recirculation. Bioresour. Technol. 2013, 143, 139–146. [Google Scholar] [CrossRef] [Scilit] [PubMed]
- Hoekman, S.K.; Broch, A.; Robbins, C. Hydrothermal Carbonization (HTC) of Lignocellulosic Biomass. Energy Fuels 2011, 25, 1802–1810. [Google Scholar] [CrossRef] [Scilit]
- Boamah, N.N.; Salaudeen, S.A. Process water from the hydrothermal carbonization of biomass: A review on the characterization, applications, and potential for future work. J. Water Process Eng. 2025, 77, 108531. [Google Scholar] [CrossRef] [Scilit]
- Kambo, H.S.; Dutta, A. A comparative review of biochar and hydrochar in terms of production, physico-chemical properties and applications. Renew. Sustain. Energy Rev. 2015, 45, 359–378. [Google Scholar] [CrossRef] [Scilit]
- Weiner, B.; Poerschmann, J.; Wedwitschka, H.; Koehler, R.; Kopinke, F.-D. Influence of Process Water Reuse on the Hydrothermal Carbonization of Paper. ACS Sustain. Chem. Eng. 2014, 2, 2165–2171. [Google Scholar] [CrossRef] [Scilit]
- Jamal-Uddin, A.-T.; Reza, M.T.; Norouzi, O.; Salaudeen, S.A.; Dutta, A.; Zytner, R.G. Recovery and Reuse of Valuable Chemicals Derived from Hydrothermal Carbonization Process Liquid. Energies 2023, 16, 732. [Google Scholar] [CrossRef] [Scilit]
- Sagar, V.; Lynam, J.G.; Parrenin, A.G. Sugar Extraction from Secondary Agricultural Waste Biomass Using Hydrothermal Carbonization and Direct Contact Membrane Distillation. Biomass 2023, 3, 323–335. [Google Scholar] [CrossRef] [Scilit]
- Zong, C.; Belete, Y.Z.; Das, A.K.; Chen, L. Effects of Operating Conditions on Nitrogen Recovery from Post-Hydrothermal Carbonization Liquids Using Gas-Permeable Membranes. ChemEngineering 2026, 10, 96. [Google Scholar] [CrossRef] [Scilit]
- Guillen-Burrieza, E.; Thomas, R.; Mansoor, B.; Johnson, D.; Hilal, N.; Arafat, H. Effect of dry-out on the fouling of PVDF and PTFE membranes under conditions simulating intermittent seawater membrane distillation (SWMD). J. Membr. Sci. 2013, 438, 126–139. [Google Scholar] [CrossRef] [Scilit]
- Nouhou Moussa, A.W.; Zrelli, A.; Sawadogo, B.; Chemini, R. A review on combined solar-membrane systems for wastewater treatment in Africa. Front. Membr. Sci. Technol. 2025, 4, 1638191. [Google Scholar] [CrossRef] [Scilit]
- Jang, Y.; Cho, H.; Shin, Y.; Choi, Y.; Lee, S.; Koo, J. Comparison of fouling propensity and physical cleaning effect in forward osmosis, reverse osmosis, and membrane distillation. Desalin. Water Treat. 2016, 57, 24532–24541. [Google Scholar] [CrossRef] [Scilit]
- Lynam, J.G.; Chow, G.I.; Coronella, C.J.; Hiibel, S.R. Ionic liquid and water separation by membrane distillation. Chem. Eng. J. 2016, 288, 557–561. [Google Scholar] [CrossRef] [Scilit]
- Rodrigo, P.M.; Fatima, S.; Kommalapati, R.R.; Chellam, S. Air-gap membrane distillation to desalinate seawater and hypersaline-produced water. Clean. Water 2025, 4, 100109. [Google Scholar] [CrossRef] [Scilit]
- Yang, K.; Qin, M. Understanding Ammonia and Water Transport in Direct Contact Membrane Distillation toward Selective Ammonia Recovery. ACS ES&T Eng. 2024, 4, 1321–1330. [Google Scholar] [CrossRef] [Scilit]
- Gallifuoco, A.; Taglieri, L.; Scimia, F.; Papa, A.A.; Di Giacomo, G. Hydrothermal conversions of waste biomass: Assessment of kinetic models using liquid-phase electrical conductivity measurements. Waste Manag. 2018, 77, 586–592. [Google Scholar] [CrossRef] [Scilit] [PubMed]
- Qtaishat, M.; Matsuura, T.; Kruczek, B.; Khayet, M. Heat and mass transfer analysis in direct contact membrane distillation. Desalination 2008, 219, 272–292. [Google Scholar] [CrossRef] [Scilit]
- Eibisch, N.; Helfrich, M.; Don, A.; Mikutta, R.; Kruse, A.; Ellerbrock, R.; Flessa, H. Properties and Degradability of Hydrothermal Carbonization Products. J. Environ. Qual. 2013, 42, 1565–1573. [Google Scholar] [CrossRef] [Scilit] [PubMed]
- Rezaei, M.; Warsinger, D.M.; Duke, M.C.; Matsuura, T.; Samhaber, W.M. Wetting phenomena in membrane distillation: Mechanisms, reversal, and prevention. Water Res. 2018, 139, 329–352. [Google Scholar] [CrossRef] [Scilit] [PubMed]
- Jasper, J.J. The Surface Tension of Pure Liquid Compounds. J. Phys. Chem. Ref. Data 1972, 1, 841–1010. [Google Scholar] [CrossRef] [Scilit]
- El-Nemr, H.A.; ElKady, M.; El-Khouly, M.E. Polystyrene-Modified PVDF Membranes: A Novel Approach for Improved Flux and Salt Rejection in Direct Contact Membrane Distillation. J. Appl. Polym. Sci. 2026, 143, e58133. [Google Scholar] [CrossRef] [Scilit]
- Shirazi, M.M.A.; Kargari, A.; Shirazi, M.J.A. Direct contact membrane distillation for seawater desalination. Desalin. Water Treat. 2012, 49, 368–375. [Google Scholar] [CrossRef] [Scilit]
- Nakason, K.; Panyapinyopol, B.; Kanokkantapong, V.; Viriya-Empikul, N.; Kraithong, W.; Pavasant, P. Characteristics of hydrochar and liquid fraction from hydrothermal carbonization of cassava rhizome. J. Energy Inst. 2018, 91, 184–193. [Google Scholar] [CrossRef] [Scilit]
- Zhang, F.; Gu, C.; Cheng, Y.; Chen, R.; Wang, Z.; Cui, Z. An integrated module with synergistic heating and turbulence promotion for enhanced vacuum membrane distillation. J. Membr. Sci. 2026, 744, 125204. [Google Scholar] [CrossRef] [Scilit]
- Paksung, N.; Pfersich, J.; Arauzo, P.J.; Jung, D.; Kruse, A. Structural Effects of Cellulose on Hydrolysis and Carbonization Behavior during Hydrothermal Treatment. ACS Omega 2020, 5, 12210–12223. [Google Scholar] [CrossRef] [Scilit] [PubMed]
- Song, Y.; Maskey, S.; Lee, Y.G.; Lee, D.-S.; Nguyen, D.-T.; Bae, H.-J. Optimizing bioconversion processes of rice husk into value-added products: D-psicose, bioethanol, and lactic acid. Bioresour. Technol. 2024, 395, 130363. [Google Scholar] [CrossRef] [Scilit] [PubMed]
- Hijaz, H.A.; Zargar, M.; Shafieian, A.; Razmjou, A.; Khiadani, M. Experimental investigation of temperature polarisation by capturing the temperature profile development over DCMD membranes. J. Membr. Sci. 2023, 687, 122089. [Google Scholar] [CrossRef] [Scilit]
- Francis, L.; Ghaffour, N.; Alsaadi, A.; Nunes, S.; Amy, G. Performance evaluation of the DCMD desalination process under bench scale and large scale module operating conditions. J. Membr. Sci. 2014, 455, 103–112. [Google Scholar] [CrossRef] [Scilit]
- Abdelrazeq, H.; Khraisheh, M.; Hassan, M.K. Long-Term Treatment of Highly Saline Brine in a Direct Contact Membrane Distillation (DCMD) Pilot Unit Using Polyethylene Membranes. Membranes 2022, 12, 424. [Google Scholar] [CrossRef] [Scilit] [PubMed]
- Kim, Y.-D.; Thu, K.; Ghaffour, N.; Ng, K.C. Performance investigation of a solar-assisted direct contact membrane distillation system. J. Membr. Sci. 2013, 427, 345–364. [Google Scholar] [CrossRef] [Scilit]
- Yan, Z.; Jiang, Y.; Liu, L.; Li, Z.; Chen, X.; Xia, M.; Fan, G.; Ding, A. Membrane Distillation for Wastewater Treatment: A Mini Review. Water 2021, 13, 3480. [Google Scholar] [CrossRef] [Scilit]
- Olatunji, S.O.; Camacho, L.M. Heat and Mass Transport in Modeling Membrane Distillation Configurations: A Review. In Frontiers in Energy Research; Frontiers Media S.A: Lausanne, Switzerland, 2018. [Google Scholar]

Disclaimer/Publisher’s Note: The statements, opinions and data contained in all publications are solely those of the individual author(s) and contributor(s) and not of MDPI and/or the editor(s). MDPI and/or the editor(s) disclaim responsibility for any injury to people or property resulting from any ideas, methods, instructions or products referred to in the content. |
© 2026 by the authors. Licensee MDPI, Basel, Switzerland. This article is an open access article distributed under the terms and conditions of the Creative Commons Attribution (CC BY) license.