


Abstract
We present a systematic, experiment-only parameterization of the radiative neutron capture cross section σn, γ(E) for thirteen actinides of importance to reactor physics, fuel-cycle modeling and transmutation (232Th, 233U, 235U, 238U, 237Np, 239Pu, 240Pu, 241Pu, 242Pu, 241Am, 243Am, 244Cm and 246Cm). A total of 90,299 EXFOR points were reduced to a per-isotope tabular form and analyzed in three regimes whose boundaries follow standard nuclear-data conventions: thermal (E < 0.5 eV), resonance (split into RRR, 0.5 eV–1 keV and URR, 1–100 keV) and fast (0.1–1.0 MeV). In every regime, an empirical and a semi-empirical description are fitted to the same data under a common point-uncertainty model; the effect of dataset-wide normalization offsets is assessed separately by refits with per-dataset log-normalization parameters. Models are compared by reduced χ2, AIC/BIC and—in the URR—by dataset-level hold-out validation, and every derived quantity carries both a delta-method uncertainty and a dataset-level resampling 95% interval. In the thermal region the bound-level-plus-first-resonance form recovers first-resonance energies for 239Pu, 241Pu, 237Np, 241Am and 243Am to more than 3% from cross-section data alone; in the URR the Porter–Thomas-corrected statistical model is preferred on AIC for 7 of 12 nuclides, with fission competition included for the four fissile targets, but on dataset-level hold-out for only 3 of 5; and in the fast region the closed-form black-nucleus statistical model used here fails for 232Th, 238U and 237Np, whereas a default TALYS calculation reproduces the energy dependence for 232Th and 238U after a single normalization, attributing the failure to the approximations of the closed-form model rather than to statistical-model theory. Dataset-level resampling intervals are up to eighty times wider than delta-method uncertainties, demonstrating that inter-experiment discrepancy—not counting statistics—dominates the uncertainty of the pooled actinide capture record.
1. Introduction
Radiative neutron capture on the actinides governs the buildup of higher actinides in irradiated fuel, the neutron economy of thermal and fast systems, the design of minor-actinide transmutation schemes, and the interpretation of safeguards and burnup measurements. Evaluated libraries—ENDF/B-VIII.0 [1], JEFF-3.3 [2], JENDL-5 [3] and CENDL-3.2 [4]—provide recommended cross sections constrained by experiment, but the underlying record is heterogeneous: different laboratories, techniques, normalizations, resolutions and epochs, with strongly non-uniform energy coverage from nuclide to nuclide.
That record is compiled in EXFOR, maintained by the Nuclear Reaction Data Centres network [5] and distributed through a retrieval system preserving the identity of every original dataset [6]. Because EXFOR stores each measurement with its dataset identifier, the pooled record can be analyzed either as one large sample or as a collection of correlated experimental campaigns. The second view is the physically correct one: points from the same campaign share a flux normalization, sample mass, and detector efficiency, so they are not independent.
The modeling of actinide capture rests on a well-established hierarchy. Below and around the first resonances, the cross section follows multilevel R-matrix theory [7], in practice, through the Reich–Moore approximation [8] as implemented in SAMMY [9] and documented for evaluation work by Fröhner [10]. Where individual levels can no longer be resolved, the average cross section follows from compound-nucleus statistical theory [11], corrected for Porter–Thomas fluctuation of the reduced neutron widths [12] and, more completely, for the Moldauer elastic-enhancement effect [13]. Above the resonance region, a level-density prescription is required: Gilbert–Cameron [14] or the back-shifted Fermi gas of Dilg et al. [15]. Modern evaluations assemble these ingredients inside full reaction codes such as TALYS [16] or EMPIRE [17], with input parameters from RIPL-3 [18,19].
The energy-regime division used here is not arbitrary. Separating thermal from epithermal at the cadmium cut-off near 0.5 eV is the basis of the Westcott convention [20,21] and remains standard in activation-analysis nuclear data [22]. Dividing the resonance region into resolved and unresolved parts is prescribed by the evaluated-file formats, which place the actinide boundary near 1 keV and the upper URR edge near 100 keV [23]; the special numerical treatment the URR requires has been assessed by the OECD-NEA [24], and the same limits reappear as group boundaries in standard multigroup structures [25]. The regimes therefore coincide with boundaries the nuclear-data community already treats as physically meaningful.
Interest in these nuclides is driven by fuel-cycle and transmutation applications [26,27]. The OECD-NEA target-accuracy assessment identified minor-actinide capture—237Np, 241Am, 243Am and the curium isotopes in particular—as among the largest contributors to design uncertainty in fast and accelerator-driven systems [28,29], and later reviews restated the need for improved differential data and consistent covariances [30,31]. That demand produced a sustained program of high-resolution time-of-flight and calorimetric measurements: 241Am capture at DANCE [32] and n_TOF [33,34], a partial-wave resonance analysis of n + 241Am [35], and the 237Np resonance-region measurement at n_TOF [36]. These form the modern, well-characterized part of the record analyzed here.
Empirical and data-driven descriptions are a complementary tradition: compact analytical forms interpolate smoothly, can be embedded in engineering codes, and can be fitted directly to measurements without a full model calculation. Machine-learning surrogates such as Bayesian neural networks have recently been applied to (n,γ) systematics [37] with the same motivation but far less interpretability. This work sits deliberately at the transparent end of that spectrum: every formula used has at most five parameters. The statistical machinery is standard but applied more strictly than is usual in cross-section systematics: models are ranked by the Akaike [38] and Bayesian [39] information criteria, and uncertainties are obtained both by linear propagation and by resampling in its clustered form [40,41,42,43], so that whole campaigns rather than individual points are resampled. Full evaluation frameworks, by contrast, combine model calculations and measurements through unified Monte Carlo [44] or generalized least-squares [45] updating. The transparent, low-parameter regression approach adopted here has previously been applied to isotopic concentrations in irradiated nuclear fuel [26,27] and to empirical cross-section formulae for light-target and cyclotron-production reactions [46,47].
The question asked is deliberately narrow: what can be extracted from the raw experimental record alone, using transparent low-parameter formulae, and where does simple physics stop working? All evaluated-library input is excluded from the fitting; evaluated and compiled quantities are used only a posteriori as benchmarks. Empirical formulae are chosen for functional convenience and provide a model-independent reference against which the added complexity of physics-based models can be assessed. Semi-empirical formulae are derived from resonance or statistical-model theory with a few nuclear parameters left free; if such a model is correct, its fitted parameters should reproduce independently tabulated nuclear data—a falsifiable test no purely empirical fit can offer. Thirteen nuclides were retained (Table 1). Section 2 describes the compilation, the uncertainty and normalization model, and the coverage that constrains what can be attempted; Section 3.1, Section 3.2 and Section 3.3 treat the three regimes; Section 3.4 examines variation across the actinide chain; Section 4 and Section 5 discuss and conclude.
Table 1.
Nuclide selection grouped by fuel-cycle role.
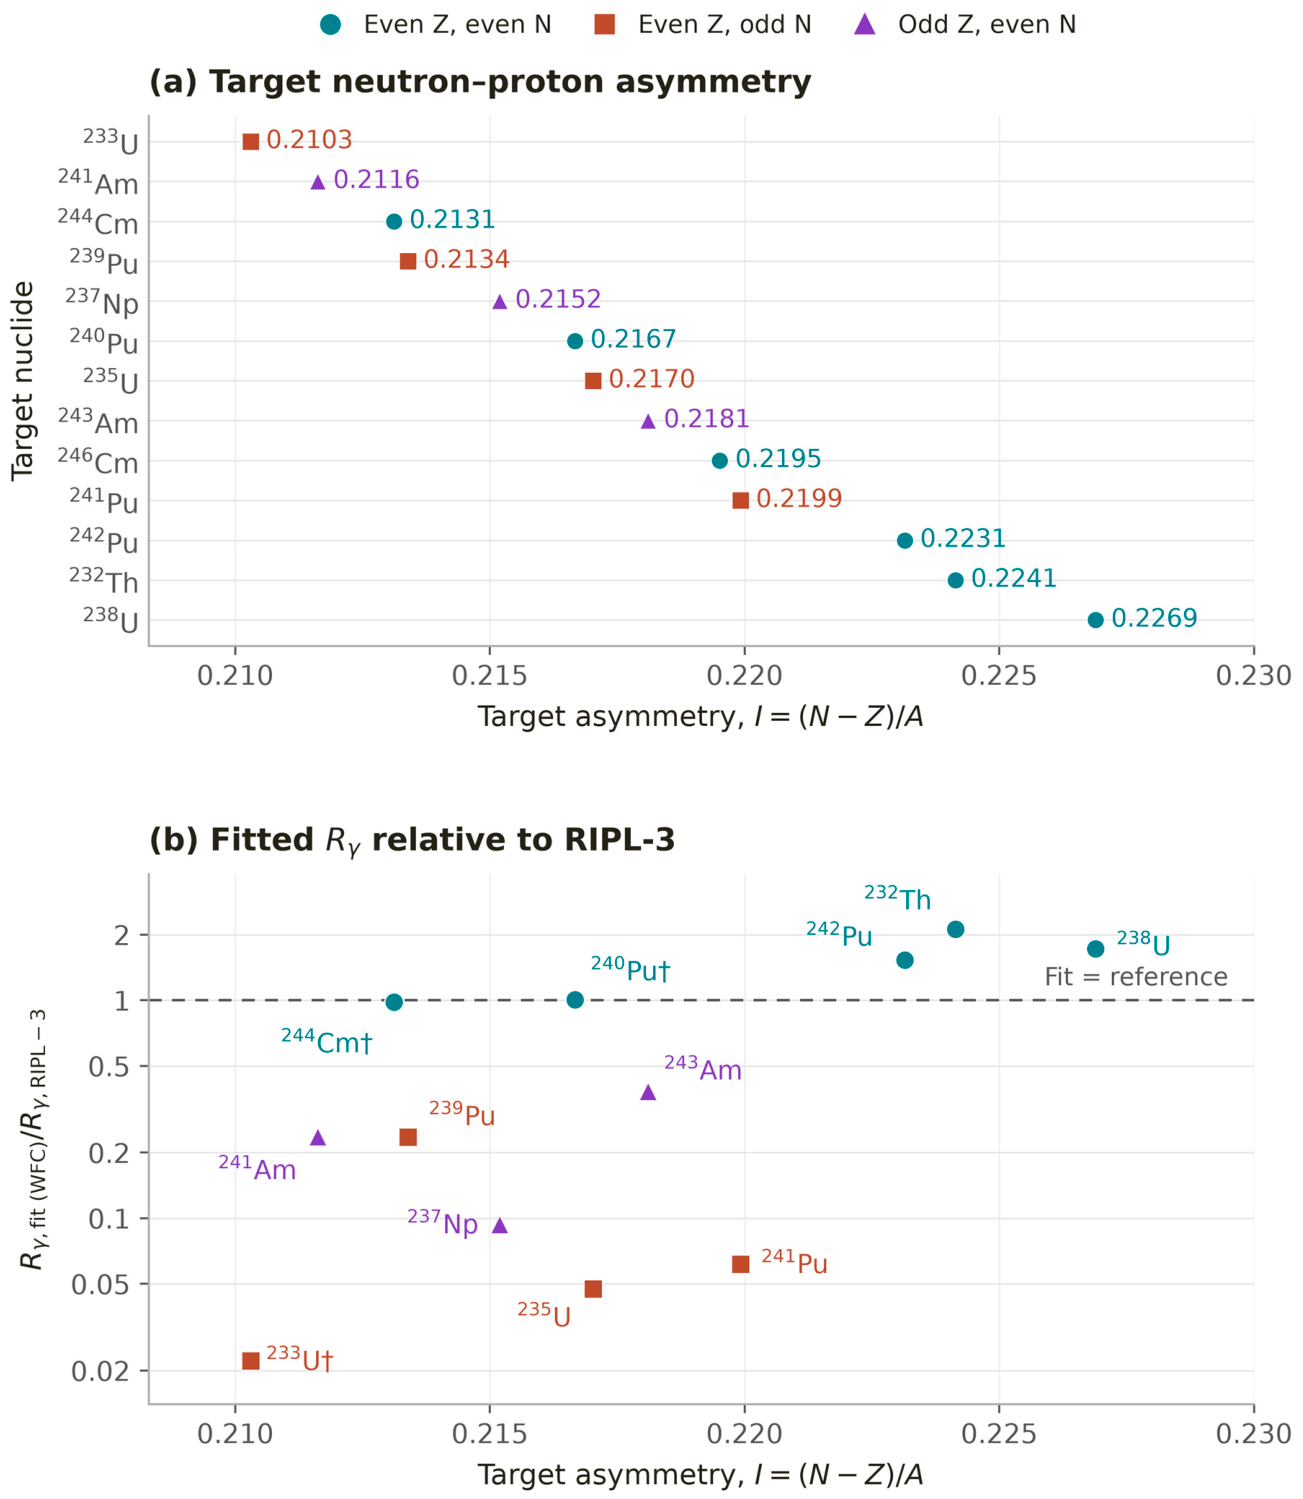
The symmetry/asymmetry-related component of this study concerns nuclear composition: the neutron–proton asymmetry I = (N − Z)/A and the even/odd character of the target proton and neutron numbers. Section Neutron–Proton Asymmetry and the Rγ Benchmark connects these descriptors to the discrepancy between fitted and reference Rγ values, providing a composition-resolved diagnostic of the unresolved-resonance model. Even/odd classification is kept distinct from equality of neutron and proton numbers and from spatial symmetry. The comparison is descriptive; it neither establishes symmetry breaking nor replaces the multiple-comparison assessment of the cross-nuclide correlations.
2. Materials and Methods
2.1. Source, Compilation and Uncertainty Model
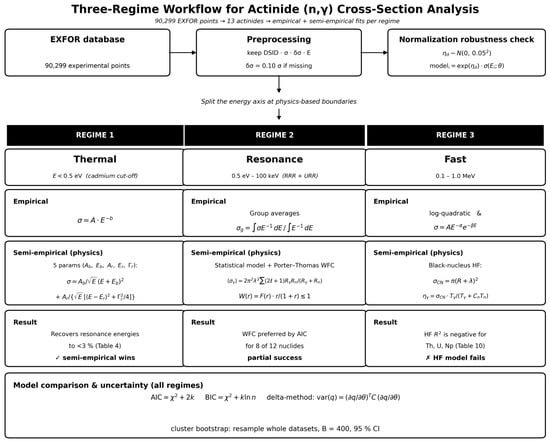
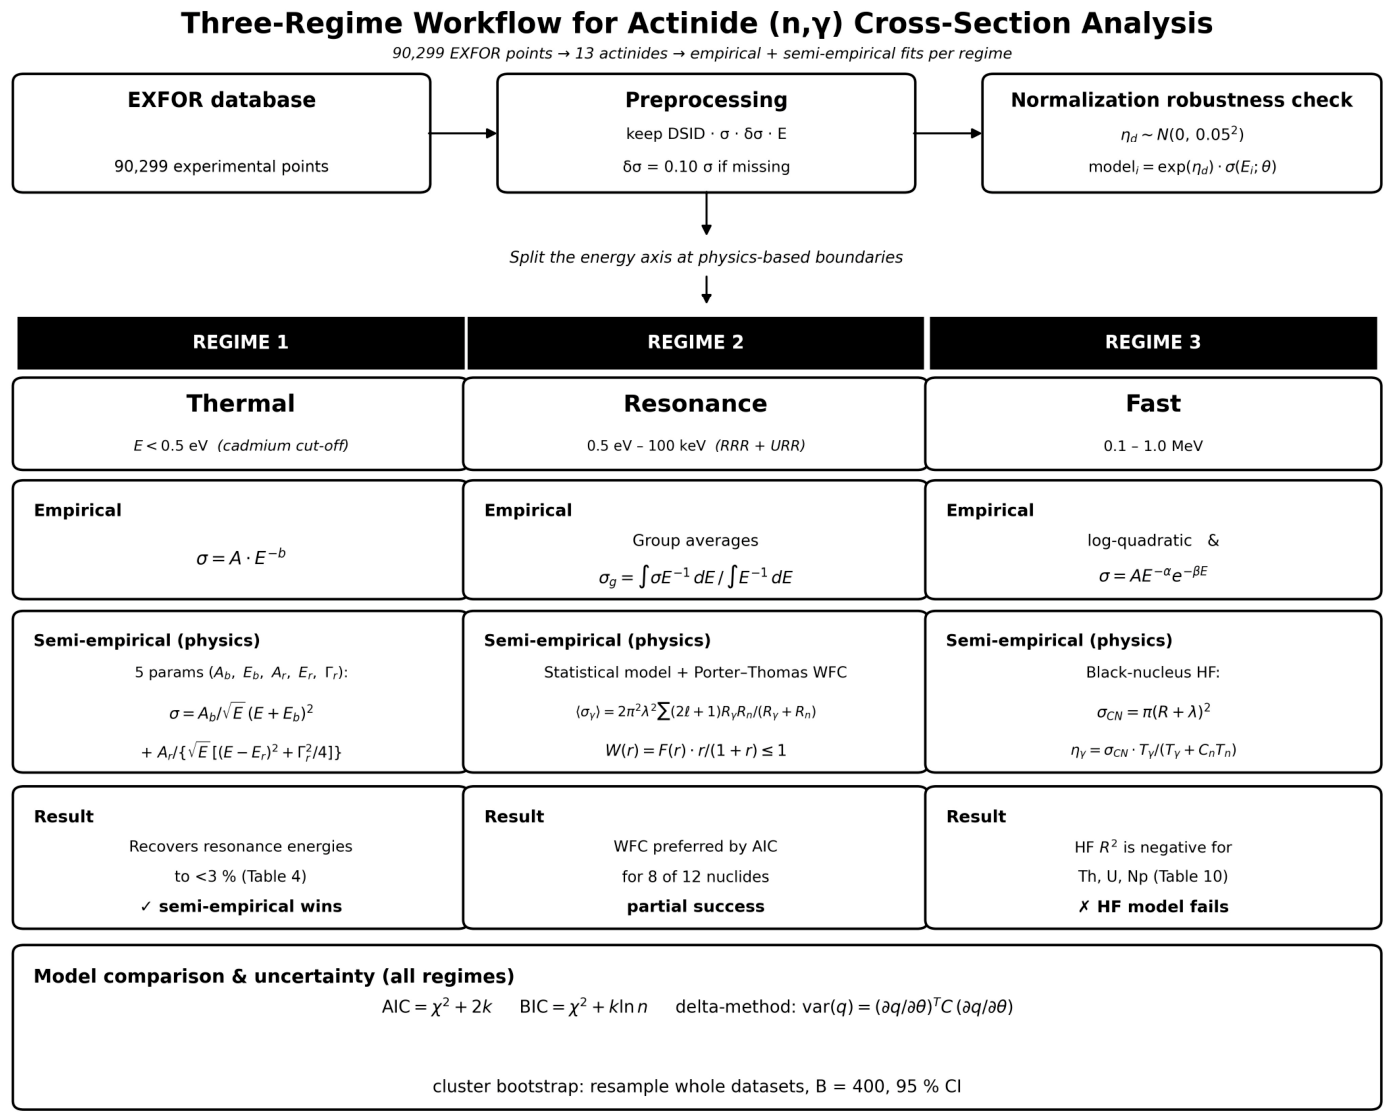
All (n,γ) data were retrieved from the IAEA EXFOR database through the Nuclear Data Services Data Explorer [48]. Each record retains the first author, publication year, EXFOR dataset identifier (DSID), incident energy E, energy uncertainty, cross-section σ, and its uncertainty where reported. The compilation used in the fits contains 90,299 points, of which 48,276 (53.5%) carry a reported uncertainty. Retention of the DSID is essential: it is what makes the hold-out validation of Section 3.2.5 and the dataset resampling of Section 3.1.3 possible, and what allows correlated normalization errors within a campaign to be treated as a block rather than as independent noise. An overview of the complete pipeline is given in Figure 1.
Figure 1.
End-to-end analysis pipeline: EXFOR retrieval and reduction into (E, σ, δσ) triplets with dataset identifiers retained, an energy split at 0.5 eV, 1 keV and 100 keV into three regimes, empirical and semi-empirical fits under a common point-uncertainty model, a separate dataset-normalization robustness check, and joint uncertainty quantification by delta-method propagation and cluster-bootstrap resampling of whole EXFOR datasets (B = 400).
Point Uncertainty and the 10% Surrogate: Where an experimental uncertainty δσ is reported, it is used directly; where absent, the assigned point uncertainty is si = 0.10σi. This fixed relative scale allows measurements without reported uncertainties to enter the weighted fit without assigning them zero uncertainty or excluding them solely because uncertainty information is missing. The same rule is applied to the empirical and semi-empirical models. As a descriptive comparison, the source EXFOR export used for the uncertainty comparison contains 82,855 records with positive finite energy, cross section, and reported uncertainty; their point-weighted median relative uncertainty, 100δσ/σ, is 9.07%, with an interquartile range of 4.61–41.04% (Supplementary Table S10). Thus, 10% is close to the overall source-export median and is retained as a rounded common working scale. This comparison is descriptive, not evidence that each missing uncertainty equals 10% or that the choice is statistically optimal. The surrogate applies to the 42,023 points (46.5%) of the compilation that lack reported uncertainties. It is distinct from the dataset-wide normalization term below: assigning a pointwise relative scale does not itself model a correlated shift in an entire experimental campaign. Because this comparison cannot establish the size of the missing uncertainties, every fit that uses point uncertainties was repeated with the surrogate set to 5%, 20%, and the regime-specific reported medians (Section 4.4; Supplementary Table S11).
A closely related precedent is provided by Alhassan et al. [49], who used reported experimental uncertainties and assigned a 10% relative uncertainty to selected EXFOR datasets with unreported uncertainties, including cases where they were the only measurements available in the energy range or had previously been assessed as being of reasonable quality. This provides a precedent for an explicit provisional assignment, rather than establishing 10% as a universal or statistically optimal experimental uncertainty.
Per-Dataset Normalization: Measurements within one experimental dataset may share an overall scale error arising from flux, sample mass, detector efficiency, or the reference standard. Each dataset d is therefore assigned a log-normalization parameter nd, and the prediction for observation i is exp(nd(i)) · m(Ei;θ). Here, yi is the measured cross section, Ei is the incident energy, θ is the vector of model parameters, d(i) is the dataset containing observation i, and m is the unnormalized model prediction. A Gaussian prior nd ~ N(0, σn2), with σn = 0.05, centers each multiplicative scale exp(nd) on unity. The fitted residual vector is
The first block of Equation (1) measures each observation–prediction difference in units of its assigned point uncertainty si. The second block penalizes dataset normalization shifts relative to the prior scale σn. Minimizing the squared residual norm therefore balances agreement with individual measurements against excessive rescaling of whole datasets. The two blocks should not be interpreted as interchangeable uncertainty sources. The fits reported in Section 3 use the point uncertainties only; the normalization terms of Equation (1) are activated in the robustness checks of Section 3.1.4 and Section 3.3.3 and in the fitted-normalization diagnostics of Section 3.3.3.
The 5% baseline sits near the lower edge of the credible range for absolute-flux budgets in modern time-of-flight campaigns (n_TOF 241Am 4–6%, n_TOF 237Np ≈ 5%, DANCE 241Am ≈ 6%). Older activation and lead-slowing-down measurements are typically quoted at 5–15% [50]; a single common prior therefore restrains the nuisance parameters rather than licensing them, and is conservative in the direction that matters.
2.2. Exclusion of 245Cm
245Cm was excluded on data-availability grounds despite its acknowledged fuel-cycle importance. Its entire EXFOR (n,γ) record comprises only two experimental points, drawn from two distinct datasets, both lying at thermal energy. No regime can therefore be fitted, hold-out validation is undefined with two datasets, and a single thermal point would enter the systematics of Section 3.4 as a leverage point with no independent confirmation. Because the three modern evaluations for this nuclide are not mutually independent, their spread understates the true uncertainty, and no 245Cm value is quoted from them; Section 4.2 treats the nuclide as a priority measurement gap.
2.3. Coverage per Regime
Here, data coverage means the availability and distribution of experimental measurements across nuclides and energy intervals. Table 2 summarizes coverage by counting the experimental points in each interval; it does not report the statistical coverage probability of a confidence interval. Coverage is extremely uneven and largely determines which nuclides can be analyzed in which regime. The regime limits are 0.5 eV for the thermal/epithermal boundary [20,22], and 1 keV and 100 keV for the resolved/unresolved and upper URR boundaries [23,24].
Table 2.
Number of experimental EXFOR points per nuclide in each energy regime; the fast-region column covers the entire range above 100 keV.
Two entries require comment. 233U has 4148 RRR points but only 7 below 0.5 eV, and 235U shows the same pattern (2680 against 4). Both are fissile, and experimental effort has overwhelmingly targeted the fission cross section and the capture-to-fission ratio in the resolved resonance region. Below 0.5 eV, the thermal capture cross section of a fissile nuclide is conventionally established once, to high precision, by a small number of integral and standards measurements. Three structural features drive the whole analysis: the thermal region is well covered for only seven nuclides; the RRR is well covered for almost all, but with point distributions that no smooth formula can fit point-by-point; the fast region is essentially empty for eight of thirteen nuclides.
2.4. Model Selection, Fit Indicators and Resampling
Information Criteria: The Akaike information criterion (AIC) [38] and Bayesian information criterion (BIC) [39] compare goodness of fit while penalizing additional model parameters. Lower values indicate the preferred model within a comparison using the same observations and uncertainty model. The expressions used for the tabulated comparisons are
AIC = χ2 + 2k, BIC = χ2 + klnn.
Here, n is the number of observations entering the fit, or the number of group-averaged observations when fitting resonance-region groups. In the tabulated model-complexity penalties, k counts the model parameters: the URR empirical power law has two (A, b), whereas the statistical model has three (S0, S1, Rγ); the thermal models have two and five, respectively. Thus, “two against three” refers to parameter counts, not to numbers of datasets or energy regimes. The dataset-normalization structure is held the same between the compared models. An identical additional parameter-count penalty for those shared nuisance parameters would cancel in within-pair AIC/BIC differences; this does not constitute a calibration of their effective degrees of freedom. The two criteria give the same preferred model in the reported comparisons; BIC tabulations are in Supplementary Tables S2–S4 and S8.
A hierarchy of evidence is adopted and applied consistently: (i) dataset-level hold-out validation is primary wherever the data permit, being the only test used here that is out-of-sample with respect to the correlated systematics that limit this corpus; (ii) information criteria are secondary; (iii) agreement of fitted parameters with independently tabulated nuclear data is a separate falsification test that no purely empirical model can pass or fail.
Fit-quality Indicators: Four indicators are reported because no single number is sufficient when the number of points per nuclide spans four orders of magnitude and the cross section spans six. Reduced χ2 is χ2 per degree of freedom; the fitting objective of the fits reported in Section 3 is the weighted sum of squares of the first block of Equation (1); the full extended residuals are used in the normalization robustness checks. The root-mean-square error (RMSE) is expressed in barns, while the relative RMSE (rRMSE) measures errors relative to the measured cross sections. R2 is evaluated on the natural logarithm of the cross section as a descriptive log-space indicator, not as the fitted objective. A negative R2 means that the model performs worse, on that scale, than a constant prediction equal to the mean of the logarithmic observations.
Dataset resampling. The procedure is a non-parametric cluster bootstrap in the sense of Field and Welsh [43], with the EXFOR dataset as the cluster. For a nuclide with D distinct DSIDs in a regime, one replicate draws D labels uniformly with replacement, concatenates all points of each drawn label, and refits from the original converged parameter vector. Derived quantities are recomputed per replicate, and the reported interval is the 2.5%/97.5% percentile interval over B = 400 replicates. Fits with fewer than three distinct DSIDs are flagged (“deg.”) rather than quoted.
3. Results
3.1. Regime 1—The Thermal Region (E < 0.5 eV)
3.1.1. Empirical and Semi-Empirical Descriptions
The standard empirical description of thermal capture is the power law σγ(E) = A·E−b, with ideal 1/v behavior at b = 1/2. For a Maxwellian flux φ(E)dE ∝ E·exp(−E/E0) dE with E0 = kT = 0.0253 eV, the Westcott factor evaluates analytically to gW = (2/√π)·Γ(2 − b), with δgW = |gW · ψ(2 − b)| · δb, and returns exactly 1 at b = 1/2. The closed form is a physical Westcott factor only for 232Th and 233U; for the five resonance-bearing nuclides it is reported as an effective gWeff.
The semi-empirical form follows from Breit–Wigner theory. Two contributions matter below 0.5 eV: a bound (negative-energy) level whose tail is the physical origin of near-1/v behavior, and the first positive-energy resonance where it lies low enough to intrude:
In Equation (3), Ab sets the amplitude of the bound-level contribution and Eb its positive energy-distance parameter; Ar sets the first-resonance amplitude, Er its position, and Γr its fitted width. The bound-level term describes the low-energy background, while the second term allows curvature associated with a nearby resonance. These five parameters (Ab, Eb, Ar, Er, Γr) are fitted without supplying tabulated resonance parameters. Agreement with independently tabulated values is therefore an external test of the model. The objective is non-convex in Er; fits used fifteen starts per nuclide on a grid of Er ∈ {0.26, 0.30, 0.42, 0.51, 1.0} eV, and Γr ∈ {0.02, 0.05, 0.10} eV, retaining the lowest-χ2 converged solution. Attainment of the global minimum was verified by χ2 profiling and 200 random restarts.
3.1.2. Results and Recovery of Resonance Parameters
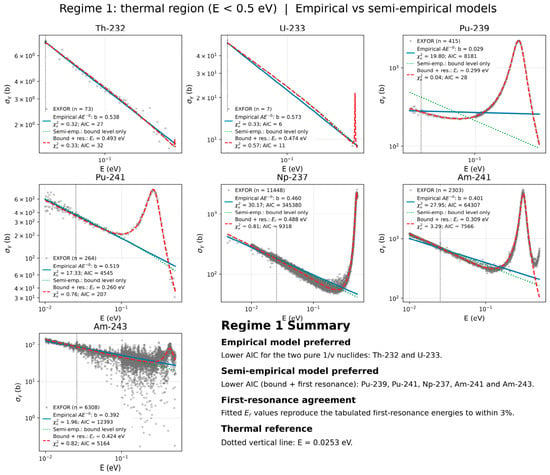
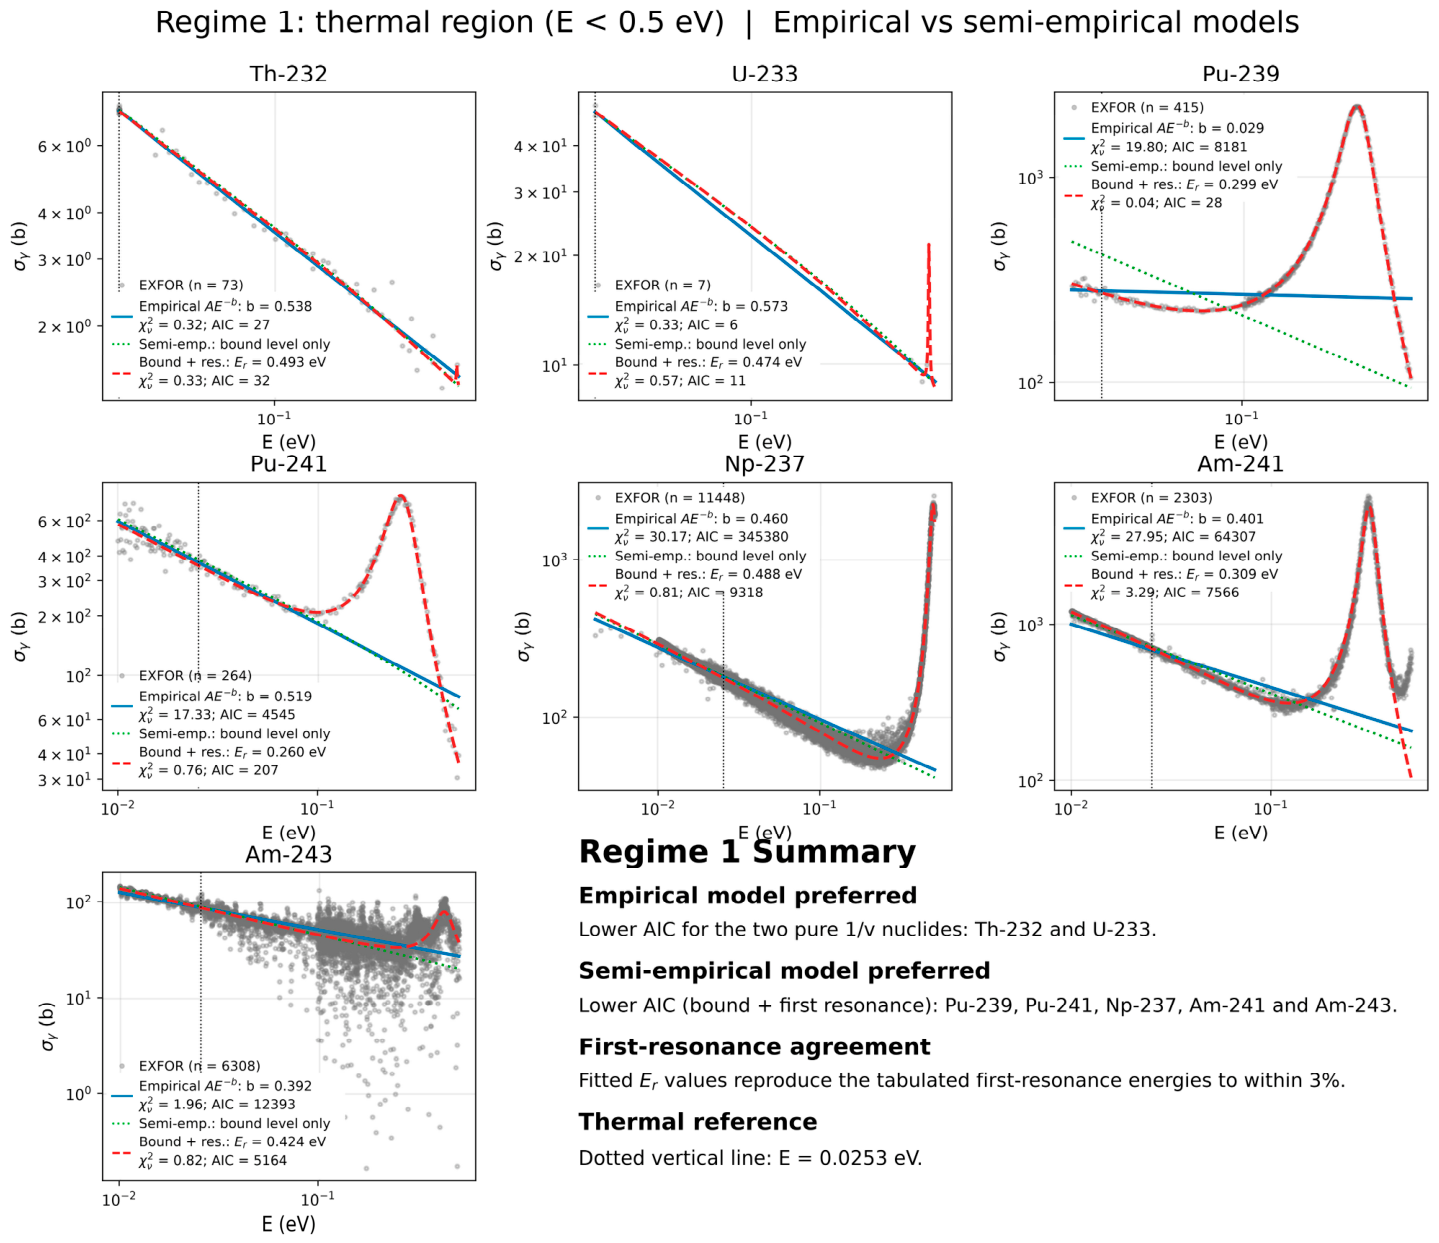
Seven nuclides have four or more distinct thermal energies and can be fitted (Table 3, Figure 2). BIC selects the same model as AIC for all seven (Supplementary Table S2).
Table 3.
Thermal-region (E < 0.5 eV) fits comparing the empirical power law and the bound-level-plus-first-resonance model; asterisks mark the AIC-preferred model. The column headed Γr (eV) reports the fitted resonance width in Equation (3), not an uncertainty in the resonance energy. A dash indicates that no resonance width is quoted for the bound-level-dominated fit. The previously reported width values are retained.
Figure 2.
Thermal-region fits for the seven fittable nuclides: gray points are EXFOR data, solid line the empirical power law A·E−b, dotted line the bound-level term alone, and dashed line the full bound-level-plus-first-resonance form. The vertical dotted line marks 0.0253 eV.
For the two nuclides whose lowest resonance lies far above the thermal range—232Th (first resonance at 21.8 eV) and 233U—the extra three parameters do not improve model selection, and the power law is preferred. For the five nuclides with a resonance below or near 0.5 eV, the semi-empirical form is strongly preferred by the reported information criteria, reducing χ2ν by factors from 2.4 (243Am) to 450 (239Pu). The first-resonance energies recovered by the semi-empirical form are compared with their tabulated values in Table 4.
Table 4.
Recovery of first-resonance energies from thermal data alone: fitted Er versus the tabulated JENDL-5 value [3].
Agreement is more than 3% throughout and better than 1% for four of five. The fitted widths (44–112 meV) are of the correct magnitude for actinide s-wave resonances. For 232Th and 233U, the multi-start fit correctly collapses to the bound-level term, making Ar consistent with zero once more.
3.1.3. Thermal Cross Sections, Westcott Factors and Resonance Integrals
Cross sections at 0.0253 eV were obtained from the data for all thirteen nuclides and compared with the IAEA safeguards reference compilation [51,52], itself based on Mughabghab’s Atlas of Neutron Resonances [53] (Table 5).
Table 5.
Thermal cross-section σ0 at 0.0253 eV, Westcott factors gW and partial resonance integrals versus the IAEA reference table [51]; asterisks mark agreement within 3% and † marks effective (non-pure-Maxwellian) gW values. Note that RI (0.5 eV–1 keV) is a partial integral of this work and is not the IAEA infinite-dilution RI∞.
Nine of the twelve comparable values agree within 3%, and five agree within 1%—a strong validation of the reduction pipeline. Three deviations deserve comment. 241Am (+19%): the IAEA value of 587 b is old; a modern OECD-NEA-referenced re-evaluation yields 747.8 b [54], between which the present 699.8 b lies, and Section 3.1.4 shows the discrepancy is not statistically significant once inter-experiment scatter is accounted for. 243Am (+16%): a normalization discrepancy issue between modern time-of-flight and older activation campaigns; the discrepancy survives dataset-level resampling. 233U (+8%): only seven thermal points exist.
3.1.4. Robustness and Uncertainty Quantification
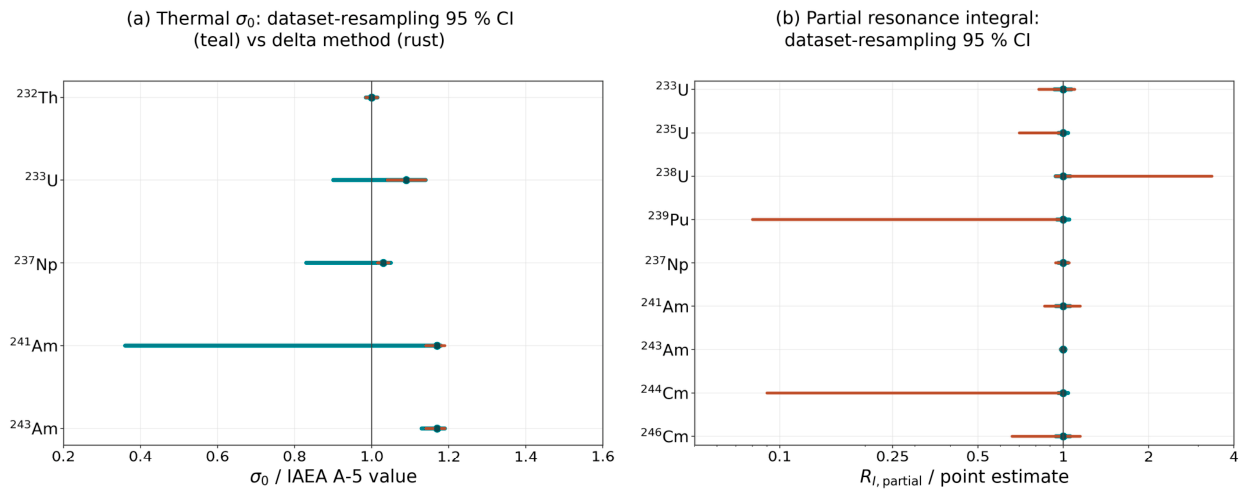
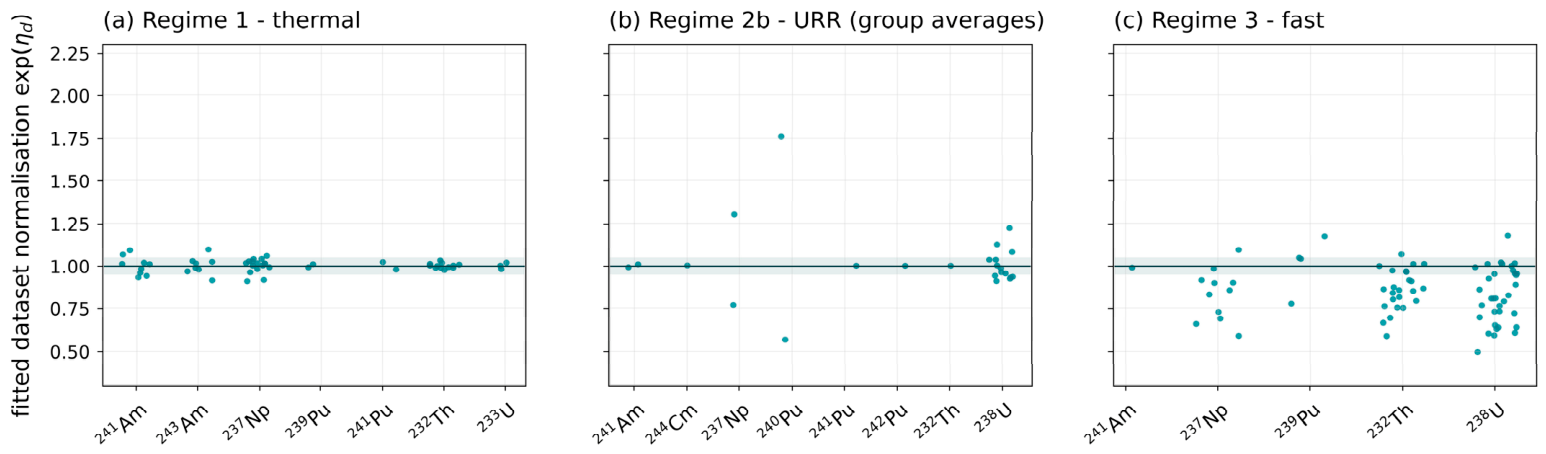
Repeating the thermal fits with the per-dataset normalization parameters activated shows them to be robust to the systematic-error model: every σ0 moves by less than 2.1% and every resonance energy by less than 0.1%. Two complementary uncertainties are computed for every derived quantity—the delta method using the full parameter covariance, and dataset resampling (Section 2.4; Table 6 and Figure 3; Supplementary Table S5). The gap between the two is itself a result: where the resampling interval is far wider, uncertainty is dominated by disagreement between laboratories rather than by counting statistics.
Table 6.
σ0 with delta-method uncertainty and dataset-resampling 95% confidence intervals, against IAEA A-5 [51]: “pow” is the empirical power law, “br” the bound-level + first-resonance model; “n.d.” flags fits unidentifiable over the available energy span and “deg.” flags resampling intervals with fewer than three independent datasets.
Figure 3.
Uncertainty of the derived thermal quantities: (a) σ0 normalized to the IAEA A-5 reference [51] with the long teal bar showing the dataset-level resampling 95% interval and the short rust bar the delta-method interval; (b) partial-resonance integrals normalized to their own point estimate, restricted to nuclides with at least three independent datasets.
Four findings follow. (1) The 241Am discrepancy is not significant: the resampling interval 526–702 b contains 587 ± 12 b, whereas the delta-method uncertainty is a factor of eighty narrower. (2) The 243Am discrepancy is real: the interval 84.3–88.6 b excludes 75.1 ± 1.8 b by a wide margin. (3) The 235U and 238U thermal fits are unidentifiable over the narrow available energy span (delta-method uncertainties of order 104–107 b). (4) For 239Pu and 241Pu, the resampling degenerates to only two datasets; the delta-method uncertainties should be read as a lower bound.
3.2. Regime 2—The Resonance Region
3.2.1. Group Averaging and the RRR/URR Split
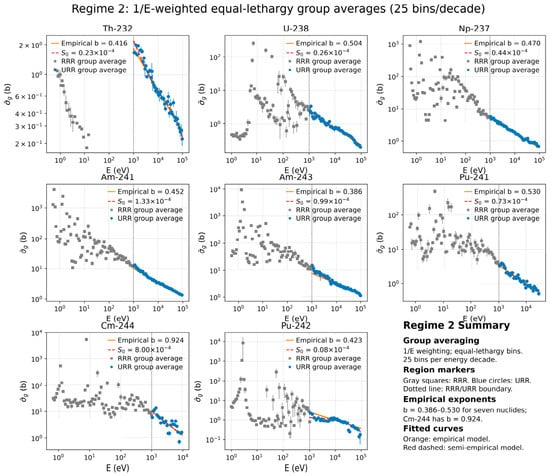
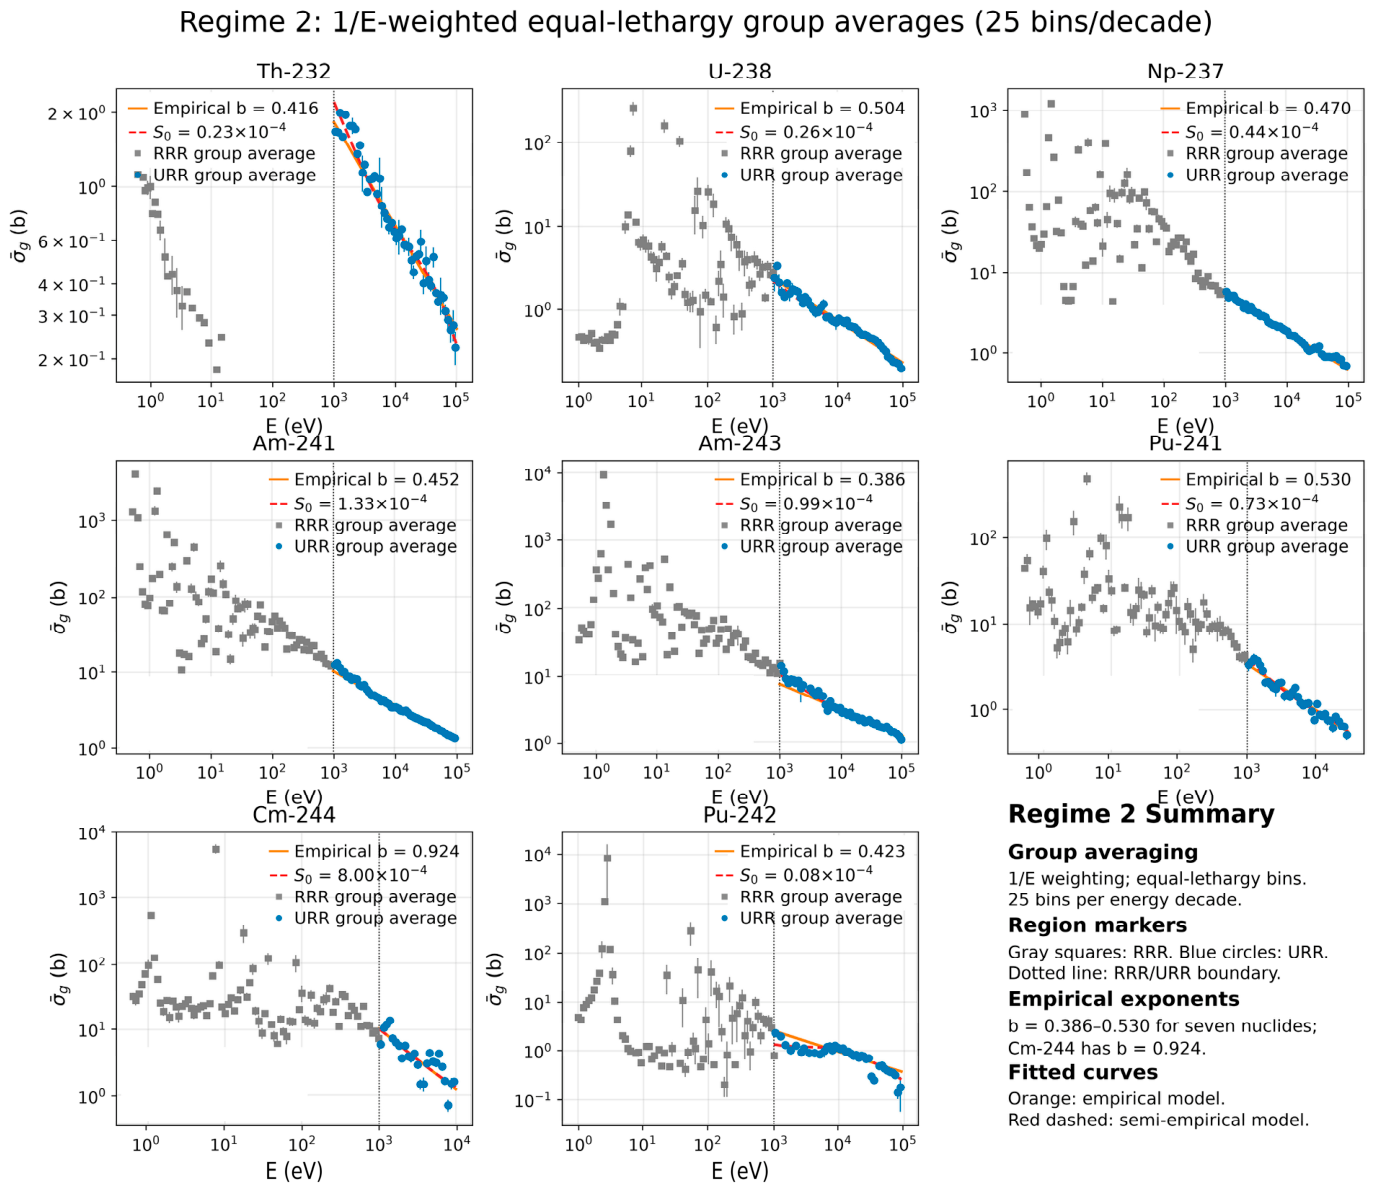
Between 0.5 eV and 100 keV, the cross section contains many resonances, so a smooth few-parameter formula cannot describe individual measurements. To summarize the energy dependence on a coarser scale, the data were binned into equal-lethargy groups, meaning intervals of equal width in ln E, at 25 bins per decade and averaged with a 1/E weight:
In Equation (4), Eg and Eg+1 are the lower and upper boundaries of group g. The denominator normalizes the 1/E weight, so the result is an average cross section rather than an integral. Partial resonance integrals then follow as RI = Σg ⟨σ⟩g · ln(Eg+1/Eg). The resonance regime is split into Regime 2a (RRR, 0.5 eV–1 keV, empirical description only) and Regime 2b (URR, 1–100 keV, both descriptions applicable); the boundary follows the actinide convention of the ENDF-6 formats [23].
3.2.2. Regime 2a—Resolved Resonance Region
Group averages were fitted with ⟨σ⟩g = A·E−b (Table 7).
Table 7.
Empirical power-law fits to 1/E-weighted group averages in the resolved-resonance region (0.5 eV—1 keV).
A negative R2 for ten of twelve nuclides establishes an important diagnostic negative result: after 1/E averaging at 25 bins per decade, the RRR admits no power-law description, and RRR cross sections are better represented by tabulated group values than by a single smooth parameterization. The brrr values should be read only as a coarse slope indicator (as used in Section 3.4), never as a predictive model. The partial resonance integrals, with their group and point counts, are also listed in Supplementary Table S6.
3.2.3. Regime 2b—Unresolved Resonance Region
The empirical description again fits ⟨σ⟩g = A·E−b. The semi-empirical description is the statistical average over many overlapping resonances, retaining s- and p-waves, with the reduced wavelength in barns π ƛ2 = (6.507 × 10⁵/E[eV]) · (A/(A + 1))2, the s-wave strength function ⟨Γn0⟩/⟨D⟩ = S0·√E, and a p-wave term. Reduced neutron widths follow a Porter–Thomas distribution, whereas radiation widths are nearly constant; Jensen’s inequality implies that the width-fluctuation average is less than or equal to the no-fluctuation expression, and the correction is applied throughout as the primary URR model:
In Equation (6), Rℓ = ⟨Γnℓ⟩/⟨D⟩ and Rγ = ⟨Γγ⟩/⟨D⟩ are average-width-to-level-spacing ratios, and ℓ = 0, 1 labels the retained s- and p-wave contributions. In Equation (5), x is the fluctuating reduced neutron width normalized to its mean, F averages the capture factor over that fluctuation, and W compares the result with the no-fluctuation expression. These equations provide an average description of the unresolved region rather than a reconstruction of each individual resonance. Equation (6) contains no fission width: compound-nucleus decay is shared between the neutron and γ channels only. For the fissile targets 233U, 235U, 239Pu, and 241Pu, the ENDF/B-VIII.0 unresolved-resonance parameters give s-wave ⟨Γf⟩/⟨Γγ⟩ ratios of about 6–25, so fission competes strongly with capture; for 237Np, 241Am, and 243Am, the ratio is below 0.01, and it is zero for 232Th and 238U. To quantify the effect, the URR fits of the four fissile nuclides were repeated with a fission channel for each spin J, using the ENDF/B-VIII.0 ⟨Γf⟩/⟨Γγ⟩ ratios and numbers of fission degrees of freedom, with Porter–Thomas fluctuations of both the neutron and the fission widths; S0, S1, and Rγ remain the only fitted parameters (Supplementary Table S12). Relative to the fits without fission, the fitted Rγ increases only by factors of 1.1–1.9 and remains far below the RIPL-3 values, whereas S0 rises to 1.4–3.1 times the RIPL-3 values because a fission-to-radiation width ratio held fixed is largely compensated by a rescaling of the neutron strength functions. Because fission competition cannot be neglected for these targets, the fission-inclusive fits are adopted as the primary statistical-model results for 233U, 235U, 239Pu, and 241Pu in Table 8; the fits without fission are retained only in Table 9, where they isolate the effect of the width-fluctuation correction. With fission included, the AIC preference changes only for 233U, for which the empirical form becomes preferred (ΔAIC = 4.6); for 235U, the empirical form remains preferred by a reduced margin (ΔAIC = 0.7), and for 239Pu and 241Pu, the statistical model remains preferred (ΔAIC = 10.9 and 5.6, respectively).
Table 8.
URR (1–100 keV) fits: empirical power law versus width-fluctuation-corrected statistical model; asterisks mark the AIC-preferred model. † the fissile targets 233U, 235U, 239Pu, and 241Pu; the statistical model includes fission competition, with ⟨Γf⟩/⟨Γγ⟩ and the number of fission degrees of freedom fixed at the ENDF/B-VIII.0 values (Section 3.2.3; Supplementary Table S12); for the remaining nuclides, Equation (6) is used.
Table 9.
Effect of the width-fluctuation correction (WFC) on the fitted s-wave strength function and comparison with RIPL-3 [18]; asterisks mark the better AIC and strength-function agreement. For 233U, 235U, 239Pu, and 241Pu, both fits omit fission and serve only to isolate the effect of the WFC; the primary, fission-inclusive values for these targets are given in Table 8.
The expectation in Equation (5) was evaluated with an 80-node Gauss–Hermite quadrature, which converged to better than one part in 105 (Supplementary Text S1). No free parameters are added; S0, S1, and Rγ remain the only fitted quantities. Averaged over 1–100 keV, the correction factor W ranges from 0.689 (241Pu) to 0.965 (233U).
The statistical model is preferred for 7 of 12 nuclides on both AIC and BIC (Table 8 and Figure 4; Supplementary Tables S3 and S12) despite having one additional parameter. Because the semi-empirical parameters are bounded whereas A and b are not, the effective complexity of the statistical model is lower than its nominal parameter count; therefore, the criteria, if anything, over-penalize the physics model, so this bias works against the conclusion drawn rather than in its favor.
Figure 4.
Regime 2 for the eight best-covered nuclides: 1/E-weighted group averages at 25 bins per decade, gray squares in the RRR and blue circles in the URR, with the empirical power law (solid) and statistical model (dashed) fitted to URR groups only.
3.2.4. Physical Validity of the Fitted Parameters and the RIPL-3 Benchmark
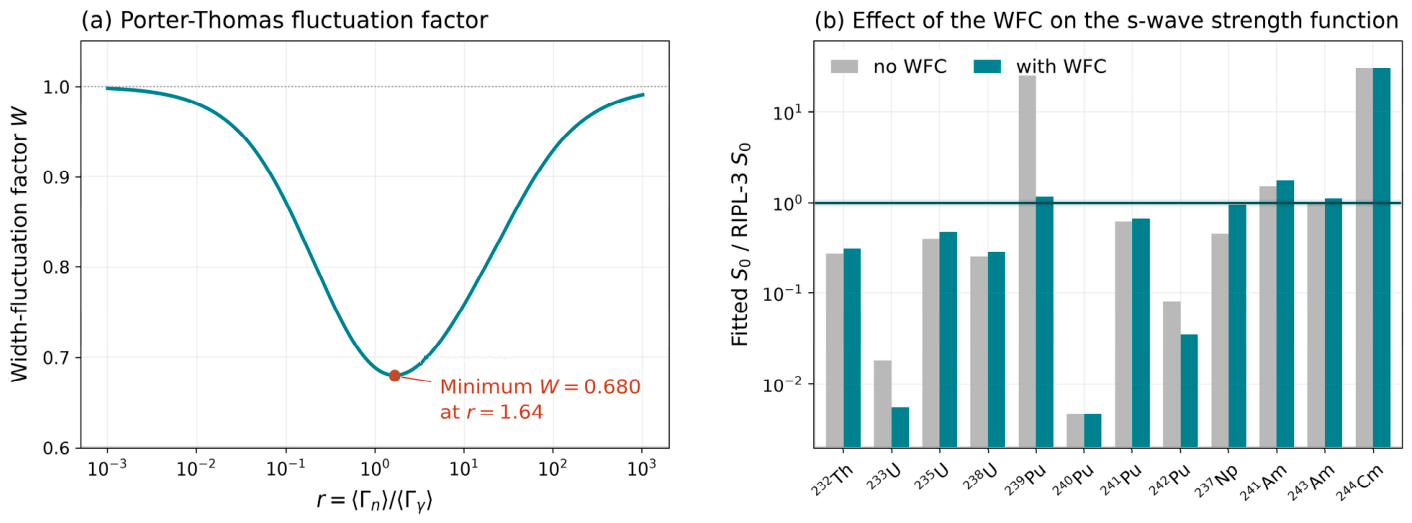
Reference S0, ⟨D0⟩ and ⟨Γγ⟩ are taken from the RIPL-3 recommended average s-wave resonance parameter file [18]. To isolate the effect of the correction, the URR data were also refitted with W ≡ 1 on the same group averages (Table 9 and Figure 5; Supplementary Table S4).
Figure 5.
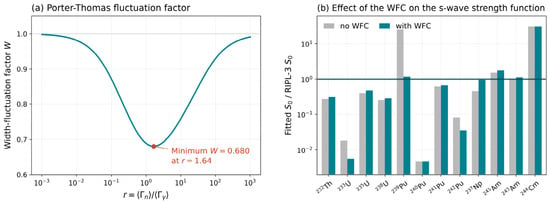
The Porter–Thomas width-fluctuation correction: (a) W(r) with its minimum of 0.680 at r = 1.64; (b) fitted s-wave strength function divided by the RIPL-3 value, without and with the correction; shaded band is the mean RIPL-3 uncertainty.
Four conclusions follow. (1) The correction removes the largest parameter-bound inconsistency: for 239Pu the uncorrected fit reaches the imposed upper bound for S0 while the corrected fit without fission gives a finite S0 = (1.40 ± 0.28) × 10−4; with fission competition included (Table 8), S0 = (3.70 ± 1.17) × 10−4, about three times the RIPL-3 value of (1.20 ± 0.10) × 10−4, so the correction removes the bound problem but does not by itself bring 239Pu into agreement with RIPL-3. (2) For 237Np, it moves S0 from a factor-of-two deficit to 5% agreement while worsening the in-sample fit, a signature of model misspecification, most likely a missing d-wave term or spin-statistical weight. (3) The correction does not resolve the discrepancies for 232Th or 238U: S0 rises by only 13–14%, which is insufficient to close a factor-of-four gap. (4) A systematic even–odd signature appears in Rγ: for the five even–even targets, the fitted-to-reference Rγ ratios range from approximately 0.98 to 2.12, whereas the odd-A targets give ratios of 0.042–0.382 with the fission-inclusive fits of Table 8 (0.022–0.382 without fission). This pattern is consistent with the single-J approximation being an important remaining model limitation; it does not establish that approximation as the unique cause of the discrepancy. Including fission competition for the fissile targets leaves this pattern intact (Section 3.2.3; Table 8): their Rγ ratios are 0.042–0.258, still far below the even–even values, so the even–odd signature is not an artifact of the omitted fission width.
3.2.5. Dataset-Level Hold-Out Validation
Information criteria reward in-sample fit; a model can be preferred by AIC yet generalize poorly when systematic errors are correlated within a campaign. Entire EXFOR datasets (about 20% per fold, up to 12 folds) were therefore withheld from URR fits, and the root-mean-square logarithmic error (RMSLE) was evaluated on the held-out data (Table 10; Supplementary Table S7).
Table 10.
Dataset-level hold-out validation in the URR (1–100 keV): RMSLE on held-out data for empirical and semi-empirical models across up to 12 folds per nuclide.
With only five nuclides, the 3-of-5 split carries no inferential weight. The exercise does, however, establish one qualitative negative result: the ranking produced by the information criteria is not reproduced out of sample. 238U is the decisive case: the semi-empirical model is strongly preferred by AIC and BIC, yet its hold-out RMSLE is 21% worse than that of the empirical model, which is the signature of a model whose parameters have absorbed dataset-specific normalization structure.
3.2.6. 232Th and 238U Strength Functions and Dataset Normalizations
The s-wave strength functions fitted for 232Th and 238U lie a factor of three to four below the RIPL-3 recommended values, whereas for 237Np the corrected fit agrees with RIPL-3 to within about 5%; for 239Pu the 16% agreement obtained without fission does not survive the inclusion of fission competition, which places S0 about three times above RIPL-3 (Table 8). The URR group fits do not include dataset normalizations, but a factor of three to four far exceeds credible normalization errors of 5–15% [50], so the residual gap reflects a genuine limitation of the s + p statistical kernel. This gap therefore indicates where a full Hauser–Feshbach treatment with optical-model transmission coefficients and explicit fission competition, with fitted rather than fixed fission widths, becomes indispensable.
3.3. Regime 3—The Fast Region (0.1–1.0 MeV)
3.3.1. Scope, Screening and Empirical Descriptions
The fast region is restricted to 0.1–1.0 MeV, which for most of these nuclides lies below the fast-fission threshold. Only five nuclides have usable data: 232Th, 238U, 237Np, 239Pu and 241Am. Outlier screening within quarter-decade lethargy windows rejected three points in total. Two empirical forms were fitted: a log-quadratic log10 σγ = a + b·log10 E + c·(log10 E)2 and an exponential σγ = A·E−α·exp(−β·E).
Even the empirical fits have limited descriptive accuracy (R2 of 0.31–0.72) because the fast-region record is dominated by scatter between campaigns, not by structure in the cross section. A variance decomposition on the residual ln σγ, splitting the residual into between-dataset and within-dataset components with intraclass correlation ρI = σB2/(σB2 + σW2), gives ρI ≈ 0.5: roughly half the unexplained variance is disagreement between campaigns. No smooth function of energy can materially exceed the observed R2 on pooled data without fitting the disagreement itself.
3.3.2. Failure of the Closed-Form Hauser–Feshbach Model
A closed-form statistical calculation was attempted with the compound-nucleus formation cross section evaluated in the black-nucleus approximation σCN = π(R + ƛ)2, a back-shifted Fermi-gas level density, a standard Lorentzian E1 γ-strength function (EG = 14 MeV, ΓG = 5 MeV), and σγ = σCN · Tγ/(Tγ + C·Tn) with the level-density parameter a and neutron-competition scale C free. The scope of this test should be stated precisely: it concerns a closed-form model with a black-nucleus formation cross section, not Hauser–Feshbach theory as implemented in modern reaction codes.
For 232Th, 238U, and 237Np the R2 is negative (−1.14, −1.04, −0.41), and for all five nuclides the level-density parameter reaches its imposed lower bound with a/A ≈ 0.034 against the established actinide value near 0.11 MeV−1 [19]. The closed-form model used here omits optical-model transmission coefficients, fission competition, direct/semi-direct capture, and the width-fluctuation correction, and it does not describe the measured capture of 232Th, 238U, and 237Np over 0.1–1.0 MeV; this result applies to that model and should not be read as a limitation of statistical models in general. To identify the missing physics, the same screened data were compared with a complete Hauser–Feshbach calculation, TALYS-2.24 [16] with its default global parameters and no adjustment (Figure 6; Supplementary Table S13). Without any fitted parameters, TALYS gives R2 = −0.25 for 232Th (closed-form model −1.14) and reproduces the energy dependence of 232Th, 238U, and 239Pu: after a single overall normalization, its R2 is 0.32, 0.32, and 0.57, comparable to the empirical fits. Its absolute magnitude is low by factors of 1.19 (232Th), 1.64 (238U), and 2.08 (239Pu), a known consequence of unadjusted global γ-strength and level-density parameters. The wrong slope of the closed-form model therefore arises mainly from its omitted physics, whereas the magnitude requires the parameter adjustment that is routine in evaluations. Neither calculation reproduces the 237Np data (TALYS R2 = −0.05), whose structure near 0.15–0.25 MeV is not captured by either model.
Figure 6.
Regime 3: fast-region (0.1–1.0 MeV) fits for the five usable nuclides showing the two empirical parameterizations and the closed-form Hauser–Feshbach curve, which has the wrong slope for 232Th, 238U, and 237Np (negative R2), together with a complete TALYS-2.24 calculation with default parameters (dotted; no fitted parameters). Closed-form curves are drawn with the fitted parameters of Table 11.
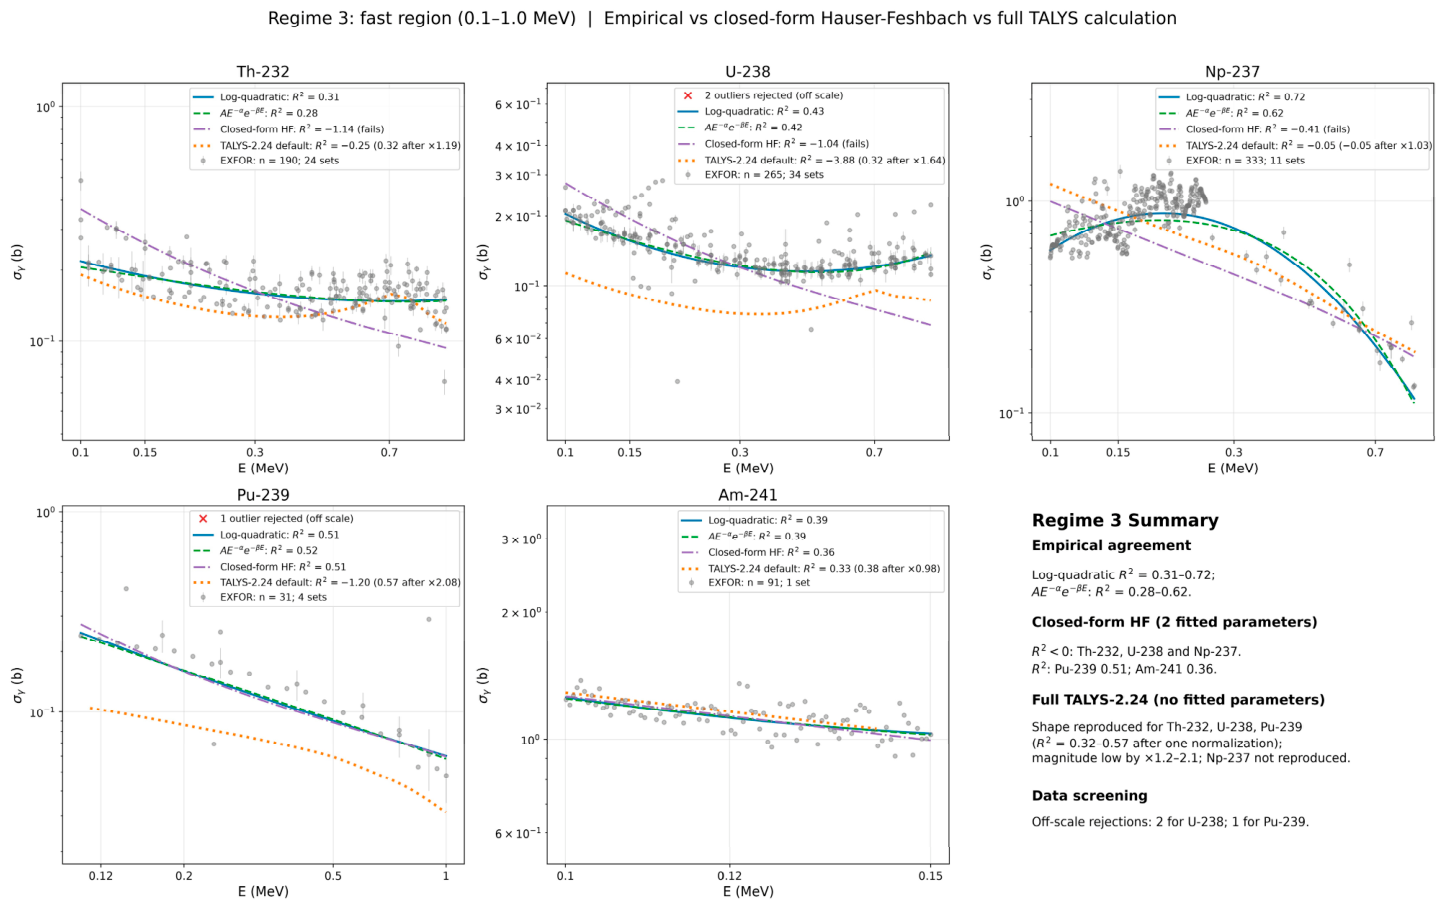
Table 11.
Fast-region (0.1–1.0 MeV) fits: log-quadratic and exponential empirical forms versus the closed-form Hauser–Feshbach model (HF) of Section 3.3.2.
3.3.3. Normalization Treatment and Its Diagnostic Value
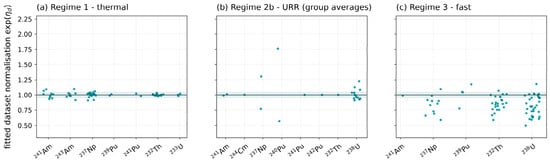
Fitted per-dataset normalizations in the fast region spread over a factor of two (18/24 232Th and 24/34 238U datasets with fitted scale shifts exceeding 5%, many of them reaching 0.5–0.6; Figure 7), far outside any credible normalization uncertainty for capture measurements [50]; the aggregate fast-region normalization diagnostics are given in Supplementary Table S9. The nuisance parameters are therefore absorbing model error rather than experimental systematics, and the conclusion that the closed-form model fails is strengthened, not weakened, by allowing normalization freedom (χ2ν remains at 98 and 144 for 232Th and 238U).
Figure 7.
Fitted per-dataset normalization factors exp(nd) for (a) the thermal region (Regime 1), (b) the URR group averages (Regime 2b) and (c) the fast region (Regime 3); each point is one EXFOR dataset, the solid line marks unity and the gray band marks the ±5% Gaussian prior.
3.4. Systematics Across the Actinide Chain
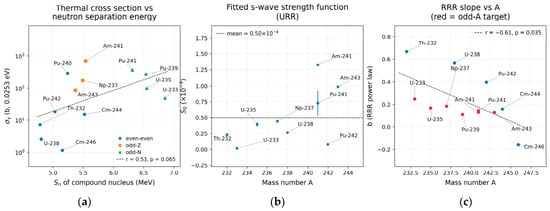
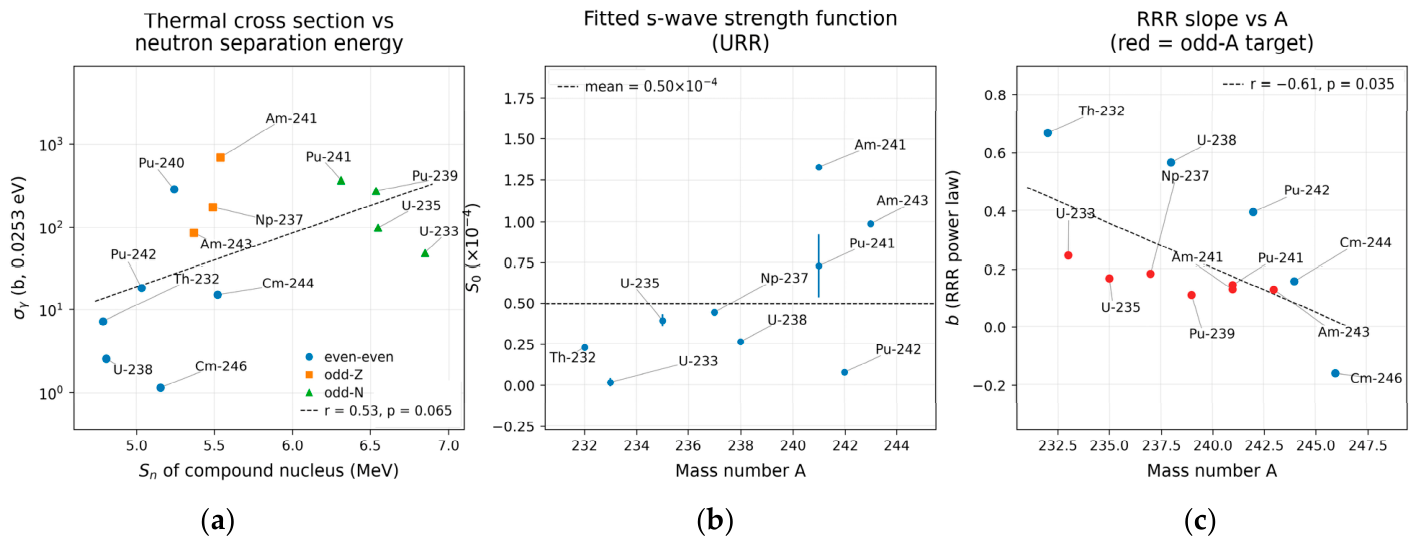
Fitted parameters were correlated with mass number A, neutron excess (N − Z)/A, compound-nucleus separation energy Sn [55], and target odd/even character, drawing on the thermal cross sections of Section 3.1, the RRR slopes of Section 3.2.2 and the URR strength functions of Section 3.2.3 (Figure 8). The nominally significant relationships are as follows:
Figure 8.
The Three Principal Candidate Systematics: (a) thermal σ0 versus compound-nucleus neutron separation energy, coded by even–even, odd-Z, and odd-N characters; (b) fitted URR s-wave strength function versus A; (c) RRR slope brrr versus A with odd-A targets highlighted. Dashed lines are least-squares trends that do not survive multiple-comparison correction.
- log10 σ0 = −2.009 + (0.658 ± 0.320)·Sn, r = 0.526, p = 0.065, n = 13;
- σ0 versus odd/even character: Spearman ρ = 0.660, p = 0.014;
- brrr versus A: r = −0.610, p = 0.035; versus (N − Z)/A: r = 0.579, p = 0.048;
- RIpartial versus A: ρ = 0.648, p = 0.023.
Multiple-Comparison Caveat: Thirty-six tests were performed, for which ≈1.8 false positives are expected at α = 0.05; none survive the Bonferroni correction (α = 0.0014). This section is therefore a screening exercise producing four candidate relationships, each with a physical rationale and each requiring a larger independent sample. No other result in this paper depends on it.
Neutron–Proton Asymmetry and the Rγ Benchmark
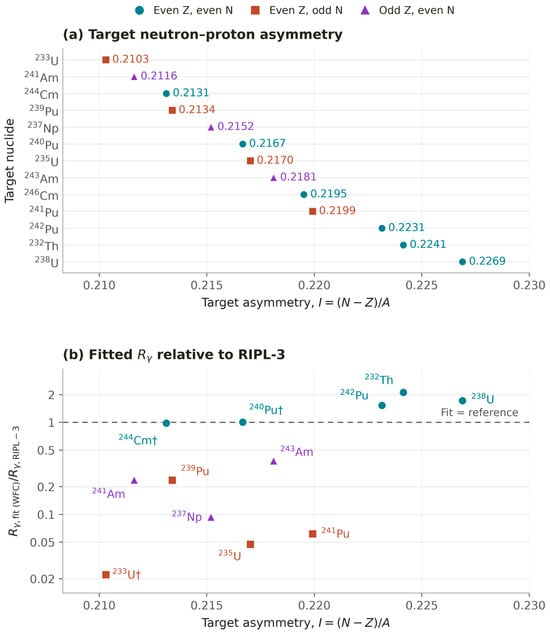
Figure 9 combines the target neutron–proton asymmetry I = (N − Z)/A with a comparison of the fitted and reference Rγ values in Table 9. Here A = N + Z, and the even/odd classes refer to the target nucleus, not the compound nucleus. All thirteen targets have I > 0; the figure therefore compares degrees of neutron excess rather than dividing the sample into N = Z and N ≠ Z nuclei. The even/odd classification describes the proton and neutron counts and is not a classification of spatial symmetry.
Figure 9.
Neutron–proton asymmetry and the Rγ benchmark comparison. (a) I = (N − Z)/A for the thirteen target nuclides, with color and symbol distinguishing even Z/even N, even Z/odd N and odd Z/even N. (b) Rγ from the width-fluctuation-corrected fit divided by the RIPL-3 reference value, plotted against target I on a logarithmic vertical scale. Ratios use the rounded entries in Table 9; the dashed line marks unity. 246Cm is omitted from panel (b) because no paired entry is tabulated. No uncertainty bars are shown because Table 9 does not report Rγ uncertainties. In panel (b), the dagger (†) marks fits with S0 at an imposed parameter bound. The comparison is descriptive and does not establish symmetry breaking.
Among the twelve targets with paired Rγ entries in Table 9, the five even–even targets have fitted-to-reference ratios of approximately 0.98–2.12; the seven odd-A targets have ratios of 0.022–0.382. With the fission-inclusive fits of Table 8, the four fissile targets give 0.042–0.258, so the odd-A range becomes 0.042–0.382, and the separation is unchanged. The plot shows this separation by target class across overlapping ranges of I. This is a descriptive, composition-resolved model diagnostic, not a demonstration that neutron excess causes the discrepancy or that Rγ follows a universal monotonic dependence on I. The pattern is consistent with the model limitations discussed in Section 3.2.4, but does not uniquely identify their origin. No new significance test is claimed; Rγ uncertainties are not tabulated in Table 9, and three displayed fits have S0 at an imposed bound.
3.5. Fit Quality Across the Three Regimes
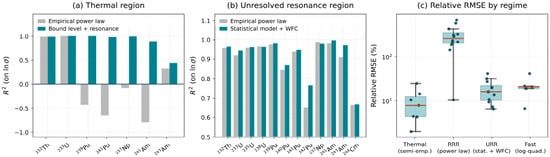
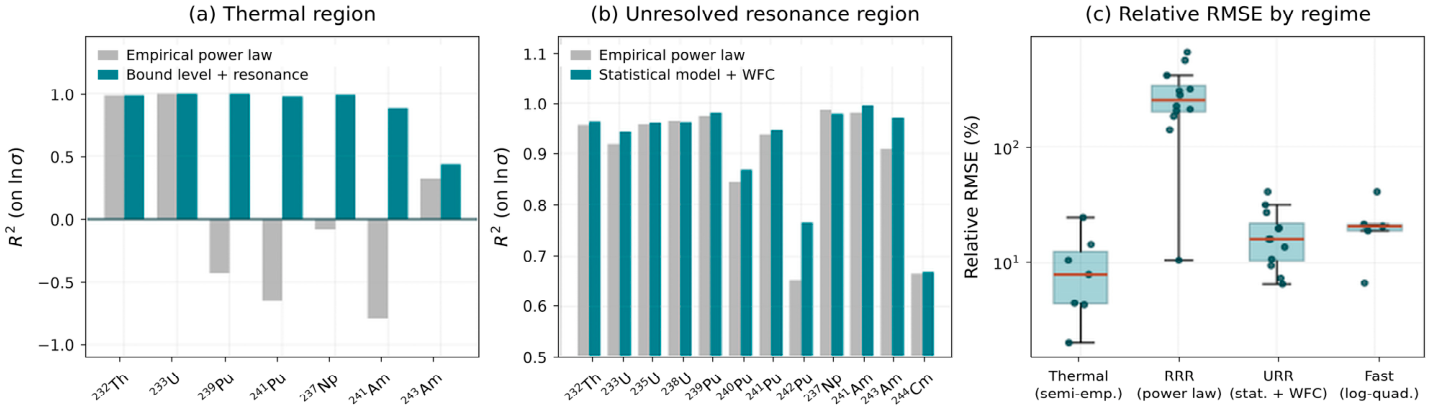
The following comparison summarizes fit quality across the three regimes, as discussed in Section 3.1, Section 3.2 and Section 3.3 and illustrated in Figure 10. In the thermal region, adding the bound level and first positive-energy resonance reduces RMSE by factors of 5 to 53 for 239Pu, 241Pu, 237Np, and 241Am and turns a negative R2 into 0.885–0.999. 243Am is the only unsatisfactory case because its thermal record is dominated by mutually inconsistent normalizations.
Figure 10.
Fit Quality Across the Three Regimes: (a) R2 on ln σγ in the thermal region for empirical (gray) and semi-empirical (teal) models; (b) R2 in the URR for empirical and width-fluctuation-corrected statistical models; (c) distribution of relative RMSE for the preferred model in each regime on a logarithmic scale.
The resonance region contains the central negative result of this paper. In the RRR, the relative RMSE is 107–677% for eleven of twelve nuclides, and R2 is negative for ten (Table 7). The URR behaves quite differently, with relative RMSE of 6–41% and R2 > 0.90 for ten of twelve, and the width-fluctuation correction lowers RMSE for eight nuclides.
In the fast region, the two empirical forms are practically indistinguishable, whereas the closed-form Hauser–Feshbach model is worse by 25–102% for 232Th, 238U, and 237Np with negative R2 for all three. Relative RMSE of 7–41% also makes the fast region the least well constrained of the three.
4. Discussion
4.1. Where Semi-Empirical Models Improve the Description
What works is the thermal region. The semi-empirical model is decisively superior wherever a low-lying resonance exists, recovering its energy to more than 3% from cross-section data alone; where none exists, it correctly collapses to the bound-level term, and the simpler power law is preferred.
What partly works is the URR. The semi-empirical model is preferred by AIC for 7 of 12 nuclides but by dataset-level hold-out validation for only 3 of 5. The difference between these two selection rates is itself informative: it indicates how much of the AIC advantage reflects physics and how much reflects the absorption of dataset systematics.
What does not work is the RRR and the fast region. The systematically negative R2 of Section 3.2.2 provides a diagnostic result that is easy to overlook: RRR cross sections are better represented by tabulated group values than by a single smooth parameterization. In the fast region, the closed-form model does not describe the data even when 24–34 free normalizations are allowed, showing that this specific closed-form black-nucleus approximation is inadequate for actinides at these energies; a default TALYS calculation reproduces the energy dependence for 232Th, 238U, and 239Pu after a single normalization (Supplementary Table S13), so the inadequacy lies in the approximation rather than in statistical-model theory. Independently, roughly half the unexplained fast-region variance is inter-campaign disagreement.
4.2. 245Cm as a Measurement Priority, and the Leading URR Defect
245Cm was excluded because only two thermal EXFOR points exist. This is a serious gap: 245Cm has a high thermal fission cross section, dominates buildup of higher curium isotopes, and its capture-to-fission ratio directly affects transmutation-efficiency estimates for minor-actinide burning [28,29]. A modern time-of-flight capture measurement covering the resonance region would be of substantial value.
The even–odd signature in Rγ (Section 3.2.4) points to the collapse of two J channels into one effective ⟨D⟩ as the principal remaining model deficiency, ahead of the missing d-wave term and the omitted elastic-enhancement correction. Because RIPL-3 tabulates ⟨D0⟩ for all thirteen nuclides, Rγ can be constrained, breaking the S0–Rγ degeneracy and making S0 individually meaningful.
4.3. What the Uncertainty Analysis Implies for the Corpus
The factor-of-eighty gap between delta-method and dataset-resampling intervals is more than a technical detail: it shows that for actinide capture the uncertainty of the pooled EXFOR record is dominated by systematic disagreement between independent measurement campaigns rather than by the counting statistics of any individual measurement. Two operational consequences follow: derived quantities should carry a dataset-level resampling interval, and nuclides resting on fewer than three independent datasets (239Pu and 241Pu thermally; 241Pu and 242Pu for RIpartial) should be flagged as having no meaningful empirical uncertainty. Every table entry reports its contributing dataset count.
4.4. Limitations
Several limitations should be noted. Experimental provenance is not explicitly weighted: all datasets share the same normalization prior, so modern time-of-flight campaigns are not favored over older activation measurements. Within the model, the single-ℓ approximation biases the URR by up to a factor of 4–5 and is the leading known model defect, while the URR d-wave term remains approximate and fission competition is included for the fissile targets (Table 8) only with ⟨Γf⟩/⟨Γγ⟩ fixed at the ENDF/B-VIII.0 values, so their S0 and S1 remain correlated with that assumed ratio, and the Moldauer elastic-enhancement term is omitted. Normalization parameters can also absorb model error: fitted values of 0.5–0.6 in the fast region are not credible as experimental normalizations. Uncertainty quantification is uneven: dataset resampling requires at least three independent datasets, so for 239Pu, 241Pu, 242Pu, and several RRR cases, only the delta method of uncertainty is available. Finally, thirteen nuclides cannot establish systematics surviving multiple-comparison correction.
The source-export comparison in Supplementary Table S10 shows substantial regime dependence: the reported median is 35.22% in the RRR but approximately 5–6% in the thermal, URR, and fitted fast-energy intervals. The 10% surrogate is therefore not a regime-specific estimate or a conservative bound for all observations. Missing uncertainties may have a different distribution from reported uncertainties, and densely sampled datasets contribute more strongly to point-weighted summaries. To test the effect of the 10% choice, every fit that uses point uncertainties—the thermal fits (Table 3, Table 4, Table 5 and Table 6) and the fast-region fits (Table 11)—was repeated with the surrogate set to 5%, 20%, and the regime-specific medians (5.54% thermal, 5.49% fast), with all other settings unchanged (Supplementary Table S11). The RRR and URR group fits, and the hold-out test, do not use point uncertainties: each group carries the standard error of its points, with a 15% fallback for single-point groups; varying that fallback between 7.5% and 30% leaves R2 negative for ten of twelve RRR nuclides and changes the URR AIC count by, at most, one nuclide (235U). In the thermal region σ0 changes by at most 0.3% for six of seven nuclides and by up to 6.6% for 241Am, whose power-law fit is poor (χ2ν ≈ 28); first-resonance energies change by less than 1%, the AIC preference is unchanged for all seven nuclides, and every σ0 remains inside its baseline resampling interval except the bound-plus-resonance 237Np value under the regime-median surrogate (176.2 b against 176.6–178.9 b). In the fast region, the closed-form Hauser–Feshbach model gives negative R2 for 232Th, 238U, and 237Np under every assumption (−0.29 to −1.26), and the log-quadratic form remains preferred for these three nuclides; only the 241Am preference, decided at baseline by ΔAIC = 0.3, changes. The conclusions are therefore insensitive to the surrogate, although missing-error scales were not estimated jointly with the fits. The normalization robustness check in Section 3.1.4 concerns a different component of the uncertainty model.
No point-by-point comparison with evaluated libraries was performed. Fits are benchmarked against compiled integral quantities and RIPL-3 parameters rather than pointwise against ENDF/B-VIII.0, JEFF-3.3 or JENDL-5. The omission is deliberate: below 1 keV an evaluated file is a reconstruction from resolved-resonance parameters, so the comparison would measure smooth curve against resonance structure; over 1–100 keV the evaluated curve is itself a statistical-model calculation of the same family. Such a comparison would be informative mainly in the fast region, where this study has already concluded that a full reaction-code calculation is required.
4.5. Methodological Extensions
A useful future extension is to estimate uncertainty scales for observations with unreported uncertainties jointly with the physical parameters, potentially within a hierarchical model that also represents dataset-wide normalization differences. These are separate components: estimating normalization scales alone does not determine the missing pointwise uncertainties. Such an extension is not implemented in the present revision; the common 10% surrogate is retained. A crossed variance-component analysis by epoch and technique (activation, total-absorption calorimetry, total-energy detection) could additionally attribute between-dataset variance to its sources.
Three further extensions target the model and the benchmarking. Re-integration of the evaluated libraries over 0.5 eV–1 keV would reconstruct pointwise cross sections onto a common grid, with MF33 covariances supplying the deferred weighted comparison. Explicit spin weighting with J-dependent level spacings, constrained by RIPL-3, would break the degeneracy between level density and strength function for the seven odd-A targets—the highest-value physics extension requiring no new data. A d-wave extension over a wider energy window is a natural next step. Beyond these, a full reaction-code calculation for the fast region using TALYS [16] or EMPIRE [17] is warranted. Finally, additional independent experimental campaigns are needed to strengthen the hold-out validation.
5. Conclusions
This analysis establishes a consistent three-regime empirical and semi-empirical parameterization of (n,γ) cross sections for thirteen actinides, based on 90,299 EXFOR data points and fitted solely to experimental data. As an external validation, the derived thermal cross sections agree with the IAEA reference compilation to within 3% for nine of the twelve nuclides with available reference values.
In the thermal region, the semi-empirical bound-level-plus-resonance model recovers the first-resonance energies for 239Pu, 241Pu, 237Np, 241Am, and 243Am to more than 3% from cross-section data alone, reducing χ2ν by factors of 2.4 to 450 relative to the power-law baseline. A closed-form Westcott factor gW = (2/√π)·Γ(2 − b) follows analytically from the empirical power law.
The resolved resonance region admits no such power-law description: R2 is negative for ten of twelve nuclides even after 1/E group averaging. In the URR, the width-fluctuation-corrected two-partial-wave statistical model, with fission competition included for the fissile targets, is preferred on AIC for seven of twelve nuclides but on dataset-level hold-out for only three of five; this gap indicates the extent to which information criteria can overstate the case for physics-based models when applied to heterogeneous experimental data. The Porter–Thomas correction frees the bound-limited 239Pu strength function (AIC 120.9 → 65.5) and brings 237Np to 5% agreement with RIPL-3, but it raises S0 for 232Th and 238U by only 13–14% and cannot explain their factor-of-four deficit. A systematic even–odd pattern in the fitted Rγ, which persists when fission competition is included for the fissile targets, identifies the single-J approximation as the principal remaining model deficiency; with fission competition included, as adopted for the fissile targets in Table 8, their S0 values lie at 1.4–3.1 times RIPL-3, so close agreement for 239Pu is obtained only when fission is omitted.
For the fast region, the closed-form black-nucleus model used here proves inadequate: the black-nucleus approximation distorts the level-density parameter by a factor of two to three, with χ2ν remaining at 98 and 144 for 232Th and 238U. A complete TALYS calculation with default parameters reproduces the energy dependence for 232Th, 238U, and 239Pu but underestimates the magnitude by factors of 1.2–2.1, so the failure is attributed to the approximations of the closed-form model, while absolute predictions still require adjusted parameters. Roughly half of the unexplained fast-region variance stems from inter-campaign disagreement.
The reported systematics across the actinide chain do not survive multiple-comparison correction and are therefore hypothesis-generating only. The central quantitative result emerges from the uncertainty comparison: dataset-level resampling intervals are up to eighty times wider than delta-method uncertainties, demonstrating that uncertainty in the actinide capture corpus is overwhelmingly dominated by systematic disagreement between independent measurement campaigns rather than by counting statistics. The main practical recommendation is therefore that no derived actinide capture quantity extracted from pooled EXFOR data should be published without an accompanying dataset-level resampling interval.
Supplementary Materials
The following supporting information can be downloaded at: https://www.mdpi.com/article/10.3390/sym18111820/s1, Table S1: nomenclature; Table S2: thermal-region AIC/BIC comparison; Table S3: URR AIC/BIC comparison; Table S4: URR AIC/BIC comparison with and without the width-fluctuation correction; Table S5: thermal σ0 values with dataset-resampling 95% intervals; Table S6: partial-resonance-integral point estimates; Table S7: URR dataset-level hold-out diagnostics; Table S8: fast-region AIC/BIC comparison; Table S9: aggregate fast-region normalization diagnostics; Table S10: reported relative uncertainties in the source EXFOR export; Table S11: sensitivity of the fits to the missing-uncertainty surrogate; Table S12: URR fits of the fissile targets including fission competition; Table S13: comparison of the fast-region data with a default TALYS-2.24 calculation; Text S1: Gauss–Hermite node-count convergence check at r = 1.64. Table S1–S13 and Text S1 are also supplied as machine-readable CSV files (S1.csv–S13.csv and S1Q.csv).
Author Contributions
Conceptualization, A.M.A. and S.S.N.; methodology, A.M.A.; software, A.M.A.; validation, A.M.A., S.A.A. and S.S.N.; formal analysis, A.M.A.; investigation, A.M.A. and S.A.A.; resources, S.S.N.; data curation, A.M.A. and S.A.A.; writing—original draft preparation, A.M.A.; writing—review and editing, S.A.A. and S.S.N.; visualization, A.M.A.; supervision, S.S.N.; project administration, A.M.A.; funding acquisition, A.M.A. All authors have read and agreed to the published version of the manuscript.
Funding
This research was funded by the Deanship of Scientific Research (DSR) at King Abdulaziz University, Jeddah, Saudi Arabia, under grant number IPP: 896-135-2026.
Data Availability Statement
All experimental data analyzed in this study are publicly available from the IAEA EXFOR database [48] at https://www-nds.iaea.org/exfor/ (accessed on 11 August 2026). Reported fitted parameters appear in the main-text tables. The accompanying Supplementary Materials provide the tabulated comparisons and derived-quantity summaries listed above, together with machine-readable CSV versions.
Acknowledgments
The authors thank the Deanship of Scientific Research (DSR) at King Abdulaziz University for financial and technical support, and the IAEA Nuclear Data Section for maintaining and distributing the EXFOR database that made this work possible.
Conflicts of Interest
The authors declare no conflicts of interest. The funders had no role in the design of the study; in the collection, analysis, or interpretation of data; in the writing of the manuscript; or in the decision to publish the results.
Abbreviations
The following abbreviations are used in this manuscript; mathematical symbols are defined in Supplementary Table S1:
| Abbrev. | Meaning |
| AIC | Akaike Information Criterion |
| BIC | Bayesian Information Criterion |
| CI | Confidence Interval |
| DANCE | Detector for Advanced Neutron Capture Experiments |
| DSID | Dataset Identifier |
| ENDF | Evaluated Nuclear Data File |
| EXFOR | Experimental Nuclear Reaction Database |
| HF | Hauser–Feshbach |
| IAEA | International Atomic Energy Agency |
| JEFF | Joint Evaluated Fission and Fusion (nuclear data library) |
| JENDL | Japanese Evaluated Nuclear Data Library |
| MOX | Mixed-Oxide (fuel) |
| n_TOF | neutron Time-of-Flight (CERN facility) |
| OECD-NEA | OECD Nuclear Energy Agency |
| RI | Resonance Integral |
| RIPL | Reference Input Parameter Library |
| RMSE | Root-Mean-Square Error |
| RMSLE | Root-Mean-Square Logarithmic Error |
| RRR | Resolved Resonance Region |
| rRMSE | relative Root-Mean-Square Error |
| URR | Unresolved Resonance Region |
| WFC | Width-Fluctuation Correction |
References
- Brown, D.; Chadwick, M.; Capote, R.; Kahler, A.; Trkov, A.; Herman, M.; Sonzogni, A.; Danon, Y.; Carlson, A.; Dunn, M.; et al. ENDF/B-VIII.0: The 8th major release of the nuclear reaction data library with CIELO-project cross sections, new standards and thermal scattering data. Nucl. Data Sheets 2018, 148, 1–142. [Google Scholar] [CrossRef] [Scilit]
- Plompen, A.J.M.; Cabellos, O.; Jean, C.D.S.; Fleming, M.; Algora, A.; Angelone, M.; Archier, P.; Bauge, E.; Bersillon, O.; Blokhin, A.; et al. The joint evaluated fission and fusion nuclear data library, JEFF-3.3. Eur. Phys. J. A 2020, 56, 181. [Google Scholar] [CrossRef] [Scilit]
- Iwamoto, O.; Iwamoto, N.; Kunieda, S.; Minato, F.; Nakayama, S.; Abe, Y.; Tsubakihara, K.; Okumura, S.; Ishizuka, C.; Yoshida, T.; et al. Japanese evaluated nuclear data library version 5: JENDL-5. J. Nucl. Sci. Technol. 2023, 60, 1–60. [Google Scholar] [CrossRef] [Scilit]
- Ge, Z.; Xu, R.; Wu, H.; Zhang, Y.; Chen, G.; Jin, Y.; Shu, N.; Chen, Y.; Tao, X.; Tian, Y.; et al. CENDL-3.2: The new version of the Chinese general purpose evaluated nuclear data library. EPJ Web Conf. 2020, 239, 09001. [Google Scholar] [CrossRef] [Scilit]
- Otuka, N.; Dupont, E.; Semkova, V.; Pritychenko, B.; Blokhin, A.; Aikawa, M.; Babykina, S.; Bossant, M.; Chen, G.; Dunaeva, S.; et al. Towards a more complete and accurate experimental nuclear reaction data library (EXFOR). Nucl. Data Sheets 2014, 120, 272–276. [Google Scholar] [CrossRef] [Scilit]
- Zerkin, V.; Pritychenko, B. The experimental nuclear reaction data (EXFOR): Extended computer database and web retrieval system. Nucl. Instrum. Methods Phys. Res. A 2018, 888, 31–43. [Google Scholar] [CrossRef] [Scilit]
- Lane, A.M.; Thomas, R.G. R-matrix theory of nuclear reactions. Rev. Mod. Phys. 1958, 30, 257–353. [Google Scholar] [CrossRef] [Scilit]
- Reich, C.W.; Moore, M.S. Multilevel formula for the fission process. Phys. Rev. 1958, 111, 929–933. [Google Scholar] [CrossRef] [Scilit]
- Larson, N.M. Updated Users’ Guide for SAMMY: Multilevel R-Matrix Fits to Neutron Data using Bayes’ Equations; Report ORNL/TM-9179/R8; Oak Ridge National Laboratory: Oak Ridge, TN, USA, 2008. [Google Scholar] [CrossRef] [Scilit] [PubMed]
- Fröhner, F.H. Evaluation and Analysis of Nuclear Resonance Data; JEFF Report 18; OECD Nuclear Energy Agency: Paris, France, 2000. [Google Scholar]
- Hauser, W.; Feshbach, H. The inelastic scattering of neutrons. Phys. Rev. 1952, 87, 366–373. [Google Scholar] [CrossRef] [Scilit]
- Porter, C.E.; Thomas, R.G. Fluctuations of nuclear reaction widths. Phys. Rev. 1956, 104, 483–491. [Google Scholar] [CrossRef] [Scilit]
- Moldauer, P.A. Statistical theory of nuclear collision cross sections. Phys. Rev. 1964, 135, B642–B653. [Google Scholar] [CrossRef] [Scilit]
- Gilbert, A.; Cameron, A.G.W. A composite nuclear-level density formula with shell corrections. Can. J. Phys. 1965, 43, 1446–1496. [Google Scholar] [CrossRef] [Scilit]
- Dilg, W.; Schantl, W.; Vonach, H.; Uhl, M. Level density parameters for the back-shifted Fermi gas model in the mass range 40 <A <250. Nucl. Phys. A 1973, 217, 269–298. [Google Scholar] [CrossRef] [Scilit]
- Koning, A.J.; Rochman, D. Modern nuclear data evaluation with the TALYS code system. Nucl. Data Sheets 2012, 113, 2841–2934. [Google Scholar] [CrossRef] [Scilit]
- Herman, M.; Capote, R.; Carlson, B.; Obložinský, P.; Sin, M.; Trkov, A.; Wienke, H.; Zerkin, V. EMPIRE: Nuclear reaction model code system for data evaluation. Nucl. Data Sheets 2007, 108, 2655–2715. [Google Scholar] [CrossRef] [Scilit]
- Capote, R.; Herman, M.; Obložinský, P.; Young, P.; Goriely, S.; Belgya, T.; Ignatyuk, A.; Koning, A.; Hilaire, S.; Plujko, V.; et al. RIPL—Reference Input Parameter Library for calculation of nuclear reactions and nuclear data evaluations (RIPL-3). Nucl. Data Sheets 2009, 110, 3107–3214. [Google Scholar] [CrossRef] [Scilit]
- International Atomic Energy Agency. IAEA-TECDOC-1506; Handbook for Calculations of Nuclear Reaction Data (RIPL-2): Reference Input Parameter Library. IAEA-TECDOC-1506; IAEA: Vienna, Austria, 2006.
- Westcott, C.H. Effective Cross Section Values for Well-Moderated Thermal Reactor Spectra, 3rd ed.; Report CRRP-960/AECL-1101; Atomic Energy of Canada: Chalk River, ON, Canada, 1960. [Google Scholar]
- Westcott, C.H.; Walker, W.H.; Alexander, T.K. Effective cross sections and cadmium ratios for the neutron spectra of thermal reactors. In Proceedings of the 2nd United Nations International Conference on the Peaceful Uses of Atomic Energy, Geneva, Switzerland, 1–13 September 1958. [Google Scholar]
- De Corte, F.; Simonits, A. Recommended nuclear data for use in the k0 standardization of neutron activation analysis. At. Data Nucl. Data Tables 2003, 85, 47–67. [Google Scholar] [CrossRef] [Scilit]
- Trkov, A.; Herman, M.; Brown, D.A. (Eds.) ENDF-6 Formats Manual: Data Formats and Procedures for the Evaluated Nuclear Data Files; Report BNL-203218-2018-INRE (ENDF-102); Brookhaven National Laboratory: Upton, NY, USA, 2018. [Google Scholar]
- OECD Nuclear Energy Agency. Assessment of the Unresolved Resonance Treatment for Cross-Section and Covariance Representation; Report NSC/WPEC/DOC(2011)430; OECD/NEA: Paris, France, 2011. [Google Scholar]
- MacFarlane, R.E.; Muir, D.W.; Boicourt, R.M.; Kahler, A.C.; Conlin, J.L. The NJOY Nuclear Data Processing System, Version 2016; Report LA-UR-17-20093; Los Alamos National Laboratory: Los Alamos, NM, USA, 2016. [Google Scholar]
- Nafee, S.S.; Al-Ramady, A.M.; Mohamed, N.M.; Alshammari, M.F. Accurate prediction of gaseous isotopes Xe and Kr concentrations from the burnup of nuclear fuel using simple regression algorithm. PLoS ONE 2023, 18, e0288329. [Google Scholar] [CrossRef] [Scilit] [PubMed]
- Alramady, A.M.; Nafee, S.S.; Alsharif, S.A. Regression analysis of isotopic concentrations in thorium-based fuel for gas-cooled fast reactors. Radiat. Phys. Chem. 2026, 243, 113731. [Google Scholar] [CrossRef] [Scilit]
- Salvatores, M.; Aliberti, G.; Palmiotti, G. (Coord.) Uncertainty and Target Accuracy Assessment for Innovative Systems Using Recent Covariance Data Evaluations; NEA Nuclear Science Vol. 26, WPEC Subgroup 26 Final Report; OECD/NEA: Paris, France, 2008. [Google Scholar]
- Salvatores, M.; Aliberti, G.; Palmiotti, G.; Rochman, D.; Oblozinsky, P.; Hermann, M.; Talou, P.; Kawano, T.; Leal, L.; Koning, A.; et al. Nuclear data needs for advanced reactor systems: A NEA Nuclear Science Committee initiative. In Proceedings of the International Conference on Nuclear Data for Science and Technology 2007; Art. 07298; EDP Sciences: Les Ulis, France, 2008. [Google Scholar] [CrossRef] [Scilit]
- Salvatores, M.; Aliberti, G.; Palmiotti, G. The role of differential and integral experiments to meet requirements for improved nuclear data. In Proceedings of the International Conference on Nuclear Data for Science and Technology 2007; Art. 07297; EDP Sciences: Les Ulis, France, 2008. [Google Scholar] [CrossRef] [Scilit]
- Salvatores, M.; Palmiotti, G. Production and use of nuclear parameter covariance data: An overview of challenging cross-cutting scientific issues. EPJ Nucl. Sci. Technol. 2018, 4, 6. [Google Scholar] [CrossRef] [Scilit]
- Jandel, M.; Bredeweg, T.A.; Bond, E.M.; Chadwick, M.B.; Clement, R.R.; Couture, A.; O’DOnnell, J.M.; Haight, R.C.; Kawano, T.; Reifarth, R.; et al. Neutron capture cross section of 241Am. Phys. Rev. C 2008, 78, 034609. [Google Scholar] [CrossRef] [Scilit]
- Fraval, K.; Wallner, A.; Lederer, C.; Eleftheriadis, C.; Leeb, H.; Giubrone, G.; Weis, C.; A Dressler, R.; Vlachoudis, V.; Losito, R.; et al. Measurement and analysis of the 241Am(n,γ) cross section with liquid scintillator detectors using time-of-flight spectroscopy at the n_TOF facility at CERN. Phys. Rev. C 2014, 89, 044609. [Google Scholar] [CrossRef] [Scilit]
- Mendoza, E.; Cano-Ott, D.; Altstadt, S.; Andriamonje, S.; Andrzejewski, J.; Audouin, L.; Balibrea, J.; Bécares, V.; Barbagallo, M.; Bečvář, F.; et al. Measurement and analysis of the neutron capture cross section of 241Am at the n_TOF facility at CERN. Phys. Rev. C 2018, 97, 054616. [Google Scholar] [CrossRef] [Scilit]
- Noguere, G.; Bouland, O.; Kopecky, S.; Lampoudis, C.; Schillebeeckx, P.; Plompen, A.; Gunsing, F.; Sage, C.; Sirakov, I. Partial-wave analysis of n + 241Am reaction cross sections in the resonance region. Phys. Rev. C 2015, 92, 014607. [Google Scholar] [CrossRef] [Scilit]
- Guerrero, C.; Cano-Ott, D.; Mendoza, E.; Abbondanno, U.; Aerts, G.; Álvarez-Velarde, F.; Andriamonje, S.; Andrzejewski, J.; Assimakopoulos, P.; Audouin, L.; et al. Measurement and resonance analysis of the 237Np neutron capture cross section. Phys. Rev. C 2012, 85, 044616. [Google Scholar] [CrossRef] [Scilit]
- Li, W.F.; Liu, L.L.; Niu, Z.M.; Niu, Y.F.; Huang, X.L. Predictions for the (n,γ) reaction cross section based on a Bayesian neural network approach. Phys. Rev. C 2024, 109, 044616. [Google Scholar] [CrossRef] [Scilit]
- Akaike, H. A new look at the statistical model identification. IEEE Trans. Autom. Control 1974, 19, 716–723. [Google Scholar] [CrossRef] [Scilit]
- Schwarz, G. Estimating the dimension of a model. Ann. Stat. 1978, 6, 461–464. [Google Scholar] [CrossRef] [Scilit]
- Efron, B. Bootstrap methods: Another look at the jackknife. Ann. Stat. 1979, 7, 1–26. [Google Scholar] [CrossRef] [Scilit]
- Efron, B.; Tibshirani, R. Bootstrap methods for standard errors, confidence intervals, and other measures of statistical accuracy. Stat. Sci. 1986, 1, 54–75. [Google Scholar] [CrossRef] [Scilit]
- Davison, A.C.; Hinkley, D.V. Bootstrap Methods and Their Application; Cambridge University Press: Cambridge, UK, 1997. [Google Scholar]
- Field, C.A.; Welsh, A.H. Bootstrapping clustered data. J. R. Stat. Soc. Ser. B Stat. Methodol. 2007, 69, 369–390. [Google Scholar] [CrossRef] [Scilit]
- Capote, R.; Smith, D.L. An investigation of the performance of the unified Monte Carlo method of neutron cross section data evaluation. Nucl. Data Sheets 2008, 109, 2768–2773. [Google Scholar] [CrossRef] [Scilit]
- Schnabel, G.; Leeb, H. A modified generalized least squares method for large-scale nuclear data evaluation. Nucl. Instrum. Methods Phys. Res. A 2017, 841, 87–96. [Google Scholar] [CrossRef] [Scilit]
- Alramady, A.M. Empirical neutron cross section formulae for (n,p) and (n,d) reactions of He-3 target. J. Appl. Math. Phys. 2021, 9, 1434–1441. [Google Scholar] [CrossRef]
- Nafee, S.S.; Al-Ramady, A.M.; Alshammari, M.F. Accurate formulae for the cross-section data for the radio-halogen I-123 from cyclotron production. Open J. Appl. Sci. 2023, 13, 1489–1497. [Google Scholar] [CrossRef]
- International Atomic Energy Agency Nuclear Data Services. EXFOR: Experimental Nuclear Reaction Database. Available online: https://www-nds.iaea.org/exfor/ (accessed on 11 August 2026).
- Alhassan, E.; Rochman, D.; Vasiliev, A.; Hursin, M.; Koning, A.J.; Ferroukhi, H. Iterative Bayesian Monte Carlo for nuclear data evaluation. Nucl. Sci. Tech. 2022, 33, 50. [Google Scholar] [CrossRef] [Scilit]
- Capote, R.; Badikov, S.; Carlson, A.; Duran, I.; Gunsing, F.; Neudecker, D.; Pronyaev, V.; Schillebeeckx, P.; Schnabel, G.; Smith, D.; et al. Unrecognized sources of uncertainties (USU) in experimental nuclear data. Nucl. Data Sheets 2020, 163, 191–227. [Google Scholar] [CrossRef] [Scilit]
- International Atomic Energy Agency. Handbook of Nuclear Data for Safeguards, Table A-5: Actinide Thermal Neutron Cross Sections, Resonance Integrals and Westcott Factors. Available online: https://nds.iaea.org/sgnucdat/a5.htm (accessed on 11 August 2026).
- International Atomic Energy Agency Nuclear Data Section. Thermal Neutron Capture Cross Sections and Resonance Integrals Table. Available online: https://www-nds.iaea.org/relnsd/NdsEnsdf/thermal-res-table.html (accessed on 11 August 2026).
- Mughabghab, S.F. Atlas of Neutron Resonances. Available online: https://www.nndc.bnl.gov/atlas/ (accessed on 11 August 2026).
- OECD Nuclear Energy Agency. Improving Nuclear Data Accuracy of the 241Am Capture Cross Section; Report NSC/R(2020)2; OECD/NEA: Paris, France, 2020. [Google Scholar]
- International Atomic Energy Agency. Live Chart of Nuclides: Ground-State Properties Service. Available online: https://nds.iaea.org/relnsd/vcharthtml/VChartHTML.html (accessed on 11 August 2026).

Disclaimer/Publisher’s Note: The statements, opinions and data contained in all publications are solely those of the individual author(s) and contributor(s) and not of MDPI and/or the editor(s). MDPI and/or the editor(s) disclaim responsibility for any injury to people or property resulting from any ideas, methods, instructions or products referred to in the content. |
© 2026 by the authors. Licensee MDPI, Basel, Switzerland. This article is an open access article distributed under the terms and conditions of the Creative Commons Attribution (CC BY) license.