


Abstract
This research focuses on the prediction and estimation problems for the generalized exponential distribution under Type-II censoring. Firstly, maximum likelihood estimations for the parameters of the generalized exponential distribution are computed using the EM algorithm. Additionally, confidence intervals derived from the Fisher information matrix are developed and analyzed alongside two bootstrap confidence intervals for comparison. Compared to classical maximum likelihood estimation, Bayesian inference proves to be highly effective in handling censored data. This study explores Bayesian inference for estimating the unknown parameters, considering both symmetrical and asymmetrical loss functions. Utilizing Gibbs sampling to produce Markov Chain Monte Carlo samples, we employ an importance sampling approach to obtain Bayesian estimates and compute the corresponding highest posterior density (HPD) intervals. Furthermore, for one-sample prediction and, separately, for the two-sample case, we provide the corresponding posterior distributions, along with methods for computing point predictions and predictive intervals. Through Monte Carlo simulations, we evaluate the performance of Bayesian estimation in contrast to maximum likelihood estimation. Finally, we conduct an analysis of a real dataset derived from deep groove ball bearings, calculating Bayesian point predictions and predictive intervals for future samples.
1. Introduction
In 1999, Reference [1] first formally introduced the generalized exponential distribution. It can also be regarded as a particular member of the three-parameter Exponentiated Weibull (EW) distribution, introduced by Reference [2]. Furthermore, its origins can be traced back to the early work of Gompertz and Verhulst, who introduced cumulative distribution functions for modeling human mortality and population growth. Interested readers can refer to References [3,4] for more details.
The probability density function (PDF) and cumulative distribution function (CDF) of generalized exponential distribution can be expressed as:
The hazard rate and reliability functions can be expressed as:
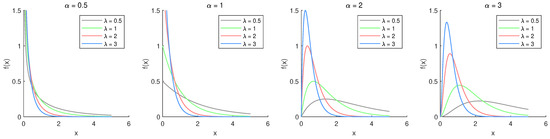
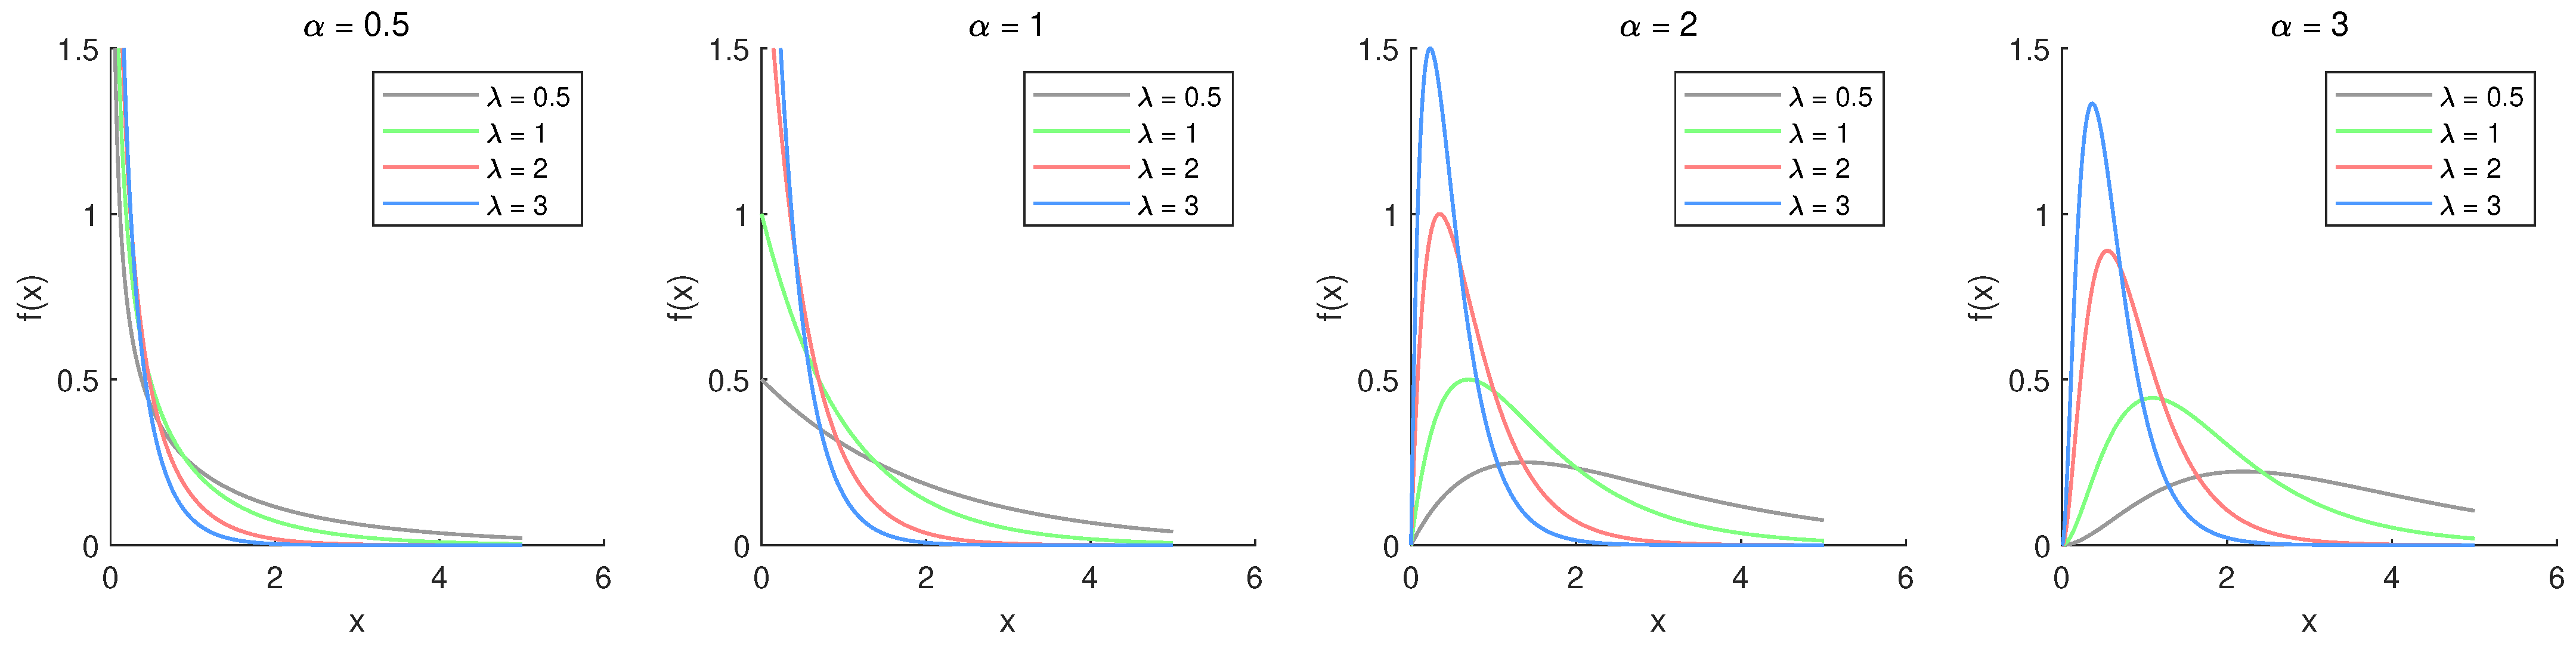
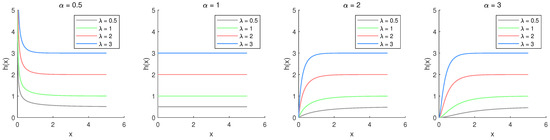
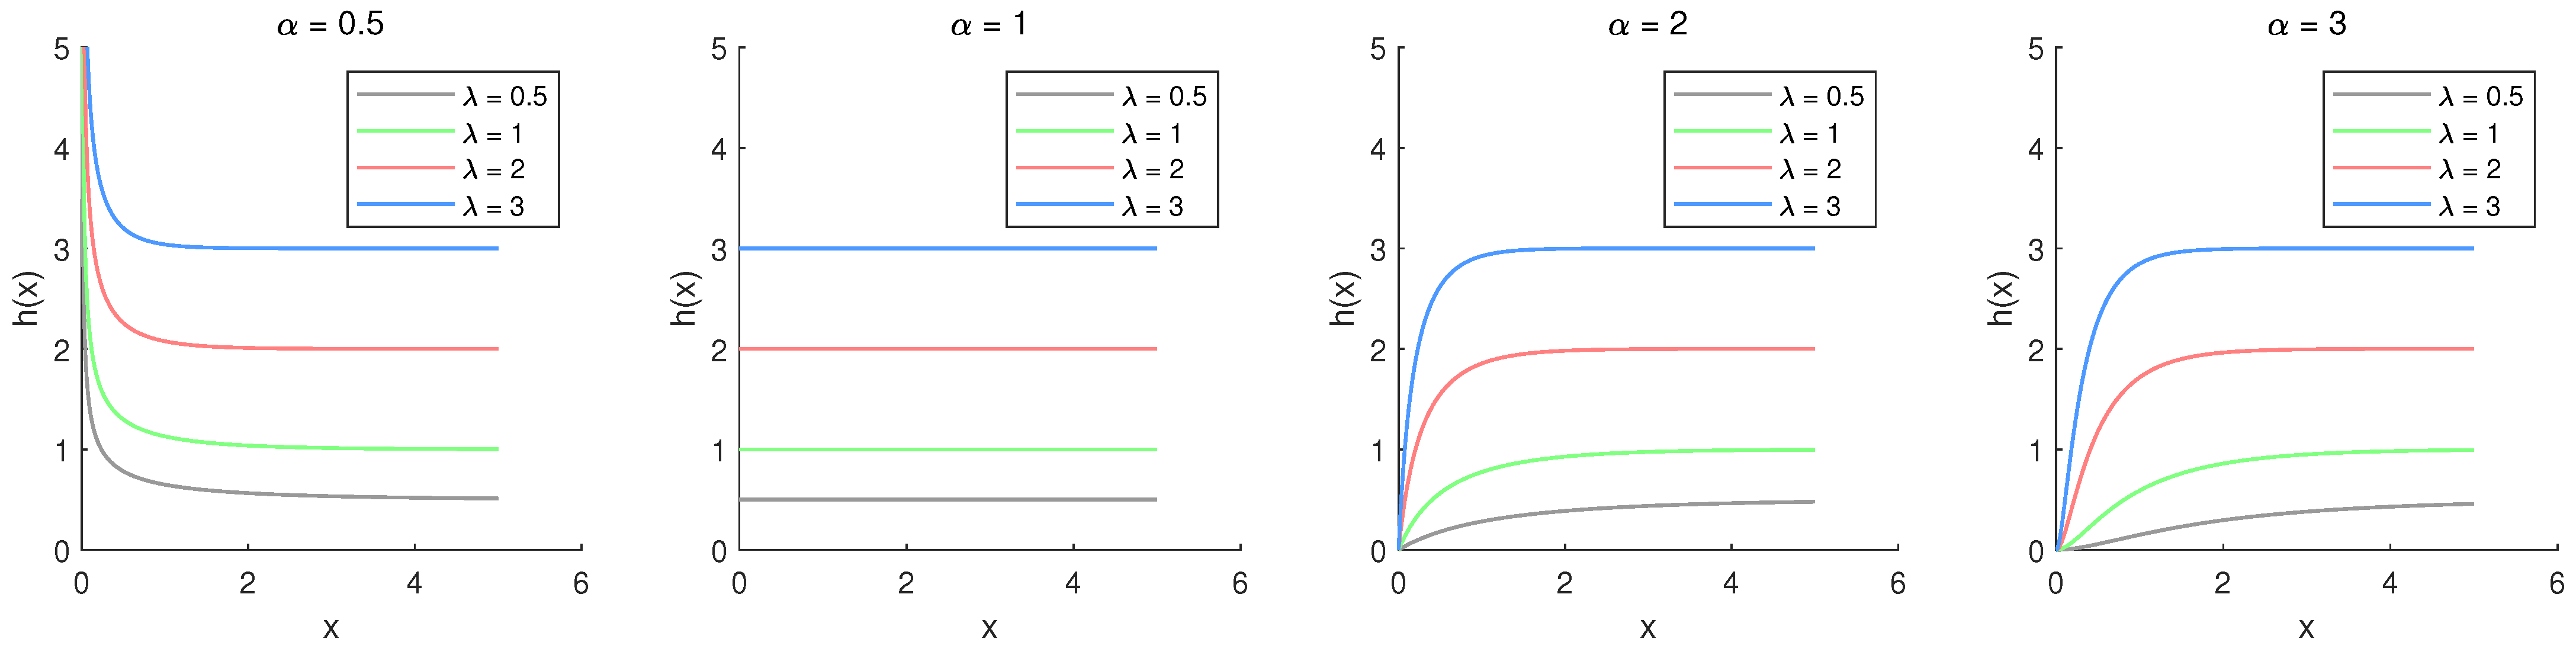
Figure 1 illustrates the PDF plots for the chosen parameter values. Based on Figure 1, the density function demonstrates different behaviors depending on . For , it is monotonically decreasing, whereas for , it becomes unimodal and right-skewed, similar to Weibull or Gamma distributions. The hazard rate plots with different parameter values are shown in Figure 2. It shows that the hazard function decreases when , remains constant when , and increases when . Notably, the hazard function eventually converges to the value of .
Figure 1.
PDF plots of the generalized exponential distribution for various parameter values.
Figure 2.
Hazard rate plots of the generalized exponential distribution for various parameter values.
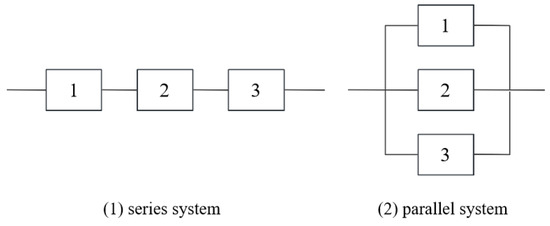
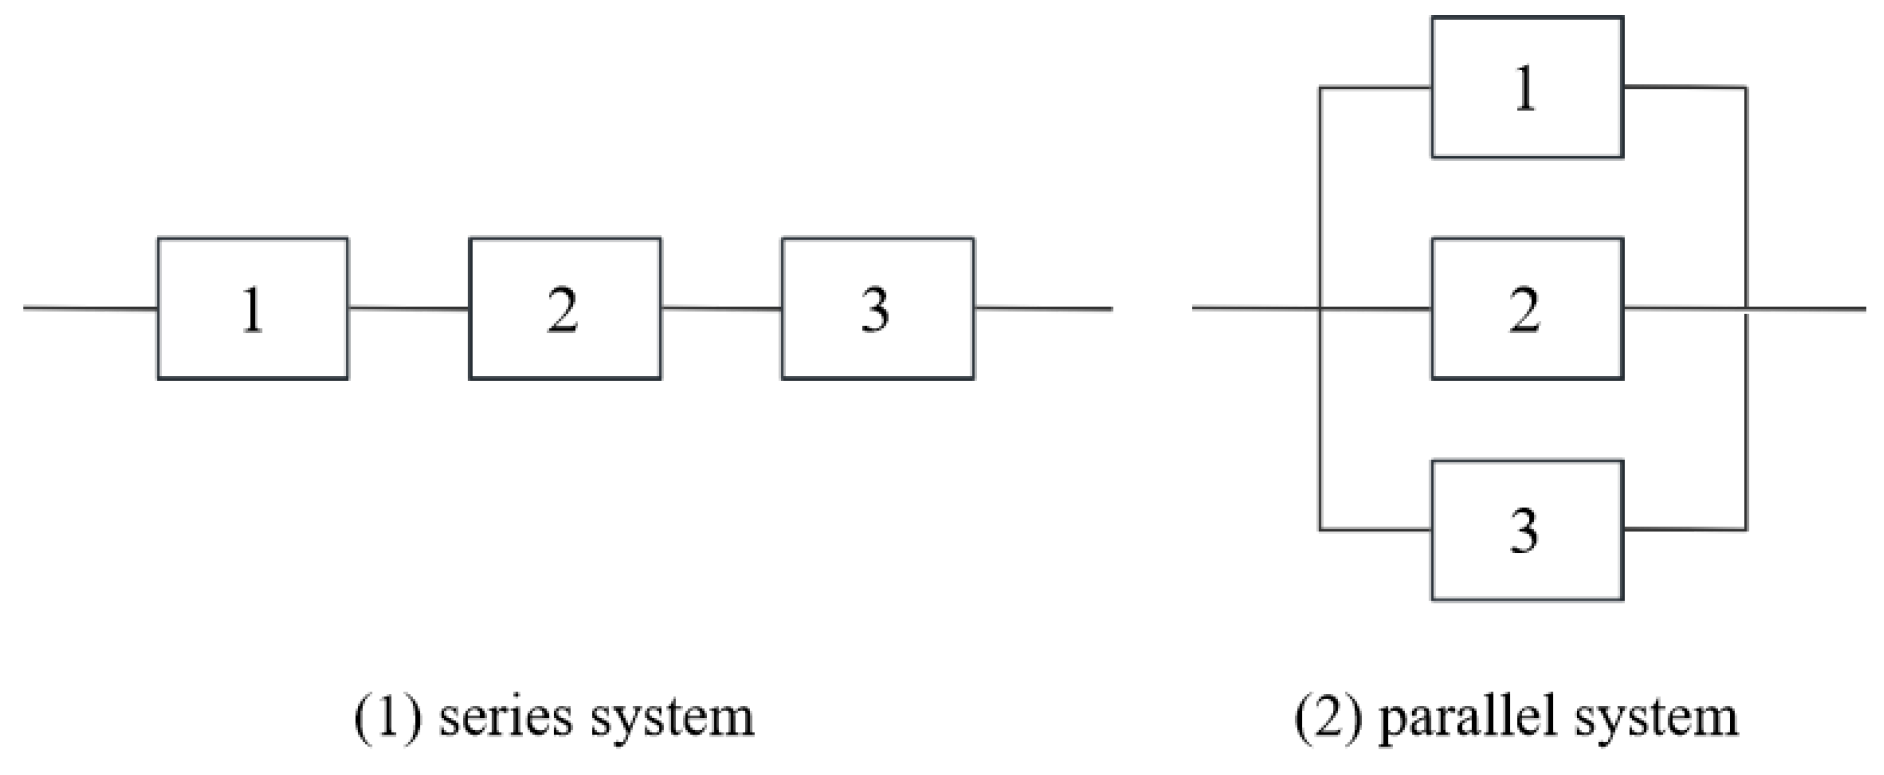
There are some interesting physical interpretations for the generalized exponential distribution. It defines the distribution of the maximum among random variables that are independently and exponentially distributed when is a positive integer greater than 1. This distribution applies to situations such as the overall lifetime of parallel systems of electronic components, each with an exponential lifetime distribution. In contrast, for a series system, the overall lifetime corresponds to the minimum of the exponentially distributed lifetimes, which follows an exponential distribution with rate parameter . Figure 3 presents a schematic representation of both series and parallel systems.
Figure 3.
Illustration of series and parallel system models.
The generalized exponential distribution has gained significant scholarly interest due to its practical importance, particularly in situations involving censored data. This attention has led to a wealth of research focusing on its statistical properties. Reference [1] conducted a comprehensive study of its properties, addressing maximum likelihood estimation (MLE) along with its asymptotic behavior and issues related to hypothesis testing.
Reference [5] compared the generalized exponential distribution with the Weibull and Gamma distributions, demonstrating its advantages in modeling skewed life data. Further, Reference [6] investigated various parameter estimation methods and evaluated their performance.
Reference [7] studied estimation issues for the generalized exponential distribution under hybrid censoring, utilizing the EM algorithm to compute MLEs and importance sampling to derive Bayesian estimates. The Bayesian estimation for the parameter using doubly censored samples was derived by Reference [8]. Reference [9] applied both classical and Bayesian approaches for the estimation of parameters as well as the reliability and hazard functions based on adaptive Type-II progressive censored data. For more detailed results and examples related to the generalized exponential distribution, please refer to References [10,11,12,13].
However, research on Bayesian prediction problems remains relatively scarce for generalized exponential distribution. Prediction is an important aspect in life-testing experiments, where data from an existing sample is used to make inferences about future observations. Several studies have explored prediction problems in various contexts. For instance, Reference [14] provided a comprehensive and detailed review of Bayesian prediction techniques and their diverse applications. Additionally, Reference [15] studied one-sample and two-sample Bayesian prediction problems for the inverse Weibull distribution under Type-II censoring. Similarly, Reference [16] investigated the Poisson-Exponential distribution by employing both classical and Bayesian approaches, providing point predictions and credible predictive intervals.
This paper focuses on both one-sample and two-sample prediction problems. In the one-sample prediction case, let represent the observed informative sample and denote the future sample. The aim is to predict and make inferences about the future order statistics for . In the two-sample case, the observed sample of size r is denoted by , and the future ordered sample of size m is represented by . These two samples are based on the same distribution and assumed to be independent, enabling predictions and inferences for the order statistics .
The primary objectives of this study are twofold. Firstly, we aim to obtain the MLEs and Bayesian estimates under the Type-II censoring scheme and to compare their performance. Secondly, we seek to derive the Bayesian posterior predictive density for future order statistics and, based on this posterior predictive density, compute both point predictions and predictive intervals.
This paper proceeds as follows: In Section 2, the EM algorithm is employed to approximate the MLE of the model. For interval estimation, the Fisher information matrix is used to construct asymptotic confidence intervals (ACIs). Additionally, two bootstrap-based interval estimation methods are explored as comparative alternatives to evaluate their performance. Section 3 presents Bayesian parameter estimation under three different loss functions, utilizing Gibbs sampling and importance sampling techniques. HPD credible intervals are further obtained from the Gibbs sampling results. Section 4 focuses on Bayesian point predictions and the computation of predictive intervals for future order statistics. In Section 5, simulation studies are conducted to evaluate the performance of the proposed methodologies, followed by an analysis of a real-world dataset related to deep groove ball bearings, which is discussed in Section 6. Finally, we present conclusions in Section 7.
2. Maximum Likelihood Estimation
Let denote a sample containing r observations obtained from the generalized exponential distribution under a Type-II censoring scheme characterized by . The likelihood function associated with this sample is given by:
Neglecting the constant term, the log-likelihood function is:
To compute the MLEs, we differentiate (6) with respect to and and set the derivatives to zero. The partial derivatives are:
However, solving these equations analytically is not feasible. Therefore, numerical methods, such as the EM algorithm, are recommended. Initially introduced in Reference [17], the EM algorithm is a suitable approach for this scenario.
Under Type-II censoring framework, the observed data, represented as , corresponds to the first r observations. The remaining data points, which are censored and unobserved, are denoted as . Together, these two components form the complete sample W, where .
When constants are excluded, the log-likelihood function for W, represented as , can be expressed as:
The EM algorithm iteratively computes the MLEs by alternating between the E-step and M-step. In the E-step, the expectation of the log-likelihood function is calculated given the observed data X and the current parameter estimates. These estimates are updated in the M-step by maximizing the expected complete log-likelihood function. Therefore, we first derive the expression for the pseudo-log-likelihood function as follows:
where
In the M-step, suppose the estimates of and at j-th iteration are denoted as and , respectively. The new estimates can be calculated by maximizing the following expression:
Here, we introduce an application of the iteration method, which is similar to the method proposed by Reference [5]. In order to maximize (11), we first take the partial derivative with respect to and .
From (12), the estimate of at -th iteration can be determined as as follows:
Thus, the maximization of (11) can be achieved by solving the corresponding fixed-point equation:
where
After computing , the corresponding value of can be determined using the relation .
The iterative procedure described in Equations (14) and (15) is deemed to have converged when the following inequality holds:
where denotes a small positive threshold to ensure accuracy and stability. The above process of the EM algorithm is summarized in the following Algorithm 1:
In Section 5, when applying the EM algorithm for MLEs under Type-II censoring, the MLEs obtained from complete samples are used as the initial values.
2.1. Fisher Information Matrix
Reference [18] introduces several core concepts closely related to the Fisher information matrix. Building on this foundation, this subsection describes the approach for obtaining the observed information matrix, following the missing value principles outlined in Reference [19], which is then used to construct confidence intervals.
Specifically, let , where represents the observed information matrix, corresponds to the missing information matrix, and indicates the complete information matrix. These matrices are related as follows:
The missing information matrix, representing the Fisher information associated with the censored data, is expressed as:
where
The complete information matrix, base on the log-likelihood function (7) is then given by:
The details of the elements within these two matrices are elaborated in Appendix A. We can calculate using the derived components of and easily. The variance-covariance matrix corresponding to the MLEs, and , is then approximated by taking the inverse of , represented as .
On the basis of this approximation, the asymptotic confidence intervals for and are given as:
where, and represent the diagonal elements of the inverse observed information matrix, denoted as . The critical value corresponds to the upper quantile of the standard normal distribution.
2.2. Bootstrap Methods
The asymptotic confidence interval approach is based on the assumption that the estimators follow a normal distribution, an assumption that holds true when the sample size is adequately large. Nevertheless, in practical, the sample size is often limited. To address this, we propose two bootstrap techniques. The first is the percentile bootstrap method [20], which generates bootstrap samples by resampling the observed data. The second method, the bootstrap-t approach [21], also generates bootstrap samples but computes a bootstrap-t statistic that adjusts the estimates using their standard deviation.
Algorithms 2 and 3 present the procedures for implementing the Boot-p and Boot-t methods, respectively.
One potential direction for future research involves exploring the methods proposed in References [22,23] for identifying extreme values, which may help improve the accuracy of the bootstrap method.
| Algorithm 2 Percentile Bootstrap (Boot-p) Method |
|
| Algorithm 3 Bootstrap-t (Boot-t) Method |
|
3. Bayesian Estimation
This section focuses on deriving the Bayes estimates for using type-II censored data within the framework of a specified loss function. Selecting an appropriate loss function is crucial, as it determines the penalty associated with estimation errors. In this study, we examine three types of loss functions: the general entropy loss function (GELF), the Linex loss function (LILF), and the squared error loss function (SELF). The SELF is widely used due to its symmetric nature and is most appropriate when the estimation error leads to symmetric consequences. For scenarios where the consequences of overestimation and underestimation differ, the Linex loss function, which introduces an asymmetry in the penalties, is more suitable. Meanwhile, the GELF accounts for entropy-based considerations, allowing greater flexibility in modeling uncertainty and estimation inaccuracies. Let denote an estimate of the . The mathematical expression of the above three loss functions is provided below:
The Bayes estimates under each of these loss functions are defined as follows:
Bayes estimate for under GELF:
Bayes estimate for under LILF:
Bayes estimate for under SELF:
This setup allows for flexibility in choosing an appropriate loss function based on the characteristics of the estimation problem. Following Reference [24], let us assume that and follow gamma prior distributions, expressed as:
where all hyper-parameters u, v, s, and b are known and positive.
The joint posterior distribution of and given type-II censored data X is
Since the denominator is a normalizing constant, we can simplify to obtain
here
It is evident that the quantities , , , and are all positive.
Therefore, the posterior expectation of any function can be given directly as:
Based on (30) and (31), Gibbs sampling is initially applied to draw Monte Carlo Markov Chain (MCMC) samples from . These samples are subsequently utilized in the importance sampling algorithm outlined in Algorithm 4 to approximate the values in (24)–(26).
| Algorithm 4 Importance Sampling for Bayesian Estimation |
|
The credible interval for can be constructed using the methodology introduced by Reference [25]. Let represent the posterior density function of , while corresponds to its cumulative distribution function. The p-quantile of , denoted as , is expressed as:
For any specific value , the posterior cumulative distribution function is expressed as:
where is an indicator function. An approximation for can be written as:
Let denote the ordered values of , and define as:
for . Using this, can be estimated as:
, can subsequently be estimated using the following expression:
In order to construct the HPD interval for , we first establish the following definition:
where . The HPD interval is then identified by selecting , the interval with the shortest length.
4. Bayesian Prediction
Bayesian prediction for future observations is explored in this section. In this study, we consider Bayesian prediction within the framework of both one-sample and two-sample cases. We provide the corresponding posterior distributions, along with methods for computing point predictions and predictive intervals.
4.1. One-Sample Prediction
Let represent the observed informative sample and denote the future sample. We aim to predict and make inferences about the future order statistic (where ). Noting that the conditional density function of can be written as
where . By applying the binomial expansion, the function mentioned above can be reformulated as:
Therefore the corresponding survival function of given X is then expressed as:
The posterior predictive density function of can subsequently be expressed as:
and the posterior survival function is
Let represent the samples obtained through Algorithm 4. The corresponding simulation-consistent estimates for and can then be approximated by:
and
where is defined as
The two-sided symmetric predictive interval for is the solution to the following equations:
The point prediction for can be determined by utilizing the corresponding predictive distribution. Specifically, it is computed as:
where
We cannot compute the above expression analytically. Therefore, we approximate using the previously drawn samples:
4.2. Two-Sample Prediction
This section addresses the problem of dealing with two distinct sets of samples, the first, identified as the informative sample, and the second, known as the future sample. The future order statistics, represented as , are considered to be statistically independent of the informative sample, . The main objective is to derive the predictive density for the k-th order statistic , conditioned on the observed sample X. The density function of can be expressed as follows:
where . If we let denote the posterior predictive density of , then it can be expressed as:
The function represents the survival function of , given by:
The predictive survival function of , denoted by , is therefore given by:
In practical applications, can be approximated based on importance sampling method:
and can be approximated by:
where is defined as in (40). The two-sided symmetric predictive interval for is the solution to the following equations:
To obtain the point prediction for , we calculate it based on the corresponding predictive distribution .
where
5. Simulation
Monte Carlo simulation results are provided to evaluate the performance of Bayesian estimation methods in contrast to classical estimation. The comparisons are conducted under various censoring schemes and a range of parameter settings. The analysis was performed on a system equipped with an 11th Gen Intel(R) Core(TM) i7-11800H @ 2.30 GHz processor. Here, we used R software (version 4.4.1) for all computations.
To begin with, Type-II censored samples are generated under various censoring schemes, assuming that they follow a generalized exponential distribution with the true parameter values and . The EM algorithm is subsequently applied to calculate the MLEs. Then, we set the hyper-parameters the values . Under these settings, Bayesian estimates are computed using various loss functions through importance sampling techniques. The simulation is performed over 3000 iterations, and the mean estimates of and are computed. Additionally, a comparison is performed between the MLEs and Bayesian estimates, utilizing the mean squared error (MSE) as the primary criterion.
The definitions for the mean and mean squared error of the estimates and are as follows:
where and are derived from the j-th simulation. Here, , with M set to 3000 for this study.
Furthermore, we explore the effect of different values of h in the LILF and in the GELF to analyze their influence on the Bayesian estimates.
Under various Type-II censoring schemes, Table 1 and Table 2 provide the average estimates and MSEs for the parameters and . The results show that the Bayesian estimates outperform the ML method. Notably, when utilizing the GELF with , the Bayesian estimates stand out by exhibiting superior performance, achieving the smallest MSEs, and closely approximating the actual parameter values.
Table 1.
Mean and corresponding MSE values for under various censoring schemes.
Table 2.
Mean and corresponding MSE values for under various censoring schemes.
Table 3 summarizes the interval estimates for the unknown parameters under various censoring schemes, along with the associated coverage probabilities (CPs) and average lengths (ALs).
Table 3.
Estimations of the intervals for parameters and under various censoring schemes.
The findings reveal that the HPD intervals consistently have the shortest ALs among all the interval estimation methods considered, followed by the asymptotic confidence intervals, while the bootstrap confidence intervals have the longest ALs, ensuring that the intervals are broad enough to cover the asymmetry. Moreover, as n and r increase, the ALs of different interval estimates tend to decrease. In terms of CPs, the asymptotic intervals achieve the highest CPs, with the HPD intervals coming next and the bootstrap intervals showing the lowest CPs. Therefore, considering both AL and CP, the HPD intervals demonstrate superior performance compared to the asymptotic and bootstrap intervals.
Next, we evaluate the feasibility and robustness of the model under various parameter combinations. For the fixed censoring scheme , seven different parameter combinations are specified. For each combination, the MLEs, Bayesian estimates, and the corresponding interval estimates are computed. Table 4 presents the mean estimates along with the MSEs (in brackets), which are used to evaluate the accuracy of the estimates for different parameter combinations. Table 5 provides the confidence and credible interval estimates corresponding to each parameter combination. Consistent with the previous discussion, the Bayesian estimates exhibit smaller MSEs compared to the MLEs. Additionally, the HPD intervals are characterized by the shortest average lengths.
Table 4.
Mean and corresponding MSE values for , under fixed censoring schemes with different true values.
Table 5.
95% confidence and credible intervals for , under fixed censoring schemes .
Then, we explore the impact of prior distribution selection on Bayesian estimation. Similar to the previous discussion, we set the true values to be and . We consider two types of prior distributions: the non-informative prior, where the hyper-parameters u, v, s, and b are set to 0, and the informative prior, where , , , and . In this case, the actual value of the parameter is typically considered as the expectation of the prior distribution. The results are provided in Table 6. It can be concluded from the table that Bayesian estimates with informative priors yield smaller MSEs compared to those with non-informative priors. This indicates that incorporating prior information in the Bayesian procedure enhances the precision of the estimates.
Table 6.
Mean and corresponding MSE values of , for Non-informative and informative priors.
Subsequently, we consider the Bayesian prediction problem. First, we employ the inverse transformation method to generate random numbers from the generalized exponential distribution, with the true values set as and . These generated values are presented in Table 7. Following this, we define different censoring schemes, namely , , , and . For one-sample prediction, we compute point predictions and interval predictions for , 28, and 30. The detailed results are displayed in Table 8. For two-sample prediction, we set and calculated both point predictions and predictive intervals. The results are summarized in Table 9.
Table 7.
Random numbers generated using the inverse transformation method.
Table 8.
Point predictions and predictive intervals for in the one-sample case.
Table 9.
Point predictions and predictive intervals for in the two-sample case.
6. Data Analysis
This section provides an illustrative example by analyzing a dataset reported by Lawless [26]. The detailed observed data are shown in Table 10.
Table 10.
Endurance Test Data for Deep Groove Ball Bearings (23 Samples).
This dataset has been analyzed in previous studies, with Reference [5] highlighting the effectiveness of the generalized exponential distribution in modeling this data.
To analyze real data, we begin by calculating the MLEs using the complete data, followed by computing the Kolmogorov–Smirnov (K-S) statistic, Akaike Information Criterion (AIC), and Bayesian Information Criterion (BIC). Additionally, in some studies, the Anderson–Darling (A-D) statistic has been found to be more effective than the K-S statistic. For further details on the A-D statistic and its associated probability calculations, please refer to Reference [27]. We also compare the goodness-of-fit for other life distributions, such as the Weibull, Log-Normal, and Gamma distributions. The PDFs of these distributions are provided below:
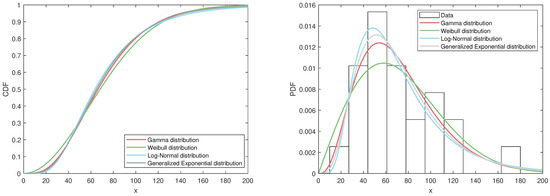
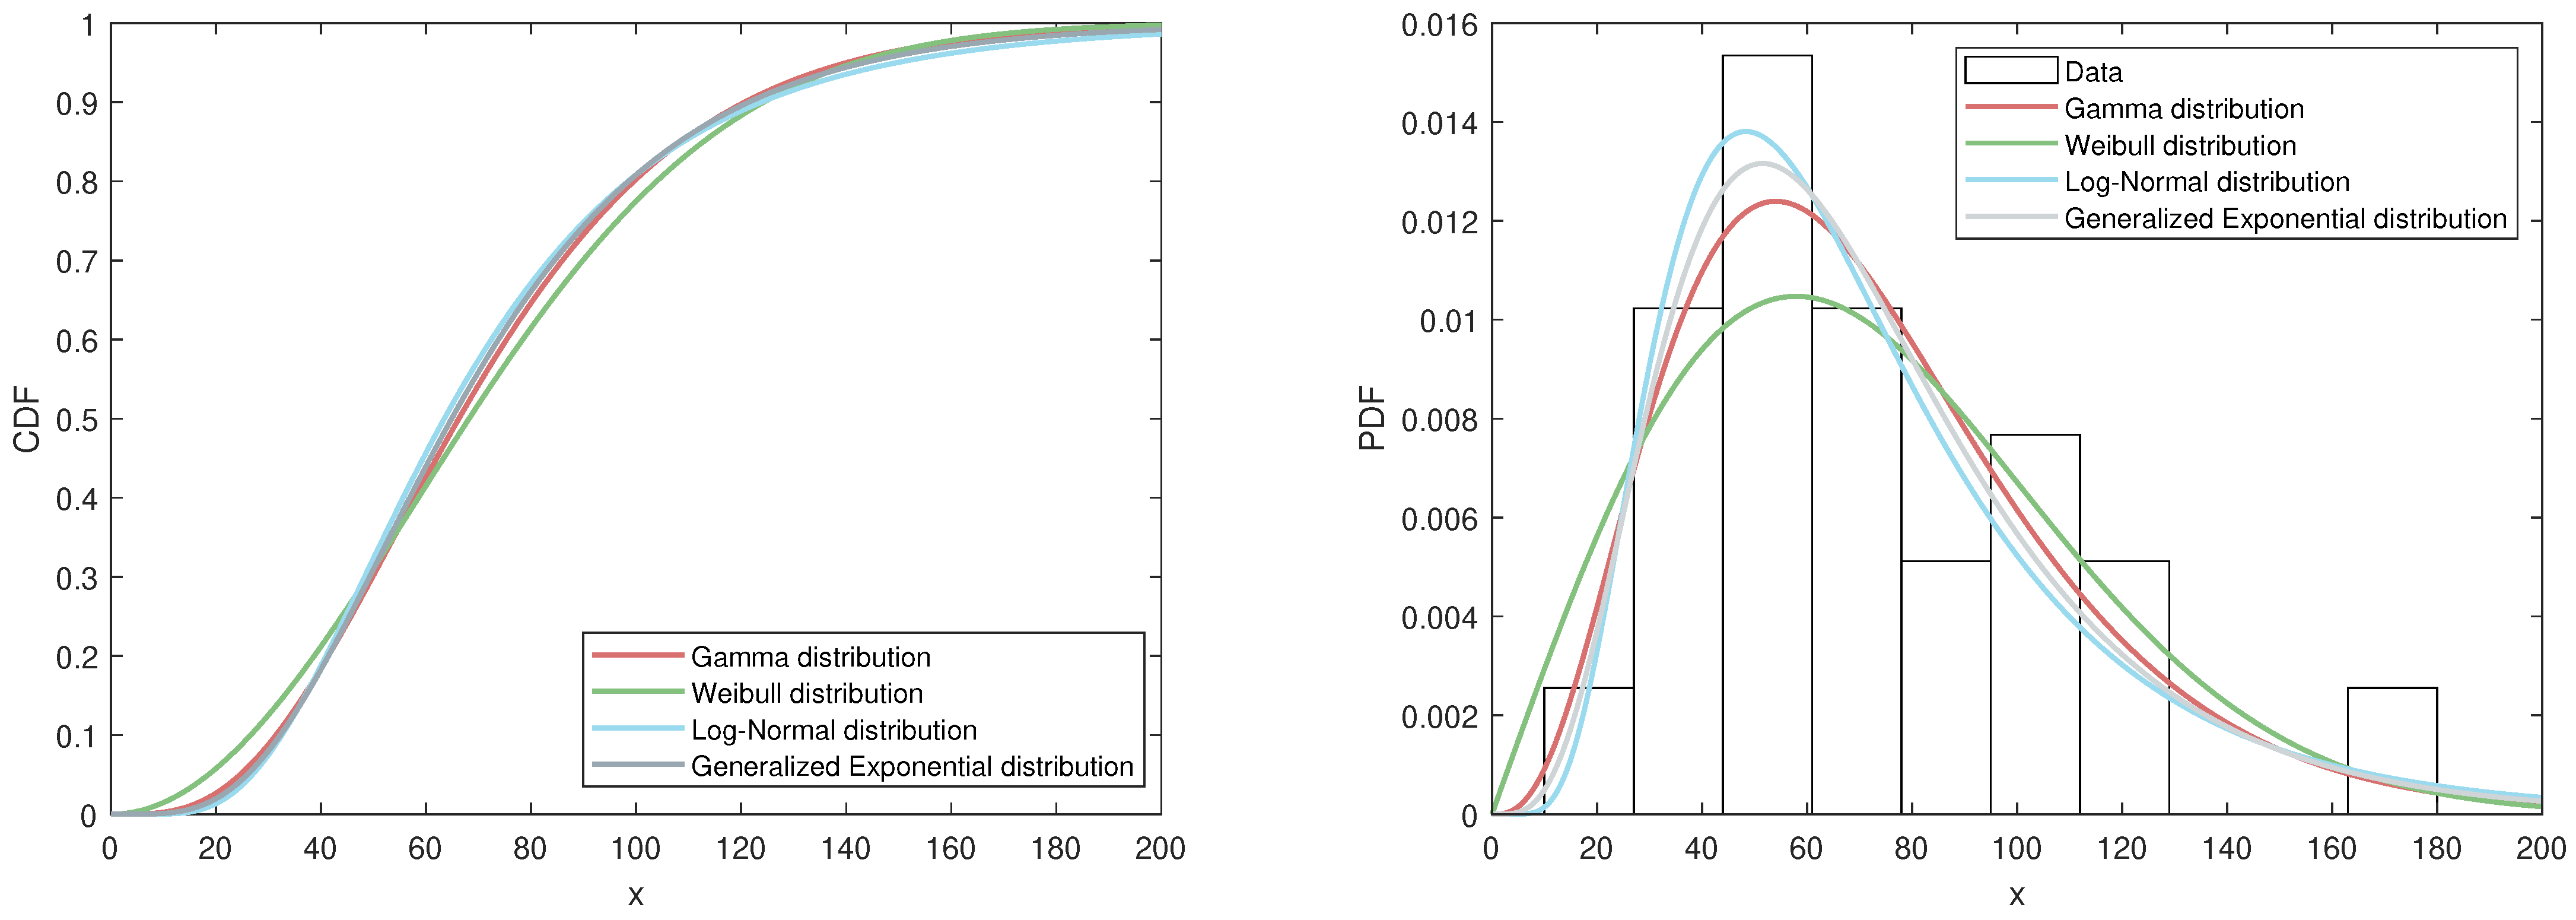
Table 11 presents the test results for each distribution. Typically, better model fit is indicated by smaller values of K-S, A-D, AIC, and BIC, along with a higher log-likelihood value. As shown in the table, the generalized exponential distribution provides a good fit for this dataset. To further visualize the model performance, Figure 4 includes two plots based on the MLEs. The first plot compares the fitted CDFs of the four distributions mentioned above. The second plot displays the fitted PDFs of these four distributions alongside a histogram of the dataset.
Table 11.
Inferences on the goodness-of-fit for real data.
Figure 4.
Comparison of fitted CDFs and PDFs for various distributions.
Now, we consider the situation where the final three observations are censored, denoted as . To estimate the unknown parameters, both Bayesian estimation and maximum likelihood estimation approaches are utilized. A summary of the estimation results is presented in Table 12.
Table 12.
Mean estimates of and for censoring scheme based on the real dataset.
The corresponding 95% asymptotic confidence intervals for are and , respectively. Meanwhile, the 95% HPD credible intervals are for and for . Notably, the HPD intervals are shorter than the asymptotic confidence intervals.
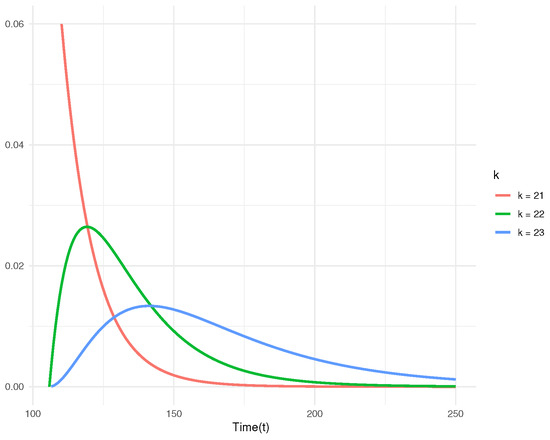
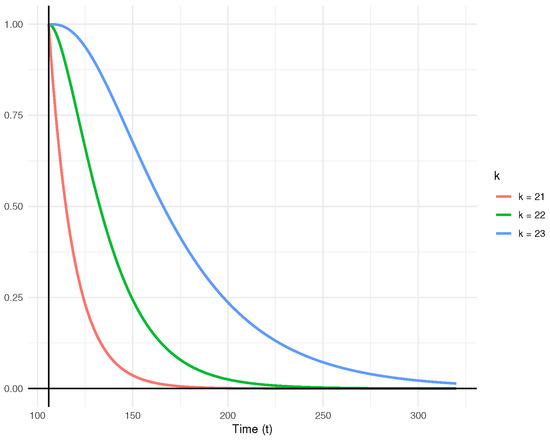
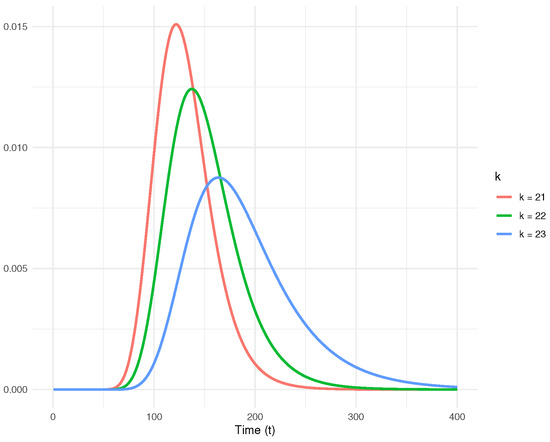
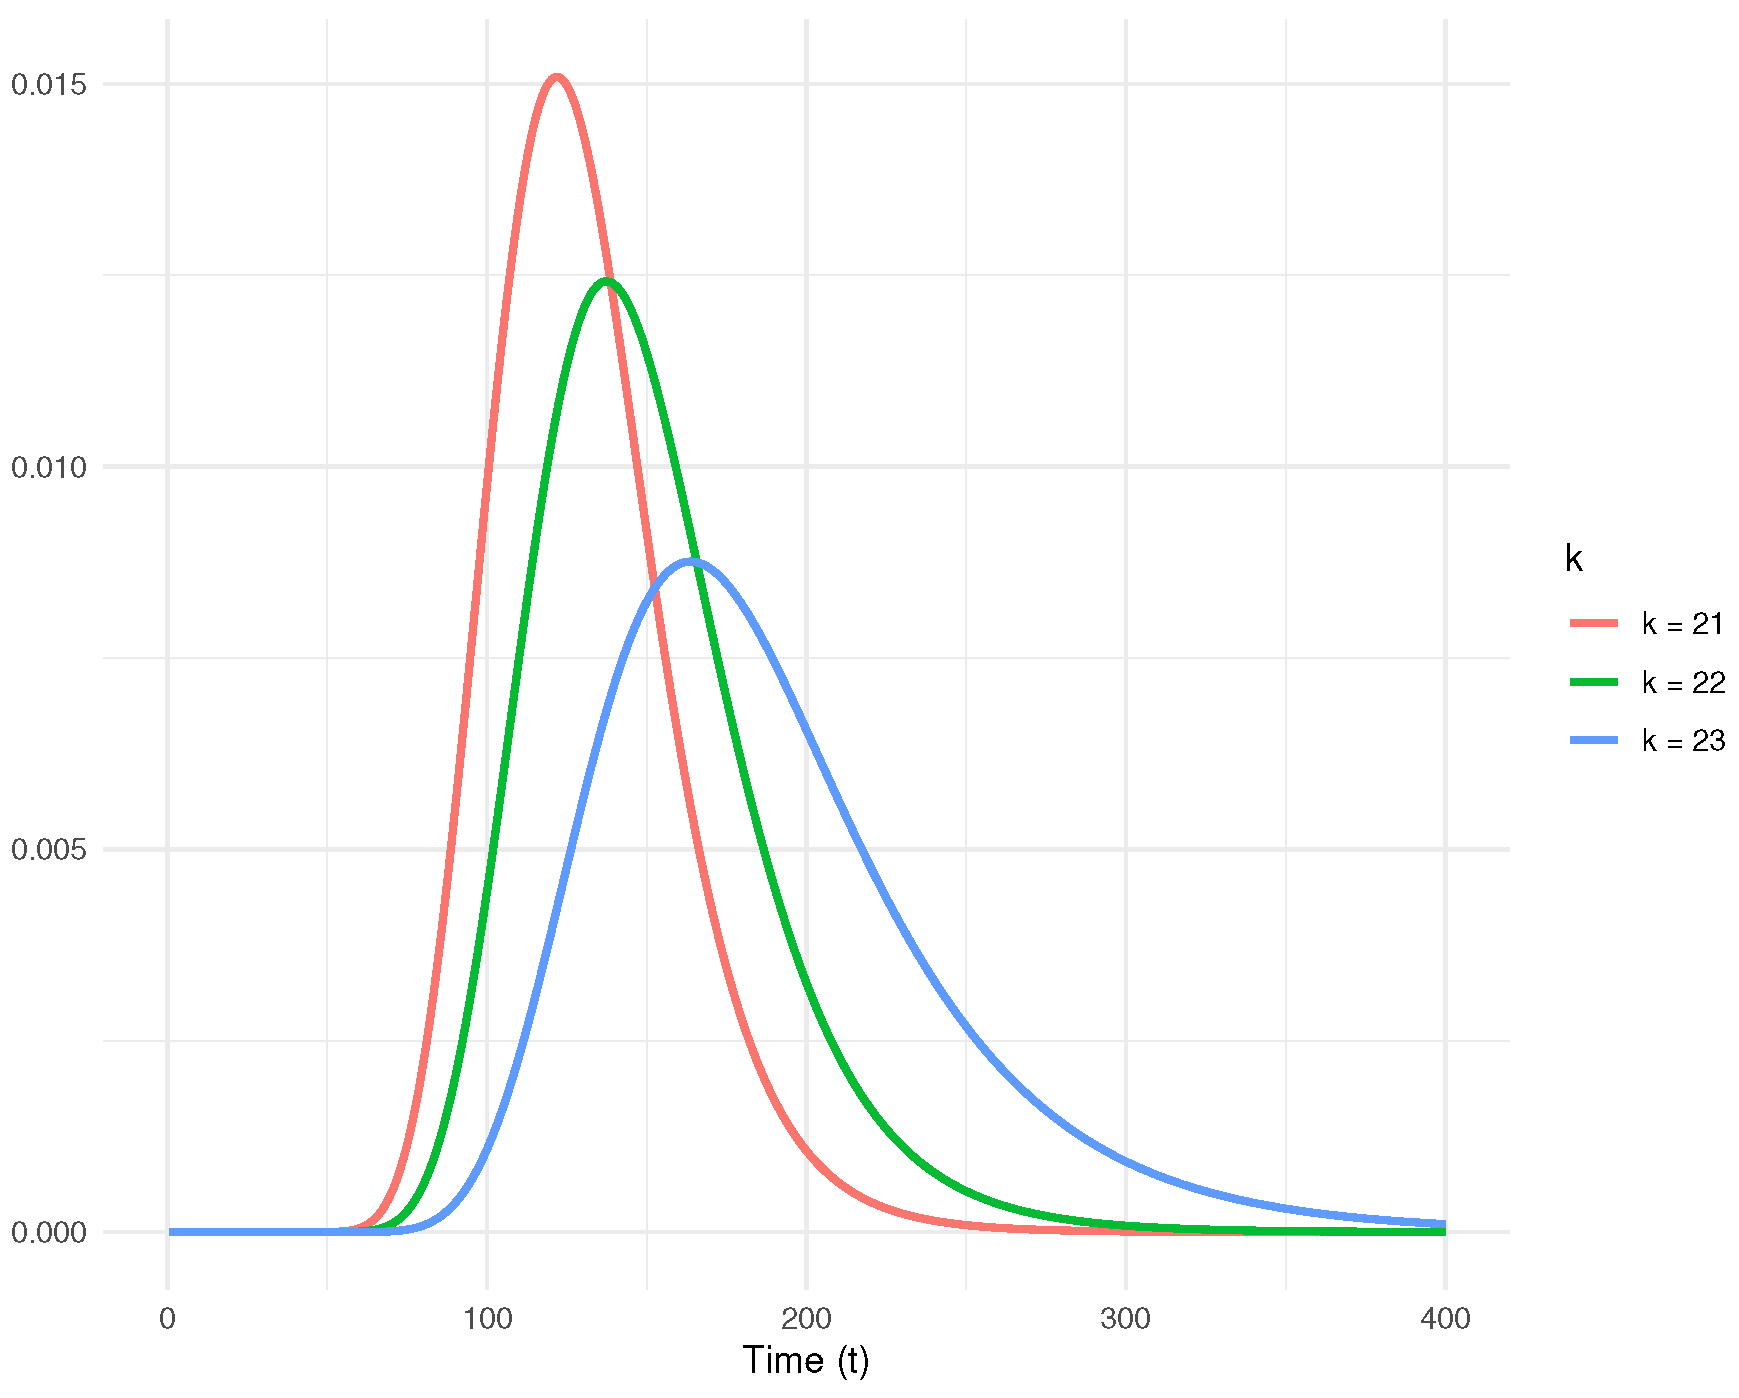
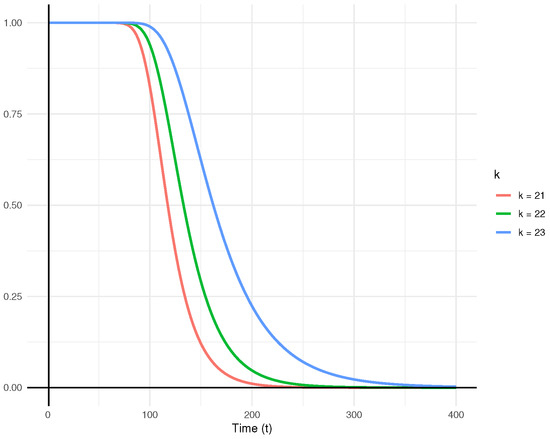
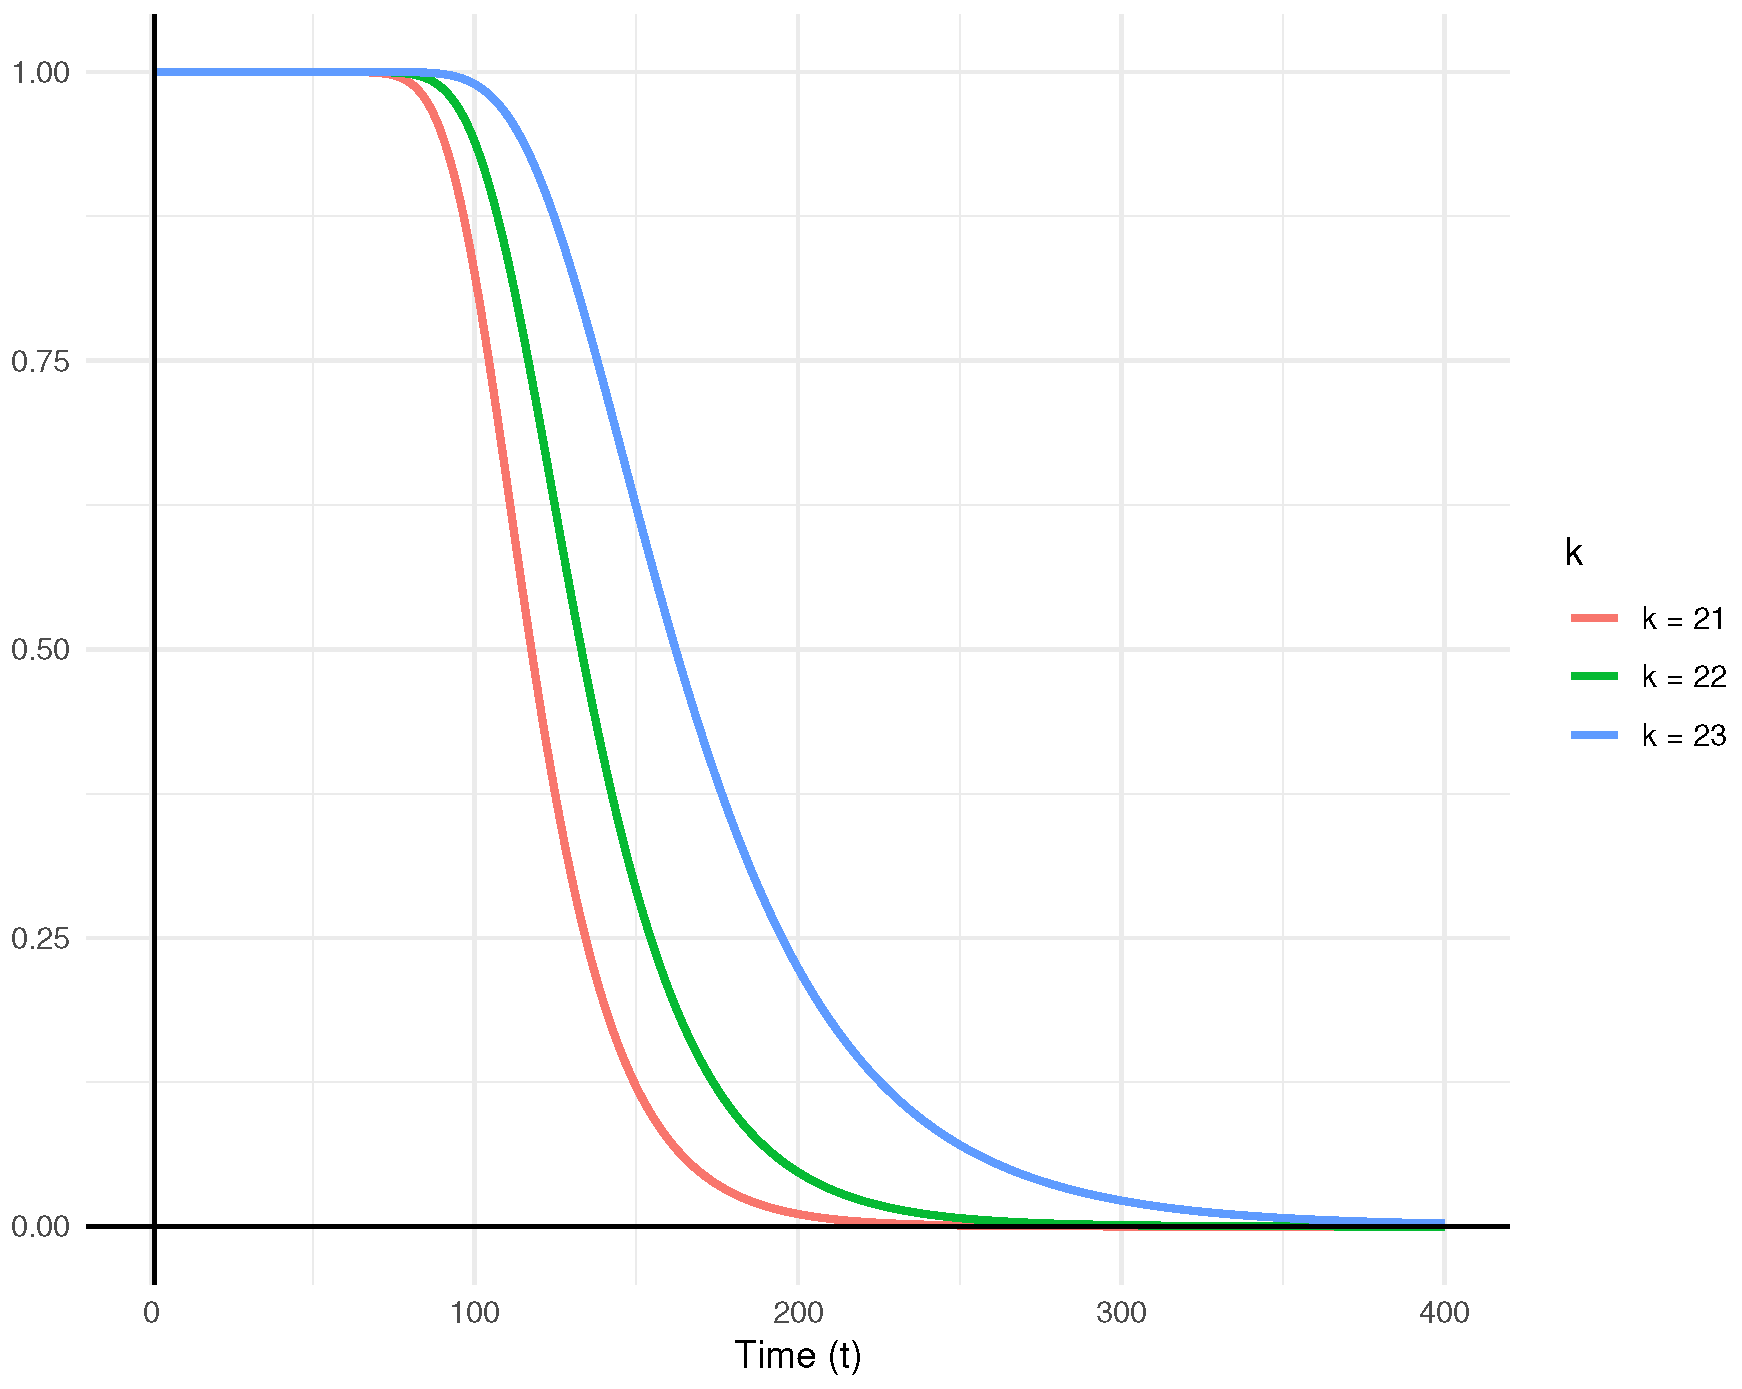
Now, we make predictive inference for the 21st, 22nd, and 23rd future order statistics, denoted as , , and , using (41) and (44). We assume that the hyper-parameters are the same as in Section 5. From Table 13, it is evident that the predicted values closely resemble the true values, thereby corroborating the effectiveness of our theoretical model. The Bayesian point prediction for the 21st order statistic is 127.92, with a 95% predictive interval ranging from 106.1134 to 147.1283. This suggests that, based on the observed sample, the 21st deep groove ball bearing is expected to fail between 106.11 and 147.13 million revolutions. Figure 5 illustrates the posterior predictive density functions for the censored observations. Additionally, the predictive survival functions for , , and are displayed in Figure 6. The plots clearly indicate that as k increases, the rate of decline in the predictive survival function decreases.
Table 13.
Point predictions and predictive intervals for , , and in the one-sample case.
Figure 5.
One-sample posterior predictive density functions of , and .
Figure 6.
One-sample predictive survival functions of , and .
We now focus on the two-sample prediction problem discussed in Section 4.2. Assume 23 new deep groove ball bearings, denoted as , are subjected to the same test. The goal is to derive the predictive density and make predictive inference for .
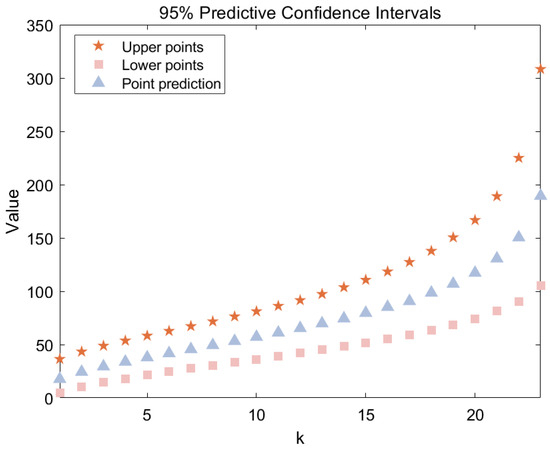
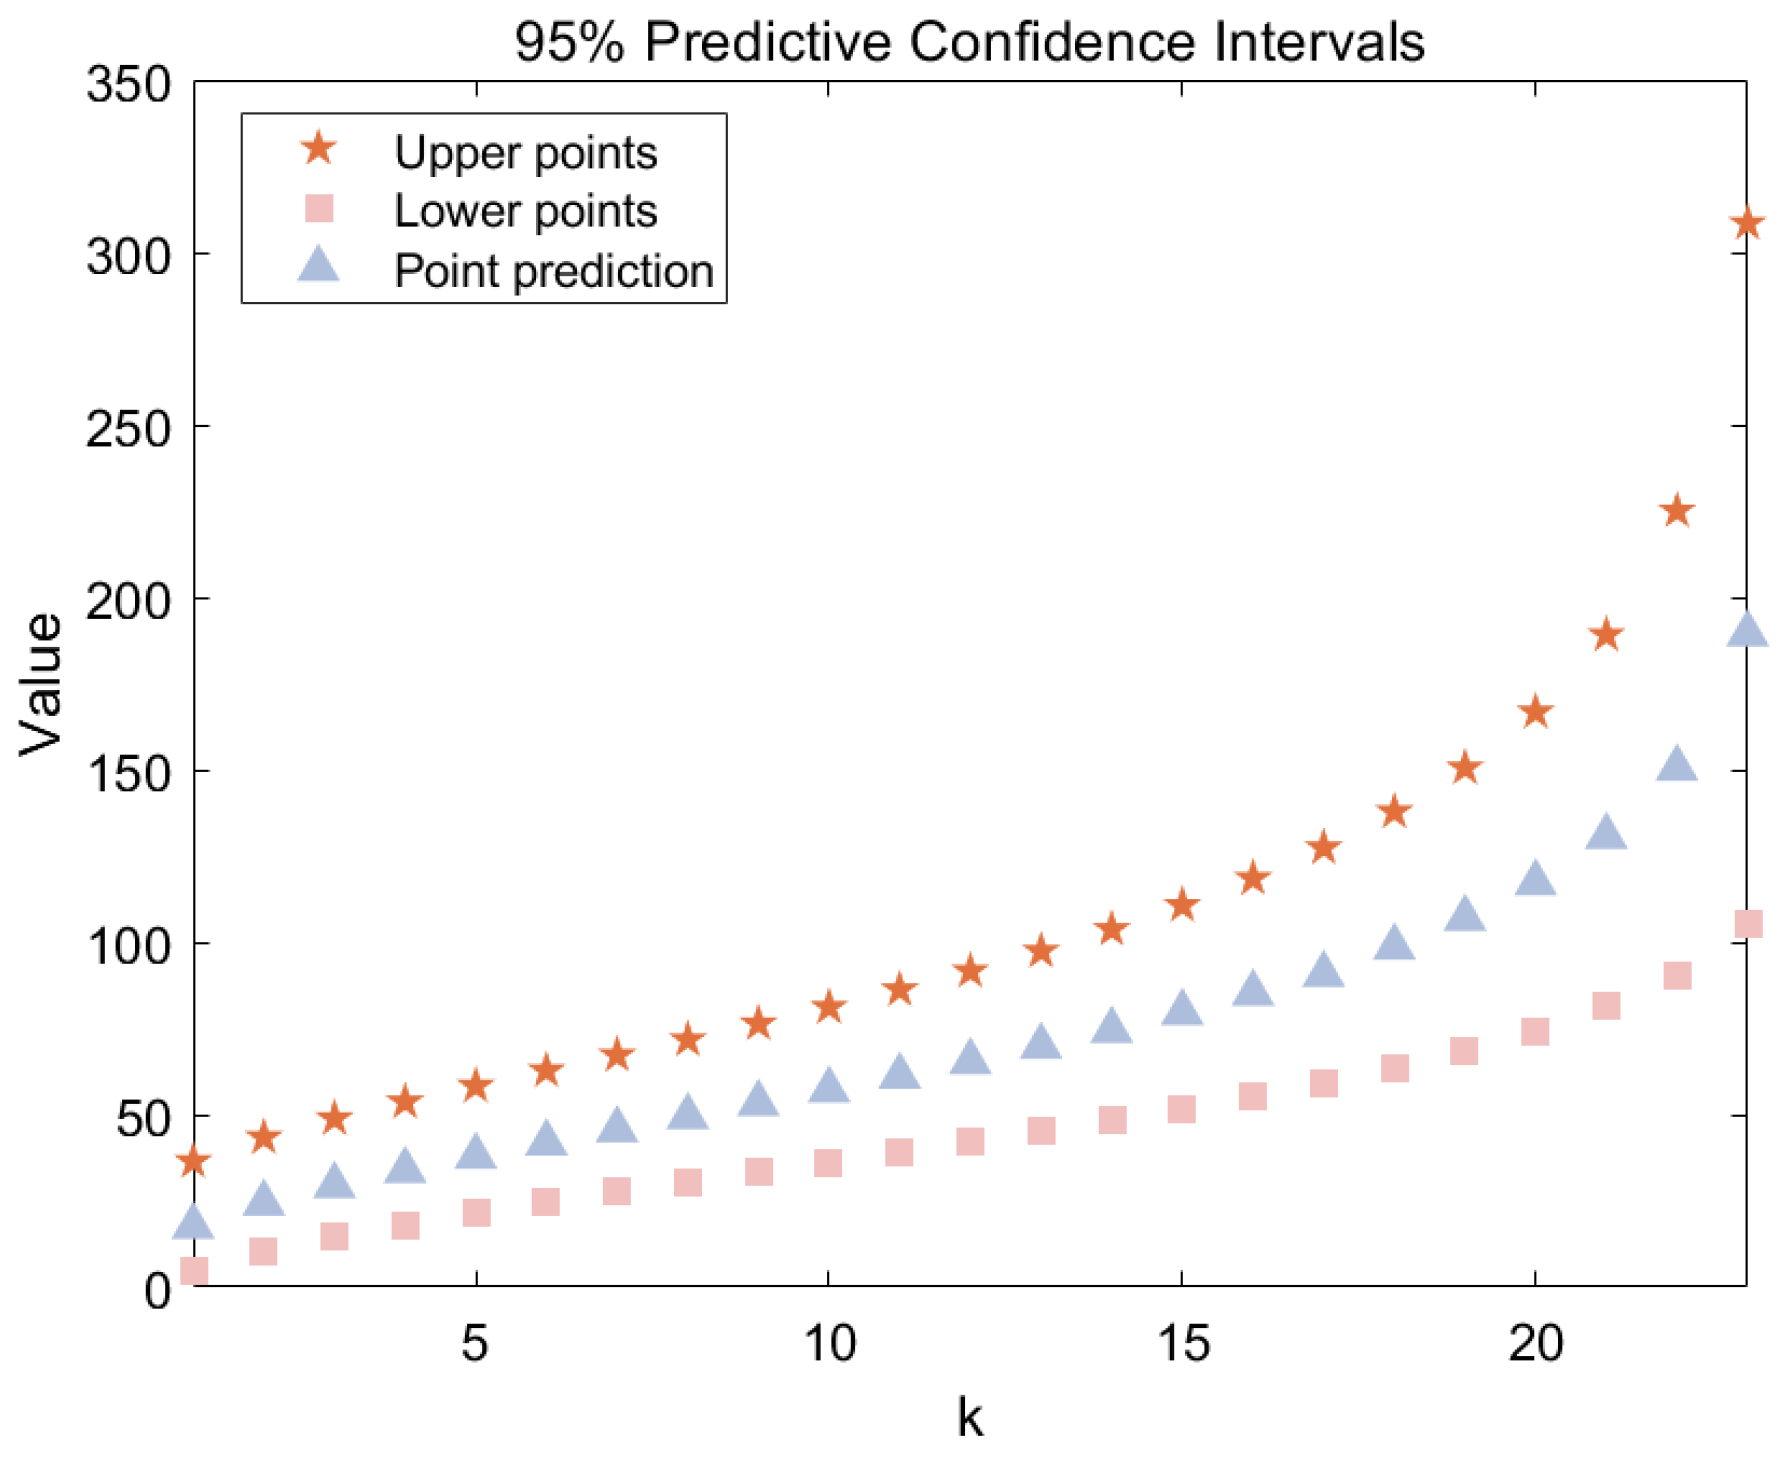
Figure 7 illustrates the point predictions and predictive intervals for the future samples derived from the observed dataset. Detailed numerical results are provided in Table 14. The Bayesian point prediction for the median is 65.36, with a 95% predictive interval for the median ranging from 42.1386 to 91.5963. This suggests that, based on the observed sample, the 12th deep groove ball bearing is expected to fail between 42.14 and 91.60 million revolutions. The posterior predictive density functions for to are shown in Figure 8. It can be observed that as k increases, the expected values of shift rightward, and the variances increase. Additionally, Figure 9 presents the predictive survival functions for , , and .
Figure 7.
Two-sample point prediction and interval prediction.
Table 14.
Point predictions and predictive intervals in the two-sample case.
Figure 8.
Two-sample posterior predictive density functions of , and .
Figure 9.
Two-sample predictive survival functions of , and .
The results above, including both one-sample and two-sample predictions, can guide maintenance decisions by using the predictive intervals to schedule timely replacement or servicing of bearings, helping to prevent unexpected failures, minimize downtime, and reduce maintenance costs.
We encourage further research utilizing larger sample sizes and real-world datasets to achieve more accurate point and interval predictions, as well as to explore the impact of prior distribution selection on predictive outcomes.
7. Conclusions
In this study, we explore the estimation and prediction problems for the generalized exponential distribution based on Type-II censored data. The MLE is performed using the EM algorithm. Additionally, Bayesian estimation methods are investigated under various loss functions. Using Gibbs sampling and importance sampling, Bayesian estimates and HPD credible intervals are constructed. Monte Carlo simulations are conducted to assess and compare the performance of classical and Bayesian estimation techniques. Notably, the results indicate that Bayesian methods consistently provide lower MSEs and more precise interval estimates. For prediction, the proposed methods are applied to the endurance test data for deep groove ball bearings, where the last three observations are censored. Both one-sample and two-sample prediction scenarios are analyzed, with posterior predictive distributions used to construct predictive intervals. The findings demonstrate that Bayesian approaches offer a robust and reliable framework for both estimation and prediction in the presence of Type-II censored data.
One limitation of the Type-II censoring scheme is that units can only be censored at the final termination time. Future studies are encouraged to investigate more adaptable censoring schemes, such as progressive type-II hybrid censoring and adaptive Type-II progressive censoring. Moreover, exploring different prior distributions, alternative loss functions, or applying the model to other lifetime distributions could further improve the versatility and reliability of the approach.
Author Contributions
Conceptualization and methodology, W.W. and W.G.; software, W.W.; investigation, W.W.; writing—original draft preparation, W.W.; writing—review and editing, W.G.; supervision, W.G. All authors have read and agreed to the published version of the manuscript.
Funding
This research was supported by Project 202510004158 which was supported by National Training Program of Innovation and Entrepreneurship for Undergraduates. Wenhao’s work was partially supported by the Science and Technology Research and Development Project of China State Railway Group Company, Ltd. (No. N2023Z020).
Data Availability Statement
The dataset utilized in this study is publicly accessible in reference [26].
Conflicts of Interest
The authors declare no conflict of interest.
Abbreviations
| Probability density function | |
| CDF | Cumulative distribution function |
| MLE | Maximum likelihood estimation |
| ACI | Asymptotic confidence interval |
| CI | Confidence interval |
| HPD | Highest posterior density |
| GELF | General entropy loss function |
| LILF | Linex loss function |
| SELF | Squared error loss function |
| MCMC | Markov Chain Monte Carlo |
| MSE | Mean squared error |
| Boot-p CI | Bootstap-p confidence interval |
| Boot-t CI | Bootstap-t confidence interval |
| AL | Average length |
| CP | Coverage probability |
| K–S | Kolmogorov–Smirnov |
| AIC | Akaike Information Criterion |
| BIC | Bayesian Information Criterion |
| A-D | Anderson–Darling |
Appendix A
Let represent the th element of the matrix , defined as follows:
Let represent the th elements of the matrix , given by
where
References
- Gupta, R.D.; Kundu, D. Theory & methods: Generalized exponential distributions. Aust. N. Z. J. Stat. 1999, 41, 173–188. [Google Scholar]
- Mudholkar, G.S.; Srivastava, D.K. Exponentiated Weibull family for analyzing bathtub failure-rate data. IEEE Trans. Reliab. 1993, 42, 299–302. [Google Scholar] [CrossRef] [Scilit]
- Gompertz, B. XXIV. On the nature of the function expressive of the law of human mortality, and on a new mode of determining the value of life contingencies. In a letter to Francis Baily, Esq. FRS &c. Philos. Trans. R. Soc. Lond. 1825, 115, 513–583. [Google Scholar]
- Verhulst, P.-F. Notice sur la loi que la population suit dans son accroissement. Corresp. Mathématique Phys. 1838, 10, 113–129. [Google Scholar]
- Gupta, R.D.; Kundu, D. Exponentiated Exponential Family: An Alternative to Gamma and Weibull Distributions. Biom. J. 2001, 43, 117–130. [Google Scholar] [CrossRef] [Scilit]
- Gupta, R.D.; Kundu, D. Generalized exponential distribution: Different method of estimations. J. Stat. Comput. Simul. 2001, 69, 315–337. [Google Scholar] [CrossRef] [Scilit]
- Kundu, D.; Pradhan, B. Estimating the parameters of the generalized exponential distribution in presence of hybrid censoring. Commun. Stat.-Theory Methods 2009, 38, 2030–2041. [Google Scholar] [CrossRef] [Scilit]
- Kim, C.; Song, S. Bayesian estimation of the parameters of the generalized exponential distribution from doubly censored samples. Stat. Pap. 2010, 51, 583–597. [Google Scholar] [CrossRef] [Scilit]
- Mohie El-Din, M.M.M.; Amein, M.M.; Shafay, A.R.; Mohamed, S. Estimation of generalized exponential distribution based on an adaptive progressively type-II censored sample. J. Stat. Comput. Simul. 2017, 87, 1292–1304. [Google Scholar] [CrossRef] [Scilit]
- Pradhan, B.; Kundu, D. On progressively censored generalized exponential distribution. Test 2009, 18, 497–515. [Google Scholar] [CrossRef] [Scilit]
- Guo, L.; Gui, W. Statistical inference of the reliability for generalized exponential distribution under progressive type-II censoring schemes. IEEE Trans. Reliab. 2018, 67, 470–480. [Google Scholar] [CrossRef] [Scilit]
- Madi, M.T.; Raqab, M.Z. Bayesian inference for the generalized exponential distribution based on progressively censored data. Commun. Stat.—Theory Methods 2009, 38, 2016–2029. [Google Scholar] [CrossRef] [Scilit]
- Gupta, R.D.; Kundu, D. Generalized exponential distribution: Existing results and some recent developments. J. Stat. Plan. Inference 2007, 137, 3537–3547. [Google Scholar] [CrossRef] [Scilit]
- Al-Hussaini, E.K. Predicting observables from a general class of distributions. J. Stat. Plan. Inference 1999, 79, 79–91. [Google Scholar] [CrossRef] [Scilit]
- Kundu, D.; Howlader, H. Bayesian inference and prediction of the inverse Weibull distribution for Type-II censored data. Comput. Stat. Data Anal. 2010, 54, 1547–1558. [Google Scholar] [CrossRef] [Scilit]
- Arabi Belaghi, R.; Noori Asl, M.; Gurunlu Alma, O.; Singh, S.; Vasfi, M. Estimation and prediction for the Poisson-Exponential distribution based on type-II censored data. Am. J. Math. Manag. Sci. 2019, 38, 96–115. [Google Scholar] [CrossRef] [Scilit]
- Dempster, A.P.; Laird, N.M.; Rubin, D.B. Maximum likelihood from incomplete data via the EM algorithm. J. R. Stat. Soc. Ser. B (Methodol.) 1977, 39, 1–22. [Google Scholar] [CrossRef] [Scilit]
- Fisher, R.A. On the mathematical foundations of theoretical statistics. Philos. Trans. R. Soc. Lond. Ser. A Contain. Pap. Math. Phys. Character 1922, 222, 309–368. [Google Scholar]
- Louis, T.A. Finding the Observed Information Matrix When Using the EM Algorithm. J. R. Stat. Soc. Ser. B (Methodol.) 1982, 44, 226–233. [Google Scholar] [CrossRef] [Scilit]
- Efron, B. The Jackknife, the Bootstrap and Other Resampling Plans; SIAM: Philadelphia, PA, USA, 1982. [Google Scholar]
- Hall, P. Theoretical comparison of bootstrap confidence intervals. Ann. Stat. 1988, 16, 927–953. [Google Scholar] [CrossRef] [Scilit]
- Jäntschi, L. Detecting extreme values with order statistics in samples from continuous distributions. Mathematics 2020, 8, 216. [Google Scholar] [CrossRef] [Scilit]
- Jäntschi, L. A test detecting the outliers for continuous distributions based on the cumulative distribution function of the data being tested. Symmetry 2019, 11, 835. [Google Scholar] [CrossRef] [Scilit]
- Raqab, M.Z.; Madi, M.T. Bayesian inference for the generalized exponential distribution. J. Stat. Comput. Simul. 2005, 75, 841–852. [Google Scholar] [CrossRef] [Scilit]
- Chen, M.H.; Shao, Q.M. Monte Carlo estimation of Bayesian credible and HPD intervals. J. Comput. Graph. Stat. 1999, 8, 69–92. [Google Scholar] [CrossRef] [Scilit]
- Lawless, J.F. Statistical Models and Methods for Lifetime Data; John Wiley & Sons: Hoboken, NJ, USA, 2011. [Google Scholar]
- Jäntschi, L.; Bolboacă, S.D. Computation of probability associated with Anderson–Darling statistic. Mathematics 2018, 6, 88. [Google Scholar] [CrossRef] [Scilit]

Disclaimer/Publisher’s Note: The statements, opinions and data contained in all publications are solely those of the individual author(s) and contributor(s) and not of MDPI and/or the editor(s). MDPI and/or the editor(s) disclaim responsibility for any injury to people or property resulting from any ideas, methods, instructions or products referred to in the content. |
© 2025 by the authors. Licensee MDPI, Basel, Switzerland. This article is an open access article distributed under the terms and conditions of the Creative Commons Attribution (CC BY) license (https://creativecommons.org/licenses/by/4.0/).