


Abstract
Since underwater imaging is affected by the complex water environment, it often leads to severe distortion of the underwater image. To improve the quality of underwater images, underwater image enhancement and restoration methods have been proposed. However, many underwater image enhancement and restoration methods produce over-enhancement or under-enhancement, which affects their application. To better design underwater image enhancement and restoration methods, it is necessary to research the underwater image quality evaluation (UIQE) for underwater image enhancement and restoration methods. Therefore, a subjective evaluation dataset for an underwater image enhancement and restoration method is constructed, and on this basis, an objective quality evaluation method of underwater images, based on the relative symmetry of underwater dark channel prior (UDCP) and the underwater bright channel prior (UBCP) is proposed. Specifically, considering underwater image enhancement in different scenarios, a UIQE dataset is constructed, which contains 405 underwater images, generated from 45 different underwater real images, using 9 representative underwater image enhancement methods. Then, a subjective quality evaluation of the UIQE database is studied. To quantitatively measure the quality of the enhanced and restored underwater images with different characteristics, an objective UIQE index (UIQEI) is used, by extracting and fusing four groups of features, including: (1) the joint statistics of normalized gradient magnitude (GM) and Laplacian of Gaussian (LOG) features, based on the underwater dark channel map; (2) the joint statistics of normalized gradient magnitude (GM) and Laplacian of Gaussian (LOG) features, based on the underwater bright channel map; (3) the saturation and colorfulness features; (4) the fog density feature; (5) the global contrast feature; these features capture key aspects of underwater images. Finally, the experimental results are analyzed, qualitatively and quantitatively, to illustrate the effectiveness of the proposed UIQEI method.
1. Introduction
Recently, as an essential carrier and expression form of underwater information, underwater imaging has played a critical role in the development of research for the ocean, such as the three-dimensional reconstruction of seabed scenes [1], marine ecological monitoring, autonomous underwater vehicle, and remote underwater vehicle navigation [2,3]. However, the complex underwater environment seriously affects the quality of underwater images, such as low visibility, blur texture, color distortion, and noise. These problems seriously affect the content interpretation of the image, and these images cannot meet the requirements of relevant image processing.
To address this problem, some underwater image enhancement and restoration methods are proposed [4,5,6,7,8,9,10,11,12,13,14,15,16,17,18]. However, due to the complexity of the underwater environment, underwater image enhancement and restoration methods will have problems, such as over-enhancement or under-enhancement. To better design underwater image enhancement and restoration methods, it is necessary to evaluate their quality. When a method of enhancing or restoring underwater images is proposed, it needs to be evaluated and compared with the most advanced methods. In practical underwater applications, the quality evaluation of underwater images after enhancement and restoration has major guiding significance for subsequent research.
Generally, the traditional image quality evaluation methods include subjective and objective quality evaluation. To better design the objective quality evaluation method, it is necessary to build the corresponding evaluation database through subjective quality evaluation. Recently, some underwater image quality evaluation databases have been constructed. Wu et al. [19] proposed the underwater optical image quality (UOQ) database. Ma et al. [20] proposed a large-scale database of underwater images, named NWPU database. Yang et al. [21] proposed an underwater image quality assessment benchmark database. However, there are few datasets about underwater image enhancement to evaluate enhancement and restoration methods.
To better design underwater image enhancement and restoration methods, it is necessary to study the objective quality evaluation method for underwater image enhancement and restoration. Generally speaking, according to the amount of information the raw image requires, the objective evaluation of image quality can be divided into three types: full-reference, reduced-reference, and no-reference. There are no distortion-free underwater images as a reference. Therefore, the objective quality evaluation of underwater images is a kind of no-reference method.
Recently, some specially designed underwater image evaluation methods have been proposed by the specific characteristics of underwater images, to better evaluate the underwater image quality. Yang et al. [22] designed an underwater color image quality evaluation (UCIQE) metric, generated by a linear combination of chroma, saturation, and contrast. Panetta et al. [23], inspired by the human visual system, proposed a new no-reference underwater image quality measurement (UIQM), including color, sharpness, and contrast. Wang et al. [24], inspired by the underwater imaging model, proposed a multiple linear regression combination of a color index, contrast index, and fog density index, dubbed the CCF. However, there are few underwater image quality evaluation methods for underwater image enhancement and restoration. Additionally, the complex underwater imaging environment causes severe underwater image distortion. The current underwater image enhancement and restoration methods cannot completely solve the problem of underwater image quality, which means there is still a lot of space for underwater image quality evaluation for underwater image enhancement and restoration.
In this paper, considering underwater image enhancement in different scenarios, nine methods of underwater image enhancement and restoration were chosen, including the image enhancement method, image restoration method, and depth learning method. Firstly, these underwater enhancement methods are described and compared. Secondly, the benchmark of underwater image enhancement is established through subjective quality evaluation. In addition, we propose a new objective quality measurement method of the enhanced and restored underwater images, based on the underwater dark channel prior (UDCP) and the underwater bright channel prior (UBCP), which can effectively evaluate the quality of the enhanced and restored underwater images. The contributions of this paper are as follows:
- The underwater image quality evaluation (UIQE) database: The paper creates a UIQE database, which collects 45 real underwater images, enhanced by 9 enhancement methods, and generates a total of 405 underwater images. Then, the UIQE database is subjectively studied and an important discovery is obtained. Although the existing enhancement methods perform well in enhancement, they are still difficult to maintain, regarding the balance in removing color and preserving details to obtain better underwater images.
- An objective UIQE index (UIQEI) method: Based on the UDCP and BCP, an objective method was proposed to accurately evaluate the quality of the enhanced and restoration underwater images. The enhanced and restored underwater images usually show different degrees of degradation in the different local regions, which brings great difficulties to the overall quality recognition of enhanced and restored underwater images. To solve this problem, an underwater dark channel map was used to illustrate the information of darker areas. Then, an underwater bright channel map is developed to show the region of brightness supersaturation. Further, the features extracted by the joint statistics of normalized gradient magnitude (GM) and Laplacian of Gaussian (LOG) are fused to capture the local differences. Finally, the features of color, fog density, and global contrast are discussed.
The rest of the paper consists of the following: Briefly reviewing some related work in Section 2. Section 3 describes the construction of an underwater database and the research of subjective evaluation. In Section 4, we introduce the specific process of feature extraction and predict the image quality. Section 5 verifies the effectiveness of the proposed method. Section 6 provides the conclusion.
2. Related Work
In this section, we briefly review the underwater imaging model and underwater enhancement method.
2.1. Underwater Imaging Model
In the process of underwater imaging in the ocean, seawater is a complex mixture, including water, suspended particles, plankton, and so on. The non-uniformity of seawater affects the light wave by absorption and scattering when it propagates in water. Absorption leads to energy loss when light passes through the medium, which depends on the refractive index of the medium. Scattering results in an offset of the propagation path. In the complex underwater environment, the attenuation of light is connected to the wavelength and color. Because the wavelength of red light is the largest, the attenuation of red light is the fastest, followed by yellow light and green light. Therefore, underwater images usually have a blue-green hue. In the Jaffe-McGlamery model [25], the underwater optical imaging process can be mathematically expressed as:
where ET is the total irradiation energy entering the camera, Ed is the light directly reflected by the object to the camera, Eb refers to the light that enters the camera when the light shines on the impurities in the water, and Ef is the random deviation of light before entering the camera lens.
Generally, the forward scattering can be ignored due to the close distance between the underwater scene and the camera. Based on predecessors [26,27,28], only the direct transmission component and background scattering component are considered. The simplified underwater image forming model (IFM) can be modeled, and the underwater image is defined as follows:
where is the restored underwater scene, the direct scattering component , and the underwater image is the transmission medium map, the back scattering component , represents the color channel, , and represents the background light, represents , represents the attenuation coefficient, and represents the depth map between the camera and the scene, and x represents the pixel coordinates. Here, the accuracy of parameter estimation directly affects the quality of restoration. In addition, this model is a simplified model, and the underwater environment is complex, resulting in a challenge for underwater image restoration.
2.2. Underwater Image Enhancement and Restoration
Recently, with the development of underwater image application, many methods for underwater image enhancement and restoration have been proposed. The enhancement method, restoration method, and deep learning method were used to improve the image quality. The existing methods to improve underwater image quality can be summarized into the following categories.
Based on the traditional image enhancement method, the image quality is improved from subjective qualitative and visual direction by changing the pixel value of the image, which does not involve the IFM model [4,5,6,7,8]. Fu et al. [4] proposed a Retinex-based (RB) method to enhance the quality of the underwater image. The process mainly includes three steps: an effective color correction strategy, a variational framework, and an alternating direction optimization strategy. Ancuti et al. [5] proposed a multi-scale fusion strategy for underwater image enhancement. Henke et al. [6] proposed a feature-based color constancy hypothesis method to correct the color deviation of underwater images, by analyzing the problems encountered in the application of the classical color constancy method for underwater images. Ji et al. [7] introduced an image structure decomposition for underwater image enhancement. Gao et al. [8] introduced an underwater image enhancement method based on local contrast correction (LCC) and multi-scale fusion. These methods improve the contrast and image quality of underwater scenarios to a certain extent, but due to the complex underwater imaging environment, the raw image cannot completely restore its details.
The image restoration method mainly constructs a reasonable mathematical model and then restores the underwater image, according to the IFM model [9,10,11,12]. Based on the physical model of the light propagation, Drew et al. [9] proposed the UDCP, which is the underwater visual information source of blue and green channels. Galdran et al. [10] proposed a Red channel (RED) restoration method, which restores the color related to short wavelengths, based on the attenuation of underwater images, and restores the low contrast. Peng et al. [11] proposed a method to estimate underwater background light, scene depth, and transmission map, based on underwater image blurring and light absorption (UIBLA). Zhao et al. [12] found that underwater image degradation is related to the optical properties of water. The optical properties of underwater media are obtained through the background color of the underwater image, and then the degradation process is inverted to restore a clear underwater image. However, restoration methods require many physical parameters and underwater optical properties, which makes these methods difficult to implement.
With the rise of deep learning in computer vision and image processing, there are some deep learning methods based on a large number of training datasets to enhance underwater image quality [13,14,15,16,17,18]. Zhu et al. [13] proposed a generative adversarial network, called CycleGAN, which uses a set of aligned image pair training sets to learn the mapping between an input image and output image, to realize the transformation of image style. Fabbri et al. [14] proposed a method to improve the quality of underwater visual scenes by using generative adversarial network (UGAN), which generates the paired images as the training datasets for degradation processing, and then using the pix2pix model to improve the underwater image quality. In UGAN, gradient penalty is more time-consuming than spectrum normalization. Li et al. [15] proposed a weakly supervised color transfer (WSCT) method to correct color distortion. WSCT is a multiterm loss function, including adversarial loss, periodic consistency loss, and structural similarity index measure loss. Li et al. [16] proposed a fusion generated adversarial network (FGAN) for enhancing underwater images. Wu et al. [17] decomposed the original underwater image into high frequency and low frequency, based on the underwater imaging model. Then, a two-stage underwater enhancement network (UWCNN-SD) of preliminary enhancement network and refinement network is proposed. However, the deep learning method needs to rely on rich training data to improve the image quality in different underwater scenarios. Khaustov et al. [18] proposed using a genetic algorithm and artificial neural network with back propagation error to enhance underwater image quality.
These enhancement methods improve the image quality of underwater scenes to a certain extent, but in some scenes, the enhanced and restored underwater images will be over-enhanced or under-enhanced. For some images, it is difficult to obtain relevant parameter values, which means the enhanced and restored underwater images are quality are unsatisfactory. Therefore, it is necessary to build a generally enhanced and restored underwater image quality evaluation method, to compare the advantages and disadvantages of these methods.
3. Construction of Subjective Evaluation Database
3.1. Underwater Image Enhancement Database (UIQE)
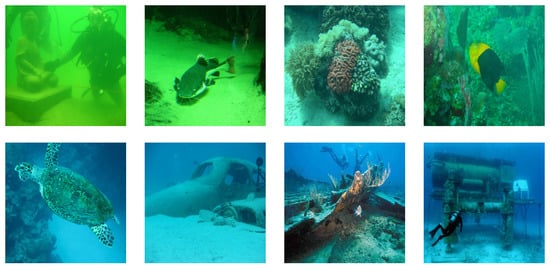
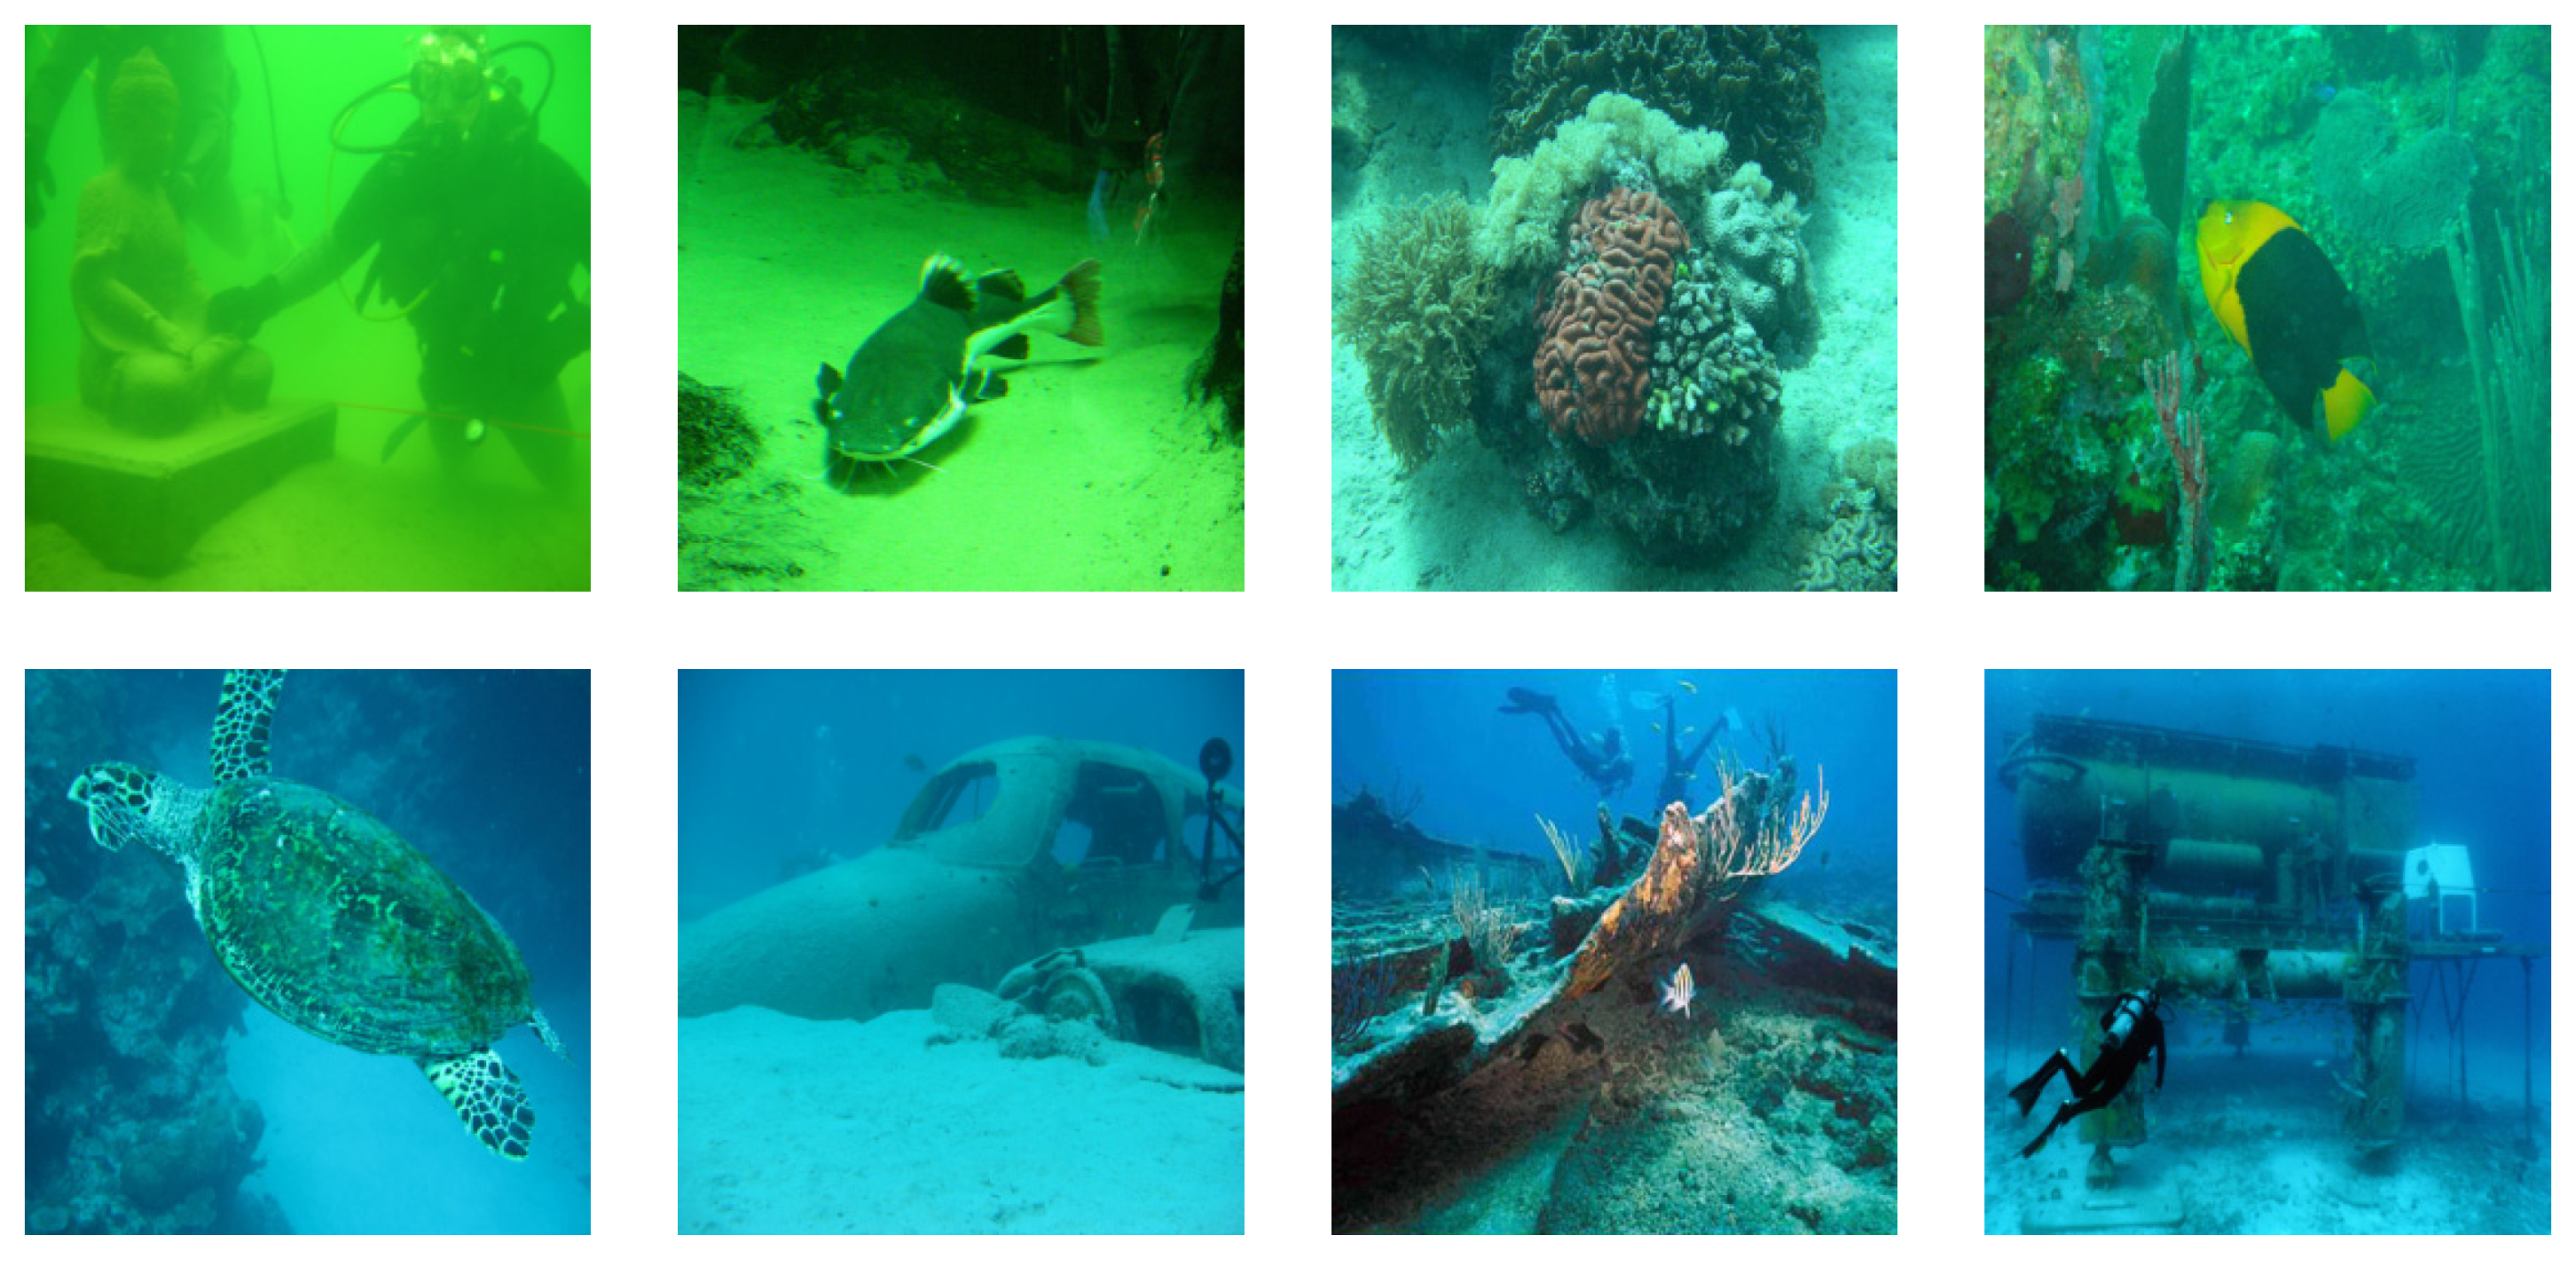
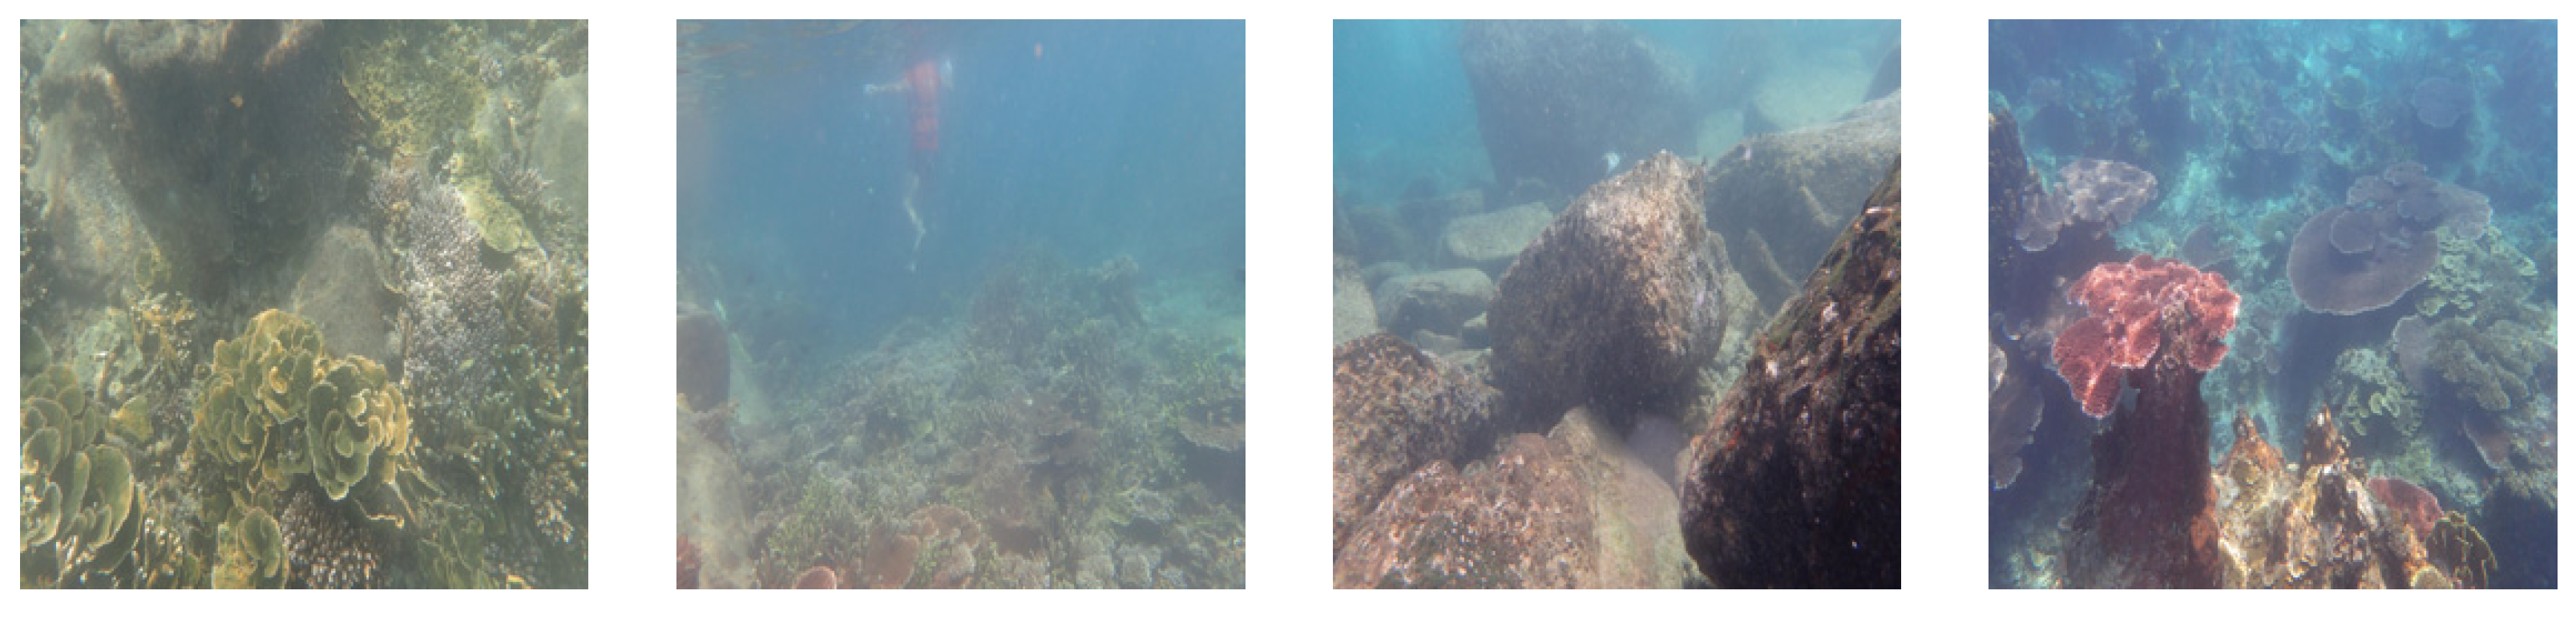
To analyze the image quality of the underwater image after the enhancement and restoration method, a quality evaluation database for the underwater image enhancement and restoration methods should be established. In the database, different underwater scenes should be considered. Firstly, 240 real underwater images were collected from [5,10,14,16,29,30], Imagenet [31], Sun [32], and the seabed near Zhangzi Island, in the Yellow Sea of China, to form a U45 dataset. To include different underwater environments, 45 underwater images were selected to construct the U45 dataset [16], which includes three classic underwater images of the green, blue, and haze scene, and each scene consists of 15 raw underwater images. The 45 underwater images selected include different scenes, such as reefs, fish, corals and portraits. In addition, when selecting images, we also consider that the close range is bright, the close range is dark, and the whole is bright. These images reflect the influence of lighting and weather on the images. Figure 1 shows some images from the U45 dataset.
Figure 1.
Real underwater images were collected in the UIQE database.
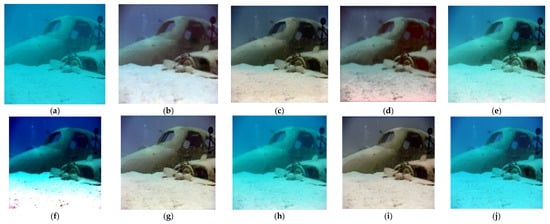
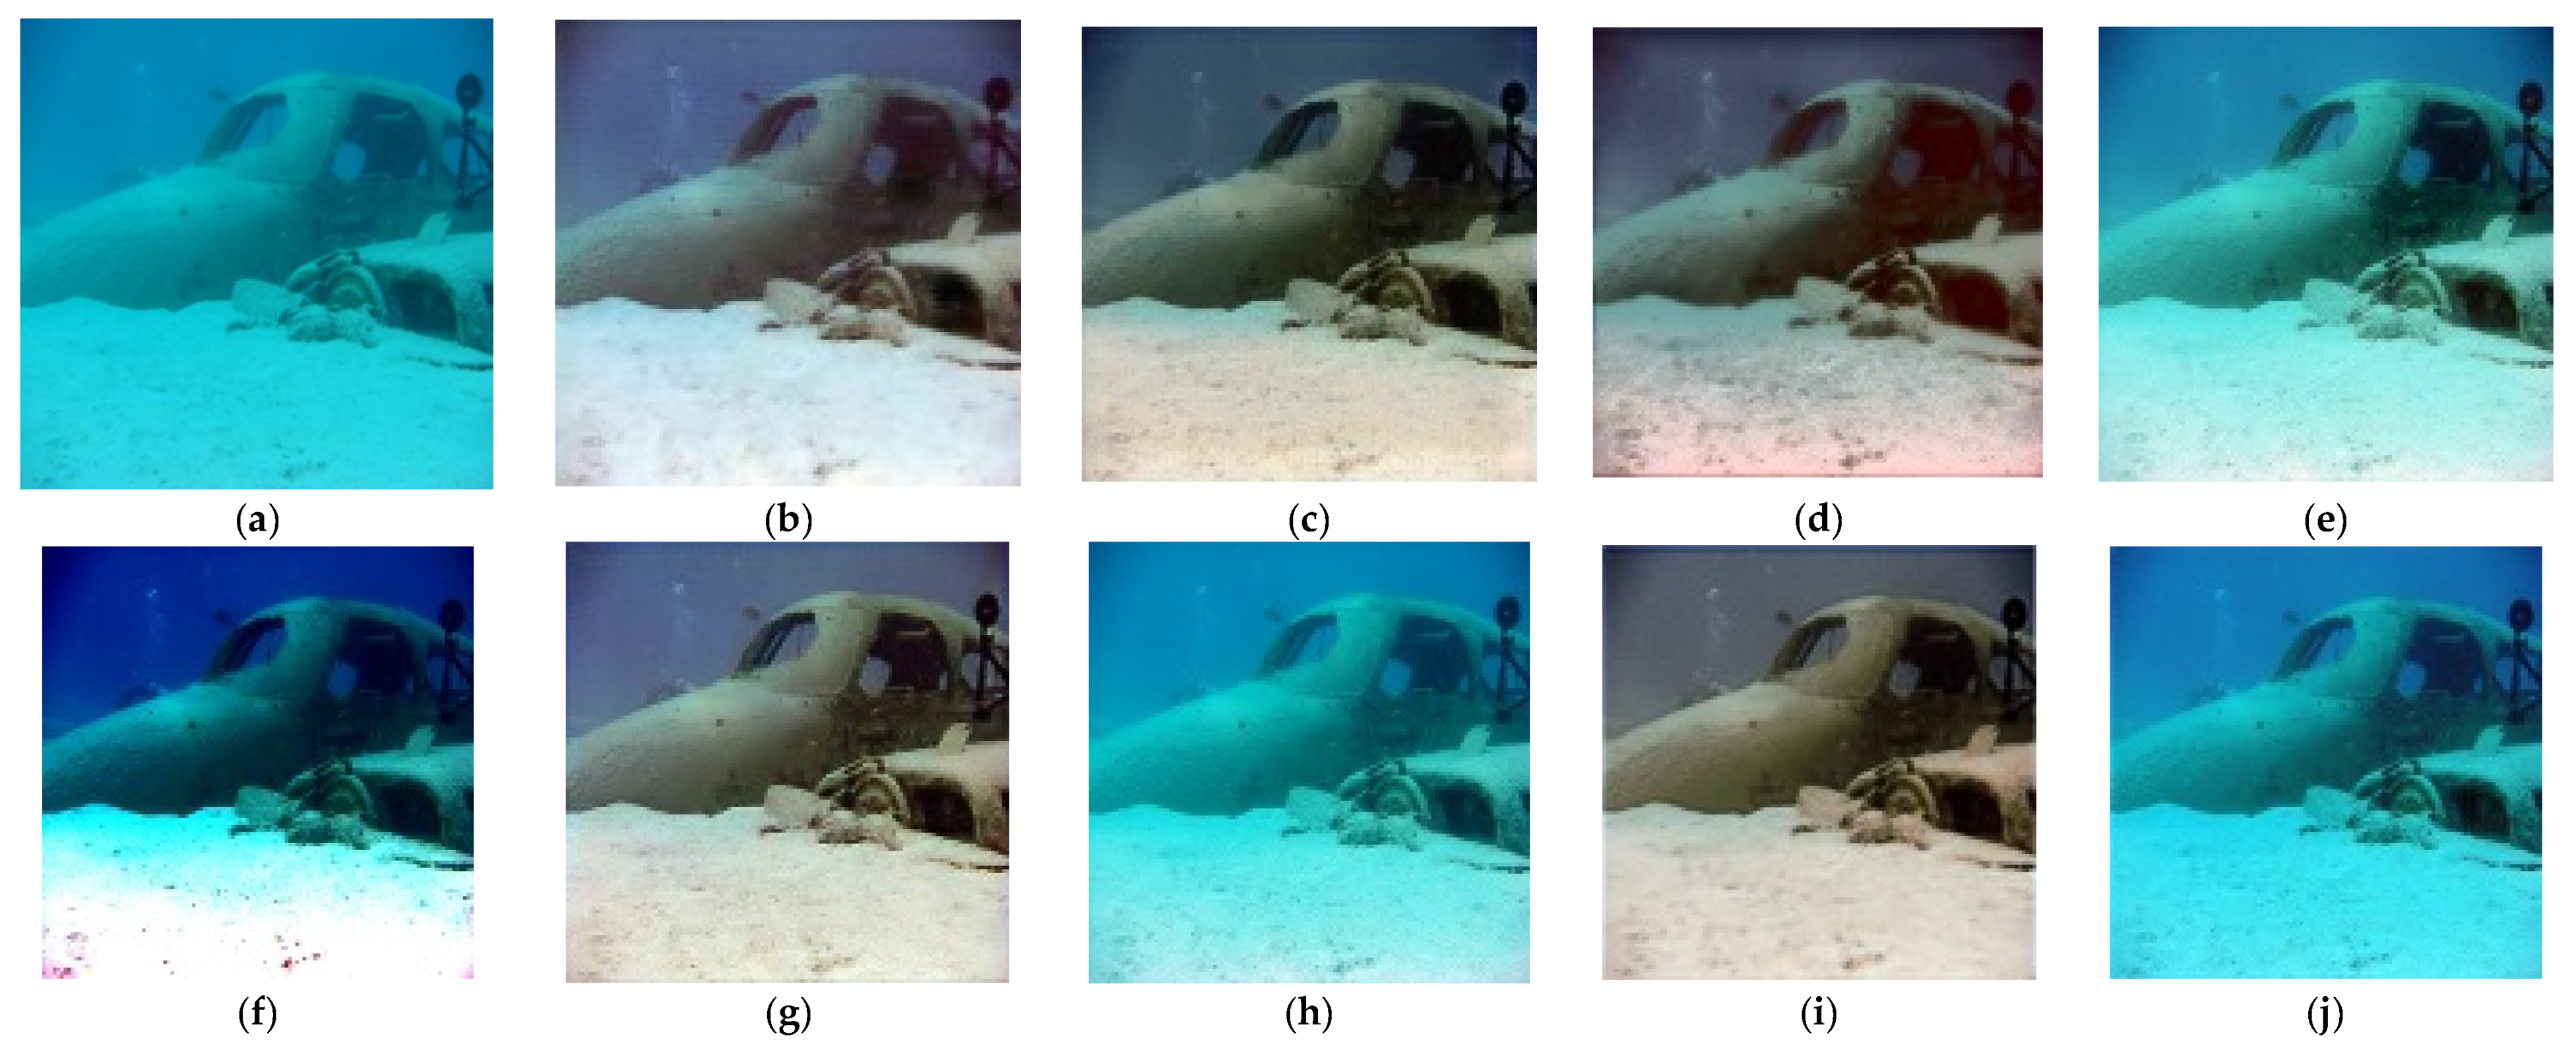
To improve the quality of underwater images, different image enhancement methods, restoration methods, and deep learning methods were used to enhance the original underwater images, including RB [4], UDCP [9], UIBLA [11], RED [10], CycleGAN [13], WSCT [15], UGAN [14], FGAN [16], UWCNN-SD [17]. Here, the author published all codes of underwater image enhancement and restoration, and there is no additional debugging for the code and default parameters. A total of 405 underwater images were generated, which constitute the UIQE database for underwater image enhancement and restoration methods. In Figure 2, we intuitively compare the different methods of the underwater images generated after enhancement. It can be found that different methods show different appearances. In the following subsection, subjective experiments are set and implemented to evaluate the images generated by these enhancement methods, quantitatively.
Figure 2.
The effects of 9 different methods on underwater image enhancement are shown. (a) Raw. (b) CycleGAN. (c) FGAN. (d) RB. (e) RED. (f) UDCP. (g) UGAN. (h) UIBLA. (i) UWCNN-SD. (j) WSCT.
3.2. Sets of Subjective Quality Evaluation
In this subsection, a subjective quality evaluation was conducted on the UIQE database. Using the double stimulation strategy, the raw underwater image is displayed side by side with the image enhanced by different methods. Subjects need to use a 5-level classification scale to evaluate the quality of overall underwater image enhancement, as shown in Table 1. It is suggested that the subjects score the overall quality of the image mainly from the following aspects: color restoration, contrast enhancement, real texture, edge artifacts, and good visibility. Each group of underwater images is displayed for 3 s, and the gray image of 1 s is displayed in the middle. Further, 405 underwater images are evenly divided into three parts, according to color. Each part has 135 images, and each part does not exceed 9 min. Each image was scored by 25 subjects. The subjects sat in the laboratory environment, under normal indoor lighting conditions, and the image was displayed on a 15-inch LCD screen with a resolution of 1920 × 1080 pixels. The viewing distance is about 3-times the screen height. Each part of the test image is randomly displayed on the LCD, which is calibrated according to the recommendations given in ITU-R bt.500-13 [33]. Before the beginning of each experiment, subjects received written instructions describing the experimental process, including the scoring scale and schedule. Ten underwater images different from the database were used for training, to make the subjects familiar with the process.
Table 1.
Rating analysis of underwater image enhancement.
3.3. Subjective Data Processing
Furthermore, the original rating data, according to [33,34,35], were processed. In the data screening process, there are rejected subjects, and the rating of an image is considered; if the average rating of the image exceeds 2 (if normal) or (if abnormal) standard deviation, it will be regarded as an outlier. Subjects with outlier evaluation of more than 5% will be rejected. Five subjects were rejected during the experiment. After excluding them, we used the remaining research data to form the mean opinion score (MOS) of each image. Let Sij be the raw score assigned by subject i to the test image j, and Nj be the total number of scores received by test image j, then MOS can be defined as follows:
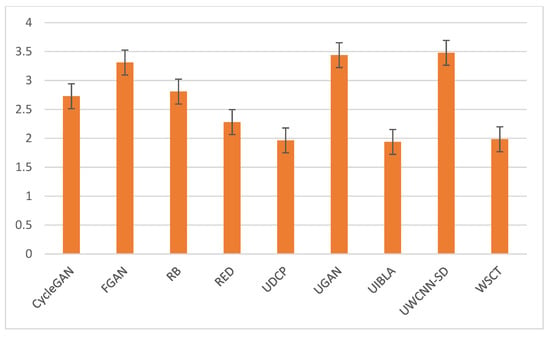
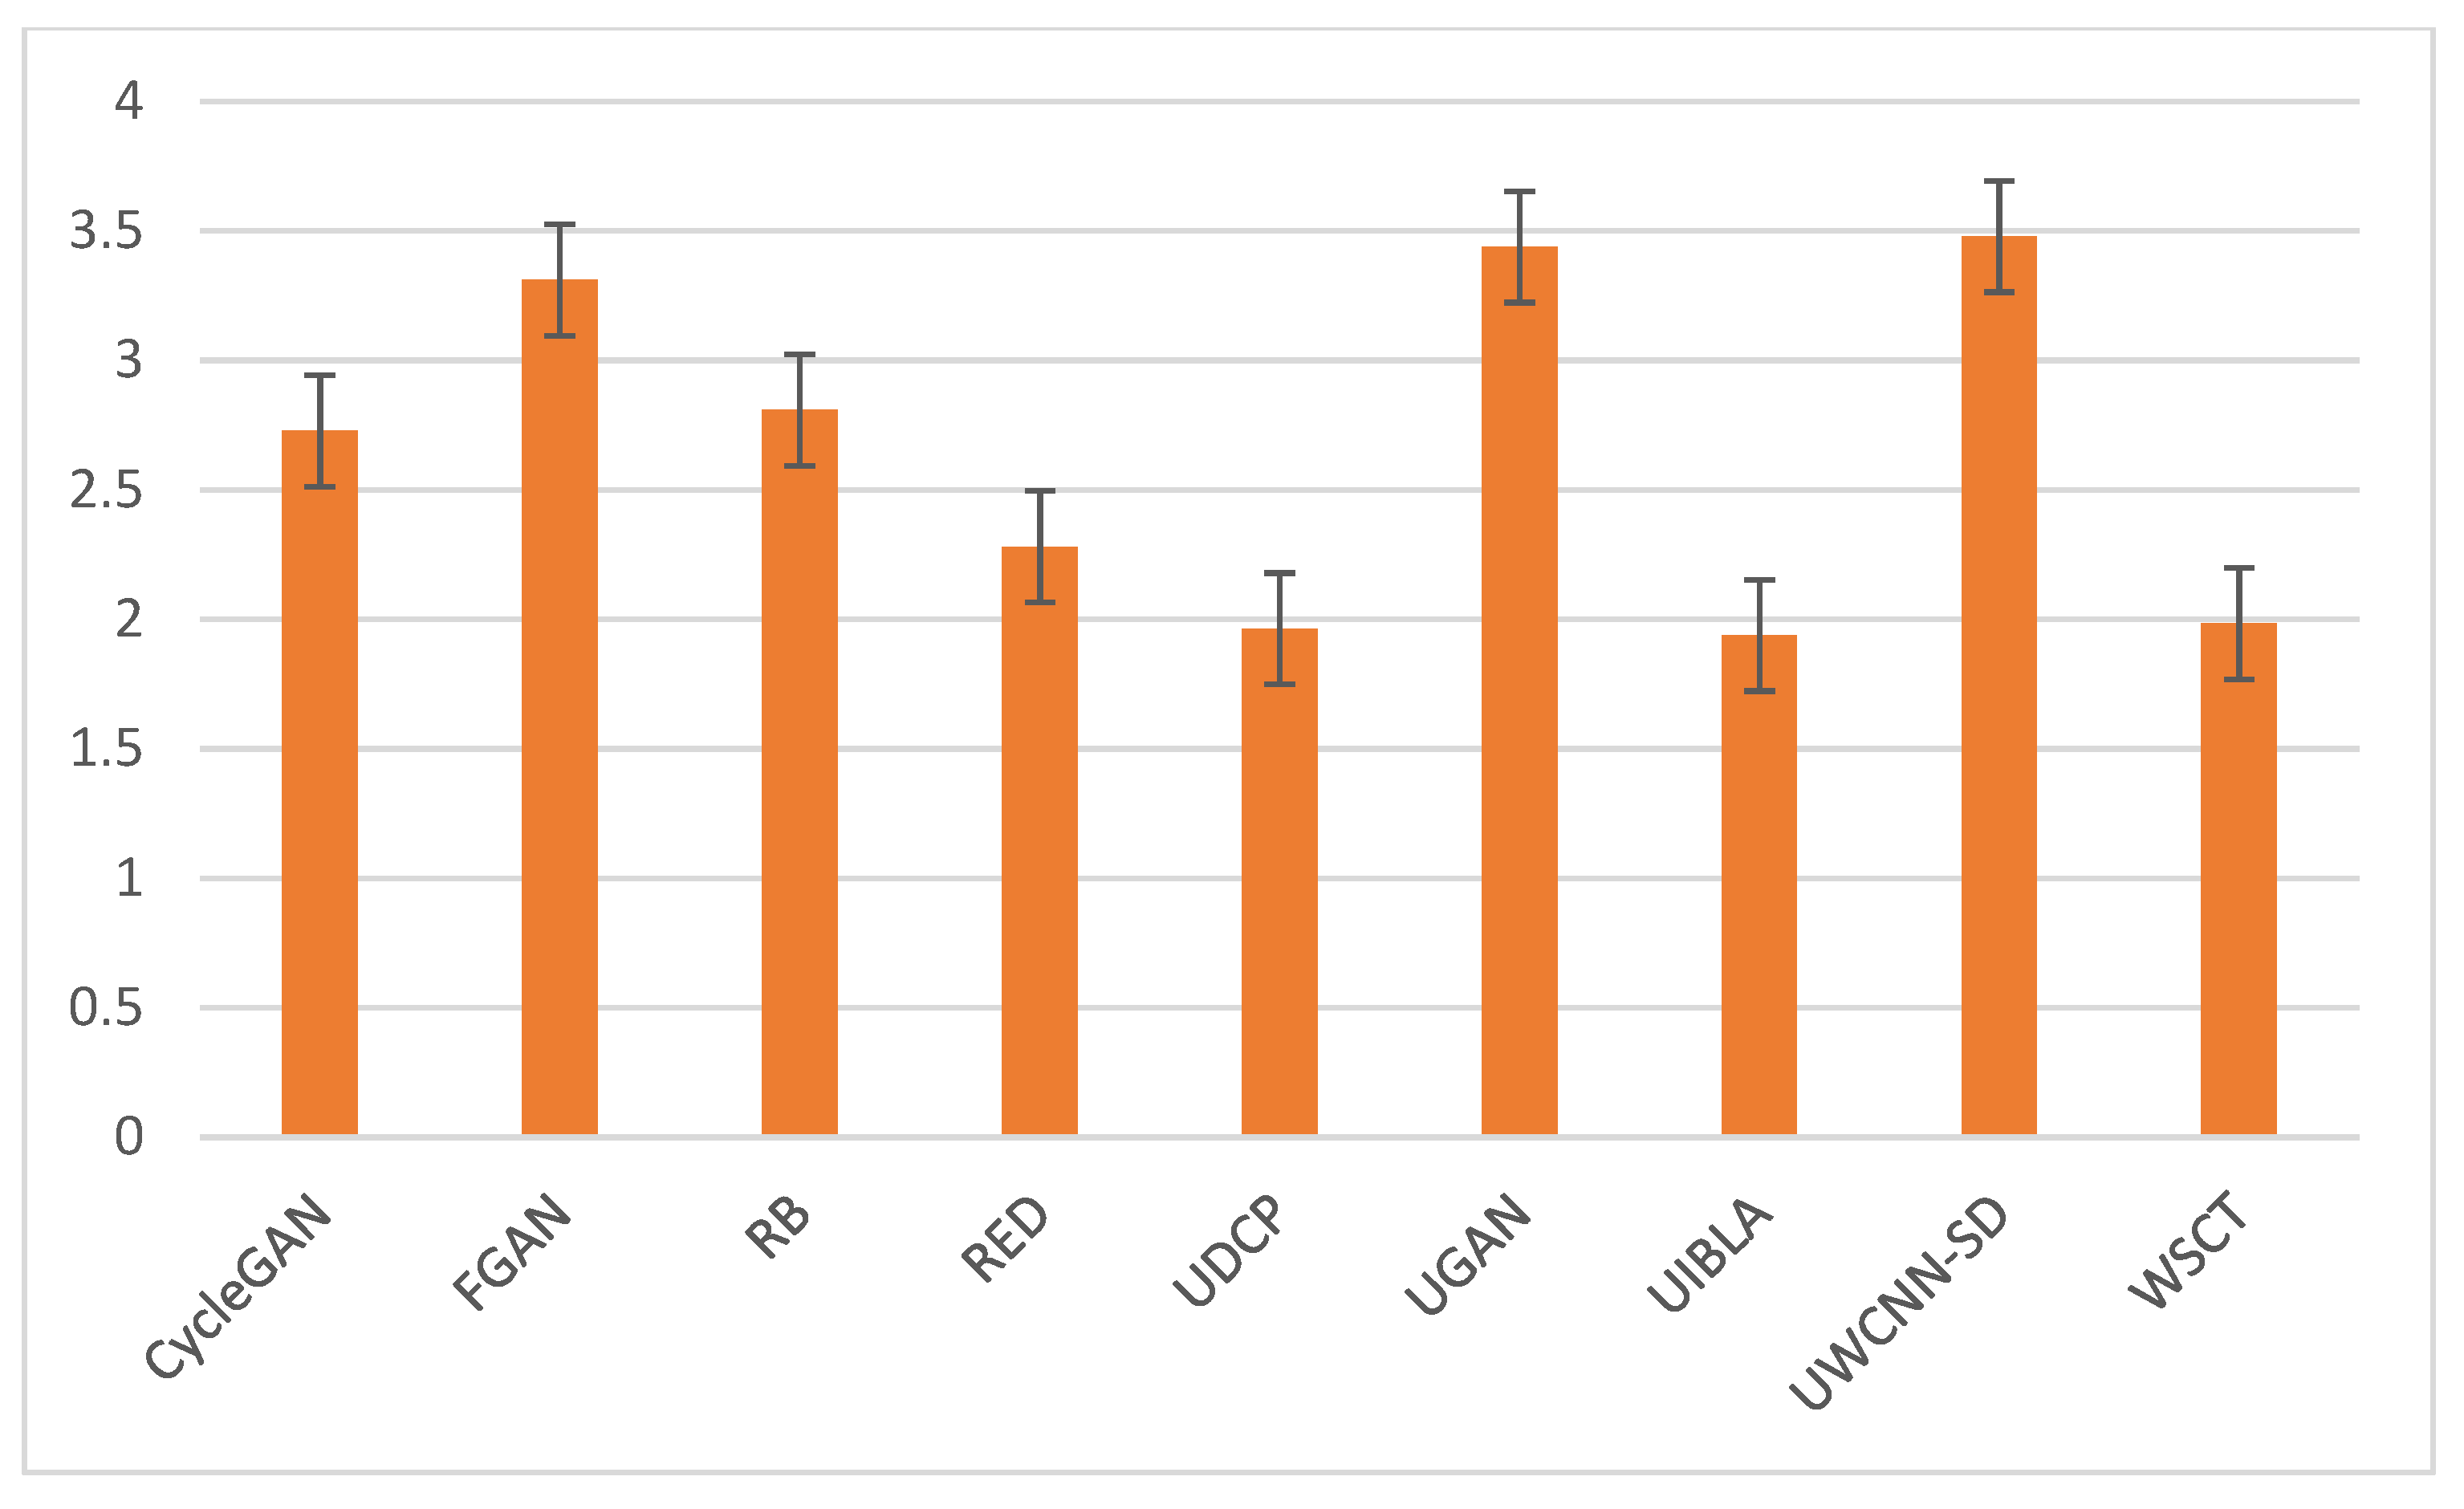
To quantitatively compare different enhancement and restoration methods, the average and standard deviation of MOS values for each method are calculated, shown in Figure 3. Each method is associated with MOS value, which is collected from the enhanced underwater image. In underwater images, UGAN, FGAN, and UWCNN-SD have the highest average scores, RED, UDCP, and UIBLA have lower average scores, and other methods are between them.
Figure 3.
Comparison of mean and standard deviation of MOS values of different enhancement algorithms.
Due to the real perceived underwater image quality (i.e., MOS), it can be used to evaluate the quality of different underwater image enhancement and restoration methods, to make the image enhancement methods develop in the right direction. To better design underwater image enhancement and restoration methods, to improve the quality of underwater images, it is necessary to evaluate the enhanced underwater image. There are a lack of objective underwater image quality evaluation methods for underwater image enhancement and restoration methods.
4. Objective Model of UIQEI
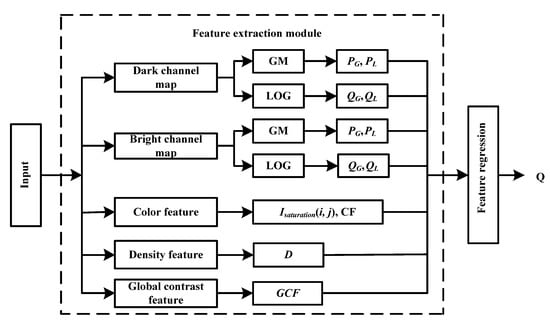
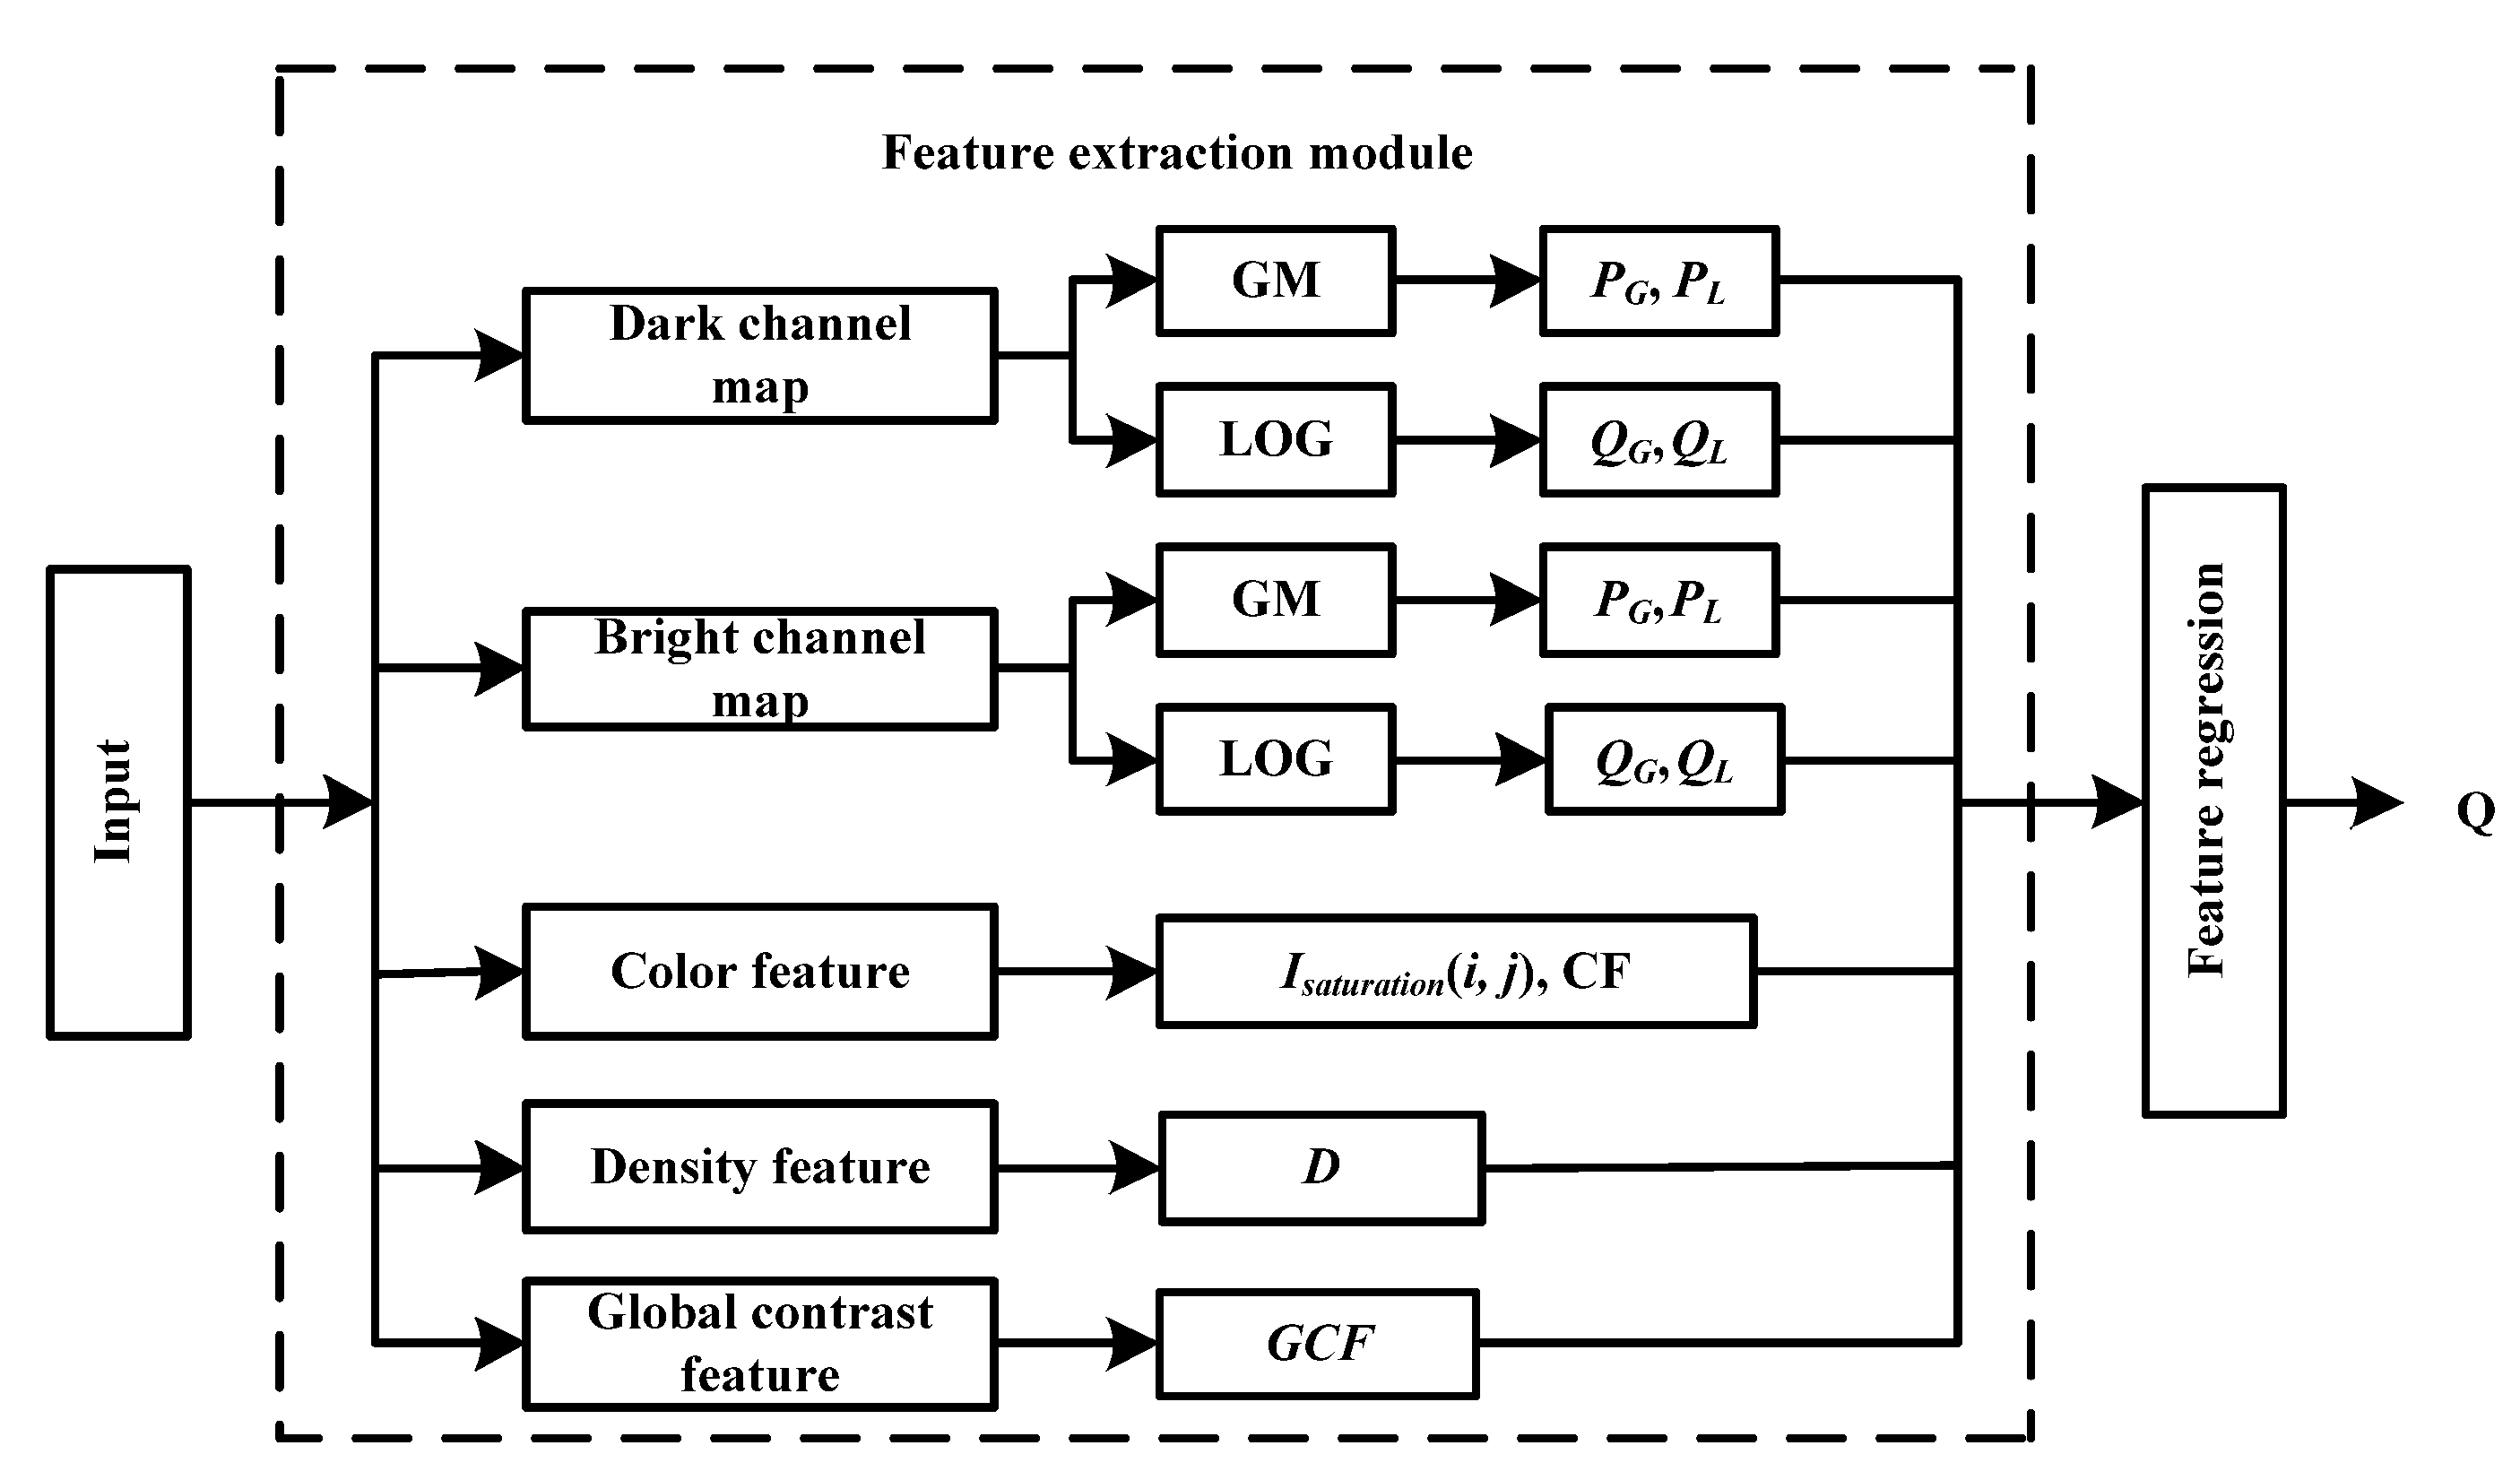
To quantitatively evaluate the image quality and consider the characteristics of the underwater imaging, a UIQEI, based on the UDCP and the UBCP, is proposed. The flow chart of the proposed UIQEI is shown in Figure 4. The proposed UIQEI is mainly constructed from five aspects: the joint statistics of normalized GM and LOG features of the UDCP; the joint statistics of normalized GM and LOG features of the UBCP; the colorfulness features; the fog density feature; the global contrast feature. Five sets of features are extracted to measure the image quality, and these features are fused into an overall underwater image enhancement method quality evaluation. Local contrast features can effectively convey the structural information of the image, in which GM and LOG features can be designed to construct the basic elements of image semantic structure (i.e., local contrast), so they are closely related to the perceived quality of the natural image.
Figure 4.
The effects of 9 different methods on underwater image enhancement are shown.
4.1. Local Contrast
4.1.1. Underwater Dark Channel Prior Theory and Bright Channel Prior Theory
For underwater imaging, contrast reduction is usually caused by backscattering, low contrast images are produced by uneven pixel distribution of the image, and the contrast corresponds to visual acuity. Compared with the atmospheric imaging, the underwater image will change with the depth of water in the acquisition process, and there will be increasing dark scenes in the image. Therefore, the light–dark contrast of an underwater image is not obvious. To improve the difference in the pixel values of the image, this paper is based on the relevant features extracted from an underwater dark channel map. The contrast of underwater images, based on the UDCP, can analyze the changes between image enhancement more sensitively.
Considering the special conditions of underwater imaging, the R channel decays first in light propagation, which makes the R channel close to zero in many cases. Therefore, only G and B channels need to be considered to calculate the dark channel of the underwater image. In the formal description of UDCP prior, the concept of dark channel is defined as [12,36,37,38]:
where represents the brightness values of channels G and B in a color image, and represents a pixel window centered on pixel points . The formula still satisfies the underwater dark channel prior and can reflect the total attenuation effect of blue-green underwater imaging. According to the UDCP and Formula (1), approximately calculating the minimum value of image brightness of each color channel of the image, that is, the underwater dark channel value of the original image, and the underwater dark channel map, is as follows:
where represents the G and B channel images, and represents the minimum brightness value of the G and B channel images. The underwater dark channel map can reflect the details of the image and the enhancement effect of color and improve the visual effect of the image. The low intensity in the underwater dark channel diagram is caused by the following three main features: (i) shadows, such as the shadows of underwater fish, corals, people, and other objects; (ii) colored objects or surfaces, such as blue or green scenes; (iii) dark objects or surfaces, such as dark fish and stones. Therefore, for the method with a better enhancement effect, the pixel value of the underwater dark channel map is low in (i) and (iii) features. In addition, the pixels generated by the underwater dark channel of the enhanced underwater image have a value higher than zero.
Similar to UDCP, this paper introduces the underwater bright channel prior (UBCP) theory to describe the image quality more accurately [39]. The underwater dark channel prior and the underwater bright channel prior are relatively symmetrical. One is to study the pixel value of the underwater dark channels and the other is to study the pixel value of the underwater bright channels. The maximum intensity of each image block with good effect should be of great value, called the bright channel. The pixel value of the bright channel of the distant scene in the image is low, especially when the image is composed of pure water. We assume that the bright channel intensity of underwater images without pure water and distant scenes is approximately 1. Then, the UBCP [39,40,41] can be defined as follows:
where represents the brightness values of channels G and B in a color image and represents a pixel window centered on pixel points . For an enhanced and restored underwater image I, the underwater bright channel map can be expressed as:
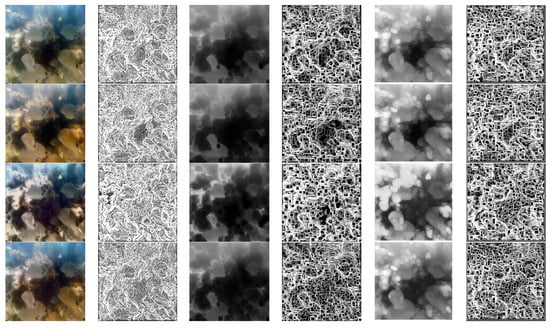
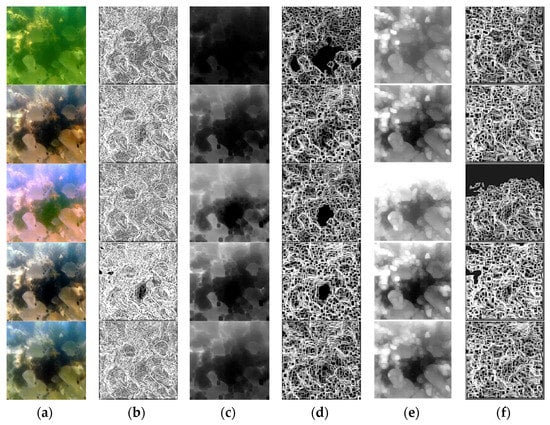
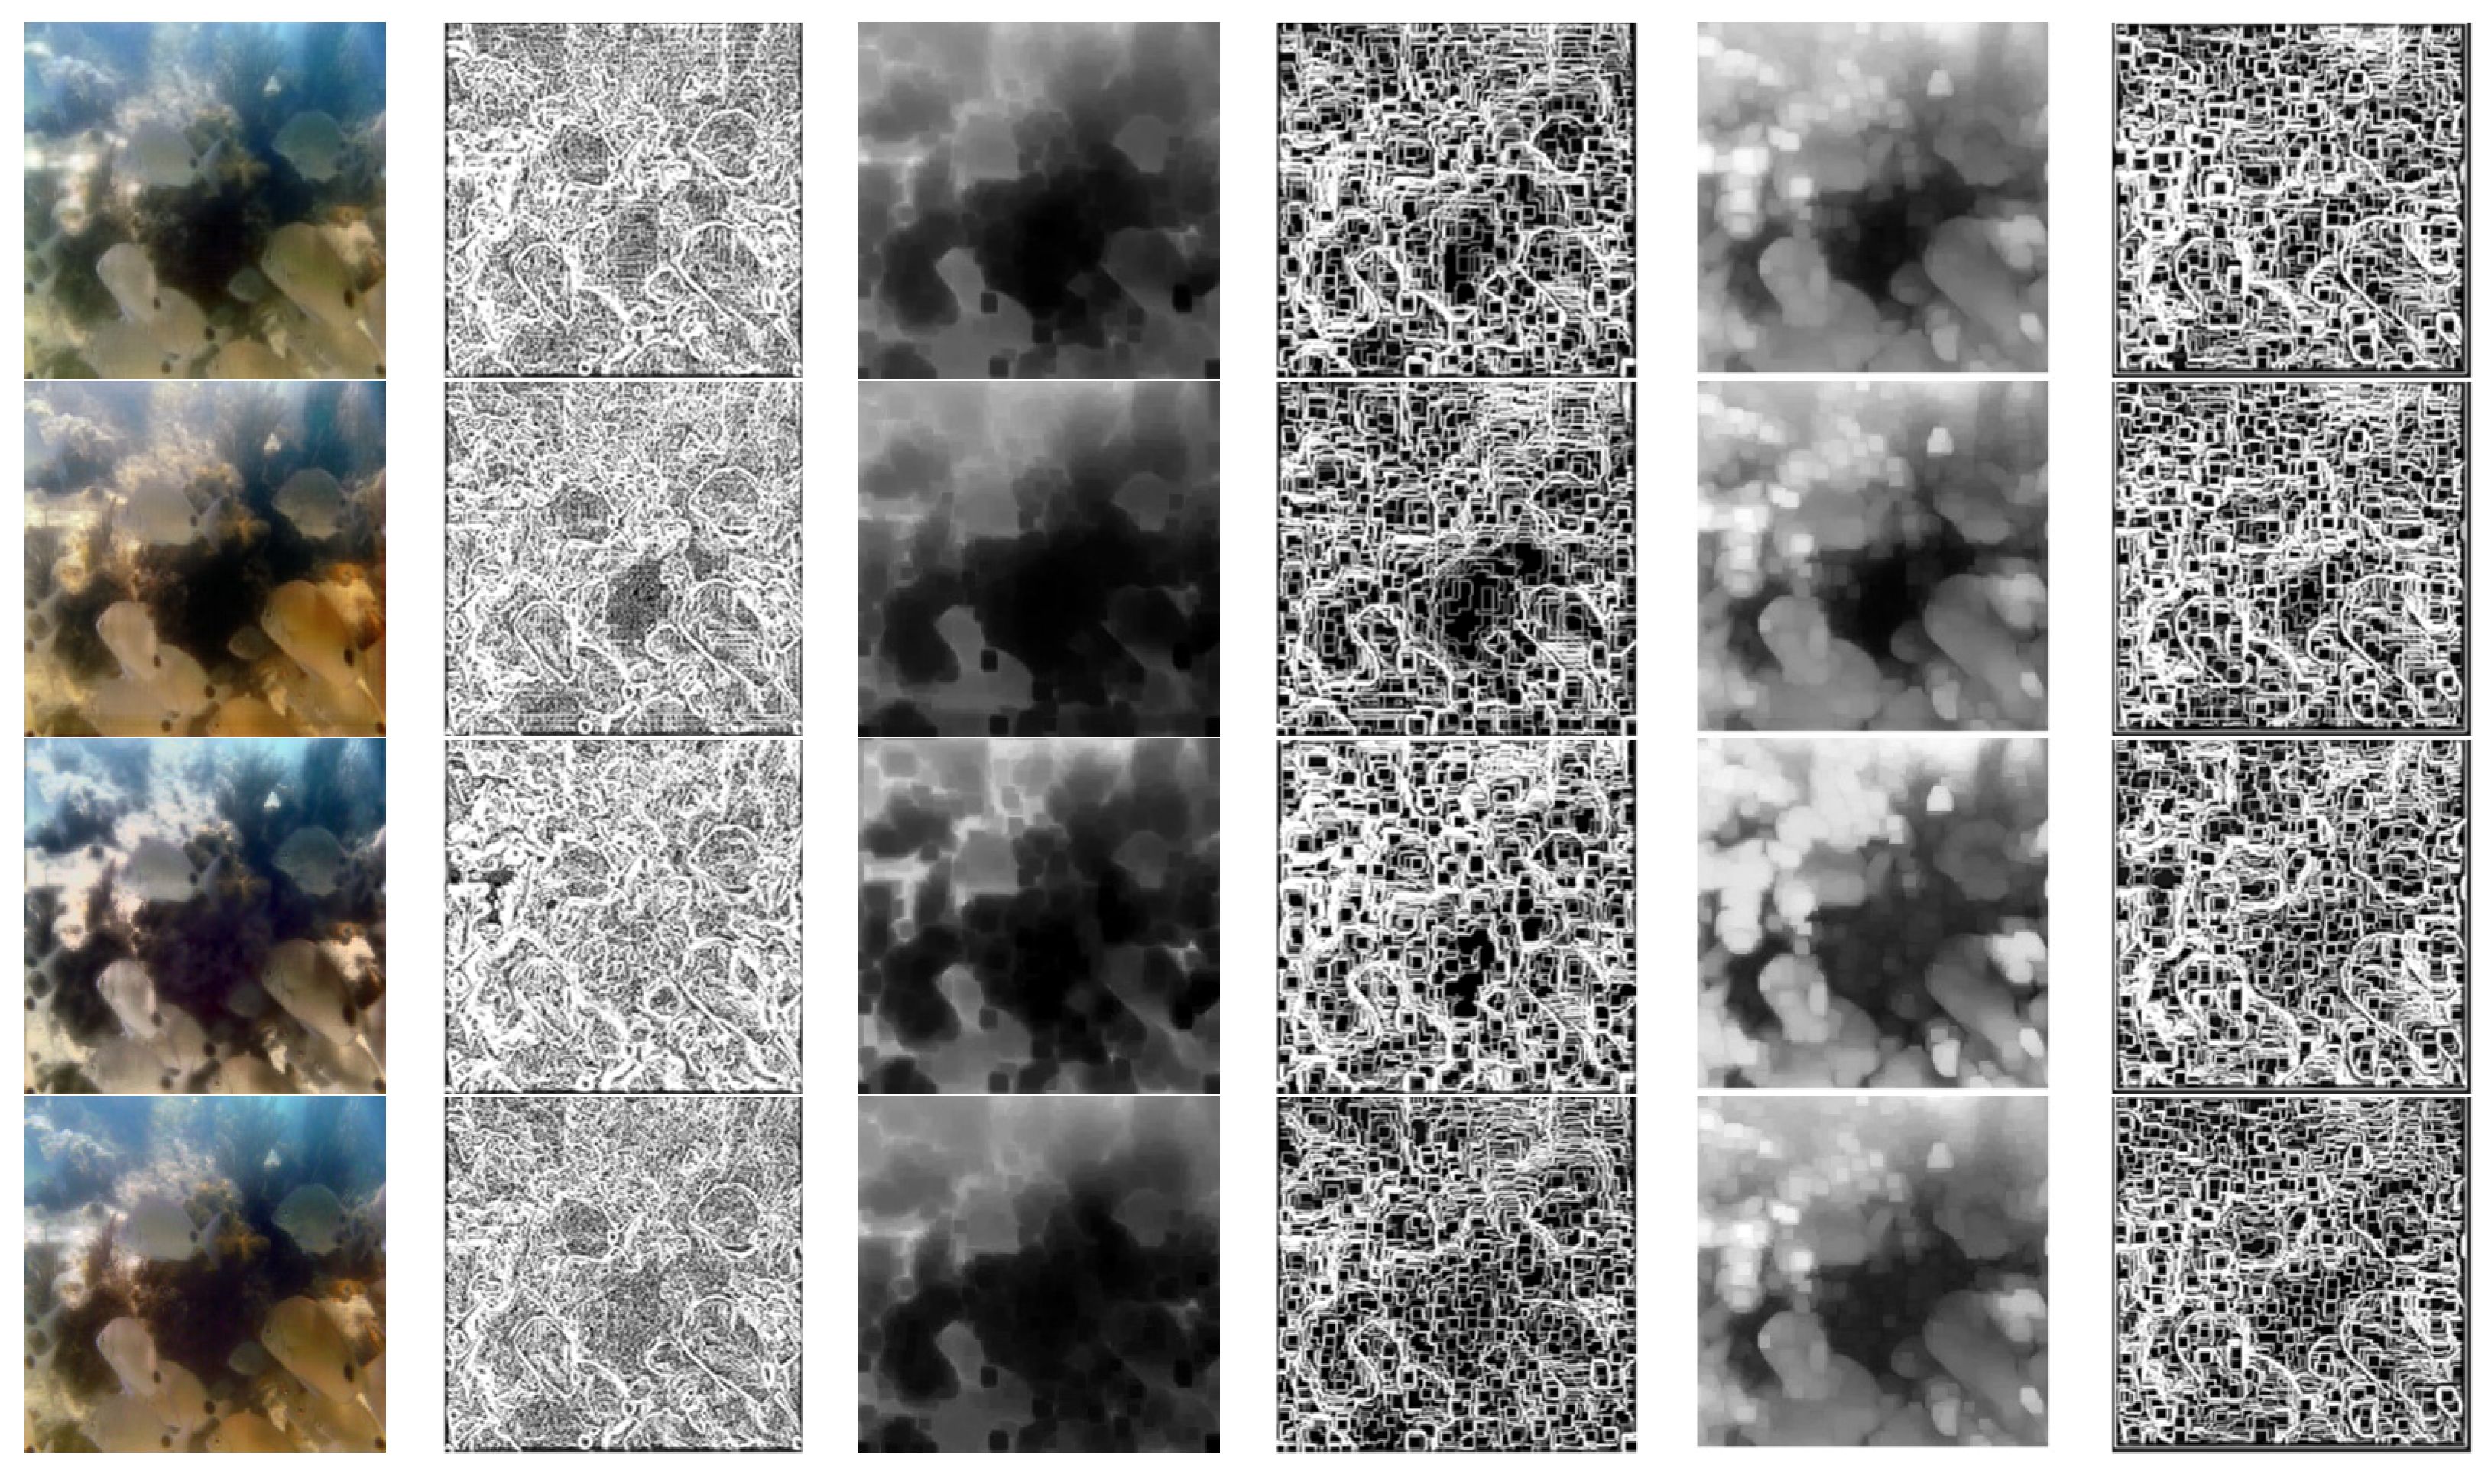
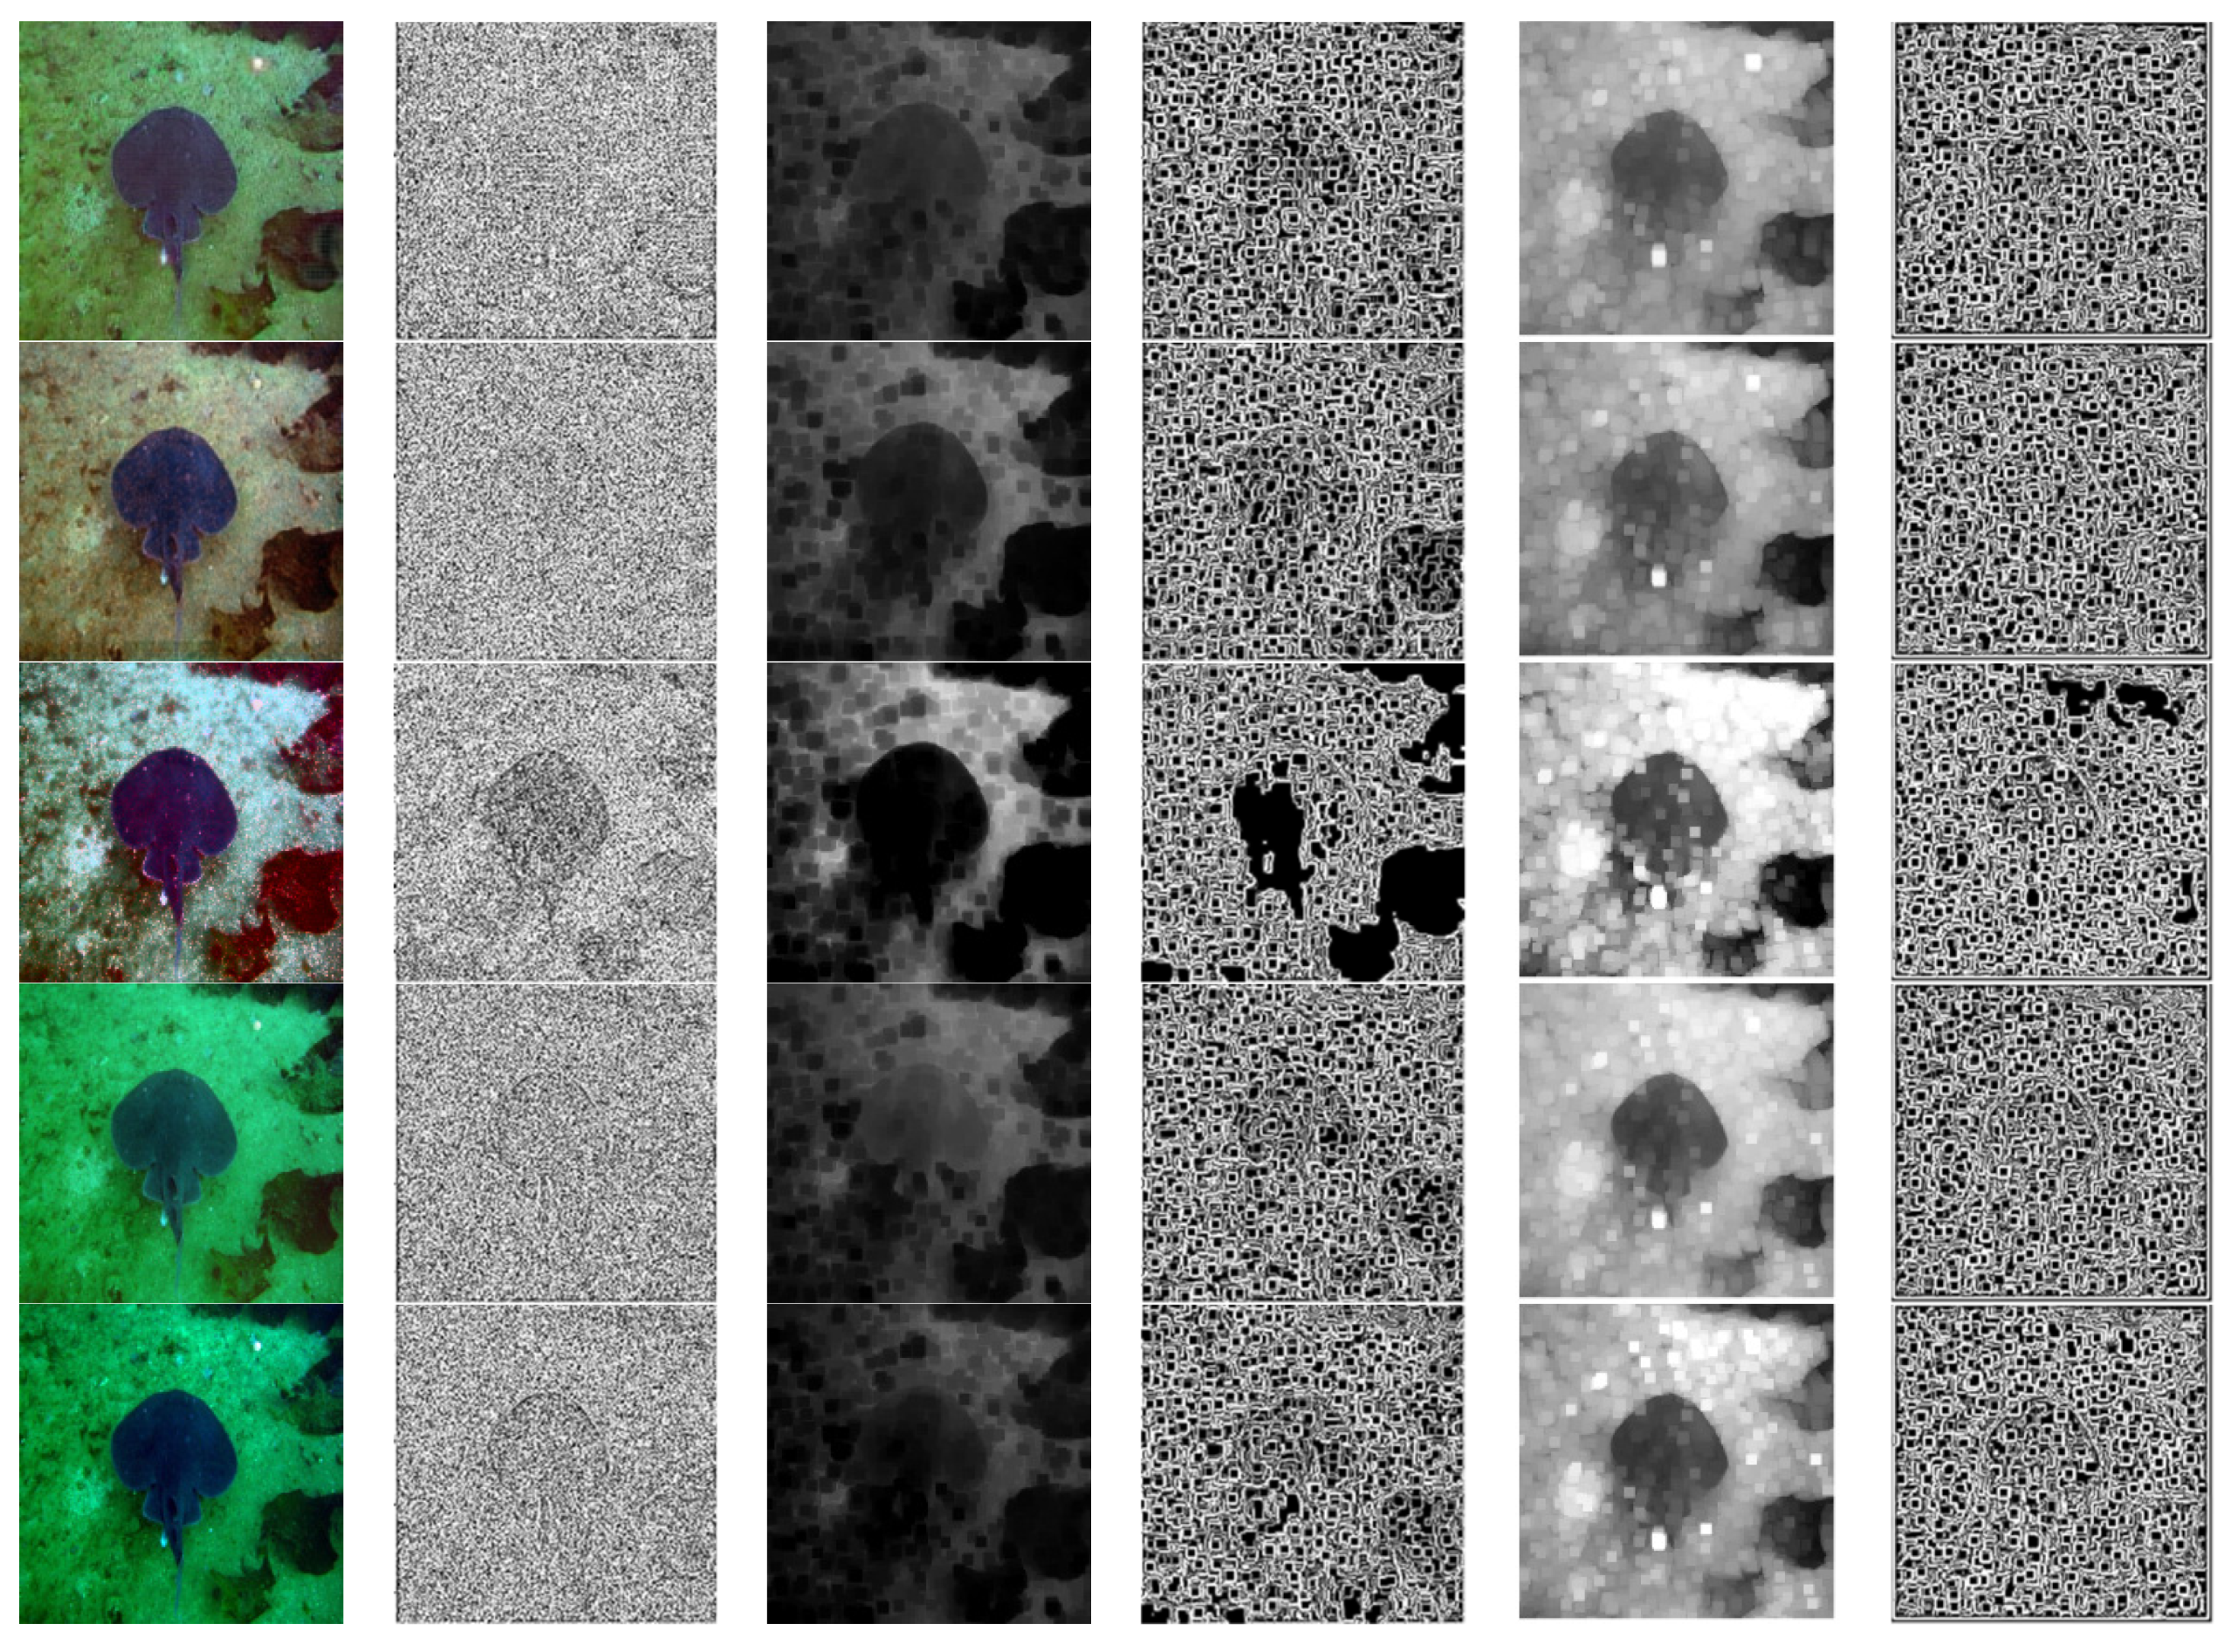
where represents the G and B color channels of an image I. By observing the underwater bright channel maps in Figure 5c and Figure 6c, it can be found that the bright channel map of the underwater image with good enhancement effect always has high intensity, while in the underwater image with poor enhancement effect, the bright channel intensity of the close-up scene is high. In addition, the intensity of bright channels in distant scenes is low.
Figure 5.
GM map of different enhancement methods. (a) the original image, (b) the GM map on the original image, (c) the UDCP map, (d) the GM map on the UDCP map, (e) the UBCP map and (f) the GM map on the UBCP map. The first line represents CycleGAN, the second line represents FGAN, the third line represents RB, the fourth line represents RED, the fifth line represents UDCP, the sixth line represents UGAN, the seventh line represents UIBLA, the eighth line represents UWCNN-SD, and the ninth line represents WSCT.
Figure 6.
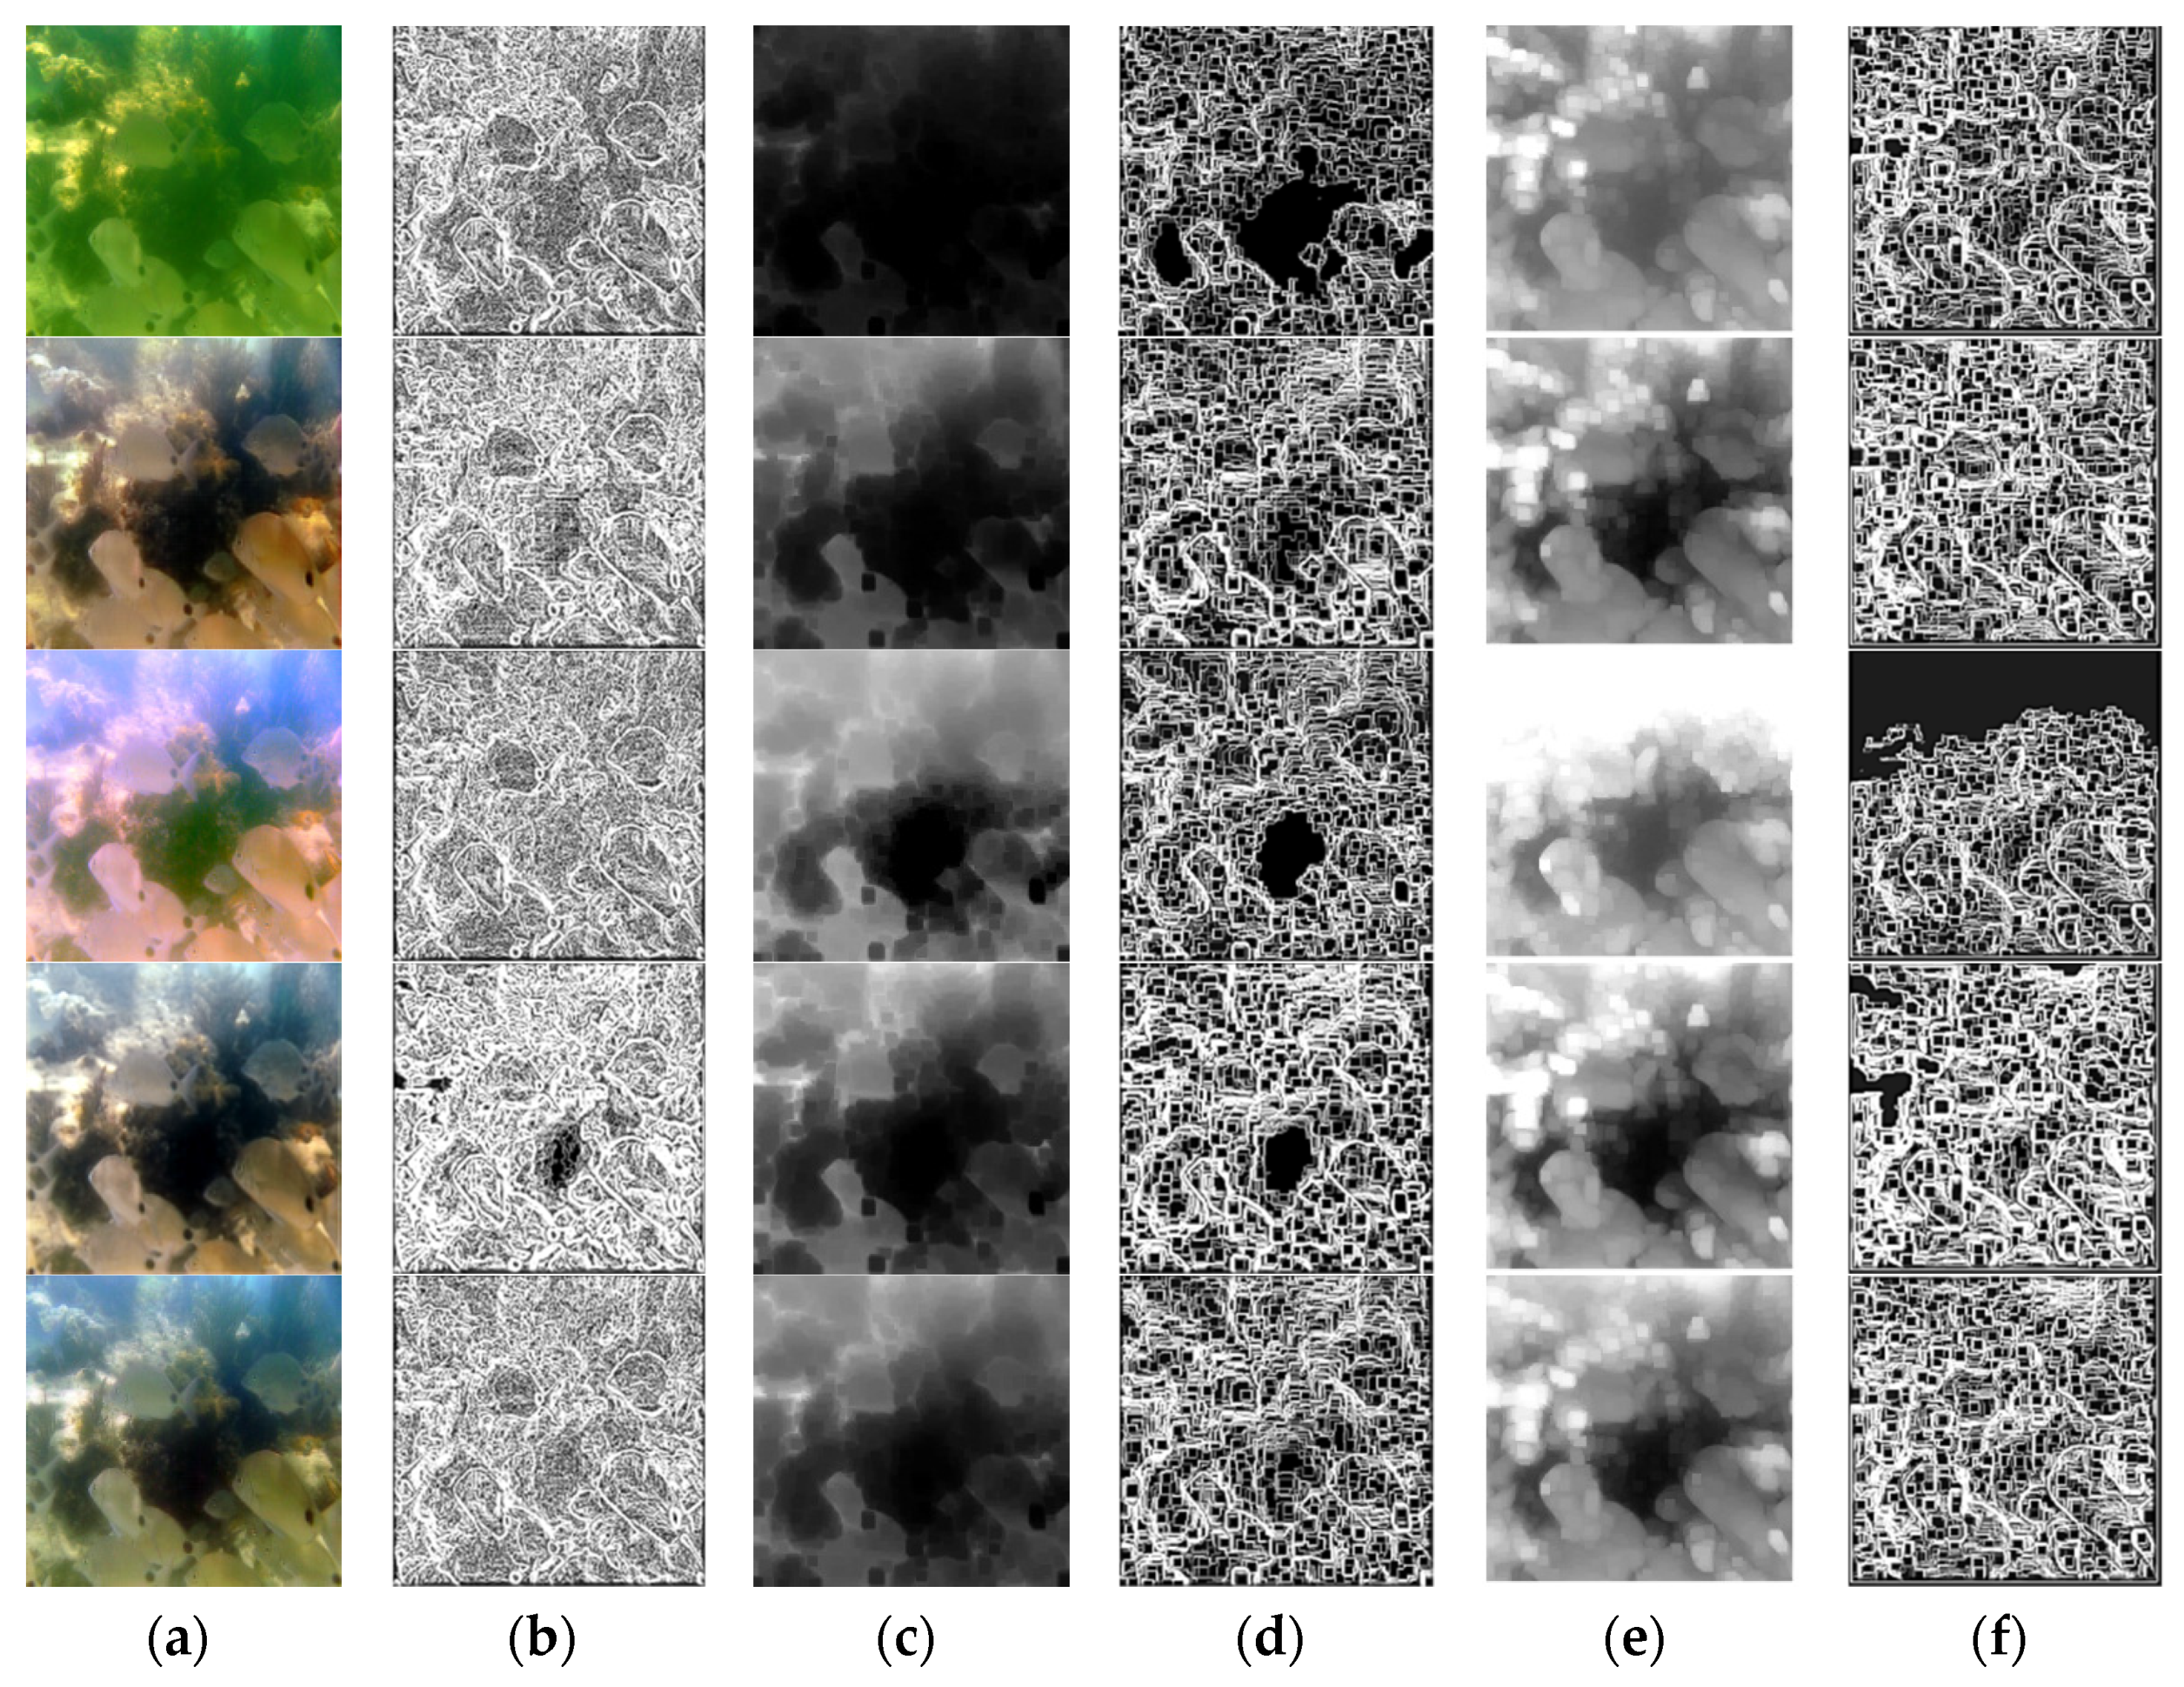
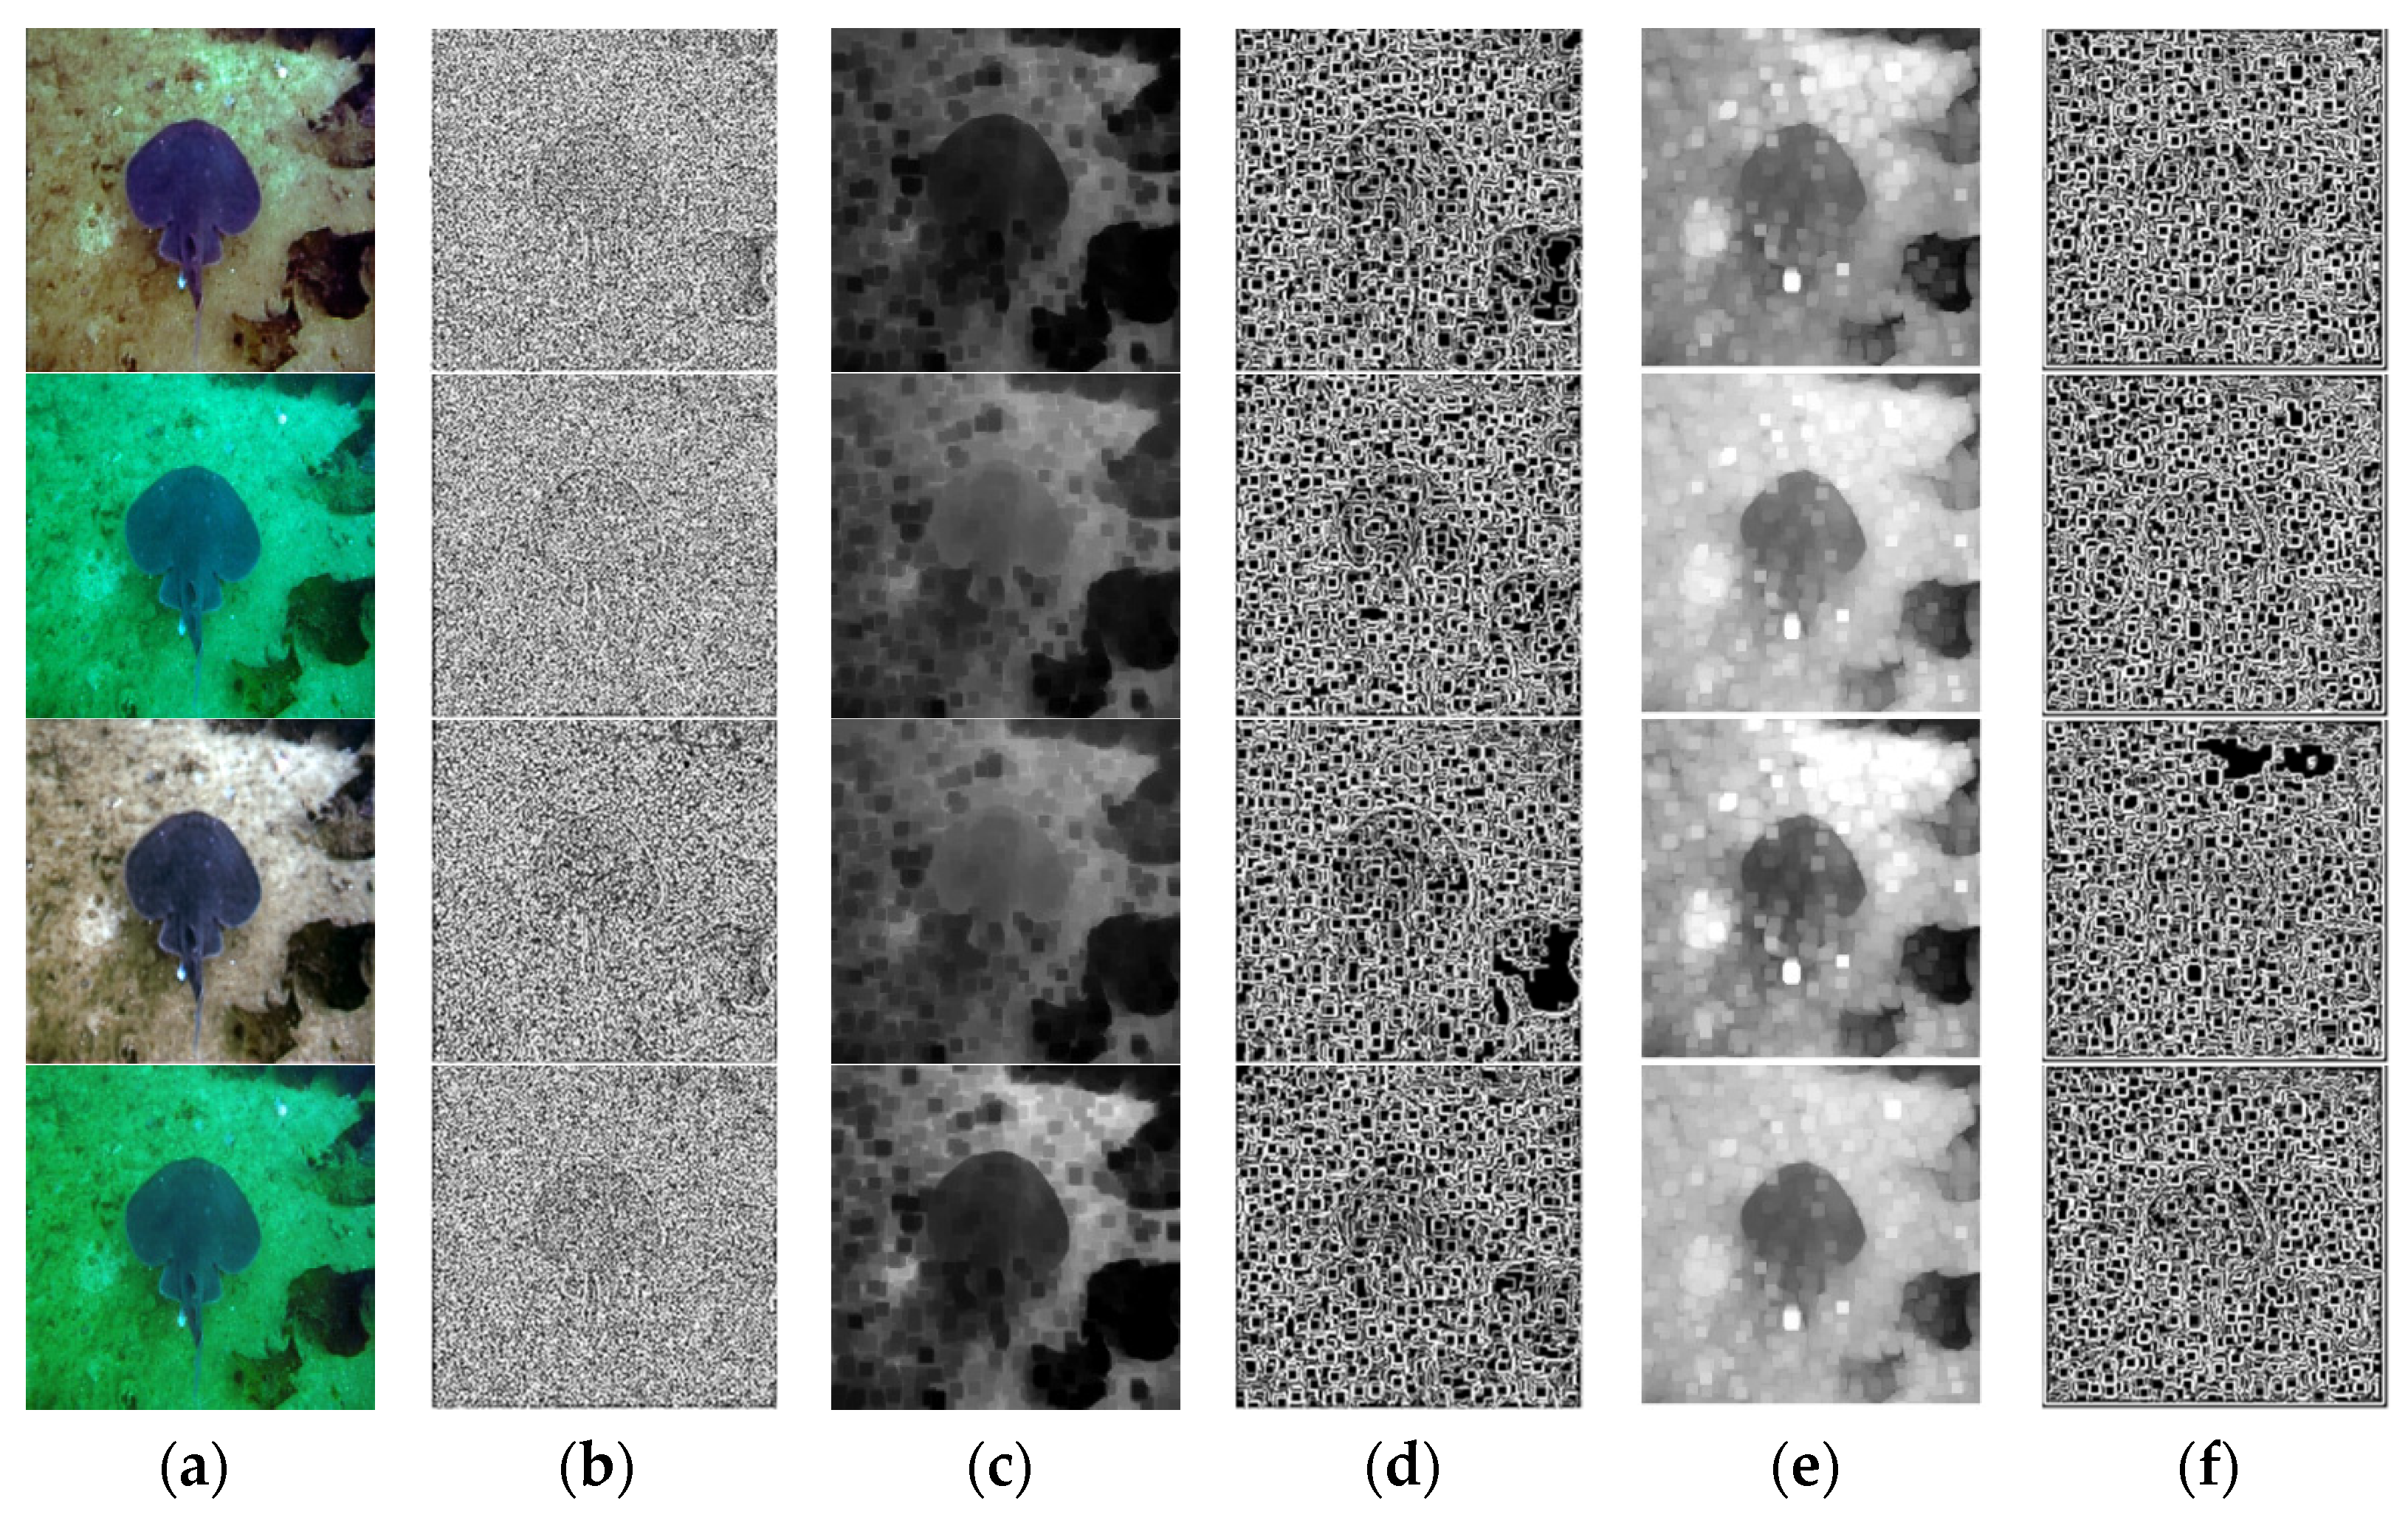
LOG map of different enhancement methods. (a) the original image, (b) the LOG map on the original image, (c) the UDCP map, (d) the LOG map on the UDCP map, (e) the UBCP map and (f) the LOG map on the UBCP map. The first line represents CycleGAN, the second line represents FGAN, the third line represents RB, the fourth line represents RED, the fifth line represents UDCP, the sixth line represents UGAN, the seventh line represents UIBLA, the eighth line represents UWCNN-SD, and the ninth line represents WSCT.
4.1.2. Gradient Amplitude and Laplacian of Gaussian
The underwater dark channel map and the underwater bright channel map of the underwater image can reflect the characteristics of color, brightness, and detail of the enhanced and restored underwater images. The discontinuity of brightness conveys most of the structural information of natural images, combined with the underwater dark channel map and underwater bright channel map, and GM and log features are extracted in order to effectively monitor relevant information. Among them, the GM feature measures the intensity of local brightness change. Then GM can be calculated as follows [42]:
where represents the linear convolution operator; represents the Gaussian partial derivative filter, and it applied along the horizontal and vertical axes:
where represents an isotropic Gaussian function with a scale parameter of .
LOG response can be used to characterize various image semantic structures, such as lines, edges, corners, and spots [43]. These structures are closely related to the human subjective perception of image quality. The LOG can be expressed as:
where
Here, LOG response is more sensitive to the structural information of the brightness change on dark channel map and bright channel map.
In this paper, GM and LOG, after joint normalization in [44], are used to keep the local contrast of GM and LOG consistent in the whole image, to eliminate the uncertainty caused by lighting changes, different sizes of edges, and other structures, namely:
where is a parameter to avoid having a denominator of zero. For the GM and LOG map after joint normalization, it can be found in Figure 5 and Figure 6 that both GM and LOG features have more GM coefficients and strong LOG response, which means that GM and LOG features can be applied to the quality evaluation process.
Because the interaction between GM and LOG will affect the local quality of the image, the marginal distribution and independent distribution of GM and LOG response is used to extract the features of the image. The specific distribution is as follows: quantizing normalized to layer M is , and quantizing to layer L is . The empirical probability for G and L can be defined as:
Extracting the quality prediction feature set from the , the marginal probability function of and can be expressed by PG and PL:
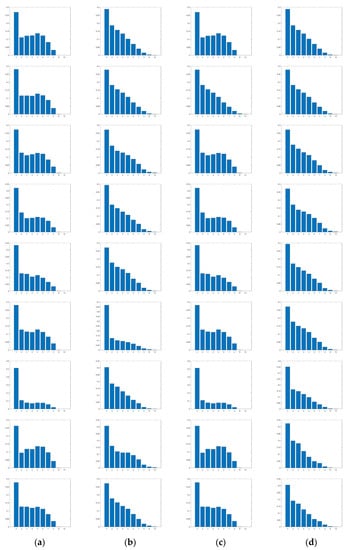
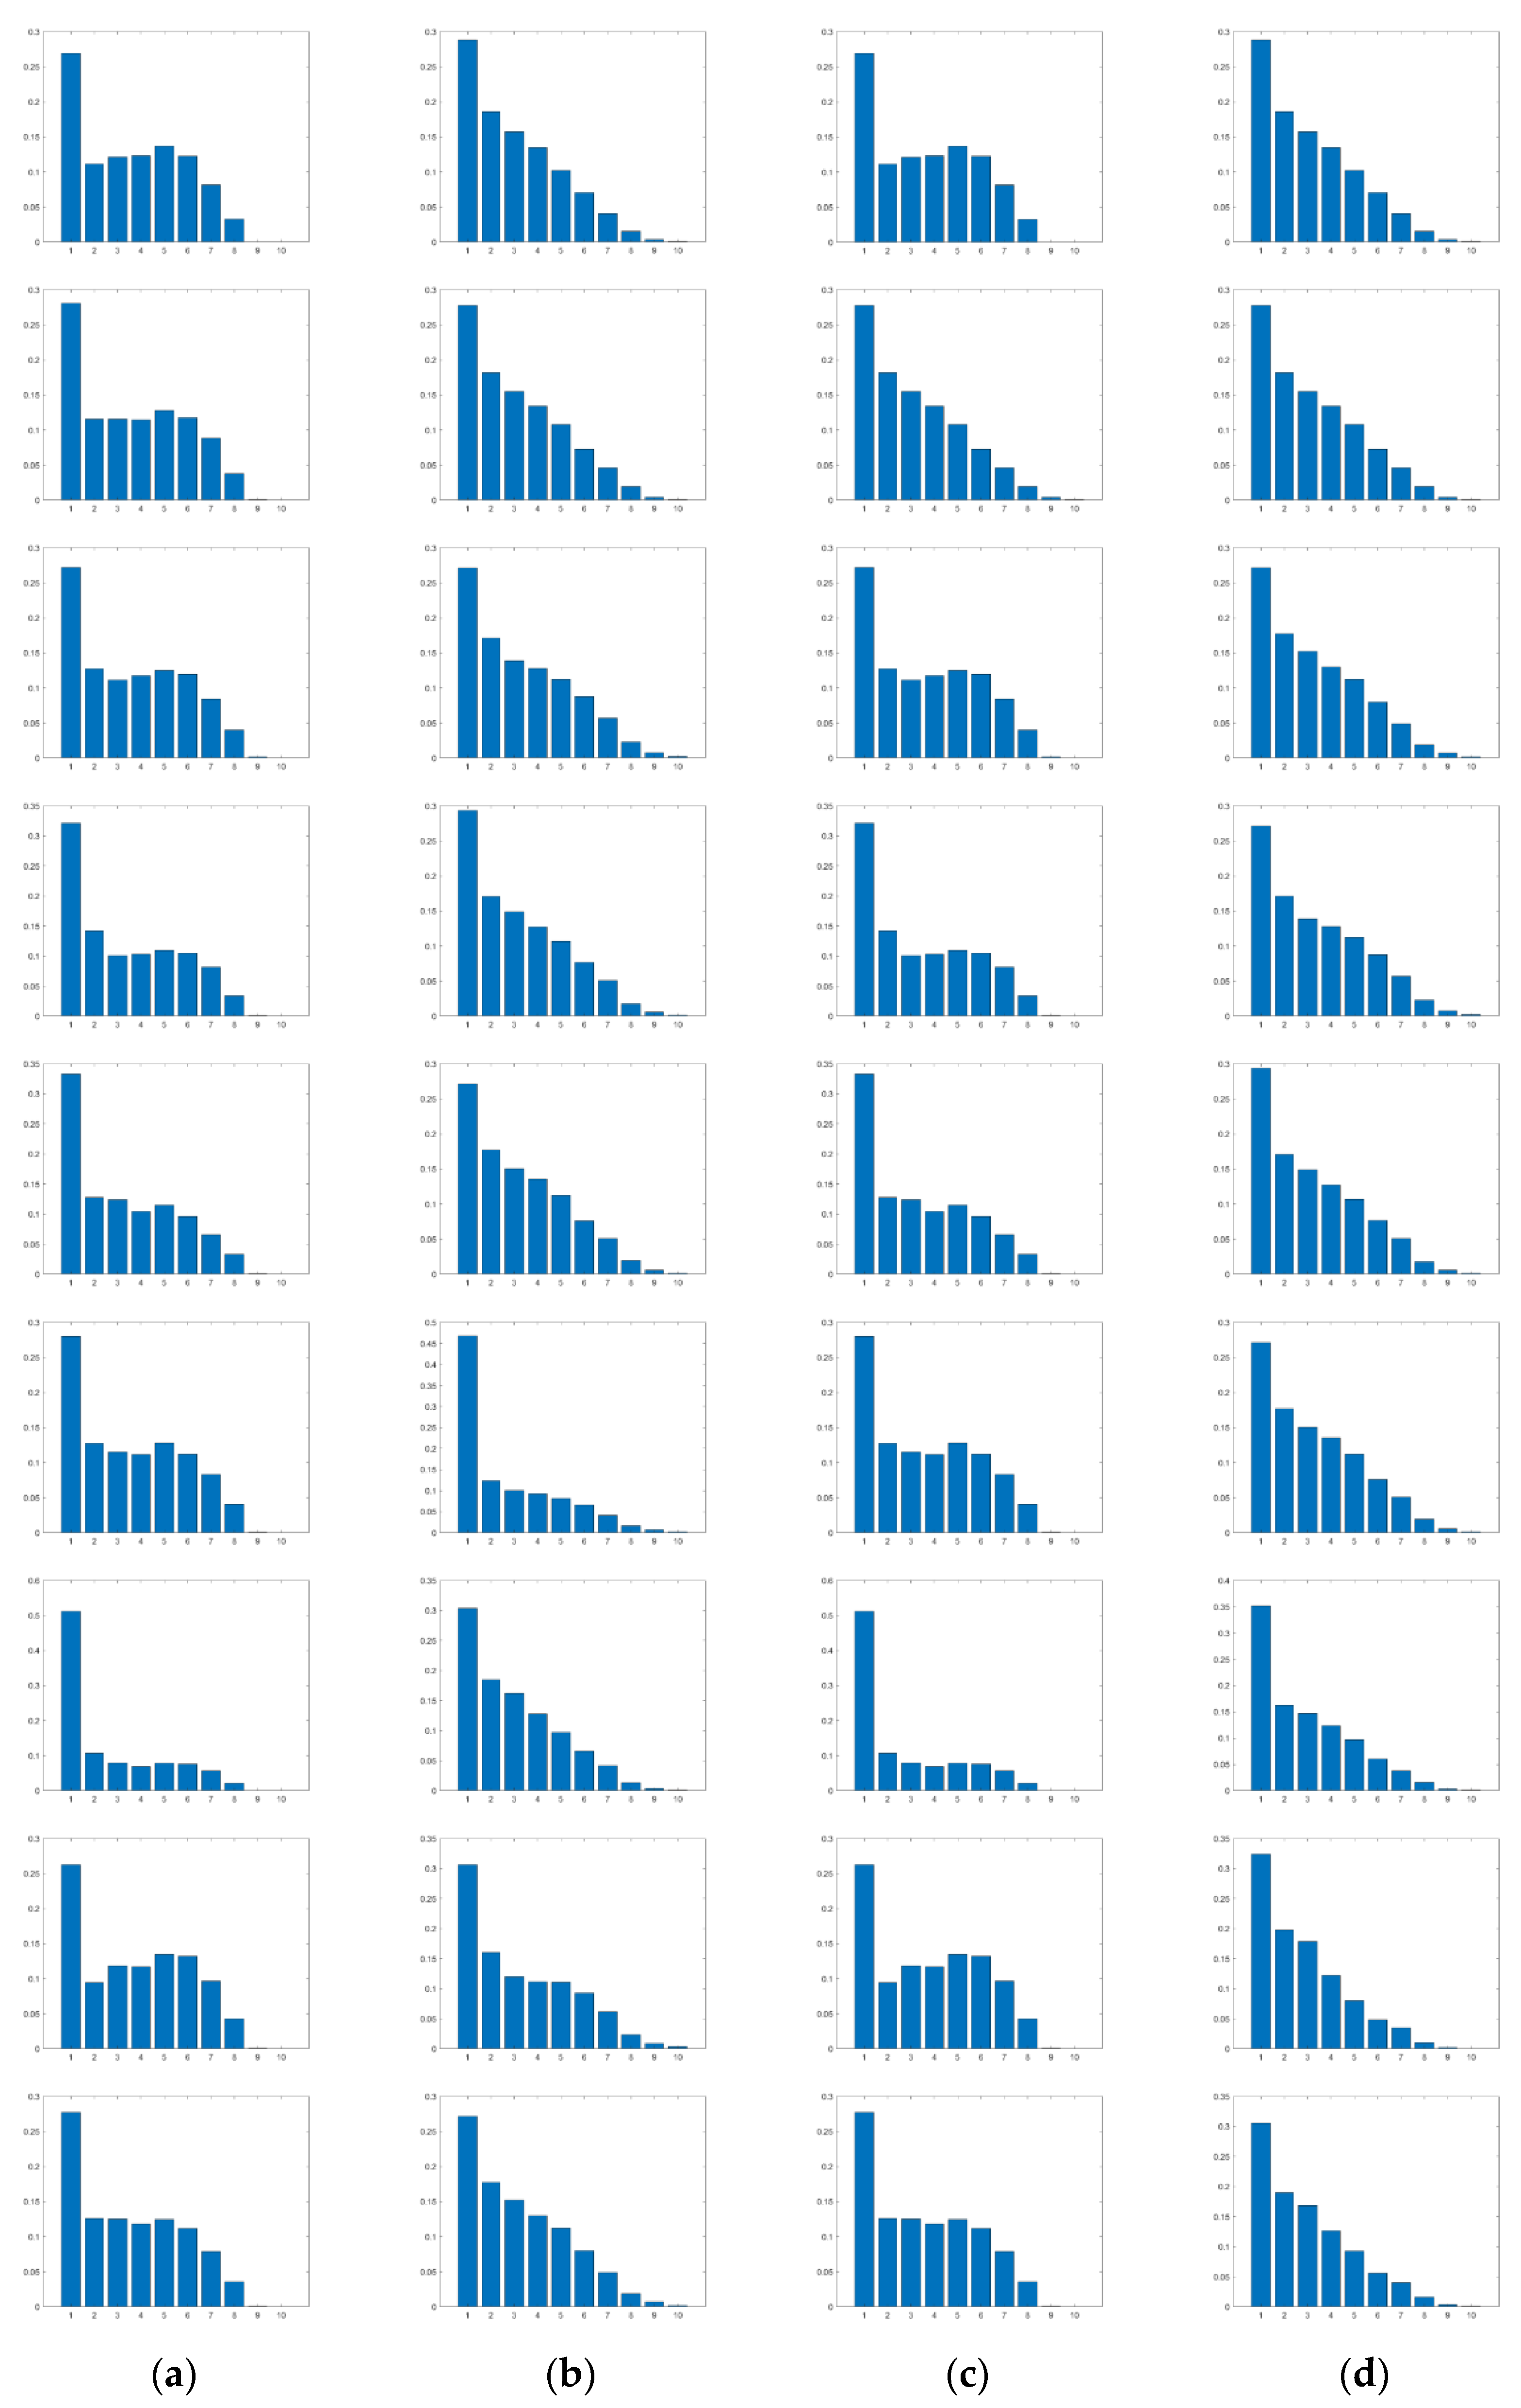
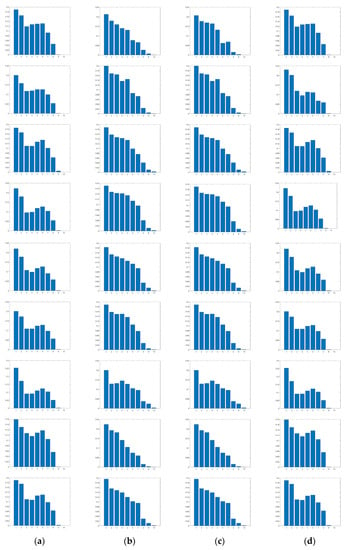
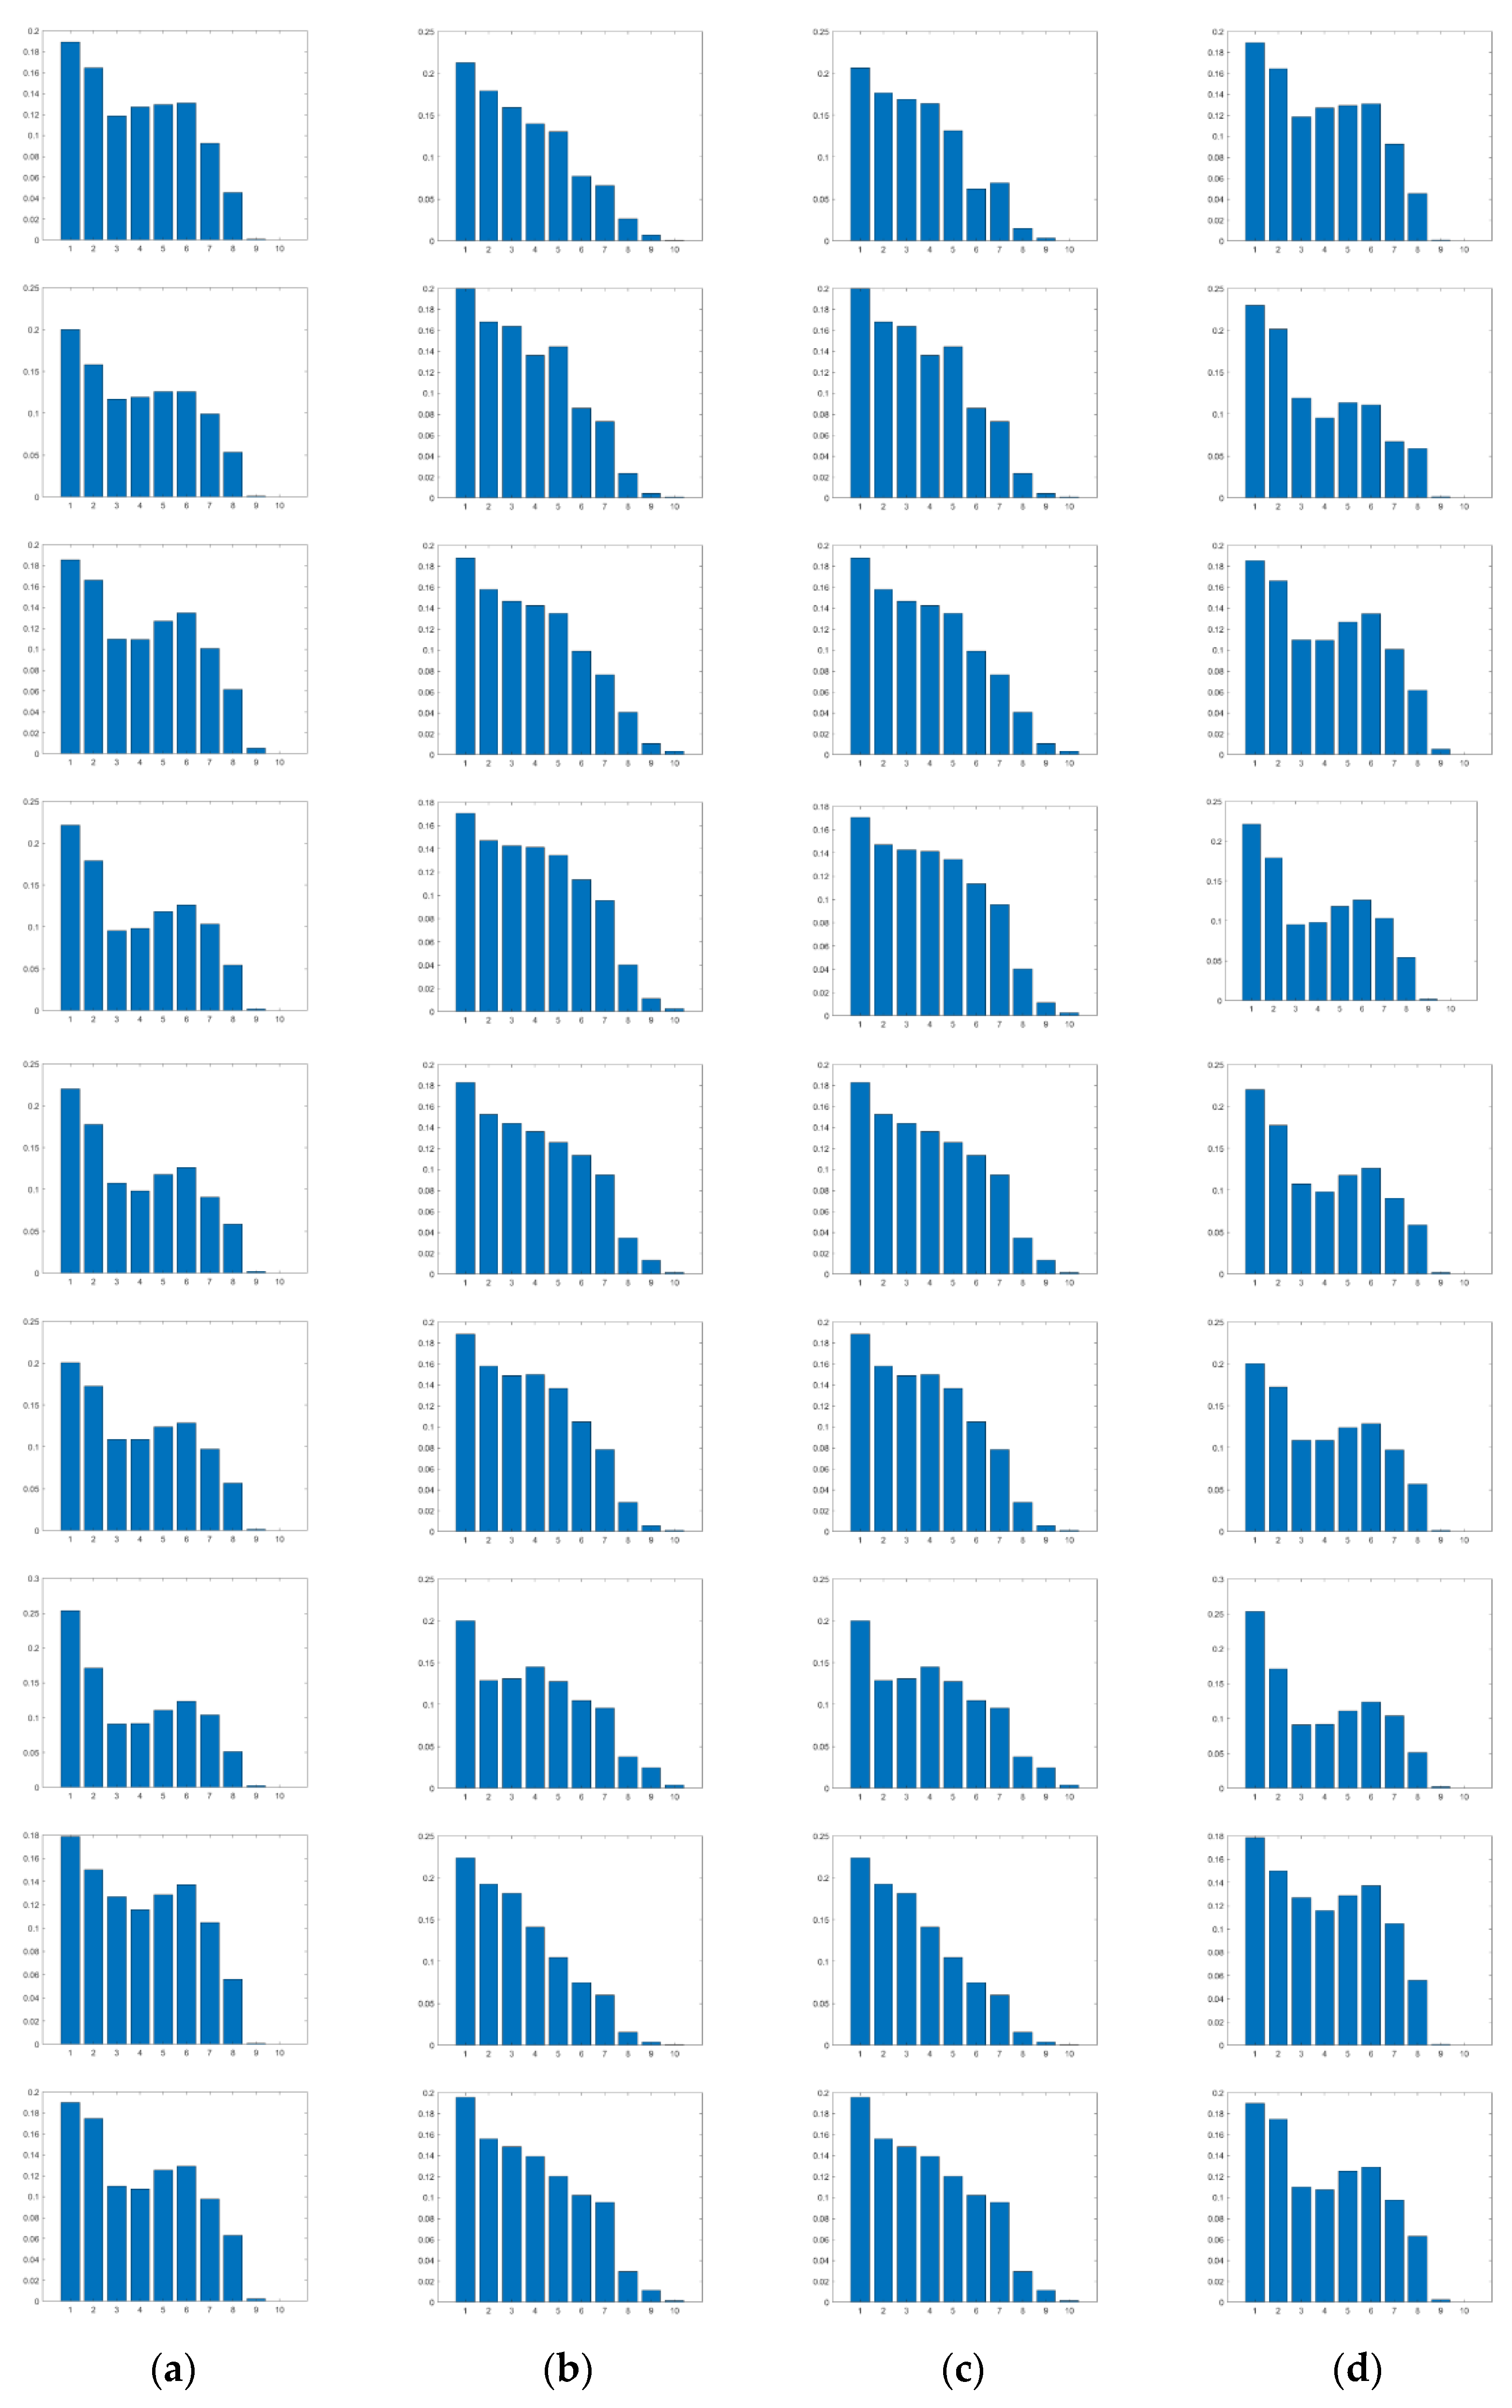
As can be seen from Figure 7, the PG and PL histogram is different in different methods. This shows that the features extracted from the marginal probability functions PG and PL can clearly distinguish different information on the image.
Figure 7.
Marginal probabilities between normalized GM and LOG features for images of the UDCP maps and the UBCP maps. (a) Histogram of PG on UBCP, (b) Histogram of PL on UBCP, (c) Histogram of PG on UBCP, (d) Histogram of PL on UDCP. The abscissa indicates that the feature is divided into 10 dimensions, and the ordinate indicates the sum of marginal distribution. The first line represents CycleGAN, the second line represents FGAN, the third line represents RB, the fourth line represents RED, the fifth line represents UDCP, the sixth line represents UGAN, the seventh line represents UIBLA, the eighth line represents UWCNN-SD, and the ninth line represents WSCT.
Because the GM and LOG features of an image are independent, the marginal probability function cannot effectively reflect the correlation between GM and LOG. For the correlation between GM and LOG, it is necessary to use the marginal probability function PG as the weight to define the correlation of G = gm on L, as follows:
Similarly, the correlation of L = ln on G is defined as follows:
Here, we describe the statistical interaction between normalized GM and LOG features, as described in Equations (16) and (17). Figure 8 draws the relevant histogram of QG and QL. The histogram distribution is different under different enhancement methods.
Figure 8.
Independency distribution between normalized GM and LOG features for images of UBCP. (a) Histogram of QG on UBCP, (b) Histogram of QL on UBCP, (c) Histogram of QG on UBCP, (d) Histogram of QL on UDCP. The abscissa indicates that the feature is divided into 10 dimensions, and the ordinate indicates the sum of conditional distribution. The first line represents CycleGAN, the second line represents FGAN, the third line represents RB, the fourth line represents RED, the fifth line represents UDCP, the sixth line represents UGAN, the seventh line represents UIBLA, the eighth line represents UWCNN-SD, and the ninth line represents WSCT.
Considering the characteristics of the underwater images, the dark and bright regions are compared in images. Through the processing of the enhanced and restored underwater images, UDCP and UBCP maps can be obtained, respectively. In Figure 5 and Figure 6, it can be found that dark channel and bright channel maps can explain the problem better than the raw image. Some regions of the enhanced restored underwater images will be under-enhanced or over-enhanced, that is, too dark or too bright. By observing Figure 5b and Figure 6b, it can be found that these problems cannot be highlighted if GM and LOG features are extracted from the original image. In Figure 5d and Figure 6d, the UDCP maps can explain the characteristics of underwater details, distinguish the darker region in the image, and analyze that a part of the image is too dark for feature extraction, which shows that the enhancement effect of the enhancement method on this region is poor. In Figure 5f and Figure 6f, the UBCP maps can represent the area of underwater supersaturation, and feature extraction cannot be carried out in the area where the image is over-enhanced. Therefore, this paper considers combining the features extracted from the UDCP maps and UBCP maps to predict the image quality.
In this paper, the distribution function is divided into 10 dimensions. By observing Figure 7 and Figure 8, it can be found that they all obey the Weibull distribution. The histogram graphics, corresponding to the nine image quality enhancement methods, are different. Therefore, the histograms of the nine enhancement and restoration methods can reasonably explain the different histograms of the corresponding methods. The difference between the histograms shows that the extracted features are clearly distinguished.
4.2. Color Feature
Color, as an important image attribute, has been widely used in image processing. The attenuation characteristics of light in water are different from that in air. Many underwater images have serious color refraction problems. In the underwater environment, with the increase in water depth, the color will be attenuated, in turn, according to the wavelength. Among them, red light with a shorter wavelength has the worst penetration ability and is also the first wavelength to disappear, so underwater images often show light green or light blue scenes. In addition, underwater low-light conditions will also reduce the color saturation of underwater images. Therefore, an underwater image and restoration method can have good color reproduction.
In this paper, color saturation and chromaticity are used as the characteristics of the underwater image. In colorimetry, chromaticity represents the degree of difference between color and gray, and saturation is the color relative to brightness [45]. As mentioned earlier, HSV color space can capture colors in the opposing color space. Therefore, two opponent color components and , related to chromaticity, can be defined as follows:
where R, G, and B represent red, green, and blue channels, respectively.
In an underwater scene, the propagation of light will affect the color change of the underwater image, and the color saturation and chromaticity will change with the change in underwater depth. Because saturation has a great impact on images with bright colors and rich colors, it has little impact on dim colors or almost neutral colors. Color saturation is calculated through the saturation space after converting the image to HSV color space. As pointed out in [45], humans prefer slightly more colorful images, and the color richness affects the judgment of perceived quality. The colorfulness (CF) is calculated according to [46], as follows:
where x = 1, 2,..., X.
4.3. Fog Density
In the process of underwater imaging, suspended particles and plankton in the water will lead to certain atomization of the image and make the image unclear. Therefore, the fog density of an image is taken as a one-dimensional feature to predict image quality. According to the work of Lark Kwon Choi et al. [47], a fog density model for predicting natural images in fog scenes is proposed. The model extracts 12 statistical features of fog perception from the natural scene to predict the fog density of the image. It then fits all statistical features extracted from the test image into the multivariate Gaussian (MVG) model, and can be calculated as follows:
where f is a d-dimensional statistical feature that represents fog density, t represents transposition, ν is the mean vector and Σ is the covariance matrix. Then, by measuring the Mahalanobis distance between the MVG model of the test image and the MVG model of 500 natural fog-free images, the Df of fog level can be calculated. Similarly, the Mahalanobis distance between the MVG model of 500 fog images and the MVG model of test images needs to be measured, and the Dff of the fog-free level can be calculated. Then, Df can be calculated as follows:
Finally, the fog density D of an image can be expressed as:
4.4. Global Contrast
Due to the scattering of the water medium, especially the influence of forward scattering, the underwater color image is seriously deteriorated and blurred. Therefore, the evaluation of global contrast is important for underwater color image quality evaluation. In this paper, the global contrast index is used to represent the blur of underwater color images.
The global contrast feature can highlight the large-scale objects in the image and avoid generating high significant values, only at the object contour. Therefore, the global contrast may affect the quality of the image as a feature to predict the image quality. The global contrast coefficient (GCF) is calculated as follows [48]:
where ,
Moreover, Ci can be defined as follows:
where S is the intensity pixel value of the gamma-corrected image. Assuming that the width and height of the image are , the image is reshaped into a one-dimensional array, arranged in the row direction.
4.5. Regression
The objective image quality evaluation method mainly consists of two parts: the above feature extraction and the feature regression, described in this section. The extracted five groups of features represent all aspects of the enhanced and restored underwater images, including GM and LOG of the dark channel map, GM and LOG of the bright channel map, color, fog density, and global contrast. A total of 84 dimensional features are extracted. These features include single features and multi-dimensional features. To predict the quality score of a single image from the extracted features, these features are summarized in Table 2 for better understanding. For each symbol, the corresponding definition can be found in the paper. As a traditional learning-based method, the next stage of this method is the construction of a prediction model. Generally, the quality prediction model can be constructed by integrating all features and regression modules, based on machine learning. Here, the Support Vector Regression (SVR) is used and defined as follows:
where C is a deviation parameter and is a relaxation variable. xi represents the feature vector of the i-th image and represents the quality score of the i-th image. function for performing the nonlinear transformation. In this paper, we use the radial basis function kernel, which is the same as the previous work, that is: , where is the kernel parameter. Based on the training samples . By inputting the extracted 84 dimensional features into the regression model, the quality of the test image can be estimated.
Table 2.
Summary of 84 extracted features.
5. Experimental Comparison
5.1. Experimental Details
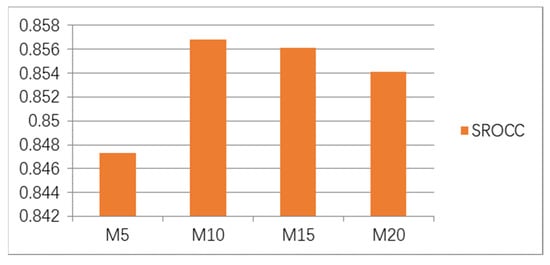
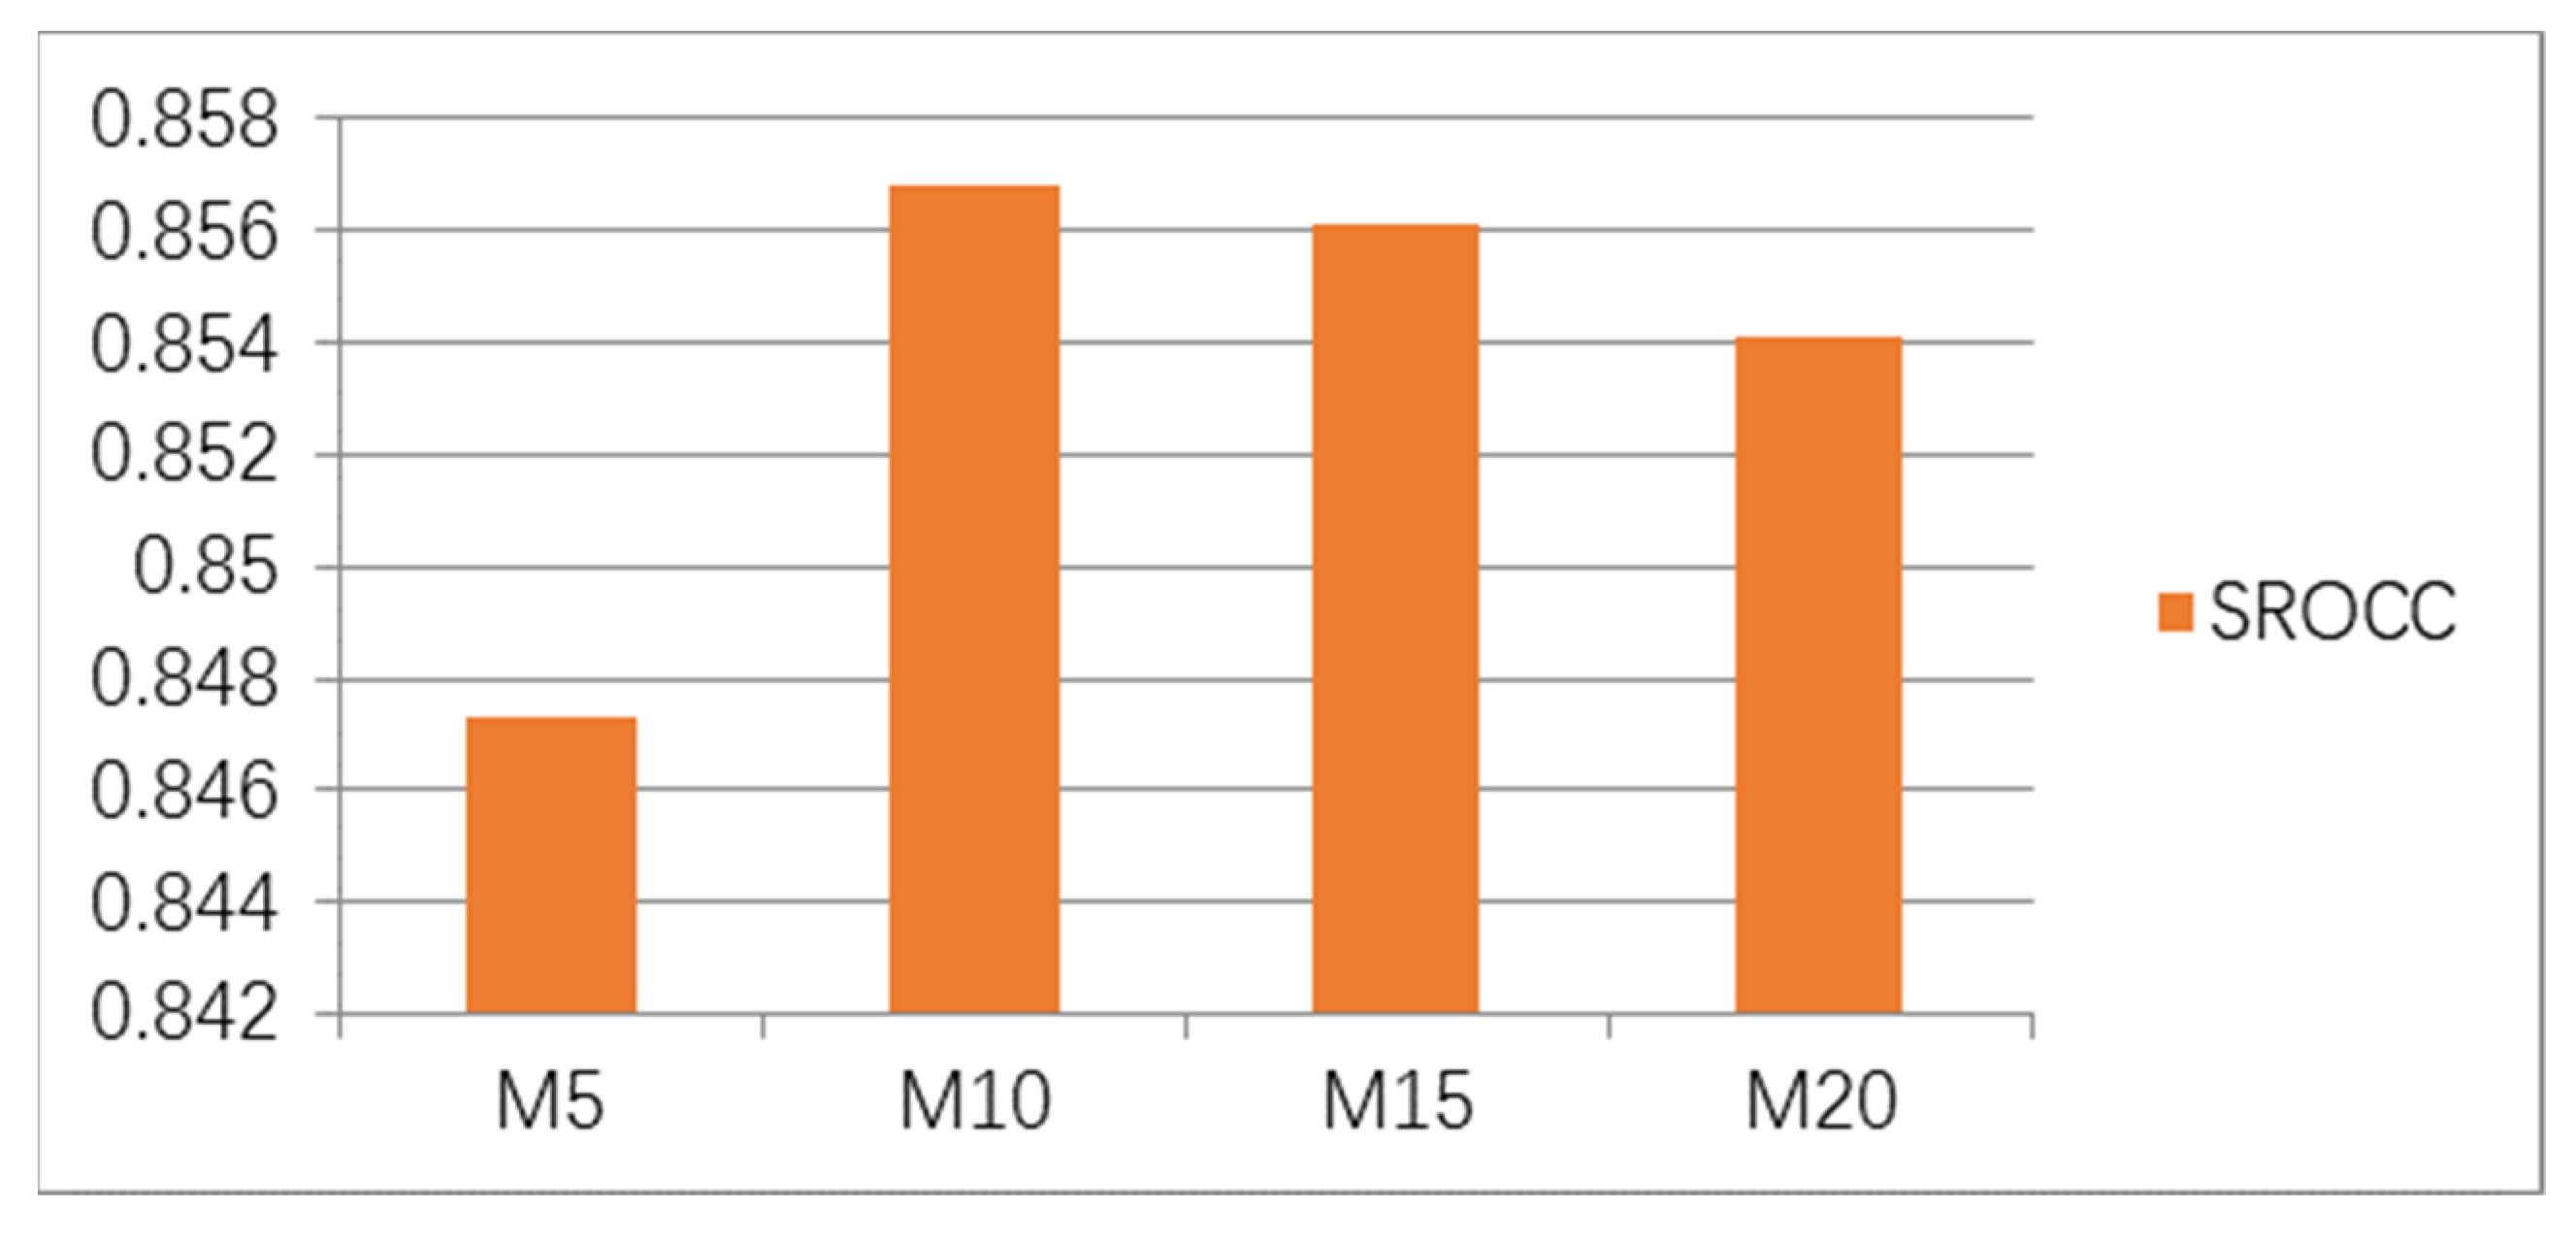
When calculating the joint probability , the number of extracted dimensions needs to be set. Generally speaking, using more dimensions can make the calculation of statistics more accurate, but it requires more samples to make the output results more accurate. However, in image quality prediction, it is necessary to use as few features as possible to achieve as high a prediction accuracy as possible. If there are many feature dimensions, the results may become unstable during regression model learning. To study the influence of the number of dimensions on the prediction performance of image quality, we make M = N = {5, 10, 15, 20}, and calculate the SROCC values of different dimensions in the database. The results are shown in Figure 9. M = N = 10 will lead to higher and more stable results.
Figure 9.
SROCC values of different dimensions M = N = {5, 10, 15, 20} in the database.
5.2. Evaluation Criteria
According to the regulations of the video quality expert group (VQEG) [49], the performance of objective image quality index is evaluated by quantifying the ability of an objective image quality index to predict subjective score (i.e., MOS), and three evaluation criteria are selected to quantify the performance of the objective image quality evaluation (IQA) method, including root mean square error (RMSE), Pearson linear correlation coefficient (PLCC) and Spearman rank-order correlation coefficient (SROCC).
Before calculating PLCC and RMSE, to explain any nonlinearity generated by the subjective scoring process and facilitate the comparison of measures in a common analysis space, a five-parameter logistic regression function is used to make a nonlinear mapping between the prediction score and the subjective quality score:
where xc and f (xc) are the original image quality score and mapping quality score, respectively, are five parameters determined by nonlinear least-squares optimization, with MATLAB, using f (xc) and subjective quality score. RMSE is used to quantify the prediction error and PLCC is used to evaluate the prediction accuracy, while the SROCC measurement method is used to predict the monotonicity. If there is a better IQA method, the smaller the value of RMSE, the better (the minimum value is 0), and the higher the values of SROCC and PLCC, the better (the maximum value is 1).
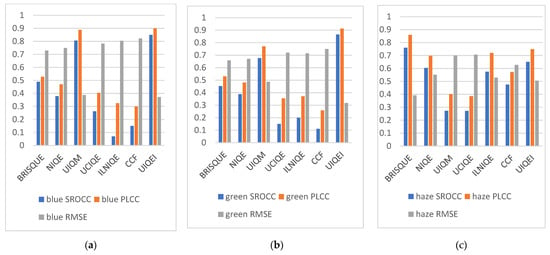
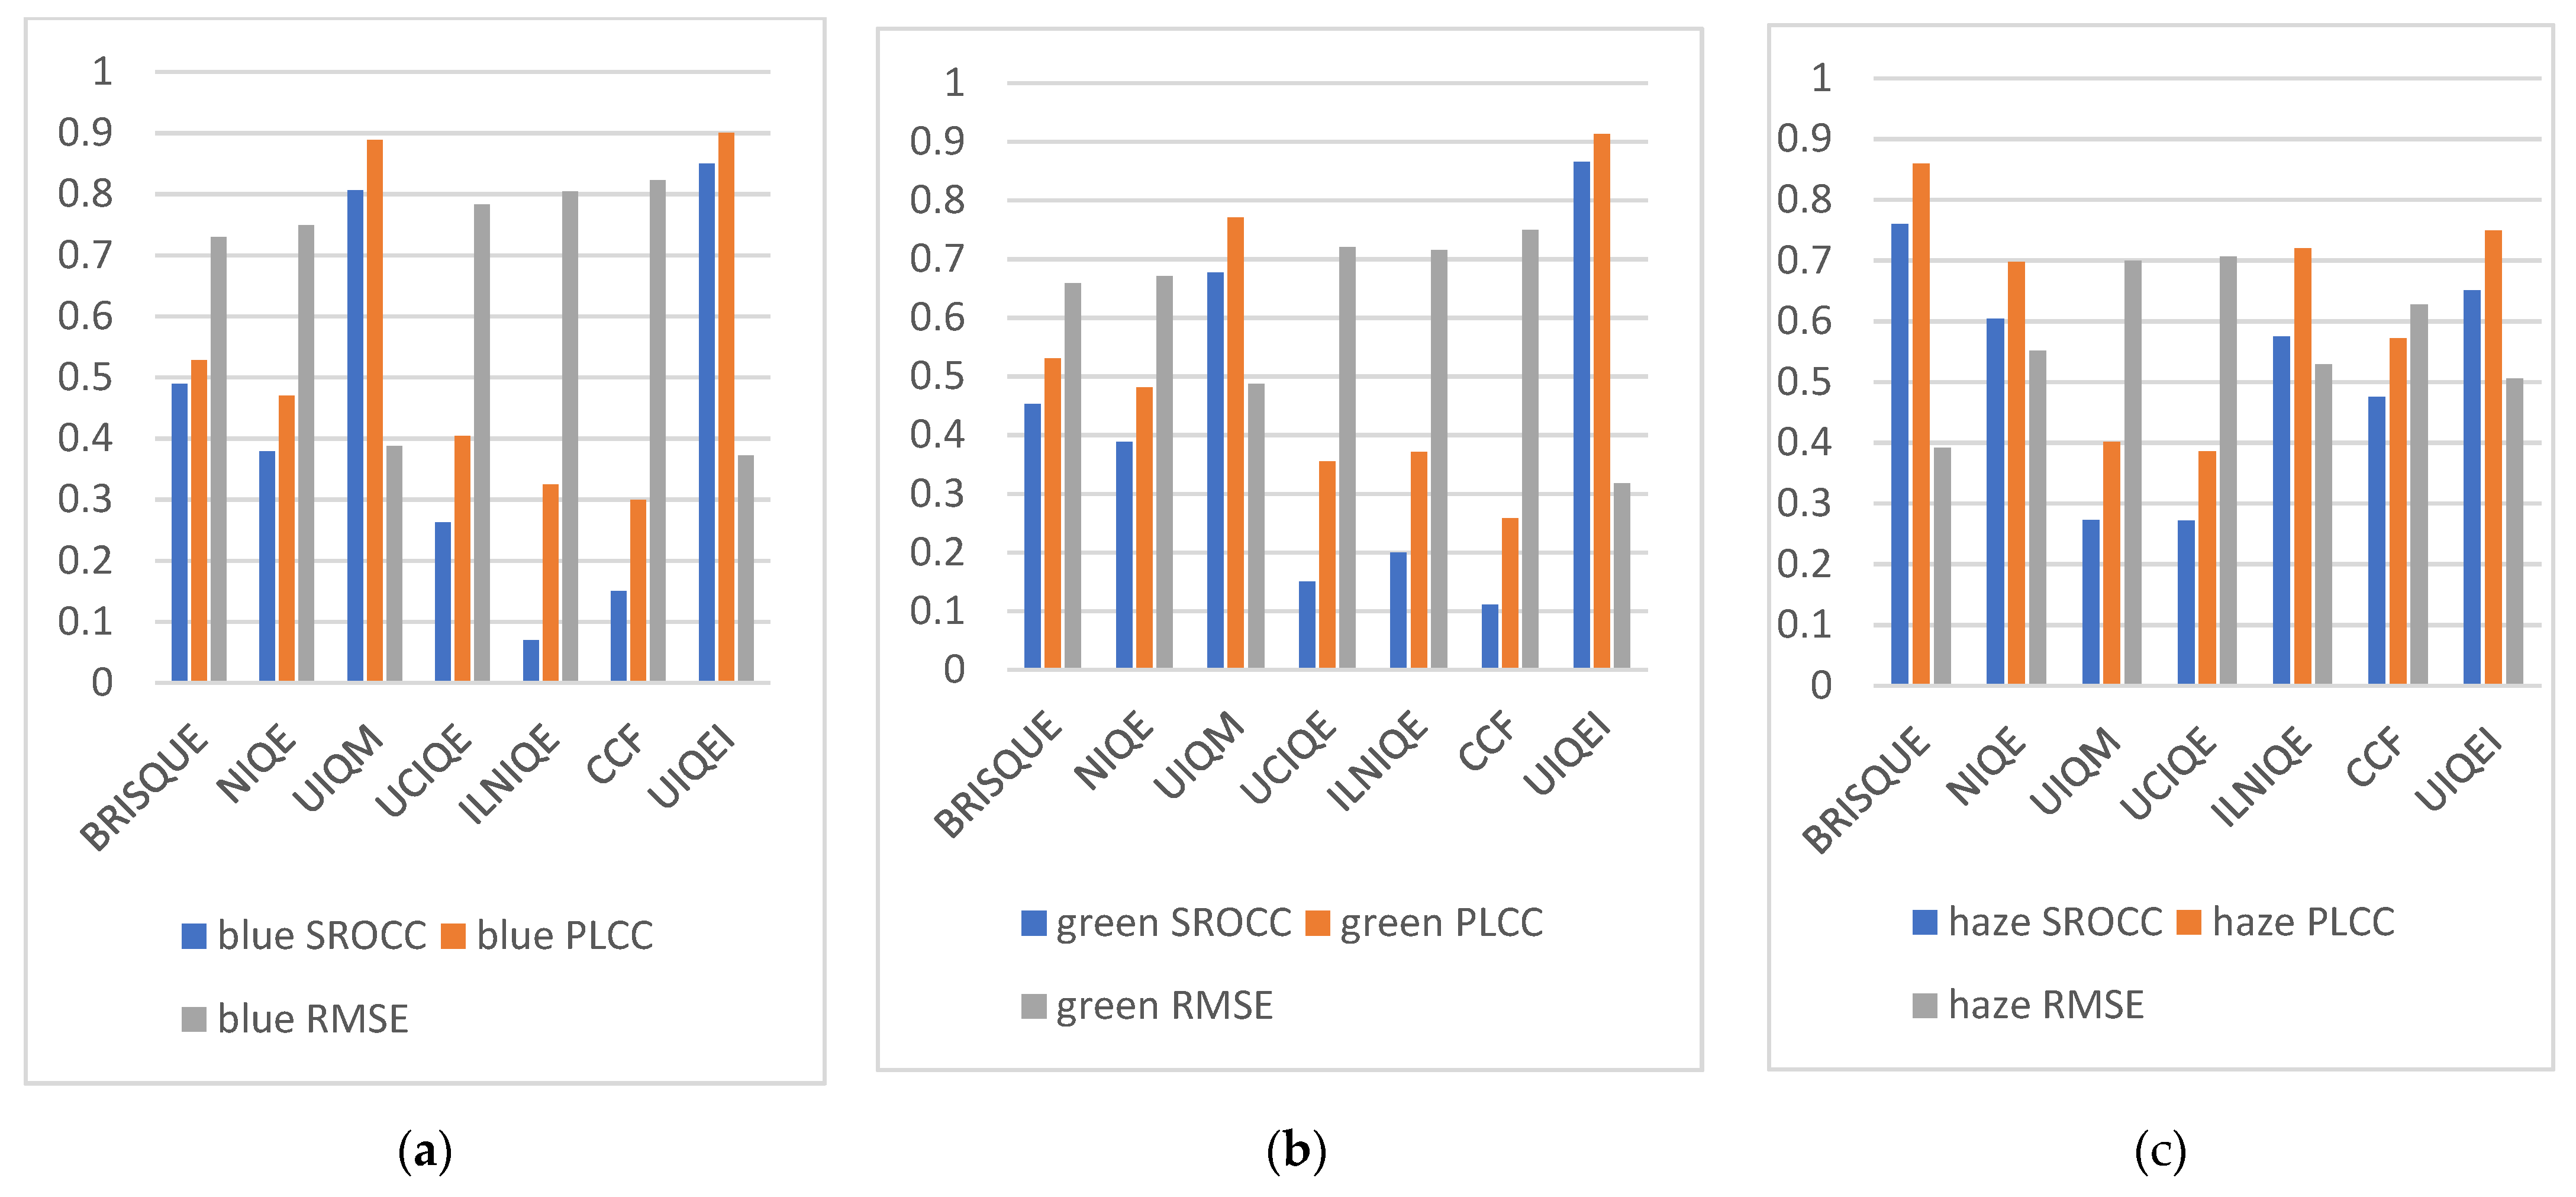
The results are shown in Table 3. It can be found that the proposed UIEQI is superior to other measurement methods in predicting the underwater image quality after enhancement. The UIEQI has the largest total correlation coefficient in the database, SROCC and PLCC are 0.8568 and 0.8705, respectively, with the minimum error of 0.3600. Therefore, the measurement index we proposed can effectively consider the importance of the specific characteristics of the underwater environment. In Figure 9, we can see that our indicators are better than other methods in different scenarios. In the green and blues scenes, we can find that the correlation coefficient between UIQM and our proposed method is large and the error is small, indicating that the evaluation effect of UIQM and our method is better for the images in the underwater green and blue scenes. In the fog scene, we can find that the correlation coefficients of BRISQUE, ILNIQE, CCF, and our proposed method are large and the error is small, and the correlation coefficient in the BRISQUE method is the largest, which shows that, the smaller the illumination depth is, the better the evaluation method in the atmosphere.
Table 3.
Performance comparison of BRSIQUE, NIQE, UCIQE, UIQM, CCF, ILNIQE and UIQEI methods.
5.3. Feature Analysis
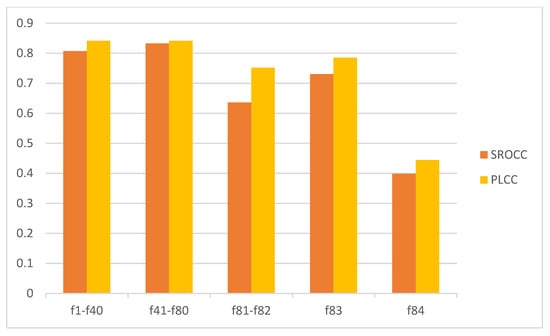
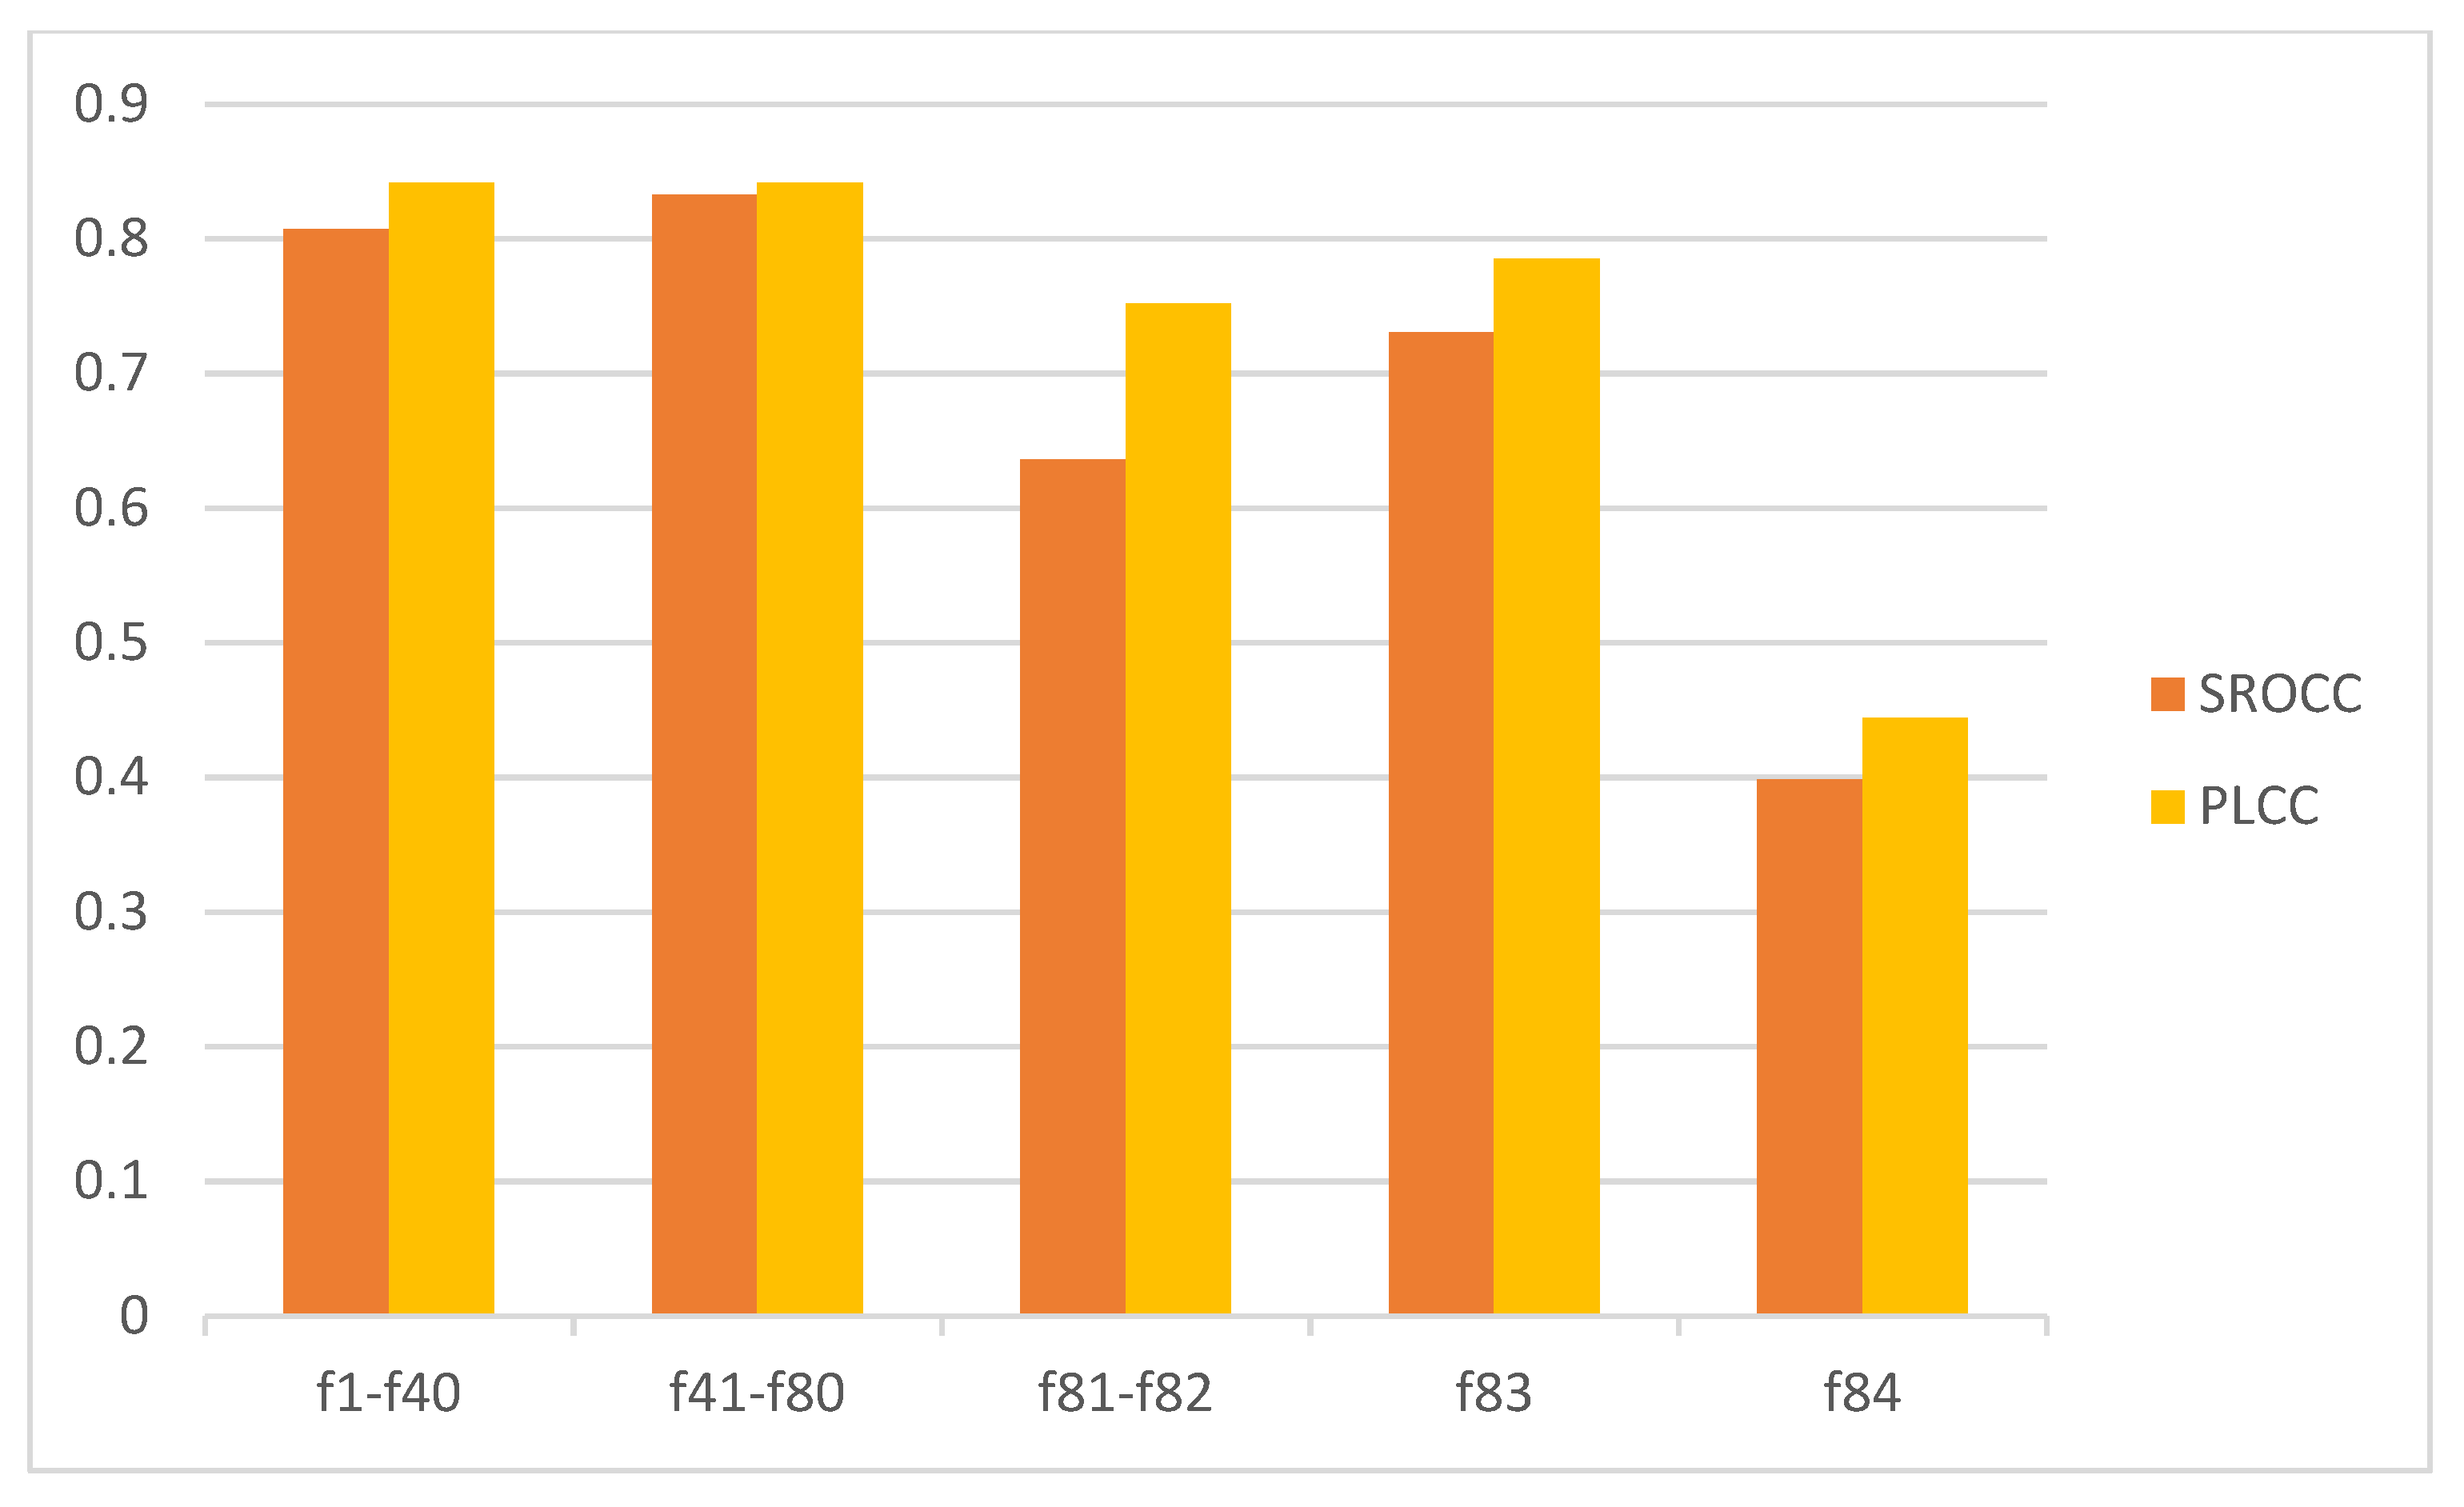
Feature analysis to more intuitively understand the relationship between UIEQI features and the subjective evaluation of the enhanced and restored underwater images are shown in Table 2. The relationship between each type of feature and mos is described. It should be noted that we did not use training in the analysis process. The SORCC and PLCC performance of each function are directly tested on the UIEQ database. Observing Figure 10, it can be found that some features show quite competitive performance, which can be comparable to the current best methods, even if they are trained on this database. In Figure 11, the relationship between a class feature and MOS is illustrated to more intuitively understand the relationship between UIEQI features and subjective quality evaluation. In the ablation experiment, we will give more detailed verification.
Figure 10.
Comparison of the performance of BRSIQUE, NIQE, UCIQE, UIQM, CCF, ILNIQE and UIQEI in three scenes. (a) in blue scene, (b) in green scene, (c) in haze scene.
Figure 11.
The performance of a class of features (SROCC and PLCC) in the UIQE database. f1–f84 are the feature IDS given in Table 2.
5.4. Ablation Experiment
The contribution of different characteristics is illustrated by some ablation experiments (refer to Table 2). The characteristics of each attribute should be understood, and the performance of these different feature groups should be tested. Table 4 tests the test group.
Table 4.
Different feature groups.
The results of ablation experiments are listed in Table 5. Consistent with the analysis given in the previous section, we observe that the GM and LOG contribute the most to the method. In addition, fog density also plays a role. Although the performance of G7 is lower than that of any other feature group, it can be found that both G8 and the feature group of our proposed method have made some contributions to the whole method.
Table 5.
Performances of different groups.
Because the performance of the learning-based method is sensitive to the percentage of the training set, it is meaningful to test the performance change of the proposed method under the different percentages of the training set. The training test is divided from 80–20% into 20–80%, and the interval is 10%. For each fixed training test segmentation, the database of the enhancement method is divided into training and test sets, and the contents do not overlap. This division is randomly repeated 1000 times and the performance was reported in the median, as shown in Table 6. From the table, we can see that the performance increases with the increase in the percentage of the training set, which is consistent with other learning-based methods [53,54]. Even if we only use 40% of the training samples, its performance is good. Such observations reflect the stability of the proposed method.
Table 6.
Performance under different training test split.
6. Conclusions
In this paper, the underwater image enhancement and restoration methods are reevaluated by evaluating the quality of the enhanced underwater images and systematically studying this strategy. In this paper, firstly, a new underwater image quality assessment (UIQE) database is established, which contains 405 enhanced and restored underwater images. These images are generated from 45 different underwater real images and enhanced by 9 representative underwater image enhancement methods. Then, the subjective quality evaluation of the database is studied. Considering that the objective of the underwater image enhancement and restoration method is to enhance contrast, remove color, enhance clarity, etc., we extract and integrate five groups of features, A new underwater image quality evaluation index (UIQEI), without reference, is proposed. UIQEI has been verified on the constructed UIQE database. UIQEI has a certain prediction ability for the effect of underwater image enhancement and restoration methods. The UIQEI proposed in this paper is another important contribution. It can be used to quantitatively evaluate the underwater image enhancement and restoration methods and optimize the actual underwater image enhancement and restoration system. The final contribution is that we discuss the evaluation methods of underwater image enhancement and restoration methods. The experimental part includes comparison with advanced methods, ablation experiments, and comprehensive and systematic image quality evaluation. It shows that UIQEI can achieve significant performance improvement and more consistent visual perception. According to the subjective data, we suggest that the combination of qualitative evaluation and quantitative evaluation can give a comprehensive and systematic evaluation of underwater image enhancement and restoration methods. In the future, we hope to build larger datasets, including more ocean types.
Author Contributions
Conceptualization, W.L., H.X. and C.L.; methodology, W.L.; software, W.L.; validation, W.L., T.L. and H.L.; formal analysis, W.L. and H.X.; investigation, W.L.; resources, W.L.; data curation, W.L.; writing—original draft preparation, W.L.; writing—review and editing, W.L. and H.X.; visualization, W.L.; supervision, H.X. and L.W.; project administration, H.X. and C.L.; funding acquisition, H.X. All authors have read and agreed to the published version of the manuscript.
Funding
Natural Science Foundation of China (62171243, 61971247 and 61501270); Zhejiang Provincial Natural Science Foundation of China (LSY19A010002 and LY22F020020); Natural Science Foundation of Ningbo (202003N4155 and 2021J134); Foundation of Zhejiang Province Education Department (Y201839115 and Y202146540).
Institutional Review Board Statement
Not applicable.
Informed Consent Statement
Not applicable.
Data Availability Statement
Available upon request to the corresponding author of this article.
Acknowledgments
The authors are deeply thankful to the reviewers and editors for their valuable suggestions to improve the quality of the paper.
Conflicts of Interest
The authors declare no conflict of interest.
References
- McConnell, J.; Martin, J.D.; Englot, B. Fusing concurrent orthogonal wide-aperture sonar images for dense underwater 3D reconstruction. In Proceedings of the 2020 IEEE/RSJ International Conference on Intelligent Robots and Systems (IROS), Las Vegas, NV, USA, 25–29 October 2020; pp. 1653–1660. [Google Scholar]
- Bobkov, V.; Kudryashov, A.; Inzartsev, A. Method for the Coordination of Referencing of Autonomous Underwater Vehicles to Man-Made Objects Using Stereo Images. J. Mar. Sci. Eng. 2021, 9, 1038. [Google Scholar] [CrossRef] [Scilit]
- Zhuang, Y.; Wu, C.; Wu, H. Event coverage hole repair algorithm based on multi-AUVs in multi-constrained three-dimensional underwater wireless sensor networks. Symmetry 2020, 12, 1884. [Google Scholar] [CrossRef] [Scilit]
- Fu, X.; Zhuang, P.; Huang, Y. A retinex-based enhancing approach for single underwater image. In Proceedings of the 2014 IEEE International Conference on Image Processing (ICIP), Paris, France, 27–30 October 2014; pp. 4572–4576. [Google Scholar]
- Ancuti, C.; Ancuti, C.O.; Haber, T. Enhancing underwater images and videos by fusion. In Proceedings of the 2012 IEEE Conference on Computer Vision and Pattern Recognition, Providence, Rhode Island, 16–21 June 2012; pp. 81–88. [Google Scholar]
- Henke, B.; Vahl, M.; Zhou, Z. Removing color cast of underwater images through non-constant color constancy hypothesis. In Proceedings of the 2013 8th International Symposium on Image and Signal Processing and Analysis (ISPA), Trieste, Italy, 4–6 September 2013; pp. 20–24. [Google Scholar]
- Ji, T.; Wang, G. An approach to underwater image enhancement based on image structural decomposition. J. Ocean. Univ. China 2015, 14, 255–260. [Google Scholar] [CrossRef] [Scilit]
- Gao, F.; Wang, K.; Yang, Z. Underwater image enhancement based on local contrast correction and multi-scale fusion. J. Mar. Sci. Eng. 2021, 9, 225. [Google Scholar] [CrossRef] [Scilit]
- Drews, P.L.J.; Nascimento, E.R.; Botelho, S.S.C. Underwater depth estimation and image restoration based on single images. IEEE Comput. Graph. Appl. 2016, 36, 24–35. [Google Scholar] [CrossRef] [Scilit] [PubMed]
- Galdran, A.; Pardo, D.; Picón, A. Automatic red-channel underwater image restoration. J. Vis. Commun. Image Represent. 2015, 26, 132–145. [Google Scholar] [CrossRef] [Scilit]
- Peng, Y.T.; Cosman, P.C. Underwater image restoration based on image blurriness and light absorption. IEEE Trans. Image Process. 2017, 26, 1579–1594. [Google Scholar] [CrossRef] [Scilit]
- Zhao, X.; Jin, T.; Qu, S. Deriving inherent optical properties from background color and underwater image enhancement. Ocean. Eng. 2015, 94, 163–172. [Google Scholar] [CrossRef] [Scilit]
- Zhu, J.Y.; Park, T.; Isola, P. Unpaired image-to-image translation using cycle-consistent adversarial networks. In Proceedings of the IEEE International Conference on Computer Vision, Venice, Italy, 22–29 October 2017; pp. 2223–2232. [Google Scholar]
- Fabbri, C.; Islam, M.J.; Sattar, J. Enhancing underwater imagery using generative adversarial networks. In Proceedings of the 2018 IEEE International Conference on Robotics and Automation (ICRA), Brisbane, Australia, 21–25 May 2018; pp. 7159–7165. [Google Scholar]
- Li, C.; Guo, J.; Guo, C. Emerging from water: Underwater image color correction based on weakly supervised color transfer. IEEE Signal Process. Lett. 2018, 25, 323–327. [Google Scholar] [CrossRef] [Scilit]
- Li, H.; Li, J.; Wang, W. A fusion adversarial underwater image enhancement network with a public test dataset. arXiv 2019, arXiv:1906.06819. [Google Scholar]
- Wu, S.; Luo, T.; Jiang, G. A Two-Stage underwater enhancement network based on structure decomposition and characteristics of underwater imaging. IEEE J. Ocean. Eng. 2021, 46, 1213–1227. [Google Scholar] [CrossRef] [Scilit]
- Khaustov, P.A.; Spitsyn, V.G.; Maksimova, E.I. Algorithm for improving the quality of underwater images based on the neuro-evolutionary approach. Fundam. Res. 2016, 2016, 328–332. [Google Scholar]
- Wu, D.; Yuan, F.; Cheng, E. Underwater no-reference image quality assessment for display module of ROV. Sci. Program. 2020, 2, 1–15. [Google Scholar] [CrossRef] [Scilit]
- Ma, M.; Feng, X.; Chao, L.; Huang, D.; Xia, Z.; Jiang, X. A new database for evaluating underwater image processing methods. In Proceedings of the 2018 Eighth International Conference on Image Processing Theory, Tools and Applications (IPTA), Xi’an, China, 7–10 November 2018; pp. 1–6. [Google Scholar]
- Yang, N.; Zhong, Q.; Li, K. A reference-free underwater image quality assessment metric in frequency domain. Signal Process. Image Commun. 2021, 94, 116218. [Google Scholar] [CrossRef] [Scilit]
- Yang, M.; Sowmya, A. An underwater color image quality evaluation metric. IEEE Trans. Image Process. 2015, 24, 6062–6071. [Google Scholar] [CrossRef] [Scilit]
- Panetta, K.; Gao, C.; Agaian, S. Human-visual-system-inspired underwater image quality measures. IEEE J. Ocean. Eng. 2015, 41, 541–551. [Google Scholar] [CrossRef] [Scilit]
- Wang, Y.; Li, N.; Li, Z. An imaging-inspired no-reference underwater color image quality assessment metric. Comput. Electr. Eng. 2018, 70, 904–913. [Google Scholar] [CrossRef] [Scilit]
- Jaffe, J.S. Underwater optical imaging: The past, the present, and the prospects. IEEE J. Ocean. Eng. 2014, 40, 683–700. [Google Scholar] [CrossRef] [Scilit]
- Drews, P.; Nascimento, E.; Moraes, F. Transmission estimation in underwater single images. In Proceedings of the IEEE International Conference on Computer Vision Workshops, Sydney, Australia, 1–8 December 2013; pp. 825–830. [Google Scholar]
- Li, C.; Anwar, S.; Porikli, F. Underwater scene prior inspired deep underwater image and video enhancement. Pattern Recognit. 2020, 98, 107038. [Google Scholar] [CrossRef] [Scilit]
- Uplavikar, P.M.; Wu, Z.; Wang, Z. All-in-one underwater image enhancement using domain-adversarial learning. CVPR Workshops 2019, 1–8. [Google Scholar]
- Li, C.; Guo, C.; Ren, W. An underwater image enhancement benchmark dataset and beyond. IEEE Trans. Image Process. 2019, 29, 4376–4389. [Google Scholar] [CrossRef] [Scilit] [PubMed]
- Liu, R.; Fan, X.; Zhu, M. Real-world underwater enhancement: Challenges, benchmarks, and solutions under natural light. IEEE Trans. Circuits Syst. Video Technol. 2020, 30, 4861–4875. [Google Scholar] [CrossRef] [Scilit]
- Russakovsky, O.; Deng, J.; Su, H. Imagenet large scale visual recognition challenge. Int. J. Comput. Vis. 2015, 115, 211–252. [Google Scholar] [CrossRef] [Scilit]
- Xiao, J.; Hays, J.; Ehinger, K.A. Sun database: Large-scale scene recognition from abbey to zoo. In Proceedings of the 2010 IEEE Computer Society Conference on Computer Vision and Pattern Recognition, San Francisco, CA, USA, 13–18 June 2010; Volume 1, pp. 3485–3492. [Google Scholar]
- Series, B.T. Methodology for the subjective assessment of the quality of television pictures. Recomm. ITU-R BT 2012, 500–513. [Google Scholar]
- Seshadrinathan, K.; Soundararajan, R.; Bovik, A.C. Study of subjective and objective quality assessment of video. IEEE Trans. Image Process. 2010, 19, 1427–1441. [Google Scholar] [CrossRef] [Scilit]
- Ma, L.; Lin, W.; Deng, C. Image retargeting quality assessment: A study of subjective scores and objective metrics. IEEE J. Sel. Top. Signal Process. 2012, 6, 626–639. [Google Scholar] [CrossRef] [Scilit]
- He, K.; Sun, J.; Tang, X. Single image haze removal using dark channel prior. IEEE Trans. Pattern Anal. Mach. Intell. 2010, 33, 2341–2353. [Google Scholar]
- Peng, Y.T.; Cao, K.; Cosman, P.C. Generalization of the dark channel prior for single image restoration. IEEE Trans. Image Process. 2018, 27, 2856–2868. [Google Scholar] [CrossRef] [Scilit]
- Wen, H.; Tian, Y.; Huang, T. Single underwater image enhancement with a new optical model. In Proceedings of the 2013 IEEE International Symposium on Circuits and Systems (ISCAS), Beijing, China, 19–23 May 2013; pp. 753–756. [Google Scholar]
- Gao, Y.; Li, H.; Wen, S. Restoration and enhancement of underwater images based on bright channel prior. Math. Probl. Eng. 2016, 2016, 3141478. [Google Scholar] [CrossRef] [Scilit]
- Wang, Y.; Zhuo, S.; Tao, D. Automatic local exposure correction using bright channel prior for under-exposed images. Signal Process. 2013, 93, 3227–3238. [Google Scholar] [CrossRef] [Scilit]
- Lin, M.; Wang, Z.; Zhang, D. Color compensation based on bright channel and fusion for underwater image enhancement. Acta Opt. Sin. 2018, 38, 1110003. [Google Scholar]
- Marr, D.; Hildreth, E. Theory of edge detection. Proceedings of the Royal Society of London. Series B. Biol. Sci. 1980, 207, 187–217. [Google Scholar]
- Canny, J. A computational approach to edge detection. IEEE Trans. Pattern Anal. Mach. Intell. 1986, 1986, 679–698. [Google Scholar] [CrossRef] [Scilit]
- Xue, W.; Mou, X.; Zhang, L. Blind image quality assessment using joint statistics of gradient magnitude and Laplacian features. IEEE Trans. Image Process. 2014, 23, 4850–4862. [Google Scholar] [CrossRef] [Scilit] [PubMed]
- Fairchild, M.D. Color Appearance Models; John Wiley & Sons: Chichester, UK, 2013; pp. 1–34. [Google Scholar]
- Hasler, D.; Suesstrunk, S.E. Measuring colorfulness in natural images. Human vision and electronic imaging VIII. Int. Soc. Opt. Photonics 2003, 5007, 87–95. [Google Scholar]
- Choi, L.K.; You, J.; Bovik, A.C. Referenceless prediction of perceptual fog density and perceptual image defogging. IEEE Trans. Image Process. 2015, 24, 3888–3901. [Google Scholar] [CrossRef] [Scilit]
- Matkovic, K.; Neumann, L.; Neumann, A.; Psik, T.; Purgathofer, W. Global contrast factor-a new approach to image contrast. Comput. Aesthet. 2005, 159–168. [Google Scholar]
- Caviedes, J.; Philips, F. Final report from the video quality expert’s group on the validation of objective models of video quality assessment march 2000. In Proceedings of the VQEG Meeting, Ottawa, ON, Canada, 13–17 March 2000. [Google Scholar]
- Mittal, A.; Moorthy, A.K.; Bovik, A.C. No-reference image quality assessment in the spatial domain. IEEE Trans. Image Process. 2012, 21, 4695–4708. [Google Scholar] [CrossRef] [Scilit]
- Mittal, A.; Soundararajan, R.; Bovik, A.C. Making a “completely blind” image quality analyzer. IEEE Signal Process. Lett. 2012, 20, 209–212. [Google Scholar] [CrossRef] [Scilit]
- Zhang, L.; Zhang, L.; Bovik, A.C. A feature-enriched completely blind image quality evaluator. IEEE Trans. Image Process. 2015, 24, 2579–2591. [Google Scholar] [CrossRef] [Scilit]
- Oszust, M. Decision fusion for image quality assessment using an optimization approach. IEEE Signal Process. Lett. 2015, 23, 65–69. [Google Scholar] [CrossRef] [Scilit]
- Yue, G.; Yan, W.; Zhou, T. Referenceless quality evaluation of tone-mapped HDR and multiexposure fused images. IEEE Trans. Ind. Inform. 2019, 16, 1764–1775. [Google Scholar] [CrossRef] [Scilit]

Publisher’s Note: MDPI stays neutral with regard to jurisdictional claims in published maps and institutional affiliations. |
© 2022 by the authors. Licensee MDPI, Basel, Switzerland. This article is an open access article distributed under the terms and conditions of the Creative Commons Attribution (CC BY) license (https://creativecommons.org/licenses/by/4.0/).