


Abstract
Subjected to high-intensity development, enclosed tropical islands frequently face severe spatial resource constraints and acute risks of ecological degradation. To seek a comprehensive solution to multidimensional spatial conflicts, this study selected Hainan Island—a region facing development pressure from the Free Trade Port construction—as the study area. By coupling the XGBoost-SHAP, NSGA-II, and PLUS models, we constructed an integrated modular spatial planning framework of “mechanism interpretation—macro optimization—micro reconstruction”. The main findings are as follows. (1) Over the past 15 years, the fragile ecosystem of the island has faced immense pressure. Lacking an external buffer hinterland, land-use transitions exhibited a distinct chain transmission characteristic of “built-up land occupying agricultural land, and agricultural land squeezing forest”. This internal spatial cascading substitution constituted the core mechanism of ESV decline. (2) The reconstruction of the spatial pattern is governed by dual thresholds of natural constraints and economic pulling. A rigid ecological defense baseline (NDVI ≥ 0.40) restricts disorderly urban sprawl, while spatial inflection points (8.46 km from the coastline and 271 m from roads) precisely delineate the coastal and traffic-oriented agglomeration boundaries for built-up land. (3) Among the predefined scenarios, the Sustainable Development (SD) scenario emerges as the optimal pathway. By proactively reducing inefficient agricultural land space at the macro level and strictly implementing identified threshold controls alongside “infill” urban agglomeration at the micro level, the SD scenario is expected to successfully achieve a Pareto-optimal synergy between socioeconomic growth and the restoration of regional ESV. This study not only establishes an objective benchmark for the refined multi-objective spatial governance of the Hainan Free Trade Port, but also provides a referential planning paradigm for vulnerable enclosed islands globally facing high-intensity anthropogenic stress.
1. Introduction
Amidst global urbanization and regional development, land-use and land-cover change (LUCC) driven by human activities has emerged as the most profound force shaping surface ecological processes [1,2]. With the continuous intensification of population agglomeration and industrial expansion, the conflict between limited environmental carrying capacity and the rigid demand for spatial expansion is growing increasingly acute [3,4]. Macroscopically, this spatial competition manifests not only as habitat patch fragmentation and biodiversity loss, but is also directly reflected in the continuous evolution of regional ecosystem service values (ESVs) [5,6,7]. Consequently, a pressing scientific challenge in current land science and regional sustainable development is how to overcome spatial heterogeneity, scientifically balance the conflicts among economic development, agricultural security, and ecological safety, and provide spatially optimized schemes equipped with refined policy guidance [8,9,10].
In the field of land use and ecological effect assessment, the academic understanding of human–environment interactions is constantly deepening [11]. Regarding ecological benefit accounting, the research perspective has shifted from static physical habitat measurements to dynamic value quantification [12,13]. Notably, the ecological value accounting system based on localized attribute modifications has become a vital tool for evaluating macroscopic ecological baselines, as it objectively reflects the supply and demand relationship of natural resources within human society [14,15,16,17]. In terms of driving mechanism interpretation, studies have gradually broken through traditional linear or isolated causal assumptions, shifting their focus to the non-linear interactions and abrupt variations of natural and human activities across multidimensional spaces [18,19]. Accordingly, the paradigm for reconstructing spatial patterns has evolved from passive extrapolation based on historical trends to trade-offs and optimizations oriented toward specific sustainable development goals [20,21]. Currently, the bi-level coupled framework of “macro-demand forecasting—micro-spatial allocation” can effectively translate macro-level quantitative competition into spatial evolution at the micro-parcel scale [22,23].
Numerous studies have applied these spatial planning paradigms to island ecosystems [24,25,26]. Given the high sensitivity of island ecosystems and their relative resource scarcity, existing studies generally adopt “ecological priority” and “carrying capacity constraints” as the core prerequisites for land optimization [27,28]. Researchers have primarily focused on the complexity of coastal zones, exploring issues such as coastal wetland protection, tourism development interference, and the spatial squeeze effects of outward-looking economies on land use [29,30,31]. Technologically, previous studies have successfully integrated the ecological security pattern (ESP) and ESV constraints with multi-objective programming (MOP) methods, providing quantitative support for delineating island development boundaries, allocating resources, and implementing ecological restoration [32,33]. These efforts have deepened the understanding of human–environment conflicts on fragile islands and preliminarily established a spatial governance paradigm underpinned by ecological baselines [34].
However, applying these paradigms to highly restricted island habitats globally remains challenging. Islands face unique structural disadvantages, particularly small island developing states (SIDSs) and enclosed tropical habitats. Constrained by absolute physical boundaries, these regions lack the vast external buffer hinterlands available to continental areas. This issue is evident in the coastalization patterns of the Mediterranean and the Caribbean. In these regions, export-oriented economies drive intense urban sprawl along narrow coastal belts, which inevitably squeezes inland agricultural and ecological spaces. When dealing with enclosed islands experiencing high-intensity spatial reconstruction, current optimization approaches still exhibit limitations in geographic mechanism interpretation and the quantification of management indicators.
(1) The applicability of the inland-perspective “boundless assumption” is highly constrained in island habitats. Most existing land optimization frameworks adopt an inland projection logic, assuming the presence of a vast external buffer hinterland. Enclosed islands, however, possess distinct physical boundaries and independent ecological cycles. Their highly agglomerated coastal development belts are tightly nested with fragile inland ecosystems [35]. Consequently, internal land conversions are prone to triggering chain-like spatial transmission effects, posing a significant challenge to the traditional boundless projection logic [26].
(2) The non-linear threshold identification of spatial driving factors remains insufficient. Although machine learning algorithms have been introduced to analyze driving forces, such studies are largely confined to ranking global factor importance [36,37]. Under the unique concentric “coastal-inland” gradient of tropical islands, there is still a lack of quantitative characterization regarding how key natural and socioeconomic elements non-linearly trigger the edge thresholds of urban expansion or ecological degradation, thereby restricting the delineation of refined regulatory red lines [38].
(3) The quantification of ecological security in multidimensional spatial conflicts remains insufficient. Constrained by limited physical carrying capacity, the expansion of built-up land driven by export-oriented economies easily provokes fierce spatial conflicts with core protected areas and agricultural land. For enclosed islands, relying solely on controlling the physical area of land use is inadequate to prevent functional ecological degradation, such as hidden deficits caused by the structural transition from natural forests to agricultural land [10]. Therefore, ESVs must be introduced as an indispensable quantitative proxy. Translating complex ecological functions into a unified ESV index is the fundamental prerequisite for executing global Pareto optimization under multidimensional objectives [39].
To bridge these research gaps, this study develops a widely applicable spatial planning framework tailored to the unique constraints of island ecosystems. We selected Hainan Island—a quintessential enclosed tropical island confronting high-intensity spatial reconstruction and strict policy red line constraints—as a representative case study to validate this methodology. An integrated modular spatial planning framework comprising “Mechanism Interpretation (Extreme Gradient Boosting, XGBoost, and SHapley Additive exPlanations, SHAP)—Macro Optimization (Non-dominated Sorting Genetic Algorithm II, NSGA-II)—Micro Reconstruction (Patch-generating Land Use Simulation, PLUS)” was constructed (Figure 1).
Figure 1.
Integrated analytical framework of the study.
The core scientific objectives are twofold: (1) to accurately identify the non-linear thresholds of geographical factors driving the island’s spatial evolution, thereby providing a quantitative basis for delineating the physical boundaries between development and conservation; and (2) to perform multi-scenario coupled simulations for 2035 by establishing ESVs and economic benefits as the dual objective functions in the NSGA-II algorithm. This aims to explore systematic trade-off schemes that holistically balance socioeconomic growth and the spatial homeostasis of the ecosystem. Through a comparative analysis of multiple scenarios, this study aims to offer theoretical support for resolving the conflicts between intense human activities and nature conservation in island regions, ultimately formulating a robust methodological reference for vulnerable enclosed islands and SIDSs worldwide that grapple with similar multidimensional development pressures.
2. Materials and Methods
2.1. Study Area
Hainan Island (18°10′–20°10′ N, 108°37′–111°03′ E) is located in southern China (Figure 2), covering a total land area of approximately 33,900 km2. The island features a typical concentric, terraced topography, with the elevation gradually decreasing from the center to the periphery. Specifically, the central mountainous region, with an elevation above 500 m, accounts for 25.1% of the total area. Centered around Wuzhi Mountain, this region forms the ecological barrier of the island. The central hilly terrace zone, ranging from 100 to 500 m in elevation, occupies the largest proportion (approximately 56.4%) and serves as the primary distribution area for tropical economic forests. The outer ring consists of coastal plains below 100 m, making up 11.7% of the island and exhibiting a continuous annular spatial distribution. This pronounced topographic gradient has nurtured the most concentrated and well-preserved tropical rainforest system in China, characterized by exceptionally high biodiversity and ecological sensitivity.
Figure 2.
Geographical location of Hainan Island.
In terms of socio-economic dimensions, Hainan Island underwent significant development transformation and spatial reconstruction between 2010 and 2025. During the study period, the permanent population increased from 8.67 million in 2010 to 10.55 million in 2025, representing a growth of 21.68%. Concurrently, the gross domestic product (GDP) grew steadily, the industrial structure was continuously adjusted, and the urbanization rate of the permanent population surged from 49.81% to 64.08% [40]. In particular, since the comprehensive launch of the Hainan Free Trade Port construction in 2018, policy dividends have further accelerated urban expansion in the coastal zone. The intertwining of objective geographical barriers and high-intensity development demands has confronted the entire island with prominent rigid resource constraints.
This unique natural and social background makes Hainan Island an ideal region for conducting multi-objective land optimization research. First, as a relatively independent geographical unit, the island lacks a vast inland hinterland for spatial substitution and ecological buffering. Its distinct physical boundaries effectively eliminate the interference of external geopolitical factors, making it a natural laboratory for quantitatively assessing the ecological effects of land expansion and identifying edge thresholds. Second, driven by Free Trade Port policies, the high-intensity demand for industrial and population agglomeration in coastal areas forms a significant spatial game against the strict ecological red lines of the central national park. This multidimensional spatial conflict among forest, agricultural land, and built-up land, which is highly pronounced within a limited space, provides a typical case study for global fragile, enclosed islands to conduct multi-objective land use trade-offs and optimizations.
2.2. Data Sources
The spatial analysis and multi-objective optimization framework constructed in this study relies on multi-source data encompassing basic geography, natural environments, and socio-economics. To ensure the geometric consistency of spatial grids during cross-platform calculation and model input, all raster and vector elements were co-registered to a unified WGS 1984/UTM Zone 49N projected coordinate system. Subsequently, they were uniformly resampled to a spatial resolution of 30 m using the bilinear interpolation method before being input into the models. The specific classifications, years, and acquisition sources of the data are detailed in Table 1.
Table 1.
Data descriptions and sources.
It should be noted that the CLCD dataset used in this study follows the traditional primary classification system and does not separately isolate tropical orchards. Existing studies and misclassification literature indicate that in southern and tropical rainy regions, this public product is often affected by complex vegetation spectra and non-linear phenology. Consequently, there is a certain degree of confusion risk between forest and agricultural land, making it highly prone to misclassifying orchards or planted forests as grassland or cropland [42].
Given that natural rubber, areca nut, and evergreen tropical fruit trees are widely distributed across Hainan Island, constrained by the traditional classification rules of this dataset and the growth cycles of trees, forest and agricultural land in this study are defined by a specific technical scope [43]. Specifically, planted economic forests in their mature stage with high canopy closure (such as mature rubber plantations) present satellite spectral features similar to natural vegetation, and are thus mostly categorized into forest within the data structure. Conversely, modern orchards with a low spatial structure, as well as planted forests undergoing rotation renewal or sapling replanting (which typically have a higher rate of bare surface soil), exhibit radiation characteristics close to reclaimed farmland. Consequently, they are easily identified and classified as cropland [44].
Therefore, agricultural land in this study inherently represents a broad land-use attribute, encompassing not only traditional croplands but also tropical orchards and the elastic conversion space between forests and agriculture. Although this technical definition differs from the narrow definition of “cropland” or “arable land” statistics typically used by natural resource management departments, it better matches the inherent spatial characteristics of public datasets in tropical island environments. Thus, it is highly suitable for exploring the multidimensional spatial trade-offs among forest, agricultural land, and built-up land at the island’s macro level.
2.3. Assessment of ESVs
2.3.1. Correction of Equivalent Factors and ESV Calculation
Referring to the equivalent factor assessment system for ecosystem service value (ESV) improved by Xie et al., this study set the baseline economic value of one standard ESV equivalent at the national level to 3406.50 CNY/hm2 [16]. To eliminate spatial heterogeneity and better reflect the actual habitat conditions of the tropical island in the study area, the grain yield ratio method was first introduced for spatial localization correction. Based on agricultural statistical data, the average actual grain yield per unit area in Hainan Province during the study period (2010–2025) was 5204 kg/hm2, whereas the national average grain yield over the same period was 5716 kg/hm2. Consequently, the regional spatial yield correction coefficient for Hainan Island was calculated to be 0.9104. After conversion, the baseline economic value of one standard ESV equivalent factor applicable to this study area () was determined to be 3101.37 CNY/hm2. Additionally, to eliminate the interference of intertemporal macroeconomic price fluctuations, ESV accounting across all years uniformly adopted a constant-price system based on a fixed period [45]. This approach ensures that the spatiotemporal evolution trends of regional ESV are driven purely by the physical quantity and structural changes of land use transitions [46].
Building upon this, integrated with the tropical ecological characteristics of Hainan Island and local research findings from relevant scholars, the ESV equivalent table for this study (Table 2) was established [16,47,48,49]. Notably, the ecological value equivalent for built-up land was set to 0. By combining the corrected baseline value with the spatial area of each land use type, the specific calculation formulas for the regional ESVs are as follows:
where and represent the total ecosystem service value of the study area and the value of the -th specific service function, respectively; is the spatial distribution area of the -th land use type; and denote the overall ecological value coefficient per unit area for the -th land use type and the value coefficient per unit area for the -th specific function, respectively; is the value equivalent factor of the -th ecological service function; refers to the economic value of one standard equivalent factor; and and represent the total numbers of land use types and ecosystem service functions, respectively.
Table 2.
Equivalent coefficients of ecosystem service value per unit area in Hainan Island.
2.3.2. Sensitivity Analysis of ESVs
To evaluate the reliability of the ESV estimations and measure the dependence of the total ESV on the applied value coefficients (VCs), the coefficient of sensitivity (CS) was introduced based on economic elasticity concepts [50]. The CS is calculated using the following formula:
where and represent the initial and adjusted total ecosystem service values, respectively; and represent the initial and adjusted value coefficients for land use type . A value of < 1 indicates that the total ESV is inelastic with respect to the value coefficient, thereby confirming the robustness and reliability of the estimation results.
2.4. Non-Linear Driving Mechanism Interpretation Using XGBoost-SHAP
This study constructed a comprehensive XGBoost-SHAP analytical framework to systematically reveal the non-linear driving mechanisms of natural and socioeconomic factors on the expansion of built-up land. Specifically, for an enclosed island like Hainan, the spatial conflict between coastal Free Trade Port development and central rainforest protection exhibits strong edge effects and topographical gradient constraints. The XGBoost-SHAP method was specifically applied in this study to quantitatively identify these hidden non-linear physical boundaries, thereby transforming abstract driving forces into concrete spatial constraint parameters for subsequent pattern simulations. Although the PLUS model used for subsequent spatial simulations incorporates a random forest algorithm and possesses probability calculation capabilities, its “black box” nature makes it difficult to identify the non-linear spatial thresholds of the driving factors. Therefore, the XGBoost algorithm, which exhibits superior predictive performance and supports SHAP interpretation, was introduced prior to the simulation for mechanism interpretation. Based on a stratified random sampling strategy, 50,000 pixels were extracted from both expanded and unexpanded areas, respectively. Ultimately, a dataset comprising 100,000 balanced samples was constructed as the foundational data support for mechanism interpretation. To rigorously validate the model’s generalization and ensure full reproducibility, a randomized data partitioning algorithm with a fixed random seed (random state = 42) was employed. The full dataset was randomly split into two mutually exclusive subsets: a training set containing 80% of the samples (80,000 pixels) for model fitting, and an independent test set comprising the remaining 20% (20,000 pixels) exclusively reserved for final accuracy evaluation.
2.4.1. Selection of Spatial Driving Factors
Considering data availability and the tropical island characteristics of Hainan Island, 12 driving factors were selected from three dimensions—natural environment, socioeconomics, and spatial location—to construct the set of independent variables (Table 3) [35,51]. Given that Hainan Island is a relatively independent geographical unit, the “distance to the coastline (D2Coast)” was specifically introduced as an island-specific locational indicator. Unlike inland regions with vast hinterlands, socioeconomic activities on islands tend to be highly agglomerated in coastal areas. The coastline serves not only as the boundary for land–sea interactions, but also as a crucial spatial attraction for the export-oriented industries and development activities of the Free Trade Port [52]. Incorporating this indicator helps quantify the “coastward” tendency of the island’s urban expansion, providing variable support for interpreting the non-linear patterns of land use evolution as it decays toward the inland. To eliminate scale discrepancies among multi-source data, all spatial elements were standardized to a unified projected coordinate system and resampled to a 30-m spatial resolution prior to model input.
Table 3.
Selection of spatial driving factors and their geographical implications.
Prior to model training, a rigorous multicollinearity diagnosis was conducted for the 12 selected driving factors to ensure the scientific validity of the subsequent SHAP feature interpretation. The diagnostic results (Figure 3) demonstrated that the maximum absolute Pearson correlation coefficient among all variable pairs was 0.69 (between DEM and Slope), which remained strictly below the widely accepted critical threshold of 0.80 [18,53]. Furthermore, the variance inflation factors (VIFs) for all variables were calculated and incorporated into Table 3. The maximum VIF observed was 4.66 (for DEM), well below the stringent diagnostic warning threshold of 5.0 [54]. These robust results confirm the absence of severe multicollinearity within the established indicator system, guaranteeing the structural independence of the feature set.
Figure 3.
Correlation matrix of the selected driving factors.
2.4.2. XGBoost Model
XGBoost (extreme gradient boosting) is a highly efficient ensemble learning algorithm based on the gradient boosting framework. By combining multiple classification and regression tree (CART) weak learners, this algorithm sequentially optimizes the objective function in an additive manner. Consequently, it constructs a high-precision predictive model capable of effectively capturing complex non-linear relationships among spatial variables [55]. Unlike traditional gradient boosting tree methods, XGBoost explicitly introduces a regularization term into the objective function to control model complexity:
where is the loss function, measuring the difference between the predicted probability and the actual expansion status; represents the actual status of the -th spatial sample (1 for expansion, 0 for non-expansion); denotes the predicted probability of the -th sample at the -th iteration; is the total number of valid samples; is the total number of decision trees; and is the complexity penalty term for the -th tree, defined as:
where indicates the number of leaf nodes in the decision tree; is the weight score of the -th leaf node; represents the complexity parameter controlling the number of leaf nodes; and is the L2 regularization coefficient for the leaf node weights. By incorporating the regularization term, the model effectively restricts the overgrowth of decision trees while reducing training errors. This significantly enhances the model’s generalization ability in global spatial prediction and mitigates the overfitting problem.
To guarantee the reliability of the mechanism interpretation and eliminate the risk of overfitting, the predictive performance of the XGBoost model was rigorously evaluated using an independent test set (20% of the samples). During the model training phase, hyperparameter regularization was strictly implemented: the maximum depth of the decision trees was constrained to 6 to prevent over-complex structures, and a conservative learning rate of 0.1 was applied over 200 boosting rounds. These explicit parameter constraints, combined with the algorithm’s inherent L2 regularization, effectively prevented the model from capturing random noise. The evaluation metrics indicate that the model possesses excellent discriminative ability, achieving an area under the curve (AUC) of 0.973 and an overall accuracy (OA) of 92.29% (Figure 4). For the positive class (urban expansion), the precision, recall, and F1-score reached 90.27%, 93.47%, and 91.84%, respectively. These highly robust validation results confirm that the trained XGBoost model effectively captured the non-linear geographical patterns, providing a solid analytical foundation for the subsequent SHAP threshold extractions.
Figure 4.
ROC curve and confusion matrix of the XGBoost model.
2.4.3. SHAP Model
Although XGBoost possesses extremely high predictive accuracy, its complex tree ensemble structure results in a lack of intuitive interpretability. To overcome this “black-box” limitation, this study introduced SHapley Additive exPlanations (SHAP), a model interpretation method based on cooperative game theory. This method can consistently quantify the marginal contribution value of each spatial feature to the model’s final output probability [56]. By calculating the SHAP value of each driving factor, it is possible not only to accurately identify the key factors dominating the expansion of built-up land, but also reveal the non-linear response characteristics and spatial thresholds of each factor through dependence plots. Its core calculation formula is:
where is the SHAP value of the -th driving factor (i.e., its contribution to the probability of built-up land expansion); is the set comprising all 12 driving factors; represents all possible feature subsets that do not include the -th factor; and correspond to the number of features in the set and subset , respectively; is the model prediction result when only the feature subset is used; and denotes the marginal predictive effect brought by adding feature into the feature subset .
To accurately quantify the zero-value spatial inflection points of non-linear responses, this study eschewed traditional visual interpretation in favor of a statistical extraction framework based on 3rd-degree polynomial fitting and Bootstrap resampling. Specifically, a 3rd-degree polynomial curve was employed to smooth the SHAP dependence scatter plots, allowing for the precise calculation of the threshold where the curve crosses the y = 0 baseline. Subsequently, to rigorously evaluate the statistical robustness of these identified thresholds, 1000 iterations of Bootstrap resampling were executed to construct the 95% confidence intervals (CIs) for each threshold.
2.5. Multi-Objective Spatial Optimization Framework: NSGA-II
The Non-dominated Sorting Genetic Algorithm II (NSGA-II) is a multi-objective genetic algorithm based on Pareto dominance. By employing fast non-dominated sorting and a crowding distance maintenance mechanism, the algorithm facilitates global trade-offs among multiple conflicting objectives, effectively addressing the challenges of convergence and solution set diversity [57]. Given the island’s lack of an external buffer hinterland, the rigid spatial demand for Free Trade Port construction directly competes with the strict national ecological redlines, triggering acute spatial trade-off dilemmas. The NSGA-II algorithm is applied here to directly address this specific research problem by optimizing the trade-offs between macroeconomic benefits and total ecosystem service values (ESVs). In this study, the NSGA-II algorithm was introduced to perform a global search and optimization for land use, strictly adhering to the constraints of regional macro-policies and area conservation. This approach provides a scientific decision-making basis for the macro-level quantitative allocation of various land types on Hainan Island for the year 2035.
2.5.1. Construction of Objective Functions
The construction of the Hainan Free Trade Port faces a dual game between high-intensity urbanization expansion and the maintenance of the island’s ecological baseline. To systematically balance their competitive conflict at the macro level, this study constructed two conflicting and mutually constraining non-linear optimization objective functions: maximizing land economic benefits and maximizing ESVs.
(1) Objective Function 1: Maximizing Land Economic Benefits
To meet the economic development demands of the Hainan Free Trade Port construction, maximizing land economic benefits was set as the first optimization objective. The quantification of these benefits is based on the spatial mapping relationship between the macro-level GDP statistics of the three industrial sectors and micro-level land use types. The specific accounting logic is as follows: the total output value of the primary industry (agriculture, forestry, animal husbandry, and fishery) is mapped and converted into four natural land types—agricultural land, forest, grassland, and water, respectively—to derive their output coefficients per unit area. Meanwhile, the total output values of the secondary and tertiary industries comprehensively represent the direct economic output of built-up land, and the output coefficient of barren is set to 0. By calculating the output coefficient per unit area for each land use type in the study area, the final economic benefit objective function is constructed as follows:
where represents the total regional land economic benefit (104 CNY); to denote the macro-allocation areas (km2) of agricultural land, forest, grassland, water, built-up land, and barren, respectively. The coefficient of each variable in the formula represents the output coefficient per unit area (104 CNY/km2) of the corresponding land use type.
(2) Objective Function 2: Maximizing Ecological Benefits
As the core cornerstone for maintaining the spatial homeostasis of the island’s socio-ecological system, the second optimization objective is used to guide the allocation of land use toward a spatial pattern with superior ecological buffering performance. The accounting of ecological benefits is oriented by ecosystem service value (ESV). Combined with the equivalent factors based on the localized correction accounting in Section 2.3, the ecological benefit coefficient per unit area for each land use type was calculated, with the ecological value equivalent of built-up land set to 0. Accordingly, the ecological benefit objective function is constructed as follows:
where represents the total projected ecosystem service value of the region (104 CNY); the constant terms in the formula denote the ecosystem service value coefficients per unit area (104 CNY/km2) for the corresponding land use types.
Maximizing and maximizing constitute the shared premise of the global multi-objective optimization. The two functions interactively search for the optimal solution in a high-dimensional non-linear solution space via the NSGA-II algorithm, aiming to find the Pareto optimal allocation scheme that meets the sustainable development requirements of the island.
2.5.2. Scenario Settings
Based on an extensive review of literature related to multi-objective land use spatial optimization, this study categorized the future spatial evolution scenarios for 2035 into four types: Business as Usual (BAU), Economic Priority (ED), Ecological Priority (EP), and Sustainable Development (SD) [9,10,22,58]. This study took maximizing economic benefits (F1) and maximizing ecosystem service values (F2) as the shared premise for global optimization, aiming to treat the balance between the Free Trade Port’s economic construction and ecological baseline protection as the core prerequisite for macro-spatial policy regulation. Regarding the setting of specific quantitative targets, the BAU scenario employs the Markov chain model to directly predict the scale of each land use type in 2035 based on historical transition probabilities from 2015 to 2025, serving as the baseline target. For the remaining three optimization scenarios, a large set of global Pareto front solutions was obtained through the NSGA-II algorithm module (Figure 5). To avoid the unfeasibility of absolute extreme corner solutions in real-world planning, robust solutions at the 95th percentile were selected as the basis for target extraction. Accordingly, this study extracted the robust solutions where economic benefits (F1) and ecological benefits (F2) reached their respective 95th percentiles as the quantitative targets for the ED and EP scenarios, respectively. Finally, a solution where both F1 and F2 are situated at an intermediate trade-off position was selected as the macro-regulatory target for the SD scenario.
Figure 5.
Pareto front distribution based on economic and ecological dual objectives.
2.5.3. Constraint Conditions
To ensure that the optimization results did not deviate from actual reality and to strictly implement the strategic guidance of the Hainan Provincial Territorial Spatial Plan (2021–2035), this study established multidimensional rigid constraint conditions [59]. Drawing on relevant similar studies, these constraint intervals serve as empirical parameters that govern the macro-optimization boundaries [10,22,60]. Their derivations are strictly grounded in statutory planning mandates, historical annual change rates (2010–2025), regional ecological carrying capacity assessments, and established academic practices.
As an independent and enclosed island unit, the total area of the entire island must remain absolutely conserved during the optimization period:
where represents the area of each land use type ( for agricultural land; for forest; for grassland; for water; for built-up land; for barren).
Due to significant spatial differences in major function zones within Hainan Island (e.g., restricted development in the central mountainous region and key industrial carrying capacity in the coastal belt), this study treated the island’s boundary as a holistic system. A constraint mechanism of “island-wide macro total volume control” was adopted in the NSGA-II model, rather than equalization restrictions at the administrative level. The rationale for this setting lies in its ability to internalize spatial differences and development trade-offs among cities and counties into a Pareto optimization front of cross-regional indicator circulation and ecological compensation across the island. Meanwhile, the specific development and protection focuses of individual cities and counties were left to the subsequent spatial allocation model (PLUS) to respond spontaneously on micro-grids based on localized driving force differences. The macro-variation interval constraints for specific land use types are as follows:
(1) Agricultural land constraint: In accordance with the national baseline requirement for permanent basic farmland protection and the historical fluctuation range observed between 2010 and 2025, its variation interval was set to 90% to 110% of the current status.
(2) Forest constraint: This constraint is directly derived from the statutory mandate of the Hainan Provincial Territorial Spatial Plan (2021–2035), which establishes a strict ecological redline requiring forest retention of no less than 21,100 km2 by 2035. Meanwhile, the upper limit was empirically set to 1.1 times the current status to accommodate potential ecological restoration gains.
(3) Built-up land constraint: To accommodate the development and construction needs of the Hainan Free Trade Port while complying with the regulatory threshold from the Hainan Provincial Territorial Spatial Plan (2021–2035)—which mandates that provincial urban development boundaries should not exceed 1.3 times the current scale—the upper limit of built-up land expansion was restricted to 1.3 times its current status. This balances future industrial agglomeration demands with effective control over urban sprawl.
(4) Grassland and water constraints: To prevent unrealistic combinatorial optimization extremes while accommodating minor ecological transitions and historical change trajectories, their variation intervals were restricted within an empirical bound of ±10% of the current status. This ensures that minor land-use types maintain structural stability and realistic elasticity within the multi-objective optimization framework.
(5) Barren constraint: Reflecting the ongoing implementation of regional ecological restoration projects and increasing land development intensity where barren patches are systematically reclaimed or vegetated, barren land was empirically parameterized to no longer increase in the future.
2.6. Spatial Simulation of Future Land Use
To spatialize the optimized land use allocation of Hainan Island under multiple scenarios in 2035, this study employed the Patch-generating Land Use Simulation (PLUS) model. This simulation process integrates a coupled framework of macro-demand trade-offs and micro-spatial constraints. While NSGA-II determines the optimal macro-level “quantity” of land types, it cannot resolve “where” these changes should occur on the complex island terrain. The PLUS model was specifically applied to bridge this spatial gap. By ingesting the macro-demands derived from NSGA-II and the non-linear spatial threshold rules extracted by XGBoost-SHAP, the PLUS model executes the micro-reconstruction of land patches. Specifically, the macro demand for each land use type under various scenarios was calculated using the aforementioned multi-objective optimization algorithm (NSGA-II). Based on this, the PLUS model simulated the spatial dynamic evolution process at the micro-patch level via the land expansion analysis strategy (LEAS) and a cellular automata (CA) allocation engine based on multi-type random seeds, revealing the specific spatial transmission paths of land-use conflicts under different future scenarios.
2.6.1. Neighborhood Weights
Neighborhood weight parameters reflect the spatial expansion momentum and agglomeration capacity of specific land-use types, with values ranging from 0 to 1. Drawing on relevant similar studies, this study strictly derived these parameters based on the historical spatial expansion intensity of Hainan Island from 2015 to 2025 [22,61]. Specifically, the weight was calculated using the normalized ratio of the newly expanded area of each land-use type to the total land area. Driven by the high-intensity construction of the Free Trade Port, built-up land exhibited the most aggressive spontaneous expansion momentum, thus yielding the maximum normalized weight of 1.00. Following the same derivation formula, agricultural land and forest, due to their significant spatial continuity and large-scale mutual conversions, received weights of 0.78 and 0.55, respectively. The expansion capacities of grassland and water were limited by strict natural conservation policies, resulting in derived weights of 0.18 and 0.25, respectively. Barren land, possessing the most stable and restricted spatial distribution, generated a minimum weight of 0.01.
2.6.2. Transition Cost Matrix
Drawing on relevant similar studies, the transition cost matrix was used to constrain the conversion permissions among land use types [61]. In strict accordance with the strategic directives of the Hainan Provincial Territorial Spatial Plan (2021–2035), the four scenarios were customized as follows: the BAU scenario followed historical transition probabilities without directional restrictions; the ED scenario, dominated by industrial expansion, allowed the conversion of agricultural land and forest into built-up land but prohibited the reverse transition of built-up land; the EP scenario strictly adhered to the statutory ecological red lines mandated by these national and provincial plans, prohibiting the conversion of forest, water, and grassland into built-up land and barren; and the SD scenario adopted a spatial trade-off strategy, which, under the premise of adhering to the aforementioned spatial probability constraints to prevent the encroachment of core forests and high-quality farmland, permitted the localized conversion of inefficient forest and agricultural land into built-up land, thereby supporting the structural adjustment and rational development of the coastal belt. Through the nesting of these matrices, the quantitative translation from macro multi-objective demands to micro island spatial patterns was achieved.
2.6.3. Spatial Suitability Probability
When configuring the spatial constraint rules for the PLUS model, drawing on the rationale of relevant studies, the non-linear thresholds identified by XGBoost-SHAP were utilized to define the spatial boundaries of intervention, while the corresponding scenario-specific policy orientations determined the intervention intensities as detailed in Table 4. Specifically, the thresholds extracted from SHAP dependence plots provided objective spatial locations for applying these rules. Building upon these data-driven boundaries, the numerical correction coefficients were configured as relative penalty or incentive modifiers to the baseline transition probabilities. These coefficients were quantitatively established based on the varying enforcement stringencies of the spatial governance strategies outlined in the Hainan Provincial Territorial Spatial Plan (2021–2035) across different scenarios. Specifically, the coefficient derivations for each rule are as follows:
Table 4.
Spatial suitability probability modification coefficients based on non-linear thresholds under multiple scenarios.
(1) Ecological Resistance (NDVI ≥ 0.40): To operationalize the baseline requirement of “building a central ecological green core”, the EP scenario applied an extreme attenuation coefficient of 0.10, imposing a severe 90% penalty on the transition probability, to strictly restrict development activities in core rainforests. The SD scenario applied a coefficient of 0.30, representing a 70% penalty, enforcing strict protection while reserving marginal flexibility for necessary ecological facility construction.
(2) Coastal Constraints and Attraction (D2Coast ≤ 8.46 km): Based on the management directives of “implementing coastal building setback lines”, the EP scenario established a constraint coefficient of 0.85, corresponding to a 15% reduction, to prevent shoreline degradation. The SD scenario was set at 0.95 to achieve a mild 5% reduction for moderate control, aiming to curb disorderly urban sprawl while securing necessary development space for the coastal urban belt. Conversely, the ED scenario applied an enhancement coefficient of 1.15 to simulate the spatial polarization effect of capital’s profit-seeking toward coastal economic zones.
(3) Corridor and Agglomeration (D2Road ≤ 271 m/NLight ≥ 6.89 nW·cm−2·sr−1): To implement the strategies of “strengthening intensive agglomeration”, the SD scenario applied an incentive coefficient of 1.10, offering a 10% probability enhancement within these buffer zones to guide urban space toward inland, “infill” compact layouts. The ED scenario further amplified this coefficient to 1.20 to provide a strong 20% incentive, simulating aggressive, traffic-oriented industrial agglomeration.
Finally, the BAU scenario maintained all baseline probabilities by setting all coefficients to 1.0 to reflect historical evolutionary inertia lacking macro-policy intervention.
2.6.4. Model Validation
To validate the PLUS model, the 2015-based simulation of 2025 was compared against actual 2025 remote sensing data. The overall accuracy (OA) reached 89.20%, demonstrating robust precision for dominant land types: built-up land (producer’s accuracy (PA): 92.48%, user’s accuracy (UA): 98.54%), forest (PA: 91.53%, UA: 91.41%), and agricultural land (PA: 85.06%, UA: 84.99%) (Table 5).
Table 5.
Accuracy assessment of land use simulation by category in 2025.
Conversely, minor categories (grassland and barren land) yielded lower accuracies. Spatially, their negligible areas and fragmented distributions exacerbate “mixed-pixel effects” [23]. Dynamically, their patch evolution is highly stochastic and lacks the robust driving rules required for cellular automata (CA) predictability. However, because OA is an area-weighted metric, these localized errors contribute negligibly to macroscopic quantitative and allocation disagreements [62]. Finally, to ensure the high OA was not inflated by persistent background pixels, the figure of merit (FoM) was calculated [63]. The resulting FoM of 0.203 aligns with established standards for complex land-change modeling, confirming the model’s reliability for 2035 multi-scenario spatial projections [62].
2.7. Software Environment and Implementation
All computational procedures, including data preprocessing, XGBoost machine learning modeling, SHAP mechanism interpretation, multicollinearity testing (VIF), Bootstrap statistical validation, and graphic visualizations, were implemented in Python 3.10. The core libraries utilized include xgboost for classification training, shap for feature attribution analysis, scikit-learn for model performance evaluation, statsmodels for variance inflation factor calculations, and pandas/numpy for data manipulation. Furthermore, the macro-level multi-objective spatial optimization (NSGA-II) was executed utilizing the Geatpy toolbox in Python, and the micro-scale future land-use simulation was performed using the PLUS software (v1.4.1). All spatial raster and vector processing tasks were supported by QGIS software (v.3.34.1) environments.
3. Results
3.1. Spatiotemporal Evolution of Land Use and ESVs
3.1.1. Spatiotemporal Characteristics of Land Use Dynamics
Based on the land use transition matrix (Table 6) and the spatiotemporal transition network (Figure 6) from 2010 to 2025, the territorial spatial pattern of Hainan Island experienced significant structural reorganization during the study period. Overall, it is characterized by the shrinkage of forest, the expansion of agricultural land, and the continuous outward sprawl of built-up land, while the area proportions of the remaining land types, such as grassland and water, remained relatively stable.
Table 6.
Land use transition statistics from 2010 to 2025 (unit: area (km2), rate (%)).
Figure 6.
Sankey diagram of land use transitions from 2010 to 2025.
Regarding the direction of land transitions, the conversion from forest to agricultural land was the core feature of land use change across the island. Over the 15-year period, the outflow area from forest to agricultural land reached 4742.68 km2, accounting for 76.96% of the total transitioned area. This substantial shift reflects a large-scale replacement in the planting structure of tropical crops. Combined with field surveys, this spatial variation closely aligns with the transformation trajectory of the local primary industry: driven by rising prices of economic crops such as areca nut and rubber, as well as local policies promoting efficient tropical agriculture, modern orchards (e.g., dragon fruit and mango) have been developed on a large scale. Because newly established orchards and economic forests undergoing rotation logging have low initial canopy closure and high bare soil rates, their spectral characteristics inherently match the identification criteria for agricultural land defined earlier (Section 2.2). Consequently, this phenomenon manifests as a massive conversion from forest to agricultural land at the remote sensing pixel scale.
This spatial transition exhibits significant topographic gradient differentiation, intuitively reflecting the spatial game process under the constrained internal hinterland conditions of the island. Specifically, the coastal plains below an elevation of 100 m serve as the core carrying area for the Free Trade Port construction. In this zone, the area of built-up land rapidly increased from 497.35 km2 to 723.73 km2, representing a growth of nearly 50%. Such high-intensity urban expansion directly occupied a substantial amount of peri-urban agricultural space (totaling 174.38 km2). To maintain the total scale of the agricultural planting system, agricultural space was forced to shift along the topography toward the central hilly terraces at elevations of 100–500 m. This spatial substitution was achieved by replacing inefficient forest and establishing contiguous orchards. In contrast, the central core mountainous region above 500 m (represented by Wuzhi Mountain) maintained excellent spatial continuity and stability of its natural forest system, benefiting from topographic barriers and the strict protection of ecological red lines. These results quantitatively reveal the chain transmission effect of island land evolution, which propagates from “coastal urban polarization” to “inland agricultural encroachment”.
3.1.2. Temporal Variations of ESVs
According to the ESV assessment results (Table 7 and Figure 7), the overall ecological assets of Hainan Island exhibited a continuous downward trend between 2010 and 2025. The cumulative loss of the island’s total ESV reached 21.93 × 10⁹ CNY, representing an overall decline of 12.19%. Among the individual ecosystem service functions, climate regulation and hydrological regulation experienced the most drastic losses due to their dominant weights in the overall value matrix. The values of these two regulatory services decreased by 6.54 × 10⁹ CNY and 5.01 × 10⁹ CNY, respectively. The decline in these two core regulatory functions constituted the primary driver of the island’s overall ecological value degradation. Mechanistically, this decline was highly synchronized with the large-scale structural conversion from forest to agricultural land in the central hilly terraces, as detailed in Section 3.1.1.
Table 7.
Temporal changes in ecosystem service values from 2010 to 2025 (unit: 109 CNY).
Figure 7.
Changes in ecosystem service values of Hainan Island from 2010 to 2025.
Within supply services, a significant functional polarization emerged during the study period, highlighting the vulnerable response of the enclosed island habitat to the rapid transformation of the primary industry. On the one hand, strongly driven by the large-scale expansion of agricultural land, food production became the only secondary function across the entire region to maintain a positive gain, with its value cumulatively increasing by 0.85 × 10⁹ CNY. On the other hand, the water supply service for the entire island underwent a fundamental reversal. The assessment revealed that while the water supply value maintained a positive surplus before 2015, it crossed the zero-value inflection point for the first time in 2020, turning into a deficit. By 2025, it further plummeted to −0.64 × 10⁹ CNY, resulting in a cumulative loss of 1.55 × 10⁹ CNY.
This significant decline in the water supply function highlights the terrestrial hydrological limitations inherent to island habitats. Unlike inland hinterlands that benefit from exogenous water replenishment or possess space for cross-basin water transfers, an island operates as a self-contained, enclosed hydrological circulation system. As identified in Section 3.1.1, specialized high-yield tropical crops—such as areca nut and modern economic fruit trees—have massively encroached upon the central hilly belt. These crops are physiologically characterized by high transpiration and intensive water consumption. Given the lack of external water replenishment, their rapid spatial proliferation directly disrupted the region’s original hydrological balance loop, thereby exacerbating the deficit of ecological assets in the water resource dimension.
Furthermore, support and cultural services, which are essential for maintaining the spatial homeostasis of the island’s ecosystem, also exhibited a monotonic downward trend during the study period. Specifically, the values of biodiversity protection and soil conservation services decreased by 2.53 × 10⁹ CNY and 2.11 × 10⁹ CNY, respectively. This decline highly coincides temporally with the large-scale logging of traditional fast-growing eucalyptus plantations and the subsequent reconstruction of surface forest stands on the island. Concurrently, the value of cultural services, such as aesthetic landscapes, dropped by 1.14 × 10⁹ CNY. Overall, the evolutionary trajectory of Hainan Island’s ESVs from 2010 to 2025 is characterized by a succession pattern of “severe depletion of core regulatory services, isolated growth in food production, and deep deficits in water supply”. These retrospective ecological assessment results quantitatively corroborate that the polarized outward sprawl of low-elevation coastal urban areas, coupled with the structural reorganization toward high-water-consuming economic crops in the central transition zone, have collectively exerted direct spatial stress on the island’s inherently limited hydrological metabolism and comprehensive ecological carrying capacity.
3.2. Driving Mechanisms and Spatial Thresholds Identification of Construction Land Expansion
To explore the driving mechanisms behind the rapid expansion of built-up land, this study introduced the XGBoost algorithm to attribute land expansion from 2010 to 2025. Concurrently, the SHAP interpretation framework was utilized to quantify the marginal contributions and non-linear spatial response patterns of various driving factors.
3.2.1. Analysis of Global Feature Importance
Based on the XGBoost model training and SHAP global feature importance assessment results (Figure 8), the expansion of built-up land on Hainan Island during the study period was jointly driven by natural ecological backgrounds, socioeconomic elements, and spatial locational factors.
Figure 8.
Global feature importance and distribution of SHAP values.
Among the 12 candidate independent variables, the Normalized Difference Vegetation Index (NDVI), nighttime light intensity (NLight), distance to major roads (D2Road), and distance to coastline (D2Coast) all yielded mean absolute SHAP values exceeding 0.40, marking them as the core driving forces for the spatial expansion of built-up land. In contrast, topographic constraint factors, such as slope, elevation (DEM), and aspect, along with meteorological factors like mean annual temperature (MAT) and mean annual precipitation (MAP), exhibited relatively low mean absolute marginal contributions. The global importance ranking results indicate that at the macro level, urban expansion on Hainan Island demonstrated distinct characteristics of coastal attachment, traffic orientation, and economic agglomeration, while being rigidly repelled by high-quality ecological locations.
As further illustrated in Figure 8, the mean |SHAP| values of these top four factors formed a distinct “natural break” from the remaining variables in the global feature importance ranking. Given that minor variables with low marginal contributions lack robust and statistically meaningful spatial inflection points, this study exclusively selected these four dominant driving factors for the subsequent precise non-linear threshold extraction and Bootstrap confidence interval validation.
3.2.2. Single-Factor Non-Linear Responses and Threshold Characteristics
The SHAP single-factor dependence plots (Figure 9) further quantified the non-linear spatial contribution patterns of the aforementioned four core driving factors to the probability of built-up land expansion. The specific spatial responses and inflection point characteristics are as follows.
Figure 9.
Single-factor SHAP dependence plots of driving factors.
(1) Ecological background constraint (NDVI): NDVI was the primary natural independent variable affecting urban spatial expansion. The response curve indicates that when the regional NDVI was below 0.40, the SHAP value was positive, exerting a positive attraction on built-up land expansion. However, once the regional NDVI crossed the abrupt threshold of 0.40 (95% CI: [0.40, 0.41]), the marginal contribution of SHAP rapidly turned negative and continued to decline. This demonstrates that spatial grids with a vegetation coverage greater than 0.40 constitute a long-term ecological constraint boundary against urban sprawl.
(2) Economic vitality agglomeration effect (NLight): The non-linear response of nighttime light intensity exhibited distinct phased scale characteristics. When the nighttime light index was below 6.89 nW·cm−2·sr−1 (95% CI: [6.81, 6.94] nW·cm−2·sr−1), its pulling effect on newly added urban space was weak, and the SHAP value was negative. Once the light intensity surpassed the critical point of 6.89 nW·cm−2·sr−1, the marginal SHAP output rose rapidly and fluctuated within a high-value range. This reflects the strong dependence of the outward expansion of built-up land on existing economic agglomeration nodes.
(3) Transportation network corridor dependence (D2Road): The distance to major roads displayed a strong spatial distance decay characteristic, with the zero-value inflection point for expansion probability occurring at 271.51 m (95% CI: [271.05, 280.39] m) from the major road. Within the 271 m spatial buffer zone from the major road, the SHAP values of this driving factor were concentrated in the positive range. Beyond this spatial span, the expansion probability dropped below zero, confirming that urban expansion on the island possesses a significant road-dependent sprawl characteristic.
(4) Coastline spatial pulling effect (D2Coast): As a unique spatial constraint variable for island units, the distance to the coastline clearly delineated the physical decay boundary of coastal attraction. In areas closer to the coastline, the expansion probability of built-up land remained in a high-value range. As the space extended inland, its pulling function decreased non-linearly, ultimately reaching a zero-value inflection point at 8460.41 m (approximately 8.46 km, 95% CI: [8.30, 8.60] km) from the sea. The identification of this threshold quantifies the coastal attachment effect, wherein urbanization construction activities on Hainan Island are highly agglomerated within the 8.46 km coastal plain belt.
3.3. Multi-Objective Land Demand Optimization for 2035
3.3.1. Projected Land Use Structure Under Multiple Scenarios
This study projected the quantitative land use structure of the study area in 2035 under the BAU scenario using the built-in Markov model of the PLUS module. Concurrently, the NSGA-II model was employed for multi-objective optimization to derive the land demands for the other three optimization scenarios (EP, ED, and SD). Table 8 presents the land use scales and the comprehensive ecological and economic benefits under each scenario.
Table 8.
Projected land use structure and comprehensive benefits under multiple scenarios in 2035 (unit: area (km2), economic benefit and ESV benefit (109 CNY)).
Under the BAU scenario, compared to 2025, forest is projected to decrease by 1710.05 km2, built-up land will increase by 139.02 km2, and the scale of agricultural land will expand by 1632.38 km2. This structure will lead to a 17.03% growth in economic benefits. However, the ecological benefits of the BAU scenario are projected to decline by 6.62%. Under this scenario, the disorderly expansion of built-up land and agricultural land would exert a significant negative impact on regional ecological functions.
The ED scenario shares similarities with the BAU scenario in terms of development orientation. Under the ED scenario, the expansion of built-up land is projected to be more pronounced, with an expected increase of 217.12 km2 compared to 2025, while agricultural land is controlled and reduced to 11,226.71 km2. The ED scenario will achieve the highest growth in economic benefits, reaching 867.48 × 10⁹ CNY. However, its ecological benefits are relatively low among the three optimization scenarios, indicating that unilaterally elevating economic indicators exerts a spatial squeeze on ecosystem service functions.
Regarding the EP scenario, forest will increase by 2862.90 km2 compared to the BAU scenario, while built-up land will decrease by 126.77 km2. The ecological benefits of the EP scenario are projected to reach the highest level. Nevertheless, due to strict controls on the scale of built-up land, its economic benefits experience a slight negative growth of 0.37% compared to the 2025 baseline. This reflects a trade-off where economic scale is constrained in exchange for ecological protection.
The SD scenario differs from the aforementioned two scenarios. Compared to the BAU scenario, forest and water under the SD scenario are projected to increase by 2661.67 km2 and 106.28 km2, respectively, while agricultural land will shrink by 2842.97 km2. This structural adjustment is expected to allow the ecological benefits of the SD scenario to improve by 11.32% compared to the BAU scenario, with a concurrent economic benefit growth of 4.03%. Relative to the 2025 baseline, this scenario would achieve positive growth in both economic and ecological dimensions, demonstrating that the comprehensive trade-off strategy can effectively coordinate the maintenance of ecological functions with the expansion of economic space.
3.3.2. Projected Ecosystem Service Values
Building upon the optimized projections of land use structure described above, Table 9 and Figure 10 further illustrate the fluctuation and differentiation characteristics of the macroscopic ecosystem service value (ESV) and its secondary functions across the different scenarios.
Table 9.
Projected ecosystem service values under multiple scenarios in 2035 (unit: 109 CNY).
Figure 10.
Comparison of individual ecosystem service values under multiple scenarios in 2035.
Under the BAU scenario, the total ESV of the island will suffer the most severe degradation, with a loss rate reaching 6.62%. Driven by the large-scale expansion of agricultural land, food production will become the only secondary service to achieve growth in this scenario. Consequently, however, the values of climate regulation and hydrological regulation will plummet to the lowest levels among the four scenarios. Due to the structural imbalance between forest and agricultural land, the water supply deficit will further deepen to −1.36 × 10⁹ CNY, building upon historical trends.
The total ESV under the ED scenario is projected to be 162.08 × 10⁹ CNY. Although the high-intensity spatial expansion of urbanization would encroach upon some fragile coastal habitats—causing gas regulation and environmental purification indicators to be slightly lower than those in the other optimization scenarios—the core climate regulation and hydrological regulation values of the island still achieve a systematic, albeit slight, recovery compared to the BAU scenario. This is primarily attributed to the rigid protection enforced by ecological constraint red lines.
The EP scenario is expected to yield the highest gain in ecological assets, with the total ESV steadily increasing by 4.51%. Except for a slight decline in the food production function, all other secondary ecosystem services are projected to reach their peaks. Specifically, the values of climate regulation, hydrological regulation, biodiversity, and soil conservation would be restored to the maximum extent. Simultaneously, the deficit in water supply would be most significantly narrowed.
The SD scenario is projected to demonstrate relatively balanced synergistic characteristics across all ecosystem service levels. The total ESV is expected to reach 163.79 × 10⁹ CNY, essentially approaching the ecological benefit level of the EP scenario. Under this scheme, core ecological functions such as climate regulation, hydrological regulation, and biodiversity protection would all achieve positive growth. Crucially, through the structural reorganization of forest and agricultural land, the water supply deficit would be effectively controlled at −0.125 × 10⁹ CNY. This would not only secure the moderate expansion of urban construction space but also accomplish the holistic restoration of the island’s comprehensive ecological regulation functions.
3.4. Multi-Scenario Spatial Pattern Simulation
Based on the CARS module of the PLUS model, this study mapped the macro land use demands under the four scenarios for 2035 onto micro-spatial grids (Figure 11). Combined with the zoomed-in inset maps of Haikou (Typical Area A), Wuzhishan (Typical Area B), and Sanya (Typical Area C), the spatial evolution of the micro-patches exhibited significant scenario-based disparities.
Figure 11.
Spatial patterns of land use and typical zoomed-in regions under multiple scenarios in 2035.
Under the BAU and ED scenarios, the newly added built-up land is projected to display obvious encroachment upon existing urban nodes, traffic arteries, and peripheral agricultural land and forest spaces. Specifically, the BAU scenario maintained the baseline suitability probabilities, simulating the historical expansion inertia lacking macro-control. This would be manifested not only in the disorderly occupation of peripheral agricultural land by built-up land in Haikou, but also in the expansion of agricultural land along low-elevation valleys and major road networks toward the edges of the central mountainous region, which led to significant fragmentation of the existing forest patches.
Under the ED scenario, because the model amplified the suitability probabilities for the 271 m buffer zone of the major road network and areas with a nighttime light intensity ≥ 6.89 nW·cm−2·sr−1 while also increasing the attraction coefficient (1.15) for the coastal zone within ≤8.46 km from the coastline, the island-wide urban expansion is projected to present significant polarization and traffic orientation. Consequently, the newly added built-up land in Sanya densely agglomerated toward the coastal zone. This indicates that driven by singular market interests, the disorderly expansion of agricultural land and urban spaces would continuously squeeze the central core ecological source areas.
The EP scenario not only applied the transition cost matrix, but also restricted the aforementioned disorderly expansion by imposing strict probability penalties. This scenario applied a strong attenuation coefficient of 0.10 to the core rainforest area with an NDVI ≥ 0.40, and a constraint coefficient of 0.85 to the coastal zone. Under these settings, the island’s urban development boundaries would shrink significantly. The increments of built-up land in Haikou and Sanya would be effectively suppressed, fundamentally blocking the encroachment of urban areas into suburbs and sensitive ecological spaces. However, due to the strict constraints on spatial transition probabilities, the geometric morphology of the newly added patches under this scenario would be excessively dispersed, making it difficult to satisfy the built-up land demand required for the agglomerated development of core industries in the Free Trade Port.
The SD scenario is expected to demonstrate superior intensiveness and rationality in its micro-spatial layout. This scenario accurately responded to the elastic constraints of the exogenous threshold rules. In Haikou, benefiting from the upward adjustment of probabilities for traffic and economic nodes, the urban spatial expansion pattern is projected to shift from historical outward sprawl to “infill” agglomeration. In the southern Sanya economic circle, restricted by the moderate coastal control resistance (a coefficient of 0.95), some inefficient agricultural land within the overloaded coastal carrying belt would be optimized into ecological buffer spaces. This would stabilize the coastal ecological baseline while ensuring the necessary construction demands of the Free Trade Port.
Crucially, in the high-elevation Wuzhishan ecological conservation area in the center, the model applied an elastic probability attenuation (a coefficient of 0.30) to the highly sensitive tropical rainforest with NDVI ≥ 0.40, replacing extreme mask-locking. This would effectively restrict the spread of development activities into the interior of the rainforest, maintaining the integrity of the central forest system. The simulation results indicate that by inputting the thresholds identified through the mechanism interpretation as exogenous rules, the SD scenario can effectively guide the spatial reorganization of the island’s land use patches, achieving a refined layout of development spaces.
4. Discussion
This study constructed an integrated modular planning framework of “mechanism interpretation—macro optimization—micro reconstruction”. This framework systematically revealed the non-linear driving mechanisms of land expansion on Hainan Island and projected spatial trade-off schemes under multiple scenarios. By comparing our local findings with previous international studies, this research broadens the theoretical understanding of human–environment interactions in geographically restricted habitats.
4.1. Chain Transmission Mechanism and Global Coastal Squeeze
A retrospective analysis of Hainan Island’s historical spatiotemporal evolution indicates that because enclosed islands lack external buffer hinterlands and possess rigid physical boundaries, their land transitions are characterized by significant “internal squeezing and chain transmission”. Empirical evidence from other highly restricted coastal environments, such as Zhujiajian Island, corroborates that the lack of spatial buffering under the dual pressures of economic expansion and ecological fragility inevitably accelerates the degradation of ESV [64]. Consequently, establishing rigid land-area thresholds becomes a critical prerequisite for spatial governance.
This spatial cascading substitution diverges fundamentally from the relatively localized land transition patterns typically observed in vast continental regions. Recent global syntheses conceptualize this phenomenon as “coastal squeeze”, wherein the rigid expansion of coastal development triggers inland-spreading ecological degradation [65]. Furthermore, the transition mechanism identified herein—where built-up land encroaches on agricultural land, which subsequently squeezes forest spaces—is consistent with the underlying mechanisms reported in global multi-trophic biodiversity research. These studies emphasize that tropical land-use alterations, particularly the proliferation of economic crops, inflict profound systemic impacts on native rainforest ecosystems [66]. Localized spatiotemporal simulations further confirm that the conversion from forest to cropland constitutes the primary stressor on the island’s ecosystem [67]. By proactively reversing this chain mechanism through the systematic reclamation of inefficient agricultural spaces within the SD scenario, this study provides a quantifiable optimization pathway to mitigate cascading coastal squeeze globally.
4.2. Geographical Mechanisms of Spatial Expansion Thresholds
The non-linear thresholds extracted via the XGBoost-SHAP framework accurately capture the spatial evolution dynamics intrinsic to tropical islands. Specifically, the NDVI threshold of ≥0.40 emerged as a rigid ecological defense baseline that effectively curtails urban sprawl. Recent global systematic reviews on island ecosystem services (IESs) indicate that land-use transitions—frequently surpassing singular climatic variables in impact—serve as the primary indicator for quantifying ecological degradation [35]. By leveraging machine learning to isolate explicit non-linear tipping points, this methodology offers a substantial departure from, and advancement over, conventional global linear models.
From a spatial perspective, the attraction decay threshold located 8.46 km from the coastline precisely defines the “coastward” agglomeration of island urbanization propelled by export-oriented economies. This trajectory extends beyond the Hainan context; it closely parallels the “coastalization” sprawl observed across Mediterranean tourism destinations, a pattern known to exert extreme stress on coupled land–sea ecosystems [30]. By translating conceptual driving mechanisms into quantifiable, data-driven parameters, the identification of these physical boundaries and agglomeration corridors establishes a universal benchmark for delineating precise regulatory redlines in highly polarized coastal environments.
4.3. Decoupling of Land Structure Under Hydrological Constraints
During the study period, the water supply value of Hainan Island shifted into a pronounced deficit after 2020. Diverging from the surface-imperviousness-induced water scarcity typically observed in continental cities, this localized hydrological deficit is driven by the complex interactions between the proliferation of high-transpiration economic crops and the enclosed water cycle of the island. A comprehensive review analyzing island ecosystem services emphasized that deprived of external buffer capacity, internal land-use conflicts within enclosed islands inherently trigger severe supply–demand frictions, culminating in a systemic “trade-off dilemma” between provisioning and regulating services [34].
Recent modeling efforts in ecologically fragile areas further substantiate that land-use structure functions as a non-linear trigger, dictating acute trade-offs in core hydrological services [68]. Our simulations confirm that the Sustainable Development (SD) scenario provides a viable pathway to decouple this structural conflict. By systemically curtailing inefficient agricultural spaces by 10.00% at the macro level and reallocating them as water conservation forests, this spatial strategy effectively neutralizes the water deficit. Ultimately, it demonstrates that resolving hydrological constraints via structural land optimization offers a robust paradigm for maintaining the metabolic balance of vulnerable ecosystems.
4.4. Global Implications for Island Spatial Governance
Elevating local optimization outcomes to a global context, this study introduces a resilient spatial governance paradigm designed to mitigate the acute spatial conflicts prevalent in enclosed islands worldwide. Multi-scenario simulations of SIDSs demonstrate that a unilateral pursuit of economic expansion within resource-constrained coastal zones invariably precipitates the collapse of ecological carrying capacity [69]. The contrast between our ED and SD scenarios directly echoes this dynamic. Recent optimization models applied to coastal zones suggest that integrating systemic constraints with Pareto optimal strategies to strictly enforce ecological redlines remains the viable trajectory for regional synergy [70]. By framing ESVs and macroeconomic output as dual objectives, the proposed framework mathematically operationalizes this “Pareto optimal” state. This effectively bridges a prominent theoretical gap in tropical island sustainability discourse, where such optimality is frequently advocated yet rarely quantified in explicit spatial configurations [71].
Furthermore, during the micro-reconstruction phase, the SD scenario innovatively substitutes traditional absolute rigid conservation with an elastic probability attenuation approach for core rainforests. This flexible zoning strategy reflects contemporary conservation imperatives extending beyond statutory protected areas. For instance, integrated spatial planning in Okinawa, Japan, highlights the necessity of flexible ecological network governance outside protected areas, as one-size-fits-all rigid lines fail to accommodate the elastic development needs within extremely scarce island land resources [26]. Our data-driven threshold intervention proves that refined and elastic spatial governance effectively balances the strict preservation of the central green core with marginal infrastructural flexibility.
Finally, transforming these simulations into actual governance requires confronting the socio-economic reality of the “agriculture–ecology–economy” triad. Studies examining a half-century of adaptive governance in global estuarine and coastal cities demonstrate that transitioning toward a service- and energy-oriented economy inherently drives built-up land to swallow high-quality agricultural space, displacing farmers’ livelihoods [72]. Facing similar coastal squeeze in hubs like Sanya and Haikou, our SD policy recommendations—advocating for coastal “infill renewals” over peripheral sprawl, coupled with establishing cross-regional lateral ecological compensation for central mountainous farmers—align with the most resilient global adaptive practices. Such strategies not only respond specifically to the Hainan Free Trade Port’s mandate but also furnish an actionable, equitable governance blueprint for other coastal hubs wrestling with industrial transformation and agrological displacement.
4.5. Comprehensive Sensitivity and Robustness Validation
To evaluate the reliability of the analytical framework, a two-part sensitivity analysis was conducted to assess the stability of the ecosystem service valuation and the robustness of the NSGA-II multi-objective optimization outcomes.
First, a standard coefficient of sensitivity method was employed for the ecological accounting. The applied value coefficients for each land-use type were adjusted by ±50%. The calculation results confirmed that all sensitivity values across the EP, ED, SD, and BAU scenarios were less than 1 (Table 10). Minor land types exhibited negligible sensitivity near zero. This demonstrates that the total ecosystem service value is highly inelastic with respect to the applied value coefficients, ensuring a reliable accounting foundation for the projections.
Table 10.
Sensitivity of total ecosystem service values to ±50% adjustments in value coefficients across four scenarios.
Building upon this baseline, a one-at-a-time perturbation test was executed on the core inputs of the NSGA-II optimization framework to verify the structural stability of the macro-level spatial allocation. Specifically, we assessed how the land-use demand outcomes for the Sustainable Development scenario responded to plausible uncertainties in the fundamental economic and ecological valuation parameters. The baseline parameters were perturbed by ±10%, yielding two alternative stress tests. Perturbation A featured a 10% increase in economic coefficients alongside a 10% decrease in ecological coefficients, while Perturbation B applied a 10% decrease in economic coefficients with a 10% increase in ecological coefficients.
The optimization outputs demonstrated significant resilience. Under both extreme perturbation schemes, the area allocations for primary land-use types exhibited negligible fluctuations (Table 11). The area alterations for agricultural land, forest, water, and grassland remained bounded within a ±0.30% margin. For instance, the variation for grassland peaked at 0.28% under Perturbation B, and forest shifted by a mere 0.03%. Similarly, the optimal allocation for built-up land varied by only −0.14% to 0.23% across the stressed conditions. These findings prove that while the coupled optimization model is dynamically responsive to parameter adjustments, the macroscopic Pareto-optimal trade-off solution is highly robust. The spatial homeostasis of the island is fundamentally driven by the accurate extraction of non-linear physical constraints and objective planning mandates, rather than being an artifact of subjective parameter settings.
Table 11.
Sensitivity of NSGA-II spatial allocation to ±10% valuation parameter perturbations under the SD scenario (unit: km2).
4.6. Limitations and Future Prospects
This study still has certain limitations. First, constrained by the resolution of regional-scale spatial data, the existing classification system struggles to accurately distinguish sub-categories within forest and agricultural land spaces (e.g., natural secondary forests versus high-water-consuming economic forests, or general orchards versus areca nut plantations). To some extent, this limits the model’s ability to precisely capture micro-parcel evolution and its localized hydrological effects. Second, micro-socioeconomic factors, such as farmers’ willingness for land transfer and dynamic industrial policies, have not yet been fully internalized into the spatial driving force indicator system. Future studies could attempt to incorporate high-resolution, finely interpreted land cover data and couple the current framework with multi-entity decision-making models, such as multi-agent systems, to further enhance the micro-level explanatory power and scientific reliability of island spatial reconstruction simulations.
5. Conclusions
Based on the unique resource constraints of tropical islands, this study constructed an integrated modular spatial planning framework of “mechanism interpretation—macro optimization—micro reconstruction”. This framework reveals the deep geographical patterns of land use change under the construction of the Hainan Free Trade Port. The main conclusions are as follows.
(1) Land evolution in an enclosed environment exhibits a significant, systemic chain transmission effect. Driven by this effect, over the past 15 years, the island’s total ESV experienced a substantial loss of 21.93 × 10⁹ CNY, and core regulatory services, especially climate and hydrological regulation, underwent phased degradation. Mechanistically, constrained by the lack of an external buffer hinterland, the continuous outward sprawl of built-up land in low-elevation coastal zones occupied massive amounts of peri-urban agricultural land. This forced agricultural land to shift inland toward higher-elevation concentric zones, thereby indirectly leading to the shrinkage of central forest areas. This internal spatial cascading substitution of “built-up land occupying agricultural land, and agricultural land squeezing forest”, coupled with the complex interactions between the expansion of high-water-consuming tropical economic crops and the island’s enclosed water cycle, constitutes the core mechanism behind this massive decline in total ESV.
(2) The reconstruction of the island’s spatial pattern exhibits clear dual thresholds: natural constraints and economic pulling. The marginal effect analysis based on the XGBoost-SHAP model indicates that the NDVI threshold of ≥0.40—serving as the interface between high-canopy natural rainforests and complex terrains—constitutes a rigid ecological defense baseline restricting disorderly urban sprawl. Concurrently, the spatial inflection points at approximately 8.46 km from the coastline and 271 m from major roads precisely delineate the “coastward” and “traffic-oriented” agglomeration boundaries of built-up land driven by an export-oriented economy. The identification of these quantified thresholds provides a robust scientific basis for implementing refined spatial governance.
(3) A comprehensive trade-off pathway centered on “revitalizing stock land and cross-regional resilient reorganization” can effectively resolve multidimensional spatial conflicts. Multi-scenario projections toward 2035 demonstrate that continuing the traditional, extensive outward development will further exacerbate the risks of spatial structural imbalance and ecological degradation on the island. In contrast, the SD scenario would proactively reduce inefficient agricultural land spaces by 10.00% at the macro level and systematically convert them into ecological conservation forests. At the micro-spatial level, it would strictly implement the identified threshold controls and “infill” urban agglomeration, establishing a refined spatial pattern characterized by “intensive coastal carrying capacity and central ecological conservation”. By integrating ESVs as the core quantitative constraint for ecological security, this pathway is projected to effectively curb the disorderly encroachment of urban and agricultural spaces upon core rainforest habitats. Ultimately, it achieves a Pareto-optimal synergy between island-wide socioeconomic development and the holistic restoration of total ESV.
In summary, this study not only provides strong methodological support for the refined layout of multi-objective territorial spatial planning in the Hainan Free Trade Port, but also offers significant methodological references and policy implications for other vulnerable islands globally that face high-intensity development stress and are constrained by land classification bottlenecks. Specifically, the mechanisms revealed herein—such as the spatial cascading substitution indicative of global “coastal squeeze”, the extraction of data-driven non-linear boundaries, and the resilient decoupling strategies for hydrological constraints—transcend localized policymaking. They establish a universally applicable and mathematically operationalized governance blueprint for SIDSs and globally vulnerable coastal habitats navigating the complex trade-offs between intensive anthropogenic development and ecological homeostasis.
Author Contributions
Conceptualization, Y.F. and J.Z.; methodology, Y.F.; software, Y.F.; validation, Y.F.; formal analysis, Y.F. and J.Z.; investigation, Y.F.; resources, Y.F.; data curation, Y.F.; writing—original draft preparation, Y.F.; writing—review and editing, Y.F., J.Z., Y.C. (Yeqing Cheng) and Y.C. (Yan Chen); visualization, Y.F.; supervision, Y.F., J.Z., Y.C. (Yeqing Cheng) and Y.C. (Yan Chen); project administration, Y.F. and J.Z.; funding acquisition, J.Z. All authors have read and agreed to the published version of the manuscript.
Funding
This study was funded by the National Natural Science Foundation of China (Grant No. 42261054, 42571263 & 42301279).
Data Availability Statement
The data used to support the findings of this study are available from the corresponding author upon request.
Acknowledgments
We thank the anonymous reviewers and all the editors who participated in the revision process.
Conflicts of Interest
The authors declare no conflicts of interest.
References
- Winkler, K.; Fuchs, R.; Rounsevell, M.; Herold, M. Global Land Use Changes Are Four Times Greater Than Previously Estimated. Nat. Commun. 2021, 12, 2501. [Google Scholar] [CrossRef] [Scilit] [PubMed]
- Foley, J.A.; DeFries, R.; Asner, G.P.; Barford, C.; Bonan, G.; Carpenter, S.R.; Chapin, F.S.; Coe, M.T.; Daily, G.C.; Gibbs, H.K.; et al. Global Consequences of Land Use. Science 2005, 309, 570–574. [Google Scholar] [CrossRef] [Scilit] [PubMed]
- Wu, T.; An, M.; Zhang, L.; Wu, X.; Li, M. Modeling Urban Expansion and Its Impacts on Carbon Storage through Integrative Scenario Analysis for Sustainable Development in the Changchun-Jilin-Tumen region. Sustain. Cities Soc. 2024, 117, 105970. [Google Scholar] [CrossRef] [Scilit]
- Zong, S.; Xu, S.; Ke, Q.; Jiang, X. Spatio-Temporal Evolution Patterns and Type Differentiation of Potential Land Use Conflicts in China. J. Geogr. Sci. 2026, 36, 321–340. [Google Scholar] [CrossRef] [Scilit]
- Costanza, R.; de Groot, R.; Sutton, P.; van der Ploeg, S.; Anderson, S.J.; Kubiszewski, I.; Farber, S.; Turner, R.K. Changes in the Global Value of Ecosystem Services. Glob. Environ. Change 2014, 26, 152–158. [Google Scholar] [CrossRef] [Scilit]
- Haddad, N.M.; Brudvig, L.A.; Clobert, J.; Davies, K.F.; Gonzalez, A.; Holt, R.D.; Lovejoy, T.E.; Sexton, J.O.; Austin, M.P.; Collins, C.D.; et al. Habitat Fragmentation and Its Lasting Impact on Earth’s Ecosystems. Sci. Adv. 2015, 1, e1500052. [Google Scholar] [CrossRef] [Scilit] [PubMed]
- Duan, J.; Shi, P.; Yang, Y.; Wang, D. Spatiotemporal Change Analysis and Multi-Scenario Modeling of Ecosystem Service Values: A Case Study of the Beijing-Tianjin-Hebei Urban Agglomeration, China. Land 2024, 13, 1791. [Google Scholar] [CrossRef] [Scilit]
- Huang, A.; Wang, Y.; Xiang, Y.; Xu, Y.; Tian, L.; Zhou, G.; Zhuang, Y.; Zhu, L. A Comprehensive Framework for Assessing Spatial Conflicts Risk: A Case Study of Production-Living-Ecological Spaces Based on Social-Ecological System Framework. Habitat Int. 2024, 154, 103218. [Google Scholar] [CrossRef] [Scilit]
- Li, X.; Chen, D.; Yang, C.; Cao, J. Optimization of Ecosystem Services Trade-Offs Based on Nsga-Iii and Topsis: A Case Study of the Lower Yellow River Region, China. Ecol. Indic. 2025, 173, 113379. [Google Scholar] [CrossRef] [Scilit]
- Luan, C.; Liu, R.; Zhang, Q.; Sun, J.; Liu, J. Multi-Objective Land Use Optimization Based on Integrated Nsga–Ii–Plus Model: Comprehensive Consideration of Economic Development and Ecosystem Services Value Enhancement. J. Clean. Prod. 2024, 434, 140306. [Google Scholar] [CrossRef] [Scilit]
- Estoque, R.C.; Wu, J.; Verburg, P.H. Land System Science for Global Environmental Change and Sustainability: Advances, Challenges, and Future Directions. Geogr. Sustain. 2026, 7, 100415. [Google Scholar] [CrossRef] [Scilit]
- Mohammadyari, F.; Mousazadeh, R.; Badamfirooz, J.; Zarandian, A.; Alemohammad, S.; Ramezani Mehrian, M. Enhancing Conservation Efficiency: Integrating Habitat Quality Modeling and Ecosystem Service Valuation for Strategic Protected Area Management. Int. J. Environ. Sci. Technol. 2026, 23, 380. [Google Scholar] [CrossRef] [Scilit]
- Garrido Mateos, L.; Rodríguez-López, F.; Sánchez-Macías, J.I. The Three-Stage Evolution in the Economic Valuation of Nature: Externalities, Ecosystem Services, and Natural Capital Accountability. J. Clean. Prod. 2025, 518, 145899. [Google Scholar] [CrossRef] [Scilit]
- Li, F.; Wang, F.; Liu, H.; Huang, K.; Yu, Y.; Huang, B. A Comparative Analysis of Ecosystem Service Valuation Methods: Taking Beijing, China as a Case. Ecol. Indic. 2023, 154, 110872. [Google Scholar] [CrossRef] [Scilit]
- Wu, Q.; Cao, Y.; Su, D.; Su, M. Bridging Ecosystem Service Supply-Demand Imbalances and Land Use Planning: A Mechanism Analysis and Threshold-Based Optimization Framework. Appl. Geogr. 2026, 190, 103978. [Google Scholar] [CrossRef] [Scilit]
- Xie, G.; Zhang, C.; Zhen, L.; Zhang, L. Dynamic Changes in the Value of China’s Ecosystem Services. Ecosyst. Serv. 2017, 26, 146–154. [Google Scholar] [CrossRef] [Scilit]
- Sun, X.; He, S.; Chen, S.; Li, W.; Jin, Y.; Sun, X.; Tang, B. Accounting for the Value of Ecosystem Assets: From Value Judgments to Management Needs—Take Yancheng City as an Example. Mar. Dev. 2024, 2, 15. [Google Scholar] [CrossRef] [Scilit]
- Lu, J.; Liu, X.; Zhu, D.; Zhang, S. Unveiling Multiscale and Nonlinear Effects of Land Use Change Drivers through Interpretable Machine Learning Model: Insights from “Ecological-Cost and Economic-Benefit” Trade-Off Perspective. Environ. Impact Assess. Rev. 2026, 118, 108254. [Google Scholar] [CrossRef] [Scilit]
- Feng, Y.; Zhang, W.; Yu, J.; Zhuo, R. Exploring Nonlinear Land Use Drivers and Multi-Scenario Strategies for Ecological Impact Mitigation: A Case Study of the Hohhot-Baotou-Ordos Area, Inner Mongolia, China. Cities 2025, 162, 105935. [Google Scholar] [CrossRef] [Scilit]
- Goldstein, J.H.; Caldarone, G.; Duarte, T.K.; Ennaanay, D.; Hannahs, N.; Mendoza, G.; Polasky, S.; Wolny, S.; Daily, G.C. Integrating Ecosystem-Service Tradeoffs into Land-Use Decisions. Proc. Natl. Acad. Sci. USA 2012, 109, 7565–7570. [Google Scholar] [CrossRef] [Scilit] [PubMed]
- Rahman, M.M.; Szabó, G. Multi-Objective Urban Land Use Optimization Using Spatial Data: A Systematic Review. Sustain. Cities Soc. 2021, 74, 103214. [Google Scholar] [CrossRef] [Scilit]
- Li, X.; Lu, Z. Exploring the Balance Between Ecosystem Services and Economic Benefits Via Multi-Objective Land Use Optimization. Land 2025, 14, 920. [Google Scholar] [CrossRef] [Scilit]
- Liang, X.; Guan, Q.; Clarke, K.C.; Liu, S.; Wang, B.; Yao, Y. Understanding the Drivers of Sustainable Land Expansion Using a Patch-Generating Land Use Simulation (Plus) Model: A Case Study in Wuhan, China. Comput. Environ. Urban Syst. 2021, 85, 101569. [Google Scholar] [CrossRef] [Scilit]
- Chi, Y.; Liu, D.; Wang, C.; Xing, W.; Gao, J. Island Development Suitability Evaluation for Supporting the Spatial Planning in Archipelagic Areas. Sci. Total Environ. 2022, 829, 154679. [Google Scholar] [CrossRef] [Scilit] [PubMed]
- Yang, M.; Luo, J.; Zhu, L.; Lu, P. Impact of Land Use Change on the Spatiotemporal Evolution of Ecosystem Services in Tropical Islands: A Case Study of Hainan Island, China. Land 2024, 13, 1244. [Google Scholar] [CrossRef] [Scilit]
- Kim, J.; Tanaka, T. Beyond protected areas: Optimizing Conservation Planning through Integrated Ecosystem Services and Connectivity Assessment in Okinawa, Japan. Landsc. Urban Plan. 2026, 269, 105580. [Google Scholar] [CrossRef] [Scilit]
- Zhang, H.; Xiao, Y.; Deng, Y. Island Ecosystem Evaluation and Sustainable Development Strategies: A Case Study of the Zhoushan Archipelago. Glob. Ecol. Conserv. 2021, 28, e01603. [Google Scholar] [CrossRef] [Scilit]
- Chi, Y.; Liu, D.; Zhang, M. Island Carrying Capacity for Three Development Types: Ecological Resource, Agricultural Production, and Urban Construction. Heliyon 2022, 8, e12232. [Google Scholar] [CrossRef] [Scilit] [PubMed]
- Day, J. Tourism, Hospitality, and Environmental Sustainability on the Small Island Developing States. Curr. Opin. Environ. Sustain. 2022, 59, 101233. [Google Scholar] [CrossRef] [Scilit]
- Lagarias, A.; Stratigea, A. Coastalization Patterns in the Mediterranean: A Spatiotemporal Analysis of Coastal Urban Sprawl in Tourism Destination Areas. GeoJournal 2023, 88, 2529–2552. [Google Scholar] [CrossRef] [Scilit]
- Liu, Y.; Zeng, H. Coastal Squeeze and Multi-Scenario Risk Assessment in China, 1985–2024. Environ. Impact Assess. Rev. 2026, 118, 108248. [Google Scholar] [CrossRef] [Scilit]
- Xin, S.; Chen, N.; Li, Z. Enhancing Ecosystem Services and Socio-Ecological System Coupling Coordination through Lulc Optimization. Ecol. Indic. 2025, 179, 114160. [Google Scholar] [CrossRef] [Scilit]
- Luo, X.; Le, F.; Zhang, Y.; Zhang, H.; Zhai, J.; Luo, Y. Multi-Scenario Analysis and Optimization Strategy of Ecological Security Pattern in the Weihe River Basin. J. Environ. Manag. 2024, 366, 121813. [Google Scholar] [CrossRef] [Scilit] [PubMed]
- Balzan, M.V.; Potschin-Young, M.; Haines-Young, R. Island Ecosystem Services: Insights from a Literature Review on Case-Study Island Ecosystem Services and Future Prospects. Int. J. Biodivers. Sci. Ecosyst. Serv. Manag. 2018, 14, 71–90. [Google Scholar] [CrossRef] [Scilit]
- Moustakas, A.; Zemah-Shamir, S.; Tase, M.; Zotos, S.; Demirel, N.; Zoumides, C.; Christoforidi, I.; Dindaroglu, T.; Albayrak, T.; Ayhan, C.K.; et al. Climate Land Use and Other Drivers’ Impacts on Island Ecosystem Services: A Global Review. Sci. Total Environ. 2025, 973, 179147. [Google Scholar] [CrossRef] [Scilit] [PubMed]
- Wang, J.; Bretz, M.; Dewan, M.A.A.; Delavar, M.A. Machine Learning in Modelling Land-Use and Land Cover-Change (Lulcc): Current Status, Challenges and Prospects. Sci. Total Environ. 2022, 822, 153559. [Google Scholar] [CrossRef] [Scilit] [PubMed]
- Li, C.; Wang, C.; Sun, T.; Lin, T.; Liu, J.; Yu, W.; Wang, H.; Nie, L. Machine Learning in Land Use Prediction: A Comprehensive Review of Performance, Challenges, and Planning Applications. Buildings 2025, 15, 3551. [Google Scholar] [CrossRef] [Scilit]
- Froese, R.; Andrino, A.; Giudice, R.; Stuch, B.; Kilian Salas, S.; Böhner, J.; Boy, D.; Boy, J.; Brown, F.; Díaz García, E.; et al. Describing Complex Interactions of Social-Ecological Systems for Tipping Point Assessments: An Analytical Framework. Front. Clim. 2023, 5, 1145942. [Google Scholar] [CrossRef] [Scilit]
- Wang, J.; Chen, T. A Multi-Scenario Land Expansion Simulation Method from Ecosystem Services Perspective of Coastal Urban Agglomeration: A Case Study of Ghm-Gba, China. Land 2022, 11, 1934. [Google Scholar] [CrossRef] [Scilit]
- Hainan Provincial Bureau of Statistics. The Statistical Yearbook of Hainan 2025. Available online: https://stats.hainan.gov.cn/ (accessed on 15 May 2026).
- Yang, J.; Huang, X. The 30 M Annual Land Cover Datasets and Its Dynamics in China from 1985 to 2025. In Earth System Science Data, version 1.0.5; Zenodo: Genève, Switzerland, 2026; Volume 13. [Google Scholar] [CrossRef]
- Xu, X.; Li, D.; Liu, H.; Zhao, G.; Cui, B.; Yi, Y.; Yang, W.; Du, J. Comparative Validation and Misclassification Diagnosis of 30-Meter Land Cover Datasets in China. Remote Sens. 2024, 16, 4330. [Google Scholar] [CrossRef] [Scilit]
- Liu, X.; Liao, J.; Jing, R.; Ye, H.; Teng, L. Extraction of Rubber Plantations on Hainan Island, China, Using Multi-Source Remote Sensing Images During 2021–2025. Forests 2025, 16, 1773. [Google Scholar] [CrossRef] [Scilit]
- Li, J.; Yang, G.; Yang, H.; Xu, W.; Feng, H.; Xu, B.; Chen, R.; Zhang, C.; Wang, H. Orchard Classification Based on Super-Pixels and Deep Learning with Sparse Optical Images. Comput. Electron. Agric. 2023, 215, 108379. [Google Scholar] [CrossRef] [Scilit]
- Brander, L.M.; de Groot, R.; Schägner, J.P.; Guisado-Goñi, V.; van ’t Hoff, V.; Solomonides, S.; McVittie, A.; Eppink, F.; Sposato, M.; Do, L.; et al. Economic Values for Ecosystem Services: A Global Synthesis and Way Forward. Ecosyst. Serv. 2024, 66, 101606. [Google Scholar] [CrossRef] [Scilit]
- Wittmer, H.; Van Zyl, H.; Brown, C.; Rode, J.; Ozdemiroglu, E.; Ten Brink, P.; Seidl, A.; Kettunen, M.; Mazza, L.; Renner, I.; et al. Guidance Manual for TEEB (The Economics of Ecosystems and Biodiversity) Country Studies, version 1.0; Institute for European Enviornmental Policy: Brussels, Belgium, 2013.
- Lei, J.; Zhou, J.; He, R.; Lin, W.; Chen, Y.; Zhong, Y.; Wang, Y.; Chen, Z. Temporal-Spatial Evolution of Ecosystem Service Value in the “Three-Space” System and Its Driving Factors in Northern Hainan. Ecol. Environ. Sci. 2025, 34, 1317–1328. [Google Scholar]
- Lei, J.; Chen, Z.; Chen, X.; Li, Y.; Wu, T. Spatio-Temporal Changes of Land Use and Ecosystem Services Value in Hainan Island from 1980 to 2018. Acta Ecol. Sin. 2020, 40, 4760–4773. [Google Scholar]
- Lei, J.; Chen, Z.; Wu, T.; Li, Y.; Yang, Q.; Chen, X. Spatial Autocorrelation Pattern Analysis of Land Use and the Value of Ecosystem Services in Northeast Hainan Island. Acta Ecol. Sin. 2019, 39, 2366–2377. [Google Scholar] [CrossRef] [Scilit]
- Kreuter, U.P.; Harris, H.G.; Matlock, M.D.; Lacey, R.E. Change in Ecosystem Service Values in the San Antonio area, Texas. Ecol. Econ. 2001, 39, 333–346. [Google Scholar] [CrossRef] [Scilit]
- Liu, J.; Hou, Y.; Li, F.; Zheng, B.; Chen, Z.; Zheng, F.; Zhang, X.; Yu, R. Land Use Change Projection and Driving Factors Exploration in Hainan Island Based on the Plus Model. Front. Mar. Sci. 2025, 12, 1534508. [Google Scholar] [CrossRef] [Scilit]
- Han, Y.; Zhu, J.; Wei, D.; Wang, F. Spatial-Temporal Effect of Sea–Land Gradient on Land Use Change in Coastal Zone: A Case Study of Dalian City. Land 2022, 11, 1302. [Google Scholar] [CrossRef] [Scilit]
- Zhang, F.; Feng, Y.; Liao, Z.; Wu, X.; Pan, K.; Tan, X.; Xiong, Q.; Tang, T.; Zhang, X.; Yu, C.; et al. The Effect of Ecological Factors on Fagaceae Species Richness in Sichuan-Chongqing Region, China. Chin. J. Appl. Environ. Biol. 2020, 26, 689–696. [Google Scholar]
- James, G.; Witten, D.; Hastie, T.; Tibshirani, R. An Introduction to Statistical Learning: With Applications in R; Springer: New York, NY, USA, 2021; Volume 2. [Google Scholar]
- Chen, T.; Guestrin, C. XGBoost: A Scalable Tree Boosting System. In Proceedings of the 22nd ACM SIGKDD International Conference on Knowledge Discovery and Data Mining, San Francisco, CA, USA, 13–17 August 2016; pp. 785–794. [Google Scholar]
- Lundberg, S.M.; Lee, S.-I. A Unified Approach to Interpreting Model Predictions. In Proceedings of the 31st International Conference on Neural Information Processing Systems, Long Beach, CA, USA, 4–9 December 2017; pp. 4768–4777. [Google Scholar]
- Deb, K.; Pratap, A.; Agarwal, S.; Meyarivan, T. A Fast and Elitist Multiobjective Genetic Algorithm: Nsga-Ii. IEEE Trans. Evol. Comput. 2002, 6, 182–197. [Google Scholar] [CrossRef] [Scilit]
- Zhang, Z.; Li, J. Spatial Suitability and Multi-Scenarios for Land Use: Simulation and Policy Insights from the Production-Living-Ecological Perspective. Land Use Policy 2022, 119, 106219. [Google Scholar] [CrossRef] [Scilit]
- Department of Natural Resources and Planning of Hainan Province. Territorial Spatial Planning of Hainan Province (2021–2035). Available online: https://lr.hainan.gov.cn/xxgk_317/0200/0202/202404/t20240424_3652621.html (accessed on 15 May 2026).
- Li, C.; Wu, Y.; Gao, B.; Zheng, K.; Wu, Y.; Li, C. Multi-Scenario Simulation of Ecosystem Service Value for Optimization of Land Use in the Sichuan-Yunnan Ecological Barrier, China. Ecol. Indic. 2021, 132, 108328. [Google Scholar] [CrossRef] [Scilit]
- Fu, Q.; Hou, Y.; Wang, B.; Bi, X.; Li, B.; Zhang, X. Scenario Analysis of Ecosystem Service Changes and Interactions in a Mountain-Oasis-Desert System: A Case Study in Altay Prefecture, China. Sci. Rep. 2018, 8, 12939. [Google Scholar] [CrossRef] [Scilit] [PubMed]
- Liu, X.; Liang, X.; Li, X.; Xu, X.; Ou, J.; Chen, Y.; Li, S.; Wang, S.; Pei, F. A Future Land Use Simulation Model (Flus) for Simulating Multiple Land Use Scenarios by Coupling Human and Natural Effects. Landsc. Urban Plan. 2017, 168, 94–116. [Google Scholar] [CrossRef] [Scilit]
- Pontius, R.G., Jr.; Millones, M. Death to Kappa: Birth of Quantity Disagreement and Allocation Disagreement for Accuracy Assessment. Int. J. Remote Sens. 2011, 32, 4407–4429. [Google Scholar] [CrossRef] [Scilit]
- Xie, Z.; Li, X.; Chi, Y.; Jiang, D.; Zhang, Y.; Ma, Y.; Chen, S. Ecosystem Service Value Decreases More Rapidly Under the Dual Pressures of Land Use Change and Ecological Vulnerability: A Case Study in Zhujiajian Island. Ocean Coast. Manag. 2021, 201, 105493. [Google Scholar] [CrossRef] [Scilit]
- Li, C.; Fang, S. Coastal Land Use Transitions and Their Cascading Impacts on Ecosystem Resilience: A Global Bibliometric Review. Reg. Ecol. Manag. 2026, 1, 7. [Google Scholar] [CrossRef] [Scilit]
- Barnes, A.D.; Allen, K.; Kreft, H.; Corre, M.D.; Jochum, M.; Veldkamp, E.; Clough, Y.; Daniel, R.; Darras, K.; Denmead, L.H.; et al. Direct and Cascading Impacts of Tropical Land-Use Change on Multi-Trophic Biodiversity. Nat. Ecol. Evol. 2017, 1, 1511–1519. [Google Scholar] [CrossRef] [Scilit] [PubMed]
- Chen, J.; Huang, X.; Wang, Y.; Chen, Z.; Feng, X. Spatiotemporal Dynamics of Ecosystem Services Under Land Use and Climate Change Scenarios on Hainan Island, China. ISPRS Int. J. Geo-Inf. 2026, 15, 291. [Google Scholar] [CrossRef] [Scilit]
- Du, P.; Huai, H.; Wu, X.; Wang, H.; Liu, W.; Tang, X. Using Xgboost-Shap for Understanding the Ecosystem Services Trade-Off Effects and Driving Mechanisms in Ecologically Fragile Areas. Front. Plant Sci. 2025, 16, 1552818. [Google Scholar] [CrossRef] [Scilit] [PubMed]
- Pantaleón, N.; Camilo, A.E.; Blanco, M.R.; Zavala, M.A.; Gómez Sal, A. Evaluating Sustainability Scenarios in Coastal Zones of Small Island Developing States (Sids): A Case Study of the Dominican Republic. Ambio 2026, 55, 2233–2249. [Google Scholar] [CrossRef] [Scilit] [PubMed]
- Chen, J.; Jiang, Y.; Yu, W.; Yang, G. Coupling System Dynamics and Mixed Cellular Automata for Carbon-Economic Optimization in Coastal Zones: A Multi-Scenario Simulation under Ssp-Rcps. Land 2026, 15, 648. [Google Scholar] [CrossRef] [Scilit]
- Han, N.; Zhang, Y. Trade-Offs and Synergies Analysis of Ecosystem Services and Simulation in Tropical Islands: A Case Study of Hainan Island, China. Pol. J. Environ. Stud. 2024, 33, 671–683. [Google Scholar] [CrossRef] [Scilit] [PubMed]
- Jiang, C.; Liao, M.; Wang, Y.; Zhang, H.; Guan, Y.; Cheng, S.; Hu, Y. Half a Century of Adaptive Governance on Marginal and Degraded Lands Sustains Agriculture-Ecology-Economy Co-Benefits in an Estuarine Delta Energy City of China. Front. Environ. Sci. 2026, 14, 1800845. [Google Scholar] [CrossRef] [Scilit]
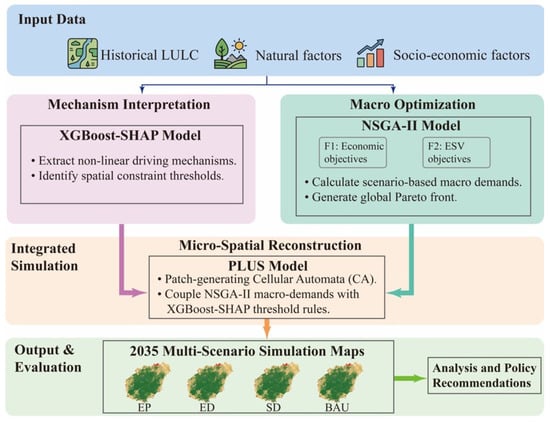
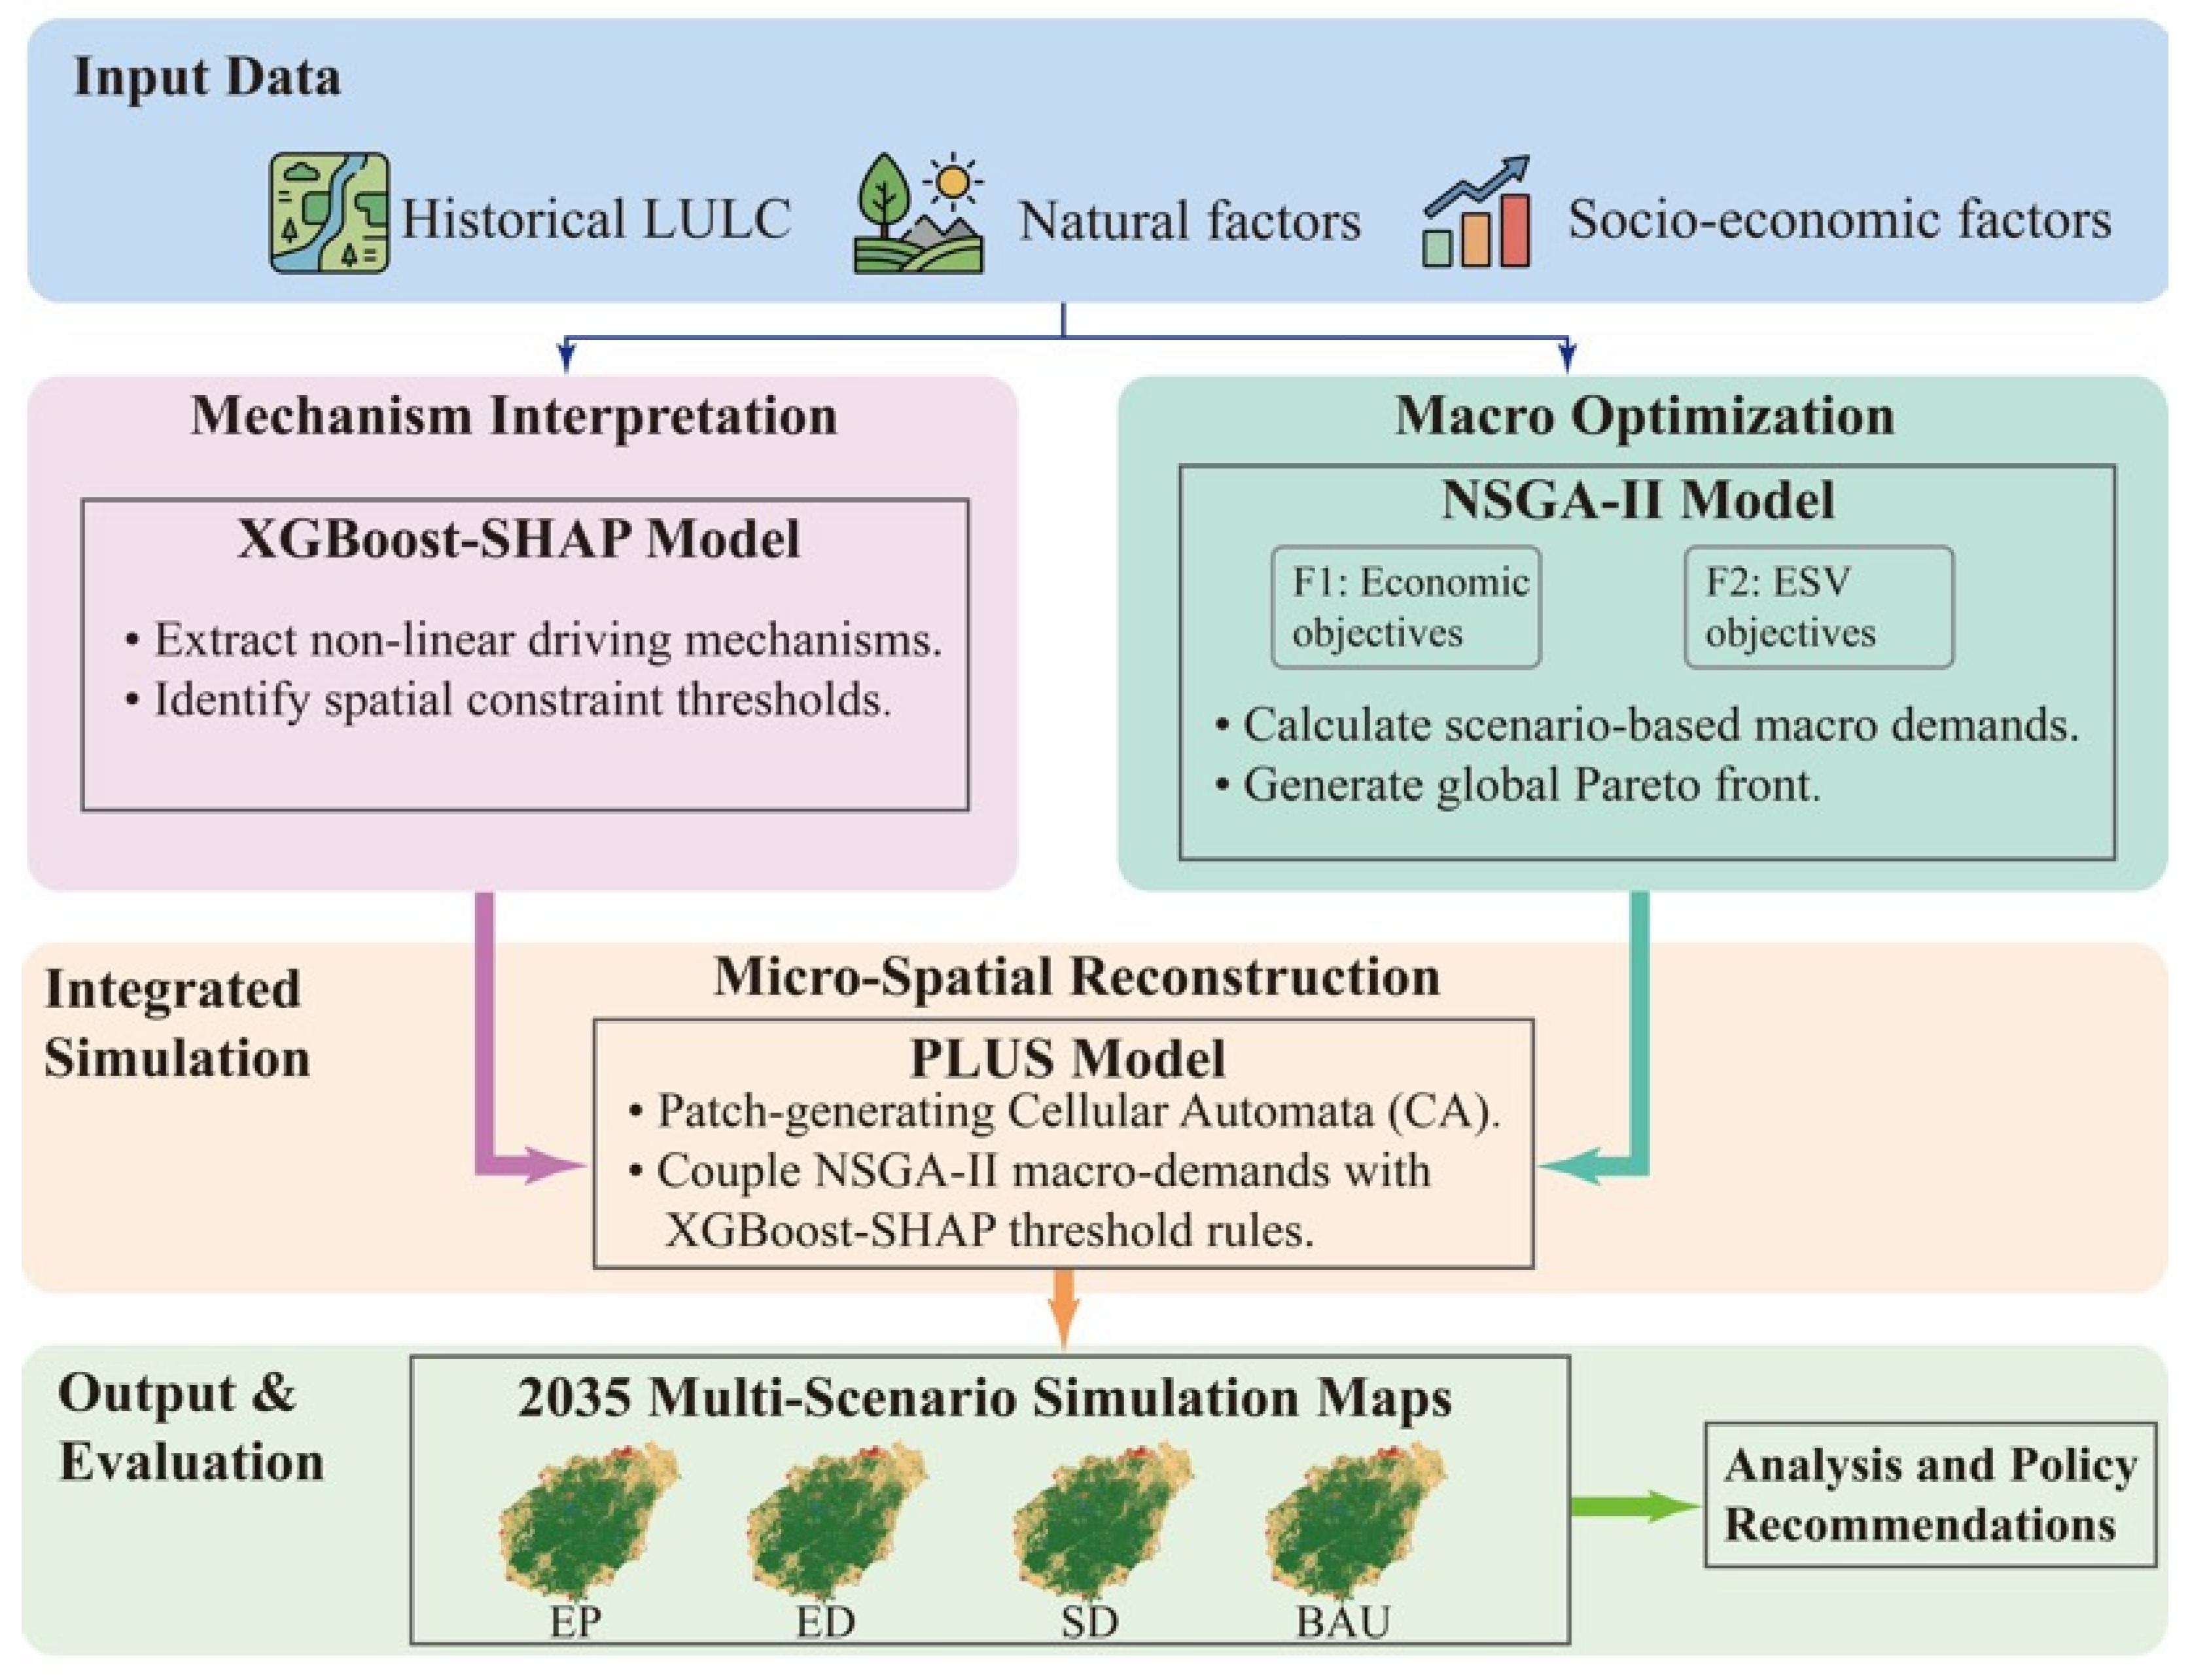
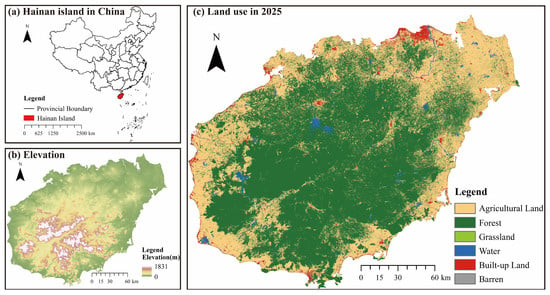
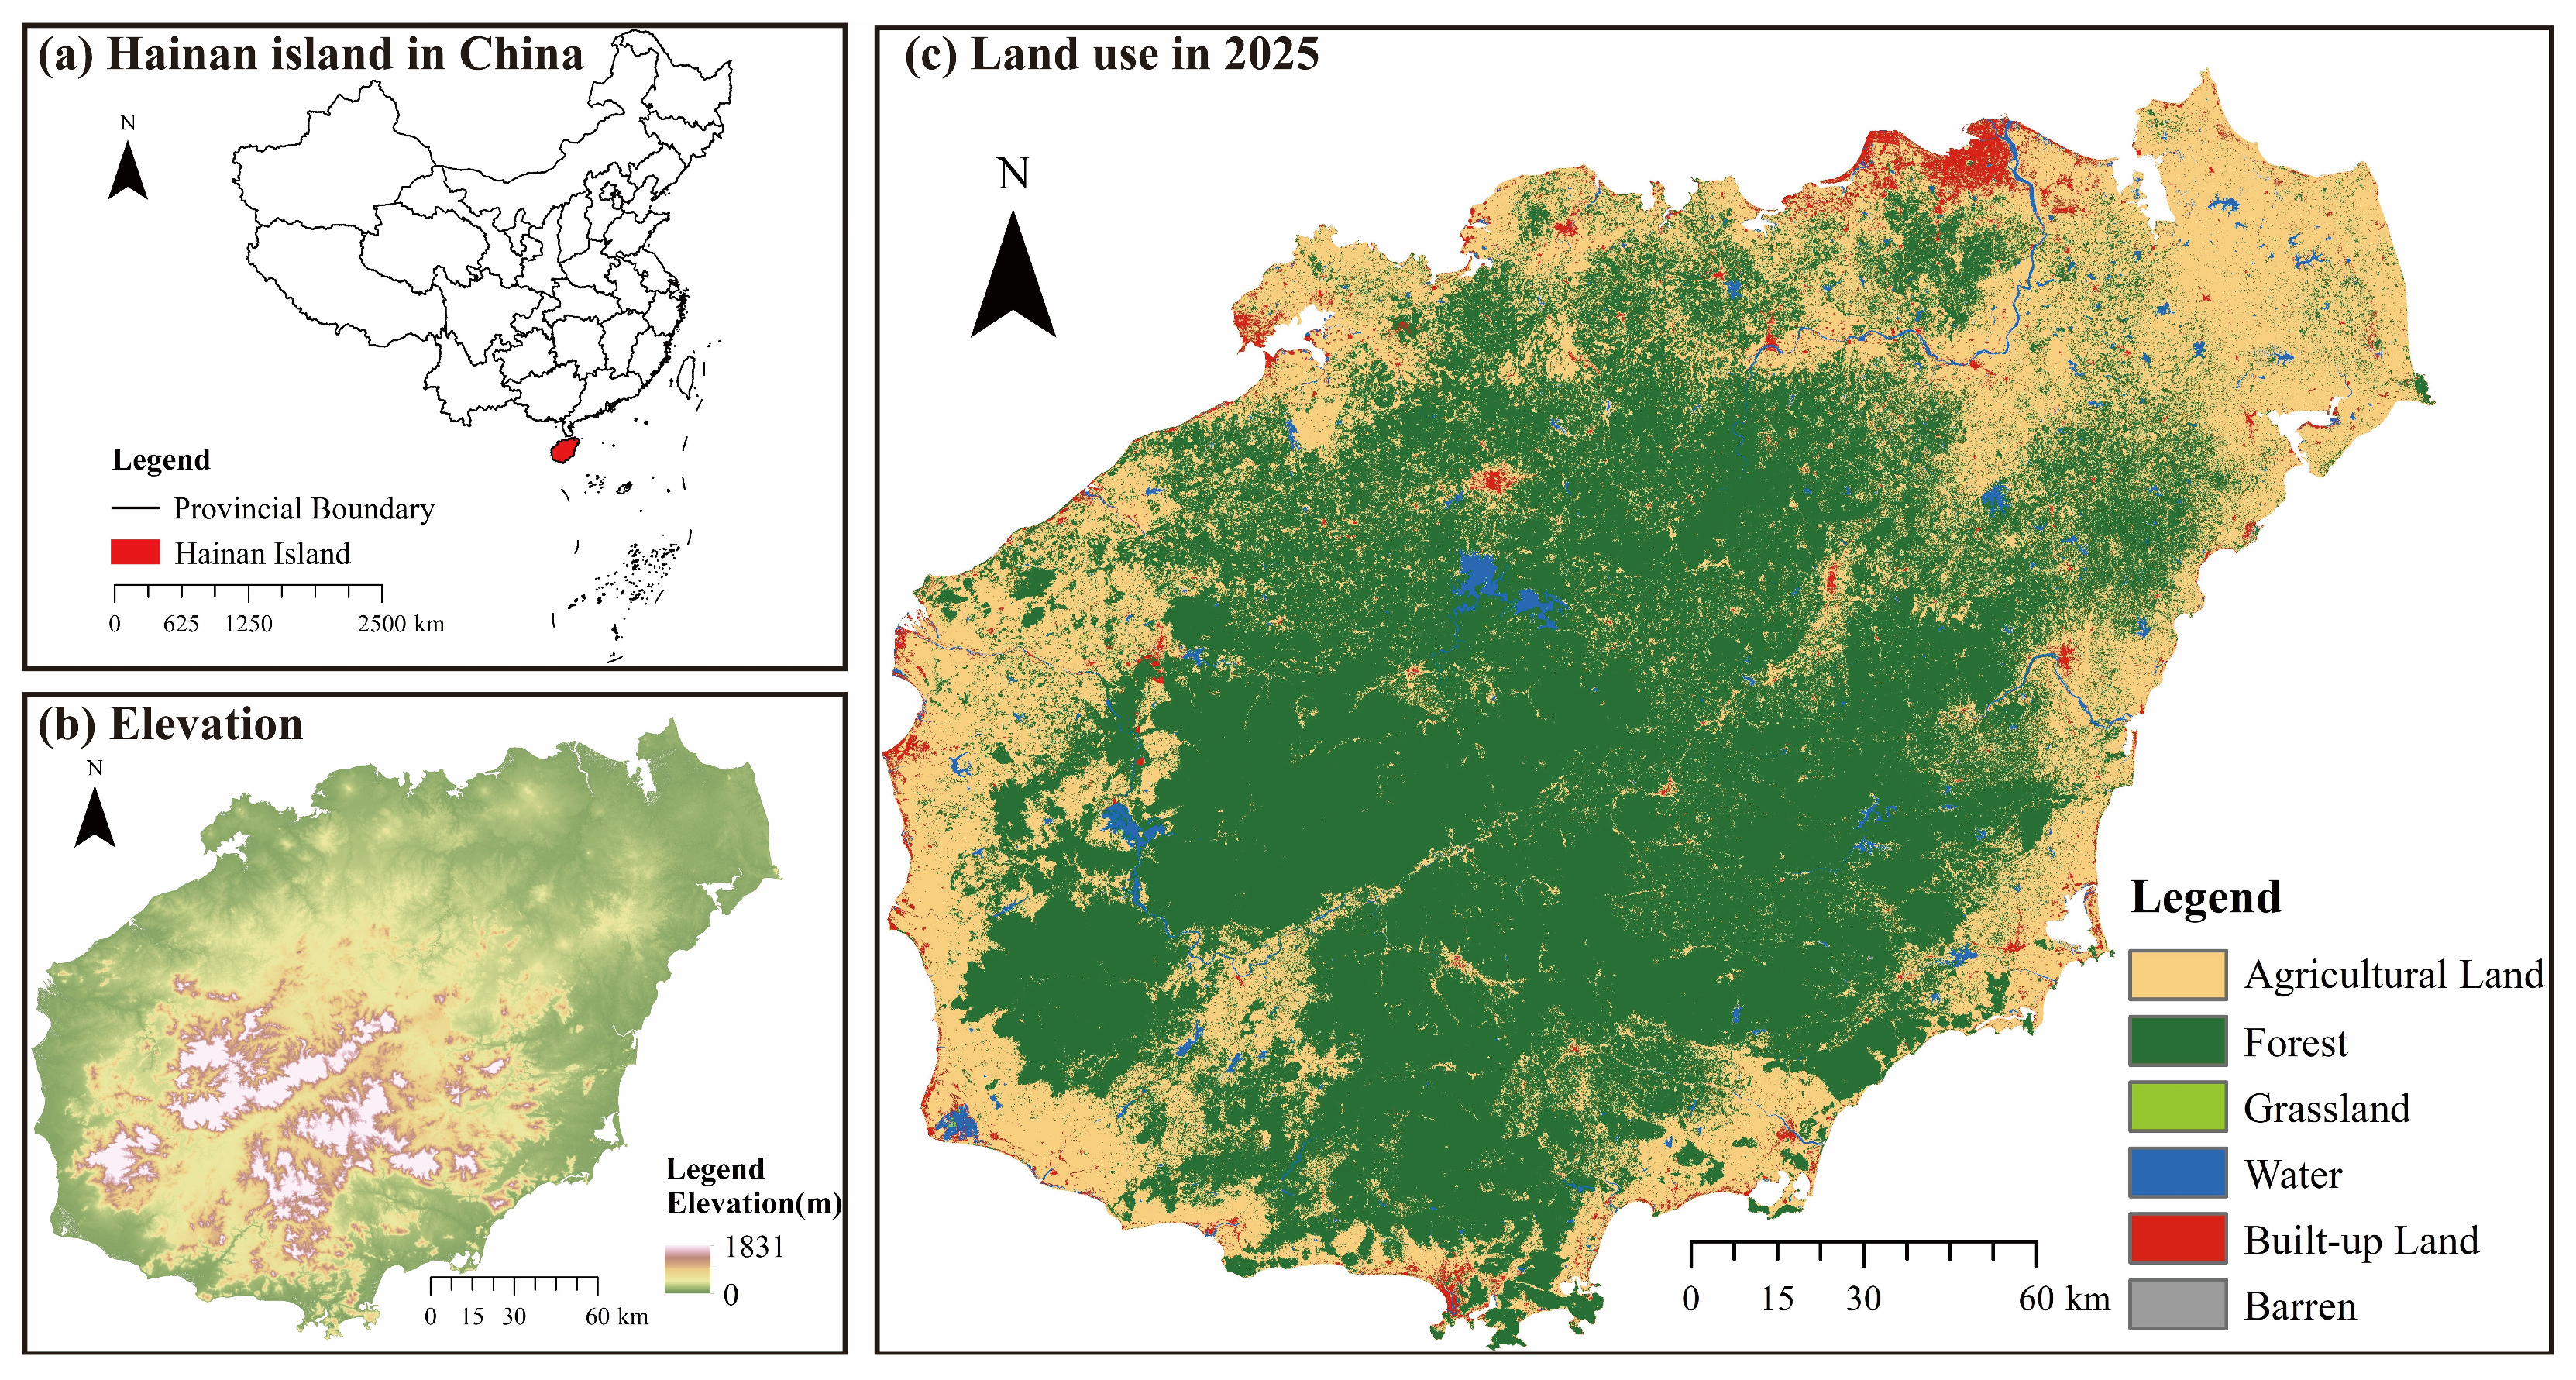
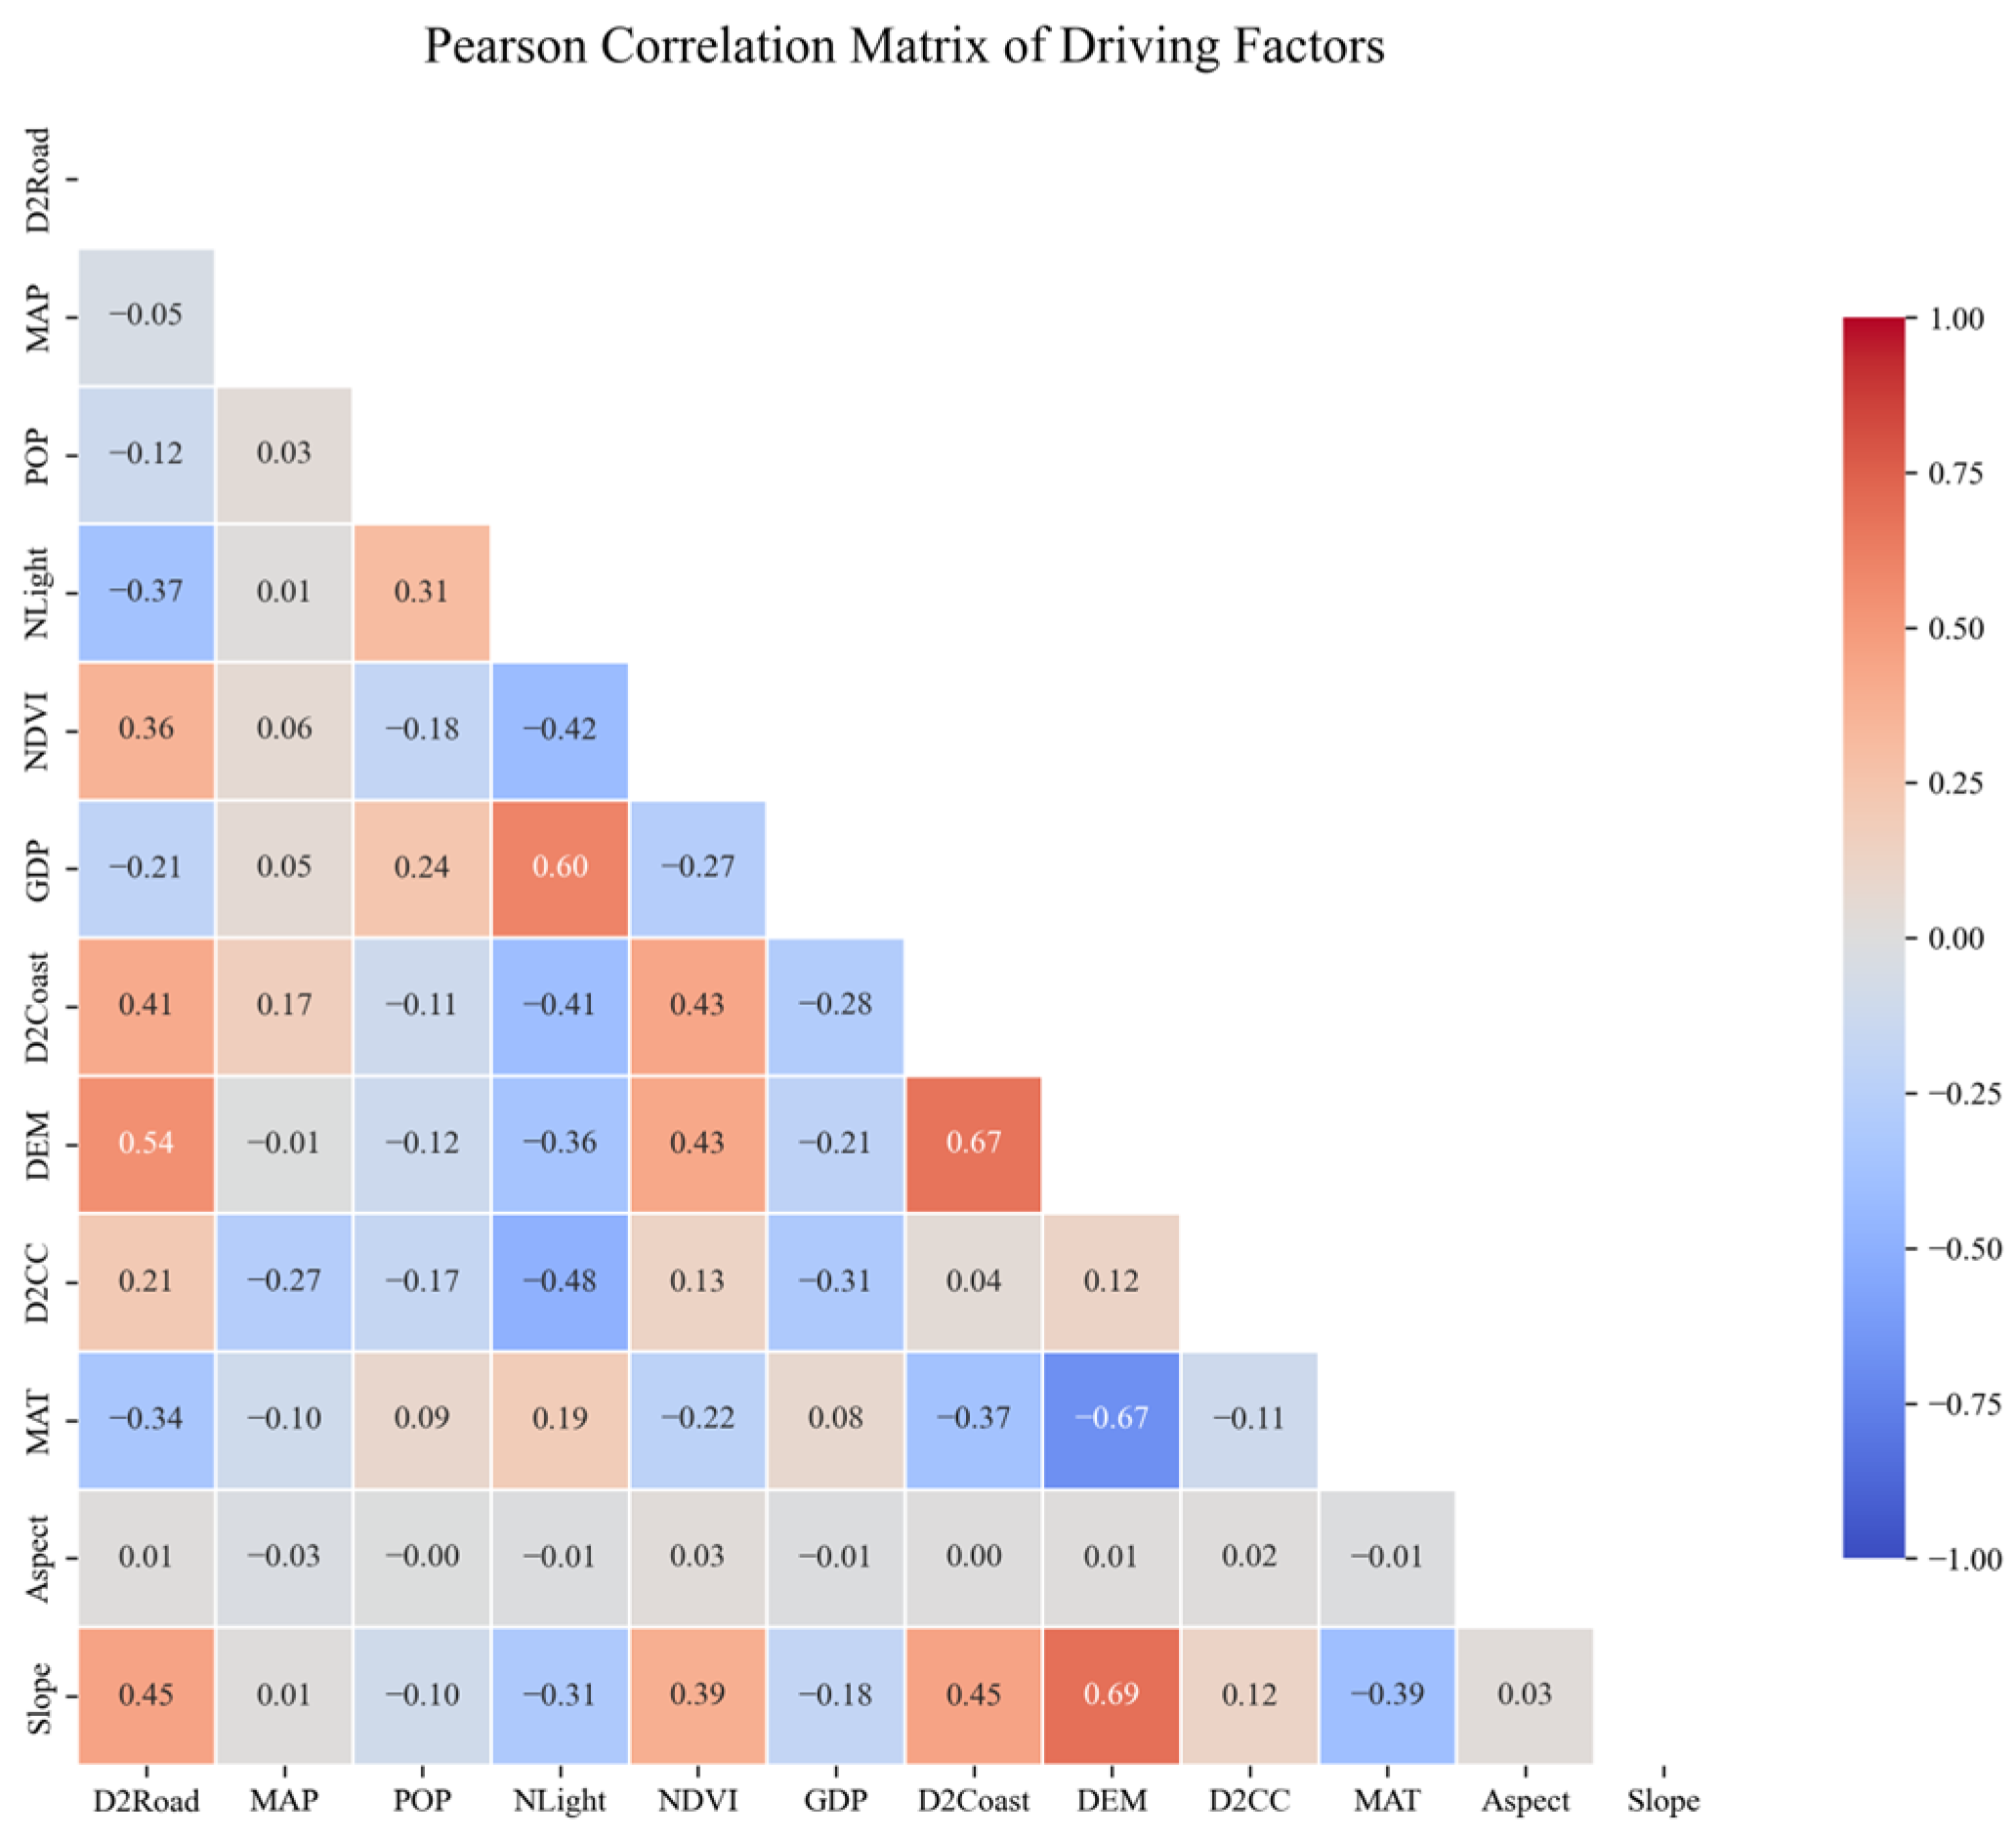
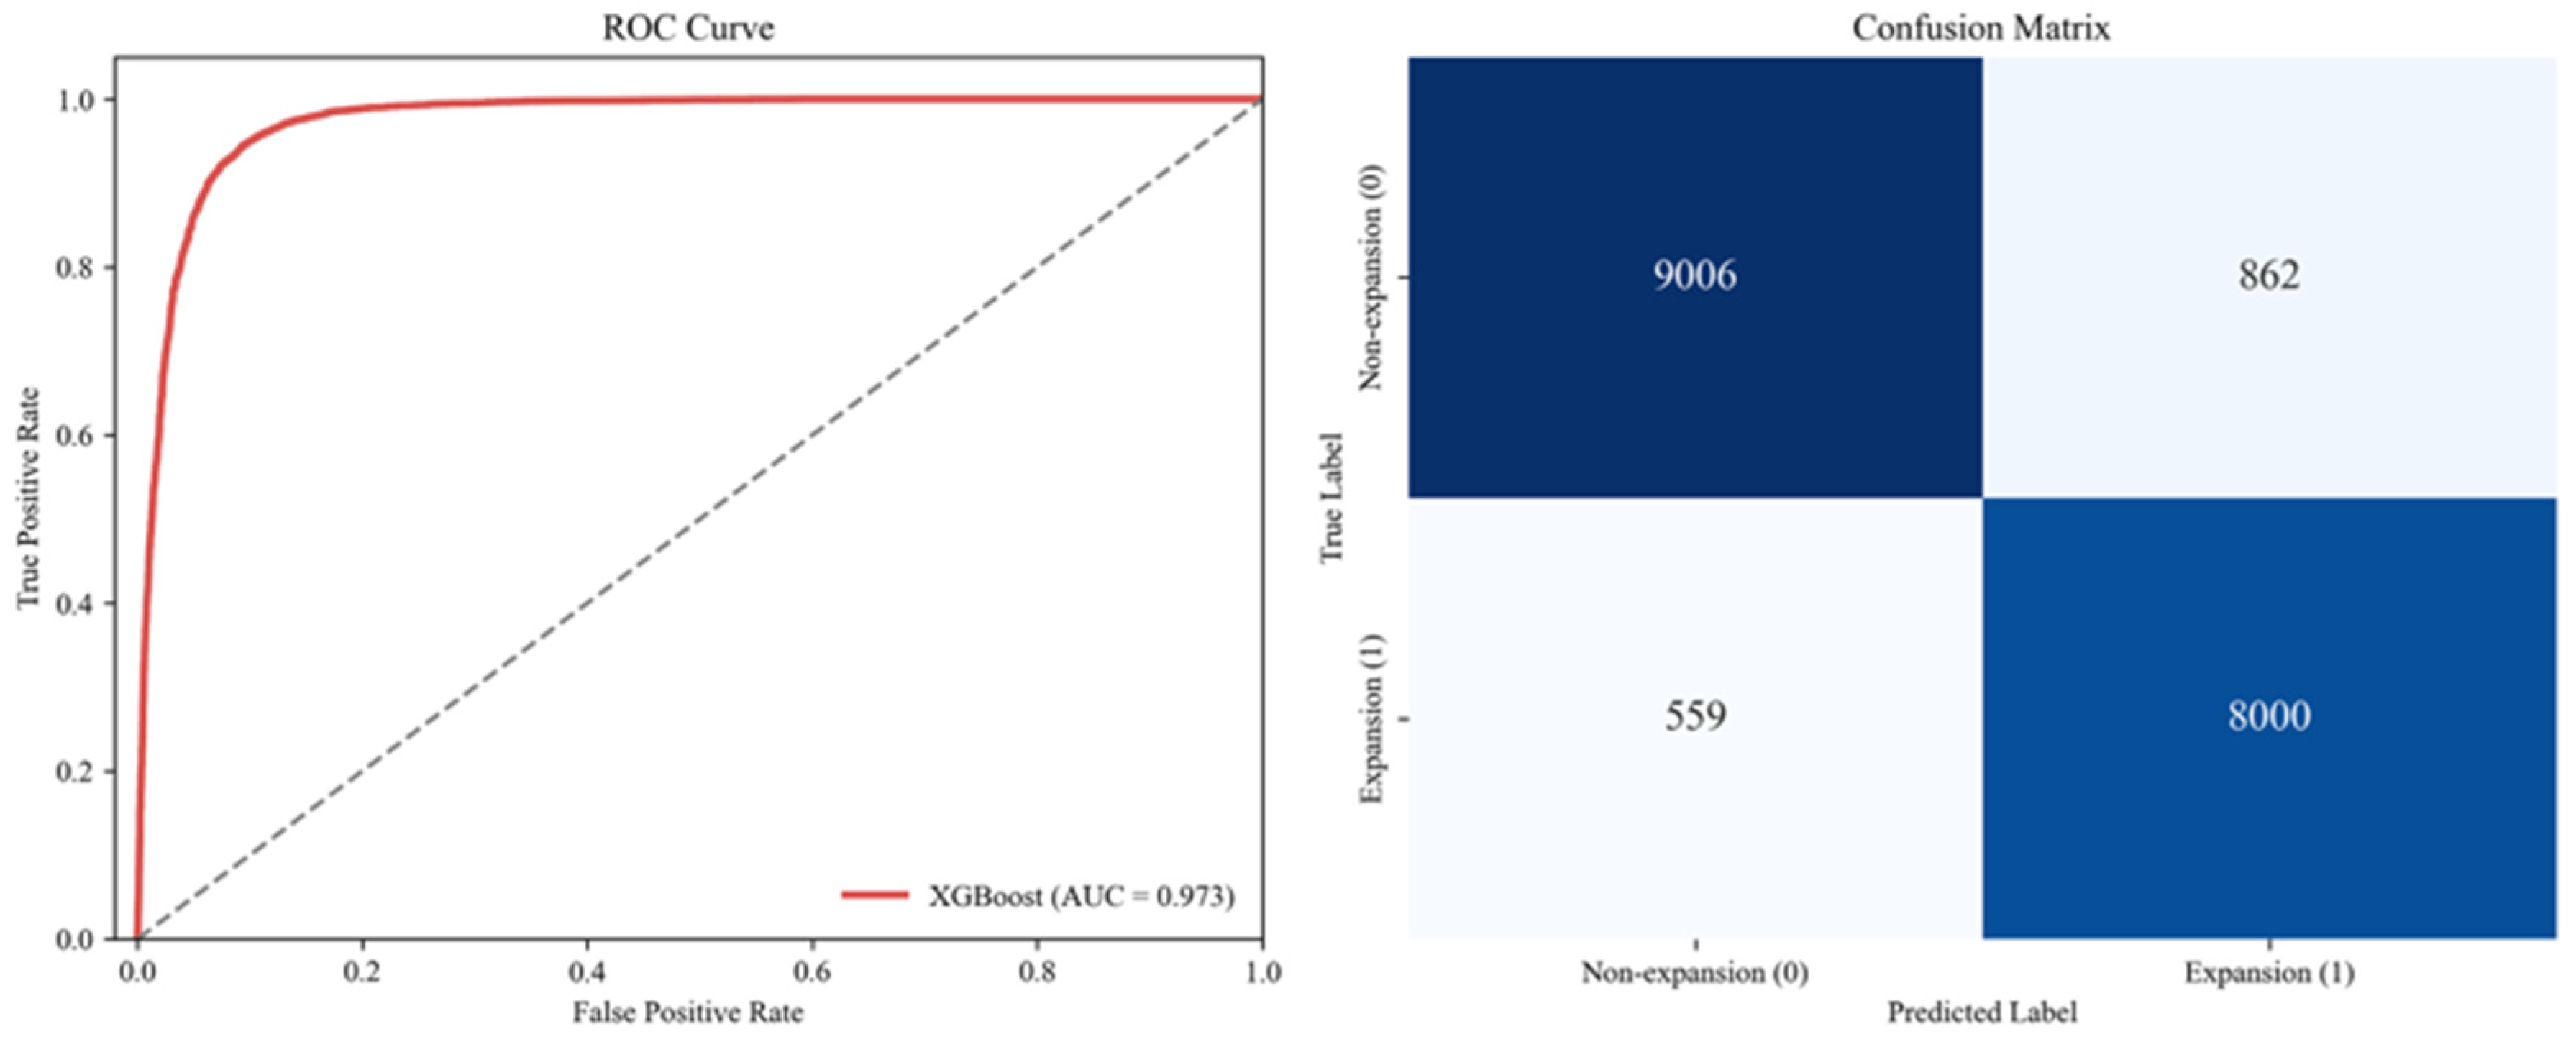
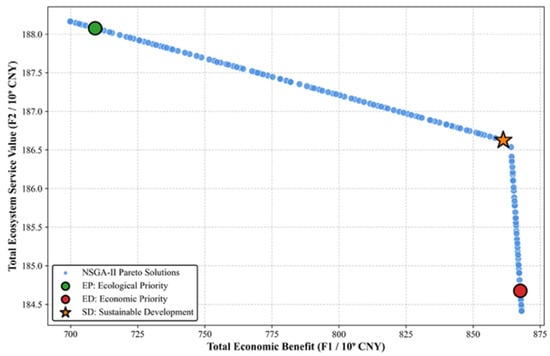
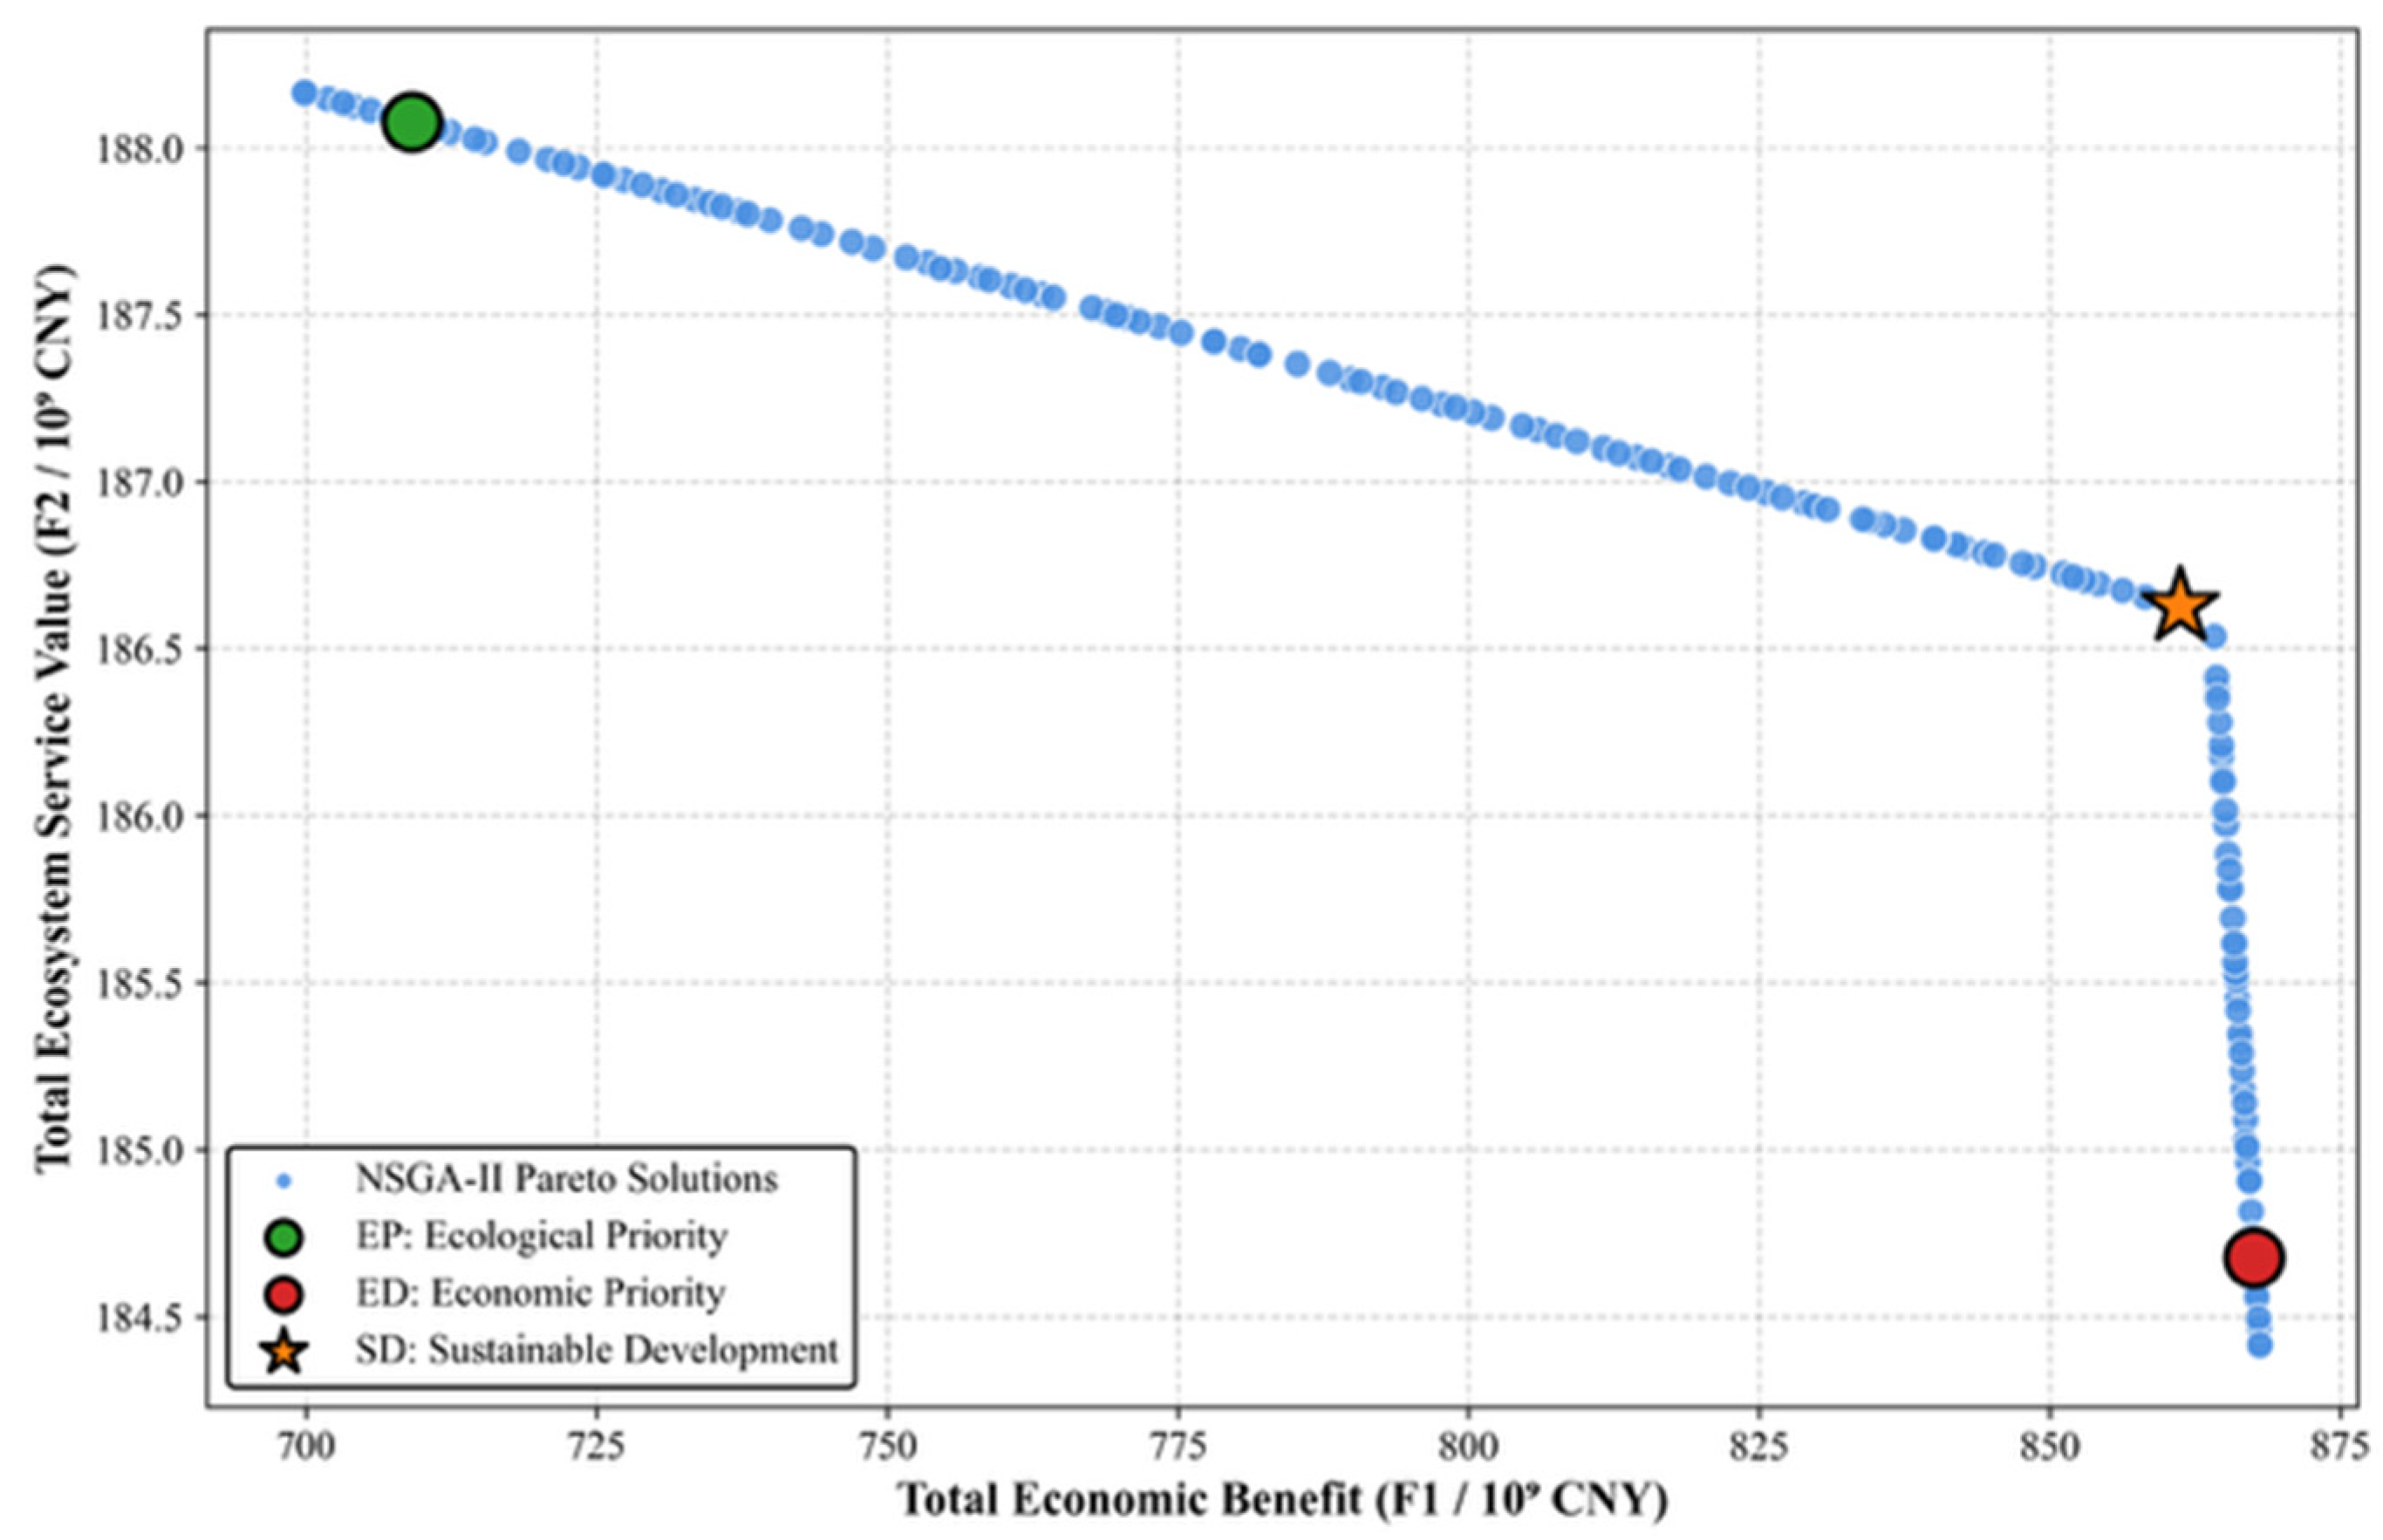
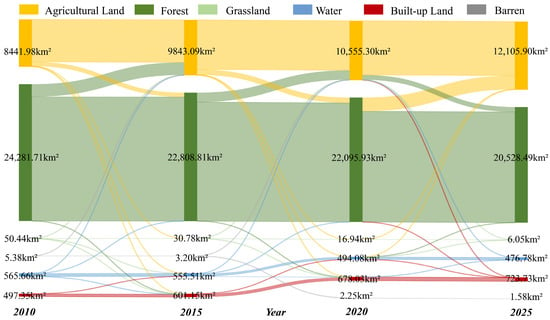
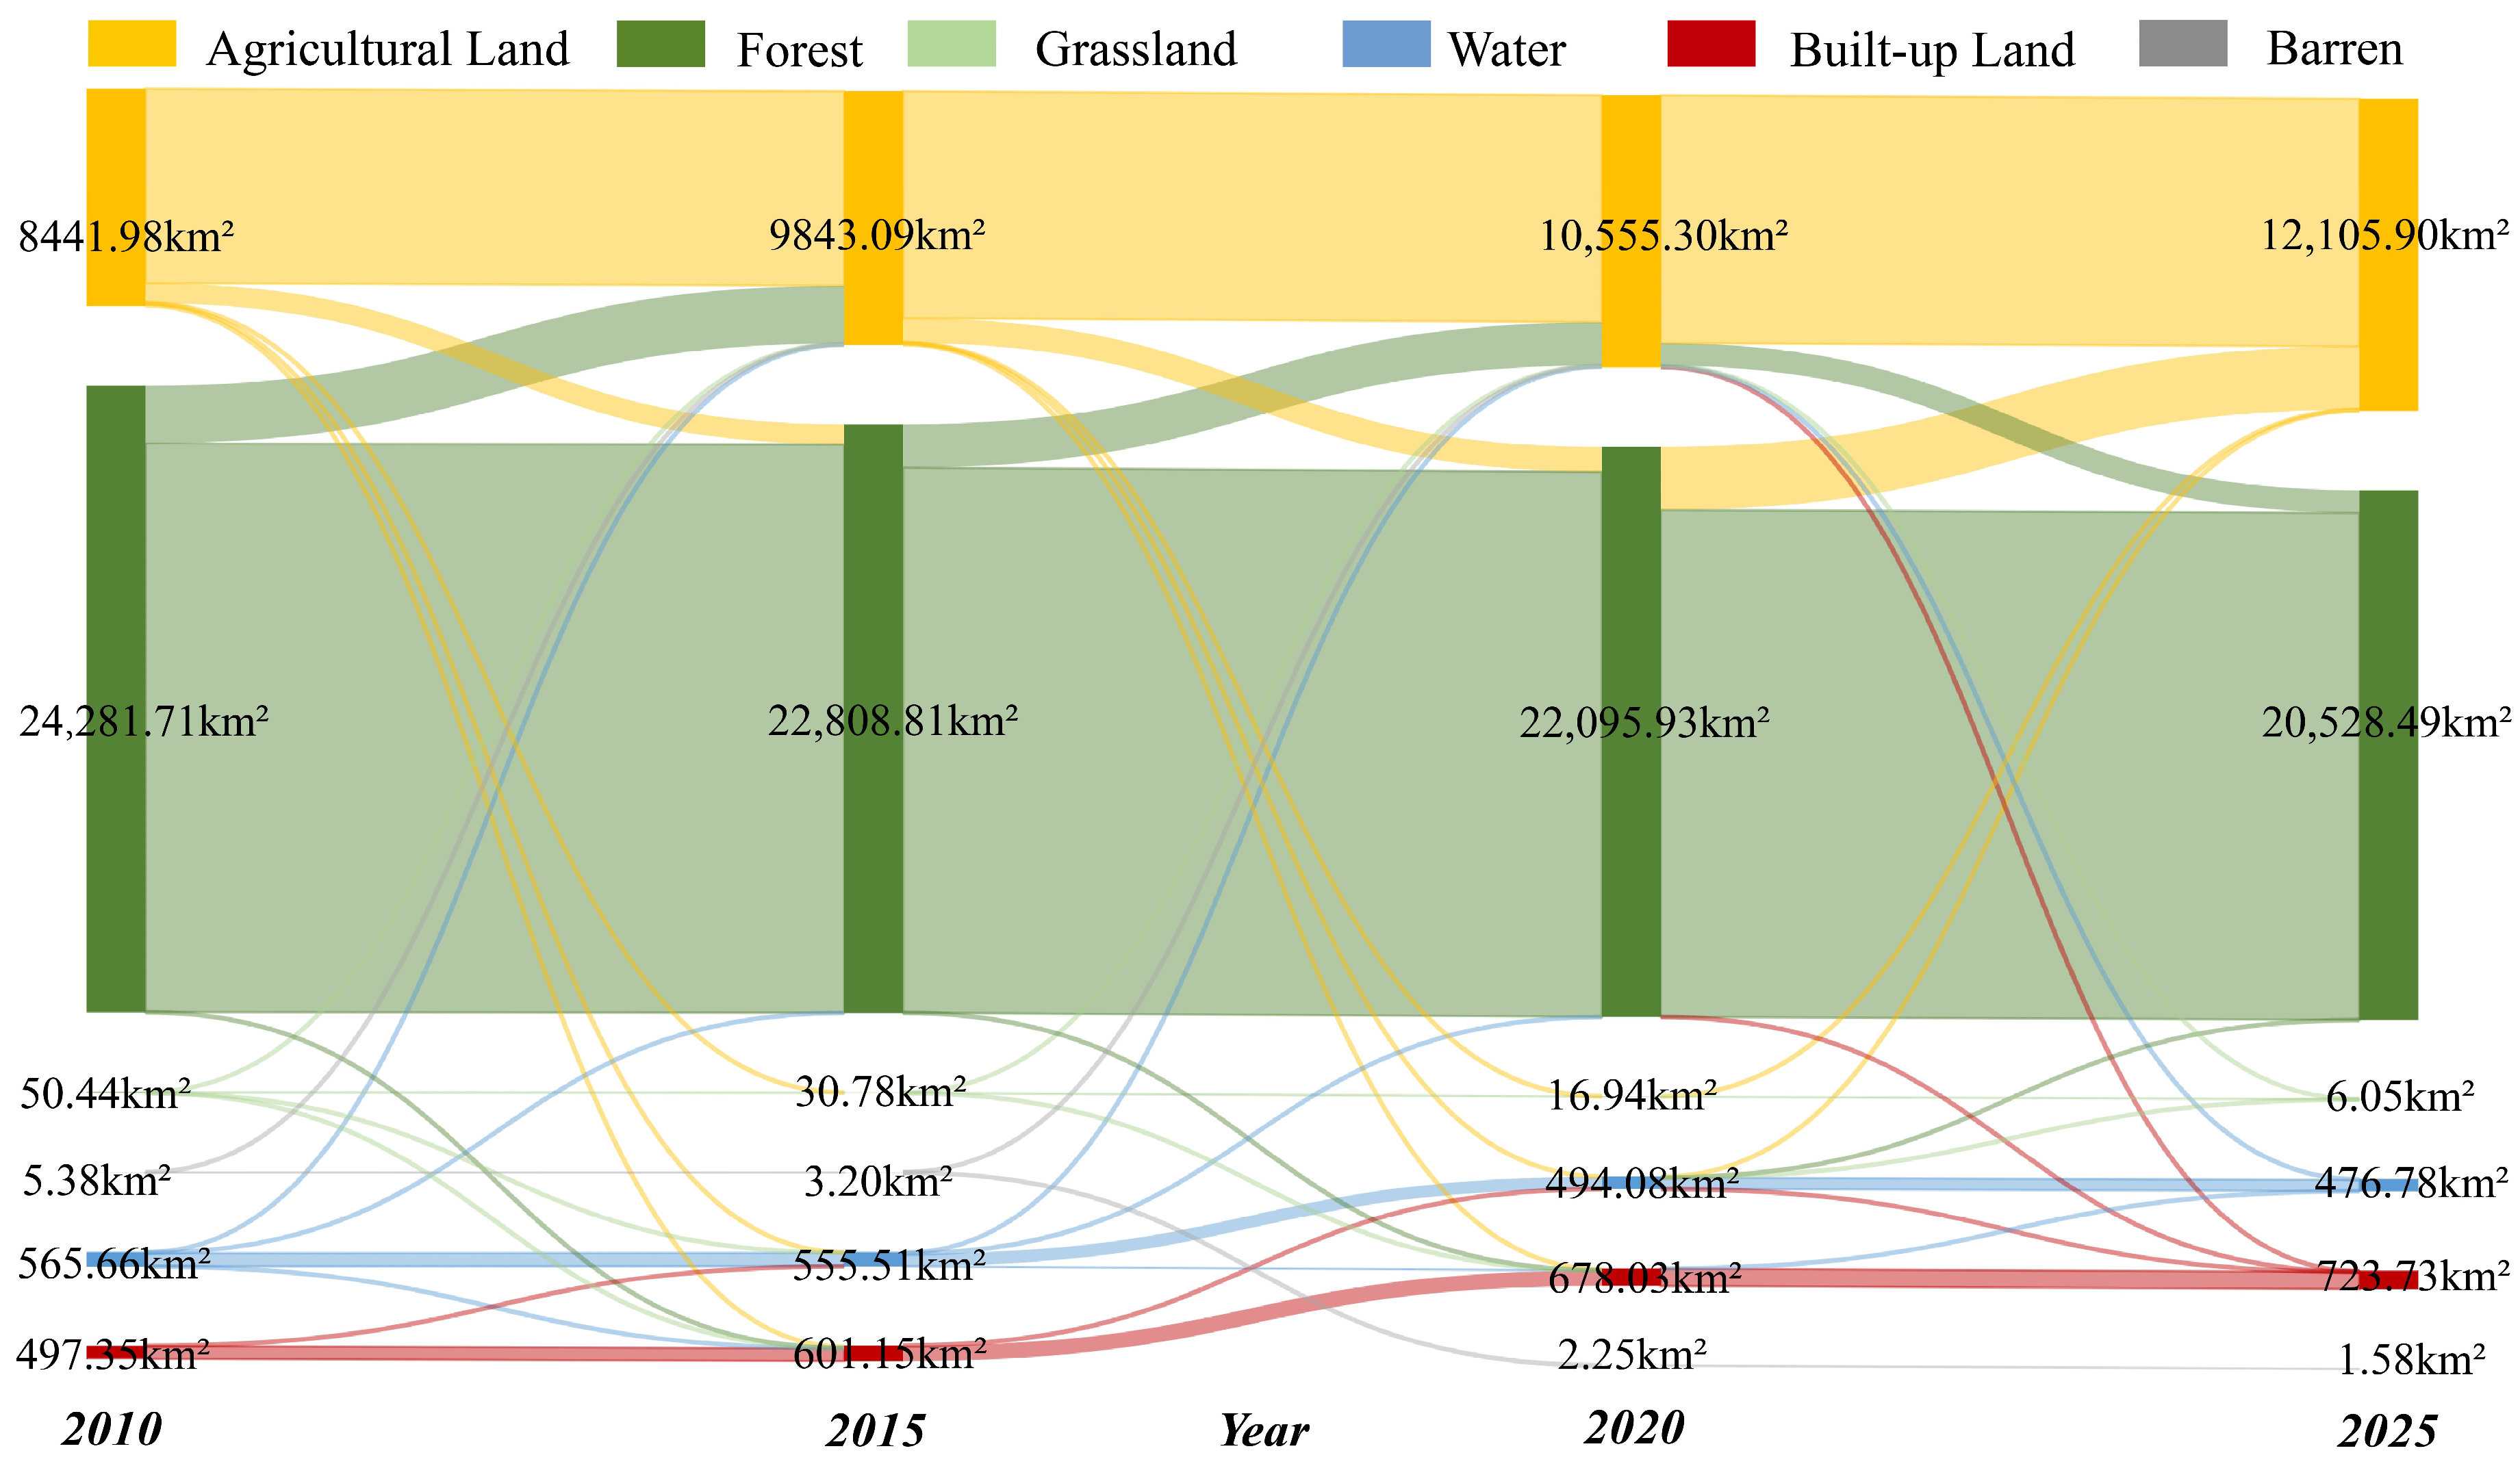
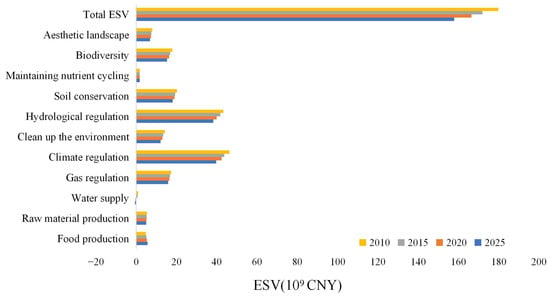
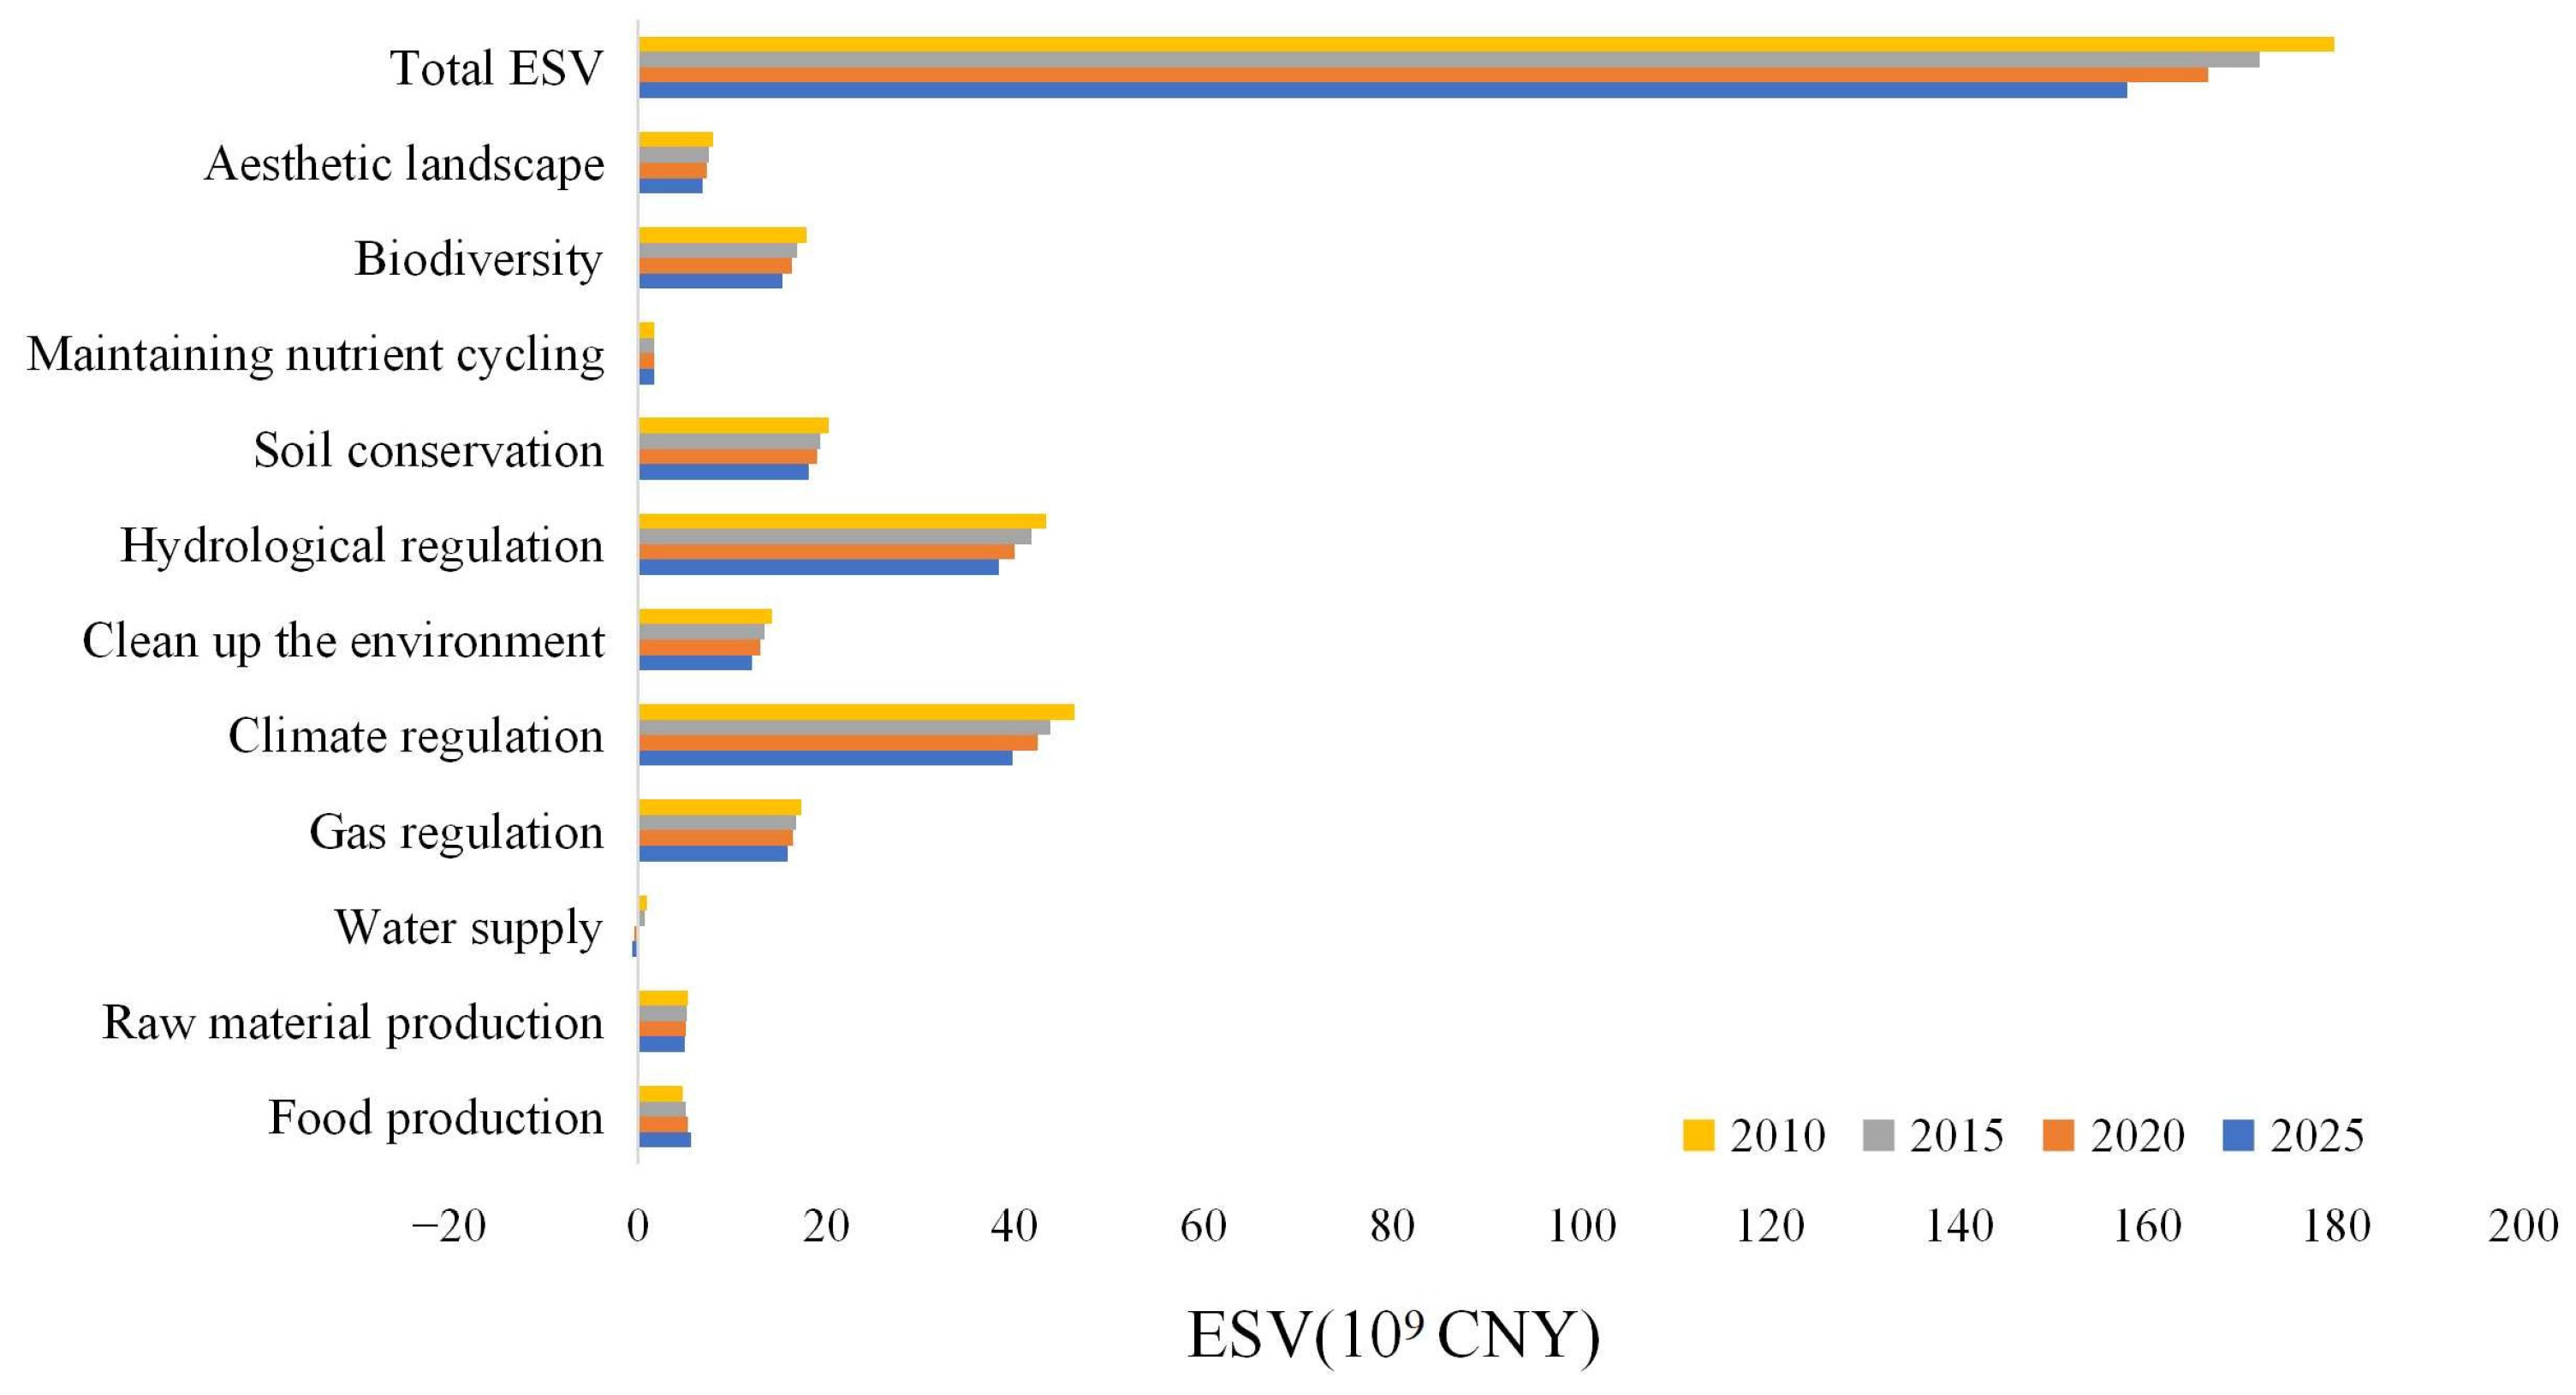
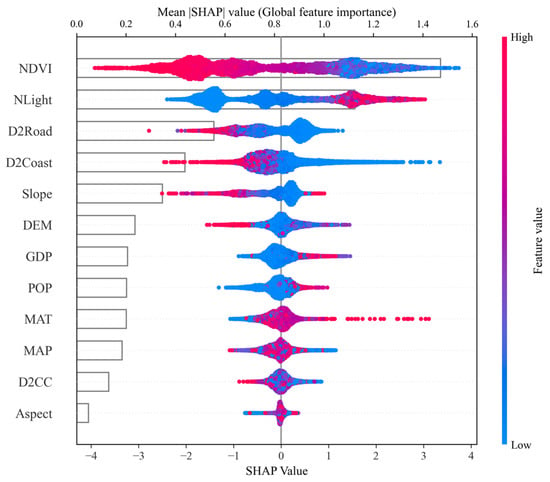
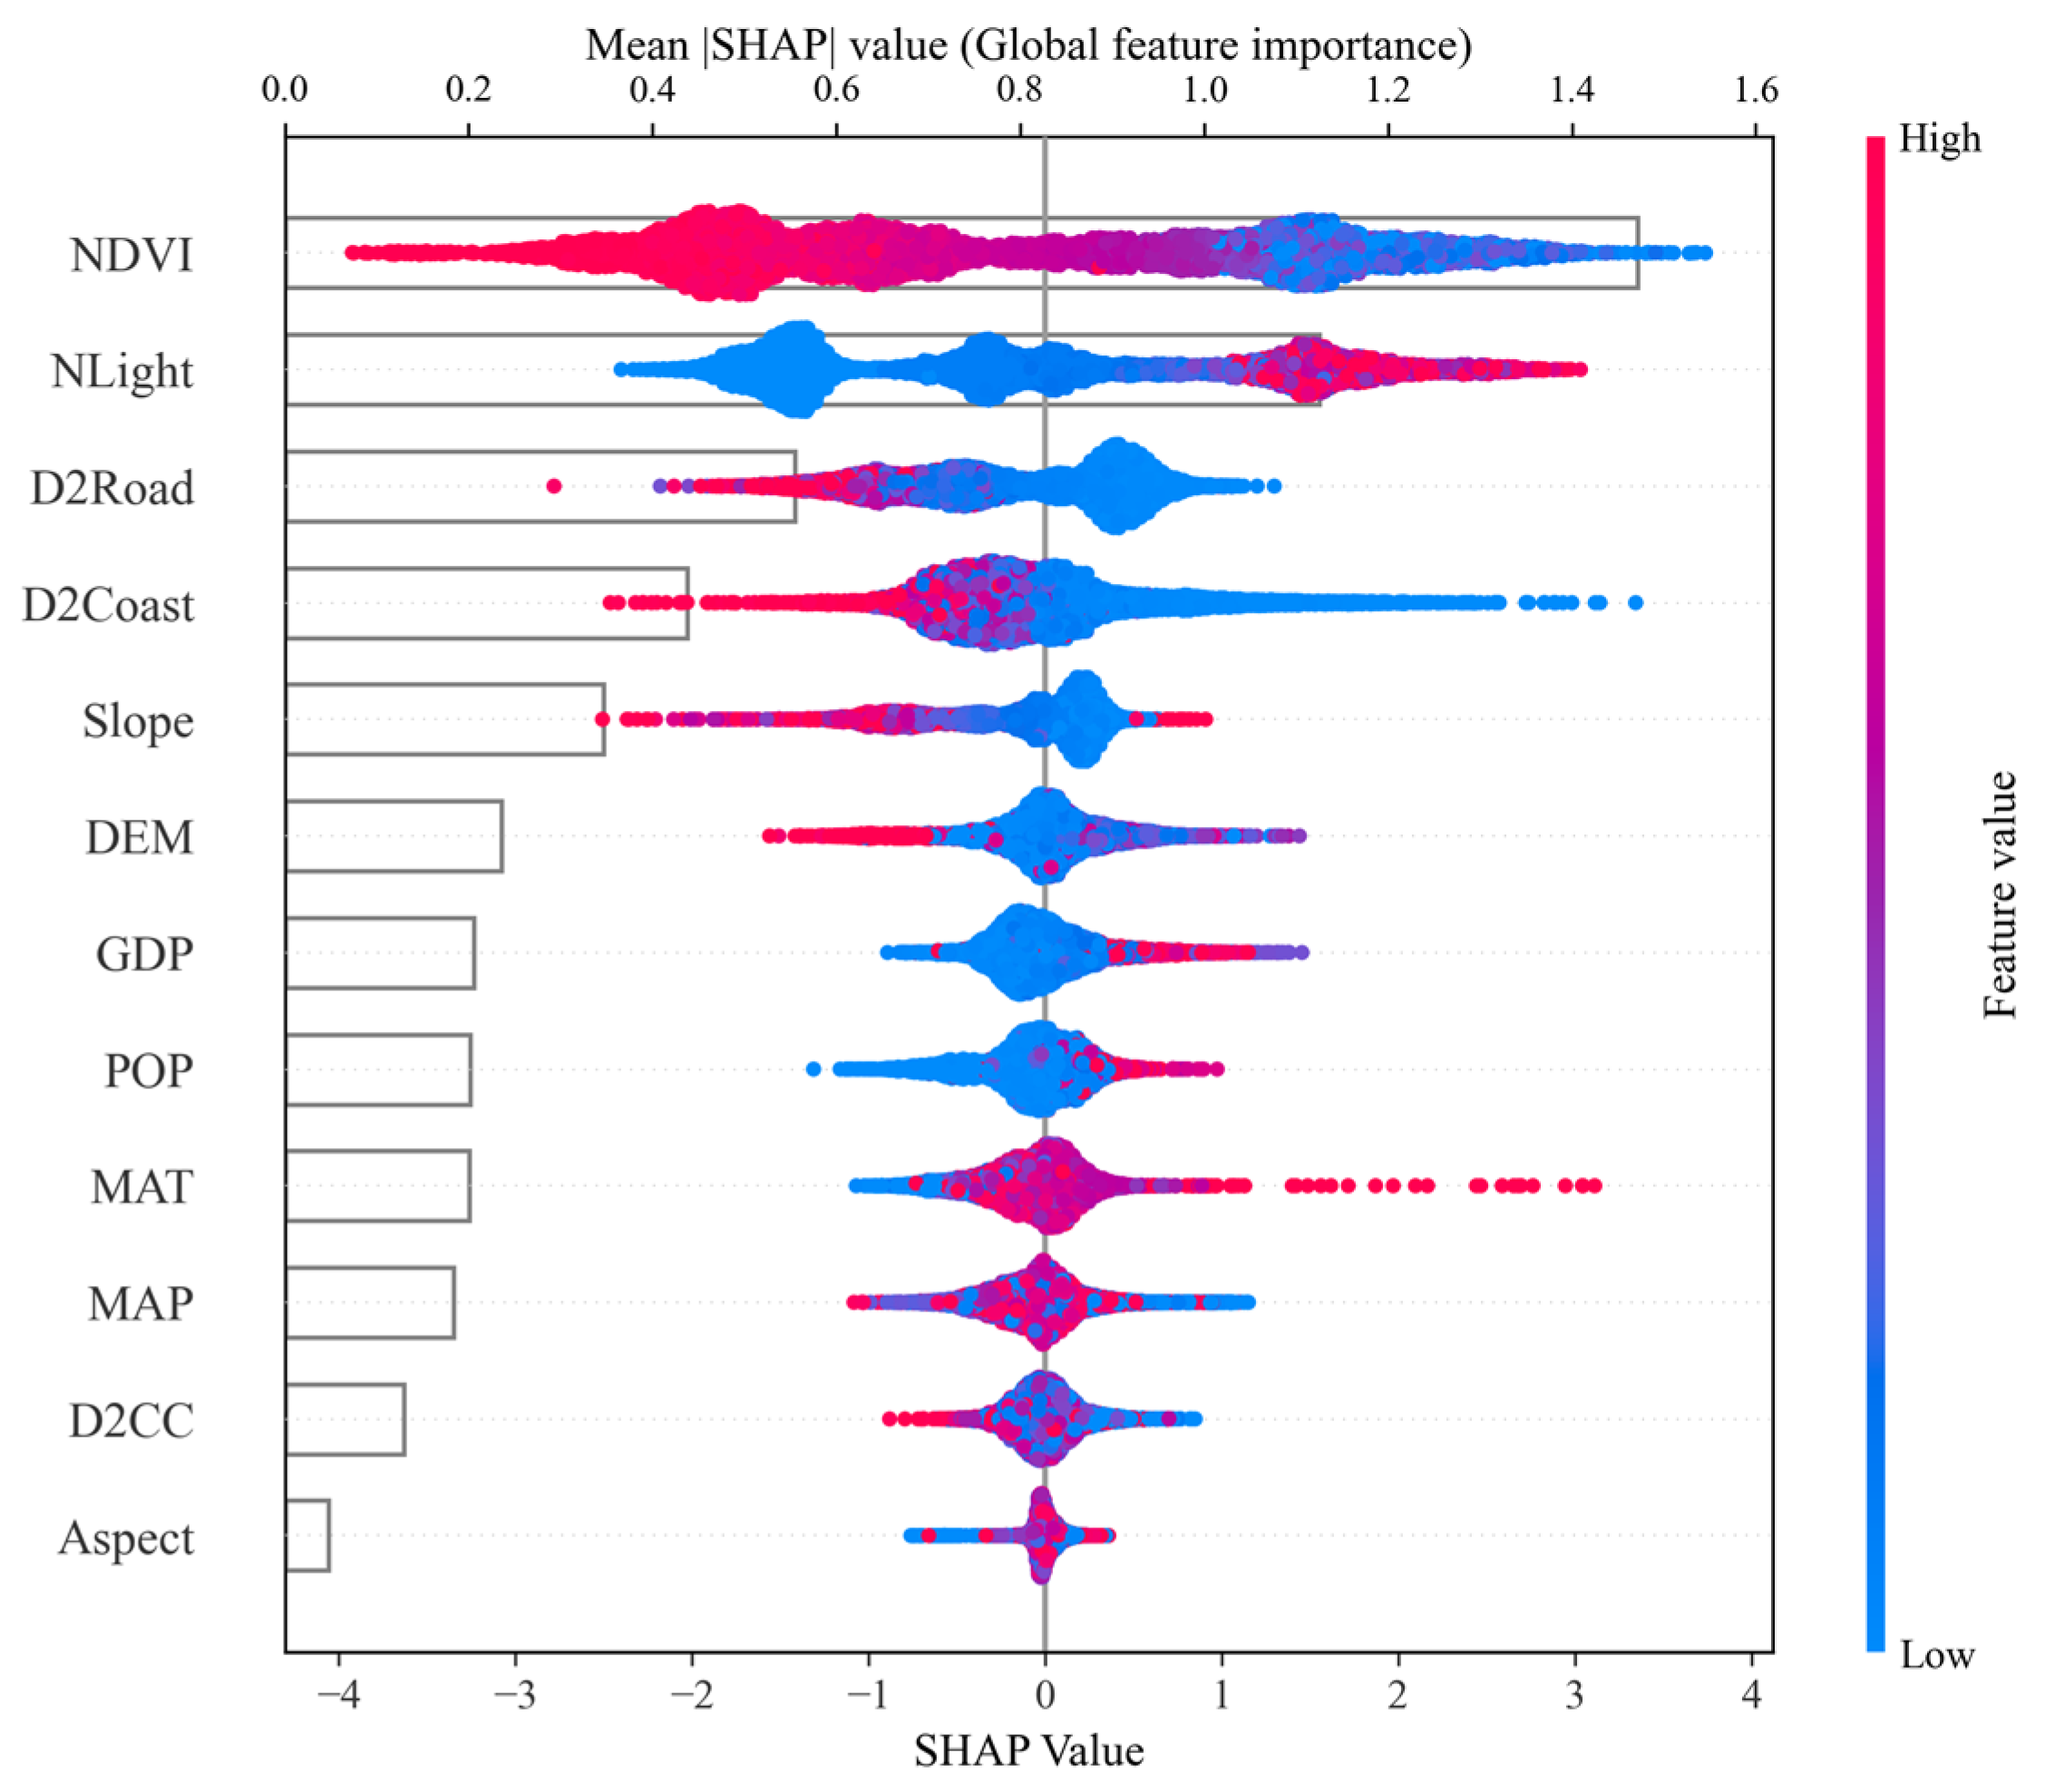
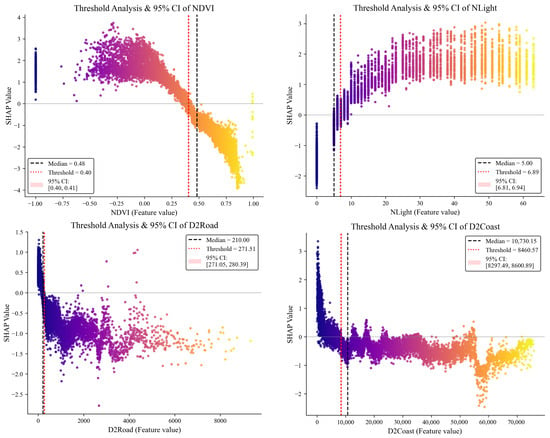
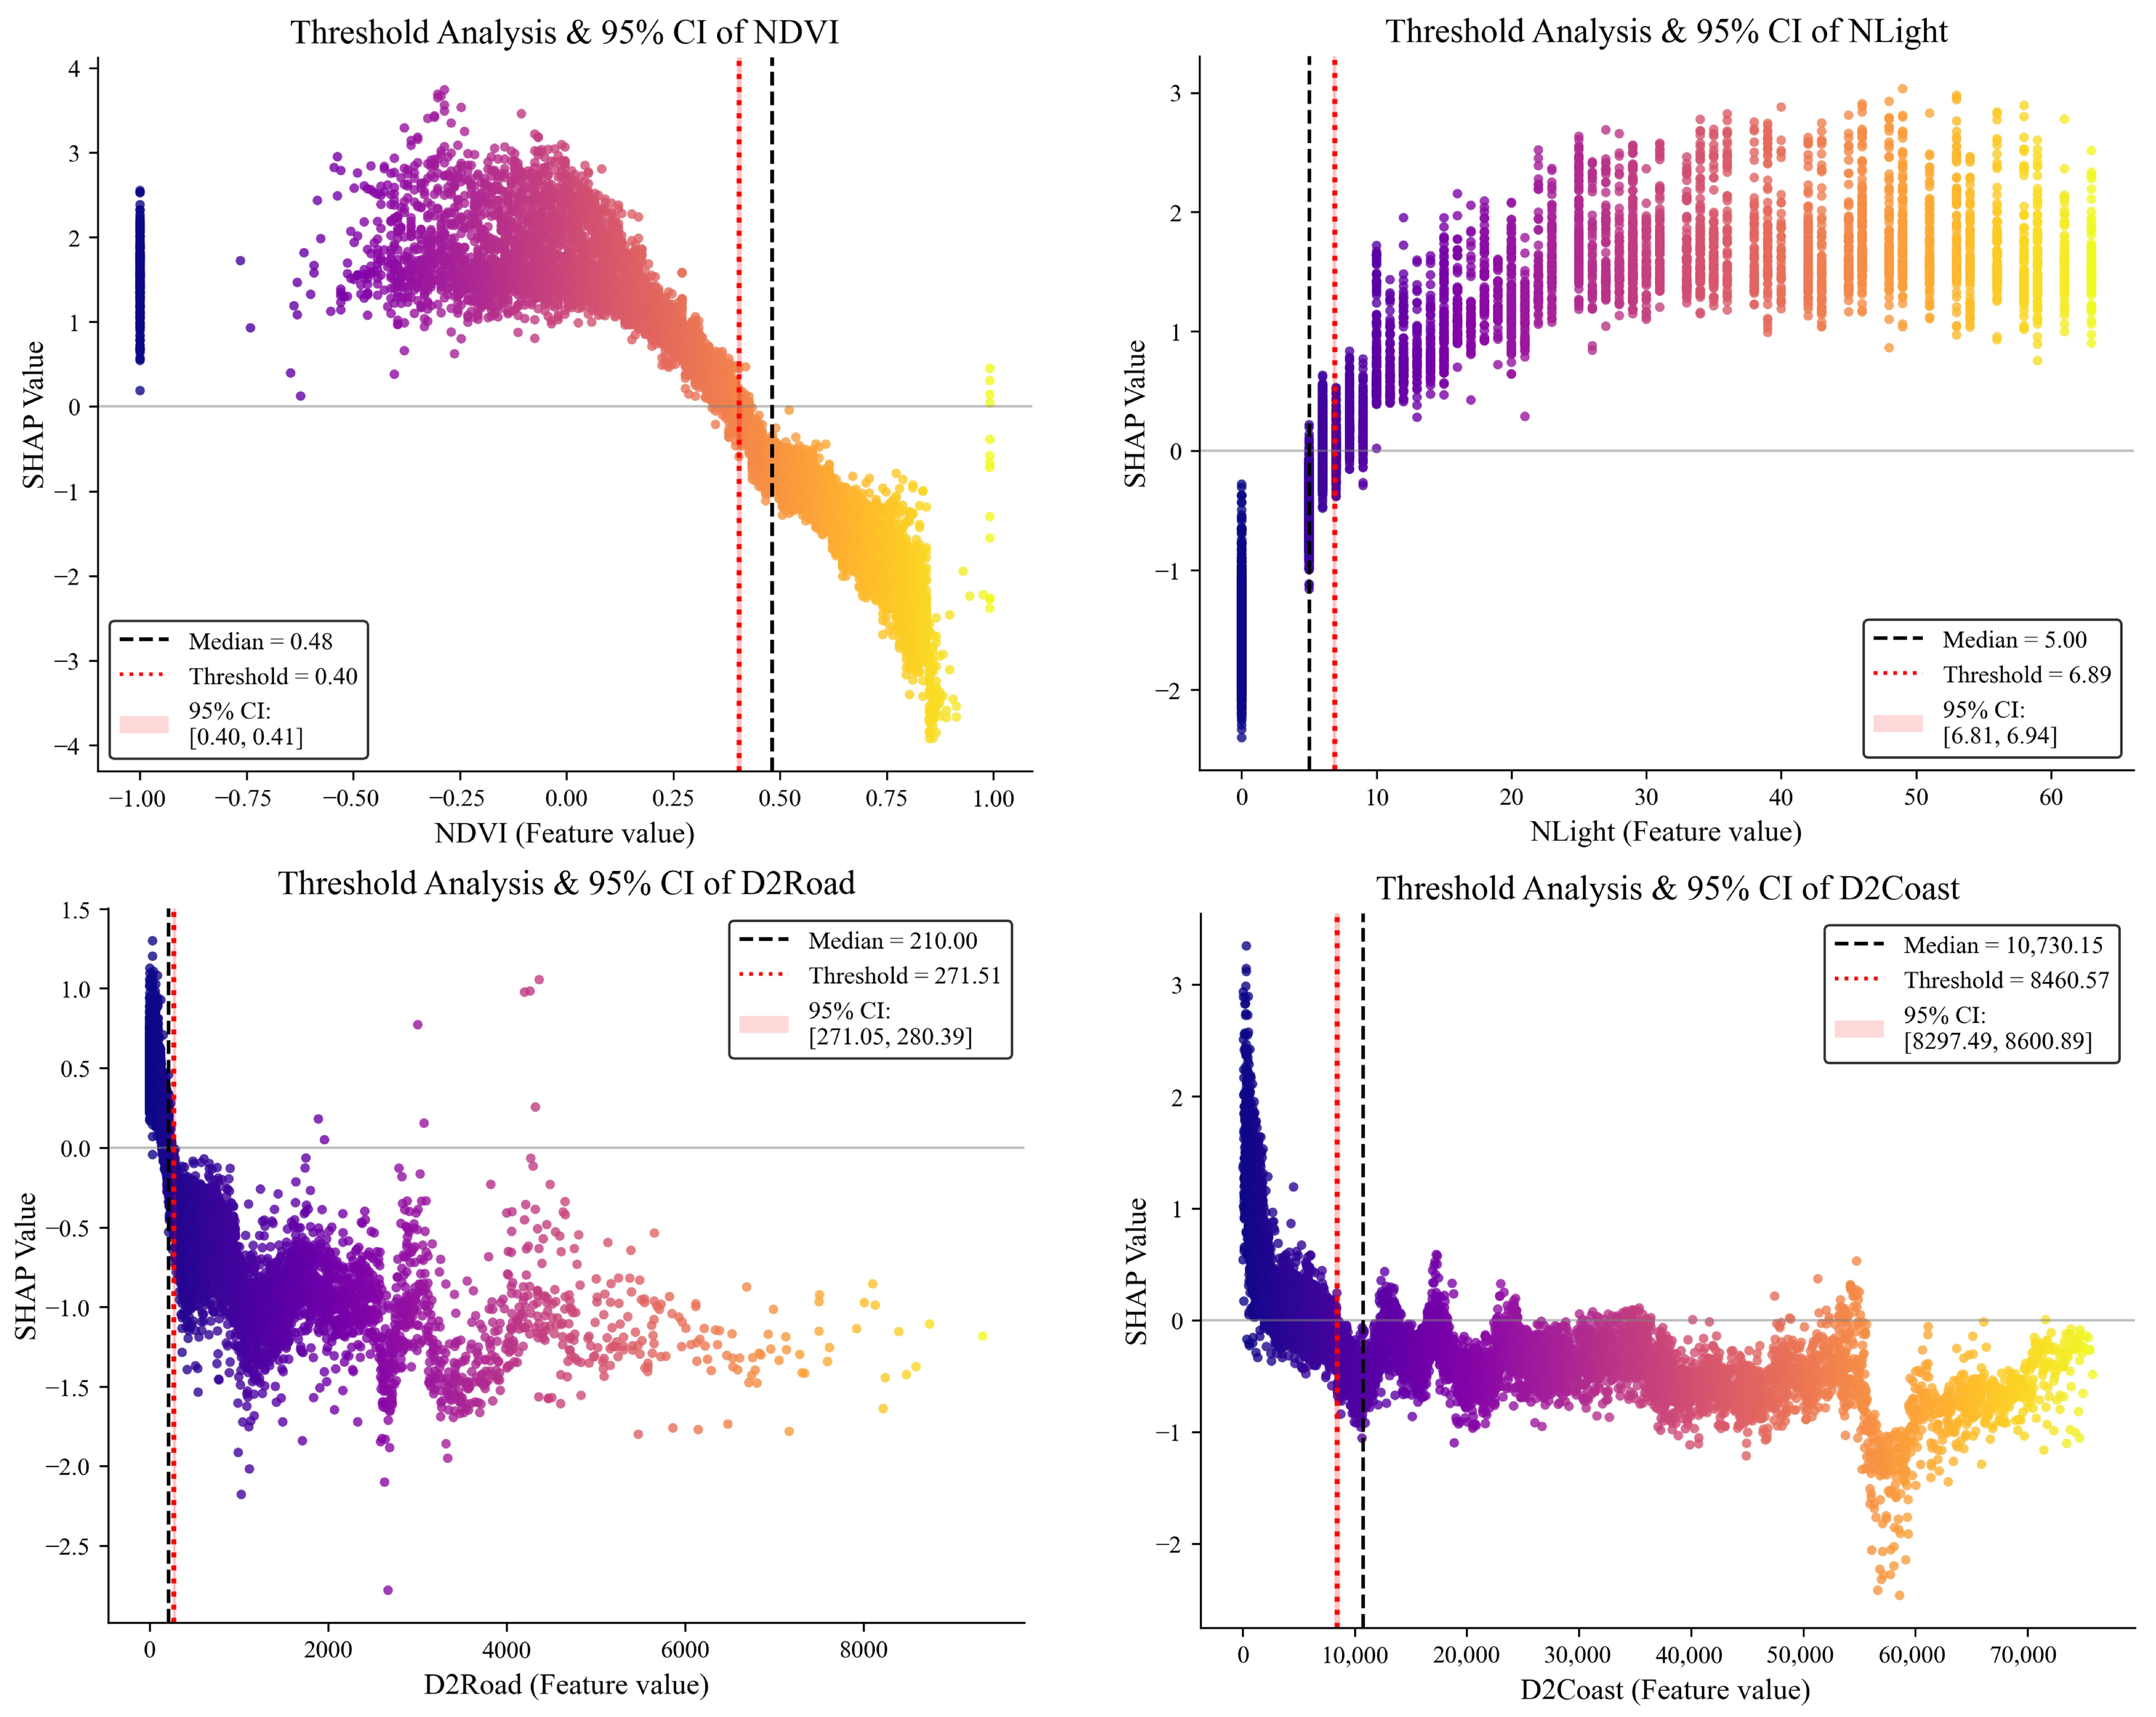
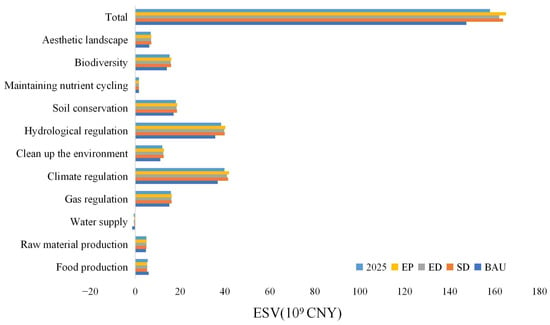
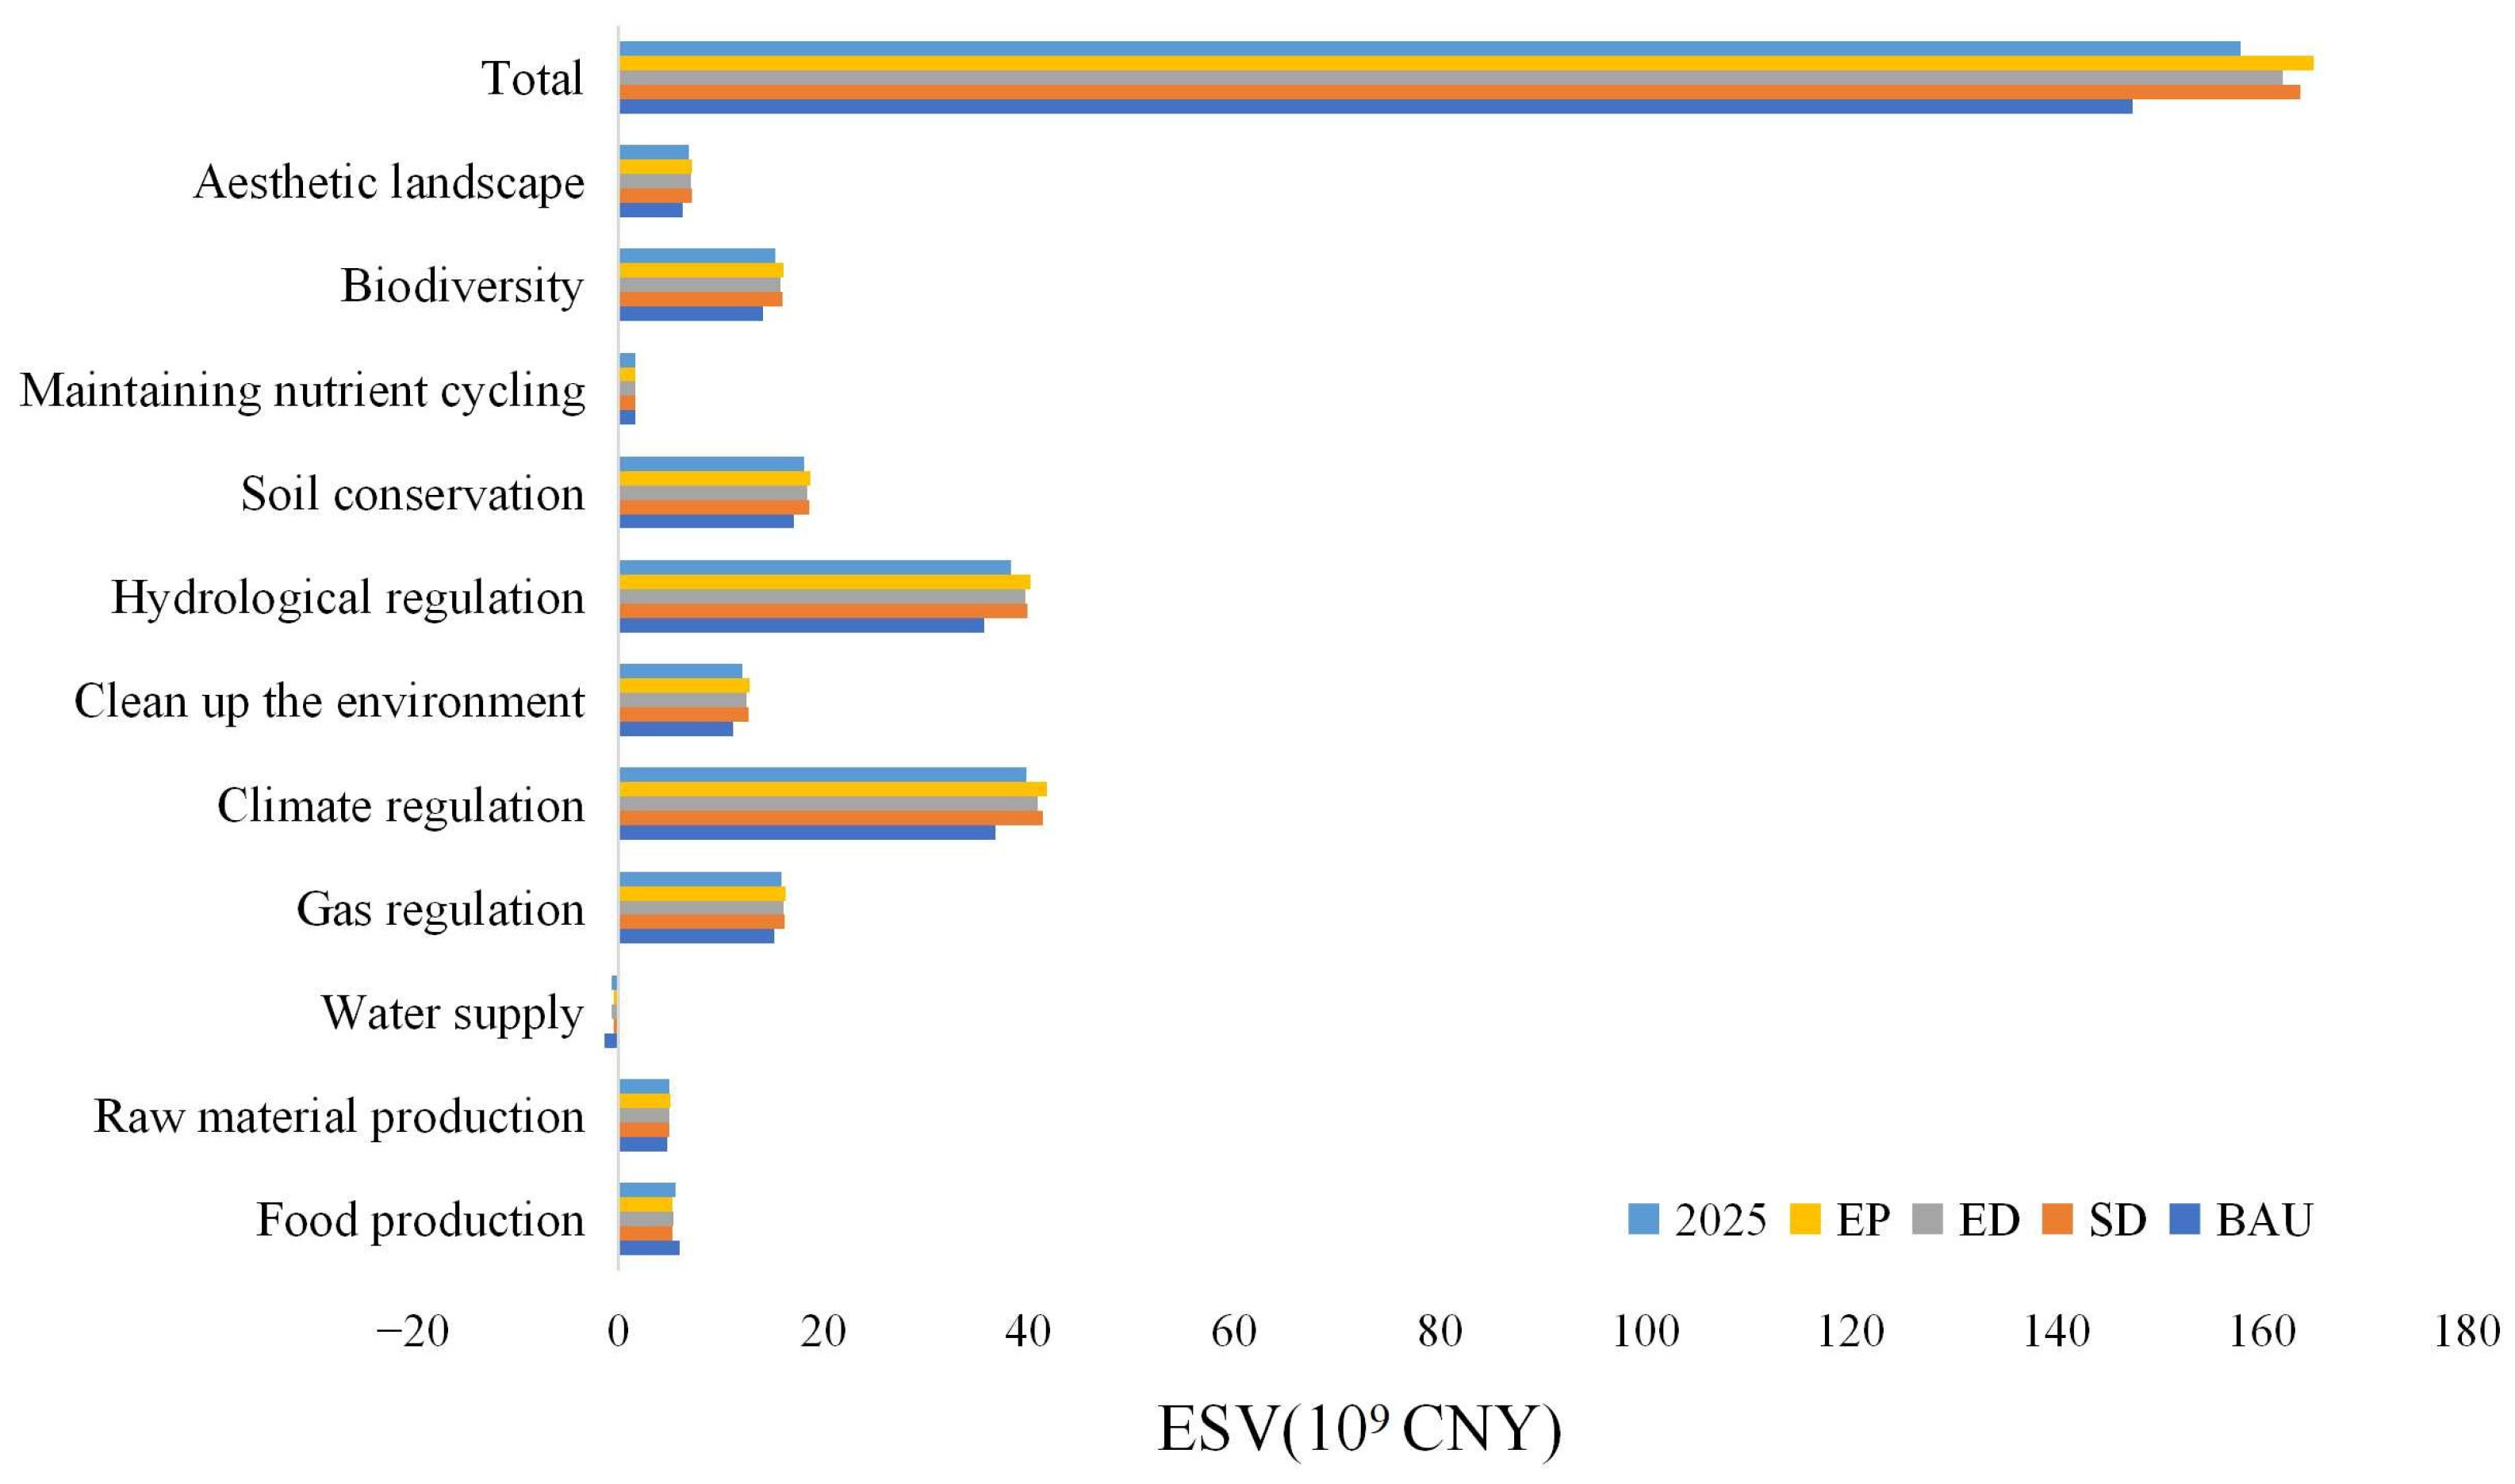
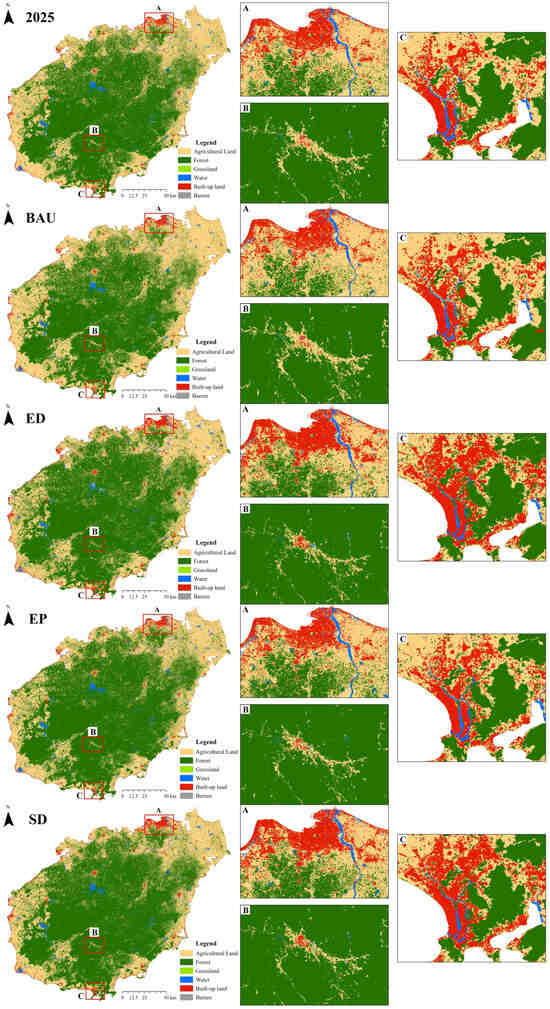
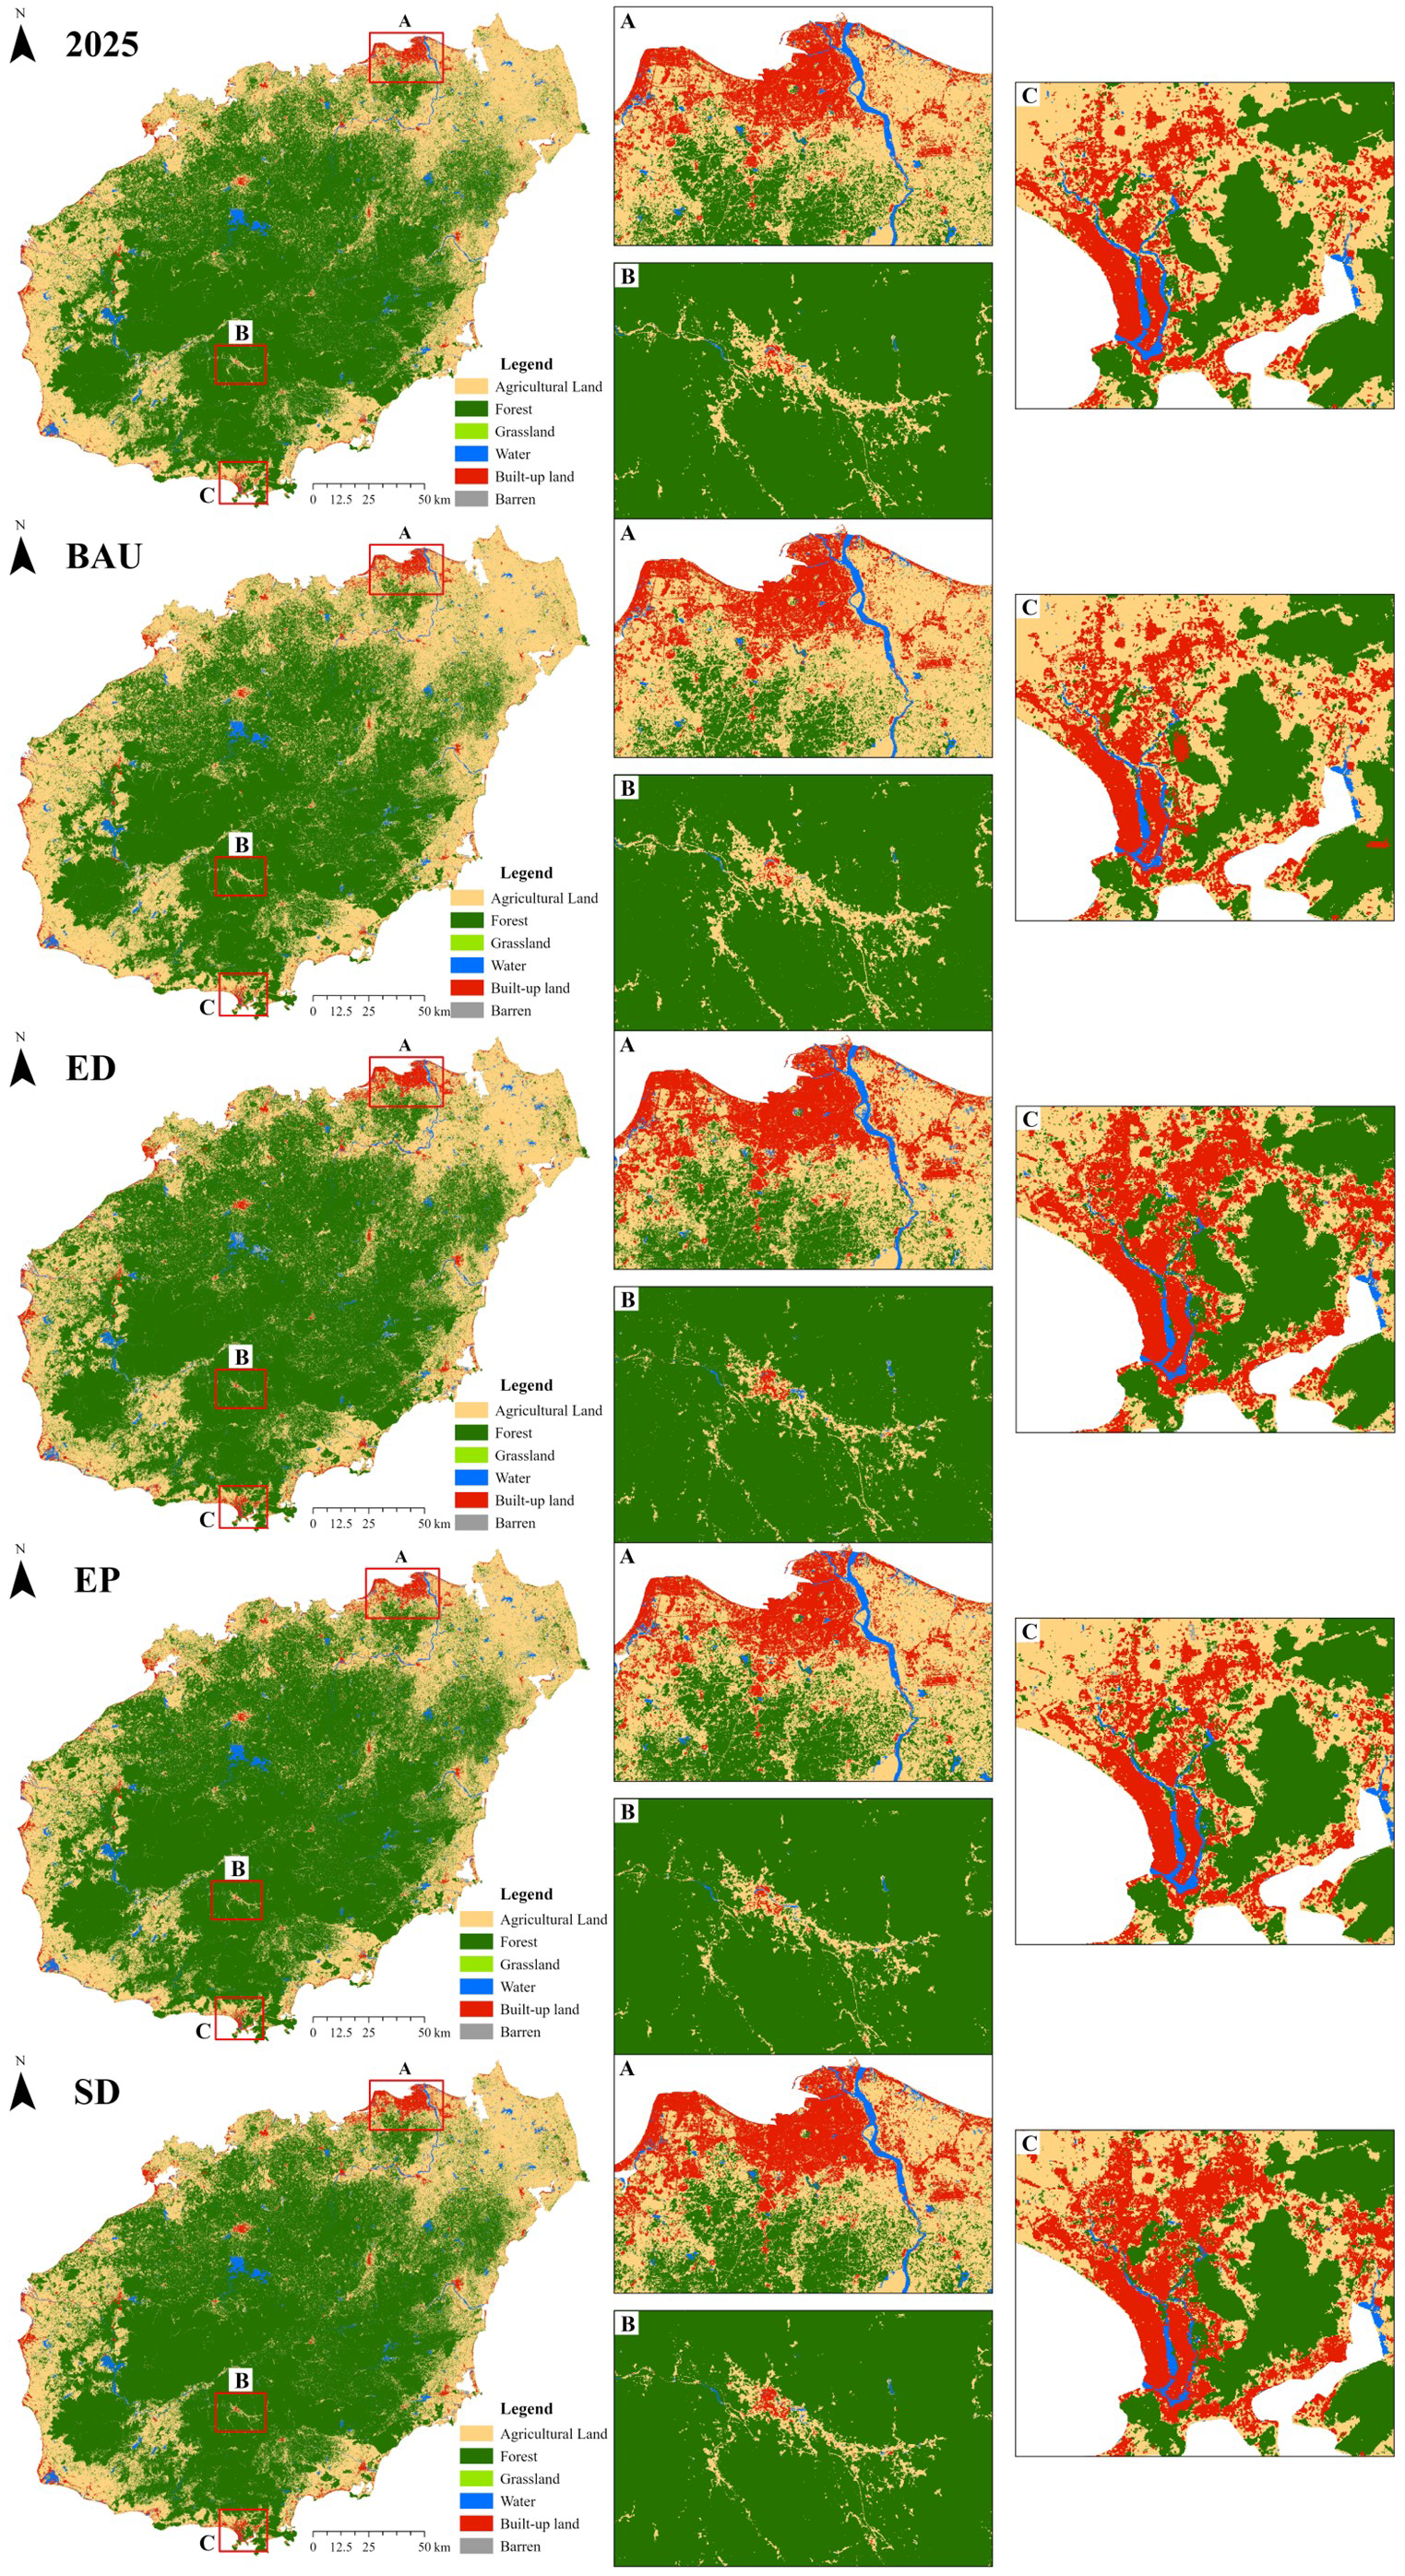

Disclaimer/Publisher’s Note: The statements, opinions and data contained in all publications are solely those of the individual author(s) and contributor(s) and not of MDPI and/or the editor(s). MDPI and/or the editor(s) disclaim responsibility for any injury to people or property resulting from any ideas, methods, instructions or products referred to in the content. |
© 2026 by the authors. Licensee MDPI, Basel, Switzerland. This article is an open access article distributed under the terms and conditions of the Creative Commons Attribution (CC BY) license.