


Abstract
Vegetation carbon sinks are an important component of the terrestrial carbon cycle, and net ecosystem productivity (NEP) is widely used to indicate ecosystem carbon-sink strength. However, the long-term dynamics and environmental associations of vegetation carbon sinks in the middle and lower Yellow River Basin remain insufficiently understood. Based on remote-sensing net primary productivity (NPP) and an empirical heterotrophic-respiration model, annual NEP was estimated for 2001–2024. Theil–Sen trend analysis, the Mann–Kendall test, coefficient of variation, optimal-parameter geographical detector (OPGD), and regression residual analysis were applied. Basin-mean annual NEP increased from approximately 214 to 425 g C m−2 yr−1, with significantly increasing areas accounting for 89.93% of the study area. Areas with NEP above 300 g C m−2 yr−1 expanded from 18.51% to 78.86%. Precipitation and solar radiation showed the highest explanatory power for NEP spatial differentiation, with mean q values of 0.538 and 0.490, and their interaction reached 0.722. Comparison with a published NEP product, parameter-sensitivity analysis, and an NPP-based robustness test supported the main temporal patterns and factor rankings. The residual-derived non-climatic component exceeded 40% of the combined component-trend magnitude across approximately 94% of the study area, but should not be interpreted as a direct measure of human activities. These findings support regional carbon-sink monitoring, water-constrained ecological restoration, and land-use management.
1. Introduction
Terrestrial carbon cycling is increasingly being reshaped by climate change and expanding human activities [1,2,3]. As a major pathway for atmospheric carbon dioxide uptake and sequestration, terrestrial vegetation plays an important role in climate regulation, ecological security, and ecosystem services [4,5,6]. However, rising greenhouse gas concentrations, more frequent heat and drought events, and intensified land-use change are altering ecosystem structure and carbon-cycle processes, resulting in pronounced spatial heterogeneity in vegetation carbon-sink capacity [3,7,8,9]. Mitigating climate change, reducing carbon emissions, and enhancing natural carbon sinks have therefore become important priorities in global climate governance and regional sustainability planning [3,10]. Because vegetation composition, carbon-sequestration potential, and ecosystem responses vary with climate, topography, land use, and human disturbance [6,9], regional assessment of vegetation carbon sinks and their associated environmental factors is essential for carbon-cycle research and spatially differentiated ecosystem management.
Net ecosystem productivity (NEP) is widely used as an indicator of ecosystem carbon-sink strength. In the framework adopted here, NEP is estimated as the difference between net primary productivity and soil heterotrophic respiration, representing the balance between vegetation carbon production and heterotrophic respiratory loss [11,12,13]. Because this formulation does not explicitly include lateral carbon transport, harvest removals, fires, or other disturbance-related fluxes, it should be interpreted as a model-derived ecological NEP indicator rather than a complete net ecosystem carbon balance. NEP is commonly estimated using field observations or model-based simulations [14,15]. Field observations provide relatively direct measurements of ecosystem carbon exchange but are limited by site coverage, observation duration, and maintenance costs [16]. Model-based approaches integrate remote-sensing and environmental data and are therefore widely applied to regional and long-term NEP assessments, although their absolute estimates remain affected by input data, empirical parameters, spatial resolution, and model structure [17]. Previous studies have examined NEP dynamics at national, basin, and ecological-zone scales [18,19], and recent research has analyzed long-term NEP persistence and hydroclimatic thresholds across the entire Yellow River Basin during 2001–2024 [20]. Vegetation productivity indicators have also been used to assess ecosystem responses associated with ecological restoration [21]. Nevertheless, studies specifically targeting the middle and lower Yellow River Basin have rarely integrated optimized spatial-factor detection, climate–residual component analysis, independent product comparison, parameter sensitivity, and mathematical-coupling tests within a unified framework.
NEP variation reflects the combined effects of environmental conditions and human activities [22]. Precipitation regulates soil-water availability and vegetation physiological activity, temperature affects phenology, photosynthesis, and ecosystem respiration, and solar radiation supplies energy for photosynthetic carbon assimilation [23,24]. Topography further influences vegetation habitats by redistributing regional water and heat conditions [25]. Trait-based evidence indicates that plant water-use strategies, functional traits, and community productivity vary along soil-water gradients, thereby affecting vegetation responses to water stress [26]. Increasing ecosystem water limitation across the Yellow River Basin also suggests that vegetation recovery and carbon-sink enhancement must be evaluated together with regional hydrological constraints [27]. Human activities influence NEP mainly through land-cover change and ecological management. Urban expansion may reduce vegetation carbon-sink capacity, whereas cropland conversion and ecological restoration can promote vegetation recovery over certain periods [28,29]. However, the relative explanatory importance of different factors and their joint associations with NEP remain insufficiently understood. Geographical detector methods have been widely used to analyze spatially stratified environmental relationships [30,31]. The optimal-parameter geographical detector (OPGD) further optimizes continuous-variable discretization methods and class numbers, reducing the influence of subjective classification choices [32]. Nevertheless, OPGD q values and interaction results represent statistical spatial associations and joint explanatory power rather than direct ecological causality.
The middle and lower Yellow River Basin connects the western ecological barrier with the economically developed eastern region and is important for regional ecological security and land-system sustainability [33]. It is also characterized by strong interactions between ecological sensitivity and intensive human activity [34]. Its environmental gradient extends from the semi-arid Loess Plateau and mountain–plain transition zones to intensively cultivated and urbanized downstream plains, making it suitable for examining spatial differences in vegetation carbon sinks. However, the long-term dynamics and environmental associations of vegetation carbon sinks in this region remain insufficiently understood, particularly the relative explanatory power of selected environmental factors and the NEP component not linearly explained by major climatic variables. This study integrates remote-sensing, meteorological, topographic, and land-use data from 2001 to 2024 and uses model-derived NEP as an indicator of vegetation carbon-sink strength to analyze its long-term trends, temporal stability, spatial differentiation, and environmental associations. OPGD and multiple regression residual analysis are used to evaluate the individual and pairwise explanatory power of environmental factors and to distinguish the climate-predicted component from the residual-derived non-climatic component. The residual may partly reflect land-use change, ecological restoration, vegetation management, and urban expansion, but it may also contain omitted environmental effects and model uncertainty; it is therefore not treated as a direct measure of human activities. Specifically, this study addresses three questions: (1) What are the long-term trends, spatial patterns, and temporal stability of model-derived NEP? (2) Which climatic and topographic factors show the highest explanatory power for NEP spatial differentiation, and how do their pairwise combinations affect joint explanatory power? (3) How do the climate-predicted and residual-derived components differ spatially, and how are the residual patterns associated with land-use change? Robustness is further assessed through comparison with a published NEP product, a ±10% parameter-sensitivity analysis, and an NPP-based test of potential mathematical coupling. The results provide a regional basis for vegetation carbon-sink monitoring, ecological restoration, and spatially differentiated management in the middle and lower Yellow River Basin.
2. Materials and Methods
2.1. Study Area
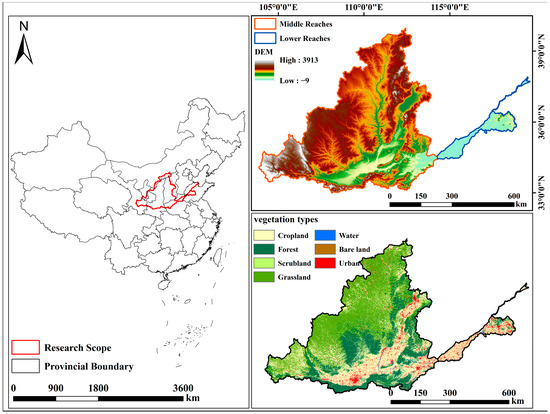
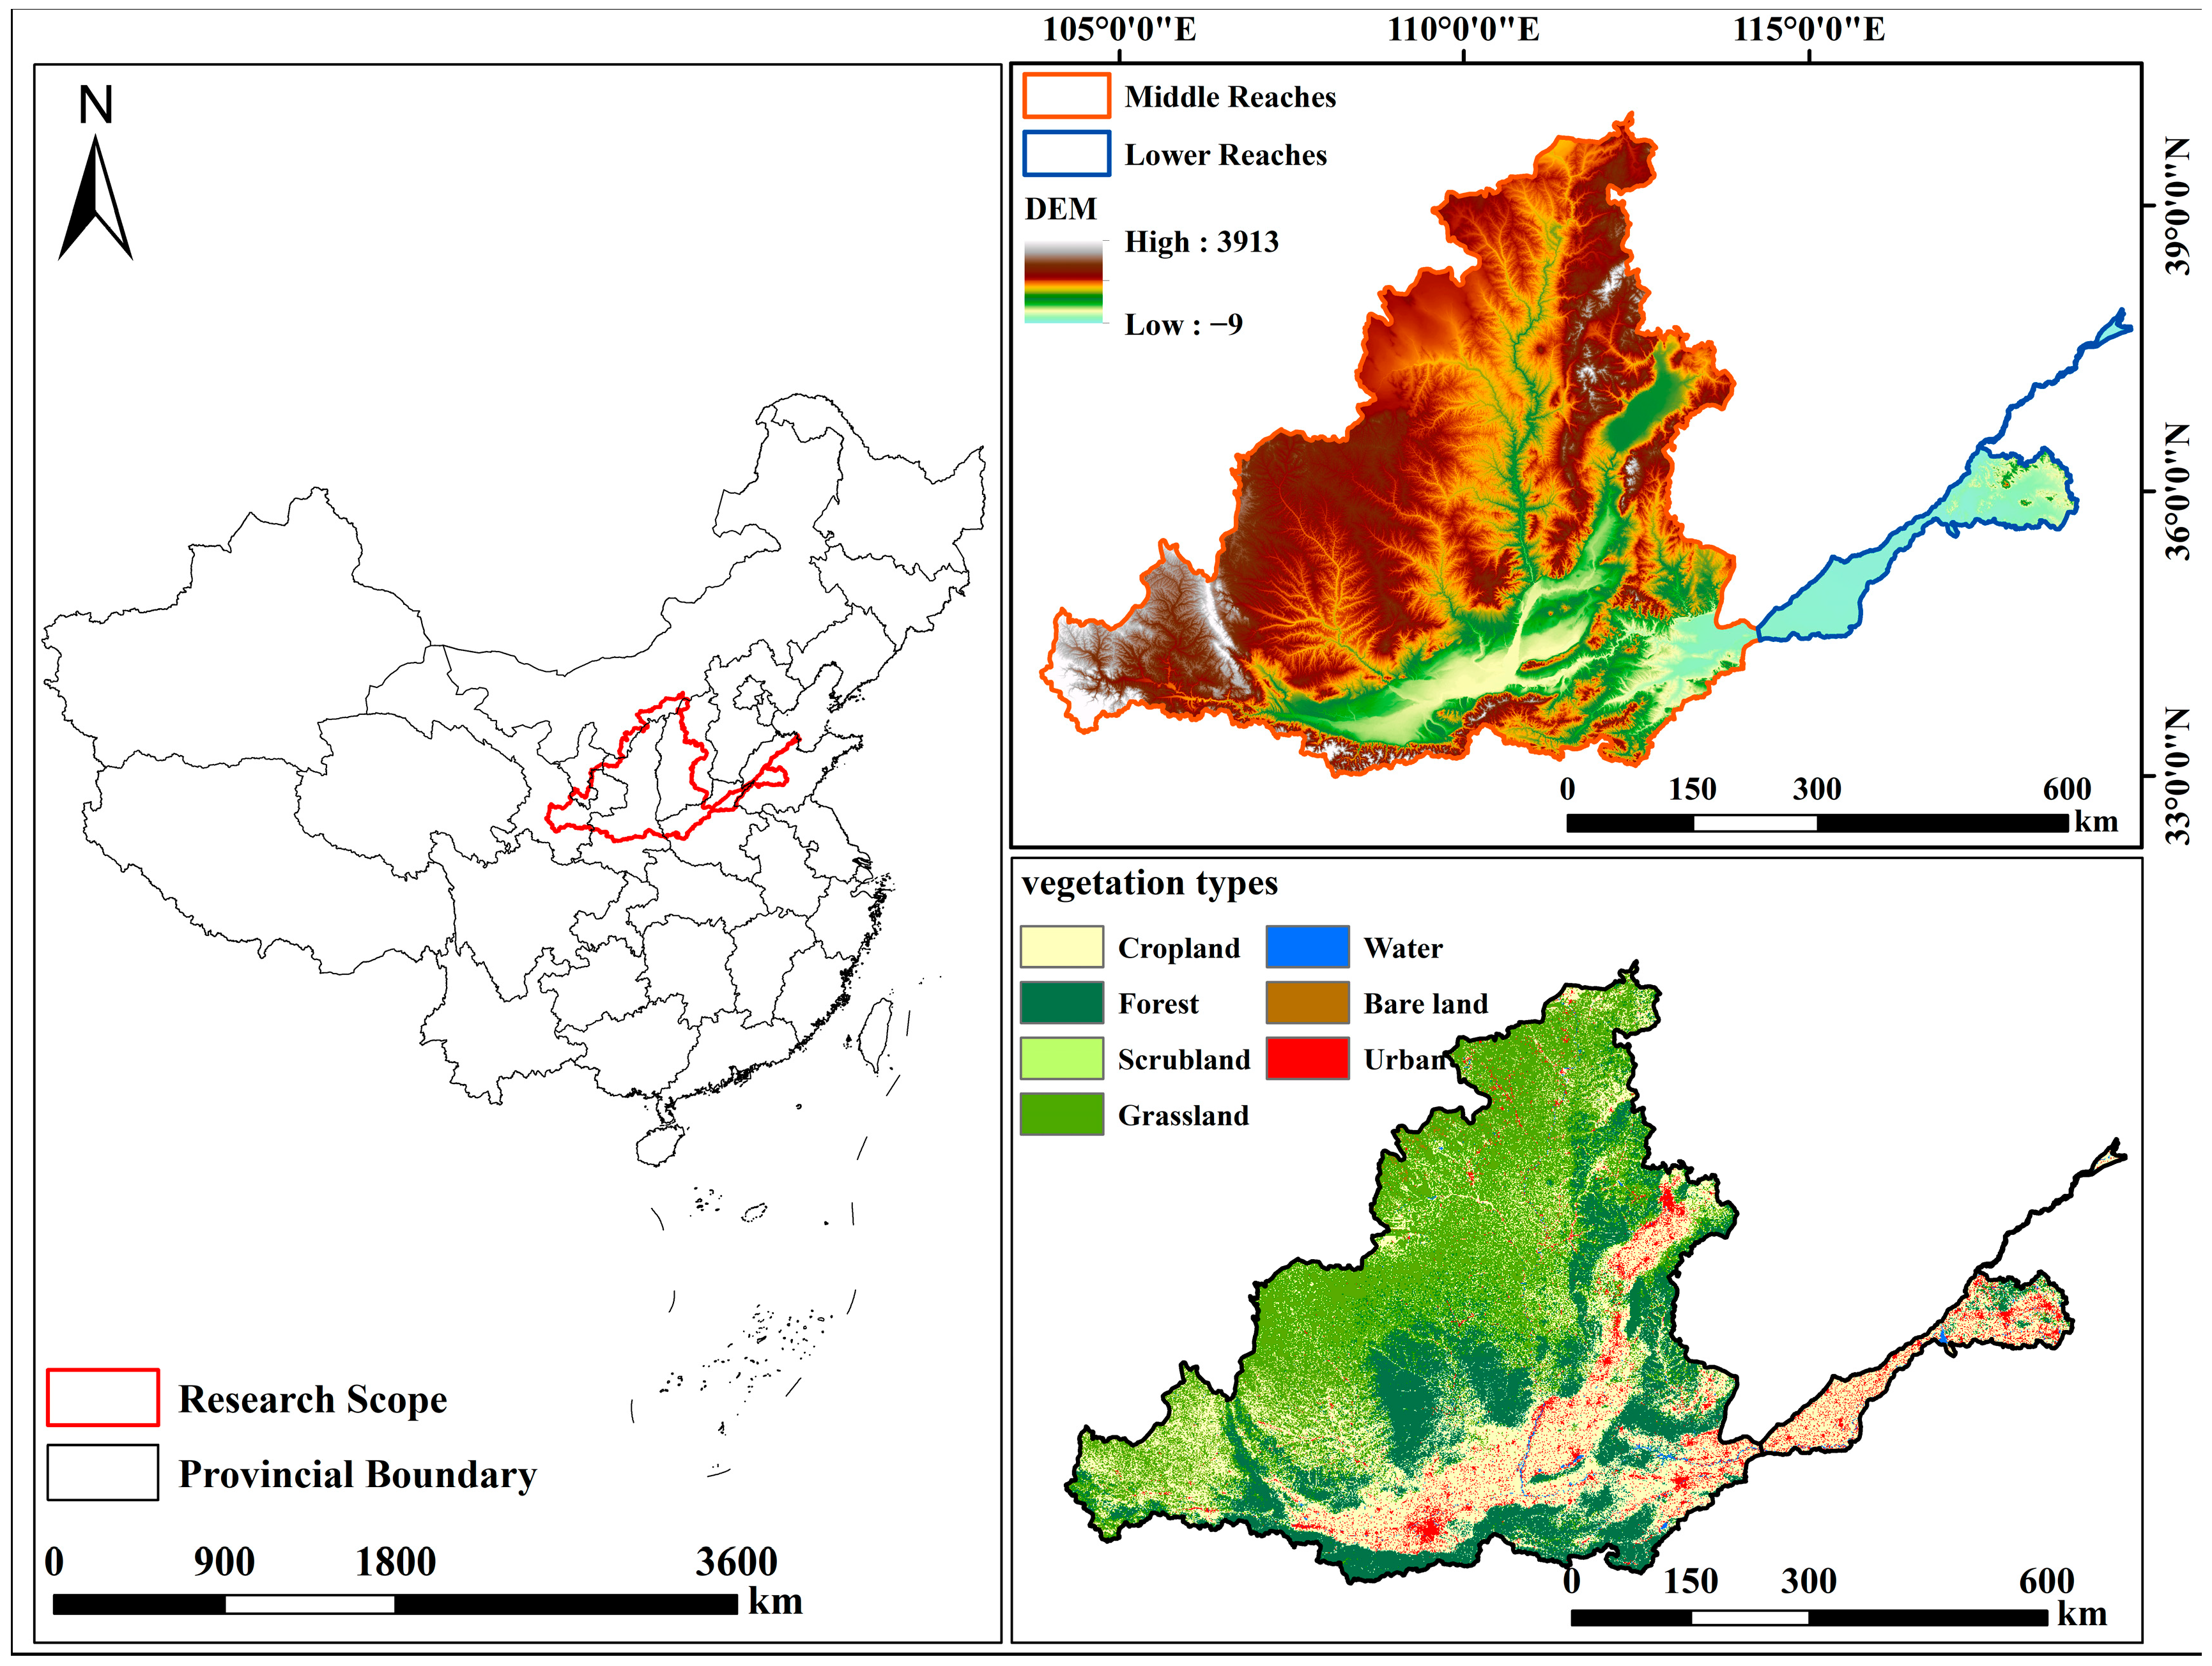
The middle and lower Yellow River Basin is located in northern China, extending approximately from 103°57′ to 119°12′ E and from 33°43′ to 40°48′ N, with a total area of approximately 366,405 km2. In this study, the spatial extent was defined as the basin area corresponding to the Yellow River section from Hekou Town in Inner Mongolia to the estuary near Dongying, Shandong Province. The study area spans Inner Mongolia, Shanxi, Shaanxi, Henan, and Shandong (Figure 1). This region crosses several distinct physiographic units, including the Loess Plateau, mountainous and hilly areas, and the lower alluvial plain. The middle reaches are characterized by pronounced topographic relief, with widespread hills, gullies, and dissected terrain, whereas the lower reaches are dominated by relatively flat alluvial plains. Owing to the combined effects of topography, climate, and land-use patterns, the study area exhibits substantial environmental heterogeneity, resulting in marked spatial differentiation in vegetation distribution.
Figure 1.
Overview map of the study area.
2.2. Data Sources and Preprocessing
This study integrated multi-source datasets for the period 2001–2024, including net primary productivity (NPP), meteorological variables (precipitation, air temperature, and solar radiation), topographic variables (DEM, slope, and aspect), and land-use/land-cover data. Slope and aspect were derived from the DEM. These datasets were obtained from publicly available data platforms and were used for NEP estimation, spatiotemporal analysis, environmental-factor analysis, and land-use interpretation. An independently published NEP product covering 2000–2020 was additionally used for cross-product comparison over the overlapping period of 2001–2020. Detailed information on the datasets is provided in Table 1.
Table 1.
Description of datasets used in this study.
All raster datasets were projected to the WGS 1984 UTM Zone 48N coordinate system and aligned to a common 1 km spatial grid. Mean annual air temperature, annual accumulated precipitation, and mean annual solar radiation were derived for each year from 2001 to 2024. Continuous datasets, including NPP, climatic variables, DEM, and slope, were resampled using bilinear interpolation, whereas categorical datasets, including aspect and land-use/land-cover, were resampled using the nearest-neighbor method. Slope and aspect were derived from the DEM before spatial alignment. All datasets were clipped using the same study-area boundary and standardized to an identical spatial extent, cell size, and cell origin.
2.3. Analytical Framework
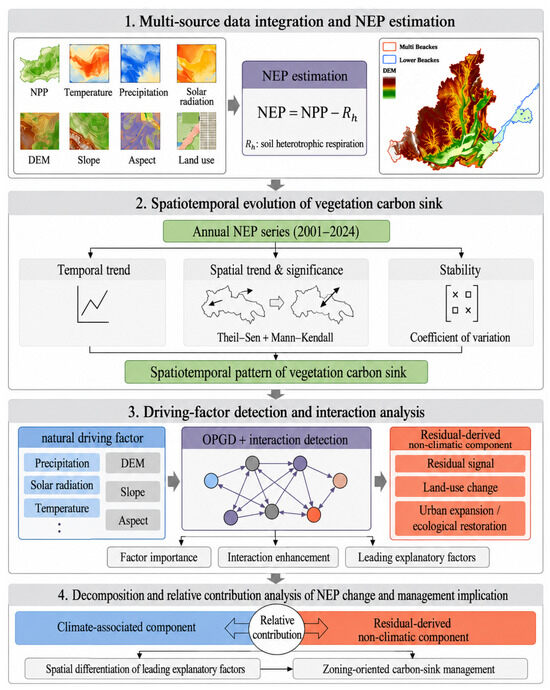
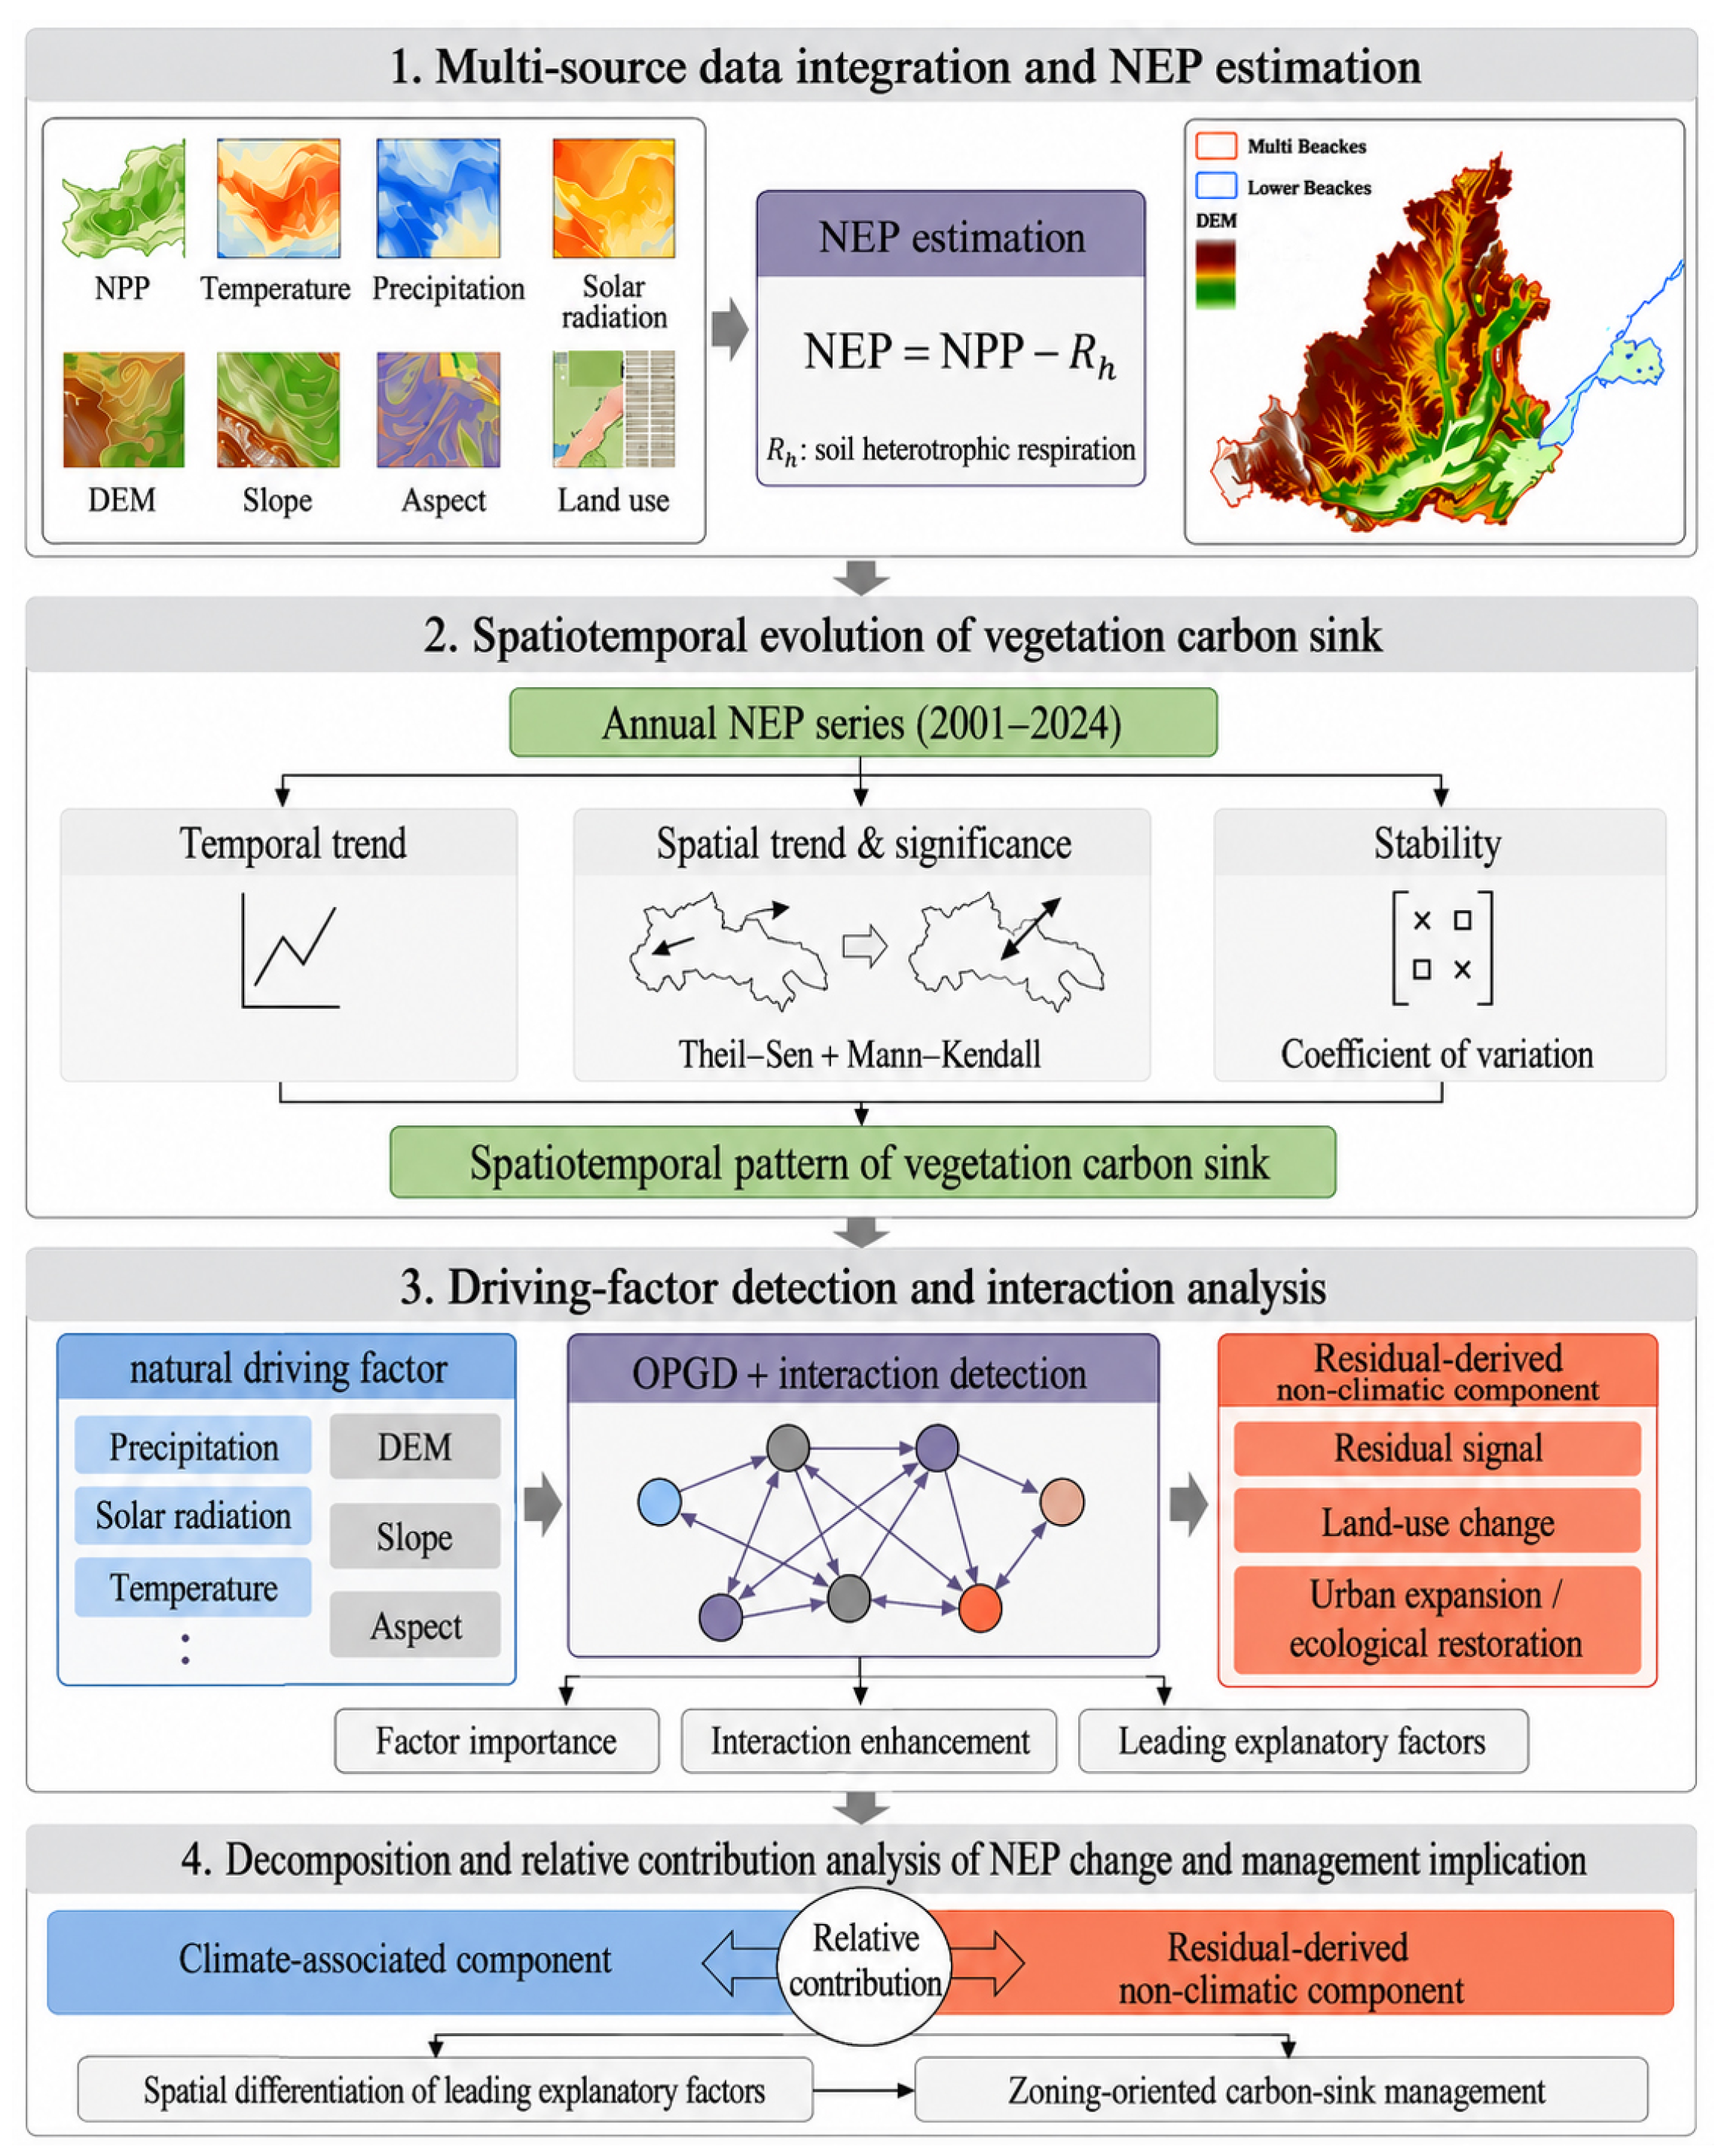
The analytical framework of this study consisted of four main steps (Figure 2). First, multi-source datasets, including NPP, meteorological variables, topographic factors, and land-use/land-cover data were collected, preprocessed, and integrated to estimate annual NEP from 2001 to 2024. Second, the spatiotemporal evolution of vegetation carbon sinks was assessed using mean annual NEP, NEP class transitions, Theil–Sen trend analysis, the Mann–Kendall significance test, and the coefficient of variation. Third, the optimal-parameter geographical detector was applied to identify the explanatory power of individual environmental factors and their pairwise interactions on the spatial differentiation of NEP. Finally, multiple regression residual analysis was used to distinguish the climate-predicted NEP component from the residual-derived non-climatic component, and the results were interpreted together with land-use/land-cover changes to support differentiated carbon-sink management.
Figure 2.
Analytical framework of the study.
2.4. Assessment of NEP Spatiotemporal Dynamics
2.4.1. NEP Estimation Model
Net reflects the net carbon-sequestration capacity of an ecosystem over a given period and is widely used to determine whether a regional ecosystem functions as a carbon source or a carbon sink [36]. In this study, NEP was calculated as the difference between vegetation NPP and soil heterotrophic respiration (), as follows:
where denotes the net ecosystem productivity of pixel in year , represents the vegetation net primary productivity of pixel in year , and is the soil heterotrophic respiration of pixel in year . When > 0, carbon fixed by vegetation exceeds carbon released through soil microbial respiration, indicating that the ecosystem acts as a carbon sink; otherwise, it acts as a carbon source [37].
The soil heterotrophic-respiration model has been widely applied in regional vegetation carbon-sink assessments [36,38]. In this study, the empirical heterotrophic-respiration model was implemented at an annual time scale, following its annual application in previous regional NEP studies [39,40].
where and represent the monthly mean air temperature and monthly precipitation of pixel in year respectively. Monthly heterotrophic respiration was calculated for each month and subsequently summed to obtain the annual value.
The estimated NEP represents a model-derived ecological indicator rather than a directly observed carbon flux. Its robustness was assessed by comparison with a published NEP product over 2001–2020 using common valid pixels, a ±10% perturbation of the key heterotrophic-respiration parameters, and an NPP-based OPGD analysis. These assessments examined the consistency of temporal variation, trend direction, source–sink classification, and environmental-factor rankings, while also evaluating potential mathematical coupling.
2.4.2. Analysis of Interannual Trends
The Theil–Sen median estimator is a robust nonparametric method for detecting monotonic trends in time-series data [37]. It is widely used in long-term environmental and ecological studies because it is less sensitive to outliers and does not require the data to follow a specific distribution. In this study, the Theil–Sen estimator was applied to quantify the temporal trend of NEP in the middle and lower Yellow River Basin from 2001 to 2024. The trend slope was calculated as follows:
where is the estimated trend slope. 0 indicates an increasing NEP trend, < 0 indicates a decreasing trend, and = 0 indicates no change. ( ) denotes the median operator; and are the NEP values in years () and (), respectively; and (n) represents the length of the time series, where (1 < < < n).
The Mann–Kendall test was further used to assess the statistical significance of NEP trends. As a nonparametric trend test, it is suitable for long-term time-series analysis because it does not require the data to follow a normal distribution and is relatively robust to the influence of zero values and outliers. Therefore, it was applied in this study to test the significance of NEP trends during the study period.
where ( ) denotes the sign function, represents the variance of the statistic , and is the standardized test statistic. When (|| > 1.96) and (|| > 2.58), the trend is considered statistically significant at the 95% and 99% confidence levels, respectively. Based on the Theil–Sen trend slope and the Mann–Kendall significance test, NEP trends were classified into five categories, as shown in Table 2.
Table 2.
Classification criteria for NEP change trends.
2.4.3. Stability Analysis of NEP
The coefficient of variation (CV) was used to assess the temporal stability of the NEP time series. CV was calculated as the ratio of the standard deviation to the mean value, as follows:
where represents the coefficient of variation, is the NEP value in year , denotes the multi-year mean NEP over the study period, and is the total number of years. A lower value indicates weaker interannual variability and higher stability of vegetation carbon sinks, whereas a higher value indicates stronger NEP fluctuations and lower temporal stability.
Only pixels with valid NEP values for all 24 years were included in the CV analysis, and the multi-year mean NEP was positive for all retained pixels; therefore, no zero or negative denominators occurred. For descriptive mapping, CV values were classified into three intervals: <0.1, 0.1–0.3, and 0.3–0.5.
2.4.4. Optimal-Parameter Geographical Detector Model
- (1)
- Factor detector
The optimal-parameter geographical detector (OPGD) model is an improved version of the conventional geographical detector. By optimizing the discretization scheme and spatial parameter settings, OPGD can reduce the uncertainty and potential bias caused by subjectively defined classification intervals, thereby improving the accuracy and robustness of spatial explanatory analysis [38]. Therefore, it was used in this study to identify the environmental factors with the highest explanatory power for the spatial differentiation of NEP in the middle and lower Yellow River Basin. The model is expressed as follows:
where represents the explanatory power of an environmental factor for the spatial differentiation of NEP; denotes a stratum; is the total number of strata; and ( are the number of samples and the variance within stratum , respectively; and and are the total number of samples and the overall variance of the study area, respectively. The value of ranges from 0 to 1, with a larger value indicating stronger explanatory power of the corresponding factor for the spatial differentiation of NEP.
- (2)
- Parameter optimization
The optimal-parameters were determined by evaluating different combinations of discretization methods and class numbers. Specifically, each continuous environmental factor was discretized using four methods: equal interval, geometric interval, natural breaks, and quantile. The candidate number of classes was uniformly set from 4 to 8. Because aspect has an explicit directional categorical property, it was preclassified into nine categories ranging from 0 to 8. The factor detector was then used to calculate the q value of each driving factor, and the combination of discretization method and class number that produced the highest q value was selected as the optimal-parameter setting. In this study, six environmental factors were selected to examine their explanatory power for NEP spatial differentiation: solar radiation (RAD), air temperature (TEM), precipitation (PRE), elevation (DEM), aspect (ASP), and slope (SLO).
To assess the potential mathematical coupling arising from the inclusion of air temperature and precipitation in the heterotrophic-respiration model, an additional robustness analysis was conducted using NPP as an alternative response variable. The NPP- and NEP-based analyses used identical spatial samples, explanatory variables, discretization methods, and candidate class numbers. The comparison covered 2001, 2005, 2010, 2015, 2020, and 2024, as well as the 2001–2024 mean period.
2.4.5. Multiple Regression Residual Analysis
A pixelwise multiple linear regression model was fitted with NEP as the dependent variable and air temperature, precipitation, and solar radiation as explanatory variables. The fitted values were used to represent the component of NEP variation statistically associated with the three included climatic variables:
where denotes the climate-predicted NEP component for pixel in year ; , , and represent mean annual air temperature, annual accumulated precipitation, and mean annual solar radiation, respectively; and , , , and are pixel-specific regression coefficients.
The residual-derived non-climatic component was calculated as:
where represents the estimated annual NEP and represents the component not explained by the linear effects of the three included climatic variables. The residual-derived component may partly reflect land-use change, ecological restoration, urban expansion, vegetation management, and other non-climatic processes. However, it may also contain omitted climatic effects, nonlinear climate–NEP relationships, atmospheric CO2 fertilization, nitrogen deposition, disturbances, input data uncertainty, and model structure error. Therefore, was not interpreted as a direct measurement of human activities.
To further quantify the relative contributions of the climate-associated and residual-derived non-climatic components to NEP changes, relative contribution rates were calculated based on the absolute values of their respective trend slopes:
where and represent the relative contribution rates of the climate-associated and residual-derived non-climatic components, respectively. Because the contribution rates were calculated using the absolute values of the trend slopes, they represent the relative magnitudes of the two component trends. The direction of each component was evaluated separately using the original signed slope, with positive and negative slopes indicating increasing and decreasing tendencies, respectively.
3. Results
3.1. Spatial and Temporal Characteristics of NEP
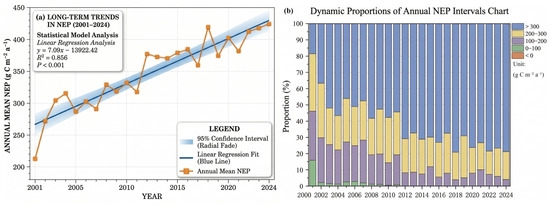
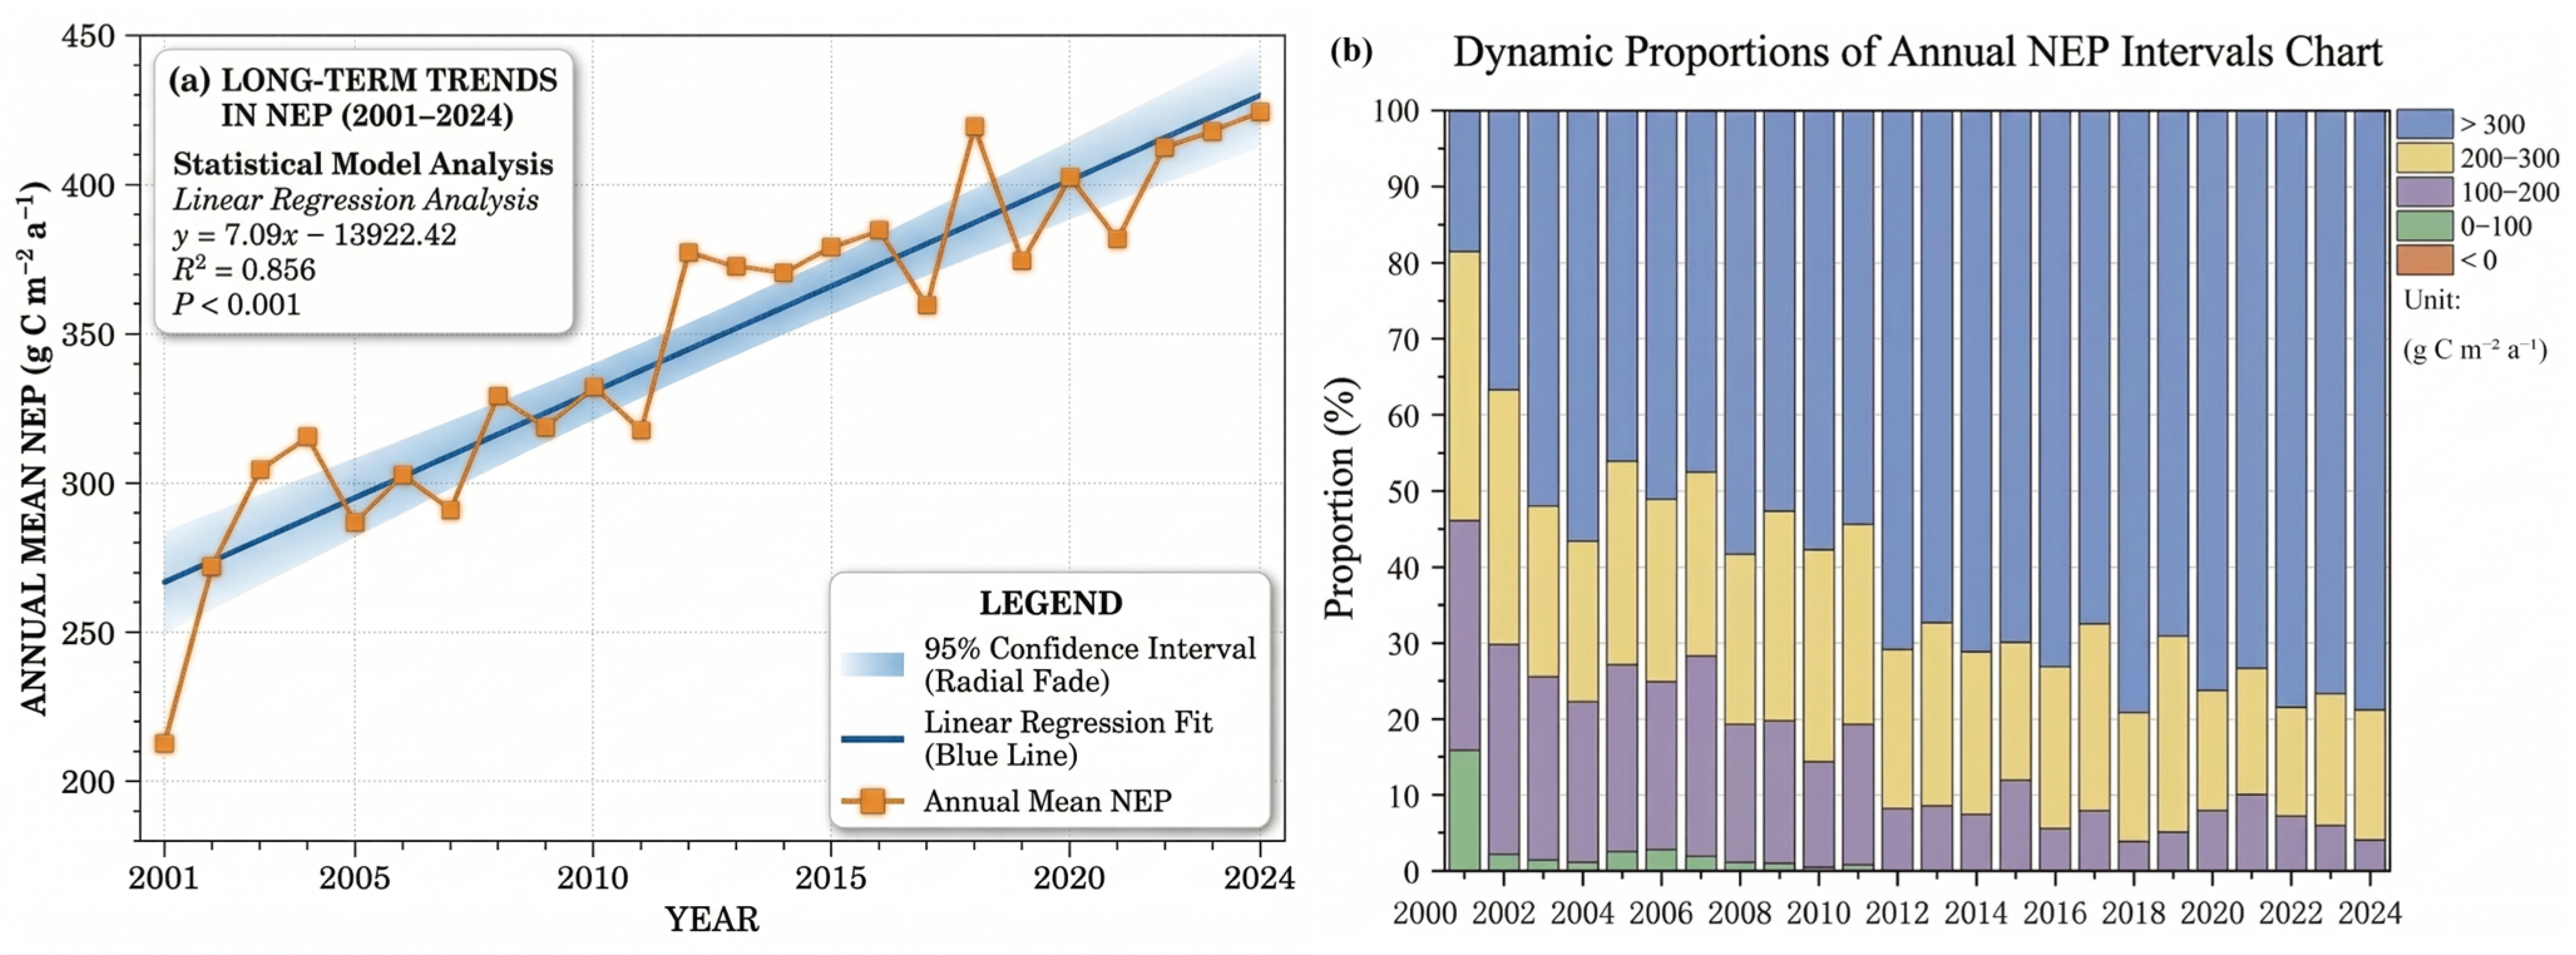
As shown in Figure 3a, vegetation NEP in the middle and lower Yellow River Basin exhibited an overall fluctuating upward trend from 2001 to 2024, indicating a continuous enhancement of regional vegetation carbon-sink capacity. During the study period, the mean annual NEP increased from approximately 214 g C m−2 yr−1 in 2001 to approximately 425 g C m−2 yr−1 in 2024. In terms of temporal stages, NEP increased rapidly during 2001–2004. Although interannual fluctuations occurred thereafter, the overall increasing trend was maintained. After 2012, NEP entered a relatively high-level stage, with mean annual values generally remaining above 360 g C m−2 yr−1.
Figure 3.
Changes in mean annual NEP and area proportions of different NEP classes in the middle and lower Yellow River Basin from 2001 to 2024.
Figure 3b shows that the area proportions of different NEP classes changed substantially from 2001 to 2024. High-NEP areas continued to expand, whereas medium- and low-NEP areas gradually contracted. Specifically, the proportion of areas with NEP greater than 300 g C m−2 yr−1 increased from 18.51% in 2001 to 78.86% in 2024 and became the dominant NEP class after 2012. In contrast, the proportion of areas with NEP values of 200–300 g C m−2 yr−1 decreased from 35.47% to 17.05%, while areas within the 100–200 g C m−2 yr−1 class declined from 30.17% to 4.05%. Areas with NEP values of 0–100 g C m−2 yr−1 further decreased from 15.83% to 0.04%. Negative NEP values were only sporadically observed in 2001, accounting for 0.02% of the study area, and were almost absent in the remaining years. Overall, the NEP class structure shifted from dominance by medium- and low-value areas toward dominance by high-value areas during the study period.
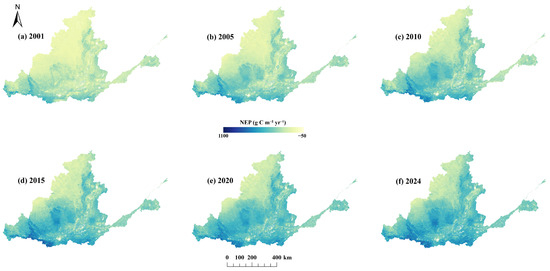
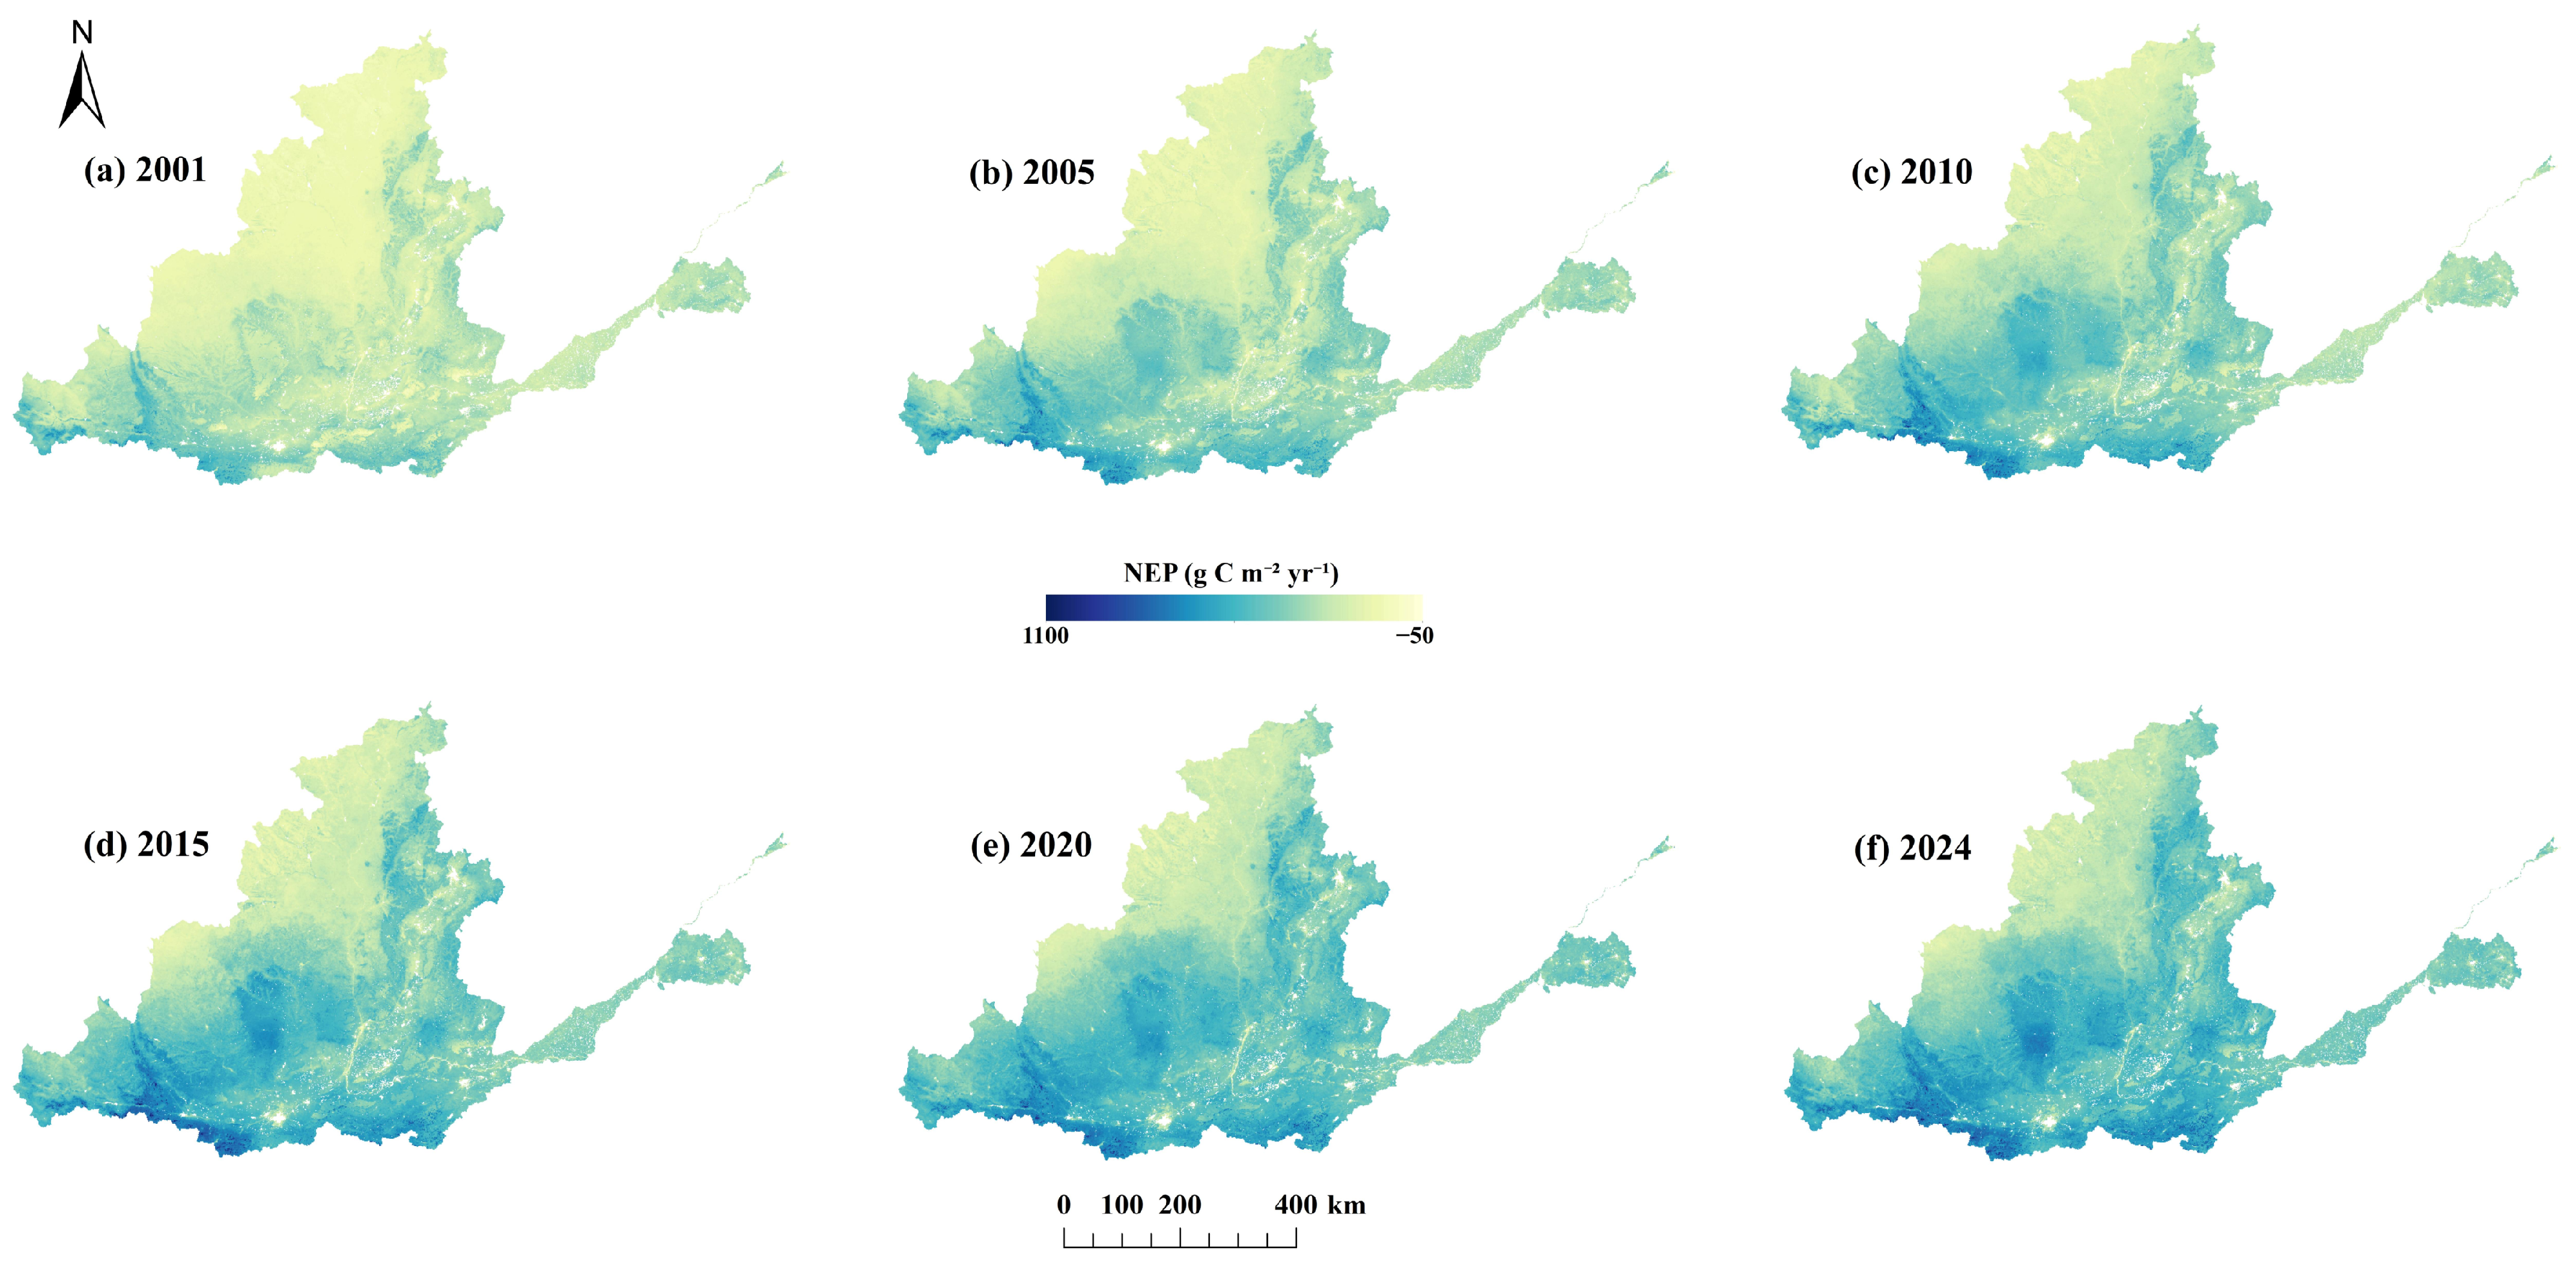
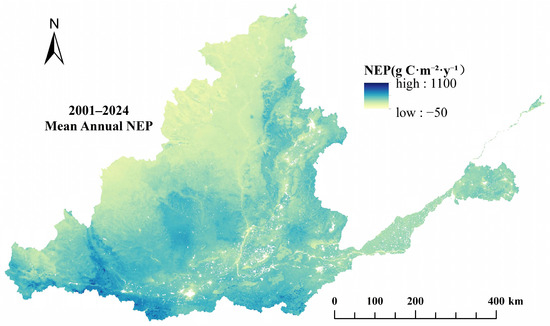
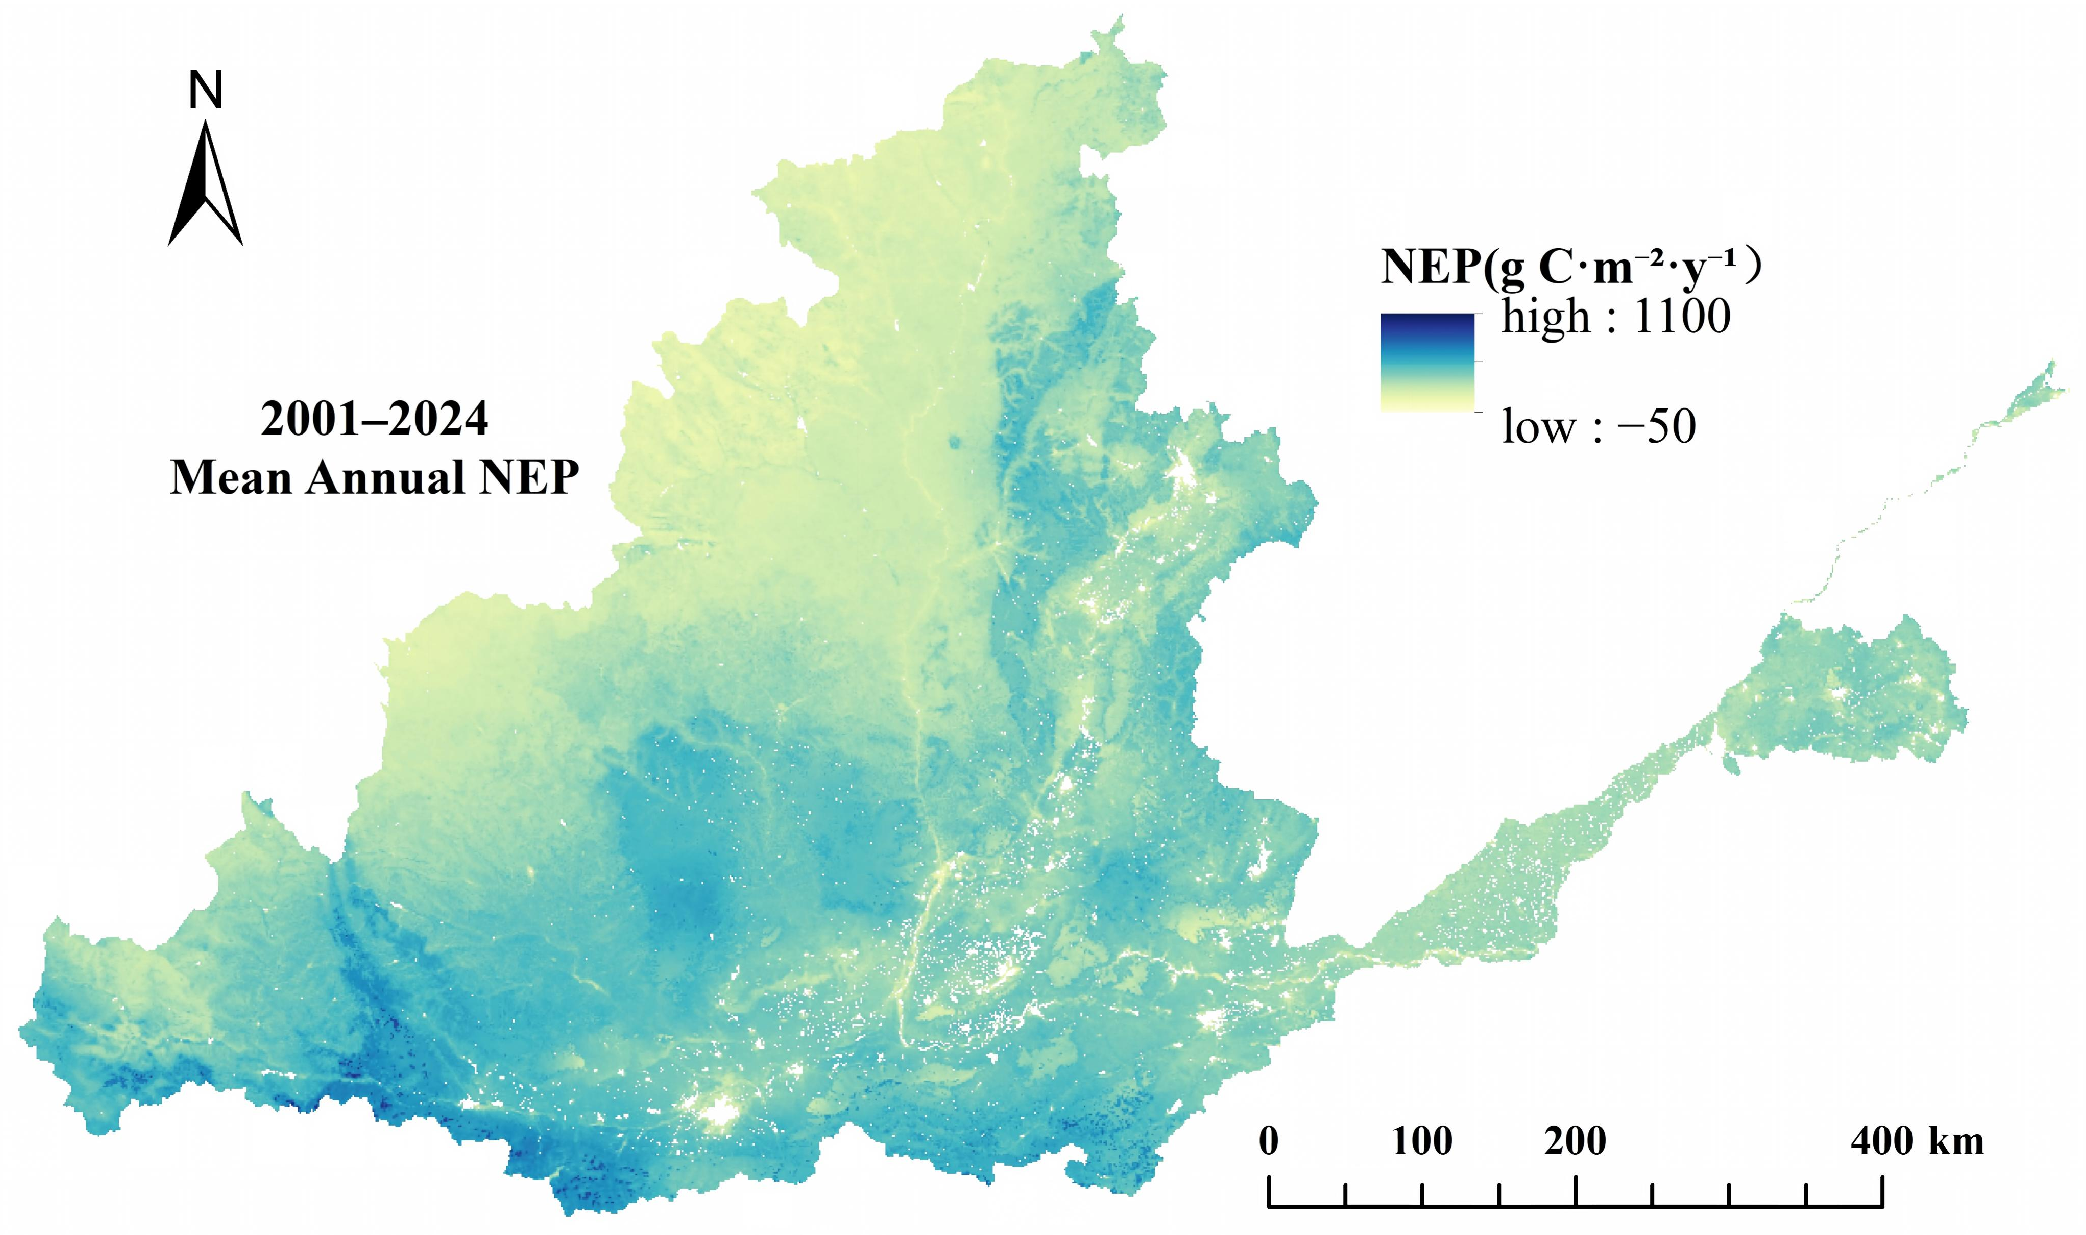
As shown in Figure 4 and Figure 5, the broad spatial gradient of NEP across the middle and lower Yellow River Basin remained relatively stable from 2001 to 2024, although NEP magnitude and the spatial extent of high-value areas increased over time. NEP was generally lower in the Ordos–Yulin area, northern Shaanxi, and northwestern Shanxi, and higher along the southern margin of the Guanzhong Plain, the western Henan Mountains, the southern Shanxi Mountains, and the southern mountainous–hilly transition zone. High-NEP areas expanded and became increasingly connected during the study period, whereas low-NEP areas remained concentrated in the northwestern part of the basin and in several densely urbanized plains, where they occurred as contiguous patches or fragmented clusters.
Figure 4.
Spatial distribution of NEP in the middle and lower Yellow River Basin in 2001, 2005, 2010, 2015, 2020, and 2024.
Figure 5.
Spatial distribution of mean annual NEP in the middle and lower Yellow River Basin during 2001–2024.
From a statistical perspective, the basin-wide multi-year mean NEP during 2001–2024 was 349.89 g C m−2 yr−1. The multi-year mean map further confirmed pronounced spatial heterogeneity across the basin, with relatively low NEP values in the northwestern part of the study area and higher values in the southern mountainous and hilly regions.
The parameter-sensitivity analysis further showed that the main temporal and spatial characteristics of NEP were insensitive to moderate perturbations of the empirical heterotrophic-respiration parameters. Across the eight sensitivity scenarios, the estimated linear trend ranged from 7.093 to 7.118 g C m−2 yr−1, corresponding to a relative change in less than 0.20% from the baseline. The minimum correlation with the baseline annual series was greater than 0.999, while the agreement in pixelwise trend direction and carbon source–sink classification exceeded 99.99%. These results indicate that the overall increasing trend and broad spatial pattern identified in this study were robust to the tested parameter perturbations.
3.2. Comparison with a Published NEP Product
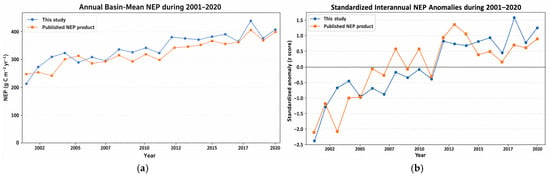
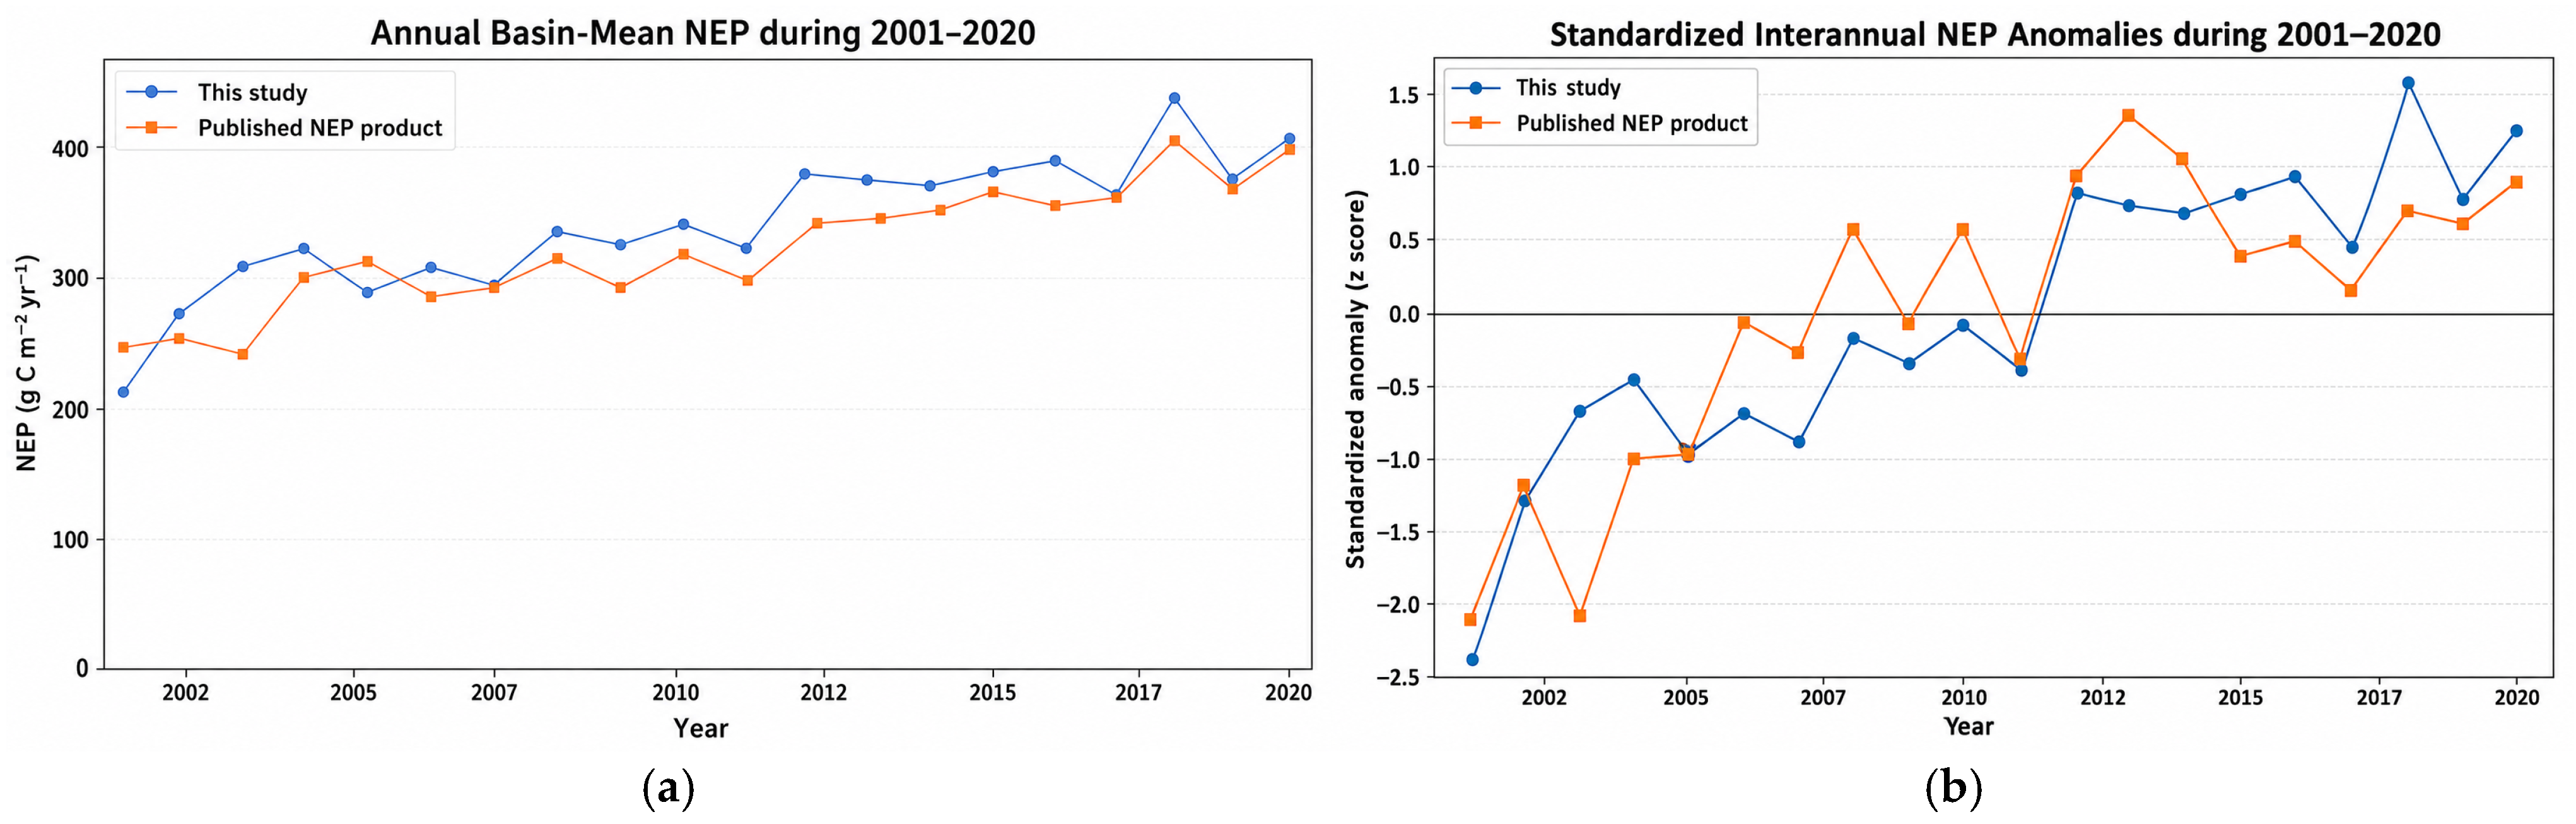
As shown in Figure 6, during 2001–2020, the NEP estimates from this study and the published product showed broadly consistent interannual variability and long-term increasing tendencies, although differences existed in their absolute magnitudes. The standardized anomalies further indicated that both products captured the principal temporal fluctuations. These absolute differences may arise from variations in NPP inputs, respiration formulations, model structures, and spatial processing. Therefore, the comparison provides an external consistency check for the broad temporal patterns of the model-derived NEP estimates.
Figure 6.
(a) Annual basin-mean NEP during 2001–2020; (b) standardized interannual NEP anomalies during 2001–2020.
3.3. Trends and Temporal Stability of NEP
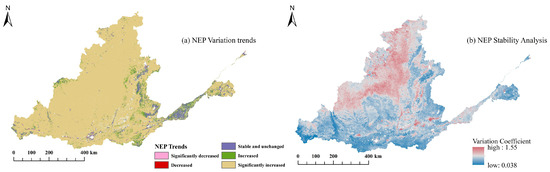
As shown in Figure 7a, NEP trends in the middle and lower Yellow River Basin were dominated by increases significant at p < 0.01 from 2001 to 2024, covering 89.93% of the study area and occurring widely across the main part of the region. Areas with increasing but non-significant trends and areas with no significant trend accounted for 4.93% and 4.92%, respectively. These areas were mainly distributed in belt-like or patchy patterns along the southern margin of the Guanzhong Plain–southern Shanxi–western Henan transition zone, the eastern margin of the Loess Plateau, and parts of the Shandong Peninsula. In contrast, areas with significant decreasing and decreasing trends accounted for only 0.13% and 0.09%, respectively, with a combined proportion of less than 0.25%. These decreasing areas were sparsely distributed in local parts of northwestern Shanxi, the northwestern margin of Henan, and isolated areas of the Shandong Peninsula. Overall, NEP changes during the study period were characterized mainly by positive enhancement, while areas with declining trends were highly limited in spatial extent.
Figure 7.
Spatial patterns of NEP trends and temporal stability in the middle and lower Yellow River Basin.
The spatial distribution of the coefficient of variation (CV) for NEP is shown in Figure 7b. Overall, the study area was dominated by low-to-moderate CV values, whereas high-CV areas accounted for a relatively small proportion. Areas with CV values below 0.1, between 0.1 and 0.3, and between 0.3 and 0.5 accounted for 4.05%, 91.85%, and 4.10% of the total vegetated area, respectively. These results indicate that interannual fluctuations in vegetation carbon sinks were generally weak across the middle and lower Yellow River Basin during the study period, and that most areas exhibited relatively high temporal stability.
Spatially, NEP variability was generally higher in the northern and northwestern parts of the study area and lower in the southern and southwestern parts, with some patchy heterogeneity in the central–eastern transitional zone. Overall, NEP showed generally low-to-moderate interannual variability while continuing to increase. High-variability areas were mainly located in the Ordos–Yulin area, northern Shanxi, and adjacent regions, with scattered high-CV patches also occurring in some densely urbanized areas and mountain–plain transitional zones in the middle and lower reaches. Low-variability areas were mainly concentrated in the southern mountainous and hilly areas, the western Henan mountains, and the southern Shanxi mountains.
3.4. Environmental Factors Associated with NEP Spatial Differentiation
3.4.1. Explanatory Power of Individual Factors
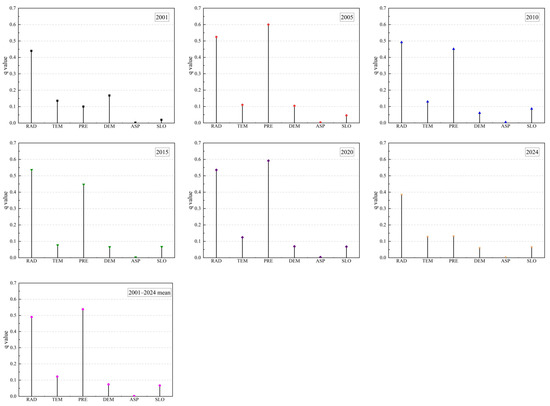
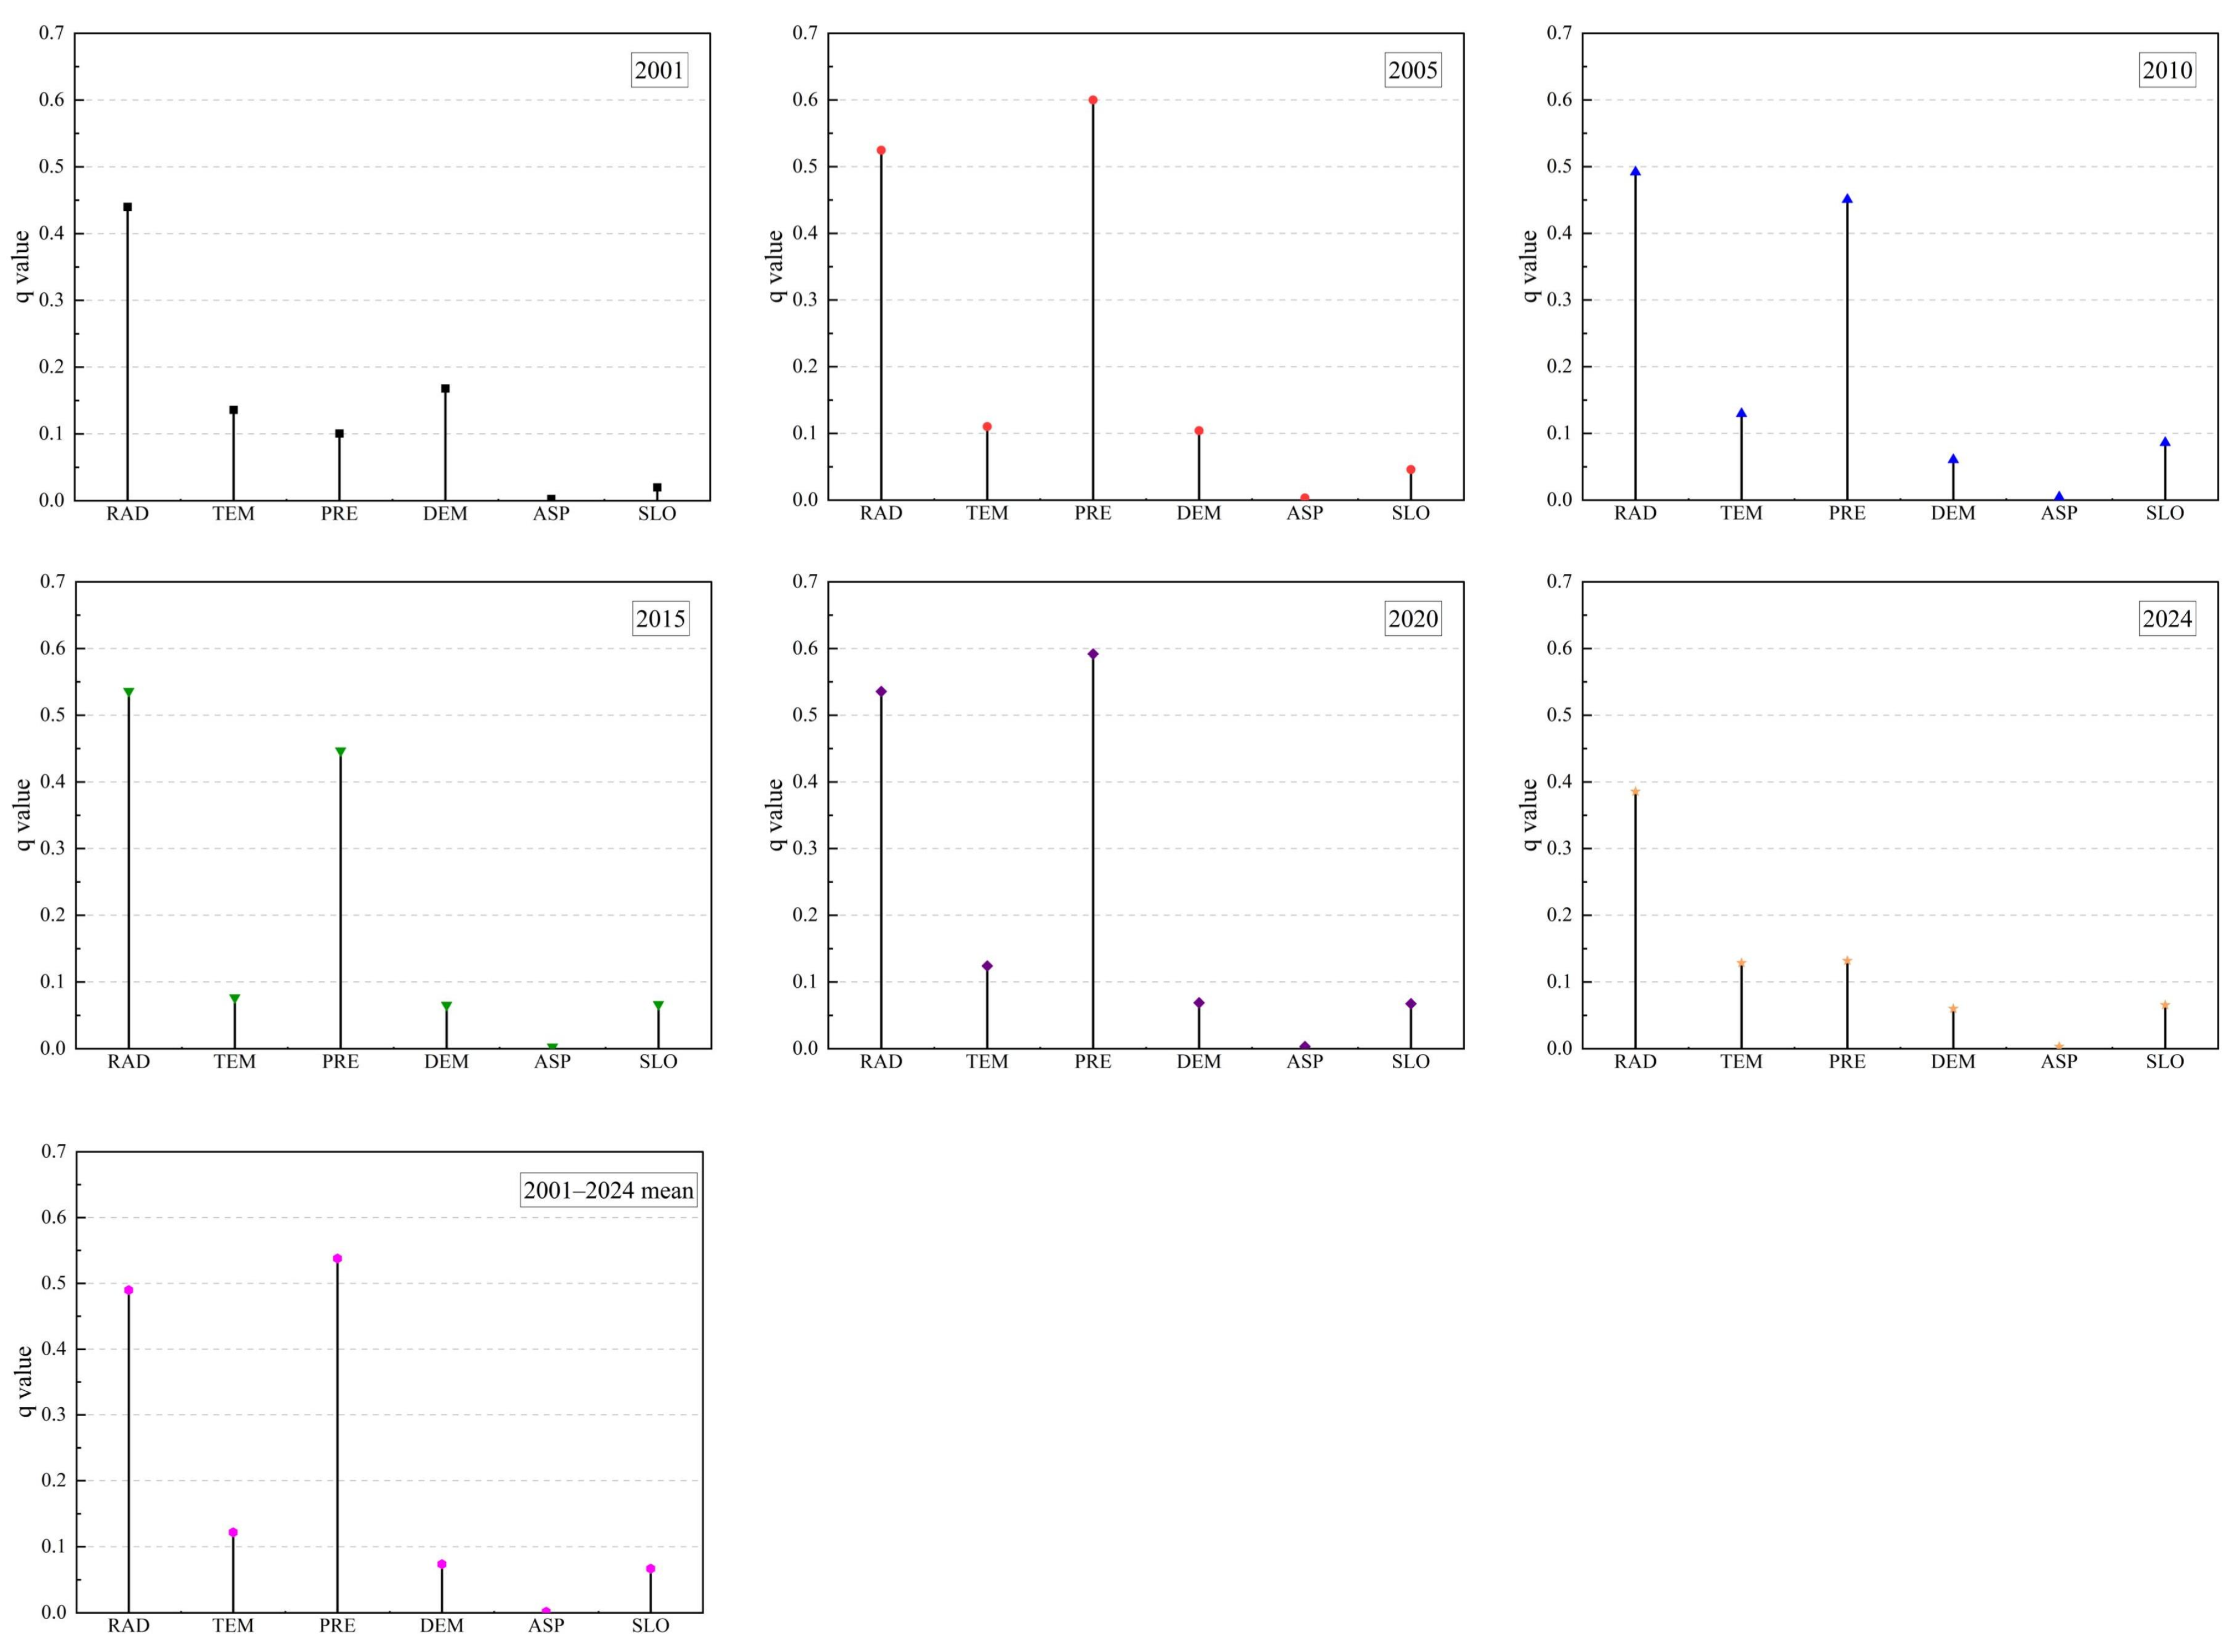
The spatial differentiation of NEP in the middle and lower Yellow River Basin was examined using the optimal-parameter geographical detector, and the results are shown in Figure 8. From 2001 to 2024, the explanatory power of the selected natural factors showed a clear hierarchical pattern. The mean q values followed the order: precipitation (0.538) > solar radiation (0.490) > air temperature (0.122) > DEM (0.074) > slope (0.067) > aspect (0.002). All factors passed the statistical significance test. Overall, precipitation and solar radiation showed the highest explanatory power for NEP spatial differentiation, followed by air temperature, whereas topographic factors, including DEM, slope, and aspect, showed relatively low explanatory power. These results indicate that climatic factors, particularly precipitation and solar radiation, were the leading explanatory factors associated with vegetation carbon-sink patterns in the middle and lower Yellow River Basin, while topographic conditions provided relatively stable background constraints through their effects on regional habitat conditions.
Figure 8.
Factor-detector results for the spatial differentiation of NEP in the middle and lower Yellow River Basin.
3.4.2. Pairwise Interaction Detection
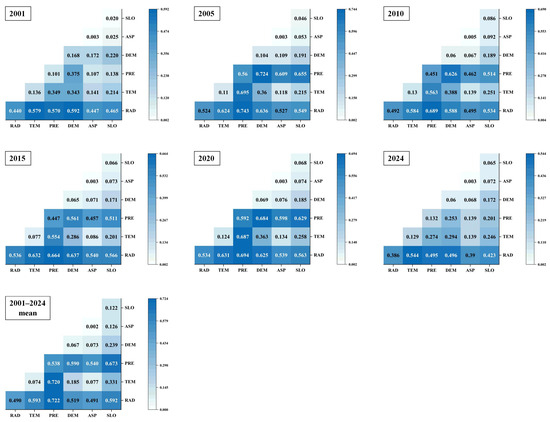
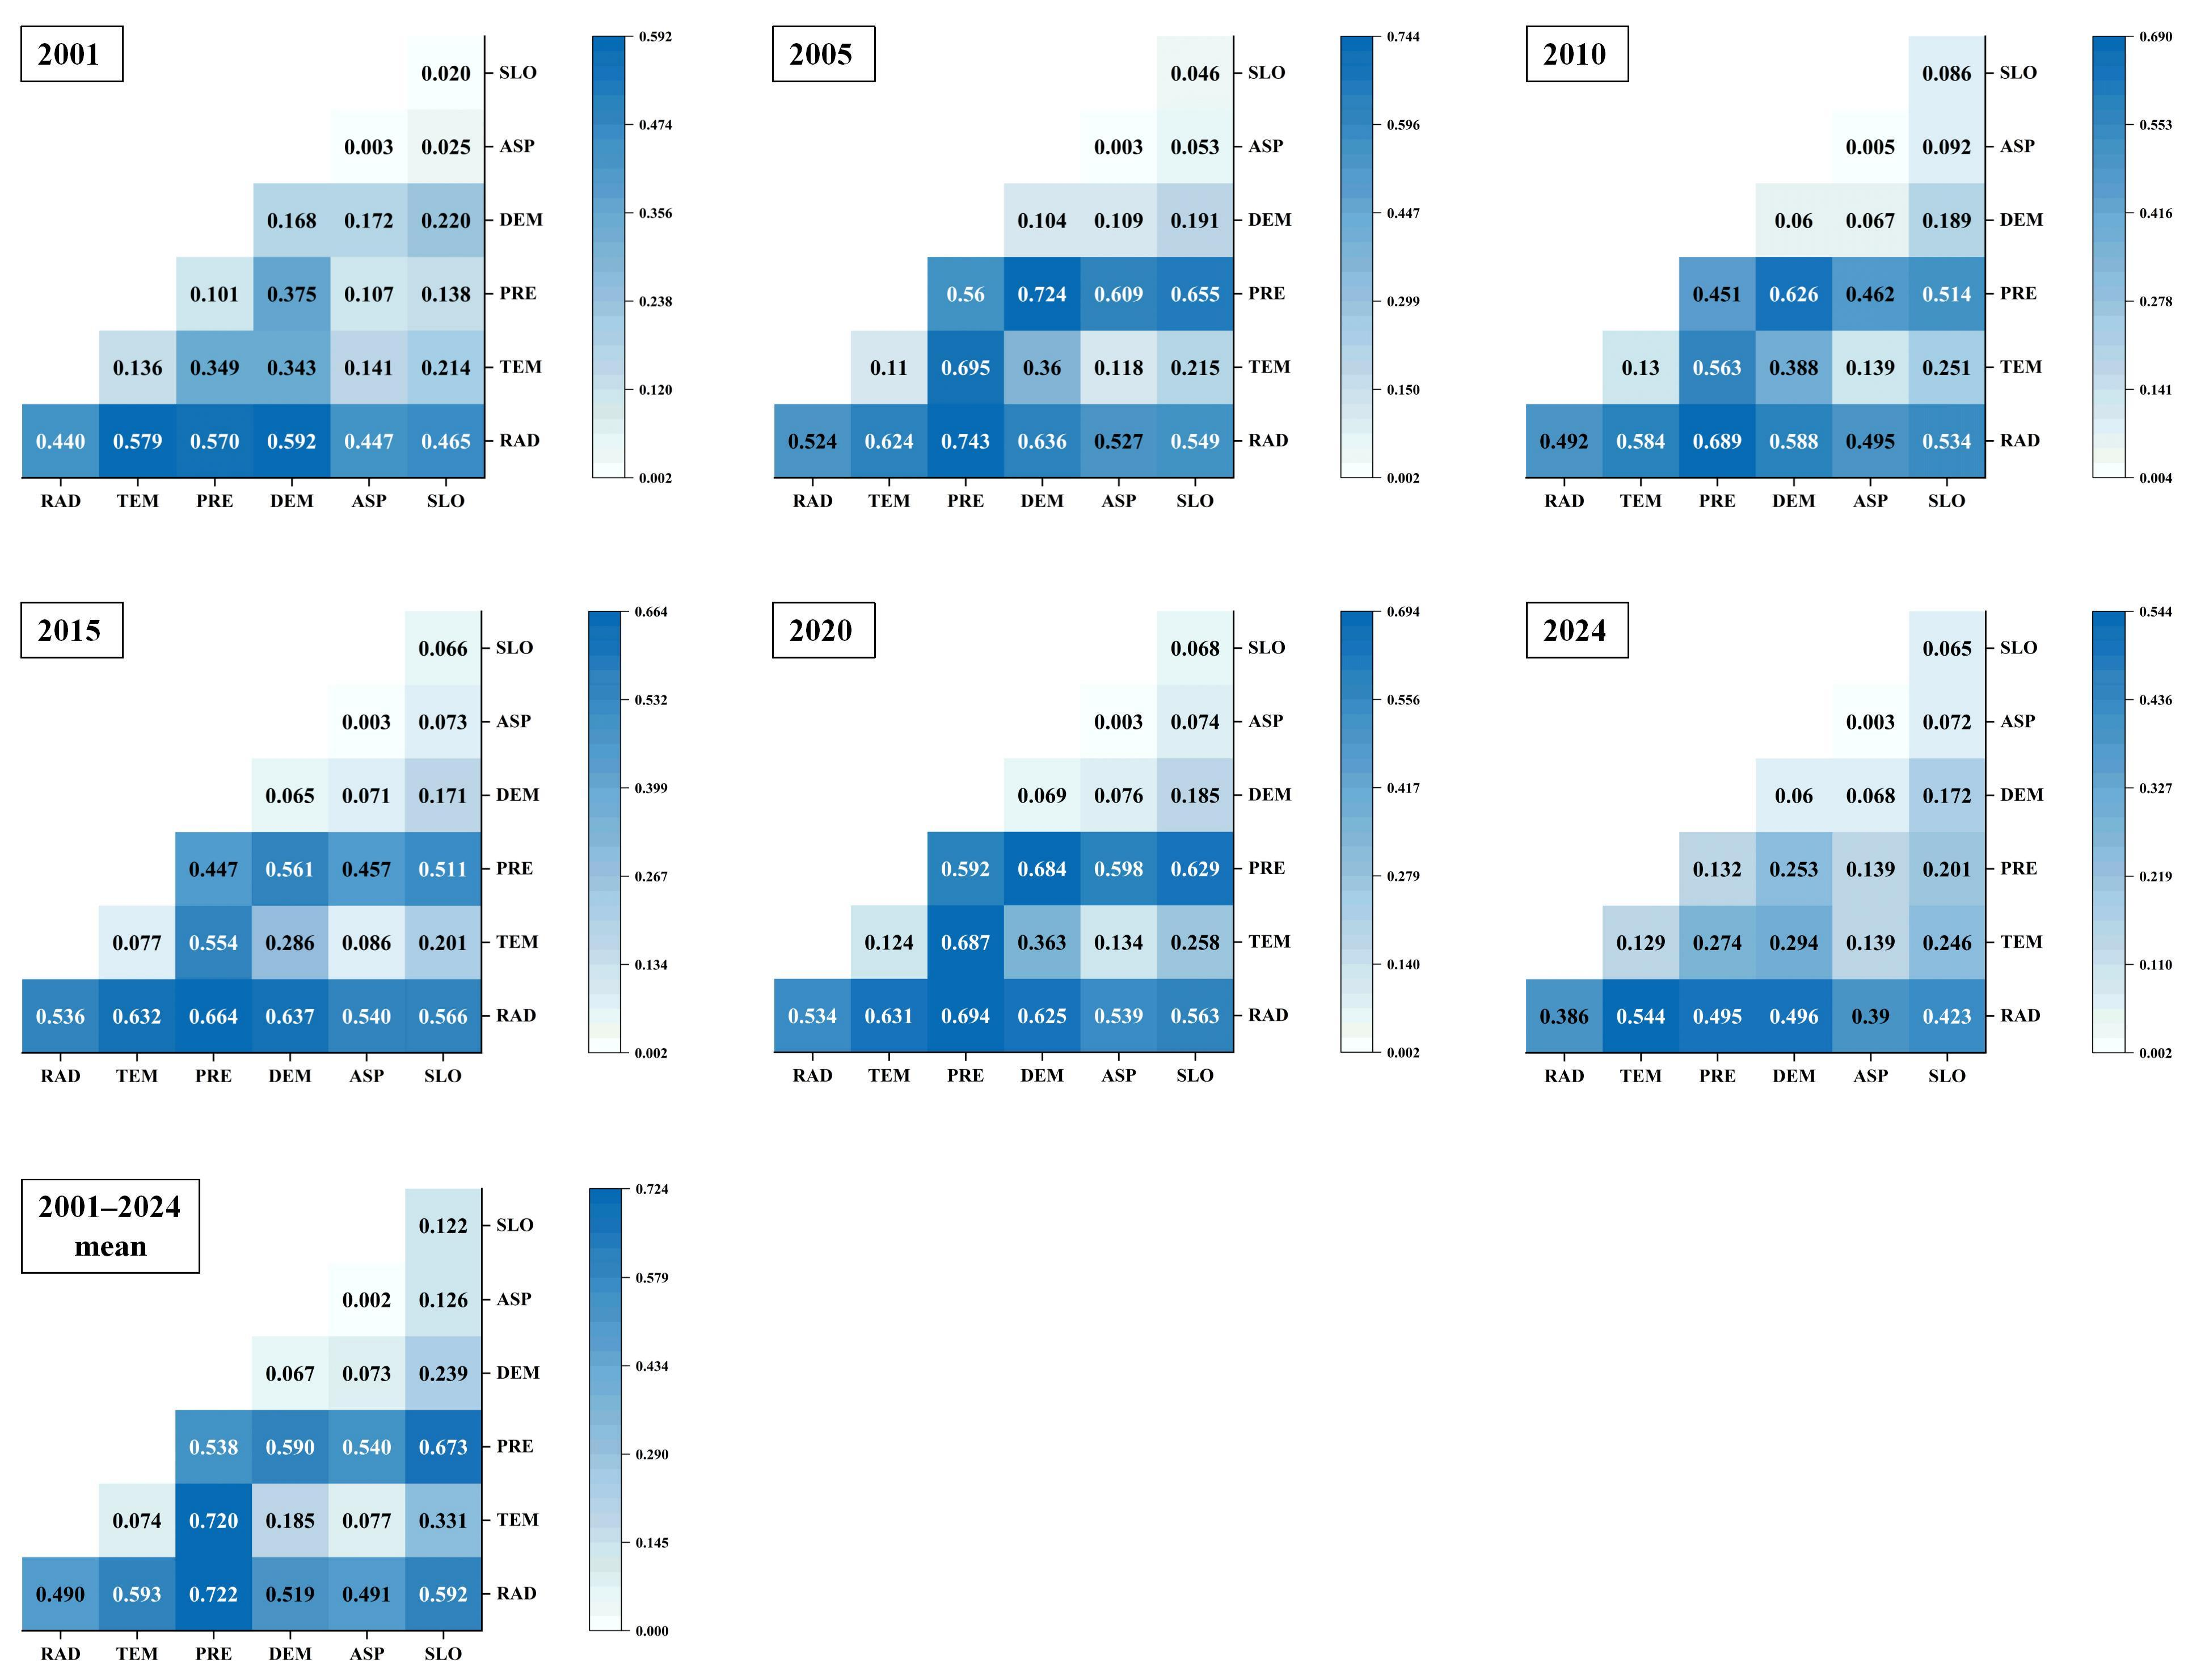
The pairwise interaction results are shown in Figure 9. The explanatory power of each pairwise interaction exceeded that of the corresponding individual factors. The interaction types were mainly characterized by bivariate enhancement and nonlinear enhancement, indicating that paired environmental factors provided greater joint explanatory power for the spatial differentiation of NEP than individual factors. Among all interactions, solar radiation ∩ precipitation exhibited the highest explanatory power (q = 0.722), followed by air temperature ∩ precipitation (q = 0.720) and precipitation ∩ slope (q = 0.673). These results suggest that NEP spatial differentiation was more strongly associated with the combined spatial distributions of climatic and topographic conditions than with any single factor. Here, interaction enhancement refers to increased joint explanatory power rather than ecological synergy or direct causality.
Figure 9.
Pairwise interaction results of environmental factors associated with NEP spatial differentiation.
3.4.3. NPP-Based Robustness Analysis
To assess potential mathematical coupling, the OPGD analysis was repeated using NPP as an alternative response variable under identical spatial samples and parameter settings. The NEP- and NPP-based results showed broadly consistent factor rankings across the selected years. For the 2001–2024 mean, the q values of precipitation, solar radiation, and air temperature were 0.538, 0.490, and 0.122 for NEP and 0.553, 0.489, and 0.124 for NPP, respectively (Table 3). This consistency supports the robustness of the main factor-detection results and indicates that their explanatory power was unlikely to result solely from the heterotrophic-respiration formulation.
Table 3.
Comparison of OPGD factor-detector q values obtained using NEP and NPP as alternative response variables.
3.5. Relative Trend Contributions of Climate-Associated and Residual-Derived Components
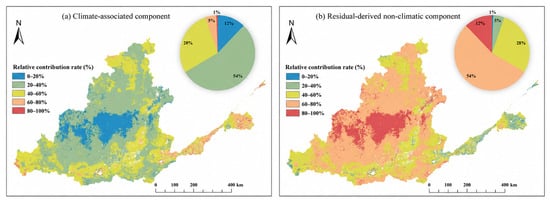
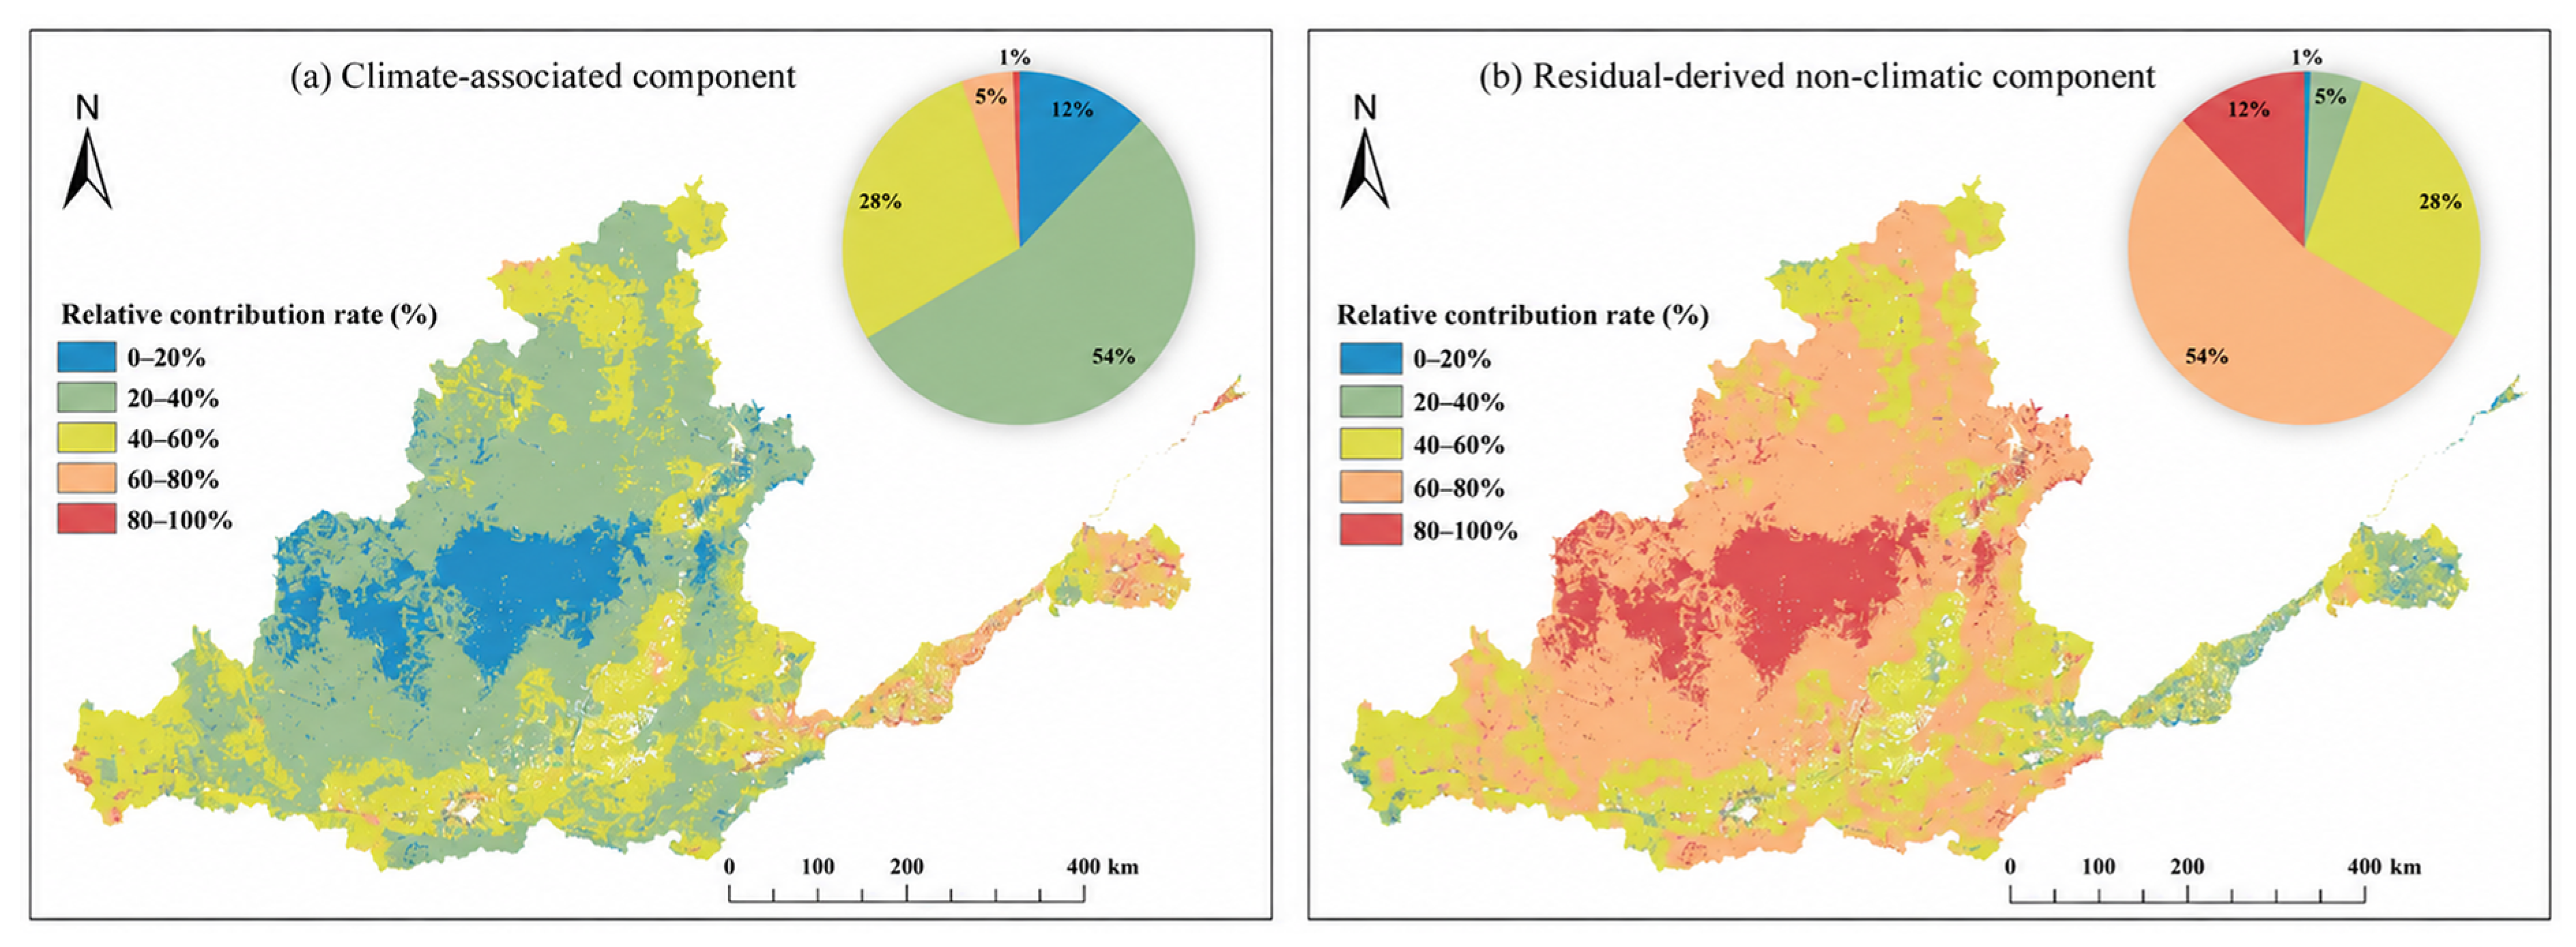
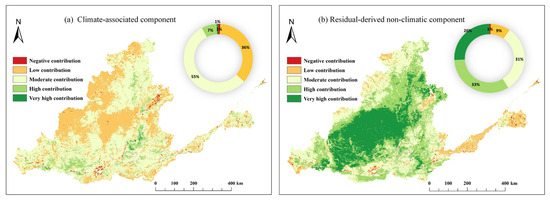
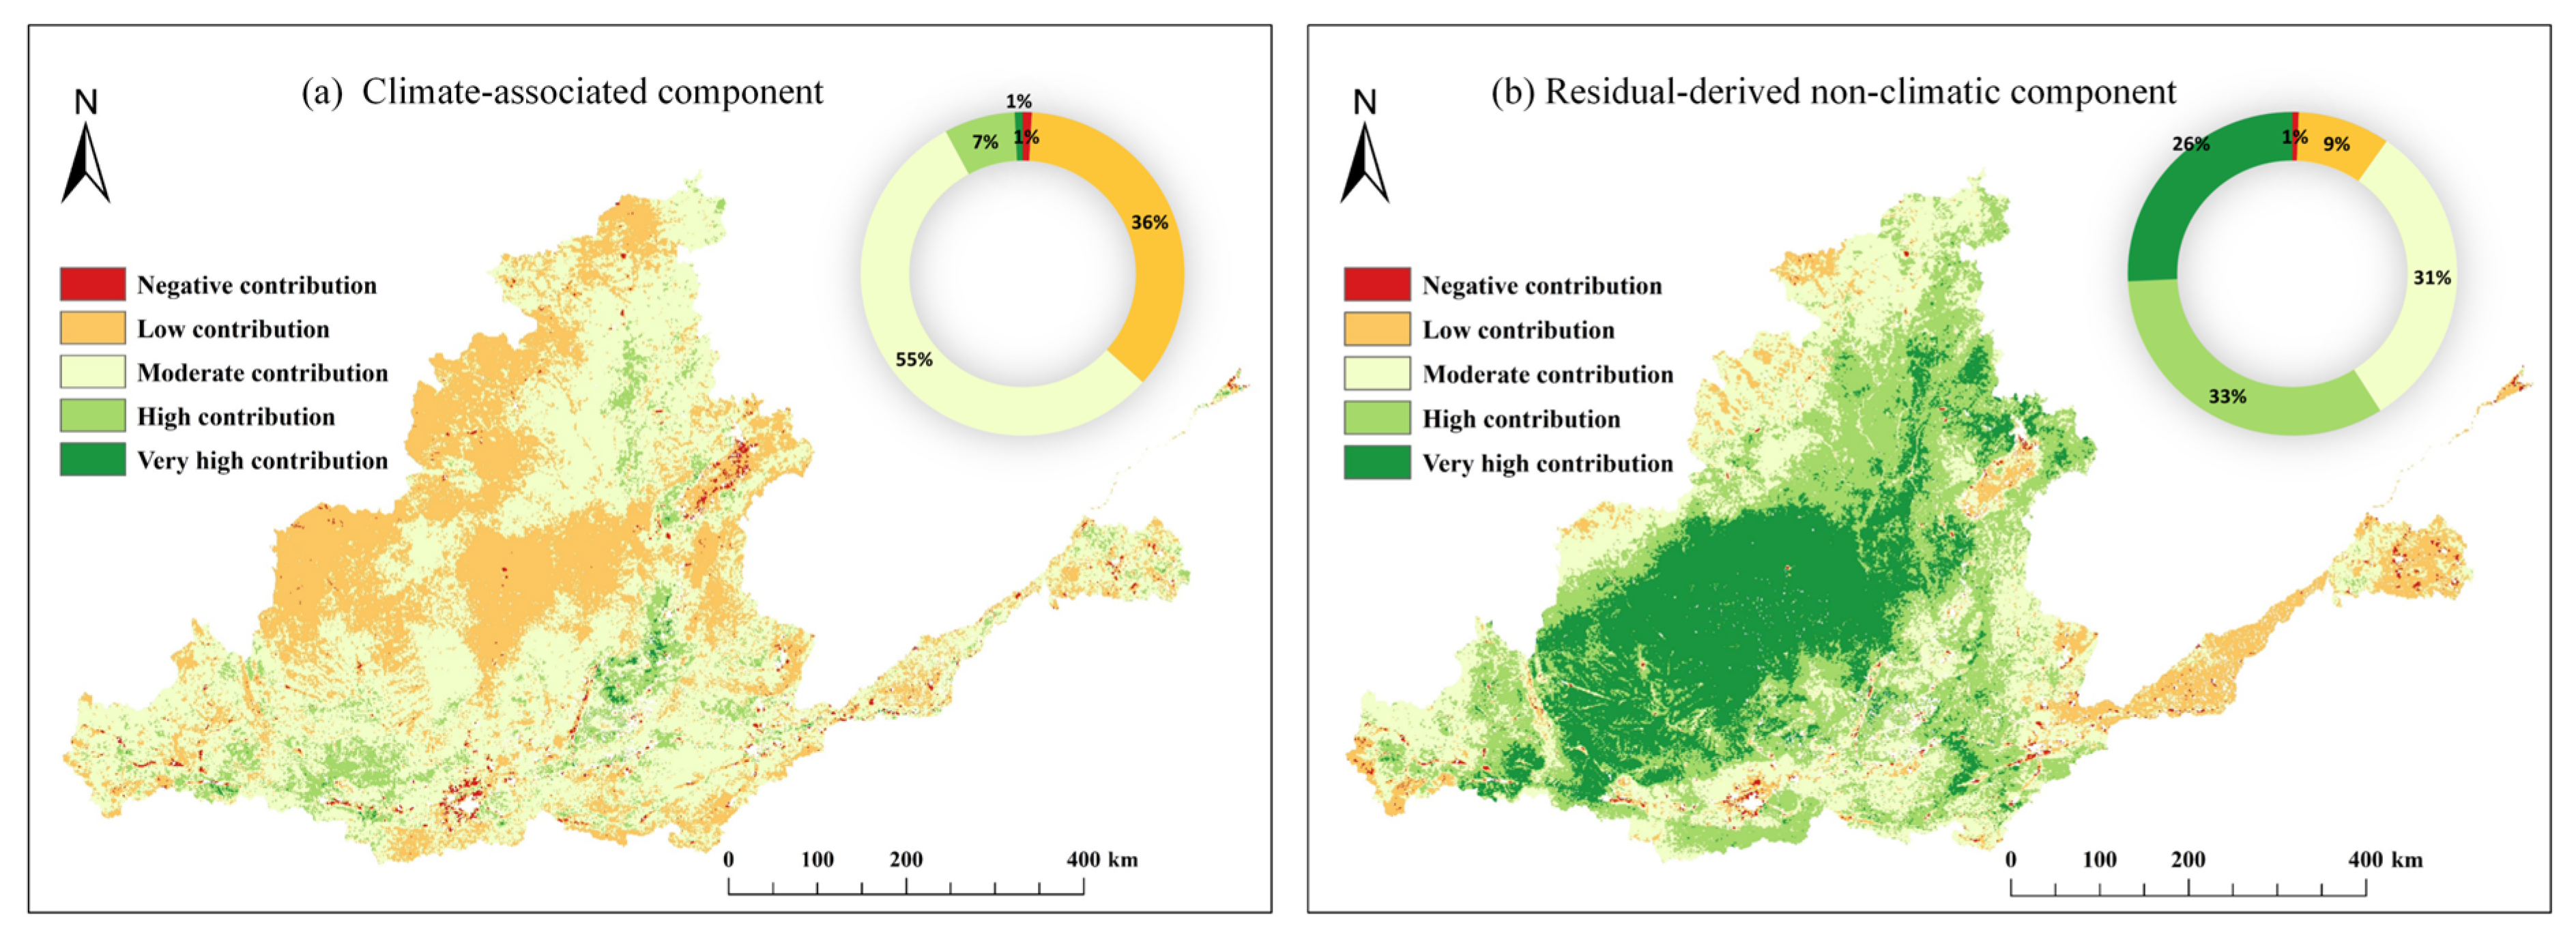
The relative shares calculated from the absolute trend slopes of the climate-associated and residual-derived components exhibited clear spatial differences across the middle and lower Yellow River Basin in Figure 10. The climate-associated component was mainly concentrated in the 20–40% and 40–60% contribution intervals, accounting for 54% and 28% of the study area, respectively. The 0–20% interval accounted for 12%, whereas areas with climate-associated contribution rates greater than 60% accounted for only 6%. Spatially, low and moderate climate-associated contributions were widely distributed across the central and northern parts of the study area, whereas relatively high contributions occurred sporadically in the southern, eastern, and peripheral zones.
Figure 10.
Relative contributions of climate-associated and residual-derived components to NEP change.
Correspondingly, the residual-derived non-climatic component represented the larger share of the absolute component-trend magnitude across most of the basin. The 60–80% interval accounted for 54% of the study area, followed by the 40–60% interval at 28% and the 80–100% interval at 12%. Areas where the residual-derived contribution exceeded 40% collectively accounted for 94% of the study area and formed a relatively continuous distribution from the central-western to the central parts of the basin. Areas with residual-derived contributions below 40% accounted for the remaining 6% and were scattered mainly along the eastern coastal zone and several peripheral areas.
The component-trend classification revealed clear differences between the climate-associated and residual-derived non-climatic components in Figure 11. For the climate-associated component, low and moderate positive trends accounted for 36% and 55% of the study area, respectively, whereas high and very high positive trends accounted for only 7% and 1%. Negative trends represented the remaining 1%. In contrast, the residual-derived non-climatic component exhibited generally larger positive trend magnitudes. High and very high positive trends accounted for 33% and 26% of the study area, respectively, reaching a combined proportion of 59%, while moderate and low positive trends accounted for 31% and 9%. Negative trends accounted for only 1%. Spatially, high and very high positive trends in the residual-derived component formed relatively continuous areas in the central-western part of the basin, whereas the corresponding classes of the climate-associated component were more spatially limited. Overall, the basin-wide increase in NEP was associated with positive trends in both components, while the residual-derived non-climatic component showed larger positive trend magnitudes across a broader spatial extent.
Figure 11.
Trends in climate-associated and residual-derived NEP components.
3.6. Major Land-Use Transitions
Given the broad spatial extent of the residual-derived non-climatic component, major land-use transitions were further quantified to provide regional context for the observed NEP changes. Land-use transitions were summarized for three periods: 2001–2010, 2010–2020, and 2020–2024. The dominant transition types are presented in Table 4.
Table 4.
Major land-use transitions in the middle and lower Yellow River Basin during 2001–2010, 2010–2020, and 2020–2024.
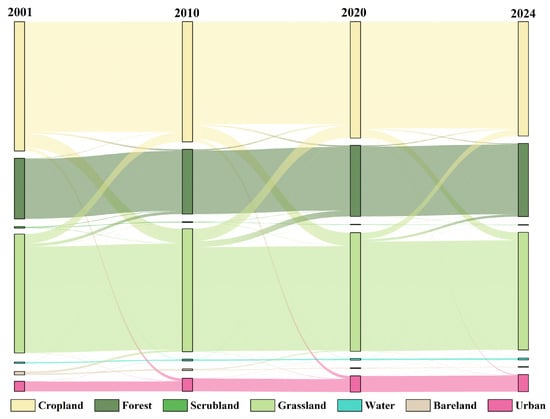
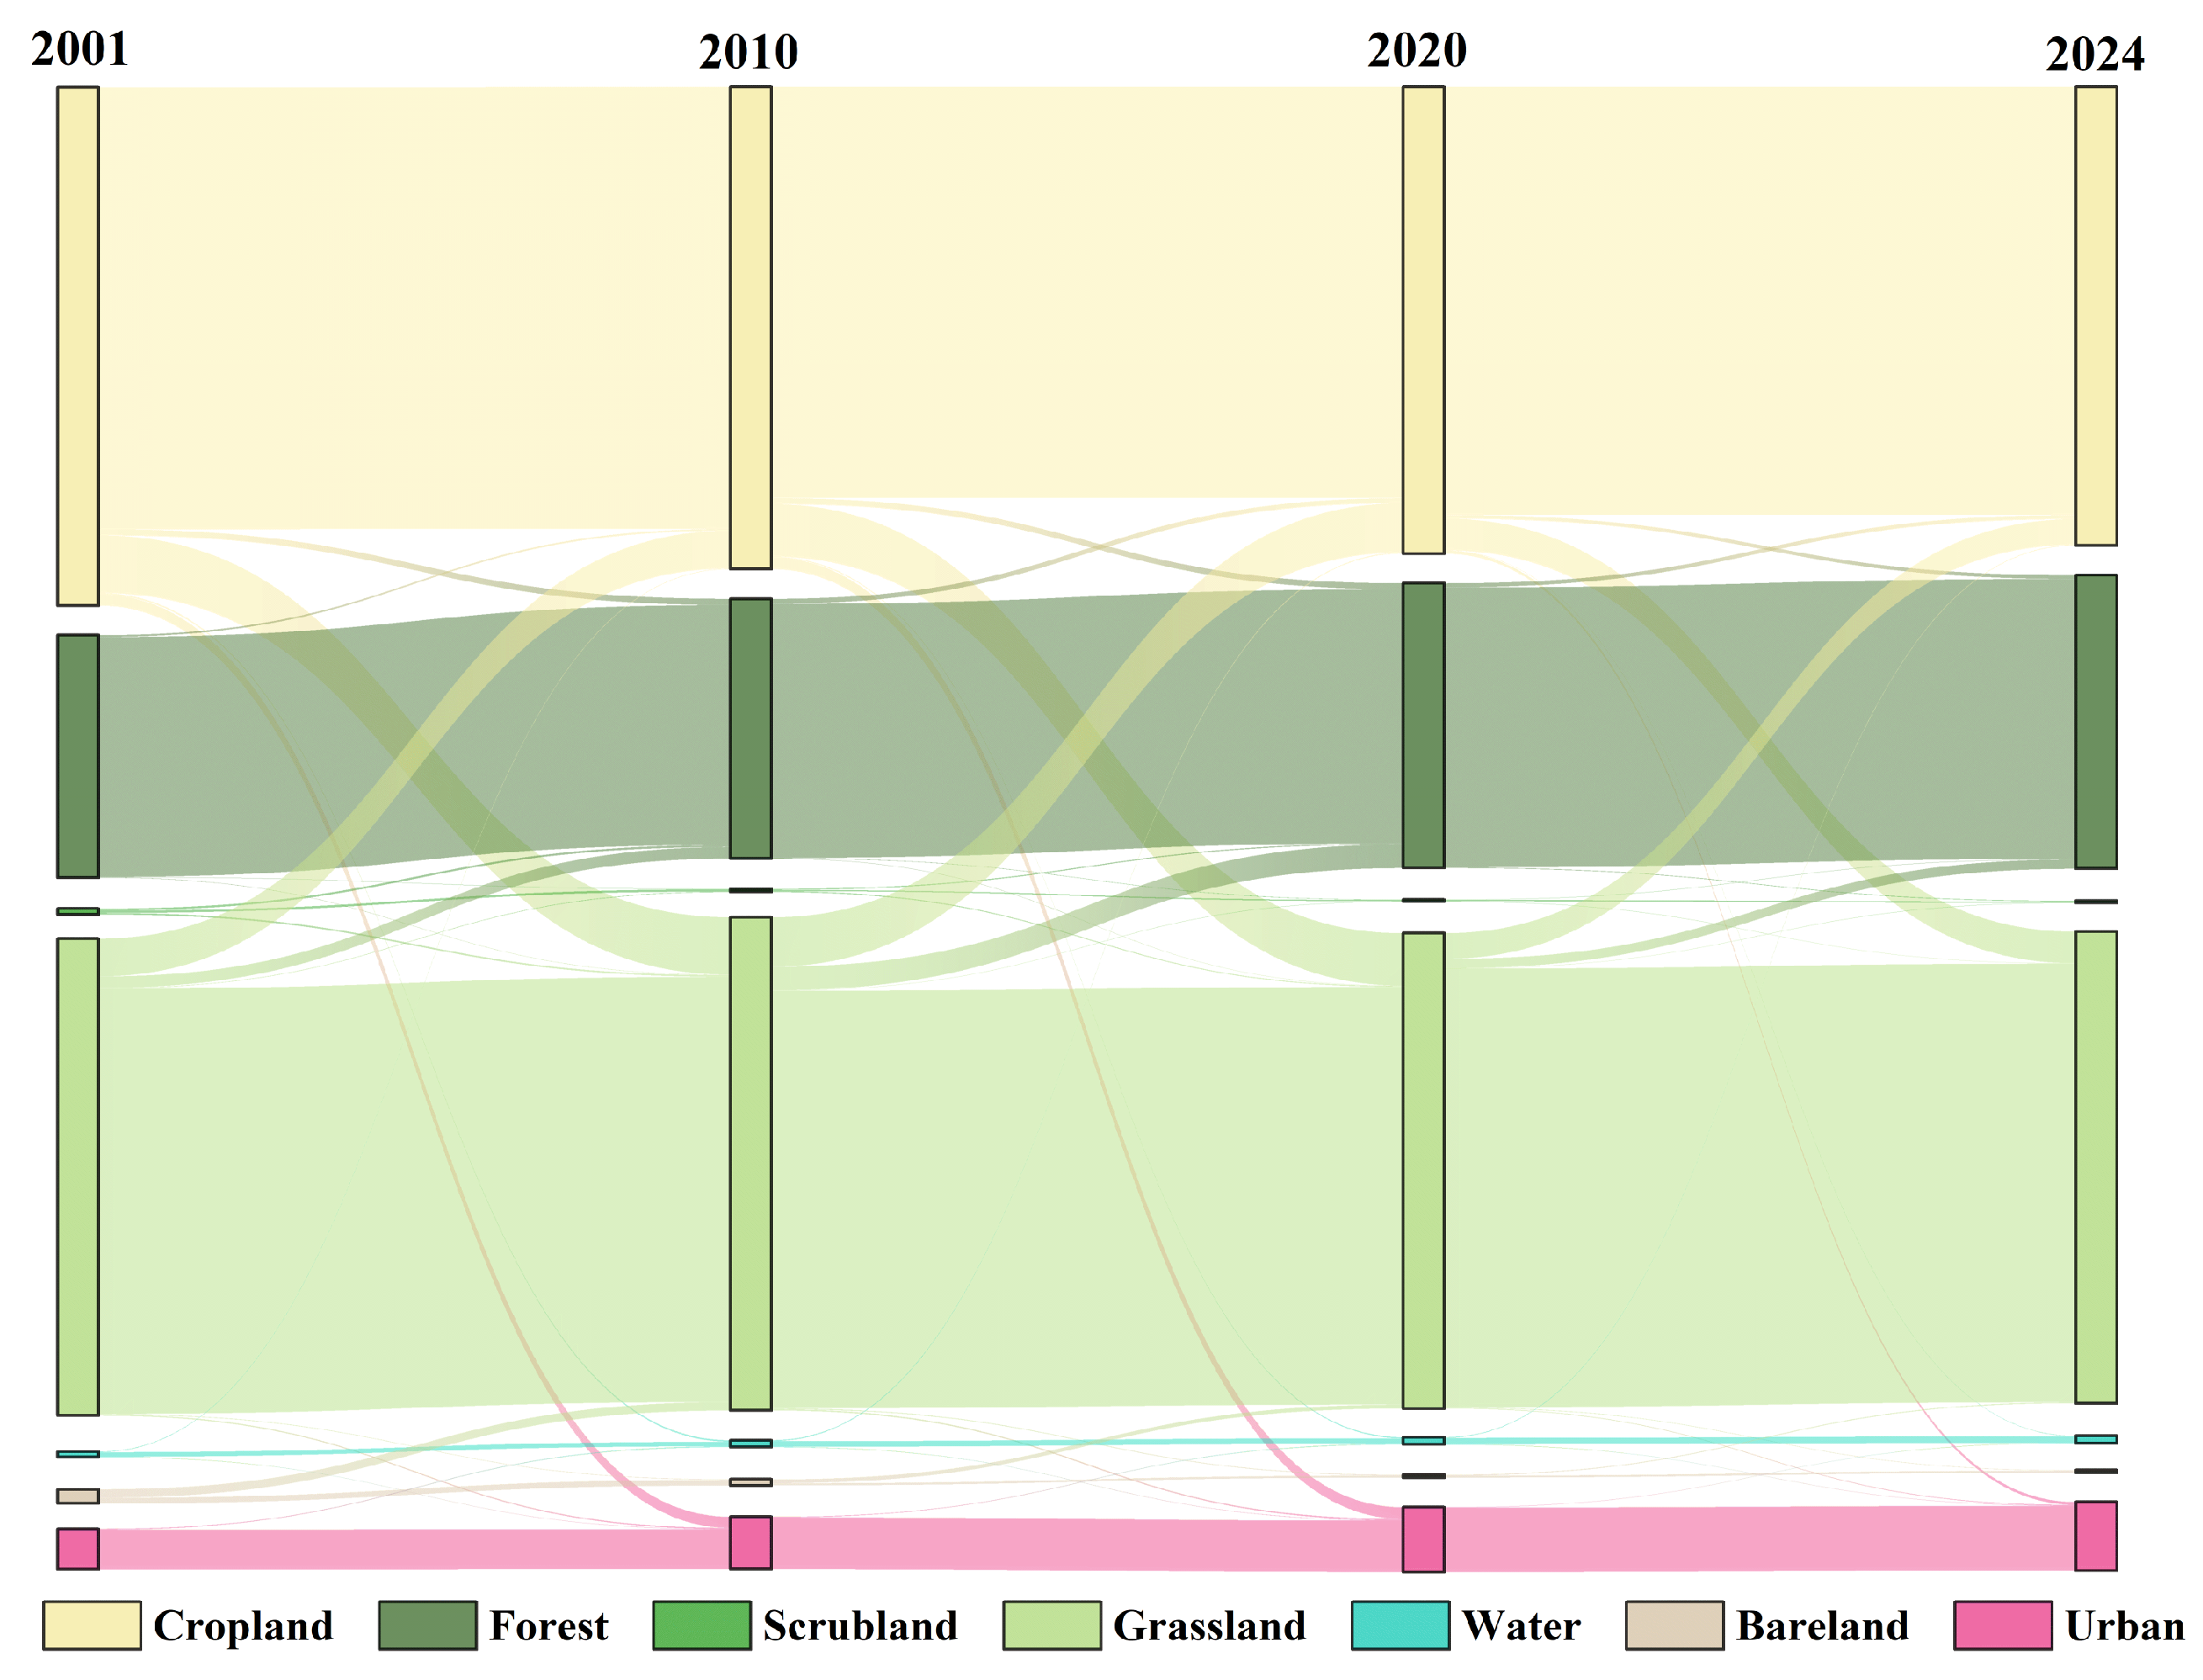
The total areas affected by land-use transitions were 40,843.54 km2 during 2001–2010, 45,259.42 km2 during 2010–2020, and 23,470.99 km2 during 2020–2024. Reciprocal conversions between cropland and grassland represented the largest land-use transitions in all three periods. Cropland-to-grassland conversion accounted for 39.83%, 32.84%, and 38.17% of the changed area during the three periods, respectively, whereas grassland-to-cropland conversion accounted for 26.18%, 30.79%, and 31.02%. Grassland-to-forest conversion was also prominent, particularly during 2010–2020, when it accounted for 14.81% of the changed area. Cropland-to-built-up-land conversion accounted for 7.66%, 7.14%, and 3.45% of the changed area during the three periods, respectively. Overall, land-use changes were characterized mainly by reciprocal adjustments between cultivated and vegetated land, together with Forest expansion and continued built-up-land growth.
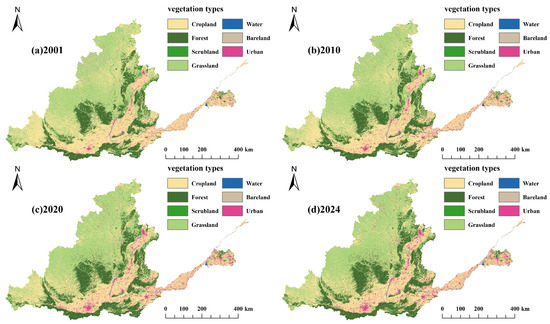
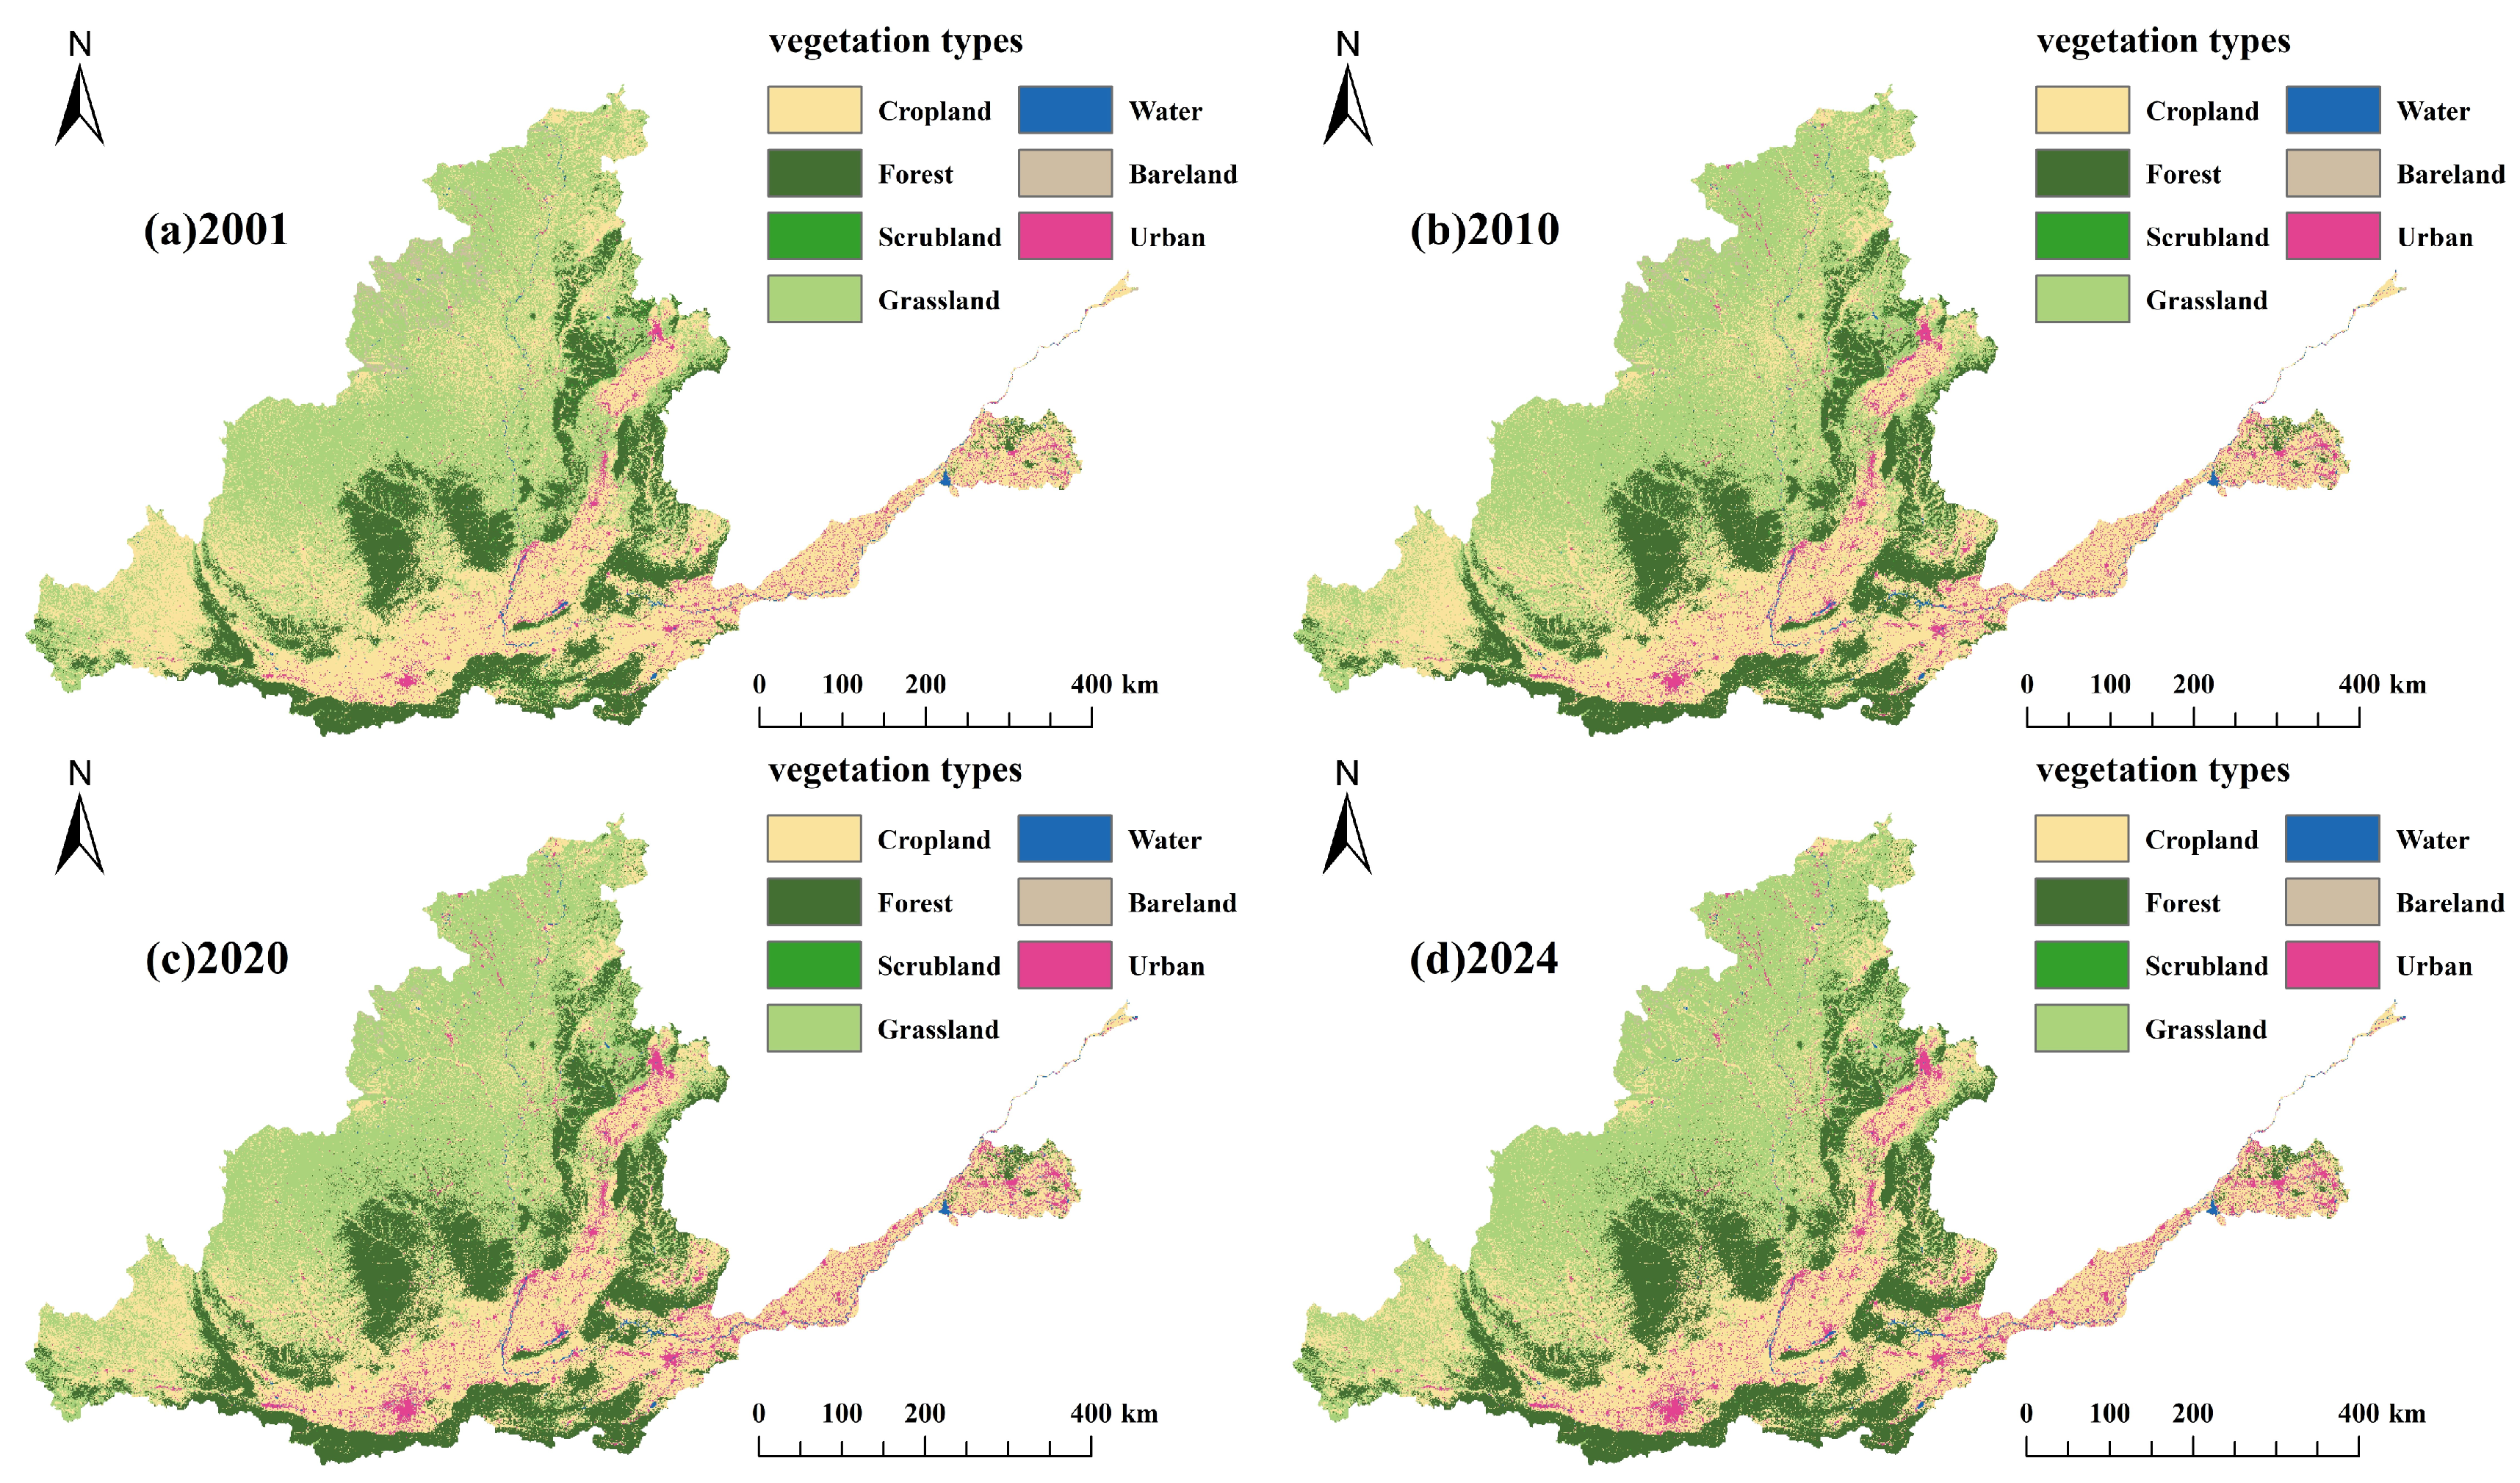
As shown in Figure 12 and Figure 13, cropland, forest, shrubland, and grassland remained the dominant land-cover types in the middle and lower Yellow River Basin throughout the study period, while built-up land continued to expand. Built-up-land expansion was mainly concentrated in the Guanzhong Plain urban belt, the Taiyuan–Jinzhong Basin, the Changzhi–Jincheng region, the Zhengzhou–Kaifeng–Xinxiang–Jiaozuo corridor, and urbanized areas of central and western Shandong. These expansion areas generally displayed belt-like or clustered patterns along major transport corridors and urban agglomerations. The land-use transition results further showed that built-up-land expansion was derived primarily from the conversion of cropland and grassland, together with smaller contributions from other land-cover types. These spatial and quantitative results characterize the major basin-scale land-use changes that occurred during the study period and provide regional context for interpreting the observed NEP dynamics.
Figure 12.
Spatial distribution of land-use/land-cover types in the middle and lower Yellow River Basin in 2001, 2010, 2020, and 2024.
Figure 13.
Land-use/land-cover transition characteristics in the middle and lower Yellow River Basin.
4. Discussion
4.1. Spatiotemporal Evolution of Vegetation Carbon Sinks
This study revealed a significant overall increase in model-derived NEP in the middle and lower Yellow River Basin from 2001 to 2024, accompanied by an expansion of high-value areas and a contraction of medium- and low-value areas, indicating an overall enhancement of regional vegetation carbon-sink strength. Spatially, NEP was generally higher in the southern and southeastern parts of the basin and lower in the northern and northwestern parts, demonstrating pronounced regional heterogeneity. These findings are consistent with Tian et al. [41], who reported a significant improvement in vegetation productivity across the Yellow River Basin, and Xuan et al. [42], who identified a general increase in NPP and marked spatial differentiation in the middle reaches after 2001.
Temporally, NEP followed a staged trajectory rather than exhibiting a simple and continuous linear increase, characterized by an early period of relatively rapid increase, subsequent interannual fluctuations, sustained growth, and a recent moderation in the rate of increase. Jiang et al. [43] similarly identified distinct vegetation-change turning points in the Yellow River Basin after 2000, while Li et al. [44] noted that afforestation-related greening on the Loess Plateau may slow or even shift toward localized browning after prolonged vegetation recovery, particularly in water-limited areas. The recent moderation observed in this study should therefore not necessarily be interpreted as a reversal of regional carbon-sink enhancement, but may indicate a transition toward a more constrained development phase in which further NEP gains increasingly depend on water availability, vegetation structure, stand development, and ecosystem resistance to climatic variability. The comparison with a published NEP product showed broadly consistent interannual variability and long-term increasing tendencies, while the parameter-sensitivity analysis indicated that the principal temporal trend, spatial pattern, and source–sink classification were largely insensitive to moderate changes in the heterotrophic-respiration parameters. These robustness assessments increase confidence in the identified basin-scale NEP dynamics, although differences in absolute magnitude may remain because of variations in input data, respiration formulations, spatial processing, and model structure.
The basin-wide increase in NEP should not be regarded as a spatially uniform response or attributed to a single regional process. Yang et al. [45] reported that carbon-sink recovery in the upper Yellow River Basin was initially dominated by climatic variability, whereas the importance of land management and ecological restoration increased during later stages. Li et al. [46] further indicated that large-scale ecological restoration substantially altered ecosystem-service patterns in the upper and middle reaches. Consistent with this regional background, the quantified land-use transitions in the present study showed extensive reciprocal conversions between cropland and grassland, together with forestland expansion and continued built-up-land growth. Vegetation-related transitions in parts of the middle reaches were broadly consistent with regional vegetation recovery, whereas agricultural adjustment, urban expansion, and transport-corridor development represented contrasting land pressures in the lower plains. These concurrent changes provide regional context for the observed NEP heterogeneity and indicate that vegetation carbon-sink enhancement occurred alongside continuing land-development pressures.
4.2. Drivers of Vegetation Carbon-Sink Dynamics
The OPGD results identified precipitation and solar radiation as the factors with the highest explanatory power for NEP spatial differentiation, followed by air temperature. This hierarchy is ecologically plausible for the middle and lower Yellow River Basin, where vegetation productivity is jointly constrained by water availability and energy supply. Precipitation influences soil-water availability, stomatal regulation, canopy development, and the duration of photosynthetically active periods, whereas solar radiation provides the energy required for photosynthetic carbon assimilation. However, additional radiation does not necessarily enhance carbon uptake under water-limited conditions because stronger radiative forcing may also increase atmospheric evaporative demand and vegetation water stress. Wang et al. [47] reported that changes in terrestrial carbon storage across the Yellow River Basin are jointly influenced by climatic variability and land-use change, highlighting the continuing role of climatic factors as fundamental background controls on regional carbon-cycle dynamics. He et al. [48] found that increasing ecosystem sensitivity to meteorological drought can substantially weaken carbon uptake capacity, indicating that water deficit remains a major constraint on stable carbon-sink enhancement in the semi-humid to semi-arid transition zone. Similarly, Song et al. [49] suggested that recent vegetation greening in the Yellow River Basin has been accompanied by intensifying water stress. Therefore, the high interaction q value between precipitation and solar radiation should be interpreted as enhanced joint explanatory power associated with regional water–energy conditions rather than as direct evidence of ecological synergy or causality.
Recent evidence further indicates that vegetation greening may itself modify regional water limitation. Zhao et al. [27] identified a widespread increase in ecosystem water limitation across the Yellow River Basin and showed that vegetation change contributed substantially to this tendency. At the plant and community levels, differences in water-use strategies, functional traits, and productivity responses along soil-water gradients may further regulate vegetation responses to water stress [26]. These findings help explain why precipitation remained the leading explanatory factor in both the NEP- and NPP-based analyses. They also suggest that carbon-sink responses to vegetation restoration are unlikely to remain spatially uniform: areas with adequate moisture may sustain continued productivity gains, whereas increasingly water-limited areas may experience weaker marginal gains or greater interannual variability as vegetation cover increases. The climatic factors included in the regression model did not fully account for the observed NEP changes. The residual-derived non-climatic component accounted for a substantial proportion of the combined component-trend magnitude across most of the study area and generally exhibited larger positive trend magnitudes than the climate-associated component. Xu et al. [50] reported substantial land-use and land-cover changes across the Yellow River Basin since 2000, particularly the continuous conversion of cropland to forestland, grassland, and built-up land, which has markedly altered regional carbon-storage patterns. Li et al. [51] further demonstrated that changes in land-use intensity can substantially reshape the spatial differentiation of ecosystem services, while Niu et al. [52] suggested that regional carbon-sink patterns are influenced not only by land-cover transitions but also by vegetation-structure dynamics. Accordingly, the residual-derived pattern may contain signals associated with vegetation recovery, land-use adjustment, ecological management, built-up-land expansion, and changes in vegetation structure. However, it may also include atmospheric CO2 effects, nitrogen deposition, disturbances, nonlinear climatic responses, omitted environmental variables, input data uncertainty, and model error. The relatively large residual-derived component therefore indicates that NEP dynamics were associated with processes extending beyond the linear effects of precipitation, temperature, and solar radiation, rather than reflecting a uniformly positive effect of human activities.
Liu et al. [53] found that vegetation expansion in the gully regions of the Loess Plateau increased carbon-sink capacity but also generated a pronounced trade-off with water yield, with this relationship exhibiting threshold characteristics. Feng et al. [54] similarly suggested that large-scale revegetation on the Loess Plateau is approaching sustainable water-resource limits. In contrast, Zhang et al. [55] found that increased precipitation and vegetation–atmosphere moisture recycling may partly compensate for evapotranspiration losses associated with revegetation, while Huang et al. [56] showed that afforestation may increase shallow-soil carbon storage while producing deep-soil drying and reducing deep-soil carbon sequestration during later restoration stages. These findings are not necessarily contradictory; rather, they indicate that carbon–water responses depend on climatic conditions, vegetation type, restoration age, soil depth, and spatial scale. Ecological restoration therefore does not imply unlimited enhancement of vegetation carbon sinks. Restoration and vegetation-management strategies in the middle and lower Yellow River Basin should be matched to local water availability and ecosystem carrying capacity, with greater emphasis on vegetation types and management practices capable of maintaining both carbon sequestration and long-term hydrological sustainability.
4.3. Management Implications
The spatiotemporal patterns and explanatory relationships identified in this study provide several implications for vegetation carbon-sink management in the middle and lower Yellow River Basin.
- (1)
- Carbon-sink management should adopt spatially differentiated strategies. High-NEP and relatively stable areas, such as the southern mountainous and hilly regions, the western Henan mountains, and the southern Shanxi mountains, should prioritize the protection of existing forests, grasslands, and other stable vegetated ecosystems, together with the maintenance of ecological connectivity. In contrast, low-NEP or highly variable areas, including the Ordos–Yulin region, northern and northwestern Shaanxi, and mountain–plain transition zones, require targeted vegetation restoration, degraded-land rehabilitation, and long-term ecological monitoring.
- (2)
- Ecological restoration should be planned under explicit water-resource constraints. The high explanatory power of precipitation and solar radiation, together with their enhanced joint explanatory power, indicates that vegetation carbon-sink enhancement is closely associated with regional water–energy conditions. Restoration planning should therefore avoid simply increasing vegetation cover and should instead match vegetation types and planting densities to local precipitation regimes, soil-water carrying capacity, and topographic conditions. Native species, shrub–grass combinations, and vegetation with relatively low water demand should be prioritized, particularly in semi-arid and water-sensitive areas.
- (3)
- Land-use regulation should be integrated into regional carbon-sink management. The quantified land-use transitions showed continued built-up-land expansion, particularly through the conversion of cropland and grassland, alongside forestland expansion and substantial reciprocal conversions between cropland and grassland. Rapidly urbanizing areas, including the Guanzhong Plain urban belt, the Zhengzhou–Kaifeng–Xinxiang–Jiaozuo corridor, and central and western Shandong, should strengthen ecological-space protection and improve the efficiency of land development. Urban green spaces, ecological corridors, farmland shelterbelts, and the redevelopment of inefficient built-up land may help reduce pressure on vegetated land and maintain regional ecological functions.
The model-derived NEP estimates represent an ecological indicator of vegetation carbon-sink strength and should not be directly equated with greenhouse-gas inventory removals or tradable carbon credits. Their application to formal carbon accounting would require additional information on carbon pools, land-management activities, disturbance-related emissions, permanence, leakage, additionality, and monitoring, reporting, and verification. The present results are therefore most suitable for regional ecological assessment, restoration prioritization, land-use planning, and long-term carbon-sink monitoring.
4.4. Uncertainties and Limitations
The reliability of the main findings was supported by the published-product comparison, parameter-sensitivity analysis, and NPP-based robustness test. These assessments consistently confirmed the basin-wide increasing tendency of NEP, the broad spatial pattern, and the leading explanatory roles of precipitation and solar radiation. Therefore, the principal conclusions regarding long-term NEP dynamics and environmental-factor rankings are considered robust at the regional scale.
Several limitations, nevertheless, remain. The absolute NEP estimates may be affected by uncertainties in remote-sensing NPP, empirical respiration parameters, model structure, and spatial resampling, because direct flux observations were not available for basin-wide validation. OPGD reflects spatial statistical associations rather than causal mechanisms, while the residual-derived component may also contain omitted environmental effects and model uncertainty. In addition, the 1 km land-use data may not reliably capture small or fragmented changes, particularly in urban–rural and mountain–plain transition zones. Future research integrating flux observations, process-based models, higher-resolution land-cover data, and socioeconomic information would further improve the accuracy and interpretation of regional carbon-sink assessments.
5. Conclusions
- (1)
- Model-derived NEP in the middle and lower Yellow River Basin showed a significant overall increase from approximately 214 g C m−2 yr−1 in 2001 to approximately 425 g C m−2 yr−1 in 2024, with a multi-year mean of 349.89 g C m−2 yr−1. Areas with NEP above 300 g C m−2 yr−1 expanded from 18.51% to 78.86%, while significantly increasing areas accounted for 89.93% of the study area.
- (2)
- Precipitation and solar radiation showed the highest explanatory power for NEP spatial differentiation, with mean q values of 0.538 and 0.490, respectively. Their pairwise interaction produced the highest joint explanatory power (q = 0.722). The NPP-based robustness analysis yielded a broadly consistent factor ranking, confirming the importance of regional water–energy conditions in shaping vegetation carbon-sink patterns.
- (3)
- The residual-derived non-climatic component accounted for more than 40% of the combined component-trend magnitude across approximately 94% of the study area and generally exhibited larger positive trend magnitudes than the climate-associated component. Major land-use changes were characterized by reciprocal conversions between cropland and grassland, forestland expansion, and continued built-up-land growth. Together, these findings reveal pronounced spatial heterogeneity in regional NEP dynamics and provide a regional reference for differentiated vegetation restoration, land-use management, and long-term carbon-sink monitoring. for differentiated vegetation restoration, land-use management, and long-term carbon-sink monitoring.
Author Contributions
Methodology, C.L., H.J., Y.X. and J.L.; Software, C.L.; Validation, H.J.; Formal analysis, Y.X.; Investigation, C.L., H.J., Y.X. and J.L.; Writing—original draft preparation, C.L.; Writing—review and editing, C.L., L.C., H.J., Y.X. and J.L.; Visualization, C.L.; Supervision, L.C.; Project administration, L.C. All authors have read and agreed to the published version of the manuscript.
Funding
This research received no external funding.
Institutional Review Board Statement
Not applicable.
Informed Consent Statement
Not applicable.
Data Availability Statement
The datasets used in this study are publicly available from the sources listed in Table 1. The processed NEP datasets, component-analysis results, and land-use transition statistics generated in this study are available from the corresponding author upon reasonable request.
Acknowledgments
The authors thank the data providers for making the datasets used in this study publicly available.
Conflicts of Interest
The authors declare no conflicts of interest.
References
- Gampe, D.; Zscheischler, J.; Reichstein, M.; O’Sullivan, M.; Smith, W.K.; Sitch, S.; Buermann, W. Increasing Impact of Warm Droughts on Northern Ecosystem Productivity over Recent Decades. Nat. Clim. Change 2021, 11, 772–779. [Google Scholar] [CrossRef] [Scilit]
- Pörtner, H.-O.; Scholes, R.J.; Arneth, A.; Barnes, D.K.A.; Burrows, M.T.; Diamond, S.E.; Duarte, C.M.; Kiessling, W.; Leadley, P.; Managi, S.; et al. Overcoming the Coupled Climate and Biodiversity Crises and Their Societal Impacts. Science 2023, 380, eabl4881. [Google Scholar] [CrossRef] [Scilit]
- Soergel, B.; Kriegler, E.; Weindl, I.; Rauner, S.; Dirnaichner, A.; Ruhe, C.; Hofmann, M.; Bauer, N.; Bertram, C.; Bodirsky, B.L.; et al. A Sustainable Development Pathway for Climate Action within the UN 2030 Agenda. Nat. Clim. Change 2021, 11, 656–664. [Google Scholar] [CrossRef] [Scilit]
- Van Soest, H.L.; Den Elzen, M.G.J.; Van Vuuren, D.P. Net-Zero Emission Targets for Major Emitting Countries Consistent with the Paris Agreement. Nat. Commun. 2021, 12, 2140. [Google Scholar] [CrossRef] [Scilit] [PubMed]
- Chen, L.; Msigwa, G.; Yang, M.; Osman, A.I.; Fawzy, S.; Rooney, D.W.; Yap, P.-S. Strategies to Achieve a Carbon Neutral Society: A Review. Environ. Chem. Lett. 2022, 20, 2277–2310. [Google Scholar] [CrossRef] [Scilit] [PubMed]
- Friedlingstein, P.; O’Sullivan, M.; Jones, M.W.; Andrew, R.M.; Hauck, J.; Landschützer, P.; Le Quéré, C.; Li, H.; Luijkx, I.T.; Olsen, A.; et al. Global Carbon Budget 2024. Earth Syst. Sci. Data 2025, 17, 965–1039. [Google Scholar] [CrossRef] [Scilit]
- Walker, A.P.; De Kauwe, M.G.; Bastos, A.; Belmecheri, S.; Georgiou, K.; Keeling, R.F.; McMahon, S.M.; Medlyn, B.E.; Moore, D.J.P.; Norby, R.J.; et al. Integrating the Evidence for a Terrestrial Carbon Sink Caused by Increasing Atmospheric CO2. New Phytol. 2021, 229, 2413–2445. [Google Scholar] [CrossRef] [Scilit] [PubMed]
- Schimel, D.S.; Carroll, D. Carbon Cycle–Climate Feedbacks in the Post-Paris World. Annu. Rev. Earth Planet. Sci. 2024, 52, 467–493. [Google Scholar] [CrossRef] [Scilit]
- Liu, Z.; Deng, Z.; He, G.; Wang, H.; Zhang, X.; Lin, J.; Qi, Y.; Liang, X. Challenges and Opportunities for Carbon Neutrality in China. Nat. Rev. Earth Environ. 2021, 3, 141–155. [Google Scholar] [CrossRef] [Scilit]
- Tian, S.; Wu, W.; Chen, S.; Song, D.; Li, L.; Li, Z. Regional Differences in the Contribution of Drivers to Carbon Sequestration and Oxygen Release from Global Terrestrial Ecosystems. Resour. Conserv. Recycl. 2024, 207, 107704. [Google Scholar] [CrossRef] [Scilit]
- Xia, L.; Tan, H.; Zhang, J.; Yang, K.; Teng, C.; Huang, K.; Yang, J.; Cheng, T. Remote Sensing and Machine Learning Uncover Dominant Drivers of Carbon Sink Dynamics in Subtropical Mountain Ecosystems. Remote Sens. 2025, 17, 2843. [Google Scholar] [CrossRef] [Scilit]
- Liu, F.; Zeng, Y. Analysis of the Spatio-Temporal Variation of Vegetation Carbon Source/Sink in Qinghai Plateau from 2000–2015. Acta Ecol. Sin. 2021, 41, 5792–5803. [Google Scholar] [CrossRef] [Scilit]
- Cao, S.; He, Y.; Zhang, L.; Sun, Q.; Zhang, Y.; Li, H.; Wei, X.; Liu, Y. Spatiotemporal Dynamics of Vegetation Net Ecosystem Productivity and Its Response to Drought in Northwest China. GISci. Remote Sens. 2023, 60, 2194597. [Google Scholar] [CrossRef] [Scilit]
- Wang, T.; Wang, X.; Liu, D.; Lv, G.; Ren, S.; Ding, J.; Chen, B.; Qu, J.; Wang, Y.; Piao, S.; et al. The Current and Future of Terrestrial Carbon Balance over the Tibetan Plateau. Sci. China Earth Sci. 2023, 66, 1493–1503. [Google Scholar] [CrossRef] [Scilit]
- Yang, D.; Zhang, H.; Liu, Y.; Chen, B.; Cai, Z.; Lü, D. Monitoring Carbon Dioxide from Space: Retrieval Algorithm and Flux Inversion Based on GOSAT Data and Using CarbonTracker-China. Adv. Atmos. Sci. 2017, 34, 965–976. [Google Scholar] [CrossRef] [Scilit]
- Piao, S.; He, Y.; Wang, X.; Chen, F. Estimation of China’s Terrestrial Ecosystem Carbon Sink: Methods, Progress and Prospects. Sci. China Earth Sci. 2022, 65, 641–651. [Google Scholar] [CrossRef] [Scilit]
- Qiu, S.; Liang, L.; Wang, Q.; Geng, D.; Wu, J.; Wang, S.; Chen, B. Estimation of European Terrestrial Ecosystem NEP Based on an Improved CASA Model. IEEE J. Sel. Top. Appl. Earth Obs. Remote Sens. 2023, 16, 1244–1255. [Google Scholar] [CrossRef] [Scilit]
- Yang, S.; Zhao, Y.; Yang, D.; Lan, A. Analysis of Vegetation NDVI Changes and Driving Factors in the Karst Concentration Distribution Area of Asia. Forests 2024, 15, 398. [Google Scholar] [CrossRef] [Scilit]
- Hou, X.; Zhang, B.; He, Q.-Q.; Shao, Z.-L.; Yu, H.; Zhang, X.-Y. Spatial–Temporal Variations in the Climate, Net Ecosystem Productivity, and Efficiency of Water and Carbon Use in the Middle Reaches of the Yellow River. Remote Sens. 2024, 16, 3312. [Google Scholar] [CrossRef] [Scilit]
- Ma, C.; Zhang, C.; Luo, Z.; Ji, L. Hydroclimatic Thresholds Shape the Long-Term Persistence of Net Ecosystem Productivity in the Yellow River Basin (2001–2024). Earth Syst. Environ. 2026. [Google Scholar] [CrossRef] [Scilit]
- Tian, K.; Liu, X.; Zhang, B.; Wang, Z.; Xu, G.; Chang, K.; Xu, P.; Han, B. Analysis of Spatiotemporal Evolution and Influencing Factors of Vegetation Net Primary Productivity in the Yellow River Basin from 2000 to 2022. Sustainability 2023, 16, 381. [Google Scholar] [CrossRef] [Scilit]
- Zhao, X.; Zhang, X.; Liu, G.; Wang, T. Spatiotemporal Changes in Vegetation Carbon Sinks and Their Correlation with Climate in the Qinling Mountains (Shaanxi Section). Bull. Surv. Mapp. 2024, 9, 55–61. (In Chinese) [Google Scholar] [CrossRef]
- Zhang, W.; Xu, Z.; Yuan, H.; Wang, Y.; Feng, K.; Li, Y.; Wang, F.; Zhang, Z. Spatio-Temporal Evolution of Net Ecosystem Productivity and Its Influencing Factors in Northwest China, 1982–2022. Agriculture 2025, 15, 613. [Google Scholar] [CrossRef] [Scilit]
- Hu, Z.; Niu, B.; Tang, J.; Zhang, Y.; Xiang, M.; Zhang, X. Has the Dominant Climatic Driver for the Carbon Budget of Alpine Grassland Shifted from Temperature to Precipitation on the Qinghai–Tibet Plateau? Remote Sens. 2023, 15, 2492. [Google Scholar] [CrossRef] [Scilit]
- Huang, Y.; Wang, F.; Zhang, L.; Zhao, J.; Zheng, H.; Zhang, F.; Wang, N.; Gu, J.; Zhao, Y.; Zhang, W. Changes and Net Ecosystem Productivity of Terrestrial Ecosystems and Their Influencing Factors in China from 2000 to 2019. Front. Plant Sci. 2023, 14, 1120064. [Google Scholar] [CrossRef] [Scilit] [PubMed]
- Chaturvedi, R.K.; Tomlinson, K.W.; Pandey, S.K.; Tripathi, A.; Raghubanshi, A.S.; Singh, J.S. Changes in Plant Traits and Productivity of Two Functional Types across a Soil Water Content Gradient in a Tropical Dry Forest. J. Ecol. 2025, 113, 3535–3549. [Google Scholar] [CrossRef] [Scilit]
- Zhao, F.; Wang, X.; Ma, S.; Wu, Y.; Qiu, L.; Sun, P.; Li, Q. Widespread Increasing Ecosystem Water Limitation during the Past Three Decades in the Yellow River Basin, China. J. Geophys. Res. Biogeosci. 2023, 128, e2022JG007140. [Google Scholar] [CrossRef] [Scilit]
- Song, W.; Feng, Y.; Wang, Z. Ecological Restoration Programs Dominate Vegetation Greening in China. Sci. Total Environ. 2022, 848, 157729. [Google Scholar] [CrossRef] [Scilit] [PubMed]
- Zhuang, Q.; Shao, Z.; Li, D.; Huang, X.; Li, Y.; Altan, O.; Wu, S. Impact of Global Urban Expansion on the Terrestrial Vegetation Carbon Sequestration Capacity. Sci. Total Environ. 2023, 879, 163074. [Google Scholar] [CrossRef] [Scilit] [PubMed]
- Tian, P.; Yan, F.; Wang, Z.; Li, Y.; Wen, Z.; Chen, Y. Spatiotemporal Variation and Driving Factors of Carbon Sources/Sinks in the Taihang–Yanshan Mountains. Huan Jing Ke Xue 2025, 46, 4403–4415. [Google Scholar] [CrossRef] [Scilit] [PubMed]
- Sun, Z.; Liu, Y.; Sang, H. Spatial-Temporal Variation and Driving Factors of Ecological Vulnerability in Nansi Lake Basin, China. Int. J. Environ. Res. Public Health 2023, 20, 2653. [Google Scholar] [CrossRef] [Scilit] [PubMed]
- Song, Y.; Wang, J.; Ge, Y.; Xu, C. An Optimal Parameters-Based Geographical Detector Model Enhances Geographic Characteristics of Explanatory Variables for Spatial Heterogeneity Analysis: Cases with Different Types of Spatial Data. GISci. Remote Sens. 2020, 57, 593–610. [Google Scholar] [CrossRef] [Scilit]
- Jiang, J.; Chen, S. Exploring the Pathways of Achieving Carbon Peaking and Carbon Neutrality Targets in the Provinces of the Yellow River Basin of China. Sustainability 2024, 16, 6553. [Google Scholar] [CrossRef] [Scilit]
- Cui, Y.; Li, L.; Lei, Y.; Wu, S. The Performance and Influencing Factors of High-Quality Development of Resource-Based Cities in the Yellow River Basin under Reducing Pollution and Carbon Emissions Constraints. Resour. Policy 2024, 88, 104488. [Google Scholar] [CrossRef] [Scilit]
- Huang, N.; Wang, L.; Zhang, Y. Dataset of Global Terrestrial Net Ecosystem Productivity from 2000 to 2020; Version 1; Zenodo: Katowice, Poland, 2025. [Google Scholar] [CrossRef]
- Pei, Z.Y.; Zhou, C.P.; Ouyang, H.; Yang, W.B. A Carbon Budget of Alpine Steppe Area in the Tibetan Plateau. Geogr. Res. 2010, 29, 102–110. [Google Scholar] [CrossRef]
- Liu, J.; Shen, L.; Chen, Z.; Ni, J.; Huang, Y. Assessing the Response of the Net Primary Productivity to Snow Phenology Changes in the Tibetan Plateau: Trends and Environmental Drivers. Remote Sens. 2024, 16, 3566. [Google Scholar] [CrossRef] [Scilit]
- Liu, L.; Wang, J.; Li, J.; He, S.; Lan, Y.; Liu, F. Evaluation of Ecosystem Service Capacity Using the Integrated Ecosystem Services Index at Optimal Scale in Central Yunnan, China. Ecol. Evol. 2025, 15, e71222. [Google Scholar] [CrossRef] [Scilit] [PubMed]
- Qu, Q.; Jian, S.; Chen, A.; Xiao, C. Investigating the Dynamic Change and Driving Force of Vegetation Carbon Sink in Taihang Mountain, China. Land 2024, 13, 1348. [Google Scholar] [CrossRef] [Scilit]
- Zhi, L.; Chai, Y.; Sun, C.; Li, R.; Hu, T. Spatiotemporal Evolution and Driving Factors of Vegetation Net Ecosystem Productivity in Henan Province over the Past 20 Years. Front. Environ. Sci. 2024, 12, 1400425. [Google Scholar] [CrossRef] [Scilit]
- Tian, H.; Ji, X.; Zhang, F. Spatiotemporal Variations of Vegetation Net Primary Productivity and Its Response to Meteorological Factors across the Yellow River Basin during the Period 1981–2020. Front. Environ. Sci. 2022, 10, 949564. [Google Scholar] [CrossRef] [Scilit]
- Xuan, W.; Rao, L. Spatiotemporal Dynamics of Net Primary Productivity and Its Influencing Factors in the Middle Reaches of the Yellow River from 2000 to 2020. Front. Plant Sci. 2023, 14, 1043807. [Google Scholar] [CrossRef] [Scilit] [PubMed]
- Jiang, X.; Fang, X.; Zhu, Q.; Jin, J.; Ren, L.; Jiang, S.; Yan, Y.; Yuan, S.; Liao, M. Time-Series Satellite Images Reveal Abrupt Changes in Vegetation Dynamics and Possible Determinants in the Yellow River Basin. Agric. For. Meteorol. 2024, 355, 110124. [Google Scholar] [CrossRef] [Scilit]
- Li, H.; Liu, X.; Liu, J.; Meng, Y.; Xing, L.; Zhao, H.; Wang, C.; Wang, R.; Wang, B. Shifts in Greening Trend of Afforestation over the Loess Plateau from 2000 to 2023. Ecol. Indic. 2025, 177, 113756. [Google Scholar] [CrossRef] [Scilit]
- Yang, J.; Li, J.; Guan, X.; Chen, Y.; Zhang, Z.; Li, W. Anthropogenic Activities Have Accelerated the Restoration of Carbon Sequestration Services in the Upper Yellow River. Ecol. Eng. 2024, 207, 107355. [Google Scholar] [CrossRef] [Scilit]
- Li, X.; Yu, K.; Xu, G.; Li, P.; Li, Z.; Shi, P.; Jia, L. Exploring Ecosystem Service Dynamics and Drivers in the Upper and Middle Yellow River Basin under Large-Scale Ecological Restoration. Ecol. Eng. 2025, 217, 107643. [Google Scholar] [CrossRef] [Scilit]
- Wang, H.; Wu, L.; Yue, Y.; Jin, Y.; Zhang, B. Impacts of Climate and Land Use Change on Terrestrial Carbon Storage: A Multi-Scenario Case Study in the Yellow River Basin (1992–2050). Sci. Total Environ. 2024, 930, 172557. [Google Scholar] [CrossRef] [Scilit] [PubMed]
- He, Y.; Cao, S.; Yan, H.; Zhang, L.; Filonchyk, M. Increased Sensitivity of Ecosystem to Meteorological Drought Reduces Carbon Uptake in the Yellow River Basin. J. Hydrol. 2026, 666, 134788. [Google Scholar] [CrossRef] [Scilit]
- Song, B.; Jiang, X.; Wu, Z.; Wang, T.; Wu, T.; Wang, H.; Xu, H.; Yu, Z.; Yan, D. Greening but Enhanced Vegetation Water Stress in the Yellow River Basin: A Holistic Perspective. J. Environ. Manag. 2025, 375, 124139. [Google Scholar] [CrossRef] [Scilit] [PubMed]
- Xu, C.; Zhang, Q.; Yu, Q.; Wang, J.; Wang, F.; Qiu, S.; Ai, M.; Zhao, J. Effects of Land Use/Cover Change on Carbon Storage between 2000 and 2040 in the Yellow River Basin, China. Ecol. Indic. 2023, 151, 110345. [Google Scholar] [CrossRef] [Scilit]
- Li, N.; Sun, P.; Zhang, J.; Shen, D.; Qiao, D.; Liu, Q. Impact of Land Use Intensity Changes on Ecosystem Services in the Yellow River Basin, China. J. Geogr. Sci. 2025, 35, 1003–1023. [Google Scholar] [CrossRef] [Scilit]
- Niu, Z.; He, H.; Zhang, M.; Liu, T.; Li, P.; Zhou, T.; Feng, L.; Lv, Y. Carbon Sequestration Patterns in the Yellow River Basin of China Are Governed by the Vegetation Structural Dynamics. J. Environ. Manag. 2025, 395, 127835. [Google Scholar] [CrossRef] [Scilit] [PubMed]
- Liu, X.; Zhao, W.; Gao, B.; Yu, L.; Yuan, J.; Liang, T.; Wang, C.; Zhou, Q.; Huan, Y.; Zhou, G.; et al. Threshold Effects of Vegetation Increase on Ecosystem Services Based on the Constraint Line Method in the Loess Plateau Gully Zone. Ecol. Indic. 2025, 174, 113470. [Google Scholar] [CrossRef] [Scilit]
- Feng, X.; Fu, B.; Piao, S.; Wang, S.; Ciais, P.; Zeng, Z.; Lü, Y.; Zeng, Y.; Li, Y.; Jiang, X.; et al. Revegetation in China’s Loess Plateau Is Approaching Sustainable Water Resource Limits. Nat. Clim. Change 2016, 6, 1019–1022. [Google Scholar] [CrossRef] [Scilit]
- Zhang, B.; Tian, L.; Yang, Y.; He, X. Revegetation Does Not Decrease Water Yield in the Loess Plateau of China. Geophys. Res. Lett. 2022, 49, e2022GL098025. [Google Scholar] [CrossRef] [Scilit]
- Huang, Y.; Gao, G.; Ran, L.; Wang, Y.; Fu, B. Afforestation Reduces Deep Soil Carbon Sequestration in Semiarid Regions: Lessons from Variations of Soil Water and Carbon along Afforestation Stages in China’s Loess Plateau. J. Geophys. Res. Biogeosci. 2024, 129, e2024JG008287. [Google Scholar] [CrossRef] [Scilit]

Disclaimer/Publisher’s Note: The statements, opinions and data contained in all publications are solely those of the individual author(s) and contributor(s) and not of MDPI and/or the editor(s). MDPI and/or the editor(s) disclaim responsibility for any injury to people or property resulting from any ideas, methods, instructions or products referred to in the content. |
© 2026 by the authors. Licensee MDPI, Basel, Switzerland. This article is an open access article distributed under the terms and conditions of the Creative Commons Attribution (CC BY) license.