Article

Spatiotemporal Dynamics and Forecasting of Ecosystem Service Value in Zhengzhou Using Land-Use Scenario Simulation

1
College of Forestry, Henan Agricultural University, Zhengzhou 450046, China
2
Postdoctoral Research Station of Landscape Architecture, Henan Agricultural University, Zhengzhou 450046, China
3
College of Landscape Architecture & Art, Henan Agricultural University, Zhengzhou 450002, China
4
Ecological and Environmental Research Laboratory, Henan Academy of Forestry, Zhengzhou 450008, China
*
Authors to whom correspondence should be addressed.
Land 2025, 14(11), 2255; https://doi.org/10.3390/land14112255
Submission received: 26 September 2025 / Revised: 31 October 2025 / Accepted: 7 November 2025 / Published: 14 November 2025
(This article belongs to the Section Land Innovations – Data and Machine Learning)

Abstract

Ecosystem service value (ESV) is a critical indicator of regional ecological well-being. Assessing and forecasting ESV are essential for achieving the coordinated development of environmental and economic systems. This study employs the SD-PLUS model, integrating Shared Socioeconomic Pathways (SSPs) and Representative Concentration Pathways (RCPs) to assess the spatiotemporal dynamics of land use and land cover change (LUCC), as well as ESV in Zhengzhou from 2030 to 2040. It analyses the impact of various driving factors on ESV and examines the spatial correlations among ecosystem services across different regions. The results indicate that the total ESV is expected to decrease by 73.53 × 10⁷ yuan, primarily due to significant reductions in cropland and water areas. By 2040, ESV is projected to increase by 14.51 × 10⁷ yuan under the SSP126 scenario, decrease by 73.18 × 10⁷ yuan under the SSP585 scenario, and show a moderate decline under the SSP245 scenario. Climate factors, transportation location, and topographical features have a significantly positive impact on ESV, while environmental and socioeconomic factors exert a negative influence. The analysis of interrelationships among ecosystem services shows that synergies dominate, especially between supporting and cultural services, with only localised trade-offs observed. These findings contribute valuable insights for the development of scientifically sound, well-reasoned, and efficient strategies for ecological conservation and sustainable development.

1. Introduction

Ecosystem services provide essential benefits to humans, playing a pivotal role in supporting human life and promoting the long-term sustainability of urban growth [1]. However, between 1990 and 2020, urban land coverage worldwide expanded at an average annual rate of 2.4%, leading to the loss of nearly 150 million hectares of natural ecosystems [2]. The rapid urbanisation and the associated land use/land cover changes (LUCC) have become key drivers of global environmental change [3]. The resulting pressure on ecosystem services (ES) presents a significant threat to both regional and global sustainable development, highlighting the urgent need for ecosystem conservation and restoration [4]. The severity of this issue is reflected in the substantial economic losses. According to Costanza et al. [5], global annual losses in ecosystem service value (ESV) due to LUCC range from US$4.3 trillion to US$20.2 trillion, with urbanised areas experiencing particularly severe degradation. As one of the fastest-urbanising nations globally, China’s evolution of ecological security patterns within its urban clusters has significant implications for both regional and global sustainable development. ESV serves as a crucial approach for measuring ecological resources. The initial global framework for assessing ESV was established [6], which directly correlated land-use types with ESV. Subsequently, this assessment system was optimised by integrating China’s socioeconomic characteristics, making it more applicable to regional studies [7]. Building upon this system, scholars have extensively explored the mechanism through which LUCC impacts ESV [8,9,10,11].
In recent years, research on LUCC and ESV evolution has transitioned from static ‘past-present’ analysis to multi-scenario, forward-looking dynamic forecasting, with research perspectives becoming progressively more comprehensive and refined. Currently, LUCC simulation studies primarily focus on two major directions: first, forecasting the quantitative structure of land use; second, simulating its spatial distribution patterns [12]. Common methodologies for quantitative forecasting include Markov models [13], system dynamics (SD) models [14], and grey prediction models [15]. SD models, by constructing causal feedback loops among multiple modules, simulate complex system behaviour, providing a more comprehensive reflection of the combined impact of various factors, such as socioeconomic conditions and policies on land-use change [16]. At the spatial simulation level, commonly used models include the CA-Markov [13], CLUE-S [17], artificial neural network (ANN) [18], mixed-cell cellular automata (MCCA) [19], and FLUS models [20]. In 2021, Liang et al. [21] presented the PLUS model (Patch-generating Land-Use Simulation Model), which improves the representation of the nonlinear interactions in LUCC through an innovative rule-mining approach and patch-generation mechanism. This advanced model has been demonstrated to outperform conventional simulation methods. Given the limitations of individual models in predicting land use, the PLUS model is commonly integrated with other methodologies, such as the Non-Stable Genetic Algorithm II (NSGA-II) [22] and the Mathematical Model for Uncertainty (MIFCCP) [23]. The integration of the SD model, which is capable of simulating land-use demand at a macro level, with the PLUS model, which facilitates spatially detailed allocation of land-use types, has emerged as an effective scenario for simulating future LUCC patterns within a multi-scenario framework.
To comprehensively assess the impacts of climate change and corresponding response strategies, the climatological community has developed an integrated framework that incorporates both socioeconomic factors and radiative forcing scenarios. Its core consists of Representative Concentration Pathways (RCPs) and Shared Socioeconomic Pathways (SSPs). This framework serves as the foundational paradigm for contemporary climate change scenario research and provides essential inputs for international comparative initiatives, such as CMIP6 [24]. SSPs depict future societal evolution under different socioeconomic pathways, while RCPs characterise radiative forcing levels associated with varying greenhouse gas concentrations [25]. Their integration enables the systematic analysis of climate-socioeconomic system interactions and has been increasingly applied to multi-scenario spatial simulations of ecosystem services (ES) in recent years [26]. For instance, Feng et al. [27] analysed the long-term evolution of habitat quality in China under multiple climate scenarios; Cai et al. [28] coupled the SD-PLUS-InVEST model to estimate changes in ESV and Ecosystem Performance (ESP) under various land-use scenarios at the county scale. Despite advances in LUCC modelling and ecosystem service assessment, these studies display significant limitations: most focus on individual ecosystem service types, failing to fully capture the cumulative effects of urban expansion and environmental change on overall ESV. Furthermore, research predominantly focuses on national or provincial scales, lacking high-precision, multi-scenario dynamic ESV simulations at the urban scale. This limitation restricts their ability to support urban ecological management practices.
As research on ESV has shifted from static assessments to dynamic mechanism analysis, the roles of natural and socioeconomic factors have been increasingly recognised as key drivers of its spatiotemporal variation [29]. Consequently, academic research has developed methodologies such as grey relational analysis [30], geographically weighted regression [31], and geographic detectors [32], conducting empirical studies across multiple scales [33,34]. However, existing analyses primarily focus on direct effects, often failing to address issues such as multicollinearity and latent variable structures. In reality, independent variables frequently exert indirect influences on ESV through mediating variables, and there exist complex interaction effects among various drivers—intrinsic mechanisms that remain insufficiently elucidated [35]. Partial Least Squares Structural Equation Modelling (PLS-SEM), as a multivariate approach integrating path analysis, factor analysis, and regression techniques, is capable of effectively handling such multi-layered causal relationships [36]. This model is not only suitable for small sample sizes but also allows for the simultaneous estimation of both direct and indirect effects, facilitating the construction of theoretical structural relationships between observed and latent variables [37]. PLS-SEM has demonstrated strong explanatory power in studies of wetland ecosystem services [38] and ecological supply-demand relationships [39]. Its application to the study of ESV driving mechanisms holds promise for systematically revealing the integrated pathways through which natural and social factors influence ESV, thus providing a structured theoretical framework for understanding.
Being the core city of the Central Plains Urban Cluster, Zhengzhou plays a pivotal role in China’s major national strategy for ‘Ecological Conservation and High-Quality Development in the Yellow River Basin’. Its development model holds substantial illustrative and guiding value for other cities within the basin. Over the past two decades, the city has undergone an unprecedented and rapid urbanisation process, characterised by explosive growth in population and GDP, coupled with drastic shifts in the relationship between human activity and land use. This has given rise to a series of challenges, including the reduction in ecological land, the exacerbation of environmental issues, and the degradation of ecosystem service functions. Therefore, this study employs the city of Zhengzhou as a case study, using the SD-PLUS model to achieve higher precision land-use simulation and calculate the evolutionary trends of ESV under future SSP-RCP scenarios. Subsequently, PLS-SEM is employed to identify key drivers, revealing mediating and moderating effects among these factors. In combination with spatial autocorrelation analysis, spatial clustering characteristics among ecosystem services are identified, and furthermore, trade-offs and synergistic relationships are elucidated through correlation networks. This study aims to dissect Zhengzhou’s ecological balance status, providing a representative case for understanding ecosystem service response mechanisms across the entire Yellow River Basin amid rapid urbanisation, thereby providing a reference for comparable cities.

2. Materials and Methods

2.1. Study Area

Zhengzhou (34°16′−34°58′ N, 112°42′−114°14′ E) is located in the central part of Henan Province, on the south bank of the Yellow River (Figure 1). The city encompasses a total area of 7567 km2, administratively divided into 6 districts, 5 county-level cities, and 1 county. It functions as the central city of the Central Plains urban agglomeration and a key transportation hub, featuring a well-integrated high-speed rail network and the Zhengzhou Aviation Port Economic Experimental Zone. The region extends across two major river basins: the Yellow River and the Huai River. Its topography is characterised by higher elevations to the west and lower terrains to the east, which provide abundant ecological resources and favourable conditions for urban development. As a typical area experiencing rapid urbanisation, intensive human activities have resulted in significant changes in land use and substantial ecological and economic conflicts.

2.2. Data Sources

The primary data used in this study consist of land-use data, climate data, and natural and socioeconomic data. Table 1 presents the detailed sources for each data category. Land-use data were obtained from the publicly available CLCD national land cover dataset [40], developed by Professor Yang Jie and Professor Huang Xin’s team at Wuhan University. These data were reclassified into cropland, forest, grassland, water bodies, construction land, and unused land. Precipitation and temperature data, based on SSP-RCP scenarios, were obtained from the Resource and Environmental Science and Data Platform (https://www.resdc.cn/) (accessed on 15 March 2025). GDP data were obtained from the grid-based GDP projections under Shared Socioeconomic Scenarios by Murakami et al. [41]. Population data were acquired from the global 1-kilometre grid population distribution under Shared Socioeconomic Scenarios [42]. Urbanisation rates were estimated using provincial urbanisation projections for China under SSP scenarios [43], supplemented by assumptions reflecting the actual dynamics in Zhengzhou. The distances to the water, highways, railway stations, main urban roads, and secondary urban roads were computed using Euclidean Distance analysis, and the Masking Tools were used to extract relevant driving factor data relevant to the study area. For the study area, all raster data have a uniform spatial resolution of 30 m, and the projected coordinate system adopted is WGS1984_UTM_ZONE_49N.

2.3. Methods

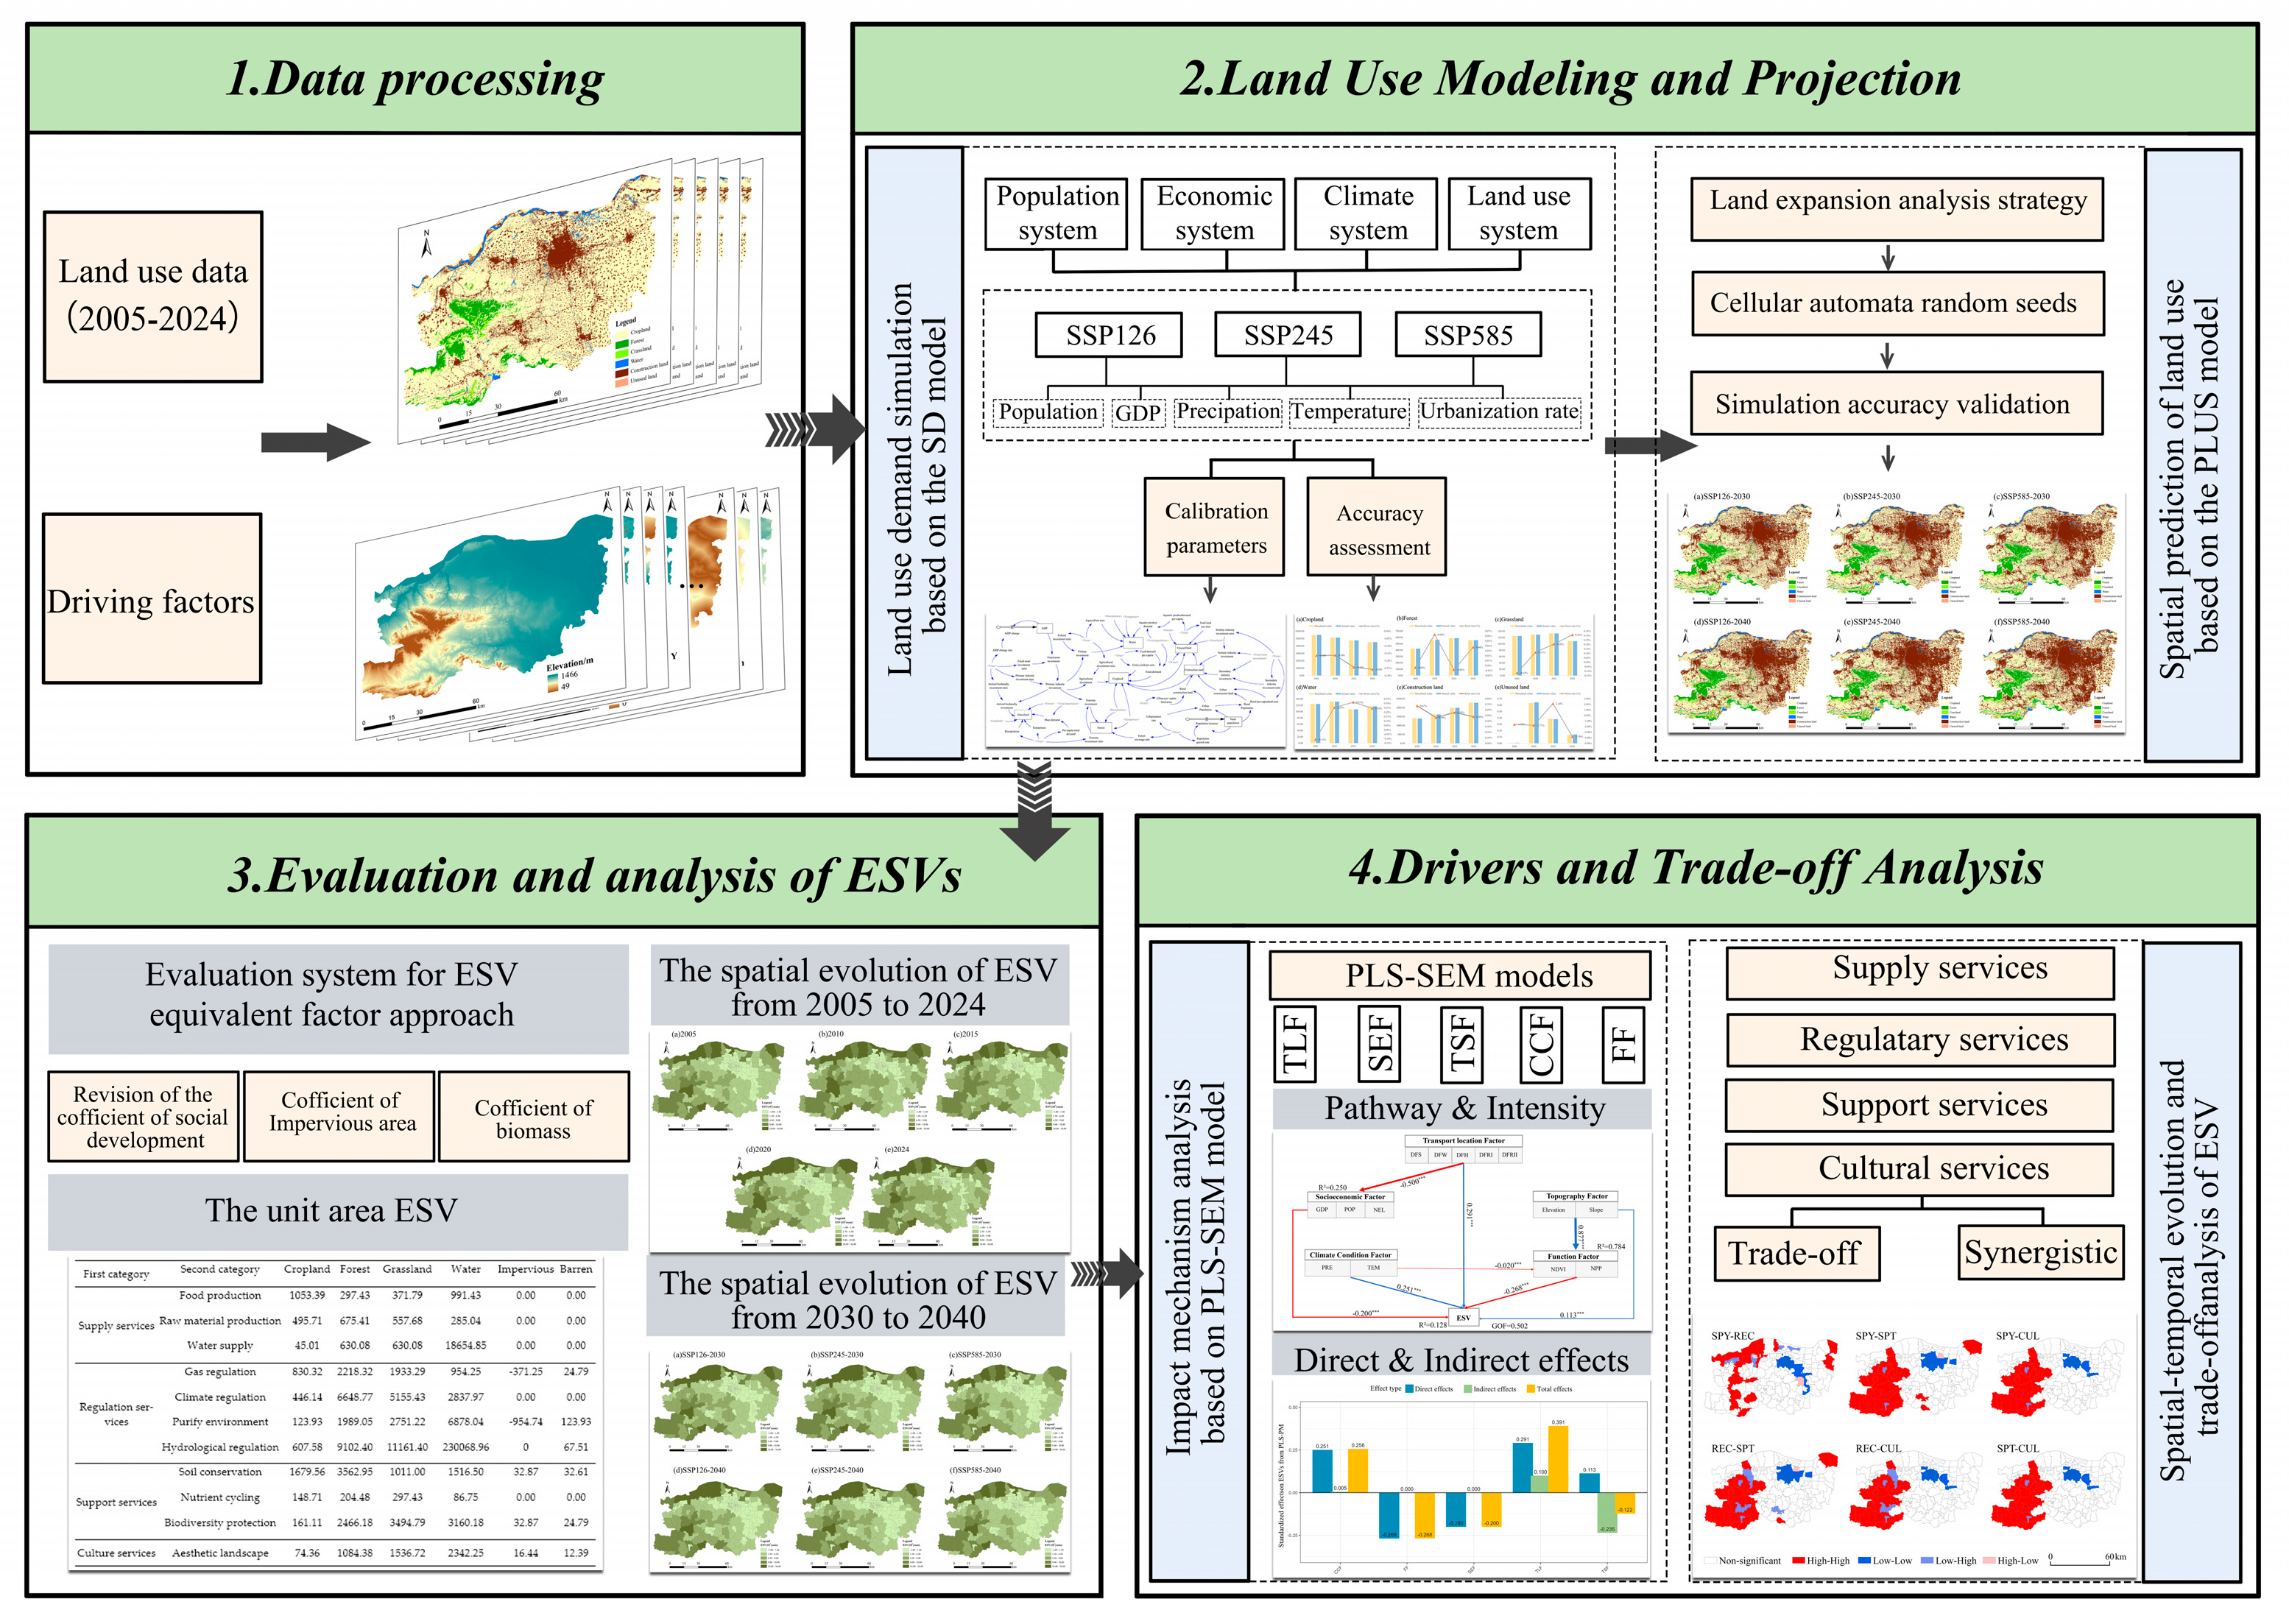
The main work content and process of this study are shown in Figure 2: Firstly, data processing is performed to examine the trends and patterns in the historical development of LUCC between 2005 and 2024. Based on various SSP-RCP scenarios, the SD-PLUS model was incorporated to simulate future land use under climate change scenarios for 2030 and 2040. Second, the equivalent factor method was applied to assess changes in ESV from 2005 to 2024, along with projections for 2030 and 2040 under various scenarios. PLS-SEM analysis was performed to investigate the driving mechanisms of ESV across various factors. Lastly, the trade-offs and synergies and spatial heterogeneity of ecosystem services were investigated using Pearson correlation coefficients and spatial autocorrelation analysis.

2.3.1. Land-Use Transition Matrix

In this research, we analyse the LUCC in Zhengzhou City using Markov modelling. The practical application of this approach in land-use assessment is demonstrated by the land-use transition matrix [44]. The formula is as follows:
S i j =   S 11 S 12 S 1 n S 21 S 22 S 2 n S n 1 S n 2 S n n
where Sij represents an n × n matrix, S is the land area; the land-use categories at the start and end of the study period are labelled as i and j, respectively, n refers to the total number of land-use categories.

2.3.2. SSP-RCP Scenarios

The CMIP6 includes a range of scenarios under the SSPs and RCPs, highlighting the driving role of diverse socioeconomic development models in climate change [45]. This study references pertinent literature [26,46], in light of data availability, selects three future climate change scenarios—SSP126, SSP245, and SSP585—for analysis. SSP126, referred to as the Sustainability Scenario, represents a socioeconomic development pathway characterised by low greenhouse gas emissions; SSP245, the Middle-of-the-Road Scenario, signifies a moderate socioeconomic trajectory with intermediate greenhouse gas emissions; and SSP585, known as the Rapid Development Scenario, entails extensive fossil fuel use and a rapid increase in high greenhouse gas emissions [47]. In contrast, while SSP119 also describes a sustainable future, its radiative forcing is more stringent, and its socioeconomic assumptions significantly overlap with those of SSP126. Given that this study seeks to contrast distinctly different future pathways, and that SSP126 sufficiently captures the low-carbon transition, SSP119 was excluded. SSP370 presents a medium-to-high forcing pathway characterised by regional competition and fossil fuel reliance, situated between SSP245 and SSP585. To maintain broad scenario coverage while avoiding undue analytical dispersion and to emphasise extreme risks, this study ultimately selected SSP585 due to its higher forcing level and more pronounced contrasts.

2.3.3. Land-Use Demand Projection Under SSP-RCP Scenarios

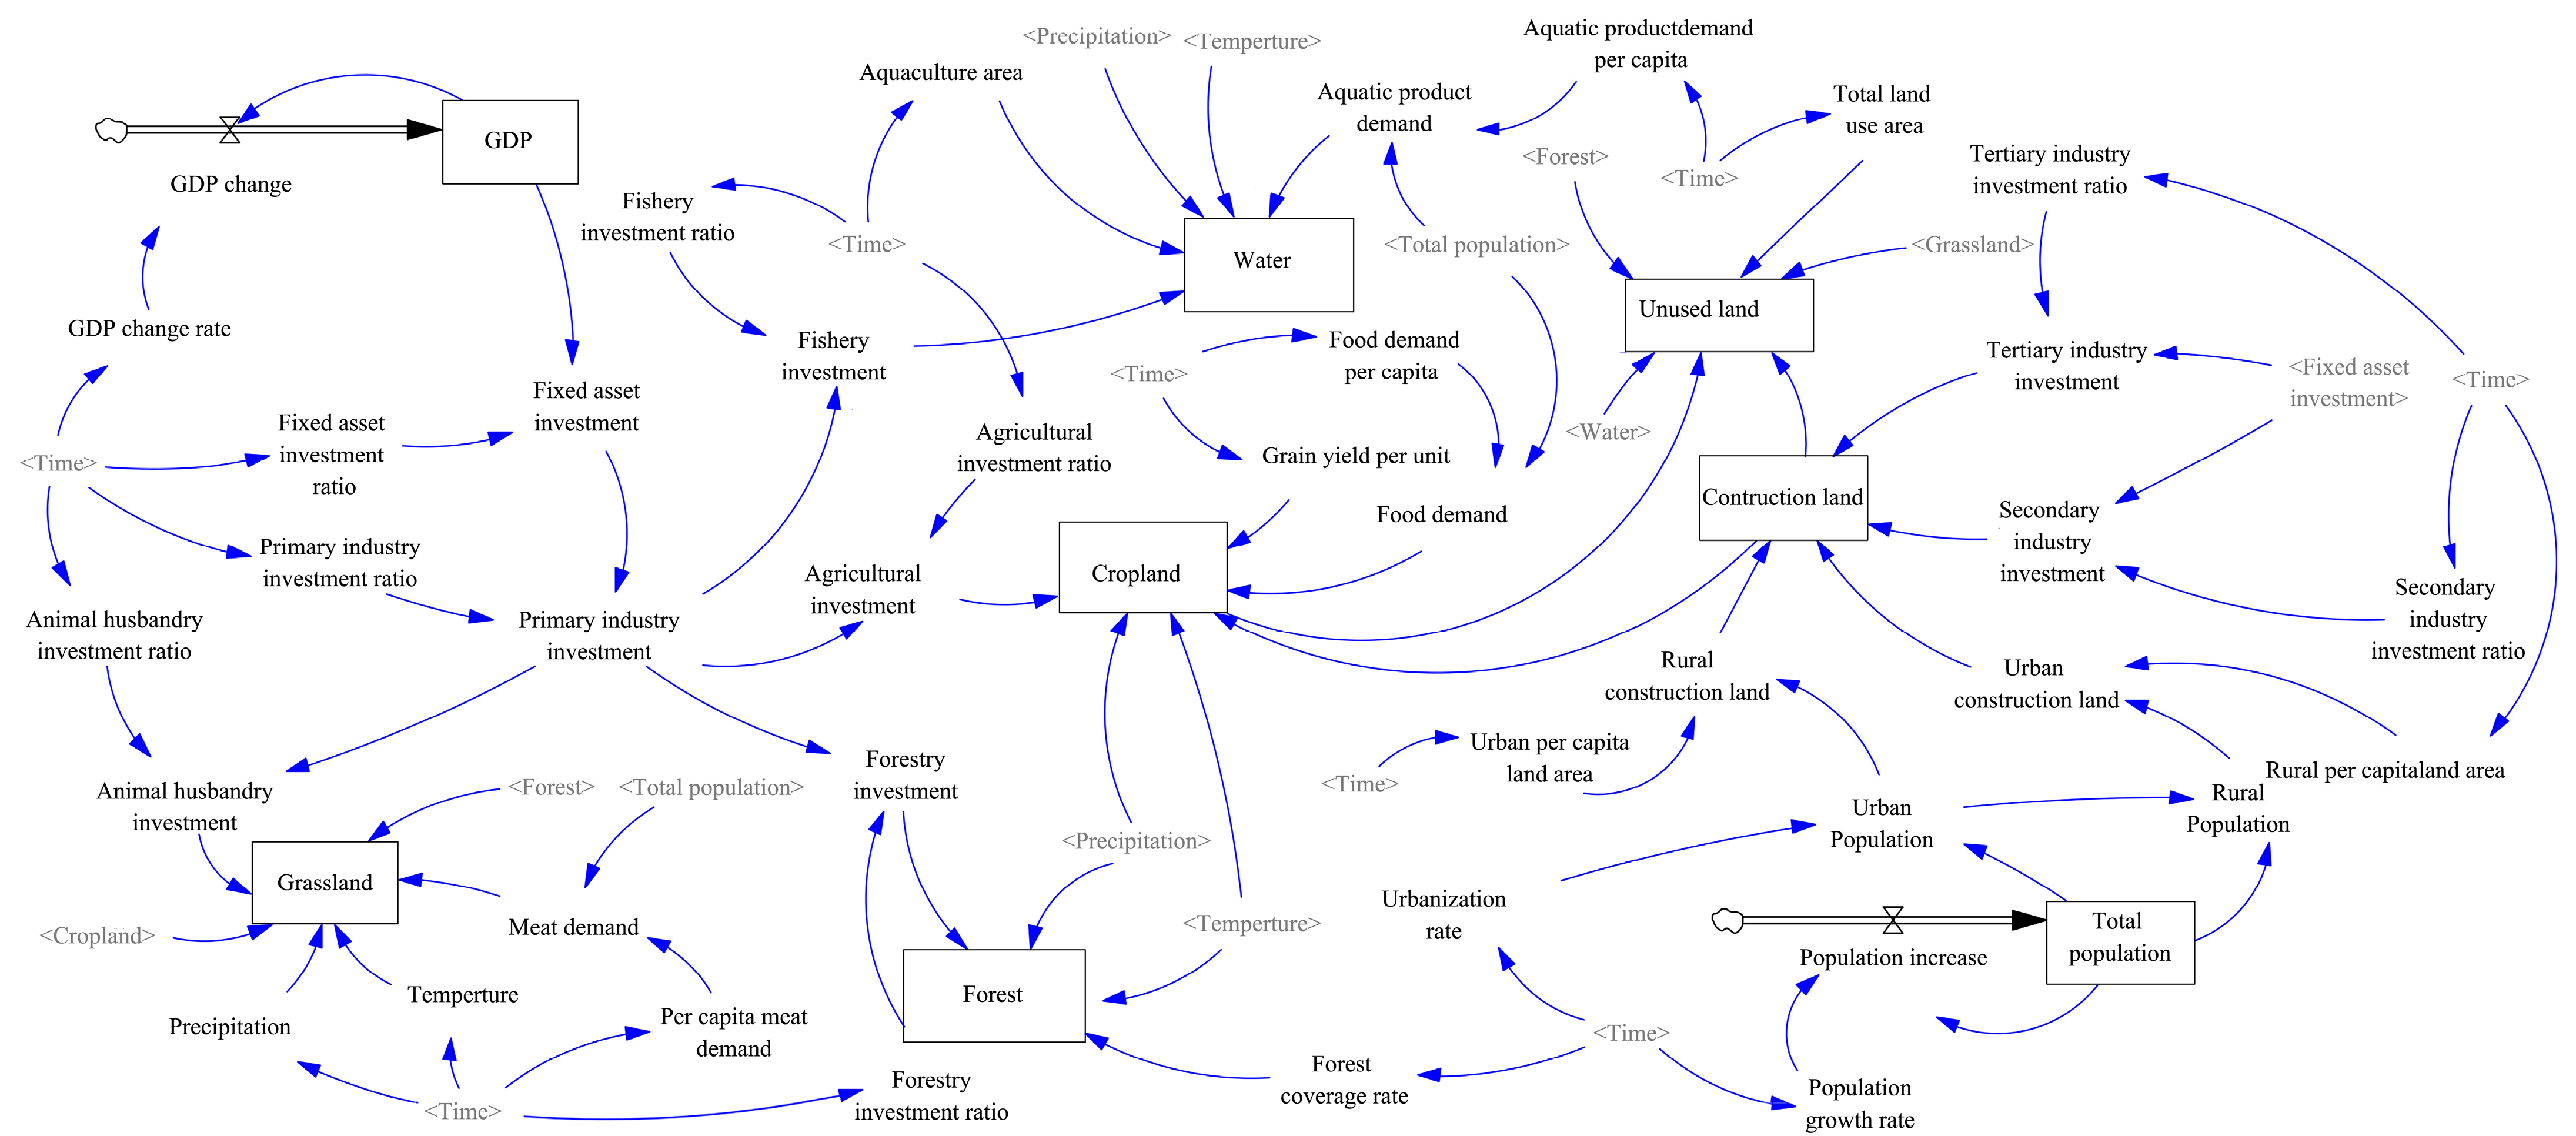
The SD model for land demand, as constructed in this study, incorporates population, economic, climate, and land subsystems [48]. Population and economic activity are the primary influencing factors that significantly impact quantitative shifts in land-use demand. The population subsystem focuses on analysing how changes in population size and structure drive land-use demand. The economic subsystem examines how economic growth and industrial structure evolution affect the scale of various land uses. Economic development alters the input proportions and output values of the three primary industries, thereby influencing land use. For instance, the output value of the primary industry affects the changes in the output value of agriculture, forestry, animal husbandry, and fisheries, subsequently impacting the corresponding land-use demand. The climate sub-system focuses on the long-term regulatory effects of factors such as temperature and precipitation on natural vegetation cover and land-use types. The land-use subsystem addresses land conversion, encompassing cropland, grassland, forest land, water bodies, construction land, and unused land.
The SD model was constructed using the Vensim PLE 10.1.0 platform (Figure 3), with a time horizon spanning from 2005 to 2040 and an annual time step. Given the availability and consistency of statistical data, the period from 2005 to 2023 was designated as the historical calibration phase. Population, economic, and climate data from this interval were used to adjust and optimise model parameters. After validating the model through the Check Model and Unit Check functions, it was confirmed that the model operates correctly with consistent units for all variables. To evaluate the model’s accuracy, historical data from 2005 to 2020 were input into the model. The simulated land-use area values were then compared to historical records to assess the error margins. As shown in Table 2, the relative errors for all land-use categories remained below 5%, which indicates high precision in the simulations.
During the projection period from 2023 to 2040, five key indicators—population, GDP, urbanisation rate, temperature, and precipitation—were chosen as regulatory variables within the SSP-RCP scenario framework. The rates of change for these parameters were determined based on their projected trajectories across various scenarios (Table 3), thereby enabling the simulation of future land resource demands under different scenarios. This approach lays a foundation for the formulation of regional land-use policies.

2.3.4. PLUS Model

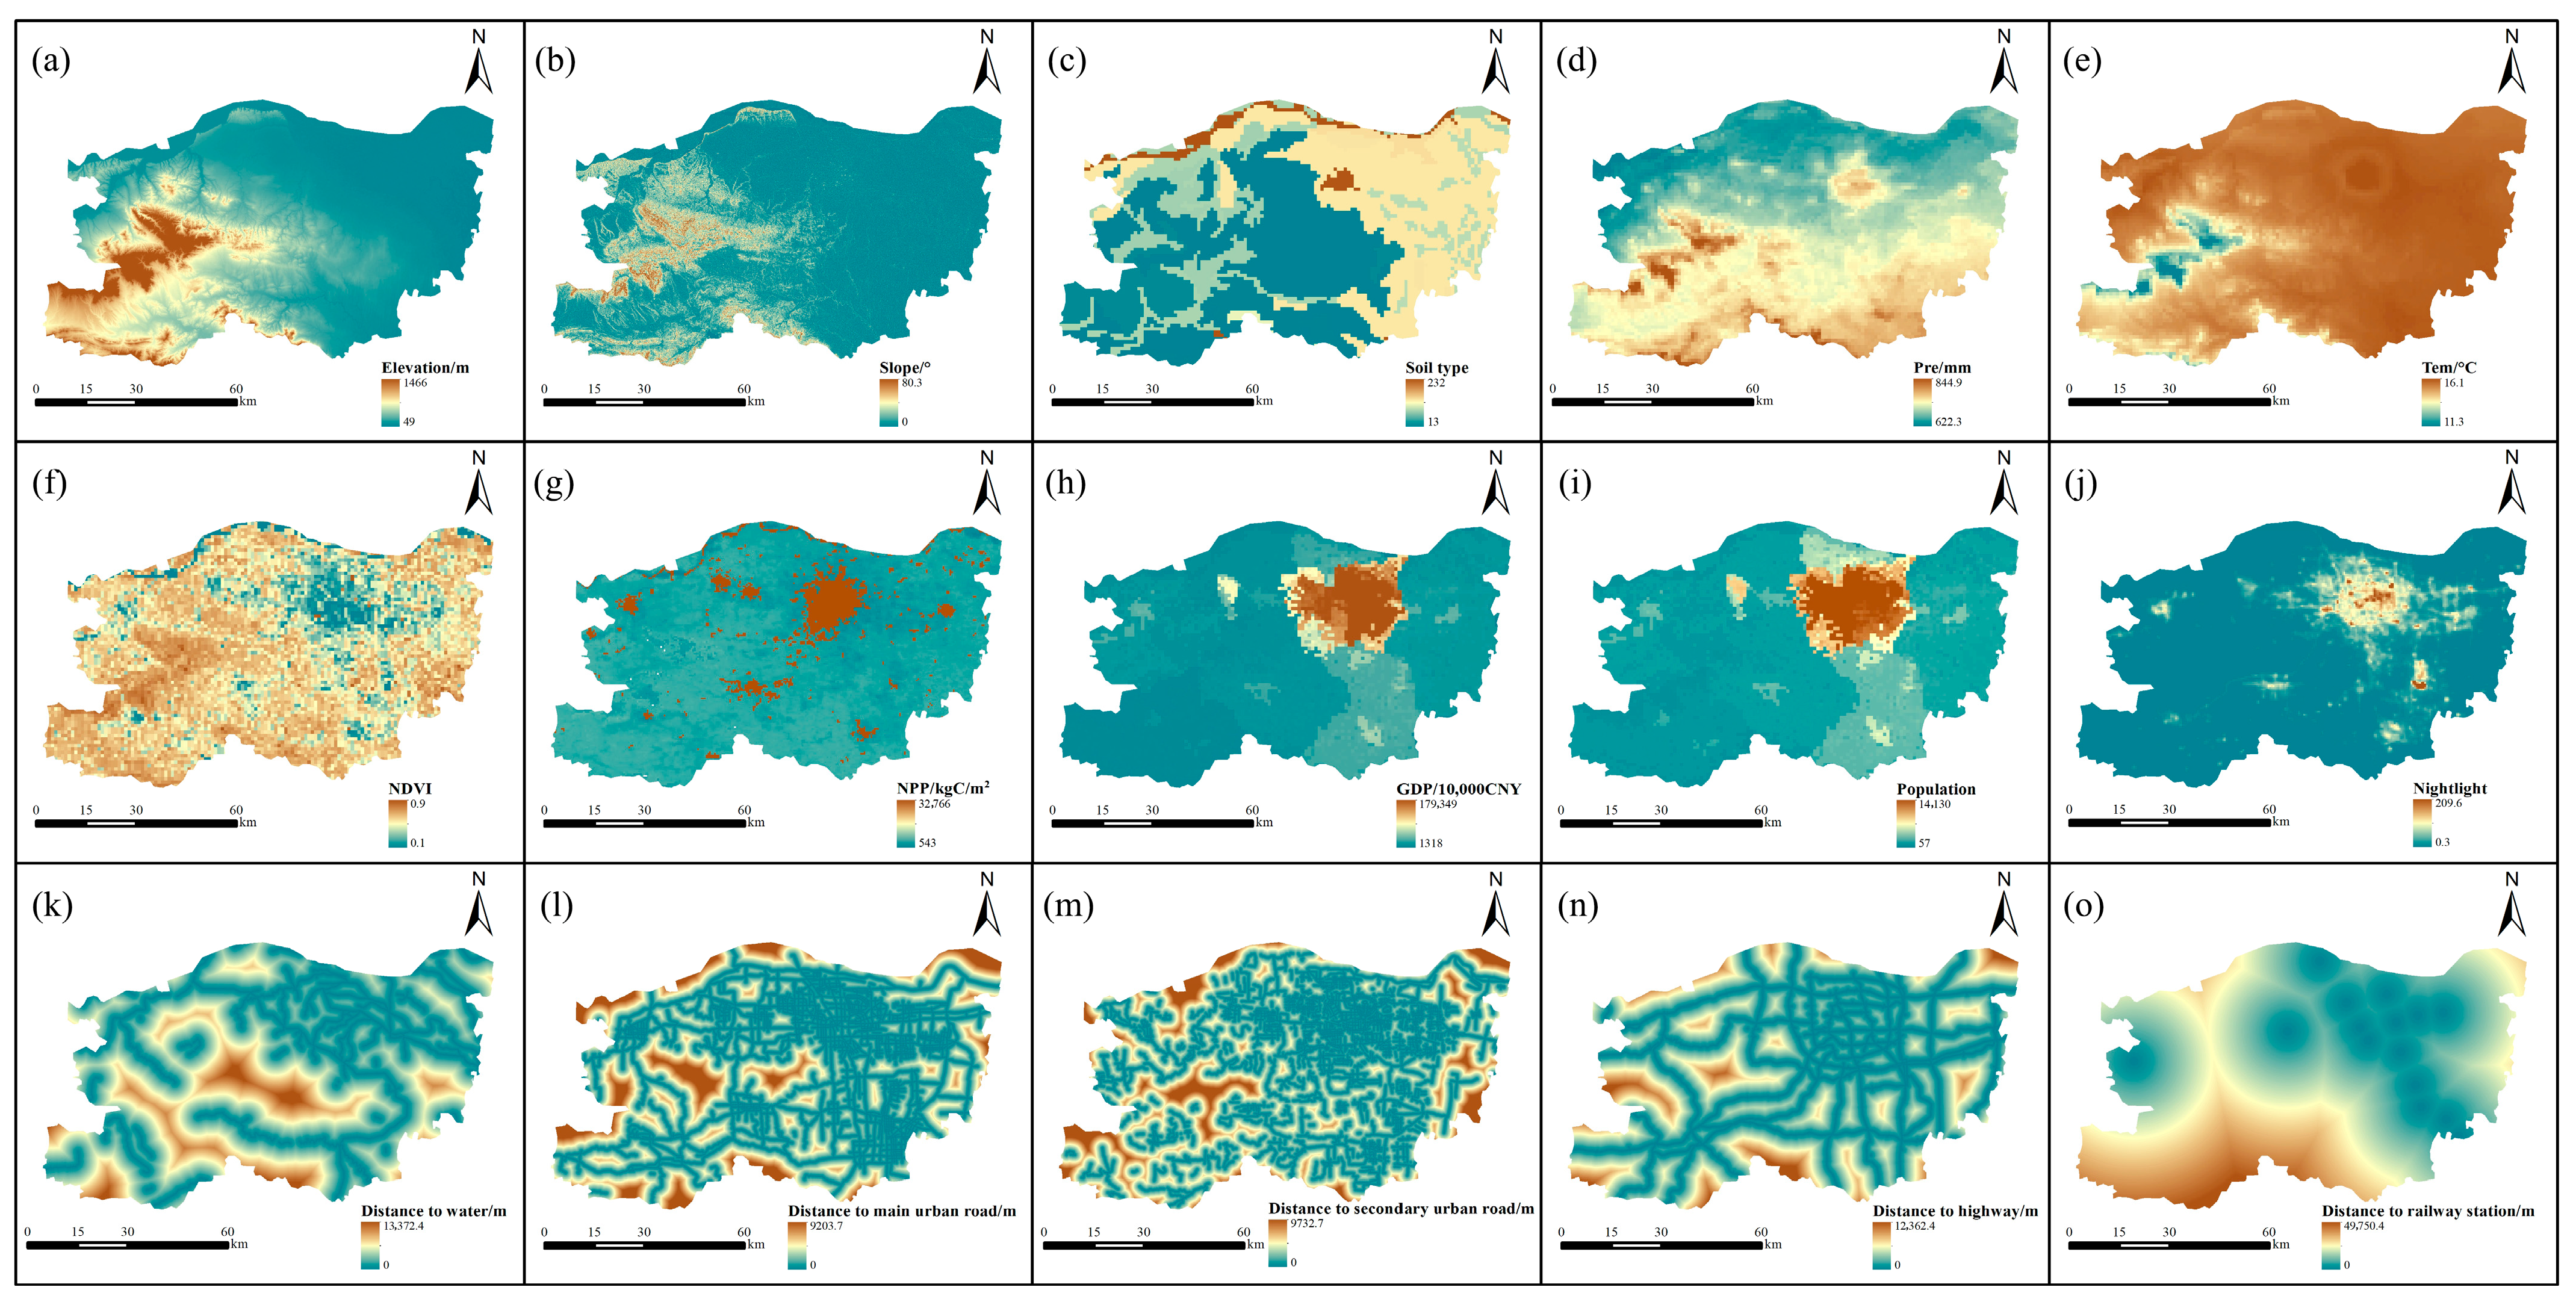
The PLUS model is a raster-based meta-cellular automaton (CA) developed for simulating land use. The model combines the Land Expansion Analysis Strategy (LEAS) with a CA model incorporating multi-type stochastic patch seeding. It leverages historical land-use conversion rules and driving factors to simulate future land-use patterns at the patch level [21]. The neighbourhood weight for each scenario in this analysis is determined by the proportion of the expansion area of each land-use type to the total expansion area [49]. Fifteen factors influencing land-use change were identified across three dimensions: natural environment, socioeconomic factors, and accessibility conditions (Figure 4).
Based on land-use data from 2010 and 2015, land-use conditions for 2020 and 2024 were simulated, and accuracy validation was performed using actual data (Figure 5). The classification accuracy was evaluated using the confusion matrix method [50], with model performance assessed through user accuracy, producer accuracy, overall accuracy, and the Kappa coefficient. The Kappa coefficient reflects the agreement between the classification results and actual data [51]. The confusion matrices for the 2020 and 2024 land-use classifications are presented in Table 4. Further analysis indicated relatively low user accuracy for water bodies and unused land, suggesting that some areas categorised as such might have been misclassified, possibly due to confusion with unused land. The Kappa coefficients for the two validation years were 0.83 and 0.78, respectively, demonstrating the model’s strong simulation capability. This confirms that the model is suitable for simulating the spatial patterns of land use in Zhengzhou under three SSP-RCP scenarios for 2030 and 2040.

2.3.5. Calculation of ESV

This study adopted the “China Ecosystem Service Value Equivalent Per Unit Area” formulated by Xie et al. [7]. By calculating the multi-year average unit area yields of the three principal food crops (wheat, maize, and soybeans) in Zhengzhou from 2005 to 2024, the study used the average purchase prices of these crops during the study period as a reference point. Based on this method, the ESV of 1 standard equivalent in Zhengzhou City is calculated to be 1381.89 yuan/hm2.
(1)
Revision of socioeconomic coefficients
The value of ecosystem services varies in response to socioeconomic development within a region. While Xie Gaodi et al. [7] calculated national ecosystem service values, this methodology lacks precision when applied to the study area. To improve the applicability of the assessment, this research modifies socioeconomic coefficients [52]. The specific formula is provided in Table 5.
(2)
Revision of Biomass Coefficients
For a given ecosystem, a positive correlation is commonly observed between precipitation levels and the economic value of hydrological services, such as water supply and flow regulation. Similarly, precipitation is closely associated with topographic slope and vegetation coverage. Other types of ecosystem services also exhibit a proportional relationship with biomass [53]. To further elucidate the spatial heterogeneity of ESV, both NPP and precipitation were selected for adjustment, in accordance with prior research. The service functions related to NPP include food production, raw material production, gas regulation, climate regulation, environmental purification, nutrient cycling maintenance, biodiversity, and aesthetic landscapes; whereas the service functions related to precipitation include water resource supply and hydrological regulation. The specific formula is provided in Table 5.
(3)
Revision of construction land area Coefficients
As areas characterised by concentrated populations, construction sites exert detrimental impacts on the ecological environment through the consumption of resources and the discharge of waste generated by human activities and daily life [54]. This study utilises the replacement cost method and market value method [55,56], based on statistical yearbook data, to quantitatively assess the regulation of gases, environmental purification, and the cultural value of construction land. The specific formula is provided in Table 5.
Through these three revisions, the table of ecosystem service values for Zhengzhou City is derived (Table 6). When calculating the total value of regional ecosystem services, the algebraic sum method is used to aggregate the ESVs of each land-use type.

2.3.6. PLS-SEM

Partial Least Squares Structural Equation Modelling (PLS-SEM) is a variant of structural equation modelling, widely utilised to examine relationships among multiple variables [57], involving both latent and observed variables. In this study, to mitigate the adverse impact of excessive multiplicative variations between data points on final outcomes, all data were subjected to standardisation. External loading tests were conducted on 15 factors, and factors with loadings below 0.5 were excluded. Building on existing research [38,58], latent variables were classified into the following categories: Transport Location Factors (TLF), Socioeconomic Factors (SEF), Climate condition Factors (CCF), Environmental Function Factors (FF), and Topography Factors (TSF). The TLF included observed distances to water bodies, railway stations, highways, and primary/secondary urban thoroughfares; Socioeconomic factors include population, GDP, and nocturnal light; Climatic factors include temperature and precipitation; Environmental functional factors consist of net primary productivity and vegetation cover index; Topographic factors include elevation and slope gradient. The ‘plspm’ package in R4.3.3 was used for model construction.
The evaluation of PLS-SEM includes Validity testing (AVE), Reliability testing (CR), and External loading testing (Loading) [38]. The Goodness-of-Fit (GoF) global criterion was introduced to assess the overall quality of the model. Based on GoF cutoff values of 0.1, 0.25, and 0.36, the overall model fit was categorised as weak, moderate, or strong [59], with path significance determined by p-values. The results of the model evaluation are presented in Table 7. All latent variables show factor Loadings greater than 0.5, CR exceeding 0.7, and AVE greater than 0.5. These findings indicate that the model is both reliable and valid.

2.3.7. Quantifying Trade-Offs and Synergies

To understand their complex dynamics, this research employs Pearson correlation analysis alongside spatial autocorrelation techniques to uncover the trade-off and synergy relationships between pairs of ecosystem services [60]. Furthermore, bivariate local autocorrelation analysis is employed to examine the spatial patterns of clustering related to the trade-off and synergy interactions among ecosystem services [61]. Based on this method, a global autocorrelation analysis was performed for 2024.

3. Result

3.1. Land Use/Cover Patterns

3.1.1. Changes in Land-Use Structure from 2005 to 2024

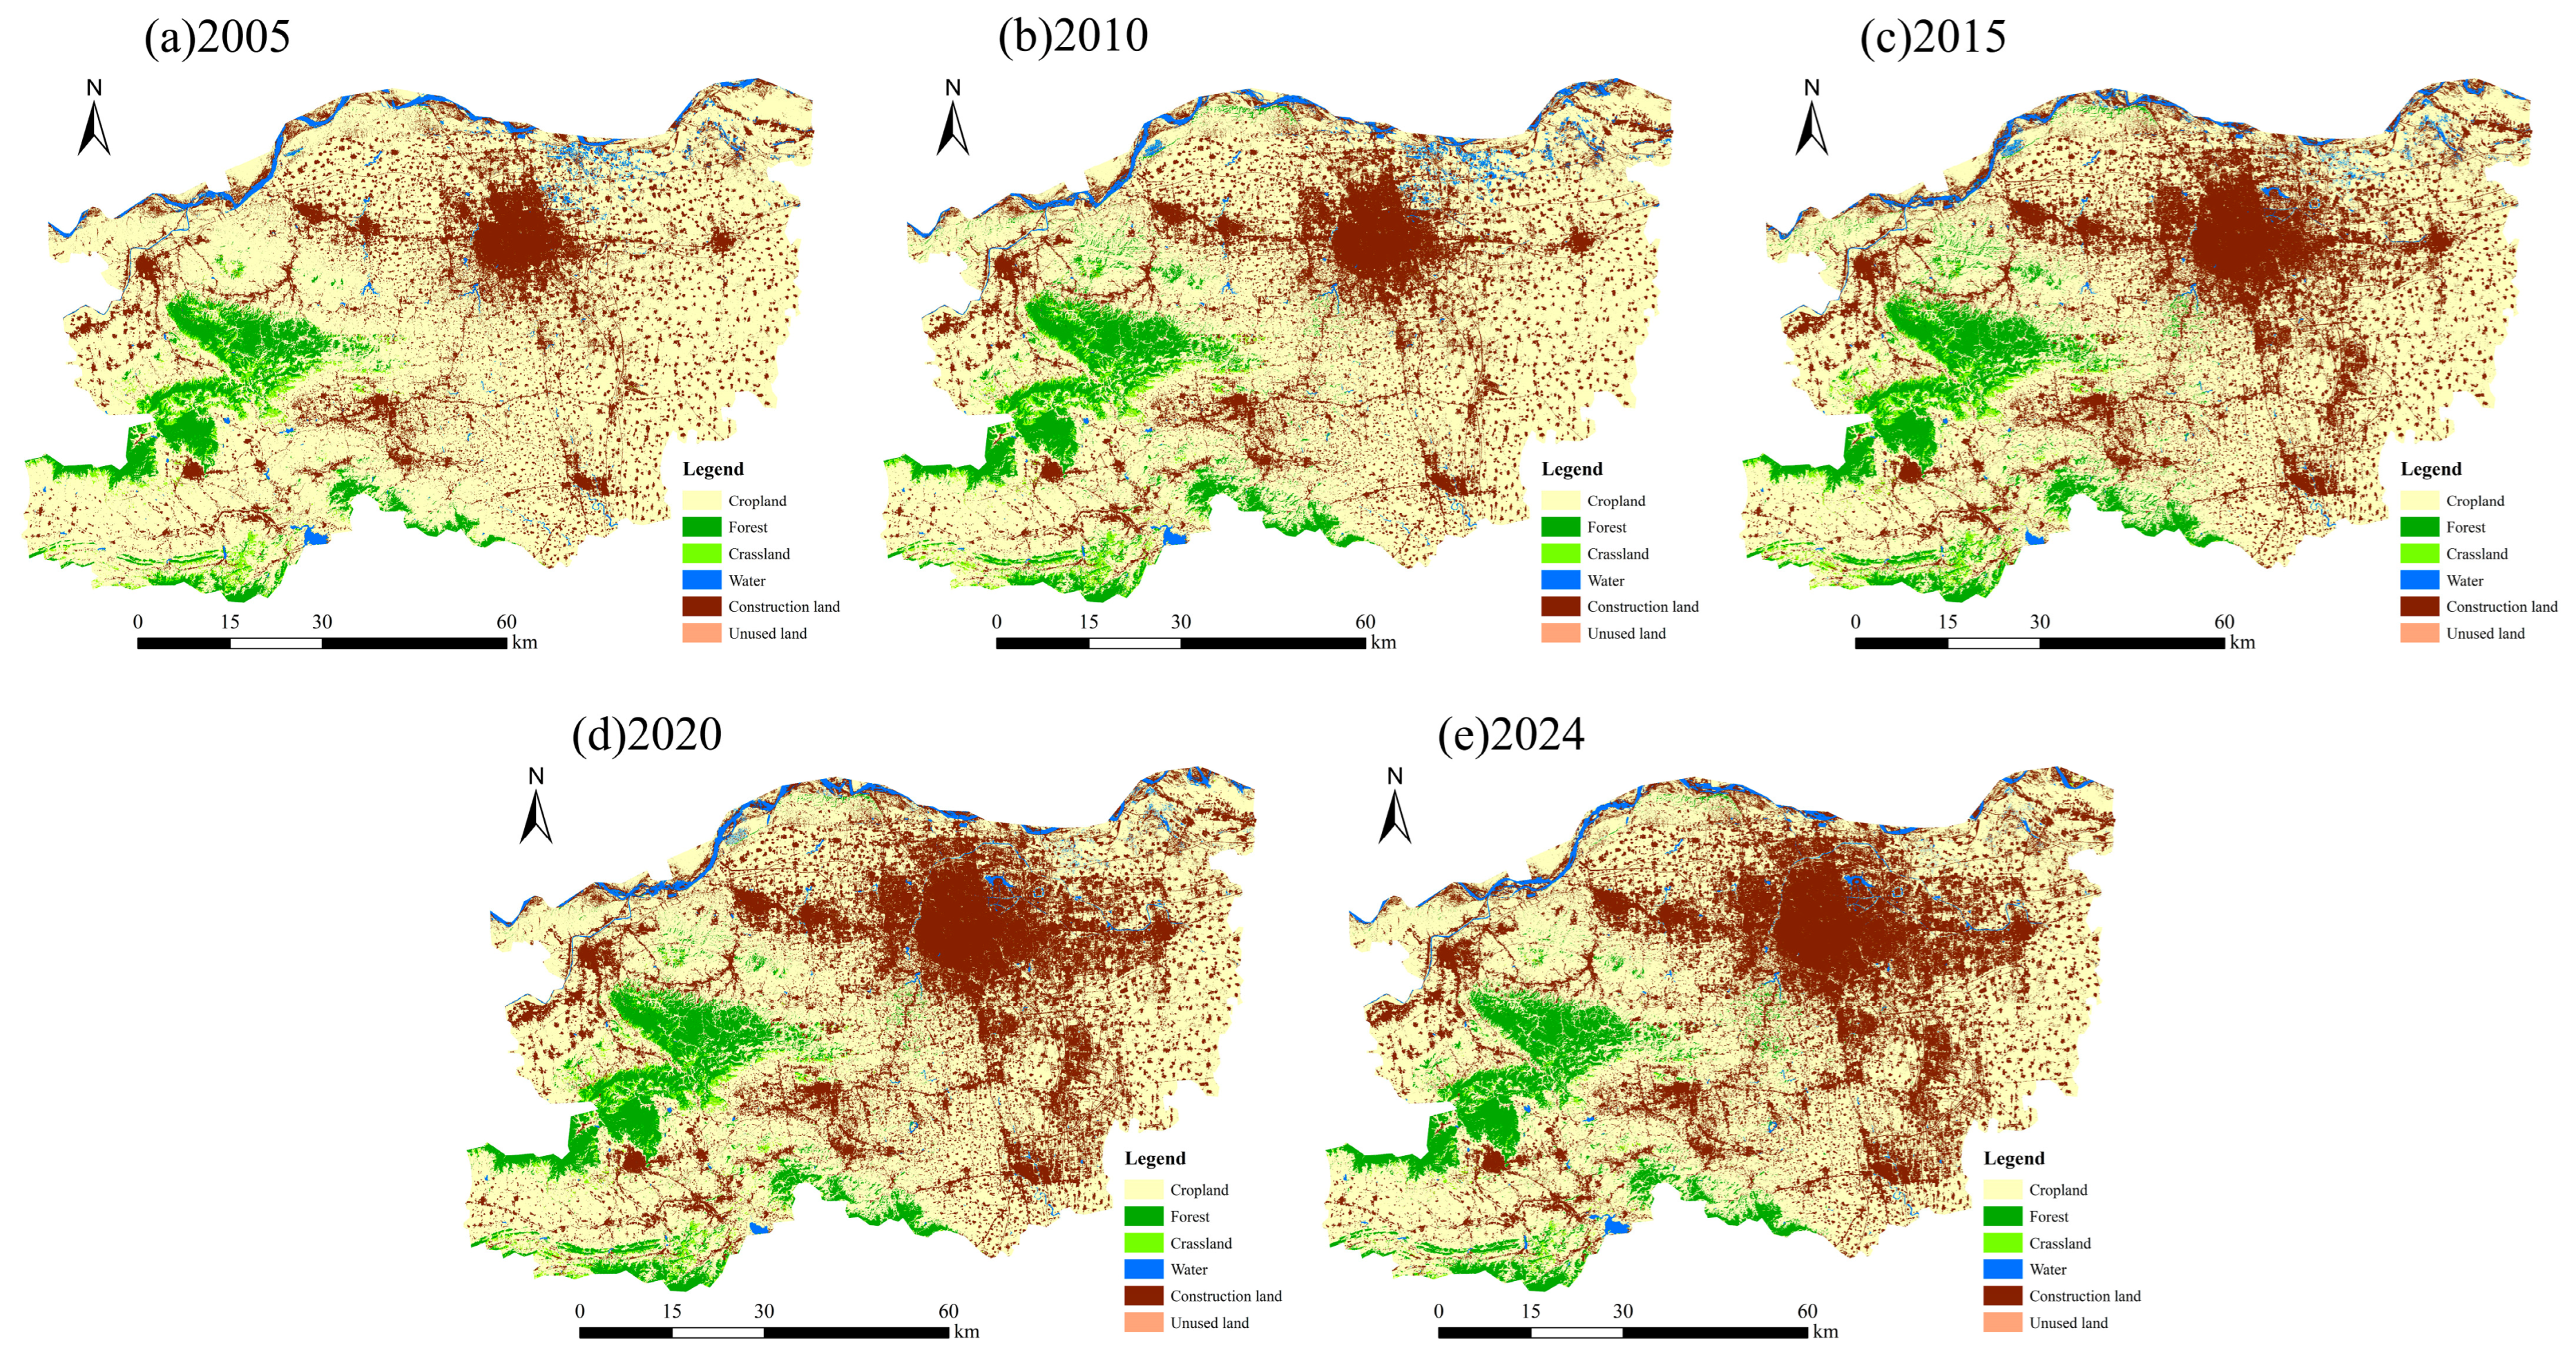
The evolution of land-use patterns in Zhengzhou City from 2005 to 2024 reveals notable trends (Figure 6). Cropland remains the dominant land-use category; however, it has experienced the most significant reduction in area. Specifically, the cropland area decreased from 5506.42 km2 to 4504.40 km2, leading to a net loss of 1002.01 km2. In contrast, construction land is the only land-use category that exhibited continuous growth throughout the study period, expanding substantially from 1389.93 km2 to 2300.97 km2. This resulted in a net increase of 910.38 km2, representing a substantial growth rate of 65.5%. This trend indicates that urban expansion has predominantly encroached upon cropland, posing a direct threat to regional food security and agricultural ecological functions.
From the viewpoint of spatial development, the expansion of construction land follows a radial pattern, extending from the central urban area (Erqi District, Zhongyuan District) to the northeast (Jinshui District, Zhongmou County District) and the south (Xinzheng City). Regarding ecological land, the forest initially increased prior to stabilising. Between 2005 and 2015, significant recovery and growth were observed, likely driven by ecological afforestation programs during this period. However, a modest decline occurred after 2015, and the forest area stabilised thereafter. By 2024, it reached 5581.51 km2, representing a 31.9% increase compared to 2005. Grasslands and water bodies constitute relatively small proportion of the total area. Grasslands are primarily located in the southwestern mountainous regions, while water bodies are mainly found along the northern banks of the Yellow River. The proportion of grassland area decreased by 24.6%, whereas the area of water bodies exhibited a general declining trend, with fluctuations, decreasing from 123.32 km2 to 110.07 km2. Although the absolute area of unused land is minimal, its fluctuations reflect development activities on marginal land and ecological management efforts.
Between 2005 and 2024, Zhengzhou experienced significant land-use transitions (Figure 7), primarily characterised by the rapid conversion of cropland to non-agricultural uses, alongside the continuous expansion of urban areas. The most pressing issue was the loss of cropland, which amounted to a total of 1092.96 km2. Notably, 80.8% was converted into construction land. Additionally, construction land became the primary category for new land development, with 86.6% of the newly developed land coming from cropland, while the remainder mainly resulted from the conversion of water. During the study period, signs of ecological restoration were also observed, as evidenced by the conversion of 131.69 km2 of cropland and 25.51 km2 of grassland into forest land. This shift reflects the partial success of ecological policies, such as the Grain-for-Green Programme.

3.1.2. Land-Use Demand Projections Under the SSP-RCP Scenario

By inputting future climate scenario parameters into the System Dynamics (SD) model, the land-use demand in Zhengzhou City from 2024 to 2040 was projected, as detailed in Table 8. The simulation results indicate a clear trend characterised by the rapid expansion of construction land and a notable reduction in cropland. Among all scenarios, construction land exhibited the most pronounced and sustained increase. By 2040, under the SSP126, SSP245, and SSP585 scenarios, construction land expansion by 17.13%, 23.25%, and 28.41%, respectively. In contrast, cropland, the primary source of land conversion, experienced a consistent decline, with reductions of 11.08%, 13.09%, and 15.36% under the respective scenarios. This pattern clearly reflects the constraining effect of economic development on cropland.
Changes in ecological land displayed distinct scenario dependencies. Under the SSP126 scenario, the forest area increased by 24.06 km2, and the grassland area by 56.64 km2 by 2040 compared to the 2024 baseline, more than doubling the latter. However, under the SSP585 scenario, the forest area decreased to 524.76 km2, and the increase in grassland was less pronounced than that under SSP126, suggesting that high-intensity development suppresses ecological space. The water area increased moderately under all scenarios, with the most significant expansion occurring under SSP126, likely due to ecological protection policies, such as the ecological red line, which limit the conversion of water bodies.

3.1.3. Spatial Distribution Simulation of Land Use Under the SSP-RCP Scenario

Simulation results from the PLUS model regarding the spatial distribution of land use in Zhengzhou (Figure 8) indicate that, under all three SSP-RCP scenarios, cropland remains the dominant land-use type, consistently accounting for over 50% of the total area. Development areas are primarily concentrated in the central urban zones, with expansion extending outward to the northeast and south, leading to the encroachment of significant portions of cropland. This trend is particularly evident in regions such as Yuxing Subdistrict, Liuji Town, and Nancao Township. Among these areas, the most significant expansion of development land occurs under the SSP585 scenario. By 2040, the area designated for development in the SSP585 scenario is projected to increase by approximately 1.3 times, followed by the SSP245 and SSP126 scenarios. The SSP126 scenario is associated with the most substantial increase in ecological land use, largely driven by the recovery of forest resources. This expansion primarily results from the conversion of grassland and cropland, particularly in the southwestern mountainous regions with strong ecological foundations, such as Gaoyang Sub-district and Shaolin Sub-district, both of which are located within natural landscape conservation zones. The increase in water bodies is mainly attributed to the conversion of certain areas of cropland, particularly along the Yellow River banks in Xincheng Sub-district and Yanminghu Town in northern Zhengzhou.

3.2. Characteristics of ESV Change

3.2.1. The Change in ESV from 2005 to 2024

The ESV of the study area was calculated based on the land-use classification data of Zhengzhou City. The results show a decrease in the total ESV from 783.41 × 10⁷ yuan in 2005 to 709.88 × 10⁷ yuan in 2024, representing a decline of 9.4% (Table 9). Cropland and water together accounted for more than 70% of the total ESV in Zhengzhou City, but experienced varying degrees of decreases during the study period. The largest contributor to this decrease was the reduction in the ESV of cropland, which dropped by 56.77 × 10⁷ yuan. Water experienced significant value fluctuations, initially increasing, then declining, before slightly recovering. A marked decrease of 65.42 × 10⁷ yuan occurred between 2010 and 2015. Although ecological restoration measures for water bodies led to a slight rebound by 2020, the values remained lower than initial levels. Forests were the only land type to exhibit a significant positive change, with a value increase of 38.99 × 10⁷ yuan. This growth was most pronounced between 2005 and 2010, reflecting the beneficial effects of ecological policies, such as the ‘Grain-for-Green’ program. Grasslands and wastelands showed smaller fluctuations in value and relatively low proportions, thereby limiting their impact on the overall ESV. In contrast, the expansion of construction land surfaces led to an absolute increase of 11.33 × 10⁷ yuan in negative ESV, indicating the persistent intensification of ecological pressures caused by urbanisation.
This study quantified and analysed the relative contributions of each ecosystem function to the overall ESV (Figure 9). Hydrological regulation services have consistently maintained a dominant position, with an annual average contribution rate of approximately 45%. However, their value has fluctuated significantly, peaking in 2010 before entering a declining trend. Regulation services remain the primary source of value, accounting for over 60%, which is substantially higher than provisioning, supporting, and cultural services. From an evolutionary perspective, the value of most service functions has exhibited a sustained decline. The value and proportion of key services, such as food production, gas regulation, and soil conservation, have declined in tandem, reflecting the overall degradation of regional ecosystem provisioning and regulatory functions. Among these, environmental purification services have experienced the most significant decline, decreasing by 64.8%, with their proportion dropping from 1.77% to 0.62%. The value of climate regulation and aesthetic landscape provision remained relatively stable or even occasionally increased.

3.2.2. Changes in the Value of ESV from 2005 to 2024

Taking the township as a unit, by utilising the natural breakpoint method, the ESV of Zhengzhou City was categorised into five distinct levels: low-value area (−1.00 × 10⁷ yuan < ESV ≤ 1.50 × 10⁷ yuan), lower-value area (1.50 × 10⁷ yuan < ESV ≤ 4.50 × 10⁷ yuan), medium value area (4.50 × 10⁷ yuan < ESV ≤ 9.00 × 10⁷ yuan), high-er-value area (9.00 × 10⁷ yuan < ESV ≤ 18.00 × 10⁷ yuan), and high-value area (18.00 × 10⁷ yuan < ESV ≤ 37.00 × 10⁷ yuan) (Figure 10). From 2005 to 2024, the spatial distribution of ESV showed significant differentiation. Specifically, regions with low and relatively low ESV values continued to expand and spatially concentrate, with their share of the total area increasing substantially from 33.73% in 2005 to 43.53% in 2024. Concurrently, the number of townships hosting these low ESV areas increased from 133 to 144. This expansion was primarily evident in fragmented plots that were widely distributed across Huiji District, Jinshui District, and the Hui ethnic area of Guancheng District. These regions are primarily characterised by construction land surfaces and cropland, alongside rapid urban development and population growth. The area with median ecological value has diminished, primarily shifting towards lower-value zones, making its distribution more isolated and fragmented. High-value areas, primarily located in regions with concentrated forested land and water bodies, showed significant contraction and decline. Notably, the total area of high ecological value zones decreased by 275.50 km2, with the number of townships containing such zones declining from 12 to 9.

3.2.3. Changes in the Value of Different SSP-RCP Scenarios

Simulation projections under SSP-RCP scenarios indicate significant path-dependent trends in the future evolution of ESV within the study region. The core pattern can be summarised as follows: SSP126 significantly supports ESV recovery, while SSP585 results in a continuing decline of ESV, with the gap between the two scenarios expanding substantially over time (Table 10). Specifically, under the SSP126 scenarios, the total ESV shows a steady increase, rising from 709.88 × 10⁷ yuan in 2024 to 724.39 × 10⁷ yuan, suggesting positive prospects for ecological recovery. This increase is primarily attributed to significant increases in forested land and water body areas. Under the SSP245 and SSP585 scenarios, total ESV experiences a consistent decline, reaching 688.47 × 10⁷ yuan and 636.70 × 10⁷ yuan, respectively, by 2040. Quantifying the contributions by land-use type reveals that water bodies, as core contributors to ESV, demonstrate a continuous increase in value, while the negative impact of construction land expansion on ESV becomes more pronounced. By 2040, the ESV of water bodies increases by 13.31% under the SSP126 scenario, highlighting their ecological centrality.
Conversely, under the SSP585 scenario, the value of construction land increases by 31.18%. Against this backdrop, the reduction in cropland further diminishes its contribution to ESV, with decreases of −11.07%, −13.08%, and −15.35% under the three scenarios, respectively. Changes in ESV across ecological land uses demonstrate differing impacts of development scenarios on ecosystem functions. Under the SSP126 scenario, forest, grassland, and aquatic ESV all show an increase by 2040, rising by 4.31%, 8.13%, and 13.31%, respectively, indicating an improvement in regulatory services. Conversely, under the SSP245 and SSP585 scenarios, the value of forest decreases by 3.81% and 6.04%, respectively, reflecting the detrimental effects of high-intensity development on ecological regulatory functions.
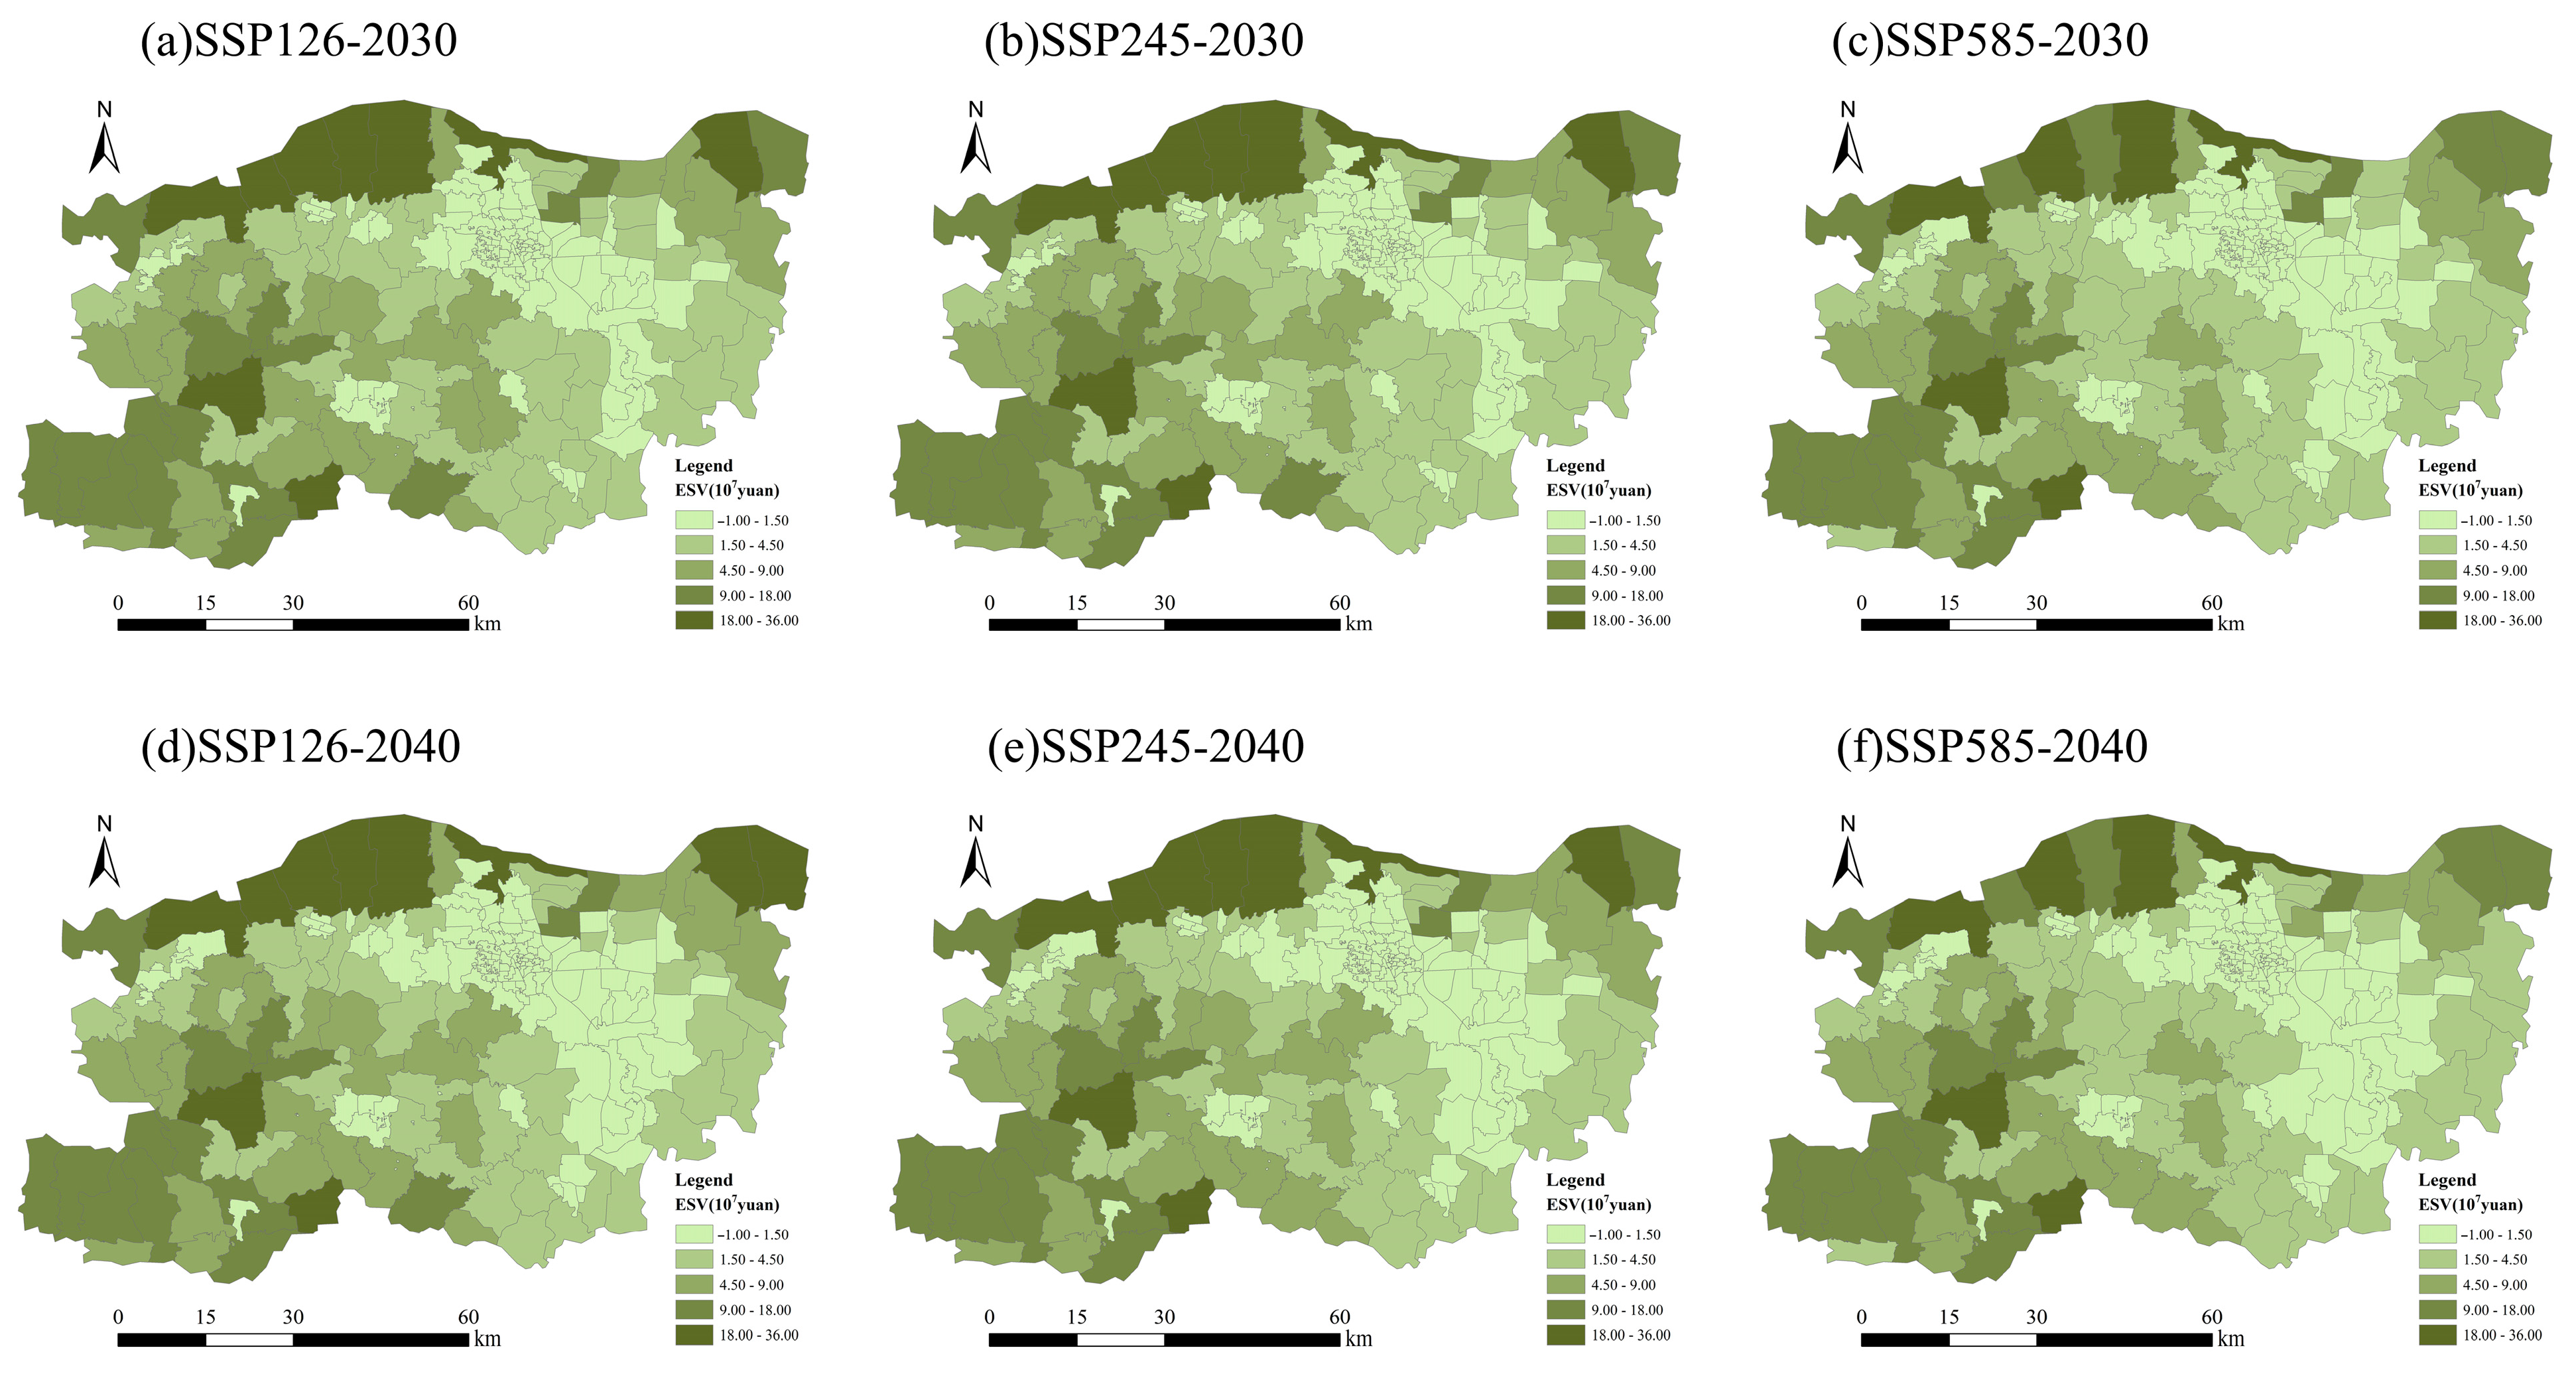
Spatial distribution patterns reveal notable spatial differentiation across various scenarios (Figure 11). By 2040, high-value ESV zones under SSP126 are primarily located in forested hilly areas such as Shecun Town, Tangzhuang Township, and Xuanhua Town in the southwest, as well as along the Yellow River coastal belt, including Heluo Town and Guangwu Town in the north. These zones display a more continuous and concentrated distribution pattern. In contrast, low-value zones under SSP585 show a marked expansion, sprawling outward from the central urban area toward surrounding plains regions such as Guodian Town and Quliang Town. The spatial pattern under the SSP126 scenario proved to be optimal, preserving the integrity of key ecological conservation areas in the west and north, while curbing the expansion of low-value zones, thereby reducing overall spatial heterogeneity. Conversely, spatial configurations under the SSP245 and SSP585 scenarios were less favourable, with persistent low-value zones suggesting that spatial equilibrium is disrupted under traditional development scenarios.

3.2.4. The Driving Mechanism of the ESV

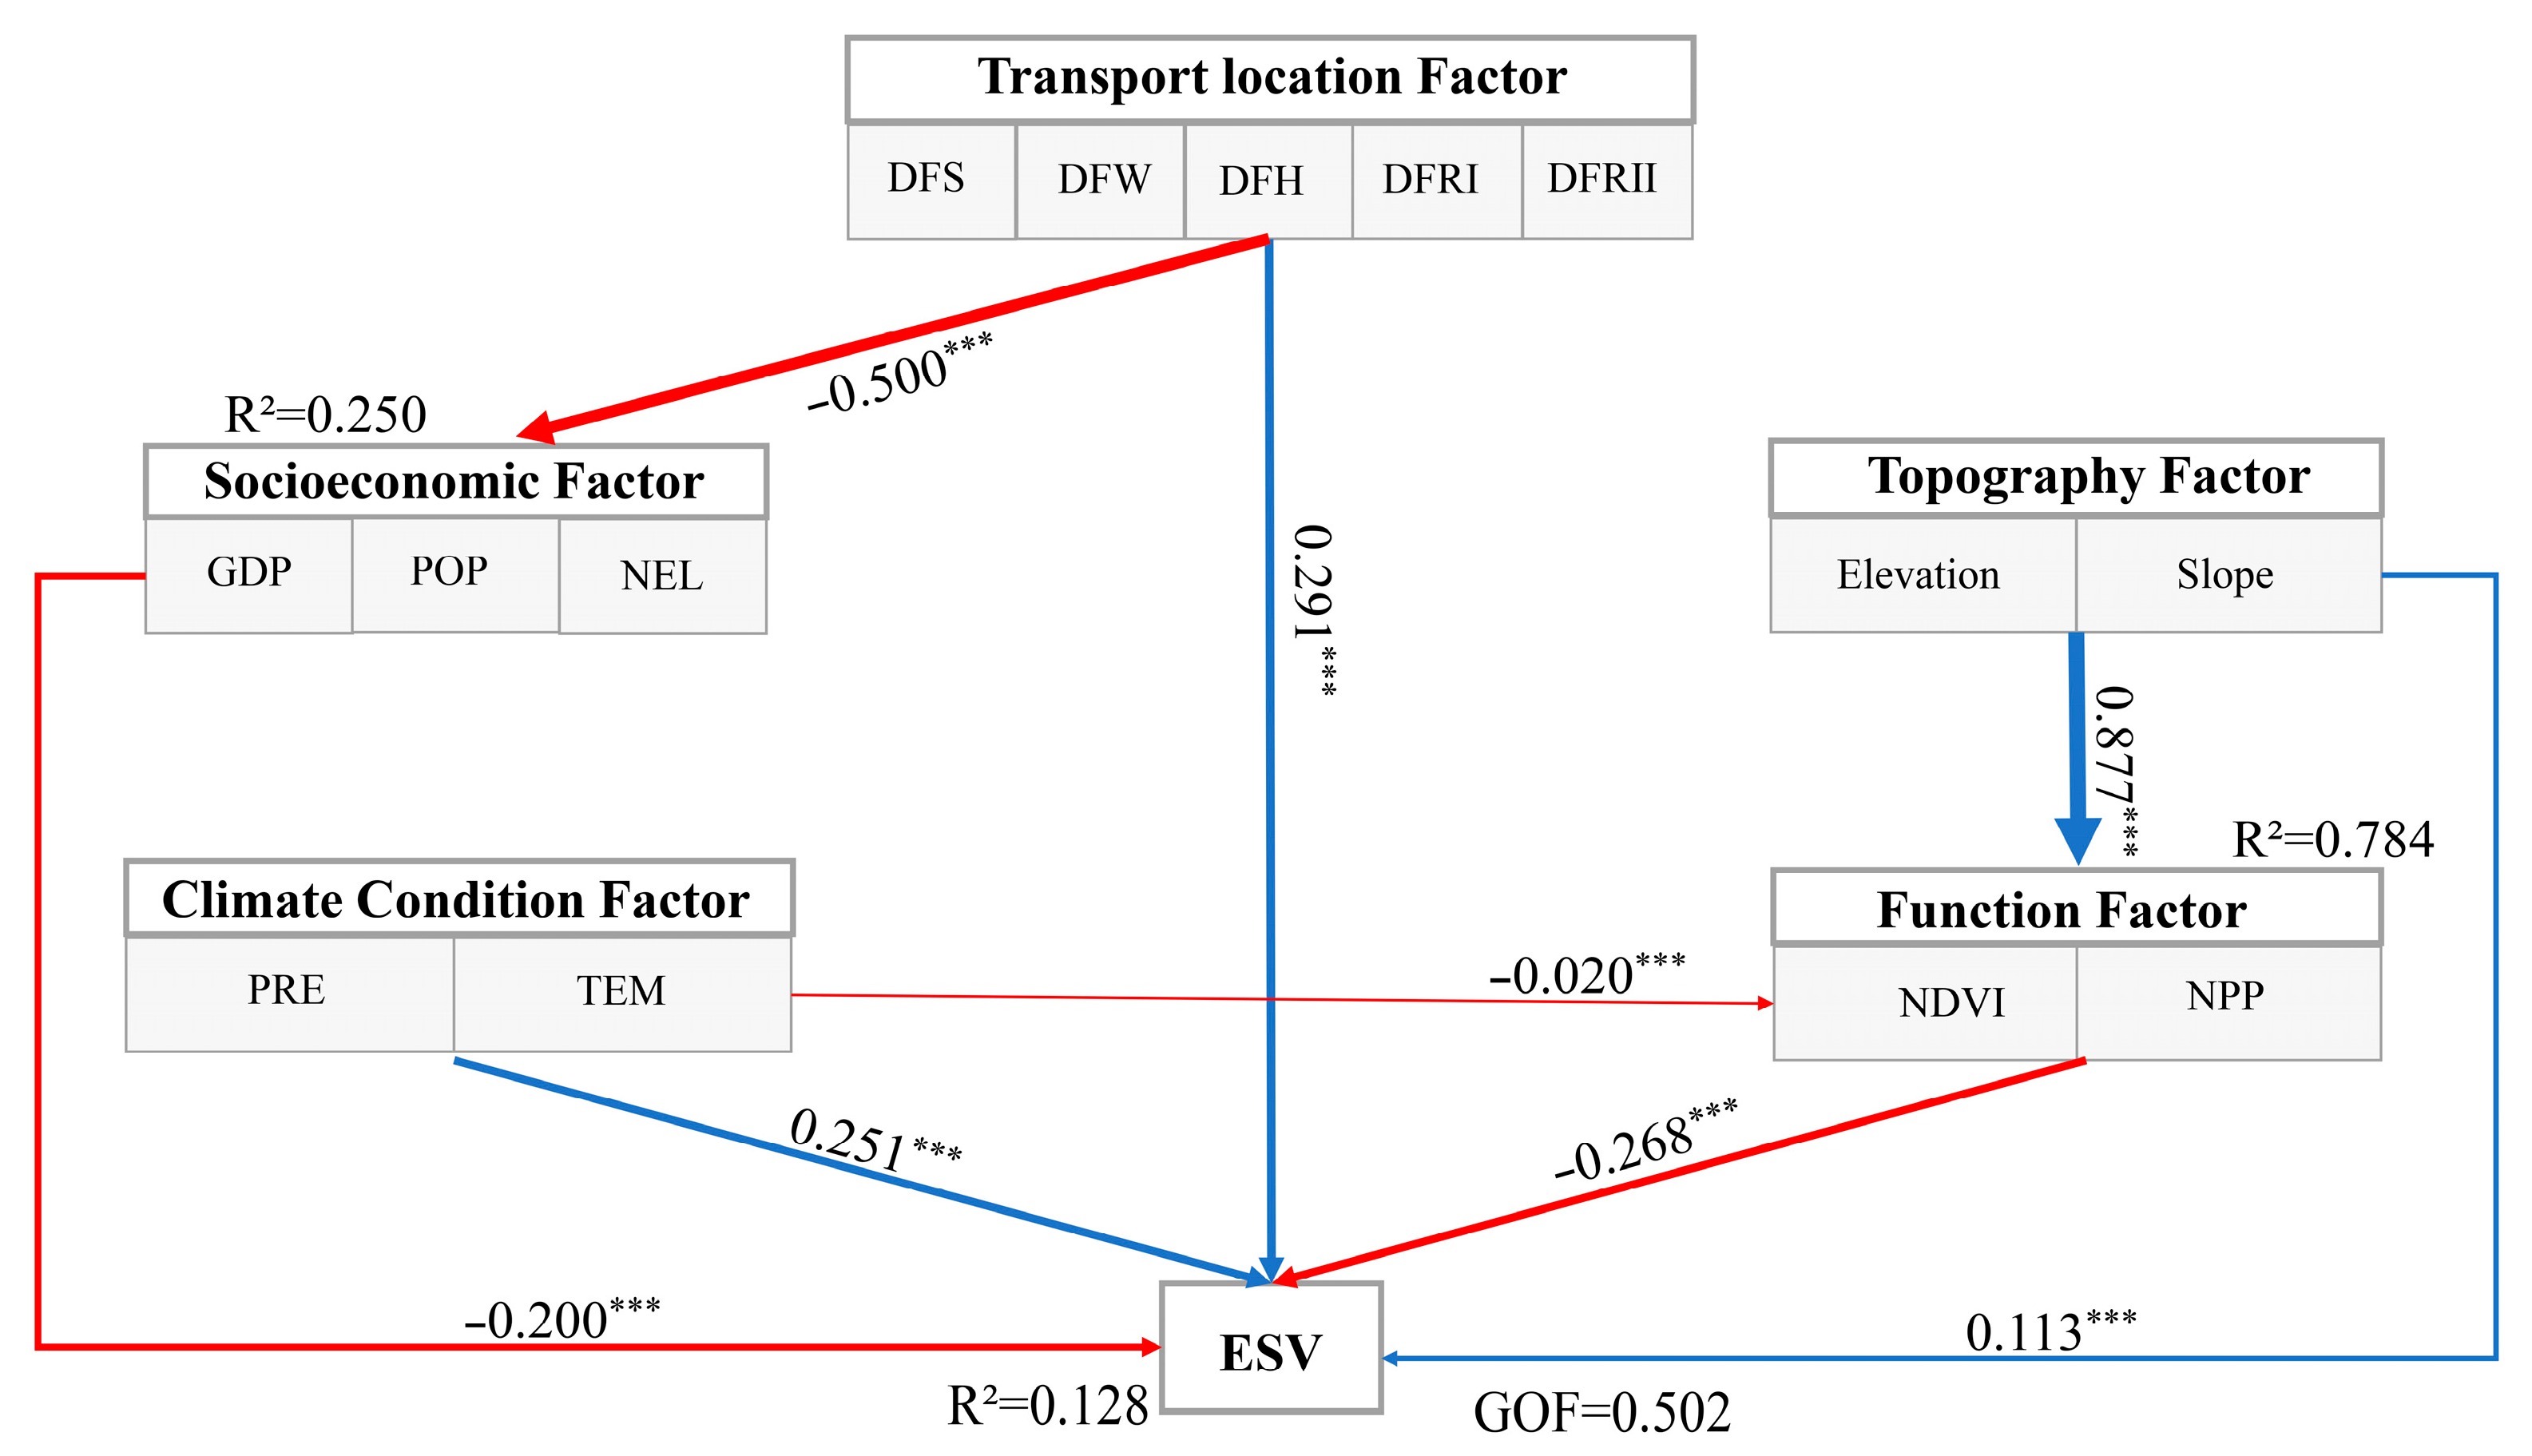
In this study, the model’s GoF was calculated at 0.502, which suggests a satisfactory fit of the model. The path coefficients and the results of the influence analysis are presented in Figure 12 and Table 11, respectively. The analysis reveals that TLF is the most pivotal driver of ESV growth, with a total effect of 0.391. This influence consists of a strong direct positive effect (0.291) and an indirect positive effect (0.100) mediated through SEF. Although TLF exhibits a direct negative effect on SEF (−0.500), this does not translate into a negative indirect impact on ESV, which highlights its dominant driving role. CCF, with a total effect of 0.256, is the second most influential positive driver of ESV. Its influence is derived almost entirely from a direct effect (0.251), with only a negligible indirect positive effect (0.005). Therefore, CCF’s promotion of ESV is stable and direct. Additionally, CCF exerts a weak direct negative effect (−0.020) on the FF factor. FF has a significant direct inhibitory effect on ESV (−0.268), meaning factors that enhance FF indirectly suppress ESV through this scenario. Consequently, FF acts as a key mediating variable influencing ESV.
In contrast, both SEF and TSF exhibit significant inhibitory effects. SEF has a direct effect on ESV of −0.200; as a mediating variable for TLF’s influence on ESV, it undergoes a strong negative effect from TLF. Notably, TSF, as a key indirect inhibitory factor, has a negative total effect on ESV (−0.122). This is primarily due to its strong negative indirect effect on FF (−0.235), which fully offsets its weak direct positive effect (0.113). TSF exerts an exceptionally strong direct positive effect on FF (0.877), representing the most potent single scenario relationship within the model.

3.2.5. Assessment of Interactions Between ESV

To investigate the trade-offs and complementarities of ecosystem services within Zhengzhou, a correlation analysis was conducted for the first-order service of ecosystem services in each township (Table 12). From 2005 to 2024, a notable positive spatial correlation was observed for each ecosystem service (p < 0.05), with correlation coefficients exceeding 0.6, highlighting the notable synergies among the four services. According to Pearson’s correlation coefficients, the influence degree was found to be in the following order: support-culture > supply-regulation > supply-support > regulation-culture > supply-culture > regulation-support.
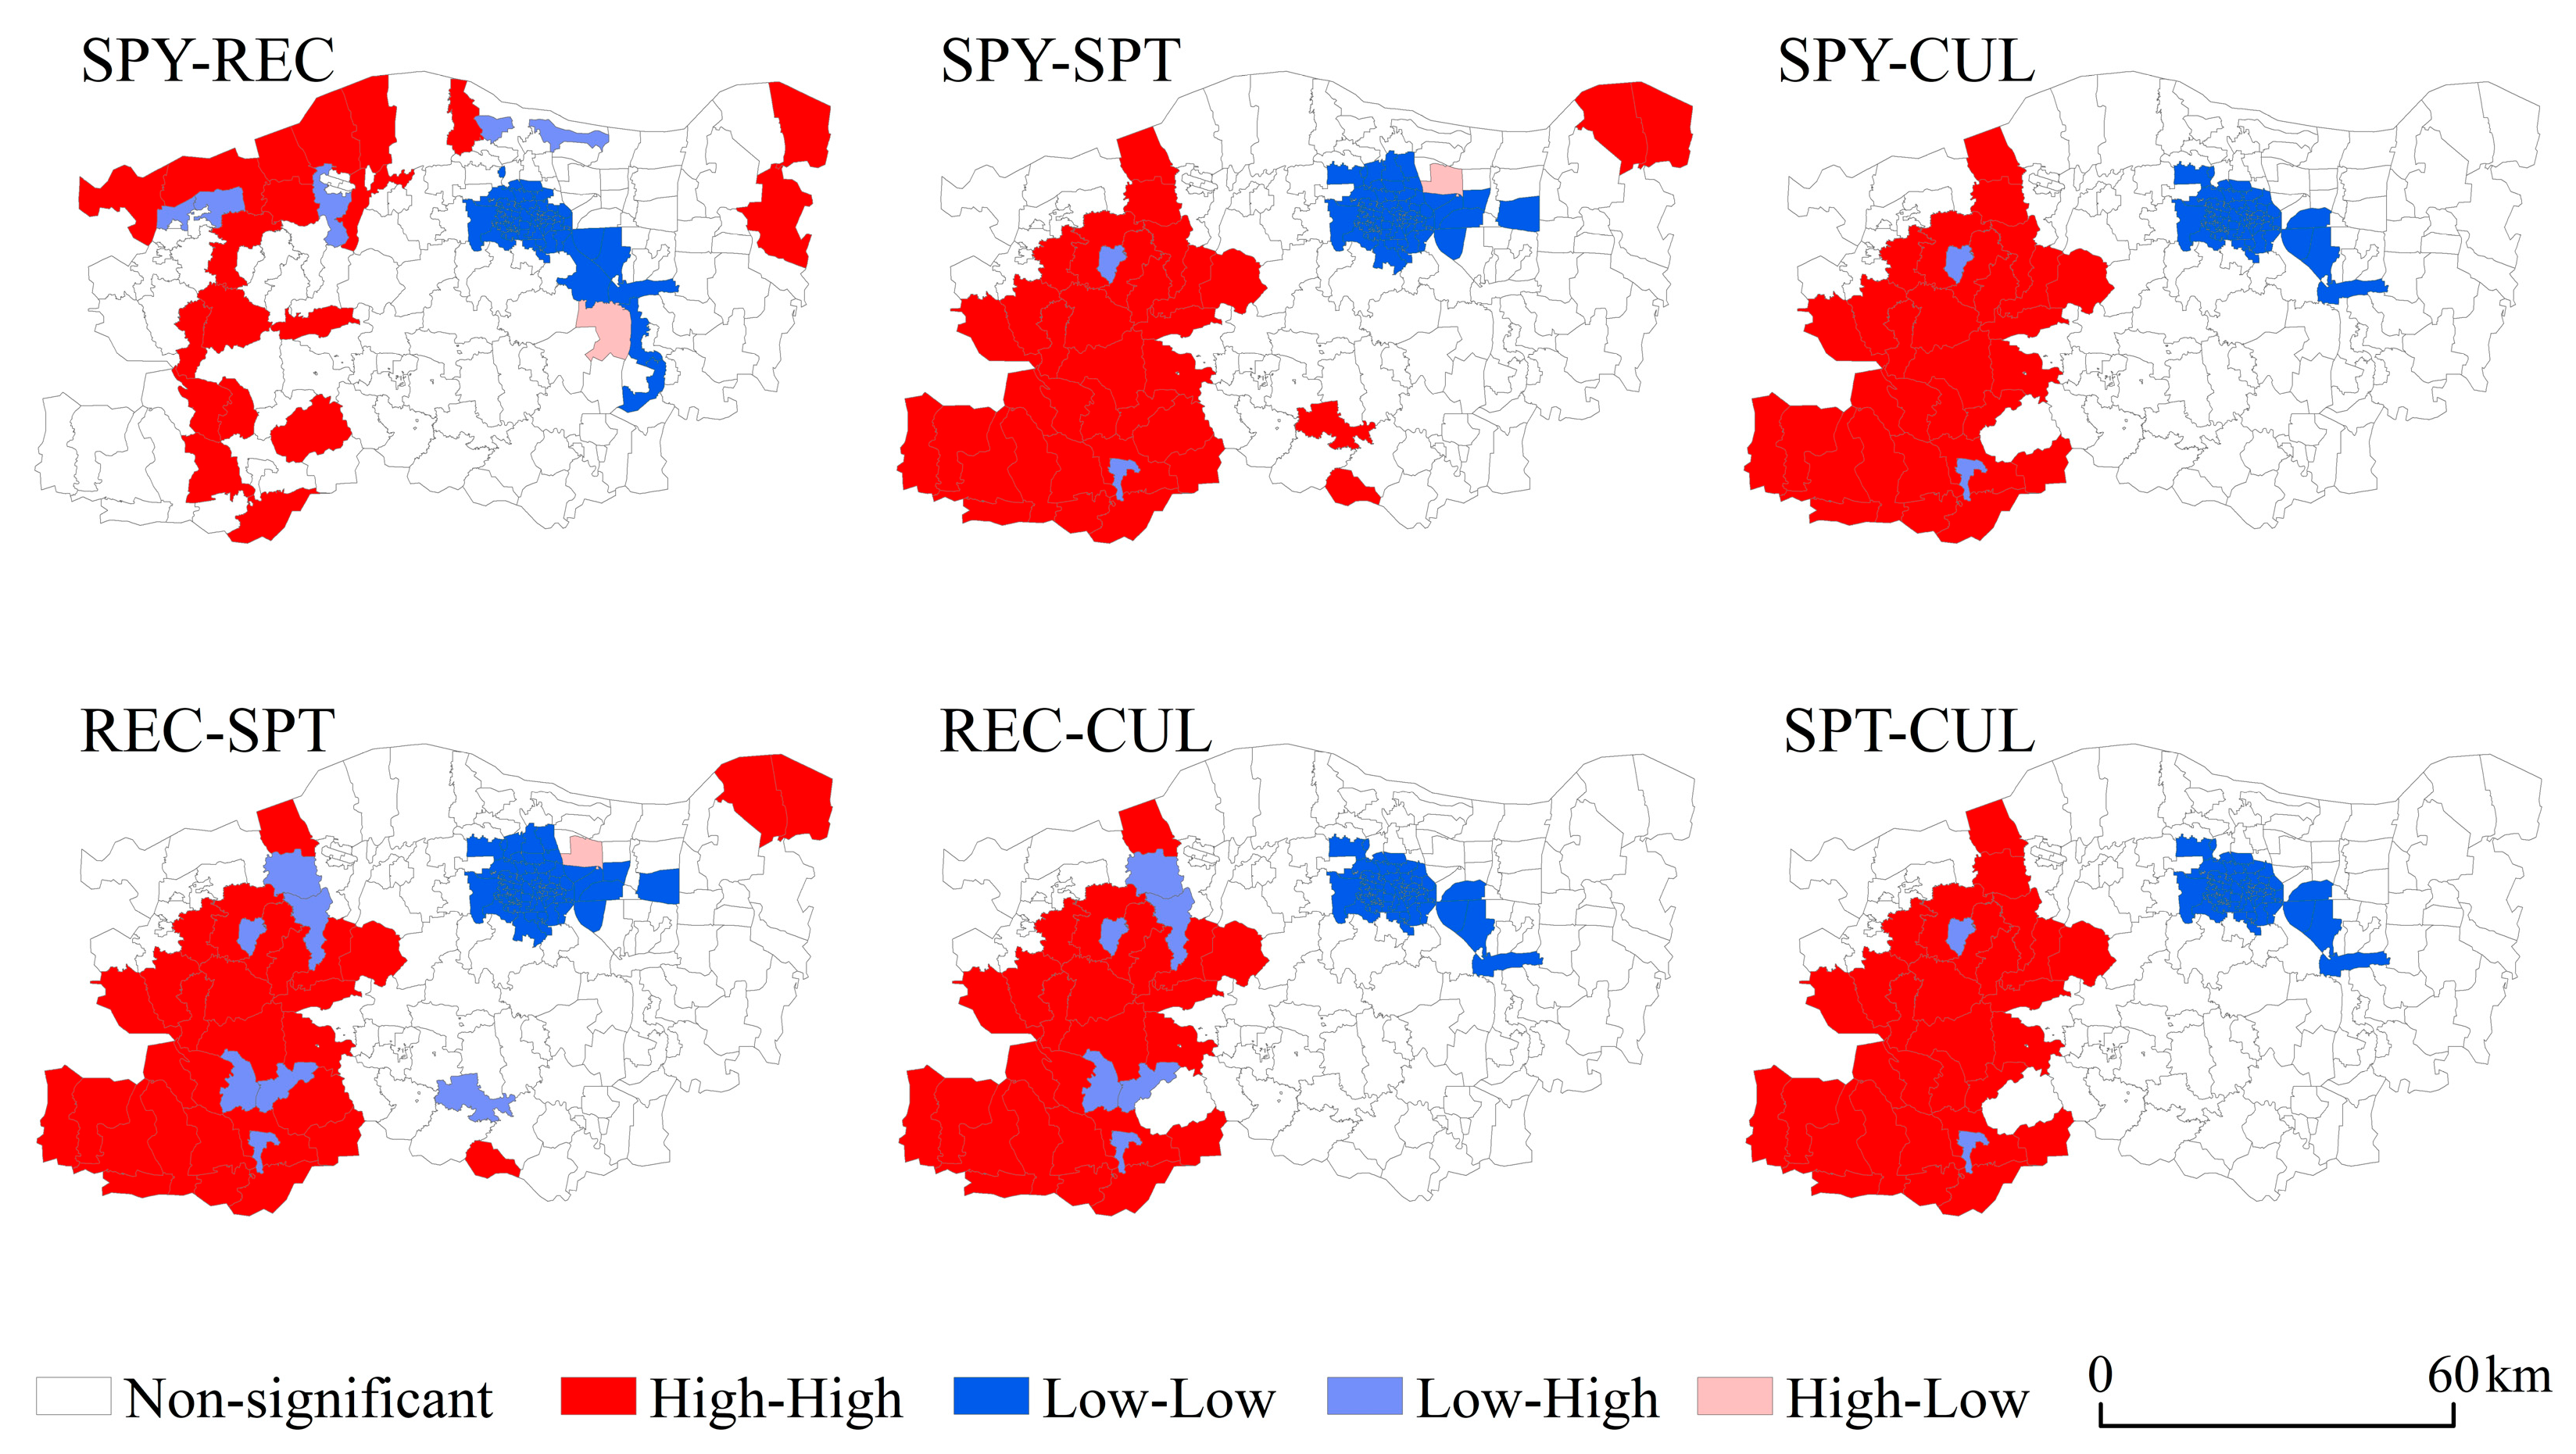
To further investigate the spatial clustering characteristics of ESV in Zhengzhou City, this study employs LISA clustering maps to illustrate the distribution of high and low-value zones in 2024 (Figure 13). The eastern part of Gongyi City, the northern part of Dengfeng City and the northern part of Zhongmou County, which are characterised by areas of forest, grassland, and water with high forest coverage and carbon sink capacity, contribute to the maintenance of ecosystem stability. These regions can provide higher values of regulating and cultural services, with a marked synergistic relationship is marked by high density and high aggregation (high-high). In contrast, the synergistic relationship in Zhongyuan District, Jinshui District, and parts of Guancheng Hui District is characterised by low density and low aggregation (low-low), reflecting ecological degradation primarily driven by extensive urban construction and rapid urbanisation. These areas exhibit weakened functions of supply, regulation and support services. Fewer areas exhibit trade-off relationships, such as Gaoshan Town, Zhongyue Street, and Yangcheng Town. These areas display low-density, high-aggregation (low-high) characteristics, being surrounded by low-value services but dominated by high-value services.

4. Discussion

4.1. The Impact of LUCC on ESV

Land-use change serves as the primary driver behind the spatiotemporal patterns of ESV within the study area. Between 2005 and 2020, the total ESV of Zhengzhou decreased by approximately 6.8%. Projections from most future development scenarios suggest that this downward trend will continue, signifying sustained long-term pressure on regional ecosystem service functions [62].
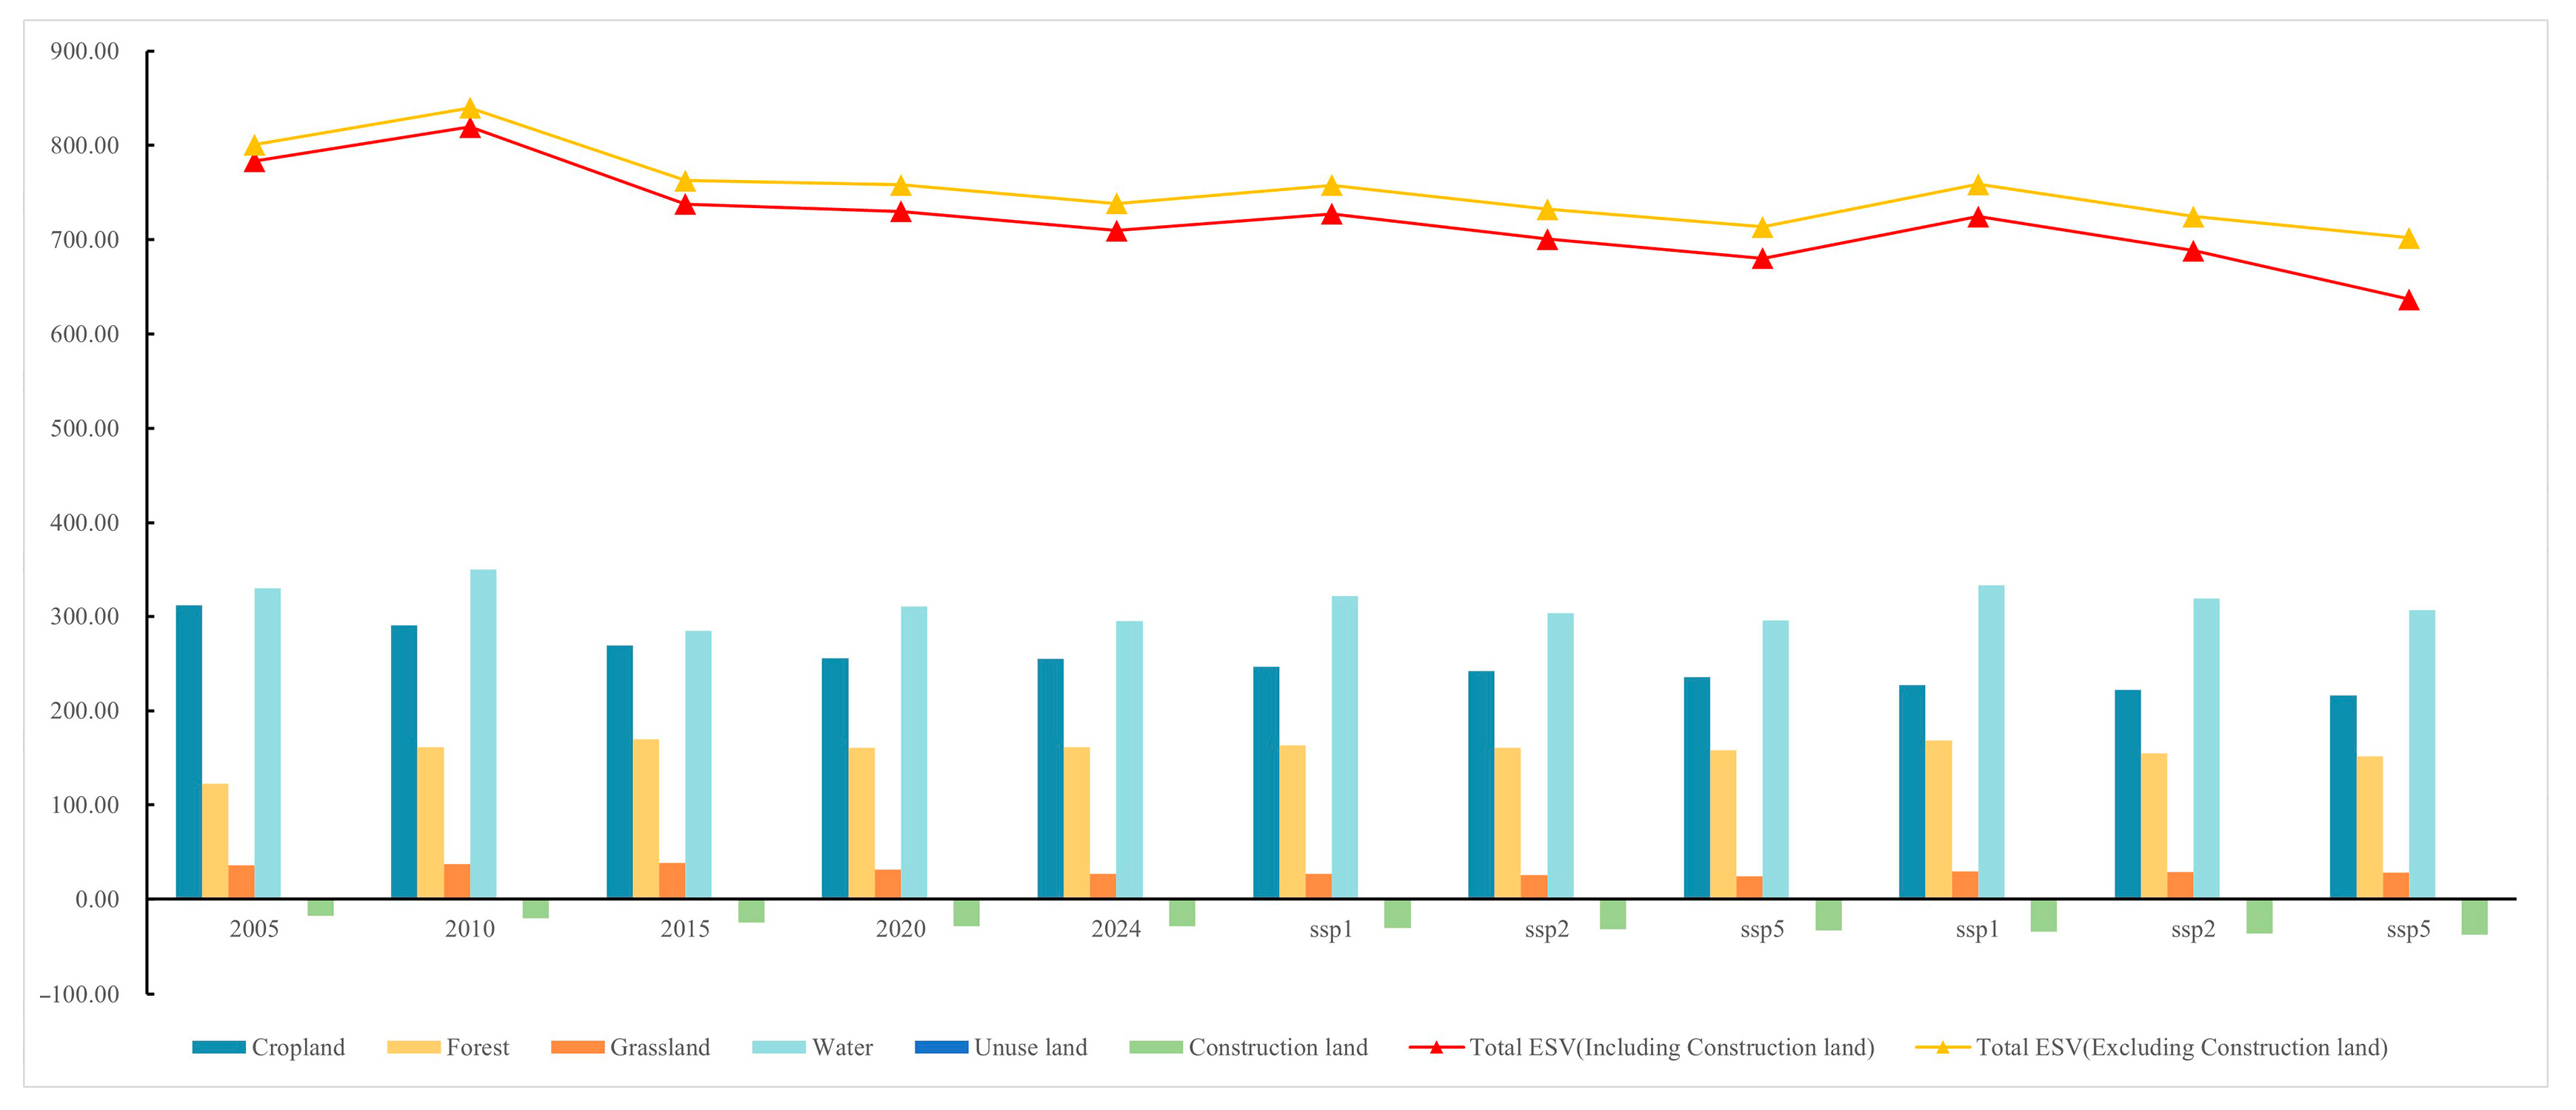
The expansion of construction land, categorised by negative ESV values, is the principal factor contributing to the net ESV loss. Specifically, the negative ESV associated with construction land increased from −17.29 × 10⁷ yuan in 2005 to −37.54 × 10⁷ yuan under the SSP585 scenario by 2040. This trend highlights the considerable disruption urban hard surfaces impose on natural ecological functions, including diminished soil and water conservation capacity, exacerbated heat island effects, and loss of biodiversity [6,63]. Even after excluding construction land from the analysis, the total ESV still decreased from 800.70 × 10⁷ yuan to 738.50 × 10⁷ yuan (Figure 14), indicating that the degradation of natural ecosystems remains the primary cause of ESV decline, with the expansion of construction land acting as an accelerant [64]. It is important to note that, as a catalyst for socioeconomic development, the negative impact of construction land on ESV can be regarded as an ecological cost rather than an absolute negative value. Through rational urban planning and the integration of green infrastructure, the ecological impact of construction land can be partially mitigated [65].
Declining trends in ESV are prevalent across economic hubs such as the Henan section of the Yellow River basin and the Shandong Peninsula, representing the ecological cost of rapid urbanisation [52,66]. Cities like Zhengzhou and Jinan display an ESV largely dependent on farmland and water bodies, both of which are land types most vulnerable to urban expansion. Despite ecological initiatives like the ‘Forest City’ programmes, their effectiveness is often undermined by the dominant momentum of urban expansion. In contrast, cities in the middle and upper reaches, such as Xi’an and Lanzhou, demonstrate an upward trend in ESV. This is attributed to intensive development models constrained by topography and the sustained benefits of major national ecological restoration projects [44,67]. Initiatives, including the Qinling Mountain ecological conservation, comprehensive Wei River management, and the greening of the Northern and Southern Mountains, serve as a continuous driver for positive contributions to their ESV. This contrast indicates that highly developed downstream urban agglomerations must move beyond the ‘incremental expansion’ model and shift towards an intensive development approach centred on urban renewal, ecological restoration, and spatial optimisation. Only through such a shift can they halt the loss of ESV and achieve the modernisation goal of harmonious co-existence between humanity and nature.

4.2. Patterns of Change and Political Implications

Simulation results based on the SSP-RCP scenarios reveal that varying socioeconomic development and climate response pathways will lead to significant divergence in the ESV of Zhengzhou, highlighting the high sensitivity of ESV to regional policies [68]. Under the sustainable development pathway SSP126, Zhengzhou’s ESV demonstrates a steady recovery by 2040, particularly in key ecological regions such as the southern mountainous areas and the Yellow River corridor. This reflects the positive outcomes of investments in green infrastructure and ecological restoration policies, which align with the implementation framework for the Sustainable Development Goal (SDG) on ‘Sustainable Cities and Communities’ [69].
The expansion of construction land, coupled with the reduction in farmland and forest land, represents the primary contradiction driving changes in ESV. Even under sustainable development pathways, construction land will increase by 17.13% by 2040, reaching 28.41% under SSP585. This expansion predominantly encroaches upon surrounding farmland, establishing a ‘zero-sum’ relationship consistent with findings from metropolitan studies such as Wuhan [70], which highlight the widespread encroachment on ecological land during urban agglomeration. Ecological land changes exhibit clear path dependency: under SSP126, forest and grassland areas expand, while under SSP585, they contract, underscoring the pivotal role of proactive ecological policies in mitigating the negative impacts of urbanisation. Furthermore, water bodies generally expanded across all three scenarios, in line with Lu et al.’s [25] observation of policy-driven water stability in urbanised regions of eastern China. The most pronounced increase occurred under SSP126, reflecting the crucial role of ecological conservation redlines and spatial controls on rivers and lakes in maintaining regional water ecosystem services [71].
Zhengzhou’s future development stands at a critical juncture, where the national strategy for ecological civilisation aligns with local urbanisation demands. The SSP126 pathway conceptually aligns with the national strategy of “ecological priority and green development” and should be prioritised as a key policy objective. In contrast, the SSP585 pathway serves as a high-risk warning scenario, highlighting the severe consequences of prioritising economic growth at the expense of ecological conservation. This approach risks a significant decline in ESV and undermines ecosystem resilience, particularly along the Yellow River and within the city centre. It is recommended that differentiated land governance strategies be applied across broader regions, with strict protection enforced in critical ecological functional zones. At the same time, optimising the national territorial spatial structure should promote concentrated urban development. This approach will facilitate the achievement of SDGs while supporting the construction of the national ecological security framework.

4.3. Multiple Factors Influencing ESV

This study applies Partial Least Squares Structural Equation Modelling (PLS-SEM) to elucidate the complex driving mechanisms behind changes in Zhengzhou’s ESV. The findings indicate that transport-location factors are the primary drivers of ESV growth, while environmental functional factors serve as key inhibitory mediators. These findings highlight the critical role of human activity-driven indirect scenarios in influencing ecosystem services in rapidly urbanising regions.
The primary driving role of TLF is closely associated with Zhengzhou’s implementation of ‘edge effects’ and ‘ecological construction’. Studies have shown that TLF has not only a direct positive impact on ESV, but also an indirect positive impact through SEF. The establishment of efficient transport networks, such as the Zhengzhou Airport Economic Zone and the ‘rice-grain’ pattern high-speed rail network, has fostered the concentration of population and economic activities in urbanised areas, thereby promoting socioeconomic development. Although transport accessibility is traditionally considered to be negatively correlated with ESV, Chen et al. [72] reported a positive correlation between transport accessibility and ESV in regions such as western Tianmen, Yueyang, and Jiujiang. This suggests that enhanced transportation infrastructure does not necessarily lead to a reduction in ESV. In Zhengzhou, the management of river systems and the development of ecological corridors near water bodies have led to improved ecological quality in areas adjacent to water. Human-driven ecological investments have substantially enhanced ecosystem services, resulting in a strong direct positive effect of TLF on ESV. This finding is further validated by the expressway along the Yellow River and the Yellow River Bridge in northern Zhengzhou [73].
Secondly, the study identified a pathway through which TSF indirectly suppresses ESV via FF. High elevations and steep slopes in the western and southern regions typically represent favourable ecological conditions, exerting a significant positive effect on FF. However, FF exhibits a direct negative effect on ESV, indicating that in Zhengzhou’s metropolitan area, the high vegetation productivity reflected by FF correlates more strongly with intensive agricultural activities than with natural forest or wetland ecosystems. Despite the high primary productivity of farmland, its per-unit-area service value is typically lower than that of forests or water bodies within the classical ESV equivalent factor accounting system. For example, the high vegetation cover in the central plains of Zhengzhou primarily stems from intensive agricultural activities [74]. When these farmland areas are incorporated into the ESV accounting model, their value per unit area may exceed that of natural woodlands. Li et al. [75] similarly observed a complementary or synergistic relationship between agricultural activities and NPP in the flat middle-to-lower reaches of Zhangye City. Areas with higher NDVI values typically exhibit greater biodiversity and resource provisioning [76]. However, NDVI values for construction land and water bodies are generally negative, ranging between −1 and 0. Given that water bodies contribute most significantly to provisioning and regulating services in ESV calculations, this may result in a negative correlation between water bodies and ESV.
Unlike the intricate scenarios influenced by human activities, CCF demonstrates a consistent and direct positive impact on ESV. Sufficient precipitation plays a vital role in vegetation, soil sequestration and erosion control, while offering essential ecosystem services such as carbon sequestration, oxygen production, and biodiversity conservation [77]. Increased temperatures can promote plant growth and nutrient cycling, potentially boosting productivity. These productivity increases can lead to greater food and ecosystem services to satisfy the needs of humans and other organisms [78]. However, climate change also poses challenges: studies suggest that excessive rainfall may exacerbate ecosystem instability, triggering natural disasters such as floods and landslides that degrade habitats, contaminate water sources, and destroy farmland [79].

4.4. Trade-Offs and Synergies Between Ecosystem Services

The correlation analysis identified significant synergistic interactions among ecosystem services in Zhengzhou, with the strongest synergy observed between support services and cultural services. This finding is consistent with the existing literature [61] and indicates a positive feedback loop between ecological conservation and human well-being amidst rapid urbanisation. Spatially, “high-high” synergy clusters—such as eastern Gongyi and northern Dengfeng—are correlated with high forest coverage, which enhances both regulatory services and cultural services through ecotourism, as exemplified by the Songshan Scenic Area. Conversely, “low-low” synergy areas in central urban districts are indicative of ecosystem degradation resulting from high-intensity urbanisation. Extensive construction land surfaces have disrupted ecological connectivity, leading to a reduction in both provisioning and regulatory services. Even in newly developed areas like the Zhengdong New Area, the conversion of wetlands into commercial land uses has weakened the functional link between water-related regulation and cultural services. Isolated “low-high” trade-off areas, such as Gaoshan and Yangcheng townships, are frequently located near ecological redline zones. In these regions, the expansion of croplands has degraded regulating services, while adjacent forests continue to provide high support services, highlighting the spatial conflicts between agricultural activities and ecological conservation.

4.5. Limitations

This study has several limitations. The accuracy of land-use simulation results directly affects the evaluation outcomes of ESV. In this research, the PLUS model was employed to predict future LULC patterns by integrating data on land use under projected climate scenarios, as well as various socioeconomic and environmental factors. Although this model is known for its high precision in simulation, its future projections rely on current land conversion trends, which might not fully reflect future dynamics. The optimal simulation results generated by the PLUS model were determined through iterative parameter adjustments, which can introduce a significant degree of subjectivity. To improve the reliability and validity of the findings, future studies should consider comparing the PLUS model with alternative models. Additionally, the inherent accuracy of various data products influences the simulation outcomes. Future work should explore higher-resolution data to address this issue [80]. The assessment in this study is based on typical climatic conditions and fails to account for the immediate impacts and lagged effects of extreme climate events, such as the Zhengzhou ‘7·20’ torrential rainfall, on ESV. Therefore, integrating urban flood resilience into the analytical framework and thoroughly investigating its feedback mechanisms with ESV across different spatiotemporal scales should be a key research focus in the future [81].

5. Conclusions

This research integrated the PLUS model with multiple climate and socioeconomic development scenarios (SSP-RCP) to examine changes in LULC in Zhengzhou City across both historical (2005–2024) and future (2030–2040) periods, as well as their influence on ESV. The key findings are summarised as follows:
Between 2005 and 2024, the predominant land-use categories in Zhengzhou City were cropland and construction land surfaces. Cropland experienced a significant reduction, while forested and unused land areas saw an increase. Furthermore, the construction land area expanded rapidly, particularly from the central urban region towards the northeast and south, with a growth rate of 65.5%. The widespread development and construction activities contributed to the gradual encroachment of construction land surfaces into other land-use categories.
The total amount of ESV in Zhengzhou City decreased by 73.53 × 10⁷ yuan from 2005 to 2024, representing a 9.4% reduction, which was primarily attributed to the rapid conversion of cropland to construction land, accounting for 77.21% of the ESV loss. The expansion of construction land area leads to serious degradation of key ecological service functions such as food production and soil conservation.
Future multi-scenario simulations demonstrate distinct patterns, with SSP126 exhibiting the most favourable outcomes. This scenario forecasts an ESV increase of 14.51 × 10⁷ yuan by 2040, primarily resulting from forest and water resource conservation within sustainable development trajectories. The SSP585 scenario predicts a significant ESV reduction of 73.18 × 10⁷ yuan by 2040, highlighting negative environmental consequences associated with high energy consumption. The ESV reduction under SSP245 is relatively more moderate.
TLF is the principal contributor to ESV growth, with CCF functioning as a secondary positive factor. FF acts as a crucial inhibitory mediator, whereas TSF induces a strong indirect inhibitory effect via FF, culminating in an overall negative impact. SEF also imposes a direct negative influence on ESV.
There is generally a clear synergistic interaction among supply, regulation, support, and cultural services, with the most pronounced synergy found between support services and cultural services. The trade-off relationship is primarily evident in the transition zones between forested and cropland, highlighting the spatial competition between ecological protection and agricultural production.

Author Contributions

L.Y. and J.S. supervised the work and contributed to data interpretation and the writing of the manuscript. G.T. guided the overall structure and framework of the manuscript. Y.L., Q.L. and L.Z. designed and performed the investigation, contributed to data interpretation and drafted the manuscript. T.W., H.Z. and D.W. performed the experiments and contributed to the modification of the manuscript. All authors have read and agreed to the published version of the manuscript.

Funding

This work was supported by the Innovation Fund of Henan Agricultural University (KJCX2020A06, KJCX2020A05), the Postdoctoral Fund Project in Henan Province (202003062), the Major Science and Technology Projects in Henan Province (201300111400), the Henan Academy of Agricultural Sciences Independent Innovation Project (2024ZC104), the Henan Provincial Natural Science Foundation Project (242300420478), and the Henan Youth Natural Science Foundation Project (252300423598).

Data Availability Statement

The original contributions presented in this study are included in the article. Further inquiries can be directed to the corresponding authors.

Conflicts of Interest

The authors declare that they have no known competing financial interests or personal relationships that could have appeared to influence the work reported in this paper.

References

  1. Daily, G.C. Nature’s services: Societal dependence on natural ecosystems (1997). In The Future of Nature; Libby, R., Sverker, S., Paul, W., Eds.; Yale University Press: New Haven, CT, USA, 2013; pp. 454–464. [Google Scholar]
  2. Bongaarts, J. IPBES, 2019. Summary for policymakers of the global assessment report on biodiversity and ecosystem services of the Intergovernmental Science-Policy Platform on Biodiversity and Ecosystem Services. Popul. Dev. Rev. 2019, 45, 680–681. [Google Scholar] [CrossRef]
  3. Xia, H.; Yuan, S.; Prishchepov, A.V. Spatial-temporal heterogeneity of ecosystem service interactions and their social-ecological drivers: Implications for spatial planning and management. Resour. Conserv. Recycl. 2023, 189, 106767. [Google Scholar] [CrossRef]
  4. Reid, W.V.; Mooney, H.A.; Cropper, A.; Capistrano, D.; Carpenter, S.R.; Chopra, K. Millennium Ecosystem Assessment. Ecosystems and Human Well-Being: Synthesis; Island Press: Washington, DC, USA, 2005. [Google Scholar]
  5. Costanza, R.; de Groot, R.; Sutton, P.; van der Ploeg, S.; Anderson, S.J.; Kubiszewski, I.; Farber, S.; Turner, R.K. Changes in the global value of ecosystem services. Glob. Environ. Chang. 2014, 26, 152–158. [Google Scholar] [CrossRef]
  6. Costanza, R.; d’Arge, R.; de Groot, R.; Farber, S.; Grasso, M.; Hannon, B.; Limburg, K.; Naeem, S.; O’Neill, R.V.; Paruelo, J.; et al. The value of the world’s ecosystem services and natural capital. Nature 1997, 387, 253–260. [Google Scholar] [CrossRef]
  7. Xie, G.; Zhang, C.; Zhang, L.; Chen, W.; Li, S. Improvement of the evaluation method for ecosystem service value based on per unit area. J. Nat. Resour. 2015, 30, 1243–1254. [Google Scholar] [CrossRef]
  8. Vatitsi, K.; Ioannidou, N.; Mirli, A.; Siachalou, S.; Kagalou, I.; Latinopoulos, D.; Mallinis, G. Lulc change effects on environmental quality and ecosystem services using eo data in two rural river basins in Thrace, Greece. Land 2023, 12, 1140. [Google Scholar] [CrossRef]
  9. Nazombe, K.S.; Nambazo, O.; Mdolo, P.; Bakolo, C.; Mlewa, R. Assessing changes in the ecosystem service value in response to land use and land cover dynamics in Malawi. Environ. Monit. Assess. 2024, 196, 741. [Google Scholar] [CrossRef]
  10. Zhao, F.; Liu, X.; Zhao, X.; Wang, H. Effects of production–living–ecological space changes on the ecosystem service value of the Yangtze River Delta urban agglomeration in China. Environ. Monit. Assess. 2023, 195, 1133. [Google Scholar] [CrossRef]
  11. Birhane, E.; Negash, E.; Getachew, T.; Gebrewahed, H.; Gidey, E.; Gebremedhin, M.A.; Mhangara, P. Changes in total and per-capital ecosystem service value in response to land-use land-cover dynamics in north-central Ethiopia. Sci. Rep. 2024, 14, 6540. [Google Scholar] [CrossRef]
  12. Chen, J.; Dong, Z.; Shi, R.; Sun, G.; Guo, Y.; Peng, Z.; Deng, M.; Chen, K. Urban multi-scenario land use optimization simulation considering local climate zones. Remote Sens. 2024, 16, 4342. [Google Scholar] [CrossRef]
  13. Dammag, A.Q.; Dai, J.; Cong, G.; Derhem, B.Q.; Latif, H.Z. Assessing and predicting changes of ecosystem service values in response to land use/land cover dynamics in Ibb City, Yemen: A three-decade analysis and future outlook. Int. J. Digit. Earth 2024, 17, 2323174. [Google Scholar] [CrossRef]
  14. Lin, Y.; Xu, X.; Tan, Y.; Chen, M. Identifying ecosystem supply–demand response thresholds for land use optimization: A case study of the Taihu Lake Basin, China. Ecol. Indic. 2025, 175, 113569. [Google Scholar] [CrossRef]
  15. Li, C.; Wu, Y.; Gao, B.; Zheng, K.; Wu, Y.; Li, C. Multi-scenario simulation of ecosystem service value for optimization of land use in the Sichuan-Yunnan ecological barrier, China. Ecol. Indic. 2021, 132, 108328. [Google Scholar] [CrossRef]
  16. Tan, J.; Li, A.; Lei, G.; Xie, X. A SD-MaxEnt-CA model for simulating the landscape dynamic of natural ecosystem by considering socio-economic and natural impacts. Ecol. Model. 2019, 410, 108783. [Google Scholar] [CrossRef]
  17. Feng, H.; Lei, X.; Yu, G.; Changchun, Z. Spatio-temporal evolution and trend prediction of urban ecosystem service value based on CLUE-S and GM (1,1) compound model. Environ. Monit. Assess. 2023, 195, 1282. [Google Scholar] [CrossRef]
  18. Wang, A.; Zhang, M.; Kafy, A.; Tong, B.; Hao, D.; Feng, Y. Predicting the impacts of urban land change on LST and carbon storage using InVEST, CA-ANN and WOA-LSTM models in Guangzhou, China. Earth Sci. Inform. 2023, 16, 437–454. [Google Scholar] [CrossRef]
  19. Zhang, P.; Liu, L.; Yang, L.; Zhao, J.; Li, Y.; Qi, Y.; Ma, X.; Cao, L. Exploring the response of ecosystem service value to land use changes under multiple scenarios coupling a mixed-cell cellular automata model and system dynamics model in Xi’an, China. Ecol. Indic. 2023, 147, 110009. [Google Scholar] [CrossRef]
  20. Li, X.; Wu, C. Sensitivity assessment and simulation of ecosystem services in response to land use change in arid regions: Empirical evidence from Xinjiang, China. Ecol. Indic. 2025, 171, 113150. [Google Scholar] [CrossRef]
  21. Liang, X.; Guan, Q.; Clarke, K.C.; Liu, S.; Wang, B.; Yao, Y. Understanding the drivers of sustainable land expansion using a patch-generating land use simulation (PLUS) model: A case study in Wuhan, China. Comput. Environ. Urban Syst. 2021, 85, 101569. [Google Scholar] [CrossRef]
  22. Luan, C.; Liu, R.; Zhang, Q.; Sun, J.; Liu, J. Multi-objective land use optimization based on integrated NSGA–II–PLUS model: Comprehensive consideration of economic development and ecosystem services value enhancement. J. Clean. Prod. 2024, 434, 140306. [Google Scholar] [CrossRef]
  23. Zhou, M.; Ma, Y.; Tu, J.; Wang, M. SDG-oriented multi-scenario sustainable land-use simulation under the background of urban expansion. Environ. Sci. Pollut. Res. 2022, 29, 72797–72818. [Google Scholar] [CrossRef]
  24. Cook, B.I.; Mankin, J.S.; Marvel, K.; Williams, A.P.; Smerdon, J.E.; Anchukaitis, K.J. Twenty-first century drought projections in the cmip6 forcing scenarios. Earth’s Future 2020, 8, e2019EF001461. [Google Scholar] [CrossRef]
  25. Lu, Z.; Li, W.; Yue, R. Investigation of the long-term supply–demand relationships of ecosystem services at multiple scales under SSP–RCP scenarios to promote ecological sustainability in China’s largest city cluster. Sustain. Cities Soc. 2024, 104, 105295. [Google Scholar] [CrossRef]
  26. Chen, Q.; Ning, Y. Projecting LUCC dynamics and ecosystem services in an emerging urban agglomeration under SSP-RCP scenarios and their management implications. Sci. Total Environ. 2024, 949, 175100. [Google Scholar] [CrossRef]
  27. Feng, Y.; Zhai, S.; Song, G.; Song, H.; Dong, G.; Jiang, X.; Dong, C.; Jayathilaka, H.B.T.P. Spatio-temporal variations of habitat quality under 8 ssp-rcp scenarios in China. J. Geophys. Res. Biogeo. 2024, 129, e2024JG008030. [Google Scholar] [CrossRef]
  28. Cai, G.; Xiong, J.; Wen, L.; Weng, A.; Lin, Y.; Li, B. Predicting the ecosystem service values and constructing ecological security patterns in future changing land use patterns. Ecol. Indic. 2023, 154, 110787. [Google Scholar] [CrossRef]
  29. Quan, L.; Jin, S.; Chen, J.; Li, T. Evolution and Driving Forces of Ecological Service Value in Anhui Based on Landsat Land Use and Land Cover Change. Remote Sens. 2024, 16, 269. [Google Scholar] [CrossRef]
  30. Wang, W.; Xu, J.; Luan, X.; Zhang, Z. Wetland ecosystem service values in beijing significantly increased from 1984 to 2020: Trend changes, type evolution, and driving factor. Ecol. Indic. 2024, 166, 112235. [Google Scholar] [CrossRef]
  31. Liu, J.; Pei, X.; Liao, B.; Zhang, H.; Liu, W.; Jiao, J. Scale effects and spatial heterogeneity of driving factors in ecosystem services value interactions within the Tibet autonomous region. J. Environ. Manag. 2024, 351, 119871. [Google Scholar] [CrossRef]
  32. Chen, S.; Wu, J. The Driving Factors of the Tradeoff-Synergistic Relationship Among Forest Ecosystem Service Values in the Yangtze River Delta, China. Forests 2024, 15, 2031. [Google Scholar] [CrossRef]
  33. Xie, L.; Wang, H.; Liu, S. The ecosystem service values simulation and driving force analysis based on land use/land cover: A case study in inland rivers in arid areas of the Aksu River Basin, China. Ecol. Indic. 2022, 138, 108828. [Google Scholar] [CrossRef]
  34. Jiang, W.; Guo, P.; Lin, Z.; Fu, Y.; Li, Y.; Kasperkiewicz, K.; Gaafar, A.-R.Z. Factors influencing the spatiotemporal variation in the value of ecosystem services in Anxi county. Heliyon 2023, 9, e19182. [Google Scholar] [CrossRef]
  35. Liu, X.; Chen, X.; Hua, K.; Wang, Y.; Wang, P.; Han, X.; Ye, J.; Wen, S. Effects of land use change on ecosystem services in arid area ecological migration. Chin. Geogr. Sci. 2018, 28, 894–906. [Google Scholar] [CrossRef]
  36. Ren, L.; Li, J.; Li, C.; Dang, P. Can ecotourism contribute to ecosystem? Evidence from local residents’ ecological behaviors. Sci. Total Environ. 2021, 757, 143814. [Google Scholar] [CrossRef]
  37. Yang, Y.; Huang, L.; Deng, S.; Zhang, X.; Hou, W.; Xiao, S.; Shen, R.; You, X.; Yang, Y.; Pan, H. Tradeoffs among ecosystem services under ecological engineering construction: Donor and receiver evaluation of 25 soil and water conservation projects in China. Ecol. Eng. 2025, 219, 107685. [Google Scholar] [CrossRef]
  38. Xiao, J.; Song, F.; Su, F.; Song, S.; Wei, C. Exploring the interaction mechanism of natural conditions and human activities on wetland ecosystem services value. J. Clean. Prod. 2023, 426, 139161. [Google Scholar] [CrossRef]
  39. Li, Y.; Liu, W.; Zhu, M.; Feng, Q.; Yang, L.; Zhang, J.; Yin, Z.; Yin, X. Influencing factors and paths of the coupling relationship between ecosystem services supply–demand and human well-being in the hexi regions, northwest China. Remote Sens. 2025, 17, 1787. [Google Scholar] [CrossRef]
  40. Yang, J.; Huang, X. The 30 m annual land cover dataset and its dynamics in China from 1990 to 2019. Earth Syst. Sci. Data 2021, 13, 3907–3925. [Google Scholar] [CrossRef]
  41. Murakami, D.; Yoshida, T.; Yamagata, Y. Gridded GDP Projections Compatible With the Five SSPs (Shared Socioeconomic Pathways). Front. Built Environ. 2021, 7, 2021. [Google Scholar] [CrossRef]
  42. Wang, X.; Meng, X.; Long, Y. Projecting 1 km-grid population distributions from 2020 to 2100 globally under shared socioeconomic pathways. Sci. Data 2022, 9, 563. [Google Scholar] [CrossRef]
  43. Chen, Y.; Guo, F.; Wang, J.; Cai, W.; Wang, C.; Wang, K. Provincial and gridded population projection for China under shared socioeconomic pathways from 2010 to 2100. Sci. Data 2020, 7, 83. [Google Scholar] [CrossRef]
  44. Han, L.; Li, Y.; Ge, Z.; Fang, F.; Gao, L.; Zhang, J.; Du, Z.; Cui, L. Study on the spatial and temporal evolution of ecosystem service value based on land use change in Xi’an City. Sci. Rep. 2025, 15, 66. [Google Scholar] [CrossRef]
  45. Li, J.; Chen, X.; Kurban, A.; Van de Voorde, T.; De Maeyer, P.; Zhang, C. Coupled SSPs-RCPs scenarios to project the future dynamic variations of water-soil-carbon-biodiversity services in Central Asia. Ecol. Indic. 2021, 129, 107936. [Google Scholar] [CrossRef]
  46. Ren, Y.; Zhang, L.; Li, X.; Zhang, G.; Li, Y.; Lian, Z. Spatiotemporal variations and driving mechanisms of carbon storage in Central Asia: Insights from the PLUS-InVEST models and machine learning. J. Environ. Manag. 2025, 389, 126123. [Google Scholar] [CrossRef]
  47. Yun, X.; Tang, Q.; Li, J.; Lu, H.; Zhang, L.; Chen, D. Can reservoir regulation mitigate future climate change induced hydrological extremes in the Lancang-Mekong River Basin? Sci. Total Environ. 2021, 785, 147322. [Google Scholar] [CrossRef]
  48. Wang, Z.; Li, X.; Mao, Y.; Li, L.; Wang, X.; Lin, Q. Dynamic simulation of land use change and assessment of carbon storage based on climate change scenarios at the city level: A case study of Bortala, China. Ecol. Indic. 2022, 134, 108499. [Google Scholar] [CrossRef]
  49. Liang, G.-M.; Xiao, Y.; Liu, M.-M.; Lin, S.; Wu, Z.-L.; Hu, X.-S. Simulation and elicitation of land use and carbon storage changes in Fuzhou under the background of traffic planning. J. Nat. Resour. 2023, 38, 3074–3092. [Google Scholar] [CrossRef]
  50. Usman, M.; Liedl, R.; Shahid, M.A.; Abbas, A. Land use/land cover classification and its change detection using multi-temporal MODIS NDVI data. J. Geogr. Sci. 2015, 25, 1479–1506. [Google Scholar] [CrossRef]
  51. Fetene, D.T.; Lohani, T.K.; Mohammed, A.K. LULC change detection using support vector machines and cellular automata-based ANN models in Guna Tana watershed of Abay basin, Ethiopia. Environ. Monit. Assess. 2023, 195, 1329. [Google Scholar] [CrossRef]
  52. Zhao, Y.; Zhang, X.; Wu, Q.; Huang, J.; Ling, F.; Wang, L. Characteristics of spatial and temporal changes in ecosystem service value and threshold effect in Henan along the Yellow River, China. Ecol. Indic. 2024, 166, 112531. [Google Scholar] [CrossRef]
  53. Xie, G.; Zhang, C.; Zhen, L.; Zhang, L. Dynamic changes in the value of China’s ecosystem services. Ecosyst. Serv. 2017, 26, 146–154. [Google Scholar] [CrossRef]
  54. Hu, S. Research on Ecosystem Service Value and Ecological Compensation Standard Based on Land Use Change. Ph.D. Thesis, China University of Mining and Technology, Beijing, China, 2020. (In Chinese). [Google Scholar]
  55. Ye, Y.; Bryan, B.A.; Zhang, J.; Connor, J.D.; Chen, L.; Qin, Z.; He, M. Changes in land-use and ecosystem services in the Guangzhou-Foshan Metropolitan Area, China from 1990 to 2010: Implications for sustainability under rapid urbanization. Ecol. Indic. 2018, 93, 930–941. [Google Scholar] [CrossRef]
  56. Xue, M.; Luo, Y. Dynamic variations in ecosystem service value and sustainability of urban system: A case study for Tianjin city, China. Cities 2015, 46, 85–93. [Google Scholar] [CrossRef]
  57. Qiu, J.; Yu, D.; Huang, T. Influential paths of ecosystem services on human well-being in the context of the sustainable development goals. Sci. Total Environ. 2022, 852, 158443. [Google Scholar] [CrossRef]
  58. Deng, C.; Shen, X.; Liu, C.; Liu, Y. Spatiotemporal characteristics and socio-ecological drivers of ecosystem service interactions in the Dongting Lake Ecological Economic Zone. Ecol. Indic. 2024, 167, 112734. [Google Scholar] [CrossRef]
  59. Wetzels, M.; Odekerken-Schröeder, G.; Van Oppen, C. Using pls path modeling for assessing hierarchical construct models: Guidelines and empirical illustration. MIS Q. 2009, 33, 177–195. Available online: http://www.jstor.org/stable/20650284 (accessed on 15 March 2025). [CrossRef]
  60. Xu, S.; Wang, K.; Wang, F. Monitoring changes and multi-scenario simulations of land use and ecosystem service values in coastal cities: A case study of Qingdao, China. Environ. Monit. Assess. 2025, 197, 173. [Google Scholar] [CrossRef]
  61. Cao, A.; Zhang, J. Multi-scenario prediction of ecosystem services value and mechanism of its trade-offs under the township scale—evidence from Liaoning province. Environ. Monit. Assess. 2025, 197, 204. [Google Scholar] [CrossRef]
  62. Loukika, K.N.; Keesara, V.R.; Buri, E.S.; Sridhar, V. Predicting the effects of land use land cover and climate change on munneru river basin using ca-markov and soil and water assessment tool. Sustainability 2022, 14, 5000. [Google Scholar] [CrossRef]
  63. Li, Y.; Qiao, X.; Wang, Y.; Liu, L. Spatiotemporal patterns and influencing factors of remotely sensed regional heat islands from 2001 to 2020 in Zhengzhou Metropolitan area. Ecol. Indic. 2023, 155, 111026. [Google Scholar] [CrossRef]
  64. Wu, K.; Han, L. Assessing urban ecosystem health using emergy and set pair analysis: A comparative study of typical chinese cities. Ecol. Indic. 2025, 178, 114102. [Google Scholar] [CrossRef]
  65. Wan, L.; Ye, X.; Lee, J.; Lu, X.; Zheng, L.; Wu, K. Effects of urbanization on ecosystem service values in a mineral resource-based city. Habitat Int. 2015, 46, 54–63. [Google Scholar] [CrossRef]
  66. Yan, S.; Chen, H.; Quan, Q.; Liu, J. Evolution and coupled matching of ecosystem service supply and demand at different spatial scales in the Shandong Peninsula urban agglomeration, China. Ecol. Indic. 2023, 155, 111052. [Google Scholar] [CrossRef]
  67. Liang, B.-Y.; Cao, C.; Li, J.-C.; Tang, Q.-H.; Wu, Y.-Y.; Xiao, X.; Rao, Y.-L.; Wang, J.-W.; Yang, L.-Q. Spatiotemporal Response of Ecosystem Service Value to Land Use Change in theLanzhou-Xining Urban Agglomeration over the Past 20 Years. Environ. Sci. 2024, 45, 3329–3340. [Google Scholar] [CrossRef]
  68. Shi, X.; Xia, H.; Machimura, T.; Matsui, T.; Haga, C.; Wang, Q.; Pan, H.; Peng, L. Scenario-based land use simulation and integrated analysis of karst ecosystem service bundles. Glob. Ecol. Conserv. 2024, 54, e03096. [Google Scholar] [CrossRef]
  69. Ai, X.; Zheng, X.; Zhang, Y.; Liu, Y.; Ou, X.; Xia, C.; Liu, L. Climate and land use changes impact the trajectories of ecosystem service bundles in an urban agglomeration: Intricate interaction trends and driver identification under SSP-RCP scenarios. Sci. Total Environ. 2024, 944, 173828. [Google Scholar] [CrossRef]
  70. Li, G.; Wang, W.; Li, B.; Duan, Z.; Hu, L.; Liu, J. Spatiotemporal simulation of blue-green space pattern evolution and carbon storage under different SSP-RCP scenarios in Wuhan. Sci. Rep. 2025, 15, 4017. [Google Scholar] [CrossRef] [PubMed]
  71. Li, D.; Fan, Q.; Guo, D. Hydrological effectiveness of ecological governance in the Yellow River Basin: A meta-analysis of water quality and ecosystem responses. Hydrol. Res. 2025, 56, 1065–1082. [Google Scholar] [CrossRef]
  72. Chen, W.; Zeng, Y.; Zeng, J. Impacts of traffic accessibility on ecosystem services: An integrated spatial approach. J. Geogr. Sci. 2021, 31, 1816–1836. [Google Scholar] [CrossRef]
  73. Bai, Y.; Sun, S.; Xu, Y.; Zhao, Y.; Pan, Y.; Xiao, Y.; Li, R. Exploring the dynamic impact of future land use changes on urban flood disasters: A case study in Zhengzhou City, China. Geogr. Sustain. 2025, 6, 100287. [Google Scholar] [CrossRef]
  74. Liu, M.; Bai, X.; Tan, Q.; Luo, G.; Zhao, C.; Wu, L.; Hu, Z.; Ran, C.; Deng, Y. Monitoring impacts of ecological engineering on ecosystem services with geospatial techniques in karst areas of SW China. Geocarto Int. 2022, 37, 5091–5115. [Google Scholar] [CrossRef]
  75. Li, Z.; Deng, X.; Jin, G.; Mohmmed, A.; Arowolo, A.O. Tradeoffs between agricultural production and ecosystem services: A case study in Zhangye, Northwest China. Sci. Total Environ. 2020, 707, 136032. [Google Scholar] [CrossRef]
  76. Hu, Y.; Zhang, S.; Shi, Y.; Guo, L. Quantifying the impact of the Grain-for-Green Program on ecosystem service scarcity value in Qinghai, China. Sci. Rep. 2023, 13, 2927. [Google Scholar] [CrossRef] [PubMed]
  77. Bai, L.; Tian, J.; Peng, Y.; Huang, Y.; He, X.; Bai, X.; Bai, T. Effects of climate change on ecosystem services and their components in southern hills and northern grasslands in China. Environ. Sci. Pollut. Res. 2021, 28, 44916–44935. [Google Scholar] [CrossRef] [PubMed]
  78. Bi, J.; Hao, R.; Li, J.; Qiao, J. Identifying ecosystem states with patterns of ecosystem service bundles. Ecol. Indic. 2021, 131, 108195. [Google Scholar] [CrossRef]
  79. Su, C.; Dong, M.; Fu, B.; Liu, G. Scale effects of sediment retention, water yield, and net primary production: A case-study of the Chinese Loess Plateau. Land Degrad. Dev. 2020, 31, 1408–1421. [Google Scholar] [CrossRef]
  80. Liu, H.; Liu, Y.; Wang, C.; Zhao, W.; Liu, S. Landscape pattern change simulations in Tibet based on the combination of the SSP-RCP scenarios. J. Environ. Manag. 2021, 292, 112783. [Google Scholar] [CrossRef]
  81. Li, Y.; Wang, P.; Lou, Y.; Chen, C.; Shen, C.; Hu, T. Assessing urban drainage pressure and impacts of future climate change based on shared socioeconomic pathways. J. Hydrol. Reg. Stud. 2024, 53, 101760. [Google Scholar] [CrossRef]
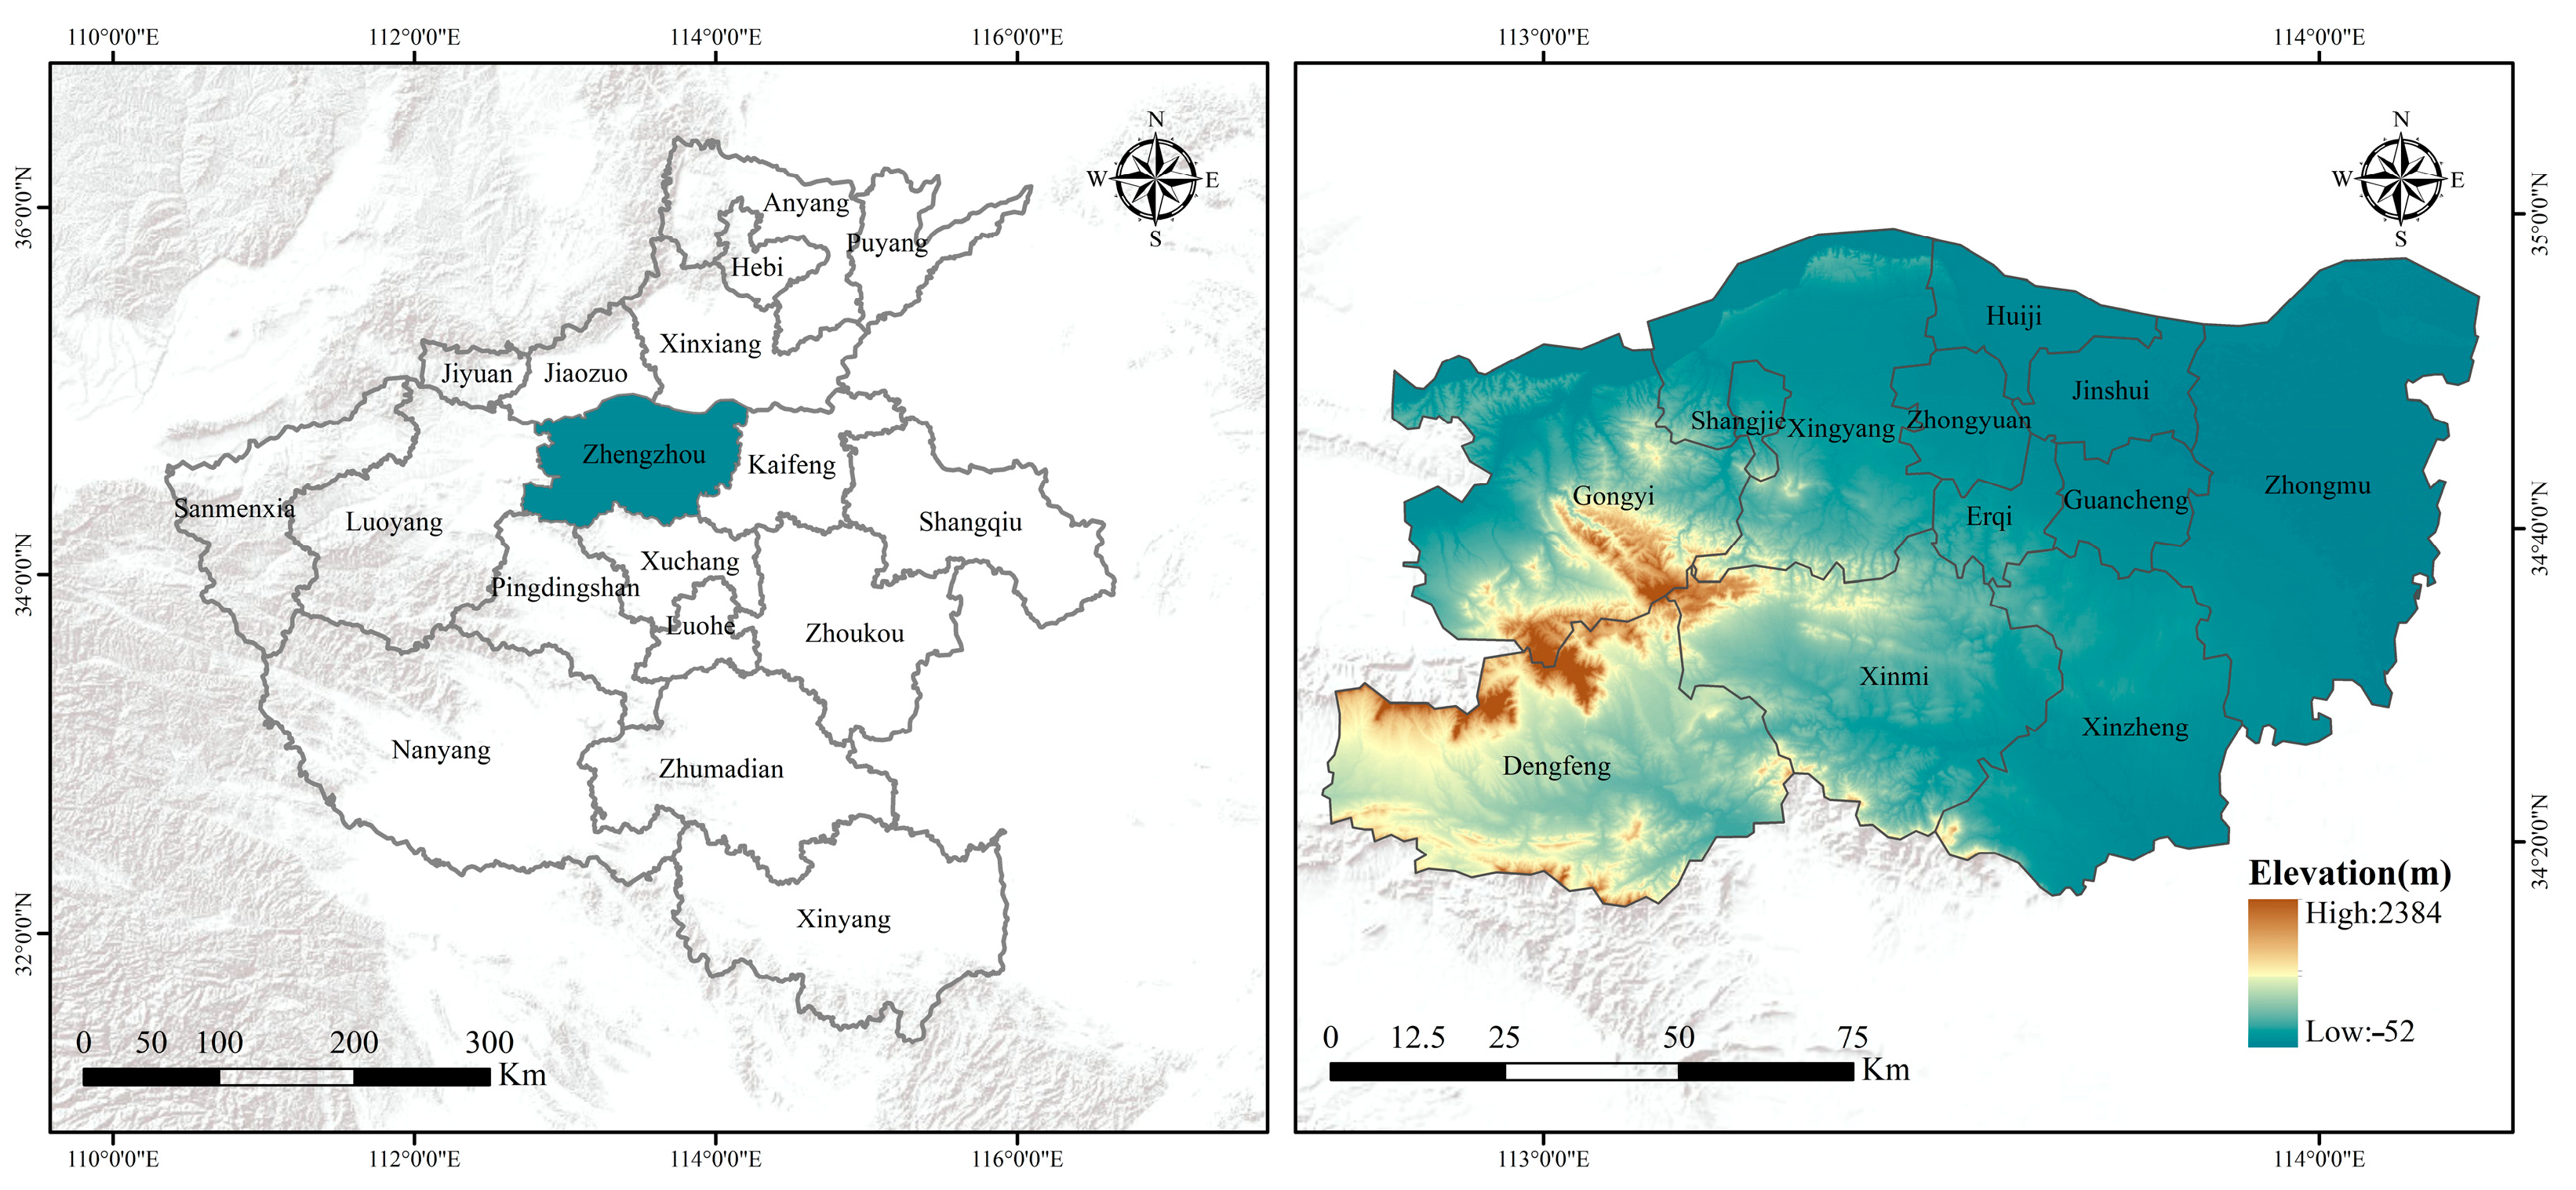
Figure 1. Spatial position of Zhengzhou city.
Land 14 02255 g001
Figure 2. Research framework.
Land 14 02255 g002
Figure 3. SD model of land-use change.
Land 14 02255 g003
Figure 4. Driving factors of the PLUS model. (a)Elevation, (b) Slope, (c) Soil type, (d) Precipitation, (e) Temperature, (f) NDVI, (g) NPP, (h) GDP, (i) Population, (j) Nightlight, (k) Distance to water, (l) Distance to main urban roads, (m) Distance to urban secondary roads, (n) Distance to highway, (o) Distance to railway station.
Land 14 02255 g004
Figure 5. Comparison of simulated land use with actual land use.
Land 14 02255 g005
Figure 6. Land use of Zhengzhou city from 2005 to 2024.
Land 14 02255 g006
Figure 7. Land-use transfer in Zhengzhou from 2005 to 2024.
Land 14 02255 g007
Figure 8. Simulation of LUCC under different SSP scenarios.
Land 14 02255 g008
Figure 9. The value of different ecosystem service functions (SPY, REC, SPT, and CUL stand for Supply Services, Regulatory Services, Support Services and Cultural Services, respectively).
Land 14 02255 g009
Figure 10. Spatial Distribution of ESV from 2005 to 2024.
Land 14 02255 g010
Figure 11. Spatial Distribution of ESV under SSP Scenarios.
Land 14 02255 g011
Figure 12. The impact of various factors on ESV (The blue and red arrows represent positive and negative effects, respectively. The width of the arrows is proportional to the strength of the effect. Statistical significance is indicated by *** (p < 0.001)).
Land 14 02255 g012
Figure 13. LISA cluster distribution of ecosystem service in 2024.
Land 14 02255 g013
Figure 14. Comparison of ESVs including and excluding Construction land.
Land 14 02255 g014
Table 1. Data name and source.
DataDetailsSpatial ResolutionSource
Land cover dataLand cover data30 mhttps://doi.org/10.5281/zenodo.5816591 (accessed on 15 March 2025)
Meteorological dataElevation12.5 mhttps://search.asf.alaska.edu/#/ (accessed on 15 March 2025)
Slope12.5 mCalculated from DEM data
Temperature1 kmhttp://data.tpdc.ac.cn/ (accessed on 15 March 2025)
Precipitation 1 kmhttp://data.tpdc.ac.cn/ (accessed on 15 March 2025)
Soil type1 kmhttps://www.resdc.cn/ (accessed on 15 March 2025)
Net Primary Production data500 mhttp://www.geodata.cn/ (accessed on 15 March 2025)
NDVI500 mhttps://www.resdc.cn/ (accessed on 15 March 2025)
Socioeconomic dataPopulation data1 kmhttps://www.resdc.cn/ (accessed on 15 March 2025)
GDP data1 km
Nighttime light1 km
Transportation location daterailway stations-OpenStreetMap (https://www.openstreetmap.org/ accessed on 15 March 2025)
highway-
Urban road-
Water-
Price, planting area and output of agricultural products--Zhengzhou City Statistical Yearbook
Table 2. SD Model simulation accuracy verification.
Land-Use TypeCroplandForestGrasslandWaterConstruction LandUnused Land
Actual Area in 2005/km25505.71423.09124.99124.031390.5000.01
Simulated Area in 2005/km25496.65423.07124.84123.901399.860.01
Relative Error−0.16%0.00%−0.12%−0.11%0.67%−1.59%
Actual Area in 2010/km25128.32558.95129.01131.351620.0500.64
Simulated Area in 2010/km25119.98559.30129.16131.691627.560.63
Relative Error−0.16%0.06%0.11%0.25%0.46%−1.77%
Actual Area in 2015/km24752.75588.11132.87106.871987.340.38
Simulated Area in 2015/km24741.18588.06133.14107.211998.340.39
Relative Error−0.24%−0.01%0.20%0.31%0.55%2.14%
Actual Area in 2020/km24515.05556.07108.30116.532272.230.14
Simulated Area in 2020/km24503.40556.27108.63116.822283.060.13
Relative Error−0.26%0.04%0.31%0.24%0.48%−3.78%
Table 3. Parameter settings for different climate scenarios.
SSPs-RCPs Scenarios2023–20302030–2040
SSP126SSP245SSP585SSP126SSP245SSP585
Rate of GDP change (%)1.612.871.79−2.25−1.37−2.14
Rate of population change (%)8.636.5710.444.743.115.68
Rate of change in urbanisation rate (%)1.951.781.951.080.941.08
Annual Average Temperature Variation (°C)0.580.810.880.430.450.48
Annual Average Precipitation Variation (mm)2.2310.964.444.45−7.369.42
Table 4. Accuracy assessment of LUCC.
LULC Type20202024
P.accuracyU.accuracyP.accuracyU.accuracy
Cropland93.32%93.32%96.28%96.28%
Forest87.41%85.93%90.75%83.60%
Grassland70.3%70.3%74.09%74.09%
Water65.01%70.36%66.45%66.45%
Construction land89.00%89.03%93.81%95.67%
Unused land63.60%63.60%61.85%61.85%
Kappa0.832 0.781
Table 5. ESV assessment model correction formula.
Revision CategoryRevised FormulaMeaning
Socioeconomic coefficient
P I = G D P s t G D P c n × 2 1 + e ( 1 E n 2,5 )
E n = E n t × U + E n r × R  
P I   represents   the   socioeconomic   adjustment   coefficient ;   G D P s t   and   G D P c n   denote   the   per   capita   GDP   of   the   study   area   and   the   national   GDP   in   year   t ,   respectively ;   E n   represents   the   Engel   coefficient ;   E n t   and   E n r refer to the urban and rural Engel coefficients, respectively; and U and R indicate the proportions of urban and rural populations, respectively.
Biomass Coefficient
P = N P P m N P P g
R = P R E m P R E g
P   and   R   represent   the   net   primary   production   ( NPP )   and   precipitation   adjustment   factors   for   Zhengzhou   City .   N P P m   and   P R E m   denote   the   mean   values   of   NPP   and   precipitation   for   Zhengzhou   City ,   whereas   N P P g   and   P R E g indicate the corresponding national mean values of NPP and precipitation.
Construction land area Coefficients
C V g = c q A r e a
C V c = C r + C c A r e a
C V g   represents   the   gas   adjustment   value ;   c q   indicates   the   cos t   of   treating   waste   gas ;   C V c   refers   to   the   environmental   purification   value ;   and   C r   and   C c represent the costs of treating municipal solid waste and industrial waste, respectively.
Total ESV
E S V = ( A k × V C k )
E S V = ( A k × V C f k )
E S V   refers   to   the   total   value   of   ecosystem   services ;   A k   represents   the   coefficients   corresponding   to   k   types   of   land   use ;   V C k   represents   the   ecological   value   coefficient ;   denotes   the   sin gle   ESV ;   and   V C f k is the value coefficient of a single service function.
Table 6. Ecosystem service value equivalent per unit area in Zhengzhou city (yuan/hm2).
First CategorySecond CategoryCroplandForestGrasslandWater Construction LandUnused Land
Supply servicesFood production1053.39 297.43 371.79 991.43 0.00 0.00
Raw material production495.71 675.41 557.68 285.04 0.00 0.00
Water supply45.01 630.08 630.08 18,654.85 0.00 0.00
Regulation servicesGas regulation830.32 2218.32 1933.29 954.25 −371.25 24.79
Climate regulation446.14 6648.77 5155.43 2837.97 0.00 0.00
Purify environment123.93 1989.05 2751.22 6878.04 −954.74 123.93
Hydrological regulation607.58 9102.40 11,161.40 230,068.96 0 67.51
Support servicesSoil conservation1679.56 3562.95 1011.00 1516.50 32.87 32.61
Nutrient cycling148.71 204.48 297.43 86.75 0.00 0.00
Biodiversity protection161.11 2466.18 3494.79 3160.18 32.87 24.79
Culture servicesAesthetic landscape74.36 1084.38 1536.72 2342.25 16.44 12.39
Table 7. PLS-SEM evaluation.
FactorsLoadingCRAVE
TLF 0.7800.520
DFS0.663
DFW0.559
DFH0.670
DFRⅠ0.756
DFRⅠⅠ0.654
SEF 0.8700.870
GDP0.952
POP0.956
NEL0.889
TSF 0.7110.585
DEM0.958
Slope0.926
CCF 0.9400.888
PRE0.799
TEM0.910
FF 0.8450.733
NDVI0.987
NPP0.543
Note: CCF, TSF, SEF, FF and TLF represent Climate Condition Factors, Topography Factors, Socioeconomic Factor, Transport Location Factor and Environmental Function Factors, respectively. DFS, DFW, DFH, DFRⅠ, and DFRⅠⅠ represent the distance to water, railway stations, highways, urban primary roads, and secondary roads, respectively; POP and NEL denote population and nightlight; PRE and TEM stand for precipitation and temperature.
Table 8. Demand for land-use types under different SSP scenarios (km2).
LULC Type202420302040
SSP126SSP245SSP585SSP126SSP245SSP585
Cropland4504.86 4354.18 4273.014154.064005.573915.213813.02
Forest 558.53 564.34 556.47 546.43 582.59 537.25 524.76
Grassland45.31 92.30 88.9485.41 101.95 99.53 97.44
Water108.87 120.06 113.40110.39 124.72 119.04 114.42
Construction land2350.68 2437.30 2536.25 2671.68 2753.342897.113018.43
Unused land0.070.15 0.24 0.36 0.14 0.20 0.25
Table 9. ESV and proportion by ecosystem class (107 yuan/hm2).
YearFactorCroplandForestGrasslandWaterConstruction LandUnused Land
2005ESV311.98122.3136.16330.24−17.290.00
Percentage39.82%15.61%4.62%42.15%−2.21%0.00%
2010ESV290.60161.5737.32350.28−20.140.00
Percentage35.46%19.71%4.55%42.74%−2.46%0.00%
2015ESV269.31170.0138.45284.86−24.710.00
Percentage36.50%23.04%5.21%38.60%−3.35%0.00%
2020ESV255.83160.7431.35310.32−28.260.00
Percentage35.05%22.02%4.30%42.51%−3.87%0.00%
2024ESV255.21161.3027.25294.75−28.620.00
Percentage35.95%22.72%3.84%41.52%−4.03%0.00%
Table 10. ESVs under SSP Scenarios (107 yuan/hm2).
LULC Type202420302040
SSP126SSP245SSP585SSP126SSP245SSP585
Cropland255.21246.70242.10235.36226.95221.83216.04
Forest161.30162.98160.71157.80168.25155.16151.55
Grassland27.2526.6825.7124.6929.4728.7628.16
Water294.75321.49303.66295.60333.97318.76306.40
Construction land−28.62−30.32−31.55−33.23−34.25−36.03−37.54
Unused land0.000.000.000.000.000.000.00
Table 11. PLS-SEM path coefficient.
PathPath Coefficient (Direct Effects)Indirect EffectsTotal Effects
TLF → SEF−0.5 ***0−0.5
TLF → ESV0.291 ***0.1000.391
SEF → ESV−0.2 ***0−0.2
TSF → FF−0.02 ***0−0.02
TSF → ESV0.113 ***−0.235−0.122
CCF → FF0.877 ***00.877
CCF → ESV0.251 ***0.0050.256
FF → ESV−0.268 ***0−0.268
Note: Statistical significance is indicated by *** (p < 0.001).
Table 12. Correlation analysis results for the four ecosystem services.
Ecosystem ServicePearson CoefficientMoran’s I
2005201020152020202420052010201520202024
SPY-REC0.868 0.885 0.885 0.893 0.882 0.4820.4680.4850.4710.497
SRY-SPT0.845 0.820 0.833 0.816 0.843 0.3790.3830.3920.3850.409
SPY-CUL0.708 0.719 0.709 0.719 0.741 0.3320.3350.3710.3430.367
REC-SPT0.636 0.632 0.676 0.649 0.673 0.3310.3340.3510.3270.35
REC-CUL0.728 0.727 0.733 0.724 0.753 0.5560.5710.5870.5830.584
SPT-CUL0.886 0.905 0.918 0.922 0.922 0.3490.3640.3680.3540.355
Disclaimer/Publisher’s Note: The statements, opinions and data contained in all publications are solely those of the individual author(s) and contributor(s) and not of MDPI and/or the editor(s). MDPI and/or the editor(s) disclaim responsibility for any injury to people or property resulting from any ideas, methods, instructions or products referred to in the content.