Abstract
Land use change is closely related to land surface temperature (LST). Based on remote sensing data from 2001 to 2020, this study analyzed the spatiotemporal variations and driving mechanisms of daytime and nighttime LST in the Urumqi Metropolitan Area (UMA) by combining traditional methods with the eXtreme Gradient Boosting (XGBoost)–SHAP coupled model. Although the average LST trend in the region was one of warming, the pixel-level significance analysis indicated that statistically significant warming (p < 0.05) is concentrated mainly in the urban core (2.65% of the area), while the majority of the region (70%) showed a non-significant warming trend. LST displayed significant spatial clustering, with Moran’s I remaining above 0.990, indicating a positive spatial autocorrelation in spatial distribution. With the advancement of urbanization, the proportion of impervious surfaces increased from 0.87% to 1.14%, while wastelands consistently accounted for approximately 50% of the total area. Different land use types showed distinct effects on the urban heat island (UHI) phenomenon: water bodies, grasslands, and forests played cooling roles, whereas barren land and impervious areas were the main heat contributors. The XGBoost-SHAP analysis further revealed that the importance ranking of driving factors has evolved over time. Among these factors, Elevation dominates, while the influence of population-related factors increased significantly in 2020. This study provides a scientific basis for regulating the thermal environment of cities in arid regions from the perspective of land use. This study provides a scientific basis for regulating the thermal environment of arid-region cities from the perspective of land use.
1. Introduction
Driven by global climate change and rapid urbanization, the coupled relationship between land use change and the thermal environment has long been a focal point of academic research []. The thermal environment is not only closely linked to the quality of residents’ lives, but also profoundly affects regional climate regulation, ecosystem service, and carbon emission patterns []. Understanding how land use dynamics shape surface temperature variations is therefore essential for promoting sustainable urban development.
As a typical arid region of Northwest China, the Urumqi Metropolitan Area (UMA) exhibits complex and unique thermal evolution patterns shaped by its desert ecological background, rapid urban expansion, and ongoing ecological restoration projects []. In the UMA, rapid urban expansion and ongoing ecological restoration have jointly reconfigured the regional land surface pattern. Urban growth tends to intensify surface heating through increased impervious surfaces and anthropogenic energy emissions, whereas ecological restoration projects contribute to localized cooling via vegetation recovery and enhanced evapotranspiration. These opposing processes interact spatially and temporally, creating a complex thermal landscape that underscores the need to disentangle their relative and combined effects. Systematically deciphering the coupling mechanism between land use and the LST holds crucial scientific significance and practical value for the sustainable development of cities in arid regions [].
Globally and regionally, the intensification of the UHI effect and increased thermal stress have become undeniable realities []. In arid regions, the sensitivity of surface temperature to land use change is particularly high due to low vegetation cover and the predominance of bare soil and impervious surfaces []. Internationally, scholars have long focused on quantifying how land cover and urban form affect surface heat distribution—for instance, Grimmond et al. highlighted the role of impervious surface expansion in intensifying the UHI effect []. Domestically, however, most studies have concentrated on the humid, economically developed eastern regions of China [], and research on arid urban agglomerations remains limited. In similar arid and semi-arid regions worldwide, studies have revealed comparable yet context-dependent mechanisms underlying urban heat formation. For example, in Middle Eastern cities such as Riyadh and Tehran, rapid urban expansion and the reduction in vegetated areas have been identified as primary causes of intensified surface warming under scarce precipitation conditions [,]. Likewise, research in Central Asian basins has shown that elevation and topographic heterogeneity strongly regulate LST by influencing airflow and surface energy balance []. However, systematic analyses for the Urumqi Metropolitan Area remain scarce, and few studies have integrated explainable machine learning to quantify the nonlinear interactions between natural and anthropogenic drivers. This study therefore fills an important research gap by applying an interpretable ML framework to an arid, topographically complex urban agglomeration [].
The response of LST to drivers such as elevation, vegetation, precipitation, population, and built-up intensity is inherently complex, and traditional linear models may fail to reflect such multiscale processes. Building on these methodological limitations, recent advances in machine learning (ML) have provided more powerful tools to model complex nonlinear relationships. In particular, the XGBoost algorithm, coupled with SHAP, enables both high predictive accuracy and interpretability by quantifying each driver’s marginal contribution and direction of influence.
By integrating this XGBoost–SHAP approach, the present study extends traditional LUCC–thermal environment research toward an interpretable machine learning paradigm, underlying LST variations in arid urban cities. This approach not only strengthens predictive robustness but also bridges the gap between empirical observation and mechanistic understanding—offering new perspectives for land use optimization and heat mitigation planning in resource-constrained environments.
In the UMA, rapid urban expansion and ongoing ecological restoration have jointly reconfigured the regional land surface pattern. Urban growth tends to intensify surface heating through increased impervious surfaces and anthropogenic energy emissions, whereas ecological restoration projects contribute to localized cooling via vegetation recovery and enhanced evapotranspiration. These opposing processes interact spatially and temporally, creating a complex thermal landscape that underscores the need to disentangle their relative and combined effects.
UMA, characterized by its distinct mountain–basin topography and accelerated urbanization, provides an ideal case for exploring how natural and anthropogenic factors jointly shape surface temperature dynamics. This study aims to: (1) Analyze the spatiotemporal evolution of LST and land use from 2001 to 2020; (2) Quantify the relative contributions of different land use types to the thermal environment; (3) Identify the key drivers and nonlinear response mechanisms of LST using the XGBoost–SHAP model. Through this integrated framework, the study seeks to reveal the intrinsic coupling process of “land use transition–driving mechanism–thermal response”, providing theoretical insights and decision support for the sustainable development of arid-region urban agglomerations.
2. Materials and Methods
2.1. Study Area Overview
The UMA is located in the Xinjiang Uygur Autonomous Region. The Region is characterized by a typical temperate continental arid climate, with warm and dry summers, and cold winters []. Based on long-term meteorological observations from the Urumqi Weather Station, the annual mean daytime land-surface LST is approximately 20 °C, while the nocturnal mean is −1 °C. Seasonal averages peak at 39 °C 104 in summer and drop to −7 °C in winter, with an average annual precipitation of 210 mm. Influenced by the arid climate and topographic variation, significant diurnal and seasonal differences in LST are observed in the region. The land use types in the UMA are diverse; however, due to its special geographical and climatic conditions, the ecological environment is fragile, with scarce and unevenly distributed water resources [].
To address these environmental challenges and guide sustainable urbanization, the “Urumqi City Territorial Spatial Master Plan (2021–2035)” was officially approved in January 2025. It aligns with the national “Two Horizontal and Three Vertical” strategy, which aims to construct an ecological security pattern to enhance resilience against issues like the urban heat island. This study directly supports the plan’s goals by quantifying the LST variations that the strategy seeks to mitigate, thereby offering a scientific basis for its implementation (Figure 1).
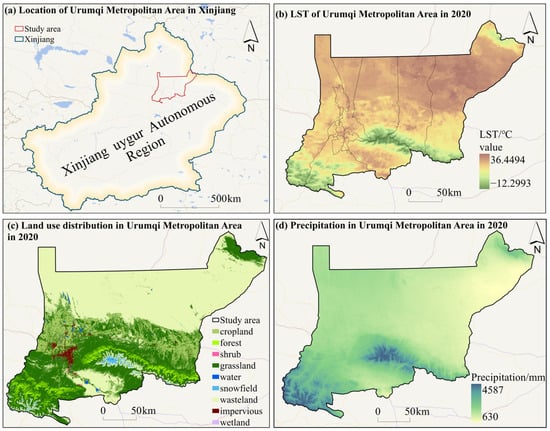
Figure 1.
Study area.
2.2. Data Sources and Research Methods
2.2.1. Data Sources
The LST data used in this study were derived from the MODIS/Aqua 8-day composite daytime LST product (MOD11A2) provided by NASA Earthdata Search, with a spatial resolution of 1 km. The land use data were obtained from the China Land Cover Dataset. For this study, land cover data from 2001, 2005, 2010, 2015, and 2020 were selected to analyze the impact of land use change on the regional thermal environment []. The category referred to as “wasteland” corresponds to the CLCD “barren land” class. This class mainly includes Gobi deserts, sandy and gravelly surfaces, exposed soil, and bare rock areas, which are typical in the piedmont plains and intermountain basins of the UMA. These surfaces are characterized by low vegetation cover (NDVI < 0.05), low albedo, high heat storage capacity, and very limited evapotranspiration. The following driver data such as Normalized Difference Vegetation Index (NDVI) data were derived from SPOT/VEGETATION and MODIS satellite imagery; Population (POP) datasets were obtained from the WorldPop open repository. Fractional Vegetation Cover (FVC) datasets are from the MODIS series (NASA/USGS), DMSP and Digital Elevation Model (DEM) data from the National Tibetan Plateau Data Center, and Gross Domestic Product (GDP) data from the Resources and Environmental Science Data Center, Chinese Academy of Sciences.
2.2.2. Research Methods
In this study, multi-year LST and LULC datasets from 2001 to 2020 were collected and preprocessed through resampling, clipping, and projection alignment to ensure spatial and temporal consistency. Based on these data, a series of analytical methods were applied sequentially to reveal both the spatial–temporal patterns and driving mechanisms of the LST. First, the spatial distribution of LST was classified using the mean and standard deviation method to identify cold and hot zones and characterize the spatial heterogeneity of LST. Then, the temporal evolution of LST was analyzed by employing the least-squares regression method, which quantified the long-term trends of surface temperature change. To further explore the spatial structural characteristics, the standard deviational ellipse and Moran’s I were used to depict the directional tendencies, clustering intensity, and spatial autocorrelation of the thermal environment. Subsequently, contribution index (CI) method were applied to quantify the impact of different LULC types on LST and to assess whether specific land use types contributed to surface cooling or heating. Finally, to capture nonlinear interactions and interpret the relative importance of multiple influencing factors, the XGBoost model was integrated with the SHAP interpretation framework. This combination enabled the quantification of complex relationships between LST and its driving variables and provided a transparent explanation of how land surface and environmental factors jointly shape the spatiotemporal dynamics of the urban thermal environment. The overall technical framework of this study is illustrated in Figure 2.
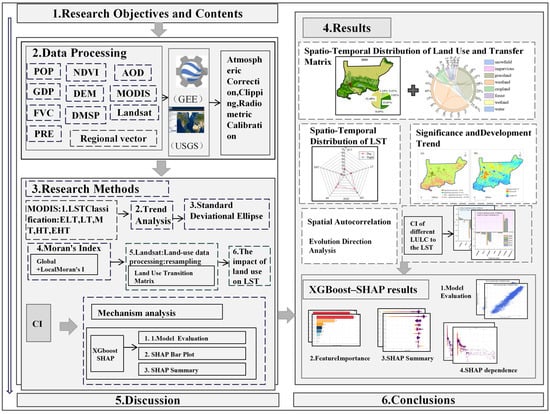
Figure 2.
Research Framework Diagram.
2.2.3. Classification of LST Grades
The specific statistical thresholds applied for this classification are provided in Table 1. To quantitatively analyze the spatiotemporal distribution characteristics of the LST in the UMA, the standard deviation classification method was adopted to divide LST into five grades []: Extremely Low Temperature (ELT), Low Temperature (LT), Medium Temperature (MT), High Temperature (HT), and Extremely High Temperature (EHT). This classification facilitates temporal comparison and analysis []. The specific statistical thresholds used to define these grades for each study year are provided in Table 1 below.

Table 1.
Classification of land surface temperature grades (°C).
2.2.4. Standard Deviation Ellipse (SDE) and Bivariate Spatial Autocorrelation
The SDE method was used to analyze the agglomeration areas of LST, which can characterize the spatial distribution pattern and directional characteristics of LST []. Centroid migration analysis can reflect both the spatial migration trajectory of thermal elements and the overall spatial heterogeneity of thermal elements. In this study, degree of correlation is expressed by Moran’s I []. Global spatial autocorrelation can analyze the agglomeration degree between spatial units in the region [], while local spatial autocorrelation can measure the correlation of individual spatial units []. All mathematical formulas are provided in the Supplementary Materials.
2.2.5. Calculation of Contribution Index
To quantify the contribution of different land use types to the LST in the study area, the CI method was adopted [].
where CI is the contribution index of a specific land use type to the LST; and are the average LST of the region covered by the specific land use type region d and the entire study area [].
2.2.6. Analyzing Driving Factors of LST Using XGBoost and SHAP
To identify and quantify the nonlinear relationships between LST and its potential driving factors, this study employed the XGBoost algorithm coupled with SHAP for model interpretation [].
- XGBoost Regression Model
XGBoost is an ensemble learning algorithm based on the gradient boosting framework, which constructs an additive model of multiple decision trees []. The predicted LST value for a sample i is expressed as the sum of k regression trees:
where represents an individual regression tree, and is the space of all possible trees.
The objective function is defined as:
where is the regularization term controlling model complexity (T: number of leaves, : leaf weights, , regularization coefficients). This formulation balances model fit and generalization, preventing overfitting while maintaining predictive performance.
In this study, the model was configured with the following optimized parameters: objective = “reg:squarederror”, max_depth = 3, learning_rate (η) = 0.1, nrounds = 100.
The model was implemented in R using the xgboost package, with input features including NDVI, FVC, DMSP, POP, GDP, PRE, and DEM, and the annual mean LST as the target variable.
- 2.
- Model Performance Evaluation
To ensure reliability, model performance was evaluated using three standard indicators: Root Mean Square Error (RMSE), Mean Absolute Error (MAE), and the Coefficient of Determination (R2). A smaller RMSE and MAE, coupled with a higher R2, indicate stronger predictive accuracy and better generalization ability [].
- 3.
- Model Interpretation with SHAP Values
To move beyond prediction and gain a deeper understanding of the contribution of each driving factor, SHAP was applied to interpret model outputs []. The SHAP value for each feature j is defined as:
where F is the full set of features, and is a subset excluding feature j.
This value represents the marginal contribution of each feature to the model’s prediction.
By averaging the absolute SHAP values across all samples, this study obtained the relative importance of each variable, revealing its contribution magnitude and direction. A positive SHAP value indicates that a variable increases the predicted LST, while a negative SHAP value reflects a cooling effect. This interpretability framework enables a transparent understanding of how natural (e.g., DEM, NDVI, PRE) and anthropogenic (e.g., GDP, POP, DMSP) factors jointly influence the LST in the UMA.
3. Results
3.1. Land Use Distribution and Transition Characteristics
As shown in Figure 3, the land use structure of the UMA underwent notable changes between 2001 and 2020, driven by both rapid urban expansion and ongoing ecological restoration. Wasteland consistently occupied the largest proportion of the total area, serving as a persistent potential heat source due to its low heat capacity and strong thermal conductivity. Grassland, the second dominant land type, declined steadily from 37.58% in 2001 to 33.01% in 2020, weakening its ability to regulate the surface thermal environment through evapotranspiration.
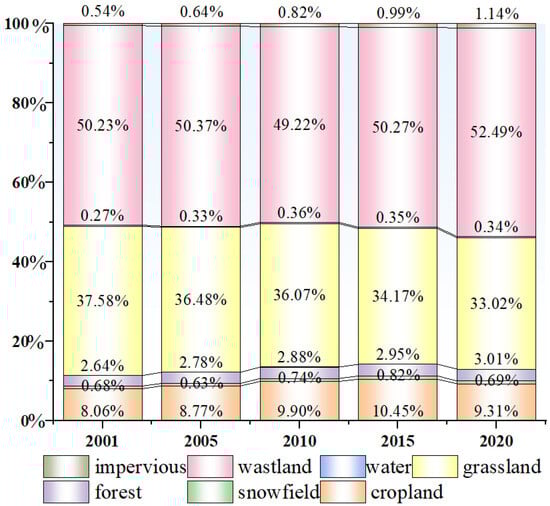
Figure 3.
UMA Land Use Area Proportion (2001–2020).
The land use transfer matrix further illustrates these dynamic conversions (see Figure S1 and Table S2 in the Supplementary Materials). Wasteland, grassland, and farmland were the core land types involved in mutual transformation. Wasteland exhibited the largest transfer-out volume (2.68 million ha), primarily converted into grassland (73.68 thousand ha) and farmland (15.25 thousand ha). Grassland experienced both active transfer-in and transfer-out processes—mainly gaining area from wasteland (233.09 thousand ha) while being converted to farmland (158.04 thousand ha) and back to wasteland—reflecting the coexistence of ecological restoration and land degradation. Farmland expansion largely resulted from the conversion of grassland and wasteland, corresponding to the cultivated land development demands during the early stage of urbanization.
From a temporal perspective, the transitions displayed distinct phased characteristics. During 2001–2005, the conversion of wasteland to grassland was most significant, marking the initial impact of ecological restoration projects on desert landscapes. Between 2005 and 2010, grassland conversion to farmland intensified, indicating active agricultural development driven by urbanization. By 2015–2020, impervious surfaces expanded rapidly, with 5505.07 ha of grassland, 1146.58 ha of wasteland, and 1886.30 ha of farmland converted into built-up areas—signaling the quality-improvement stage of metropolitan urbanization.
The evolution of land use in the UMA reflects a progressive transformation from an ecologically dominated landscape to a more urbanized pattern. The coexistence of restoration and expansion highlights the dual challenge of balancing development intensity and thermal environment regulation. Strengthening grassland restoration, promoting the ecological utilization of wastelands, and optimizing the spatial configuration of construction land are essential strategies for mitigating heat accumulation and enhancing the ecological resilience of arid-region urban ecosystems.
These structural and transitional changes in land use inevitably influenced the regional surface thermal regime, which is further analyzed in the following section.
3.2. Spatiotemporal Characteristics of LST
3.2.1. Daytime and Nighttime LST from 2001 to 2020
From the distribution of daytime LST in the UMA during 2001–2020 (Figure 4), high-altitude areas of the Tianshan Mountains were dominated by ELT and LT, while low-altitude plain areas were mainly characterized by medium to high temperatures. In some eastern and northern regions, agglomerations of EHT gradually formed, particularly in urban built-up areas and urbanization expansion zones, where the scope of HT expanded gradually. From the perspective of thermal environment proportion changes (Table S2), medium and high temperature zones dominated the study area during 2001–2020, but fluctuations occurred in different years. The proportion of the MT zone reached a peak of 48.08% in 2005, while the proportion of the HT zone increased significantly to 36.53% in 2015. The proportion of the EHT zone was relatively low (0.38–2.95%) but peaked in 2010, reflecting the concentrated intensification of thermal intensity in the urban core area and surrounding regions during this period. Meanwhile, the proportions of ELT and LT zones remained relatively stable (ELT: 9–10%; LT: 11–13%), mainly distributed in high-altitude mountainous areas and river valleys. Change analysis showed that daytime LST generally increased in the UMA from 2001 to 2020. No significant change or even a slight cooling trend was observed in high-altitude mountainous areas and some water bodies, which is closely related to urbanization, the increased degree of surface impermeability, and the reduction in vegetation coverage.
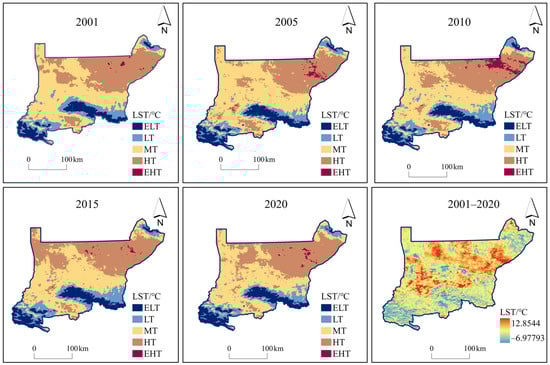
Figure 4.
Spatial distribution of daytime LST in the UMA from 2001 to 2020.
From the distribution of nighttime LST in the UMA during 2001–2020 (Figure 5), the spatial gradient of LST was weaker than that during the daytime. In 2001, the nighttime EHT zone was mainly concentrated in the central and southern parts of Urumqi City, while the remaining areas were dominated by MT. From 2005 to 2015, the HT zones became scattered. In 2020, the area of HT zones contracted slightly, but the thermal intensity in the central urban area further increased.
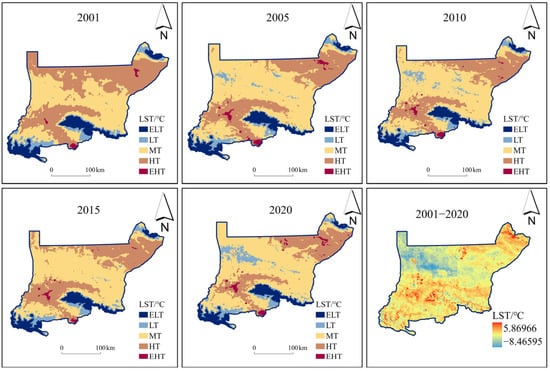
Figure 5.
Spatial distribution of nighttime LST in the UMA from 2001 to 2020.
Radar chart (Figure S2) indicated that the proportion of the nighttime MT zone increased significantly, rising from 41.30% in 2001 to 56.39% in 2020, while the proportion of the HT zone decreased significantly from 42.37% to 23.87%. The proportions of ELT and ET zones were relatively stable, but the proportion of the LT zone increased significantly to 9.93% in 2020, indicating a temperature decrease in some suburban and farmland areas at night.
Change analysis showed that from 2001 to 2020, nighttime LST increased in the urban core area but decreased in suburban and some other regions. This phenomenon is associated with the large heat capacity of cities and the cooling effect of green spaces in surrounding areas [].
3.2.2. Temporal Variation Trend of LST
The spatiotemporal trend of LST was quantified by applying a pixel-wise least-squares regression to the complete MODIS MOD11A2 time series (2001–2020). The resulting slopes represent the annual rate of temperature change.
Results (Figure 6) shows a warming trend, but significant spatial differences existed. The significance results (Figure 6a) indicated that the significantly warming area accounted for 2.65% of the total area, mainly distributed in the central area of Urumqi City. The proportion of significantly cooling areas was extremely low (0.13%), scattered in high-altitude mountainous areas and local river valleys, which was related to factors such as altitude, vegetation, and the cooling effect of Tianshan glaciers. Most areas showed an insignificant warming trend, while 25.48% of the area exhibited an insignificant cooling trend, mostly located in mountainous areas, green spaces, and water-rich regions. From the perspective of change trends (Figure 6b), warming areas were concentrated in the urban core area and along major transportation corridors, while cooling trends were mainly distributed in the Tianshan Mountains and riparian green corridors. The high-temperature phenomenon in the core area of the metropolitan area showed spatial persistence and concentration, while the peripheral natural ecological areas played a key role in alleviating changes in the LST.
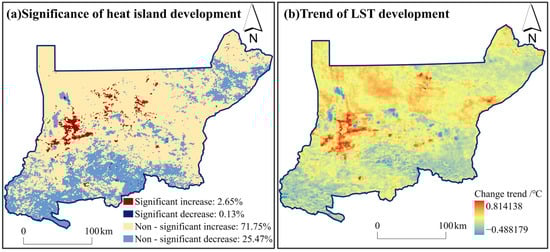
Figure 6.
Significance and trend of daytime LST development in the UMA from 2001 to 2020.
3.2.3. Spatial Autocorrelation Analysis of LST
Results of spatial autocorrelation analysis shows that the diurnal Moran’s I values of LST in 2001, 2005, 2010, 2015, and 2020 were all greater than 0.990, indicating a positive spatial correlation. Additionally, the spatial autocorrelation was significant, with all p-values less than 0.001 (Table 2).
Table 2.
LST Global Spatial Autocorrelation Significance Test.
From the results of spatial agglomeration and spatial outliers of LST (Figure 7), high-high (H-H) agglomeration areas were mainly distributed in wastelands and impervious surfaces, while low-low (L-L) agglomeration areas were primarily located in water bodies (mainly in the form of glaciers). This suggests that while the UMA exhibits overall spatial clustering of surface temperature, local-scale variations remain highly significant due to differences in land cover and topography. Both during the daytime and nighttime, water bodies and vegetation contributed to the formation of L-L agglomeration areas.
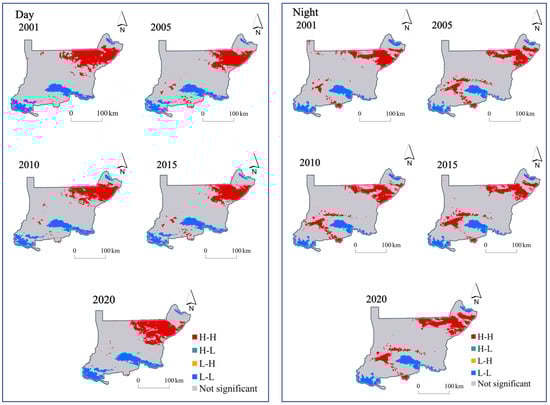
Figure 7.
Spatial agglomeration and spatial outliers of LST from 2001 to 2020.
3.2.4. Analysis of LST Evolution Direction
From the results of the SDE (Figure 8), during 2001–2020, the spatial pattern of LST distribution showed obvious directional characteristics. The major axis of the ellipse was generally distributed along the southwest-northeast direction, reflecting that the regional thermal environment was jointly affected by terrain and urban spatial layout.
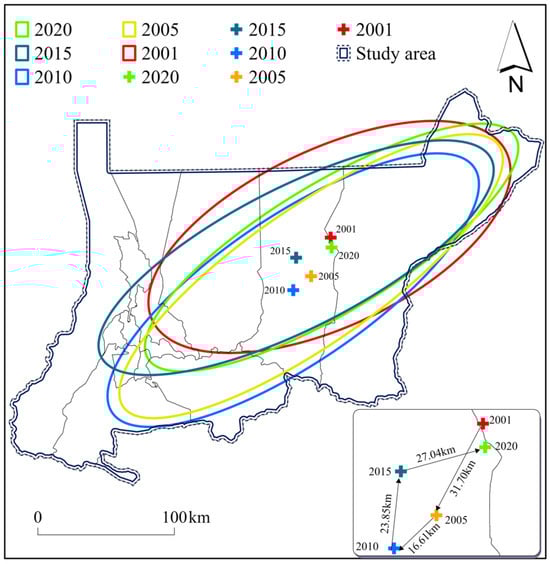
Figure 8.
Standard deviation ellipse of UHI in the UMA from 2001 to 2020.
From the perspective of ellipse area changes, the ellipse range was the smallest in 2001, indicating relatively concentrated heat distribution. The ellipse area expanded significantly in 2005 and 2010, suggesting an expansion of the heat spatial distribution range and an increase in the area affected by the thermal environment. The ellipse area contracted slightly in 2015 and 2020, indicating that the distribution of high-temperature zones tended to be concentrated and the spatial heterogeneity of the thermal environment weakened. The center of the ellipse generally showed a southwestward migration trend during 2001–2020, with a relatively large displacement amplitude between 2005 and 2015. Changes in the ellipse shape in different years also showed that the extensibility of heat distribution along the major axis was obvious in 2005 and 2010. The ellipse in 2020 tended to be compact, indicating that while the UHI effect was intensified in local core areas, the scope of its peripheral impact relatively decreased.
3.2.5. Contribution of Land Use Types to the Regional LST
Different land use types exhibited distinct thermal behaviors during the daytime and nighttime (see Annex for details). In the UMA, wastelands and impervious surfaces made the largest contributions to the main heat sources, while water bodies, grasslands, and forests served as major cold sources. These ecological land types mitigated surface heating through shading, transpiration, and evaporative cooling processes [].
In 2020, wastelands showed the highest positive CI (CI = 1.949 during the daytime) and 0.335 at nighttime), making them the dominant drivers of surface warming (Figure 9). Grassland exhibited cooling effect with a CI of −1.3768, while forest land and water bodies showed moderate negative contributions. Farmland acted as a mild daytime cooling surface due to irrigation and crop growth, but its nighttime contribution was slightly positive. The diurnal contrast highlights the thermophysical differences between surface materials: wastelands absorb solar radiation rapidly under strong insolation but cool efficiently at night, whereas impervious surfaces, with high thermal inertia and low emissivity, retain heat and release it slowly, thereby dominating nighttime warming. Meanwhile, vegetated and water-covered areas maintained negative CI values throughout the diurnal cycle, confirming their sustained cooling capacity.
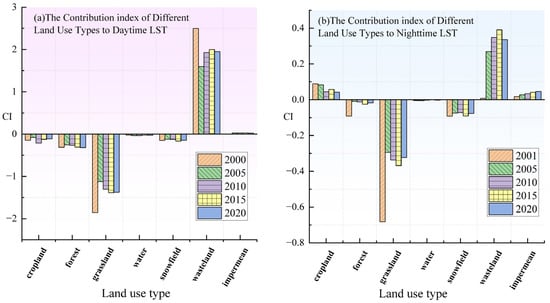
Figure 9.
Contribution of different land use types to the regional thermal environment in the UMA from 2001 to 2020.
From 2001 to 2020 the CI results indicate that wastelands and impervious surfaces consistently contributed positively to LST increases, while grasslands, forests, and water bodies provided stable cooling effects. The thermal environment of the UMA thus reflects a dynamic balance between urban expansion and ecological space contraction, emphasizing the importance of enhancing vegetation coverage and optimizing land structure to mitigate regional heat accumulation.
3.3. Machine Learning-Based Analysis of LST Drivers
3.3.1. Model Performance and Validation
The performance of the XGBoost model was rigorously evaluated using RMSE, MAE, and the R2 on both the training and test sets for the years 2001, 2005, 2010, 2015, and 2020. The detailed results are presented in Table 3.
Table 3.
Evaluation Metrics of the XGBoost Model.
The model demonstrates strong and consistent predictive performance across all years. The R2 values consistently exceed 0.91 for both the training and test sets, indicating that the model explains a high proportion of the variance in the dependent variable. The close alignment between the training and test set metrics for RMSE and MAE across all time periods suggests that the model generalizes well without significant overfitting.
3.3.2. Relative Importance of Driving Factors
Figure 10 shows the SHAP-based relative importance of candidate driving factors for daytime LST across the five study years. A prominent and consistent finding is that DEM is the dominant driver of surface temperature in the UMA, with SHAP importance values substantially larger than those of other predictors (e.g., roughly 2.8–3.7 across 2001–2020). This indicates that topographic control—through its influence on radiative balance, boundary-layer processes and air temperature lapse rates—strongly governs spatial LST variation in this mountainous-basin environment.
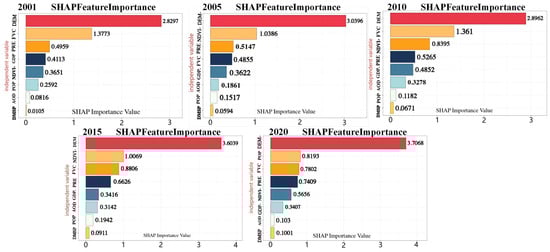
Figure 10.
SHAP Importance Bar Chart.
Vegetation-related metrics (FVC/NDVI) form the second-most influential group and generally act as cooling factors, while PRE also ranks high in several years, reflecting climatic modulation of soil moisture and vegetation cooling capacity. Socioeconomic indicators (GDP, POP, DMSP) show lower SHAP importance but exhibit a tendency to increase in recent years, suggesting a growing anthropogenic contribution to local warming as urbanization progresses. Other variables (AOD, DMSP) contribute less overall but may be locally relevant under specific conditions.
Natural topographic and climatic controls remain primary, whereas human-driven land surface changes and urbanization increasingly influence LST patterns. This outcome underscores the need to integrate topography explicitly when interpreting UHI and land-use impacts in arid mountainous-basin cities.
3.3.3. Nonlinear Relationships and Threshold Effects
The SHAP dependence plots (Figure 11) reveal clear nonlinear and threshold effects among the major drivers of daytime LST in the UMA. These results demonstrate the combined regulation of natural, biophysical, and socioeconomic factors on LST. DEM shows a strong negative relationship with LST, where low-lying areas correspond to higher SHAP values and thus stronger warming. This pattern highlights the fundamental topographic control of radiation balance and heat accumulation in the mountainous–basin setting of the UMA.
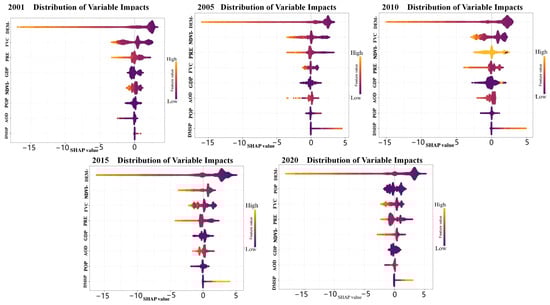
Figure 11.
Beeswarm plot of predictor importance, 2001–2020.
Vegetation indicators exhibit pronounced cooling effects with a clear threshold: SHAP values decline sharply as vegetation increases but stabilize once NDVI exceeds ~0.5, indicating diminishing returns of additional greening. PRE also has a negative yet nonlinear relationship with LST—moderate increases in rainfall enhance soil moisture and evapotranspiration, but the cooling effect weakens beyond a certain level.
In contrast, socioeconomic variables show positive and accelerating SHAP responses, reflecting intensified anthropogenic heat emissions and surface sealing. Their influence strengthens notably in 2020, confirming the growing role of urbanization in regional warming. These nonlinear interactions quantitatively validate the coupling mechanism of “land use transition–thermal environment effect.” Natural factors (DEM, PRE, vegetation) shape the baseline thermal pattern, while human-driven processes increasingly amplify surface heating, emphasizing the dual control of topography and urbanization in arid metropolitan systems.
4. Discussion
4.1. Spatial and Temporal Variation in Surface Temperature in UMA
The coupling mechanism between land use and the thermal environment in the UMA can be conceptualized as the interaction among land surface physical properties, biophysical feedbacks, and anthropogenic influences. As a typical urban agglomeration in an arid region, from 2001 to 2020, the overall LST exhibited an upward trend. This variation is associated with the continuous increase in impervious surfaces and the decline in vegetation coverage. But the observed cooling in parts of the suburban and farmland areas at night can be attributed to the unique local meteorological and topographic conditions of the arid region. some of these cooling areas are located in foothill or valley regions. During the night, cold, dense air drains down slopes due to gravity and accumulates in these topographical depressions, forming ‘cold air lakes.’ [,] Under stable atmospheric conditions, this effect can significantly amplify the nocturnal cooling in these localized areas, overriding the broader background warming trend. In contrast, cropland and forested areas, functioning as primary cold sources, effectively mitigated surface warming through their higher evapotranspiration rates, emphasizing the fundamental importance of ecological land in regional thermal regulation [].
The Moran’s I results show that the LST of the UMA exhibited spatial autocorrelation both during the day and at night, though it slightly declined over time. This suggests a weakening of the spatial clustering of the thermal environment and a gradual diffusion of the urban heat field []. Such a pattern implies that the heat island effect is no longer confined to individual city centers but is expanding into a metropolitan-scale spatial network, displaying a “multi-core coupling” pattern. This spatial diffusion of heat indicates a decreasing local climate regulation capacity and the continuous weakening of ecological carrying capacity under urban expansion. H-H Clusters: Identifying these as the “core heating zones” or “thermal intervention priority areas.” The mitigation efforts (e.g., cool materials, targeted green infrastructure) must be strategically concentrated within these statistically significant clusters to achieve maximum efficiency and impact. Their persistence over time indicates entrenched thermal issues that require targeted, high-intensity mitigation.
The movement of the SDE’s center and its orientation closely mirrors the direction of major urban sprawl and infrastructure development as seen in our land use change maps. This implies that the spatial trajectory of the region’s warming is directly steerable by urban planning decisions. The SDE shift provides a macroscopic, quantitative measure of how the entire thermal landscape is being reshaped by asymmetric urban growth.
Compared with humid-region cities, the mechanisms of heat island formation in arid cities are distinctive []. First, under arid climatic conditions, low air humidity and sparse vegetation lead to insufficient latent heat flux, while the proportion of sensible heat is much higher, causing surface temperatures to rise rapidly. Second, the stark differences in underlying surface types—particularly the high albedo and high heat capacity of bare land and wasteland—result in rapid daytime heat absorption and slow nocturnal heat release, forming a “thermal memory” effect [,]. Moreover, weak wind speeds and limited vertical air mixing further reduce the dissipation of heat within the urban interior. These factors collectively endow the UMA’s heat island effect with characteristics of persistence, intensity, and low dissipation. The overall upward trend of daytime and nighttime LST observed in the UMA is broadly consistent with recent regional studies showing warming in arid and semi-arid zones, where LST increase is concentrated in lowland and human-dominated areas. For example, a Xinjiang-wide analysis reported a warming tendency with strong topographic imprints and identified elevation, precipitation and vegetation as key controls of LST variability [].
4.2. Driving Effects of Land Use Structure Adjustment on Thermal Pattern and Implications for Urban Sustainability
Population growth serves as the fundamental socioeconomic driver behind land use change and the evolution of the surface thermal environment. During the observation period, the permanent resident population of the UMA increased steadily from approximately 2.09 million in 2001 to 4.05 million in 2020, exhibiting a clear pattern of intensified spatial agglomeration. The POP growth was highly concentrated in the urban core, while suburban and county areas experienced relatively slow expansion.
This continuous demographic increase has directly accelerated urbanization and the conversion of ecological and agricultural lands into built-up areas. As a result, impervious surfaces expanded, fundamentally altering the physical properties and energy balance of the land surface. Although barren land remains the dominant land type, this transformation led to a substantial regional LST increase. While some ecological land—such as forests and wetlands—has partially recovered through ecological restoration projects, its cooling contribution remains insufficient to offset the warming induced by urbanization. The results indicate that optimizing land use structure and increasing the proportion of ecological space are key strategies for mitigating the heat island effect. It is recommended that urban master planning strengthen the networked configuration of green space systems and construct a “corridor–patch–node” integrated ventilation and cooling framework. At the same time, the expansion of impervious surfaces should be strictly controlled, and surface evapotranspiration capacity enhanced through measures such as green roofs and permeable pavements []. At the metropolitan scale, coordinated governance should be promoted through regional ecological compensation mechanisms and ecological security pattern planning, achieving spatial equilibrium of the thermal environment and enhancing ecological resilience.
4.3. Machine Learning Interpretation of LST Driving Mechanisms in the UMA
The machine learning analysis using the XGBoost–SHAP framework provides new insights into the hierarchical and nonlinear mechanisms driving LST variation in the UMA []. Among all factors, DEM exhibited the highest SHAP importance throughout the study period (2001–2020), underscoring the dominant role of topography in shaping the spatial heterogeneity of LST, this align with multiple recent findings that emphasize the primary role of topography and hydroclimatic conditions in arid environments []. Similar analyses across arid cities and regions have shown that while socioeconomic indicators significantly contribute to local LST increases, natural background variables often control the large-scale spatial framework [].
The integration of XGBoost–SHAP results quantitatively validates the coupling mechanism, revealing how natural, biophysical, and anthropogenic drivers jointly regulate LST patterns. Lower elevation basins, where human activities are concentrated, showed higher LST, while mountainous regions exhibited pronounced cooling effects driven by enhanced airflow and vegetation coverage.
Vegetation-related indicators were identified as the second-most influential group, generally exerting significant cooling effects. However, SHAP dependence plots indicated a nonlinear pattern, where the cooling effect strengthened rapidly with NDVI increase below 0.4 but plateaued beyond this threshold. This diminishing return effect suggests that vegetation’s thermal regulation in arid environments is limited by water availability and soil moisture.
PRE also contributed to LST regulation, mainly through modulating vegetation activity and surface moisture. In contrast, socioeconomic factors showed relatively smaller but steadily increasing SHAP importance values over time, reflecting the growing influence of anthropogenic heat sources and urban expansion on LST.
A comparison with prior work further clarifies the novelty of this study. Recent remote-sensing investigations in Urumqi have characterized LST spatial patterns and their relations with urban morphology [], but these studies primarily used regression or spatial-statistical approaches that do not explicitly decompose nonlinear interactions. Classic studies in arid cities such as Phoenix have long highlighted the roles of landscape heterogeneity and urban morphology in shaping surface temperatures [,]. Methodologically, emerging work applying interpretable XGBoost–SHAP to LST and urban morphology provides a direct precedent for our approach. Compared to earlier Urumqi studies, our integration of XGBoost with SHAP uniquely quantifies hierarchical driver importance and reveals threshold/ nonlinear responses (e.g., vegetation saturation, DEM control), thereby providing both a finer mechanistic interpretation and a transferable analytical framework for arid-region UHI studies.
These findings reveal that the spatial pattern of surface temperature in the UMA results from the joint control of natural topographic–climatic conditions and intensified human activities. The dominance of DEM highlights the persistent role of natural terrain, while the rising importance of socioeconomic factors demonstrates the accelerating thermal impact of urbanization.
These patterns are generally consistent with results reported for other arid-region cities, such as Phoenix and Tehran, where vegetation thresholds and topographic constraints similarly govern surface heat distribution []. Such consistency supports the reliability and generalizability of the XGBoost–SHAP model in analyzing the complex mechanisms of urban thermal environments in arid regions.
By integrating explainable machine learning into the analytical framework, this study not only quantifies the relative contributions of natural and human factors but also uncovers their nonlinear threshold effects. This provides a new perspective for optimizing urban spatial structure and improving heat mitigation strategies in arid metropolitan areas.
5. Conclusions
This study, integrating multi-period remote sensing and land use data from 2001 to 2020, comprehensively examined the spatiotemporal evolution of LST and its driving mechanisms in the UMA—a representative arid-region urban agglomeration in Northwest China. By combining classical spatial statistical methods with the XGBoost–SHAP machine learning framework, this research revealed the coupling process of “land use transition–thermal pattern response–driving mechanism,” providing an integrated understanding of urban thermal dynamics in arid environments.
1. Wasteland has long accounted for approximately 50% of the total land use in the study area with slight fluctuations, while the proportion of impervious surfaces has gradually increased. The transfer-in scale of impervious surfaces from multiple land use types has expanded, demonstrating the spatial expansion of the metropolitan area during the quality-improvement stage of urbanization. The proportion of grassland continued to decrease, falling from 37.58% in 2001 to 33.01% in 2020.
2. Over the past 20 years, the LST in the study area has shown an upward trend, with 71.75% of the area experiencing an insignificant temperature rise. Although the global Moran’s I remained consistently above 0.99, indicating a spatial autocorrelation of LST, the LISA analysis revealed clear local differentiation. The spatial clustering of LST in the UMA should be interpreted as globally strong but locally heterogeneous, reflecting the interplay between urban expansion and natural landscape controls.
3. Different land use types showed significant temperature differences between daytime and nighttime. During the daytime, the relative LST of impervious surfaces and wastelands remained at a high level. In 2020, grassland had a contribution value of −1.37 to the thermal environment, showing a significant cooling effect. Relying on irrigation and evapotranspiration cooling, grassland, forest land, and water bodies mainly contributed to cooling the regional thermal environment.
4. The XGBoost–SHAP framework effectively identified the relative importance and nonlinear effects of multiple environmental and socioeconomic variables on LST. DEM consistently exerted the strongest control, underscoring the influence of topographic heterogeneity on regional temperature patterns. PRE and vegetation indices acted as major cooling drivers, but their effects displayed threshold behaviors, with diminishing cooling benefits once NDVI exceeded moderate levels. In contrast, GDP, DMSP, and POP showed increasing SHAP importance over time, reflecting the growing contribution of urbanization to surface warming. This interpretable framework provides a transferable approach for understanding the land use–thermal environment coupling in other arid-region cities.
Supplementary Materials
The following supporting information can be downloaded at: https://www.mdpi.com/article/10.3390/land14112252/s1, Figure S1: Land use transfer matrix in the UMA from 2001 to 2020; Figure S2: Radar chart of diurnal temperature zone proportions; Figure S3: LST of different land use types in the UMA from 2001 to 2020; Figure S4: Model Performance and Validation. Table S1: Case of verification of 30m land use data resampling to 1000m accuracy; Table S2: Land Use Transfer Results from 2001 to 2020; Table S3: Proportion of day and night thermal environment area (%); Table S4: CI of different land use types to LST during the day; Table S5: CI of different land use types to LST during nighttime; Text S1. Formulas for Standard Deviation Ellipse (SDE) and Centroid Migration; Text S2. Bivariate Spatial Autocorrelation [,,].
Author Contributions
B.S.: Conceptualization, Methodology, Writing—original draft. A.K.: Funding acquisition, Conceptualization, Supervision, Methodology. All authors have read and agreed to the published version of the manuscript.
Funding
This work was funded by National Natural Science Foundation of China (No. 42361030); The Third Xinjiang Scientific Expedition Program, grant number (No. 2021xjkk0905).
Data Availability Statement
Data will be made available on request.
Conflicts of Interest
The authors declare no conflicts of interest. The funders had no role in the design of the study; in the collection, analyses, or interpretation of data; in the writing of the manuscript; or in the decision to publish the results.
References
- Wenhui, K. Advance and future prospects of urban land use/cover change and ecological regulation of thermal environment. Sci. Geogr. Sin. 2018, 38, 1643–1652. [Google Scholar]
- Lee, D.; Oh, K. Developing the urban thermal environment management and planning (UTEMP) system to support urban planning and design. Sustainability 2019, 11, 2224. [Google Scholar] [CrossRef]
- Zhang, X.; Wei, W.; Zhou, L.; Guo, Z.; Li, Z.; Zhang, J.; Xie, B. Analysis on spatio-temporal evolution of ecological vulnerability in arid areas of northwest China. Acta Ecol. Sin. 2021, 41, 4707–4719. [Google Scholar] [CrossRef]
- Huang, J.; Han, W.; Zhang, Z.; Ning, S.; Zhang, X. The decoupling relationship between land use efficiency and carbon emissions in China: An analysis using the socio-ecological systems (SES) framework. Land Use Policy 2024, 138, 107055. [Google Scholar] [CrossRef]
- Yang, X.; Chen, B.; Hu, K. A review of impacts of urbanization on extreme heat events. Prog. Geogr. 2015, 34, 1219–1228. [Google Scholar]
- Liu, H.; Jiang, L.; Liu, B.; Liu, R.; Xiao, Z. Characteristics of drought in China and its effect on vegetation change in recent 40 years. Acta Ecol. Sin. 2023, 43, 7936–7949. [Google Scholar]
- Luo, M.; Meng, F.; Wang, Y.; Sa, C.; Bao, Y.; Liu, T. Mutual feedback relationship between vegetation GPP and soil moisture in China under climate change. Acta Geogr. Sin. 2024, 79, 218–239. [Google Scholar]
- Chen, F.-G.; Guo, A.-Q.; Wu, A.-B.; Wang, Y.-T.; Fan, J. Evolution of urban expansion pattern and its impact on the quality of the ecological environment in the beijing-tianjin-hebei urban agglomeration. Huan Jing Ke Xue = Huanjing Kexue 2025, 46, 3708–3719. [Google Scholar]
- Amindin, A.; Pouyan, S.; Pourghasemi, H.R.; Yousefi, S.; Tiefenbacher, J.P. Spatial and temporal analysis of urban heat island using landsat satellite images. Environ. Sci. Pollut. Res. 2021, 28, 41439–41450. [Google Scholar] [CrossRef]
- Nadizadeh Shorabeh, S.; Hamzeh, S.; Zanganeh Shahraki, S.; Firozjaei, M.K.; Jokar Arsanjani, J. Modelling the intensity of surface urban heat island and predicting the emerging patterns: Landsat multi-temporal images and Tehran as case study. Int. J. Remote Sens. 2020, 41, 7400–7426. [Google Scholar] [CrossRef]
- Lioubimtseva, E.; Cole, R.; Adams, J.; Kapustin, G. Impacts of climate and land-cover changes in arid lands of central asia. J. Arid. Environ. 2005, 62, 285–308. [Google Scholar] [CrossRef]
- Ya, P.; Juanjuan, W.; Shanshan, W.; Liulan, T.; Jie, L.; Zhaopeng, W. Spatiotemporal pattern evolution of land use conflict in urumqi city from the perspective of ecological security. Arid. Land. Geogr. 2024, 47, 81–92. [Google Scholar]
- Liu, Y.; Tao, H.; Zhu, J.; Mondal, S.K.; Bakhtiyorov, Z. Assessment of ecological vulnerability in xinjiang uygur autonomous region, China. Res. Cold Arid. Reg. 2025. [Google Scholar] [CrossRef]
- Chen, S.; Halik, Ü.; Shi, L.; Fu, W.; Gan, L.; Welp, M. Habitat quality dynamics in urumqi over the last two decades: Evidence of land use and land cover changes. Land 2025, 14, 84. [Google Scholar] [CrossRef]
- Wei, B.; Kasimu, A.; Reheman, R.; Zhang, X.; Zhao, Y.; Aizizi, Y.; Liang, H. Spatiotemporal characteristics and prediction of carbon emissions/absorption from land use change in the urban agglomeration on the northern slope of the tianshan mountains. Ecol. Indic. 2023, 151, 110329. [Google Scholar] [CrossRef]
- Sun, Q.; Zhou, L.; Tang, X.; Sun, D.; Dang, X. Spatial influence and prediction of oasis urban expansion on cultivated land in arid areas: A case study of the hexi corridor. J. Nat. Resour. 2021, 36, 1008–1020. [Google Scholar] [CrossRef]
- Jumai, M.; Kasimu, A.; Liang, H.; Tang, L.; Aizizi, Y.; Zhang, X. A Study on the Spatial and Temporal Variation of Summer Surface Temperature in the Bosten Lake Basin and Its Influencing Factors. Land 2023, 12, 1185. [Google Scholar] [CrossRef]
- Mamattursun, A.; Yang, H.; Ablikim, K.; Obulhasan, N. Spatiotemporal evolution and driving forces of vegetation cover in the Urumqi River Basin. Int. J. Environ. Res. Public. Health 2022, 19, 15323. [Google Scholar] [CrossRef]
- Shen, Z.; Zeng, J. Spatial relationship of urban development to land surface temperature in three cities of southern fujian. Acta Geogr. Sin. 2021, 76, 566–583. [Google Scholar]
- Yu, W.; Yang, J.; Cong, N.; Ren, J.; Yu, H.; Xiao, X.; Xia, J. Attribution of urban diurnal thermal environmental change: Importance of global–local effects. IEEE J. Sel. Top. Appl. Earth Obs. Remote Sens. 2023, 16, 8087–8101. [Google Scholar] [CrossRef]
- Chen, T.; Zhou, S.; Kang, R.; Kaufmann, H.; Wang, Y.; Chen, H. Impact of land transformation processes in eastern China on the long-term development of land surface temperatures. Geocarto Int. 2024, 39, 2322063. [Google Scholar] [CrossRef]
- Kim, M.; Kim, D.; Kim, G. Examining the relationship between land use/land cover (LULC) and land surface temperature (LST) using explainable artificial intelligence (XAI) models: A case study of Seoul, South Korea. Int. J. Environ. Res. Public. Health 2022, 19, 15926. [Google Scholar] [CrossRef] [PubMed]
- Sagi, O.; Rokach, L. Approximating XGBoost with an interpretable decision tree. Inf. Sci. 2021, 572, 522–542. [Google Scholar] [CrossRef]
- Subedi, B.; Morneau, A.; LeBel, L.; Gautam, S.; Cyr, G.; Tremblay, R.; Carle, J.-F. An xgboost-based machine learning approach to simulate carbon metrics for forest harvest planning. Sustainability 2025, 17, 5454. [Google Scholar] [CrossRef]
- Takefuji, Y. Beyond xgboost and SHAP: Unveiling true feature importance. J. Hazard. Mater. 2025, 488, 137382. [Google Scholar] [CrossRef]
- Cao, B.; Chen, Q.; Du, M.; Cheng, Q.; Li, Y.; Liu, R. Simulation analysis of the cooling effect of urban water bodies on the local thermal environment. Water 2022, 14, 3091. [Google Scholar] [CrossRef]
- Sachsen, T.; Ketzler, G.; Knörchen, A.; Schneider, C. Past and future evolution of nighttime urban cooling by suburban cold air drainage in aachen. DIE Erde–J. Geogr. Soc. Berl. 2013, 144, 274–289. [Google Scholar]
- Rochette Cordeiro, A.M.; Ornelas, A.; Silva, D.D. The importance of topography in the formation of cold-air pooling in urban spaces. The example of the city of Coimbra (Portugal). Theor. Appl. Clim. 2023, 152, 227–239. [Google Scholar] [CrossRef]
- Abulimiti, A.; Liu, Y.; Tang, J.; Mamtimin, A.; Yao, J.; Zeng, Y.; Abulikemu, A. Urbanization effect on regional thermal environment and its mechanisms in arid zone cities: A case study of urumqi. Remote Sens. 2024, 16, 2939. [Google Scholar] [CrossRef]
- Xu, H.; Li, C.; Wang, H.; Zhou, R.; Liu, M.; Hu, Y. Long-term spatiotemporal patterns and evolution of regional heat islands in the Beijing–Tianjin–Hebei urban agglomeration. Remote Sens. 2022, 14, 2478. [Google Scholar] [CrossRef]
- Shou, Y.; Zhang, D. Recent advances in understanding urban heat island effects with some future prospects. Acta Meteorol. Sin. 2012, 70, 338–353. [Google Scholar]
- Zhang, Z.; Wu, Q.; Xun, X.; Hou, Y.; Gao, S. Analysis on thermal physical properties of different ground types. J. Chang Univ. (Nat. Sci. Ed.) 2015, 35, 41–47. [Google Scholar]
- Bindajam, A.A.; Mallick, J.; AlQadhi, S.; Singh, C.K.; Hang, H.T. Impacts of vegetation and topography on land surface temperature variability over the semi-arid mountain cities of Saudi Arabia. Atmosphere 2020, 11, 762. [Google Scholar] [CrossRef]
- Zhang, M.; Cao, Y.; Zhang, Z.; Zhang, X.; Liu, L.; Chen, H.; Gao, Y.; Yu, F.; Liu, X. Spatiotemporal variation of land surface temperature and its driving factors in xinjiang, China. J. Arid. Land 2024, 16, 373–395. [Google Scholar] [CrossRef]
- Zhi, L.; Peng, L.; Qiang, L. Study on a model of water surface growth and its driving factors in large cities along the middle reaches of the Yangtze River. Acta Ecol. Sin. 2018, 38, 3766–3774. [Google Scholar] [CrossRef]
- Shui, C.; Shan, B.; Li, W.; Wang, L.; Liu, Y. Investigating the influence of land cover on land surface temperature. Adv. Space Res. 2025, 75, 2614–2631. [Google Scholar] [CrossRef]
- Ma, X.; Yang, J.; Zhang, R.; Yu, W.; Ren, J.; Xiao, X.; Xia, J. XGBoost-based analysis of the relationship between urban 2-D/3-D morphology and seasonal gradient land surface temperature. IEEE J. Sel. Top. Appl. Earth Obs. Remote Sens. 2024, 17, 4109–4124. [Google Scholar] [CrossRef]
- Wang, J.; Chen, X.; Zhang, J. Spatial differences and influencing factors of land surface temperature in xinjiang: A county-level study. Theor. Appl. Climatol. 2025, 156, 229. [Google Scholar] [CrossRef]
- Fan, J.; Chen, X.; Xie, S.; Zhang, Y. Study on the response of the summer land surface temperature to urban morphology in urumqi, china. Sustainability 2023, 15, 15255. [Google Scholar] [CrossRef]
- Buyantuyev, A.; Wu, J. Urban heat islands and landscape heterogeneity: Linking spatiotemporal variations in surface temperatures to land-cover and socioeconomic patterns. Landsc. Ecol. 2010, 25, 17–33. [Google Scholar] [CrossRef]
- Imhoff, M.L.; Zhang, P.; Wolfe, R.E.; Bounoua, L. Remote sensing of the urban heat island effect across biomes in the continental USA. Remote Sens. Environ. 2010, 114, 504–513. [Google Scholar] [CrossRef]
- Olgun, R.; Karakuş, N.; Selim, S.; Yilmaz, T.; Erdoğan, R.; Aklıbaşında, M.; Dönmez, B.; Çakır, M.; Ardahanlıoğlu, Z.R. Impacts of landscape composition on land surface temperature in expanding desert cities: A case study in arizona, USA. Land 2025, 14, 1274. [Google Scholar] [CrossRef]
Disclaimer/Publisher’s Note: The statements, opinions and data contained in all publications are solely those of the individual author(s) and contributor(s) and not of MDPI and/or the editor(s). MDPI and/or the editor(s) disclaim responsibility for any injury to people or property resulting from any ideas, methods, instructions or products referred to in the content. |
© 2025 by the authors. Licensee MDPI, Basel, Switzerland. This article is an open access article distributed under the terms and conditions of the Creative Commons Attribution (CC BY) license (https://creativecommons.org/licenses/by/4.0/).