Abstract
Water resource management and agricultural practices in the Mediterranean region, characterised by the excessive use of pesticides, pose significant environmental and human health challenges. As they can be easily and inexpensively produced from various biomass sources, biochars are frequently recommended as a low-cost secondary decontamination strategy to address soil contamination problems. This study investigates the properties and sorption behaviours of biochars produced in a low-cost metallic kiln using local rosemary, giant reed, St. John’s wort, olive, cypress, and palm tree biomass residues to evaluate their potential for environmental remediation, with a special focus on the mobility and retention of contaminants. Analytical and experimental techniques were employed to characterise the biochars’ physicochemical attributes and sorptive capacities. The core analyses included measurement of basic physicochemical properties, including pH, electrical conductivity, functional group identification via Fourier transform infrared (FTIR) spectroscopy, and the molarity of ethanol droplet (MED) test to assess the surface hydrophobicity. Batch sorption experiments were conducted using methylene blue (MB) and two fluorescent tracers—uranine (UR) and sulforhodamine-B (SRB)—as proxies for organic contaminants to assess the adsorption efficiency and molecule–biochar interactions. Furthermore, the adsorption isotherms at 20 °C were fitted to different models to assess the biochars’ specific surface areas. Thermodynamic parameters were also evaluated to understand the nature and strength of the adsorption processes. The results highlight the influence of feedstock type on the resulting biochar’s properties, thus significantly affecting the mechanism of adsorption. Rosemary biochar was found to have the highest specific surface area (SSA) and cation exchange capacity (CEC), allowing it to adsorb a wide range of organic molecules. Giant reed and palm tree biochars showed similar properties. In contrast, wood-derived biochars generally showed very low SSA, moderate CEC, and low hydrophobicity. The contrasting properties of the three dyes—MB (cationic), UR (anionic), and SRB (zwitterionic)—enabled us to highlight the distinct interaction mechanisms between each dye and the surface functional groups of the different biochars. The reactivity and sorption efficiency of a biochar depend strongly on both the nature of the target molecule and the intrinsic properties of the biochar, particularly its pH. The findings of this study demonstrate the importance of matching biochar characteristics to specific contaminant types for optimised environmental applications, providing implications for the use of tailored biochars in pollutant mitigation strategies.
1. Introduction
Sustainable land management is increasingly threatened by climate change and intensive agriculture. In the Mediterranean, irregular but intense rainfall events coupled with fragile soils amplify the leaching and runoff of agrochemicals, especially pesticides. In this context, pesticide-based pest management practices not only lead to soil and water quality degradation but also undermine biodiversity, ecosystem services, and human health [,,,]. According to the Food and Agriculture Organization (FAO), the mean rate of pesticide application in Tunisia is 0.65 kg/ha, in contrast to the global average of 2.4 kg/ha. Despite this relatively low rate of application, certain regions may experience elevated levels of contamination, particularly in surface water bodies [,]. Furthermore, numerous studies have reported significant contamination with pesticides and emerging pollutants in groundwater sources [,]. Addressing pesticide contamination is thus central to maintaining productivity and resilience in this region. While various mitigation strategies—such as integrated pest management and advanced filtration systems—have been explored, they often face limitations regarding scalability and cost-effectiveness. At the same time, the Mediterranean agricultural sector faces persistent challenges in managing crop residues. In Tunisia, the production of essential oil from rosemary and other aromatic plants, such as cypress and St. John’s wort, generates substantial biomass residues, amounting to approximately 5460 tonnes annually for rosemary. The olive and palm agricultural sectors are very important in this regard, with 70 million olive trees and 5 million palm trees, leading to a residue potential of 5 million and 198,000 tons of olive wood and leaves, respectively [,,,,,,]. Burning or uncontrolled decomposition of residues contributes to greenhouse gas emissions, air contamination with particulate emissions, soil contamination [], and resource inefficiency [,]. The valorisation of residues remains limited and mostly at the research stage, highlighting an untapped opportunity for sustainable resource management. Circular strategies that valorize agricultural by-products could therefore enhance both soil restoration and environmental protection. Biochar—a carbon-rich product of biomass pyrolysis, typically at temperatures between 300 and 700 °C—offers such potential. Biochar has gained attention due to its porous structure and functional surface groups, allowing it to immobilize pesticides and other contaminants, thus reducing their mobility and bioavailability in soils and water systems [,,,,,,,]. Although recent studies have highlighted the potential of biochar for environmental remediation, its performance is highly variable. Key factors influencing its efficiency include the feedstock type, pyrolysis temperature, and the physicochemical properties of both the biochar and target pollutants []. Understanding the mechanisms underlying the activity of biochar is essential to promote the valorisation of agricultural and agri-food residues within a circular economy framework. The transformation of these residues into biochars tailored to local conditions offers a sustainable pathway for waste management and soil improvement. However, the high variability in feedstock types, pyrolysis conditions, and resulting physicochemical properties makes the performance of biochar highly case-specific. Reducing these variabilities and establishing standardized characterization and application criteria are crucial steps toward dedicating biochar as a reliable tool for sustainable soil management and environmental remediation. Critically, little is known about the efficacy of biocharunder Mediterranean land-use conditions, where unique climatic and soil dynamics influence contaminant transport. This study investigates how locally derived biochars interact with model contaminants under conditions representative of Mediterranean agriculture. Using different molecules, such as methylene blue, uranine, and sulforhodamine-B, as pesticide proxies, we aim to (i) characterise the adsorption properties of biochars produced from different local feedstocks, (ii) evaluate the influence of pyrolysis temperature on retention performance, and (iii) identify the mechanisms governing biochar–contaminant interactions. By linking biomass valorisation with soil remediation, our findings contribute to sustainable land management strategies that address both pesticide mitigation and agricultural residue utilization in Mediterranean agroecosystems.
2. Materials and Methods
A schematic representation of the study design is shown in Figure 1.
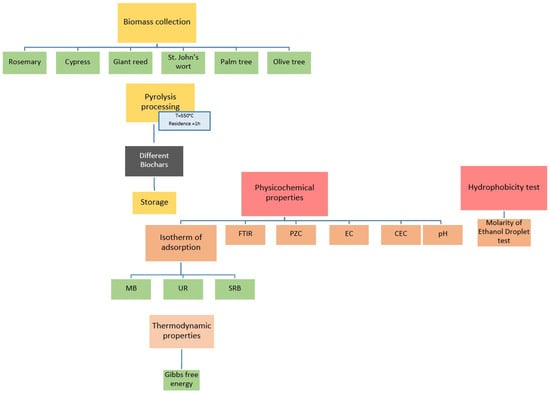
Figure 1.
Schematic representation of the methodological approach.
2.1. Biochar Production
Biochar was produced from six distinct biomass sources: stems and leaves of rosemary (Salvia rosmarinus), stem of giant reed (Arundo donax), leafless cypress (Cupressus sempervirens) branches, midrib of Mexican fan palm tree (Washingtonia robusta), branches of olive tree (Olea europea), and stem and leaves of St. John’s wort (Hypericum perforatum). These biomass materials were pyrolysed in a custom-built metal kiln consisting of two cylindrical steel containers: an inner cylinder, which serves as the reactor where biomass is pyrolysed under oxygen-free conditions, and an outer cylinder, where heating is provided by gas burners fuelled with butane. Eventually, the biogas produced from the biomass is also used as fuel. During the pyrolysis process, the kiln temperature was monitored and maintained at 550 °C for a residence time of 1 h. The average yield obtained during our study was around 35% for all type of biomass. In addition to these laboratory-produced biochars, we also tested traditionally produced olive tree charcoal following the earth mound kilning method, for which no pyrolysis temperature was available. This method consists of stacking wood in a conical or dome-shaped mound approximately 3 m in diameter and 1.5 m high, which is then covered with seaweed and a thick layer of earth to restrict air entry. The carbonization process generally lasts two to three days and leads to an average yield of about 20–25% [].
2.2. Basic Chemical Properties of Biochars
Several fundamental soil properties—pH, electrical conductivity (EC), cation exchange capacity, and exchangeable cations—were measured for the different types of biochar. The pH of the biochar samples was determined at room temperature using a glass electrode pH meter. Before measurement, the pH meter was calibrated with buffer solutions at pH 4, 7, and 10 to ensure accuracy. Biochar pH was measured in a 1:20 (w/v) biochar-to-water ratio using deionised water []; specifically, 1 g of biochar was mixed with 20 mL of deionised water in a 50 mL glass bottle and shaken for 1 h to allow for equilibration. Electrical conductivity was also measured in a 1:20 biochar-to-water ratio using a pre-calibrated EC meter. Both pH and EC measurements were performed in triplicate to enhance reliability and reproducibility [,].
The CEC and exchangeable cations in the biochar samples were determined using the cobalt hexamine method at their natural pH, following the protocol of Ciesielski et al. (1997) []. Exchangeable cations were displaced using an excess solution of cobalt hexamine chloride , which does not alter the biochar’s pH. This reagent enables the exchange of both basic and acidic cations. The biochar was saturated with excess cobalt hexamine cations, and the displaced exchangeable cations were directly measured in the same solution.
CEC was calculated as the difference between the amount of cobalt hexamine added and the amount remaining in solution, with the adsorbed representing the biochar’s CEC. Exchangeable cations and concentrations were quantified using ICP spectrometry.
2.3. Adsorption Experiments
Batch adsorption experiments were conducted to study the isotherm of methylene blue adsorption [,] onto biochar. For each experiment, 0.3 g of prepared biochar was accurately weighed using an analytical balance (±0.0001 g precision) and added to 50 mL centrifuge tubes. Methylene blue solutions with initial concentrations ranging from 0.25 to 800 mg/L were prepared by diluting a 1000 mg/L stock solution with deionised water. To each biochar-containing centrifuge tube, 40 mL of 0.01 M CaCl2 solution was added. The tubes were then placed on a rotator set to 70 rpm for 24 h to ensure equilibrium was reached. After the equilibration period, the tubes were centrifuged at 3000 rpm for 20 min. Subsequently, a 3 mL aliquot of the supernatant was collected using a syringe and filtered through a 0.2 m membrane filter for UV–visible spectrophotometer analysis. Methylene blue solutions with known concentrations were prepared to calibrate the measurements.
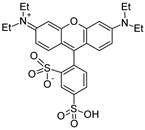
In this research, two fluorescent dyes were selected to study isotherm adsorption onto biochar. Uranine is widely used for groundwater tracing, which has a single carboxyl functional group and no positive charge. UR is highly soluble in water, with moderate hydrophobicity and a negative charge developing at a pH greater than 8.7. The second dye is sulforhodamine B, which is more hydrophilic than UR and has greater solubility. It has a permanent positive charge and, under environmental pH conditions, behaves as a zwitterion. Sene et al. (2023) [] suggested that SRB can serve as a promising proxy for studying the behaviour of hydrophobic pesticides. Lange et al. (2018) [] found that SRB could mimic the behaviour of S-Metalachlor, a hydrophobic herbicide. The main purpose of choosing uranine and sulforhodamine B as proxies to study pesticide adsorption onto biochars was to simulate the behaviours of pesticides through adsorption experiments, providing insight into key mechanisms. These dyes are commonly used as they share physicochemical properties (e.g., aromaticity, molecular structure, and functional groups) with contaminants such as pesticides, allowing us to draw parallels regarding adsorption behaviour []. The properties of the utilised molecules are summarised in Table 1. For each experiment, precisely 0.3 g of the prepared biochar was measured using an analytical balance with a precision of ±0.0001 g and placed into 50 mL centrifuge tubes. The UR solutions were prepared at concentrations of 0.0125, 0.025, 0.100, 0.400, 0.600, and 0.800 mg/L, while the SRB solutions were adjusted to concentrations of 0.025, 0.100, 0.400, 0.600, 0.800, 1, and 2 mg/L. All concentrations were prepared through the dilution of a 1000 mg/L stock solution with deionised water. A 0.01 M CaCl2 solution was used as the background electrolyte, 30 mL of which was added to each biochar-containing centrifuge tube. Then, the tube was placed on a rotator set to 150 rpm for 24 h to ensure that equilibrium was reached. After the equilibration period, the tubes were centrifuged at 4500 rpm for 20 min. A 3 mL aliquot of the supernatant was then drawn with a syringe and passed through a 0.2 m membrane filter for filtration. The contents of SRB and UR were analysed separately with a fluorescence spectrophotometer. The excitation/emission wavelengths for UR were 490/512 nm while, for SRB, they were 564/586 nm. To calibrate the measurements, UR and SRB solutions with known concentrations were prepared. All experiments were conducted in triplicate to ensure statistical reliability, with results reported as mean values.

Table 1.
Physicochemical properties of the used tracers.
The amount of methylene blue and the fluorescent dyes adsorbed onto biochar at equilibrium, denoted as (mg/g), were calculated according to Equation (1):
where and represent the initial and equilibrium concentrations of the supernatant (mg/L), respectively; V is the solution volume (L); and is the biochar weight (g). Adsorption was performed until the maximum plateau value (mg/g) corresponding to a monolayer adsorption of methylene blue covering the whole biochar surface was reached. The theoretical adsorption models of Freundlich (Equation (2)) and Langmuir (Equation (3)) were fitted to the experimental data:
where (mg(1−n)Ln/g) and (L/g) are the distribution factors for the Freundlich and Langmuir equations, respectively; (mg/g) is the maximum absorption value; n (dimensionless) is an empirical parameter; and (mg/L) is the amount of dye adsorbed at equilibrium. Considering a monolayer of methylene blue adsorbed onto the surface of biochar when is reached, and knowing the molar surface area () of methylene blue (782,878 ), the specific surface area (SSA) can be derived [,,,] using the following equation:
where represents the molar mass of methylene blue (320 ).
2.4. Thermodynamic Properties
Thermodynamic parameters are crucial for quantifying the strength of physicochemical bonds in adsorption processes. In particular, the Gibbs free energy change in adsorption () is directly related to the Langmuir constant (), which acts as an equilibrium constant, providing insight into the spontaneity and favourability of adsorption [,]:
where R is the universal gas constant (8.314 J/mol·K), T is the temperature (K), and is a dimensionless value derived from :
where is the molar mass of biochar, which can be considered to be 994 g/mol with respect to the generic chemical formula for biochar , and is the molar volume of water (0.018 L/mol). The magnitude of is commonly used to distinguish between different adsorption mechanisms:
- Physisorption ( kJ/mol): Dominated by weak van der Waals forces, typically reversible.
- Strong physisorption or weak chemisorption ( kJ/mol): Involves hydrogen bonding or dipole interactions, stronger than van der Waals forces but weaker than covalent bonding.
- Chemisorption ( kJ/mol): Characterised by strong covalent or ionic bonding, often irreversible or requiring significant energy for desorption.
These thermodynamic insights help to determine the nature and stability of adsorption, which influences material selection for adsorption-based applications.
2.5. Determination of the Point of Zero Charge
The point of zero charge (PZC) is characterised as the pH level at which the surface charge becomes neutral under specified temperature, pressure, and solution conditions. It is important to determine this value for adsorption processes as the adsorbent is positively charged below the PZC, whereas it is negatively charged for pH values higher than the PZC [,]. The procedure for determining PZC was similar to the method described by Al-Maliky et al. (2021) []. Twenty-one glass bottles were divided into 3 groups (7 bottles for each group). One gram of biochar was placed in each glass bottle. For each group, the seven bottles were filled initially following the same ratio, as detailed in Table 2. Each group was assigned a different concentration of KCl (0.1, 1, or 2 M) to test varying ionic strengths. Measurements at various ionic strengths allow for confirmation of whether PZC represents an intrinsic surface property of biochar or is influenced by electrolyte-specific adsorption, providing insight into the electrostatic stability of biochar surfaces [,,,]. The bottles in each group were filled with mixtures of 0.1 M HCl, 0.1 M NaOH, and water in specific volumes to create a range of initial pH conditions. The suspensions were shaken for one hour, and the initial pH () was measured. One millilitre of the respective KCl solution (0.1, 1, or 2 M) was added to each bottle in the corresponding group to adjust the ionic strength. The bottles were shaken again for 30 min, and the final pH () was measured. The pH difference (pH) was calculated using .

Table 2.
Solutions for the point of zero charge determination for the different biochars.
2.6. Molarity of Ethanol Droplet Test
The hydrophobicity test using methanol—commonly referred to as the Molarity of Ethanol Droplet (MED) test or the critical surface tension test—provides a precise quantification of a biochar’s hydrophobicity [,,]. The procedure involves preparing a series of ethanol–water solutions with increasing ethanol concentrations (typically ranging from 0% to 60% v/v). A thin uniform layer of biochar is spread over a flat surface, and droplets (50 L) of each solution are applied sequentially, starting with pure water. Each droplet is observed for 5 s to determine whether it penetrates the biochar. The process continues with increasing ethanol concentrations until the lowest concentration at which the droplet fully infiltrates within 5 s is identified. Xu et al. (2022) [] established a correlation between MED values and contact angle measurements, further refining the assessment of biochar surface properties.
2.7. Determination of Surface Functional Groups with Fourier Transform Infrared Spectroscopy
The Fourier transform infrared spectroscopy protocol for biochar analysis involves sample preparation, spectral acquisition, and data interpretation. First, the biochar sample is finely ground and dried at 40 °C before analysis to ensure homogeneity and remove moisture. For solid-state analysis, the sample is mixed with potassium bromide (KBr) in a ratio of about 1:100 and pressed into a thin pellet. The prepared sample is then placed on the FTIR spectrometer. The instrument is typically set to scan the mid-infrared region (4000–400 ) with a resolution of 4 . Multiple scans (usually 32–64) are performed and averaged to improve the signal-to-noise ratio. A background spectrum is collected before sample analysis and automatically subtracted from the sample spectrum. The resulting spectrum is then analysed for characteristic absorption bands corresponding to specific functional groups in the biochar. Key regions of interest include OH stretching (3200–3400 ), aliphatic OH stretching (2850–2950 ), C=O stretching (1700–1730 ), aromatic C=C stretching (1590–1615 ), and various bands of AO stretching (1000–1300 ). The relative intensities of these bands provide information about the surface chemistry of the biochar and the degree of carbonisation.
2.8. Statistical Analysis
Statistical processing of data was performed with the R software (4.3.2) [] to assess the significance of differences and similarities between the physicochemical parameters of the various types of biochar. As only three replicates could be measured for most of the experiments, non-parametric analysis with the Kruskal–Wallis test was performed, considering a statistical significance level of p < 0.05.
Principal Component Analysis was conducted using the PAST4 (4.15) software [] to assess the key physicochemical properties of the biochars. The selected properties included pH, electrical conductivity, specific surface area, Molarity of Ethanol Droplet, and adsorption parameters for the Freundlich and Langmuir models, namely, the partition coefficients ( and ), maximum adsorption capacity (), and Gibbs free energy of adsorption. These adsorption parameters were determined for the various tracers, including methylene blue.
3. Results
3.1. Basic Chemical Properties
The pH values of the solutions in contact with biochar, as presented in Table 3, were predominantly alkaline. The highest pH value was observed for olive tree (exceeding 10), followed by rosemary biochar and palm tree biochar, presenting values of 9.8 and 9.7, respectively. Traditional olive tree charcoal and cypress biochar exhibited slightly lower pH values, both around 8 (8.1 and 8.7, respectively). In contrast, the St. John’s wort and giant reed biochars displayed pH values that were close to neutral.

Table 3.
Chemical properties of the different biochars produced from various feedstocks. Exchangeable cations (XCa, XMg, XK, XNa) and the sum of cations (∑cat.) are expressed in . The cation exchange capacity (CEC) is also given in , and the soluble residue (SR) is expressed as a percentage of the initial ash content. pH and electrical conductivity (EC, in dS/m) were measured in a 1:5 biochar-to-water suspension.
The contact solution’s electrical conductivity varied significantly between the different biochars, ranging from slightly saline for giant reed (4.72 dS/m) to predominantly non-saline for most of the samples. Notably, EC and pH exhibited an inverse correlation, as illustrated in Figure 2; as such, the biochars were distributed along two distinct trends, forming two separate groups.
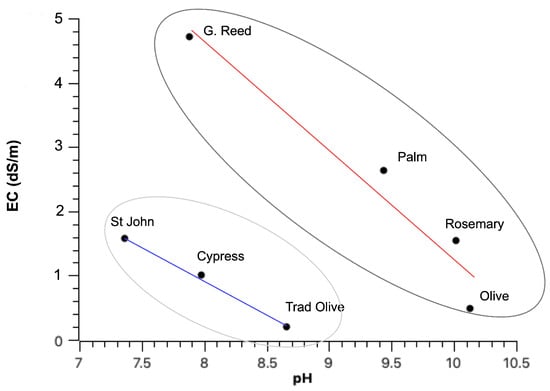
Figure 2.
Electrical conductivity vs. pH for different biochar types. Two major trends can be observed.
The exchangeable cation and CEC results presented in Table 3 show that most biochars showed high over-saturation, that is, the sum of their exchangeable cations was superior to the actual CEC. This was especially the case for palm biochar, with a saturation ratio (SR) of 1400%, followed by giant reed and cypress biochars, both with values near 700%. Traditional olive tree charcoal, rosemary biochar, and St. John’s wort biochar showed SR values near 300%, while olive tree biochar was close to saturation with an SR of 120%.
Giant reed biochar had the highest sum of cations, driven by an extremely high content of potassium (40 ), probably due to the initial composition of the biomass. Palm biochar also had a high sum of cations (≈24 cmolc/kg) with significant contributions from calcium and sodium, suggesting potential salinity concerns. In contrast, olive tree biochar has the lowest cation content (8.11 ), indicating a lower mineral content or less ash. Palm biochar had high exchangeable sodium (XNa = 7.124 ), which could be problematic in saline-sensitive soils. Rosemary and St. John’s wort showed balanced cation distributions, with rosemary having higher XK and St. John’s wort having higher XCa and XMg.
Rosemary biochar had the highest CEC (9.0 ), meaning that it can retain more positively charged nutrients. Traditional olive charcoal, cypress biochar, and palm biochar had the lowest CEC values (1.5, 1.5, and 1.7 , respectively), suggesting limited nutrient retention ability. Biochars from St. John’s wort, giant reed, and olive tree had intermediate CEC (≈7 ).
3.2. Point of Zero Charge Measurement
To estimate the PZC, pH was plotted vs. and was determined as the pH value where the plot intersects the x-axis (pH = 0), representing the point at which the net surface charge of the adsorbent is zero. The results shown in Figure 3 illustrate the evolution of of the biochars with increasing concentration of the KCl solution. The biochars from the rosemary, palm, and olive trees had high PZC values (≈9 at 0.1 mol/L), indicating the presence of alkaline functional groups and that the surface of these biochars remains positively charged for pH values below 9, making them effective for the adsorption of anions in neutral to slightly alkaline environments. Cypress and giant reed biochars, as well as traditional olive tree charcoal, showed intermediate PZC values (7–7.5 at 0.1 mol/L), revealing the presence of both alkaline and acidic functional groups at their surface. St. John’s wort biochar, with a PZC at pH 5 for 0.1 mol/L, typically has an acidic surface. For pH values greater than 5, the surface is mainly negatively charged and therefore adapted to cation adsorption. The tendency for most of the biochars was a decrease in the PZC with increasing concentration, which is generally expected as higher ionic strength compresses the electrical double layer around the biochar particles, reducing the pH at which the surface charge becomes neutral. This is common in colloidal systems, where an increased electrolyte concentration shields surface charges, shifting the PZC to lower pH values [,]. In contrast, the biochars of St. John’s wort and palm tree, as well as traditional olive tree charcoal, showed increasing or stable PZC with increasing concentration.
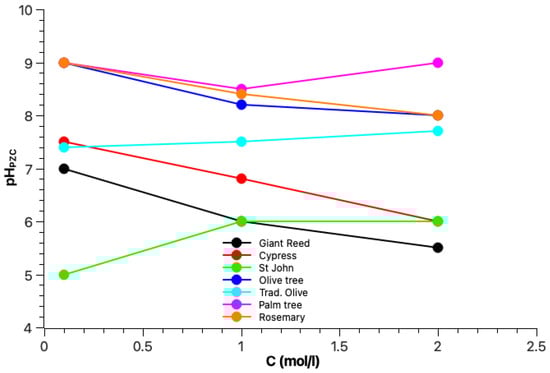
Figure 3.
Evolution of the pH values of Point of Zero Charge () for the biochars at several KCl concentrations.
3.3. Hydrophobicity of Biochars
The key results of this test are presented in Table 4. The biochar from the olive tree had a MED value of 0, indicating a highly hydrophilic surface, which can be related to polar surface functional groups such as -COOH and -OH. Traditional olive charcoal, palm biochar, and cypress biochar showed hydrophobic properties with moderate MED values. In contrast, giant reed, St. John’s wort, and rosemary biochars presented high to very high MED values (20, 40, and 60%, respectively), indicating highly hydrophobic surfaces. This was attributed to their graphite-like non-polar carbon surfaces (presenting aromatic carbon groups) generated by high pyrolysis temperatures.

Table 4.
Molarity of Ethanol Droplet method results for the different biochars.
3.4. Characteristic Functional Groups of Different Biochars
The adsorption capacity of biochar is primarily governed by its surface chemistry, particularly the type and abundance of functional groups, with both the feedstock composition and the pyrolysis conditions significantly influencing this capacity. FTIR studies of the surface functional groups revealed notable differences between the seven biochars, with variations in absorbance intensities, peak shapes, and positions (Figure 4). The olive tree biochar, traditional olive tree charcoal, and palm tree biochar did not exhibit major peaks in the 3700–3100 region, indicating a low hydroxyl (-OH) content. Despite this, these biochars were the most hydrophilic among the samples studied.
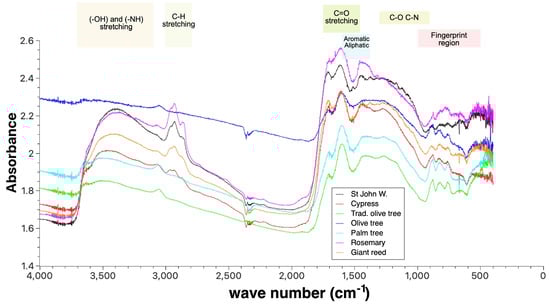
Figure 4.
Fourier transform infrared spectra of the different biochars.
In contrast, the St. John’s wort and rosemary biochars displayed strong peaks in the 3000–2800 and 1700–1500 regions, suggesting higher contents of aliphatic and aromatic compounds (e.g., lipids, waxes, or terpenes). This composition confers highly hydrophobic properties to these biochars.
Giant reed biochar showed prominent peaks in the 1500–1000 range, indicating a higher lignin and cellulose content.
Cypress biochar, olive tree biochar, and traditional olive tree charcoal exhibited more pronounced peaks around 1650 , which may indicate a higher presence of oxidised functional groups.
Finally, palm tree biochar and traditional olive tree charcoal showed more distinct absorbance in the fingerprint region (∼1000–500 ), suggesting unique mineral or sulphur contents.
3.5. Methylene Blue Adsorption and Specific Surface Area Measurement
The adsorption of methylene blue onto the biochars was quantified by establishing adsorption isotherms, fitting them to the Freundlich and Langmuir models, and determining the corresponding adsorption parameters. As shown in Table 5, the Freundlich model provided a better fit, although the Langmuir model also demonstrated good agreement. The parameter n confirms the non-linear nature of the isotherms, while the high values of the partition parameter indicate strong adsorption. The highest values were observed for traditional olive tree charcoal (7.74 ), followed closely by rosemary biochar (6.15 ). In contrast, the palm tree and giant reed biochars exhibited the lowest values, indicating weaker adsorption affinities. It is important to note that unlike the Langmuir constant , the Freundlich constant lacks direct physical significance.

Table 5.
Freundlich and Langmuir adsorption parameters for methylene blue, including the corresponding correlation coefficients (), the specific surface area of the different biochars, and the Gibbs free energy change in adsorption. [u]: .
The partition coefficient for the Langmuir model () was significantly lower than for most biochars. Cypress and St. John’s wort biochars exhibited the highest values, indicating stronger adsorption capacities. In contrast, rosemary and giant reed biochars showed the lowest values, as further confirmed by their Gibbs free energy change in adsorption (). The values for the adsorption of methylene blue in these biochars suggest strong physisorption, except for the rosemary biochar, which indicated weaker physisorption ( kJ/mol).
Despite these results, rosemary and giant reed biochars exhibited the highest maximum adsorption capacities (), translating to the highest specific surface areas, at 62 and 48 , respectively. In addition to a high , St. John’s wort biochar also demonstrated a considerable SSA (45 ). In contrast, woody biochars—including cypress, olive tree, and palm tree biochars—as well as traditional olive charcoal, exhibited the lowest SSA values (11, 13, 6.9, and 7.3 , respectively).
3.6. The Adsorption of Different Tracers
The adsorption of uranine and sulforhodamine-B onto different biochars was evaluated by establishing adsorption isotherms, which were subsequently fitted to the Freundlich and Langmuir models. The corresponding adsorption parameters are presented in Table 6 and Table 7. Both models fit the adsorption isotherms equally well, as indicated by the R-squared values. Notably, the fit was generally better for SRB than for UR across most biochars.

Table 6.
Freundlich and Langmuir adsorption parameters for uranine, including the corresponding correlation coefficients (), the specific surface area of the different biochars, and the Gibbs free energy change in adsorption. [u]: .

Table 7.
Freundlich and Langmuir adsorption parameters for sulforhodamine-B, including the corresponding correlation coefficients (), the specific surface area of the different biochars, and the Gibbs free energy change in adsorption. [u]: .
Taking into account the partition coefficients for both models ( and ), the biochars exhibited a higher affinity for SRB than for UR. This trend is also evident when analysing the maximum amount of dye adsorbed onto the biochar surface, expressed regarding the weight ().
Furthermore, the Gibbs free energy of adsorption values were generally more negative for SRB than for UR, indicating stronger adsorption bonds. For UR, strictly suggests physisorption, whereas the results indicate stronger physisorption for SRB; at least for the olive and palm tree biochars. However, an exception was observed for the rosemary and St. John’s wort biochars, where the values of were more negative, hence indicating stronger bonds with UR than SRB.
A synthesis of these results is presented in Figure 5, where the values of the molar and are shown for each biochar and dye (including MB). MB adsorption generally exhibited more negative values , reaching the strong physisorption range, except for rosemary biochar. However, MB adsorption also resulted in lower molar values compared with SRB and UR.
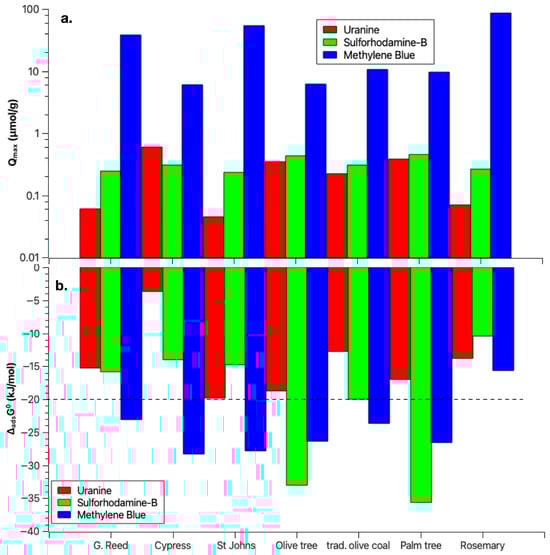
Figure 5.
Chief adsorption parameters, illustrating (a) the maximum uptake ; and (b) the binding strength ().
For uranine adsorption in biochars derived from giant reed, cypress, St. John’s wort, and rosemary, a trend similar to MB was observed: lower values correspond to more negative values, and vice versa. The adsorption of SRB onto the various biochars appears more balanced, with the binding strength and the maximum adsorption capacity varying in tandem. Among the biochars tested, the olive and palm tree biochars exhibited the highest adsorption of SRB, both regarding maximum uptake and binding strength.
3.7. Statistical Analysis
A Principal Component Analysis (PCA) was conducted on all biochars, based on their physicochemical and adsorption properties, to highlight their differences and similarities. The results shown in Figure 6 reveal distinct groupings. Notably, palm tree biochar (in the upper right) exhibited high values for both principal components, suggesting strong adsorption capacity and binding strength. Meanwhile, giant reed biochar stands apart, likely due to its unique surface chemistry or porosity.
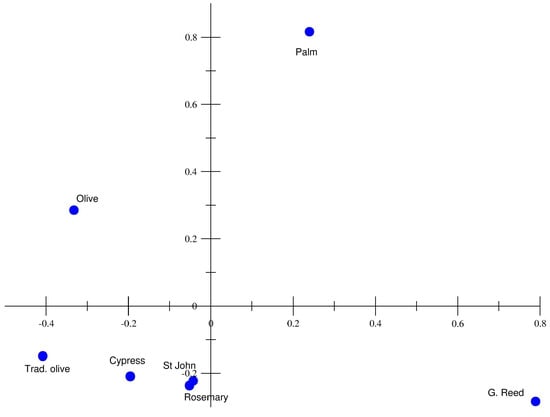
Figure 6.
Principal Component Analysis plot for the different biochars considering pH, EC, SSA, MED, CEC, exchangeable cations, , and Freundlich and Langmuir adsorption parameters (, , , ) for MB, UR, and SRB.
Most biochars, including traditional olive, cypress, St. John’s wort, and rosemary, were clustered near the origin, indicating similar adsorption characteristics with relatively lower adsorption capacity. Olive biochar presents intermediate properties, distinguishing itself from the main cluster while not exhibiting the extreme behaviour of palm or giant reed.
The correlation matrix shown in Figure 7 highlights several notable positive and negative relationships between the measured parameters. Electrical conductivity is primarily driven by exchangeable potassium (XK), as evidenced by their strong positive correlation. A significant relationship was also observed between cation exchange capacity and specific surface area, likely as both were measured using techniques sensitive to electrostatic interactions.
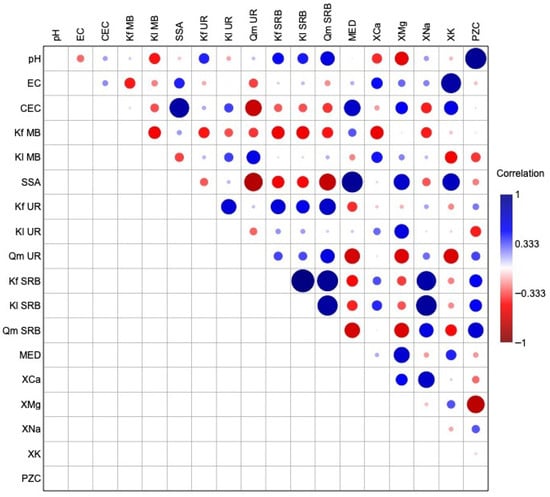
Figure 7.
Correlation matrix between the different parameters for the biochars.
Interestingly, SSA positively correlates with MED values, suggesting that increases in surface area are accompanied by greater surface hydrophobicity. This implies a concurrent development of hydrophilic and hydrophobic domains within the biochar matrix. In addition, SSA shows positive correlations with certain exchangeable cations such as XMg and XK, while being negatively associated with adsorption parameters derived from the UR and SRB models. The point of zero charge () is highly and positively correlated with pH and moderately correlated with the adsorption parameters of SRB.
In particular, Freundlich and Langmuir adsorption parameters for SRB exhibited strong positive correlations with exchangeable sodium. This may point to a specific interaction or affinity of SRB molecules for sodium, potentially playing a role in modulating the adsorption behaviour in sodium-rich biochars.
4. Discussion
4.1. Intrinsic Properties
The fundamental analysis of pH and electrical conductivity reveals an intriguing behaviour of biochar: electrical conductivity is inversely correlated with pH. This observation suggests that the ash content in the biochar is likely low, as ash is typically responsible for highly alkaline pH values and increased electrical conductivity. Therefore, the inverse relationship between pH and EC in the tested biochars implies a minimal presence of ash, which would otherwise elevate both parameters. Some authors consider that biochar with a high specific area will have a higher pH; however, at the same time, they can adsorb part of the solutes, therefore lowering the EC []. The presence of surface functional groups, such as hydroxyl and carbonyl groups, contributes to the high pH values observed in the biochars. At the same time, the mineral content of the raw biomass primarily governs the electrical conductivity. In the EC vs. pH diagram, the biochars can be seen to present a similar linear trend, but are grouped into two distinct categories with different intercept values. Although exhibiting equivalent pH values, St. John’s wort biochar, cypress biochar, and traditional olive tree charcoal released significantly fewer minerals into solution than biochars in the second group.
Rosemary biochar exhibits a dual chemical character, with (i) oxygen-rich functional groups—such as hydroxyl (-OH), carboxyl (-COOH), and carbonyl (-C=O)—that enhance its affinity for polar contaminants, including organic pollutants, and provide active sites for ion exchange, electrostatic interactions, and hydrogen bonding, thus promoting hydrophilic interactions, and (ii) aromatic structures, which facilitate the adsorption of hydrophobic organic compounds through stacking and van der Waals forces. The presence of these oxygen-containing groups accounts for its high cation exchange capacity and the substantial adsorption capacity for MB. Additionally, its high specific surface area increases its ability to adsorb a broad range of organic molecules, despite its overall hydrophobic character.
Similarly, the St. John’s wort and giant reed biochars also demonstrated high hydrophobicity, elevated SSA, and significant CEC, reflecting the coexistence of both oxygen-rich functional groups and aromatic domains.
In contrast, the olive tree biochar, while showing a moderate CEC, had very low SSA and lacks hydrophobic properties, likely due to a lower abundance of oxygen-rich and aromatic groups.
Cypress biochar, traditional olive tree charcoal, and palm tree biochar all exhibited low CEC, low SSA, and minimal hydrophobicity. FTIR analyses confirmed that these biochars contain fewer oxygen-rich functional groups but relatively more aromatic structures.
These observations underline a clear distinction between wood-derived biochars and those derived from other biomass types, based on their intrinsic physicochemical properties. The strong correlation between high SSA and increased hydrophobicity can be attributed to the higher pyrolysis temperatures likely achieved in the core of the reactor for non-woody biomass, thus promoting the formation of aromatic structures, reducing oxygenated functional groups, and resulting in greater SSA and hydrophobicity [,,].
4.2. Adsorption Properties
The adsorption properties of the different biochars for the various dyes were generally comparable with or better than those reported in previous studies using non-activated biochars. For example, Kataya et al. (2025) [] evaluated the adsorption of MB onto a biochar derived from a mixture of orange peel, banana peel, potato peel, and coffee grounds, reporting a maximum adsorption capacity of 30 mg/g, whereas the highest obtained in our study was 28 mg/g for the rosemary biochar. These values are within the same range and remain higher than those reported in other studies []. For UR, the Freundlich distribution coefficient for oak and pine wood biochars ranged between 29 and 60 g(1−n)Ln/kg in the study of Sene et al. (2023) [], and from 262 to 586 g(1−n)Ln/kg in that of Zhang et al. (2024) []; meanwhile, in our study, values ranged from 230 to 1690 g(1−n)Ln/kg. In contrast, SRB exhibited higher adsorption capacities in the study of Zhang et al. (2024), with values ranging from 800 to 9700 g(1−n)Ln/kg, compared with a maximum value of 300 g(1−n)Ln/kg obtained for olive tree biochar in our study. Overall, SRB adsorption appears to be more favourable on wood-derived biochars.
To evaluate the quality of the adsorption of the different molecules, the ratio between the adsorption energy and the maximum amount of adsorption () is presented for the various biochars in Figure 8. Rosemary biochar shows a balanced performance, with UR (≈200), SRB (≈50), and MB (≈200) having relatively low ratios, indicating more efficient adsorption across all dyes.
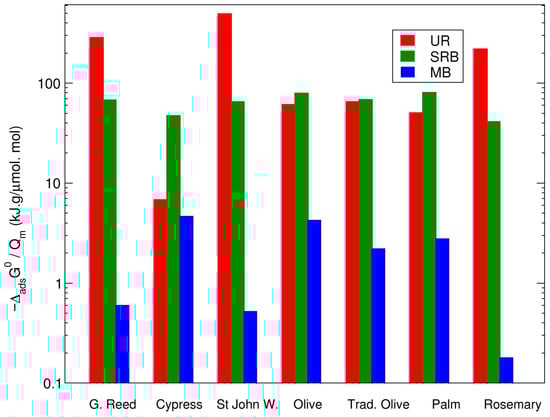
Figure 8.
Ratio between the Gibbs free energy of adsorption and the maximum adsorption () for UR, SRB, and MB on the various types of biochar.
Methylene blue is a cationic molecule [] that preferentially adsorbs onto negatively charged surfaces through electrostatic interactions with the hydroxyl (-OH), carboxyl (-COOH), and carbonyl (-C=O) functional groups on biochar. The interactions of MB with most biochars were characterised by high energy binding sites (highly negative values), with only a limited number of adsorption sites or limited accessibility, as was generally low. Therefore, the ratio was extremely high (about 100 times higher than for SRB) for most types of biochar, especially due to the presence of oxygen-rich surface functional groups. However, this ratio was moderate for the rosemary, St. John’s wort, and giant reed biochars, indicating more adsorption sites on oxygen-rich functional groups, which was confirmed by the FTIR results.
The adsorption results indicate that uranine generally exhibited lower adsorption efficiency compared with SRB and MB on the biochar surfaces. Uranine, an anionic molecule with hydrophobic properties [], has limited capacity for electrostatic interactions with the predominantly negatively charged biochar surface []. Instead, its adsorption primarily depends on bonding between the xanthene structure of the molecule and the aromatic rings of the biochar. Notably, St. John’s wort, giant reed, and rosemary biochars displayed the highest ratios (Figure 8)—a finding consistent with their FTIR spectra, which revealed a higher abundance of aromatic rings (Figure 4).
The PZC values measured at 0.1 mol/L KCl for certain biochars, such as rosemary, giant reed, and palm tree, suggest a positively charged surface under environmental conditions with pH values below 8.6. However, these biochars exhibited notably high pH values—exceeding 9 (see Table 3)—indicating that their surfaces are predominantly negatively charged under typical conditions. This discrepancy highlights the complex interplay between surface charge and environmental pH, influenced by the intrinsic properties and ionic strength of the biochars.
Sulforhodamine-B (SRB) was found to have the highest surface affinity for all the biochars. Moreover, as can be seen from Figure 8, the ratio was the lowest for SRB for all biochars. For neutral to alkaline pH values—which are prevalent in environmental conditions—SRB is mainly anionic with amphiphilic properties, showing hydrophilic and hydrophobic properties []. It presents a complex molecular structure, featuring sulphonate groups that confer a negative charge and aromatic rings that facilitate -electron interactions. Therefore, electrostatic interactions are only partially responsible for the adsorption of SRB onto the biochar surface, as the biochar surface is negatively charged. However, the aromatic structure of SRB—particularly its xanthene core—can engage in stacking with the graphene-like aromatic domains of biochar. These interactions are especially significant for biochars produced at higher pyrolysis temperatures (e.g., >500 °C), which enhance graphitisation and aromaticity, providing electron-rich regions that align with the SRB’s -electron system. Therefore, it is interesting to notice that the three materials showing the highest interactions with SRB (olive biochar, traditional olive tree charcoal, palm tree biochar) were also those that showed a distinctive FTIR peak in the 1600 region, corresponding to C=C stretching. Hydrogen bonding between SRB and the -OH and C=O groups on biochar also plays a crucial role in the adsorption process, as indicated by the FTIR pattern.
A synthesis of the different interactions between the various biochar surfaces and the three dyes with contrasting properties is presented schematically in Figure 9. The correlation matrix indicates the relationships between different parameters, such as SSA and hydrophobicity, both of which are indicators of the quality of pyrolysis, as pointed out by He et al. (2024) [].
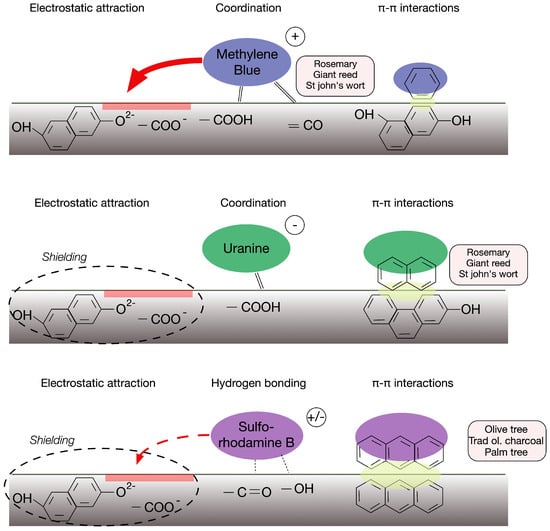
Figure 9.
Schematic diagram of interactions between the different dyes and the biochar surface.
5. Conclusions
The potential of locally produced biochar as an affordable and sustainable material to reduce pesticide contamination in Mediterranean agricultural systems is reinforced by the results presented in this study. By producing a variety of biochars using Tunisian biomass as feedstocks and evaluating their physicochemical and adsorption characteristics, we demonstrated that the type of feedstock and the pyrolysis conditions have significant impacts on the performance of biochars. Among the tested materials, rosemary, St. John’s wort, and giant reed biochars demonstrated the best combination of characteristics: high specific surface area, increased cation exchange capacity, and efficient adsorption of MB, UR, and SRB. These characteristics, which facilitate interactions with both polar and non-polar contaminants, are attributed to a balanced composition of aromatic structures and oxygen-rich functional groups on the biochar surface. The importance of thermal processing conditions in influencing adsorption behaviour is highlighted by the association between high SSA and increased hydrophobicity, as well as the predominance of aromatic groups in high-temperature pyrolysed biochars. On the other hand, due to their limited porosity and functional group diversity, wood-derived biochars, such as cypress biochar, olive biochar, and traditional olive charcoal, showed lower SSAs, CECs, and adsorption capacities. Overall, the findings emphasise that the use of biochar is not a one-size-fits-all solution. Its effectiveness depends on careful selection of the feedstock, pyrolysis parameters, and target contaminants. The actual adsorption of pesticides has not yet been tested with this set of biochars and, therefore, direct conclusions about their interactions with such contaminants cannot be drawn. However, experiments using organic dyes provide valuable information about the types of surface interactions that these biochars can develop, which are likely relevant to their potential interactions with pesticides. This study confirmed the feasibility and efficiency of using locally produced biochars as sorbants for organic dyes, indicating their potential to retain or reduce the mobility of organic pollutants. Further studies involving organic contaminants will be necessary to scale these findings to field conditions.
Author Contributions
Conceptualization, A.H. and C.H.; methodology, A.H., S.N. and C.H.; software, C.H.; validation, A.H., A.B.H.T., F.L., S.N. and C.H.; formal analysis, A.H. and C.H.; resources, A.H., A.B.H.T., F.L. and C.H.; data curation, A.H., S.N. and C.H.; writing—original draft preparation, A.H. and C.H.; writing—review and editing, A.H. and C.H.; visualization, A.H. and C.H.; supervision, C.H. All authors have read and agreed to the published version of the manuscript.
Funding
This research was funded by LMI NAILA and JEAI BIOCHAR projects.
Data Availability Statement
The raw data supporting the conclusions of this article are available at: https://doi.org/10.5281/zenodo.17203436.
Acknowledgments
We dedicate this work to the memory of our co-author and colleague, Aida Ben Hassen Trabelsi, who sadly passed away before its publication. Her dedication, insight, and contributions were invaluable to this study. We also thank Mathias Palhec (IRD) and Maël le Nôtre (V.I.A à l’IRD Tunisia) for their valuable assistance with the analysis and fieldwork.
Conflicts of Interest
The authors declare no conflicts of interest.
Abbreviations
The following abbreviations are used in this manuscript:
| MB | Methylene Blue |
| SSA | Specific Surface Area |
| SRB | Sulforhodamine-B |
| UR | Uranine |
| FTIR | Fourier Transform Infrared |
| MED | Molarity of Ethanol Droplet |
| CEC | Cation Exchange Capacity |
| XMg | Exchangeable Magnesium |
| XK | Exchangeable Potassium |
| XNa | Exchangeable Sodium |
| XCa | Exchangeable Calcium |
| ∑ cat. | Sum of cations |
| PZC | Point of Zero Charge |
| SE | Standard Error |
References
- Delcour, I.; Spanoghe, P.; Uyttendaele, M. Literature review: Impact of climate change on pesticide use. Food Res. Int. 2015, 68, 7–15. [Google Scholar] [CrossRef]
- Tang, F.H.M.; Lenzen, M.; McBratney, A.; Maggi, F. Risk of pesticide pollution at the global scale. Nat. Geosci. 2021, 14, 206–210. [Google Scholar] [CrossRef]
- Tudi, M.; Daniel Ruan, H.; Wang, L.; Lyu, J.; Sadler, R.; Connell, D.; Chu, C.; Phung, D.T. Agriculture Development, Pesticide Application and Its Impact on the Environment. Int. J. Environ. Res. Public Health 2021, 18, 1112. [Google Scholar] [CrossRef]
- Pérez-Lucas, G.; Navarro, G.; Navarro, S. Adapting agriculture and pesticide use in Mediterranean regions under climate change scenarios: A comprehensive review. Eur. J. Agron. 2024, 161, 127337. [Google Scholar] [CrossRef]
- Grünberger, O.; Hamdi, R.; Lagacherie, M.; Chaabane, H. Pesticide contamination pattern of surface water in an urban–agricultural mediterranean watershed (Wadi Guenniche, Bizerte Lagoon, Northern Tunisia). J. Environ. Sci. Health Part B 2024, 59, 521–539. [Google Scholar] [CrossRef] [PubMed]
- Dahmeni, G.; Grünberger, O.; Hanene, C. Assessment of pesticide contamination in hill reservoirs: Combination of a rainfed farming survey and water multiresidue monitoring (Lebna watershed, Cap Bon, Tunisia). Environ. Monit. Assess. 2024, 196, 1257. [Google Scholar] [CrossRef]
- Khezami, F.; Gómez-Navarro, O.; Barbieri, M.V.; Khiari, N.; Chkirbene, A.; Chiron, S.; Khadhar, S.; Pérez, S. Occurrence of contaminants of emerging concern and pesticides and relative risk assessment in Tunisian groundwater. Sci. Total Environ. 2024, 906, 167319. [Google Scholar] [CrossRef] [PubMed]
- Toumi, K.; Arbi, A.; Soudani, N.; Lomadze, A.; Haouas, D.; Bertuzzi, T.; Cardinali, A.; Lamastra, L.; Capri, E.; Suciu, N.A. Ecotoxicological Risk Assessment and Monitoring of Pesticide Residues in Soil, Surface Water, and Groundwater in Northwestern Tunisia. Water 2025, 17, 2387. [Google Scholar] [CrossRef]
- Salhab, J.; Weber, M.; Paganini, T.; Khamassi, F.; Bellagha, S.; Hadj, H.; Laabidi, F. Olive Oil, Medicinal and Aromatic Plants, and Tomatoes in North-West Tunisia: A Roadmap to Developing Competitive Advantage on Strategic Markets; World Bank: Washington, DC, USA, 2020. [Google Scholar] [CrossRef]
- FAO. Experiences of Near East Countries on Utilization and Processing of Non-Wood Forest Products: Cases of Gum Arabic, Bee-Honey, Pistachios, Rosemary & Stone Pine. In Proceedings of the 20th Session of the Near East Forestry and Range Commission, Antalya, Turkey, 29 January–2 February 2012; FO: NEFRC/2012/5.2; Technical Report; Food and Agriculture Organization of the United Nations (FAO): Rome, Italy, 2012. [Google Scholar]
- Taghouti, I.; Daly hassen, H. Essential oils value chain in Tunisian forests: Conflicts between inclusiveness and marketing performance. Arab. J. Med. Aromat. Plants 2018, 4, 15–41. [Google Scholar] [CrossRef]
- El Hamrouni, K.; Khouja, M.L.; Boussaid, M.; Akrimi, N.; Toumi, L. Essential-Oil Composition of the Tunisian Endemic Cypress (Cupressus sempervirens L. var. numidica Trab.). Chem. Biodivers. 2013, 10, 989–1003. [Google Scholar] [CrossRef] [PubMed]
- Anvari, S.; Aguado, R.; Jurado, F.; Fendri, M.; Zaier, H.; Larbi, A.; Vera, D. Analysis of agricultural waste/byproduct biomass potential for bioenergy: The case of Tunisia. Energy Sustain. Dev. 2024, 78, 101367. [Google Scholar] [CrossRef]
- Hosni, K.; Msaâda, K.; Ben Taârit, M.; Ouchikh, O.; Kallel, M.; Marzouk, B. Essential oil composition of Hypericum perfoliatum L. and Hypericum tomentosum L. growing wild in Tunisia. Ind. Crop. Prod. 2008, 27, 308–314. [Google Scholar] [CrossRef]
- Goolsby, J.; Moran, P.; Martinez Jiménez, M.; Yang, C.; Canavan, K.; Paynter, Q.; Ota, N.; Kriticos, D. Biology of Invasive Plants 4. Arundo donax L. Invasive Plant Sci. Manag. 2023, 16, 81–109. [Google Scholar] [CrossRef]
- Yakupoğlu, T.; Dindaroğlu, T.; Rodrigo-comino, J.; Cerdà, A. Stubble burning and wildfires in Turkey considering the Sustainable Development Goals of the United Nations. Eurasian J. Soil Sci. 2022, 11, 66–76. [Google Scholar] [CrossRef]
- Zalidis, G.; Stamatiadis, S.; Takavakoglou, V.; Eskridge, K.; Misopolinos, N. Impacts of agricultural practices on soil and water quality in the Mediterranean region and proposed assessment methodology. Agric. Ecosyst. Environ. 2002, 88, 137–146. [Google Scholar] [CrossRef]
- Yeilagi, S.; Rezapour, S.; Asadzadeh, F. Degradation of soil quality by the waste leachate in a Mediterranean semi-arid ecosystem. Sci. Rep. 2021, 11, 11390. [Google Scholar] [CrossRef]
- Sohi, S.; Krull, E.; Lopez-Capel, E.; Bol, R. Chapter 2—A Review of Biochar and Its Use and Function in Soil. In Advances in Agronomy; Academic Press: Cambridge, MA, USA, 2010; Volume 105, pp. 47–82. [Google Scholar] [CrossRef]
- Lehmann, J.; Joseph, S. (Eds.) Biochar for Environmental Management: Science, Technology and Implementation, 2nd ed.; Routledge: London, UK; New York, NY, USA, 2015. [Google Scholar] [CrossRef]
- De Sousa Lima, J.R.; de Moraes Silva, W.; de Medeiros, E.V.; Duda, G.P.; Corrêa, M.M.; Filho, A.P.M.; Clermont-Dauphin, C.; Antonino, A.C.D.; Hammecker, C. Effect of biochar on physicochemical properties of a sandy soil and maize growth in a greenhouse experiment. Geoderma 2018, 319, 14–23. [Google Scholar] [CrossRef]
- Lehmann, J.; Cowie, A.; Masiello, C.A.; Kammann, C.; Woolf, D.; Amonette, J.E.; Cayuela, M.L.; Camps-Arbestain, M.; Whitman, T. Biochar in climate change mitigation. Nat. Geosci. 2021, 14, 883–892. [Google Scholar] [CrossRef]
- Janeau, J.L.; Intanon, S.; Pansak, W.; Rodprai, C.; Anusorn, K.; Hammecker, C.; Grellier, S. Slope position and biochar influence soil properties and seed displacement in a tropical agroecosystem. Eur. J. Soil Sci. 2022, 73, e13216. [Google Scholar] [CrossRef]
- Lehmann, J.; Joseph, S. Biochar for environmental management. In Biochar for Environmental Management, 3rd ed.; Routledge: London, UK, 2024; pp. 1–14. [Google Scholar] [CrossRef]
- Khorram, M.S.; Zhang, Q.; Lin, D.; Zheng, Y.; Fang, H.; Yu, Y. Biochar: A review of its impact on pesticide behavior in soil environments and its potential applications. J. Environ. Sci. 2016, 44, 269–279. [Google Scholar] [CrossRef] [PubMed]
- Lehmann, J.; Barrios, E.; Devault, M.; Li, L.; Nelson, R.; Six, J.; Trimmer, J. Biochar in the circular bionutrient economy. Proc. Natl. Acad. Sci. USA 2025, 122, e2503668122. [Google Scholar] [CrossRef]
- Menemencioglu, K. Traditional wood charcoal production labour in Turkish forestry (Çankırı sample). J. Food Agric. Environ. 2013, 1111, 1136–1142. [Google Scholar]
- OECD. Test No. 122: Determination of pH, Acidity and Alkalinity; Technical Report; OECD Publishing: Paris, France, 2013. [Google Scholar]
- Rajkovich, S.; Enders, A.; Hanley, K.; Hyland, C.; Zimmerman, A.; Lehmann, J. Corn growth and nitrogen nutrition after additions of biochars with varying properties to a temperate soil. Biol. Fertil. Soils 2011, 48, 271–284. [Google Scholar] [CrossRef]
- International Biochar Initiative (IBI). Standardized Definition and Product Testing Guidelines for Biochar That Is Used in Soil; Technical Report IBI-STD-01; International Biochar Initiative: Westerville, OH, USA, 2012. [Google Scholar]
- Ciesielski, H.; Sterckeman, T.; Santerne, M.; Willery, J.P. Determination of cation exchange capacity and exchangeable cations in soils by means of cobalt hexamine trichloride. Effects of experimental conditions. Agronomie 1997, 17, 1–7. [Google Scholar] [CrossRef]
- Hegyesi, N.; Vad, R.T.; Pukánszky, B. Determination of the specific surface area of layered silicates by methylene blue adsorption: The role of structure, pH and layer charge. Appl. Clay Sci. 2017, 146, 50–55. [Google Scholar] [CrossRef]
- Kipling, J.J.; Wilson, R.B. Adsorption of methylene blue in the determination of surface areas. J. Appl. Chem. 2007, 10, 109–113. [Google Scholar] [CrossRef]
- Sene, S.; Dollinger, J.; Hammecker, C.; Lagacherie, M.; Negro, S.; Samouelian, A. Potential of fluorescent tracers to appraise biochar amendment strategies for pesticide mitigation—Insights from comparative sorption. Environ. Sci. Pollut. Res. 2023, 30, 92182–92192. [Google Scholar] [CrossRef] [PubMed]
- Lange, J.; Olsson, O.; Sweeney, B.; Herbstritt, B.; Reich, M.; Alvarez-Zaldivar, P.; Payraudeau, S.; Imfeld, G. Fluorescent tracers to evaluate pesticide dissipation and transformation in agricultural soils. Sci. Total Environ. 2018, 619–620, 1682–1689. [Google Scholar] [CrossRef]
- Yukselen, Y.; Kaya, A. Comparison of Methods for Determining Specific Surface Area of Soils. J. Geotech. Geoenviron. Eng. 2006, 132, 931–936. [Google Scholar] [CrossRef]
- Yukselen, Y.; Kaya, A. Suitability of the methylene blue test for surface area, cation exchange capacity and swell potential determination of clayey soils. Eng. Geol. 2008, 102, 38–45. [Google Scholar] [CrossRef]
- Almeida, C.; Debacher, N.; Downs, A.; Cottet, L.; Mello, C. Removal of methylene blue from colored effluents by adsorption on montmorillonite clay. J. Colloid Interface Sci. 2009, 332, 46–53. [Google Scholar] [CrossRef]
- Zhou, X.; Zhou, X. The unit problem in the thermodynamic calculation of adsorption using the Langmuir equation. Chem. Eng. Commun. 2014, 201, 1459–1467. [Google Scholar] [CrossRef]
- Guilhen, S.; Watanabe, T.; Silva, T.; Rovani, S.; Marumo, J.; Tenório, J.; Masek, O.; de Araujo, L. Role of Point of Zero Charge in the Adsorption of Cationic Textile Dye on Standard Biochars from Aqueous Solutions: Selection Criteria and Performance Assessment. Recent Prog. Mater. 2022, 4, 010. [Google Scholar] [CrossRef]
- Mahmood, T.; Saddique, M.T.; Naeem, A.; Westerhoff, P.; Mustafa, S.; Alum, A. Comparison of Different Methods for the Point of Zero Charge Determination of NiO. Ind. Eng. Chem. Res. 2011, 50, 10017–10023. [Google Scholar] [CrossRef]
- Al-Maliky, E.A.; Gzar, H.A.; Al-Azawy, M.G. Determination of Point of Zero Charge (PZC) of Concrete Particles Adsorbents. IOP Conf. Ser. Mater. Sci. Eng. 2021, 1184, 012004. [Google Scholar] [CrossRef]
- Noh, J.S.; Schwarz, J.A. Estimation of the point of zero charge of simple oxides by mass titration. J. Colloid Interface Sci. 1989, 130, 157–164. [Google Scholar] [CrossRef]
- Kosmulski, M. The pH dependent surface charging and points of zero charge. X. Update. Adv. Colloid Interface Sci. 2023, 319, 102973. [Google Scholar] [CrossRef]
- Miyittah, M.K.; Tsyawo, F.W.; Kumah, K.K.; Stanley, C.D.; Rechcigl, J.E. Suitability of Two Methods for Determination of Point of Zero Charge (PZC) of Adsorbents in Soils. Commun. Soil Sci. Plant Anal. 2016, 47, 101–111. [Google Scholar] [CrossRef]
- Letey, J.; Carrillo, M.; Pang, X. Approaches to characterize the degree of water repellency. J. Hydrol. 2000, 231–232, 61–65. [Google Scholar] [CrossRef]
- Kinney, T.; Masiello, C.; Dugan, B.; Hockaday, W.; Dean, M.; Zygourakis, K.; Barnes, R. Hydrologic properties of biochars produced at different temperatures. Biomass Bioenergy 2012, 41, 34–43. [Google Scholar] [CrossRef]
- Edeh, I.G.; Mašek, O. The role of biochar particle size and hydrophobicity in improving soil hydraulic properties. Eur. J. Soil Sci. 2021, 73, e13138. [Google Scholar] [CrossRef]
- Xu, J.; Jia, L.; Dang, C.; Liu, X.; Ding, Y. Effects of solid–liquid interaction and mixture concentration on wettability of nano-droplets: Molecular dynamics simulations. AIP Adv. 2022, 12, 105313. [Google Scholar] [CrossRef]
- R Core Team. R: A Language and Environment for Statistical Computing; R Foundation for Statistical Computing: Vienna, Austria, 2021. [Google Scholar]
- Hammer, Ø.; Harper, D.A.T.; Ryan, P.D. PAST: Paleontological Statistics Software Package for Education and Data Analysis. Paleontol. Electron. 2001, 4, 9. [Google Scholar]
- Hunter, R.J. Chapter 3—The Calculation of Zeta Potential. In Zeta Potential in Colloid Science; Hunter, R.J., Ed.; Academic Press: Cambridge, MA, USA, 1981; pp. 59–124. [Google Scholar] [CrossRef]
- Sparks, D.L. 5—Sorption Phenomena on Soils. In Environmental Soil Chemistry (Second Edition); Sparks, D.L., Ed.; Academic Press: Burlington, NJ, USA, 2003; pp. 133–186. [Google Scholar] [CrossRef]
- Yuan, Y.; Liu, Q.; Zheng, H.; Li, M.; Liu, Y.; Wang, X.; Peng, Y.; Luo, X.; Li, F.; Li, X.; et al. Biochar as a sustainable tool for improving the health of salt-affected soils. Soil Environ. Health 2023, 1, 100033. [Google Scholar] [CrossRef]
- Xiao, X.; Chen, B.; Zhu, L. Transformation, Morphology, and Dissolution of Silicon and Carbon in Rice Straw-Derived Biochars under Different Pyrolytic Temperatures. Environ. Sci. Technol. 2014, 48, 3411–3419. [Google Scholar] [CrossRef] [PubMed]
- Chen, T.; Zhang, Y.; Wang, H.; Lu, W.; Zhou, Z.; Zhang, Y.; Ren, L. Influence of pyrolysis temperature on characteristics and heavy metal adsorptive performance of biochar derived from municipal sewage sludge. Bioresour. Technol. 2014, 164, 47–54. [Google Scholar] [CrossRef]
- Wang, L.; Ok, Y.S.; Tsang, D.C.W.; Alessi, D.S.; Rinklebe, J.; Wang, H.; Mašek, O.; Hou, R.; O’Connor, D.; Hou, D. New trends in biochar pyrolysis and modification strategies: Feedstock, pyrolysis conditions, sustainability concerns and implications for soil amendment. Soil Use Manag. 2020, 36, 358–386. [Google Scholar] [CrossRef]
- Kataya, G.; Issa, M.; Badran, A.; Cornu, D.; Bechelany, M.; Jellali, S.; Jeguirim, M.; Hijazi, A. Dynamic removal of methylene blue and methyl orange from water using biochar derived from kitchen waste. Sci. Rep. 2025, 15, 29907. [Google Scholar] [CrossRef]
- Zhang, X.; Cheng, W.; Wang, J.; Lei, Y.; Yang, X.; Duan, Q.; Duan, W.; Zhang, Y. Study on adsorption characteristics of biochars and their modified biochars for removal of organic dyes from aqueous solution. Green Process. Synth. 2024, 13, 20240154. [Google Scholar] [CrossRef]
- Al-Ghouti, M.A.; Al-Absi, R.S. Mechanistic understanding of the adsorption and thermodynamic aspects of cationic methylene blue dye onto cellulosic olive stones biomass from wastewater. Sci. Rep. 2020, 10, 15928. [Google Scholar] [CrossRef] [PubMed]
- Buzády, A.; Erostyák, J.; Paál, G. Determination of uranine tracer dye from underground water of Mecsek Hill, Hungary. J. Biochem. Biophys. Methods 2006, 69, 207–214. [Google Scholar] [CrossRef] [PubMed]
- Hong, M.; Zhang, L.; Tan, Z.; Huang, Q. Effect mechanism of biochar’s zeta potential on farmland soil’s cadmium immobilization. Environ. Sci. Pollut. Res. 2019, 26, 19738–19748. [Google Scholar] [CrossRef] [PubMed]
- Polat, B.E.; Lin, S.; Mendenhall, J.D.; VanVeller, B.; Langer, R.; Blankschtein, D. Experimental and Molecular Dynamics Investigation into the Amphiphilic Nature of Sulforhodamine B. J. Phys. Chem. B 2011, 115, 1394–1402. [Google Scholar] [CrossRef] [PubMed]
- He, D.; Luo, Y.; Zhu, B. Feedstock and pyrolysis temperature influence biochar properties and its interactions with soil substances: Insights from a DFT calculation. Sci. Total Environ. 2024, 922, 171259. [Google Scholar] [CrossRef]
Disclaimer/Publisher’s Note: The statements, opinions and data contained in all publications are solely those of the individual author(s) and contributor(s) and not of MDPI and/or the editor(s). MDPI and/or the editor(s) disclaim responsibility for any injury to people or property resulting from any ideas, methods, instructions or products referred to in the content. |
© 2025 by the authors. Licensee MDPI, Basel, Switzerland. This article is an open access article distributed under the terms and conditions of the Creative Commons Attribution (CC BY) license (https://creativecommons.org/licenses/by/4.0/).

