


Abstract
Afforestation is a high-potential and cost-effective climate change mitigation strategy, but its large-scale implementation raises sustainability concerns. It requires extensive areas of land, potentially conflicting with agriculture and impacting food security. Moreover, inappropriate forest expansion, such as the afforestation of naturally open habitats, could reduce habitats for non-forest organisms and may cause biodiversity loss. Here, we assess the global mitigation potential of afforestation by integrating environmental constraints and sustainable food system transformations within an integrated assessment model framework. Using the Asia-Pacific Integrated Model (AIM), including the AIM-Hub general equilibrium model and AIM-PLUM spatial land use allocation model, we evaluated seven scenarios incorporating biodiversity protection, soil quality enhancement, dietary shifts, food waste reduction, trade, and irrigation intensification. We found that environmental considerations reduce the maximum afforestation potential to 2.13 GtCO2 yr−1, highlighting the importance of accounting for land use trade-offs. However, sustainable food system transformations substantially recover this mitigation potential, increasing afforestation-based carbon sequestration to 5.01 GtCO2 yr−1 by 2100. Approximately 90% of this potential can be achieved at a cost below 50 USD tCO2−1. Our study emphasizes the need for integrated policies to balance climate mitigation with environmental conservation.
1. Introduction
To achieve net-zero CO2 emissions and limit global warming to 1.5 °C, it is estimated that 100–1000 GtCO2 will need to be removed from the atmosphere by 2100 [1]. This implies that, even under stringent mitigation policies, meeting the Paris Agreement targets will require the large-scale deployment of carbon dioxide removal (CDR) [2]. Land-based mitigation strategies such as afforestation could make important contributions to achieving these targets [3,4,5].
Afforestation offers high carbon sequestration potential at a low-to-moderate cost and could therefore become an alternative to or could complement other mitigation options. It is estimated that afforestation could sequester approximately 1.1–3.3 GtCO2 annually by 2050 [1]. When combined with other measures, such as reducing deforestation and improving forest management, afforestation could contribute significantly to the realization of global climate targets [6,7,8]. The cost estimates for afforestation are lower than those for novel carbon removal technologies such as bioenergy with carbon capture and storage (BECCS) or direct air capture (DACCS) [9,10,11], and substantial carbon sequestration may be achievable for less than $50 per tCO2 [12,13].
Despite its cost-effectiveness and substantial mitigation potential, afforestation implementation faces several sustainability challenges. Large-scale afforestation requires extensive land areas to be established, maintained, and protected as permanent forest systems over long periods, while existing forests must simultaneously remain protected from degradation and deforestation [14,15]. This requirement creates potential trade-offs with competing land uses, particularly agriculture, which plays a critical role in global food production and food security [16,17,18,19]. Several modeling studies have demonstrated that ambitious afforestation scenarios may generate significant climate benefits but may also produce considerable socioeconomic and food security-related consequences. Kreidenweis et al., for example, using the MAgPIE model, estimated that large-scale afforestation covering approximately 2580 Mha globally could achieve a cumulative carbon sequestration of around 860 GtCO2 by the end of the century [20]. However, this scenario could also increase global food prices by approximately 80% by 2050 and more than fourfold by 2100 due to reduced agricultural land availability. Similarly, Frank et al., using the GLOBIOM model, projected that afforestation pathways consistent with the 1.5 °C climate target could increase the number of undernourished people by approximately 80–300 million by 2050 [21].
Beyond competition with food production, environmental concerns are also projected to increase significantly when afforestation activities are scaled up beyond certain thresholds. Large-scale afforestation of approximately 200 Mha could lead to substantial changes in land use patterns, impacting biodiversity, water resources, and local climates [22,23,24]. Some studies have estimated that the sustainable carbon sequestration potential of afforestation is unlikely to exceed 3.3 GtCO2 per year without causing adverse environmental effects [9,25]. Moreover, the afforestation of naturally open habitats may also negatively affect biodiversity because of habitat loss for non-forest organisms [26,27,28]. This could, in turn, drive up food prices, heighten the risk of food scarcity, and undermine overall land use efficiency [3].
Previous studies have provided important insights into the carbon sequestration potential and economic feasibility of afforestation, as well as its implications for land use, biodiversity, ecosystem services, and food security [10,18,19,29]. Environmental protection can constrain the land available for afforestation [30], increasing land scarcity, land price, and associated costs [31]. Conversely, transitions toward more sustainable food systems, including dietary shifts and reduced food waste, may lower agricultural land demand and potentially release land for afforestation [32]. These opposing forces highlight the need to jointly consider environmental constraints and food system transitions when assessing the feasible scale, mitigation potential, and costs of global afforestation without compromising food security.
Therefore, this study explores the carbon sequestration potential of global afforestation and its associated costs by integrating environmental considerations, focusing on biodiversity and soil conservation, in addition to considering sustainable food systems. We expected that the global afforestation potential would be restricted when environmental considerations were included but that sustainable food systems could partly compensate for these impacts. The vision of this study is to create a clear and balanced framework to support effective and sustainable afforestation efforts. For clarification, although both terms describe the establishment of tree cover on land not currently forested, they differ with respect to the land’s recent history. Reforestation applies specifically to land that carried forest cover at some point within the past 50 years but has since been converted to another use (e.g., cropland or pasture), whereas afforestation applies to land that has been non-forested for longer than 50 years. In this study, we distinguish the two by judging whether the area was forest or not in the pre-industrial period, but when accounting for carbon accounting purposes, we treat them equivalently. For simplicity, we therefore use the term “afforestation” throughout the remainder of this paper to refer to both processes, which is in line with the IPCC [1].
2. Materials and Methods
Our study evaluates global afforestation carbon sequestration potential using an integrated assessment modeling (IAM) framework that combines the Asia-Pacific Integrated Model–computable general equilibrium model (AIM-Hub; formerly AIM-CGE) [33] and the Asia-Pacific Integrated Model–Platform for Land Use and Environmental Modeling (AIM-PLUM) [34].
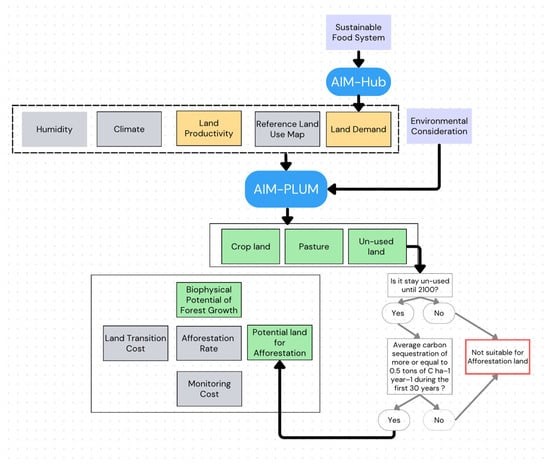
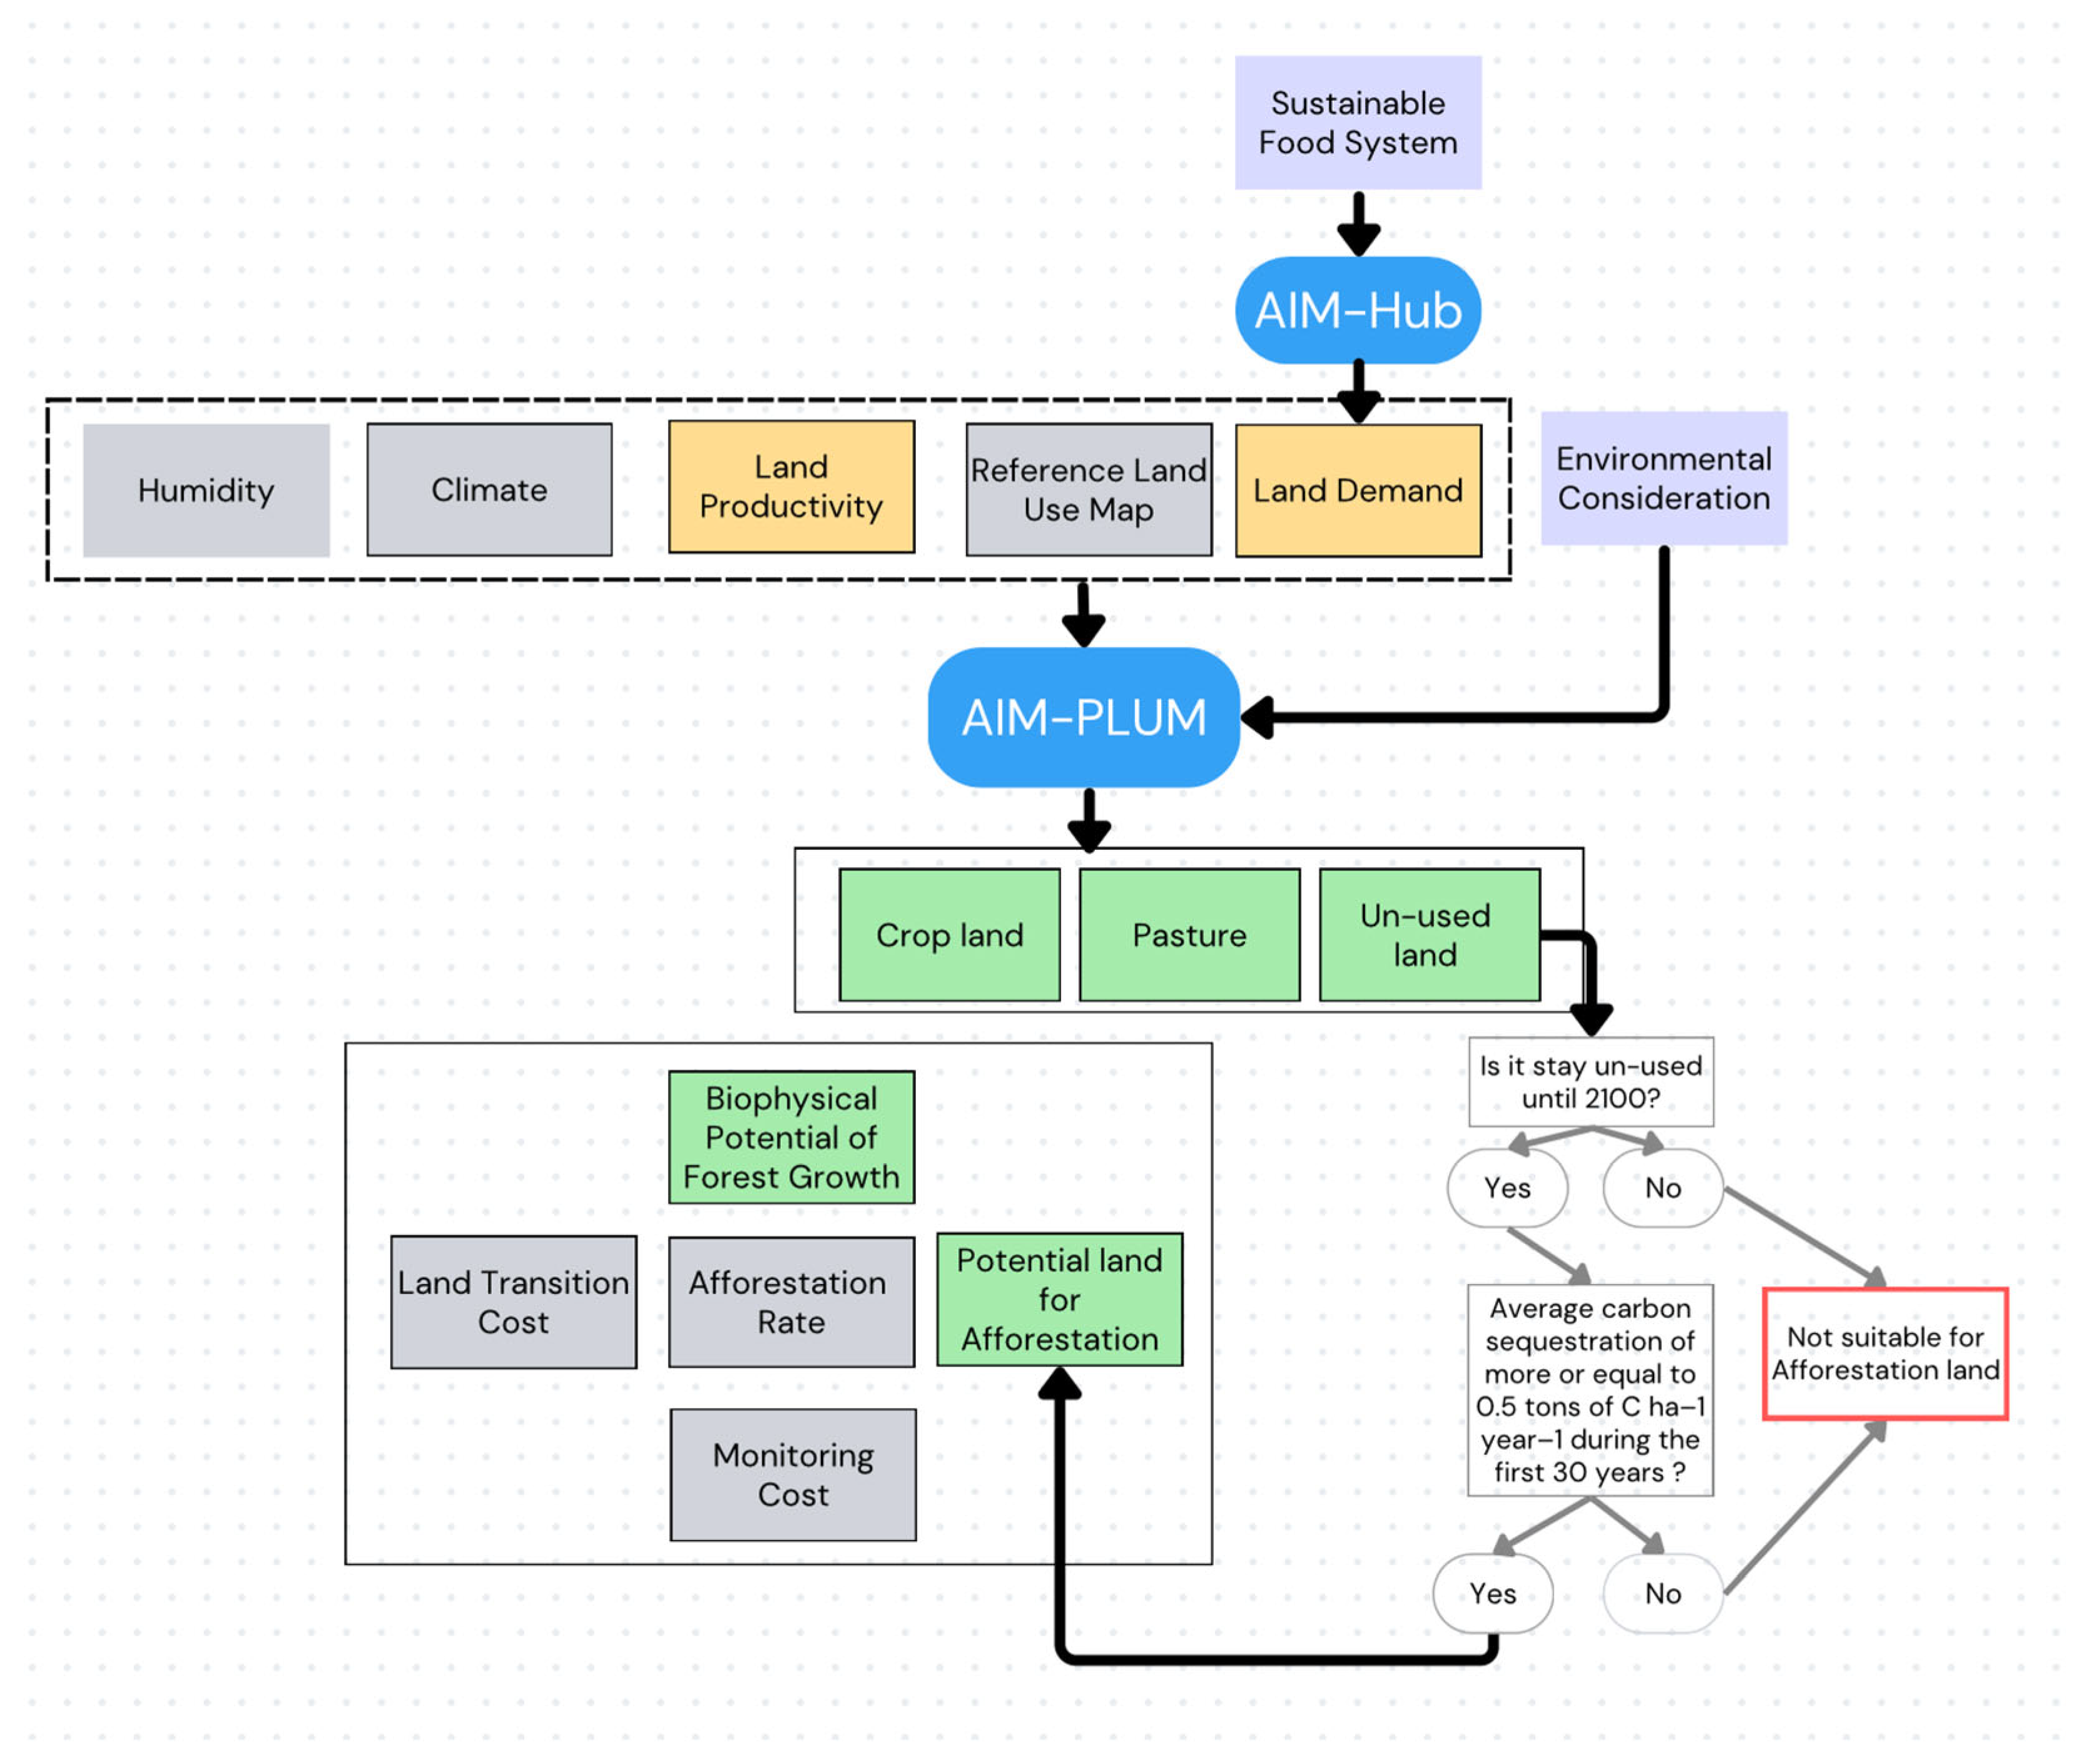
The assessment consisted of four main steps. First, future land use demands for cropland, pasture, bioenergy crops, and forests were projected considering each scenario using the AIM-Hub model and spatially allocated to 0.5° × 0.5° grid cells using the AIM-PLUM model. Second, land suitable for afforestation was identified from the remaining unused land using a set of sustainability and biophysical criteria. Third, afforestation carbon sequestration potential was estimated by combining suitable afforestation area with region-specific forest growth functions. Finally, the economic feasibility of afforestation was evaluated through cost estimation and the construction of carbon supply curves (Figure 1).
Figure 1.
Schematic representation of the framework for estimating global afforestation carbon sequestration potential. Blue boxes indicate the models used; purple boxes indicate scenario set-up; yellow boxes indicate key land-related inputs; green boxes indicate land-use outputs and input for afforestation potential; and gray boxes indicate other explanatory inputs. Black arrows represent the main model/data flow, while gray arrows indicate the land-selection and decision-making process.
- a.
- Land demand estimation and spatial allocation
The study framework (Figure 1) began with an assessment of the regional land area used for crops, grass, bioenergy, and forest, which were derived using the Asia-Pacific Integrated Model–computable general equilibrium model (AIM-Hub) (formerly named AIM-CGE) for each scenario. The demand was then input into the Asia-Pacific Integrated Model–Platform for Land Use and Environmental Model (AIM-PLUM), which disaggregated the data into 0.5° grid cells.
The AIM-Hub was developed by Fujimori et al. [33] and has been widely used for climate change studies [31,34,35,36,37,38,39]. In AIM-Hub, supply, demand, trade, and investment are described as individual behavioral functions that respond to changes in the price of production factors and commodities, in addition to changes in technology. The functions also respond to preference parameters based on the assumed population, gross domestic product (GDP), and consumer preferences. The model contains 42 industrial classifications, including 10 agriculture sectors, and has 17 regions. Production functions are formulated as multi-nested constant elasticity substitution (CES) functions where land is a production factor for agricultural and forest commodities. Allocation of land by sector is formulated as a multinomial logit function to reflect differences in substitutability across land categories with land rent [35].
The projected regional land use demands were subsequently downscaled to a spatial resolution of 0.5° × 0.5° using AIM-PLUM, a spatially explicit global land use allocation model based on profit maximization [34]. For cropland, the allocation was predicated on profit maximization, with a portion of the land use categories selected to yield the greatest profit within the constraints of specific biophysical land productivity, land, and irrigation maps for the base year and established costs associated with land conversion and carbon pricing. Due to the lack of data for projecting future profit distribution from livestock products, adjustments to pasture land were made by either expanding or reducing it around the base-year distribution to align with the required pasture area. These modifications were guided by the objective of minimizing land development costs. The cropland and pasture areas were allocated to unprotected areas, while forest and other natural vegetation were allocated to other land according to the carbon stock density, with the variation over time monitored in each grid cell. A threshold of carbon stock density between forest and grassland was determined to ensure that the forest area was the same as the statistically determined forest area. The allocation was conducted in 10-year steps.
- b.
- Identification of suitable land for afforestation carbon sequestration potential
This study focuses on the technical potential of afforestation and reforestation (A&R). Because the carbon sequestration potential of afforestation and reforestation is assumed to be comparable, both activities were represented using the same sequestration approach. Carbon sequestration was estimated based solely on changes in aboveground and belowground living biomass carbon stocks [40].
Potential afforestation land was therefore identified from land that remained available after satisfying projected demands for food production, livestock grazing, bioenergy production, and other land uses (Figure 1). These areas primarily consisted of grasslands and bare lands and were subsequently screened using a series of sustainability and biophysical criteria to determine their suitability for afforestation.
First, only grid cells with an average carbon sequestration rate exceeding 0.5 tC ha−1 yr−1 during the first 30 years after planting were considered suitable. This criterion excluded locations where forest growth was insufficient to provide meaningful carbon sequestration benefits [41]. Second, to ensure the long-term permanence of afforestation and minimize future land use conflicts, only land projected to remain unused throughout the century (until 2100) was considered eligible (Figure S2). Third, afforestation expansion was constrained by an afforestation rate assumption based on the Global Forest Goal of increasing global forest area by 3% [42] (Equation (1)). This constraint reflects practical limitations on large-scale implementation and avoids unrealistically rapid land conversion.
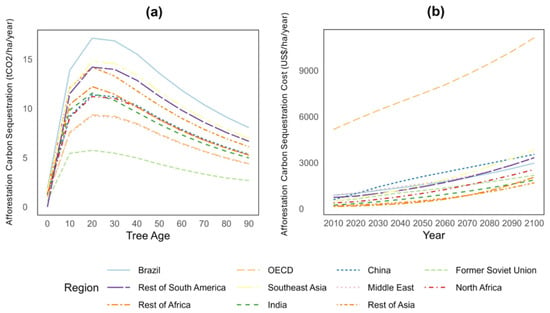
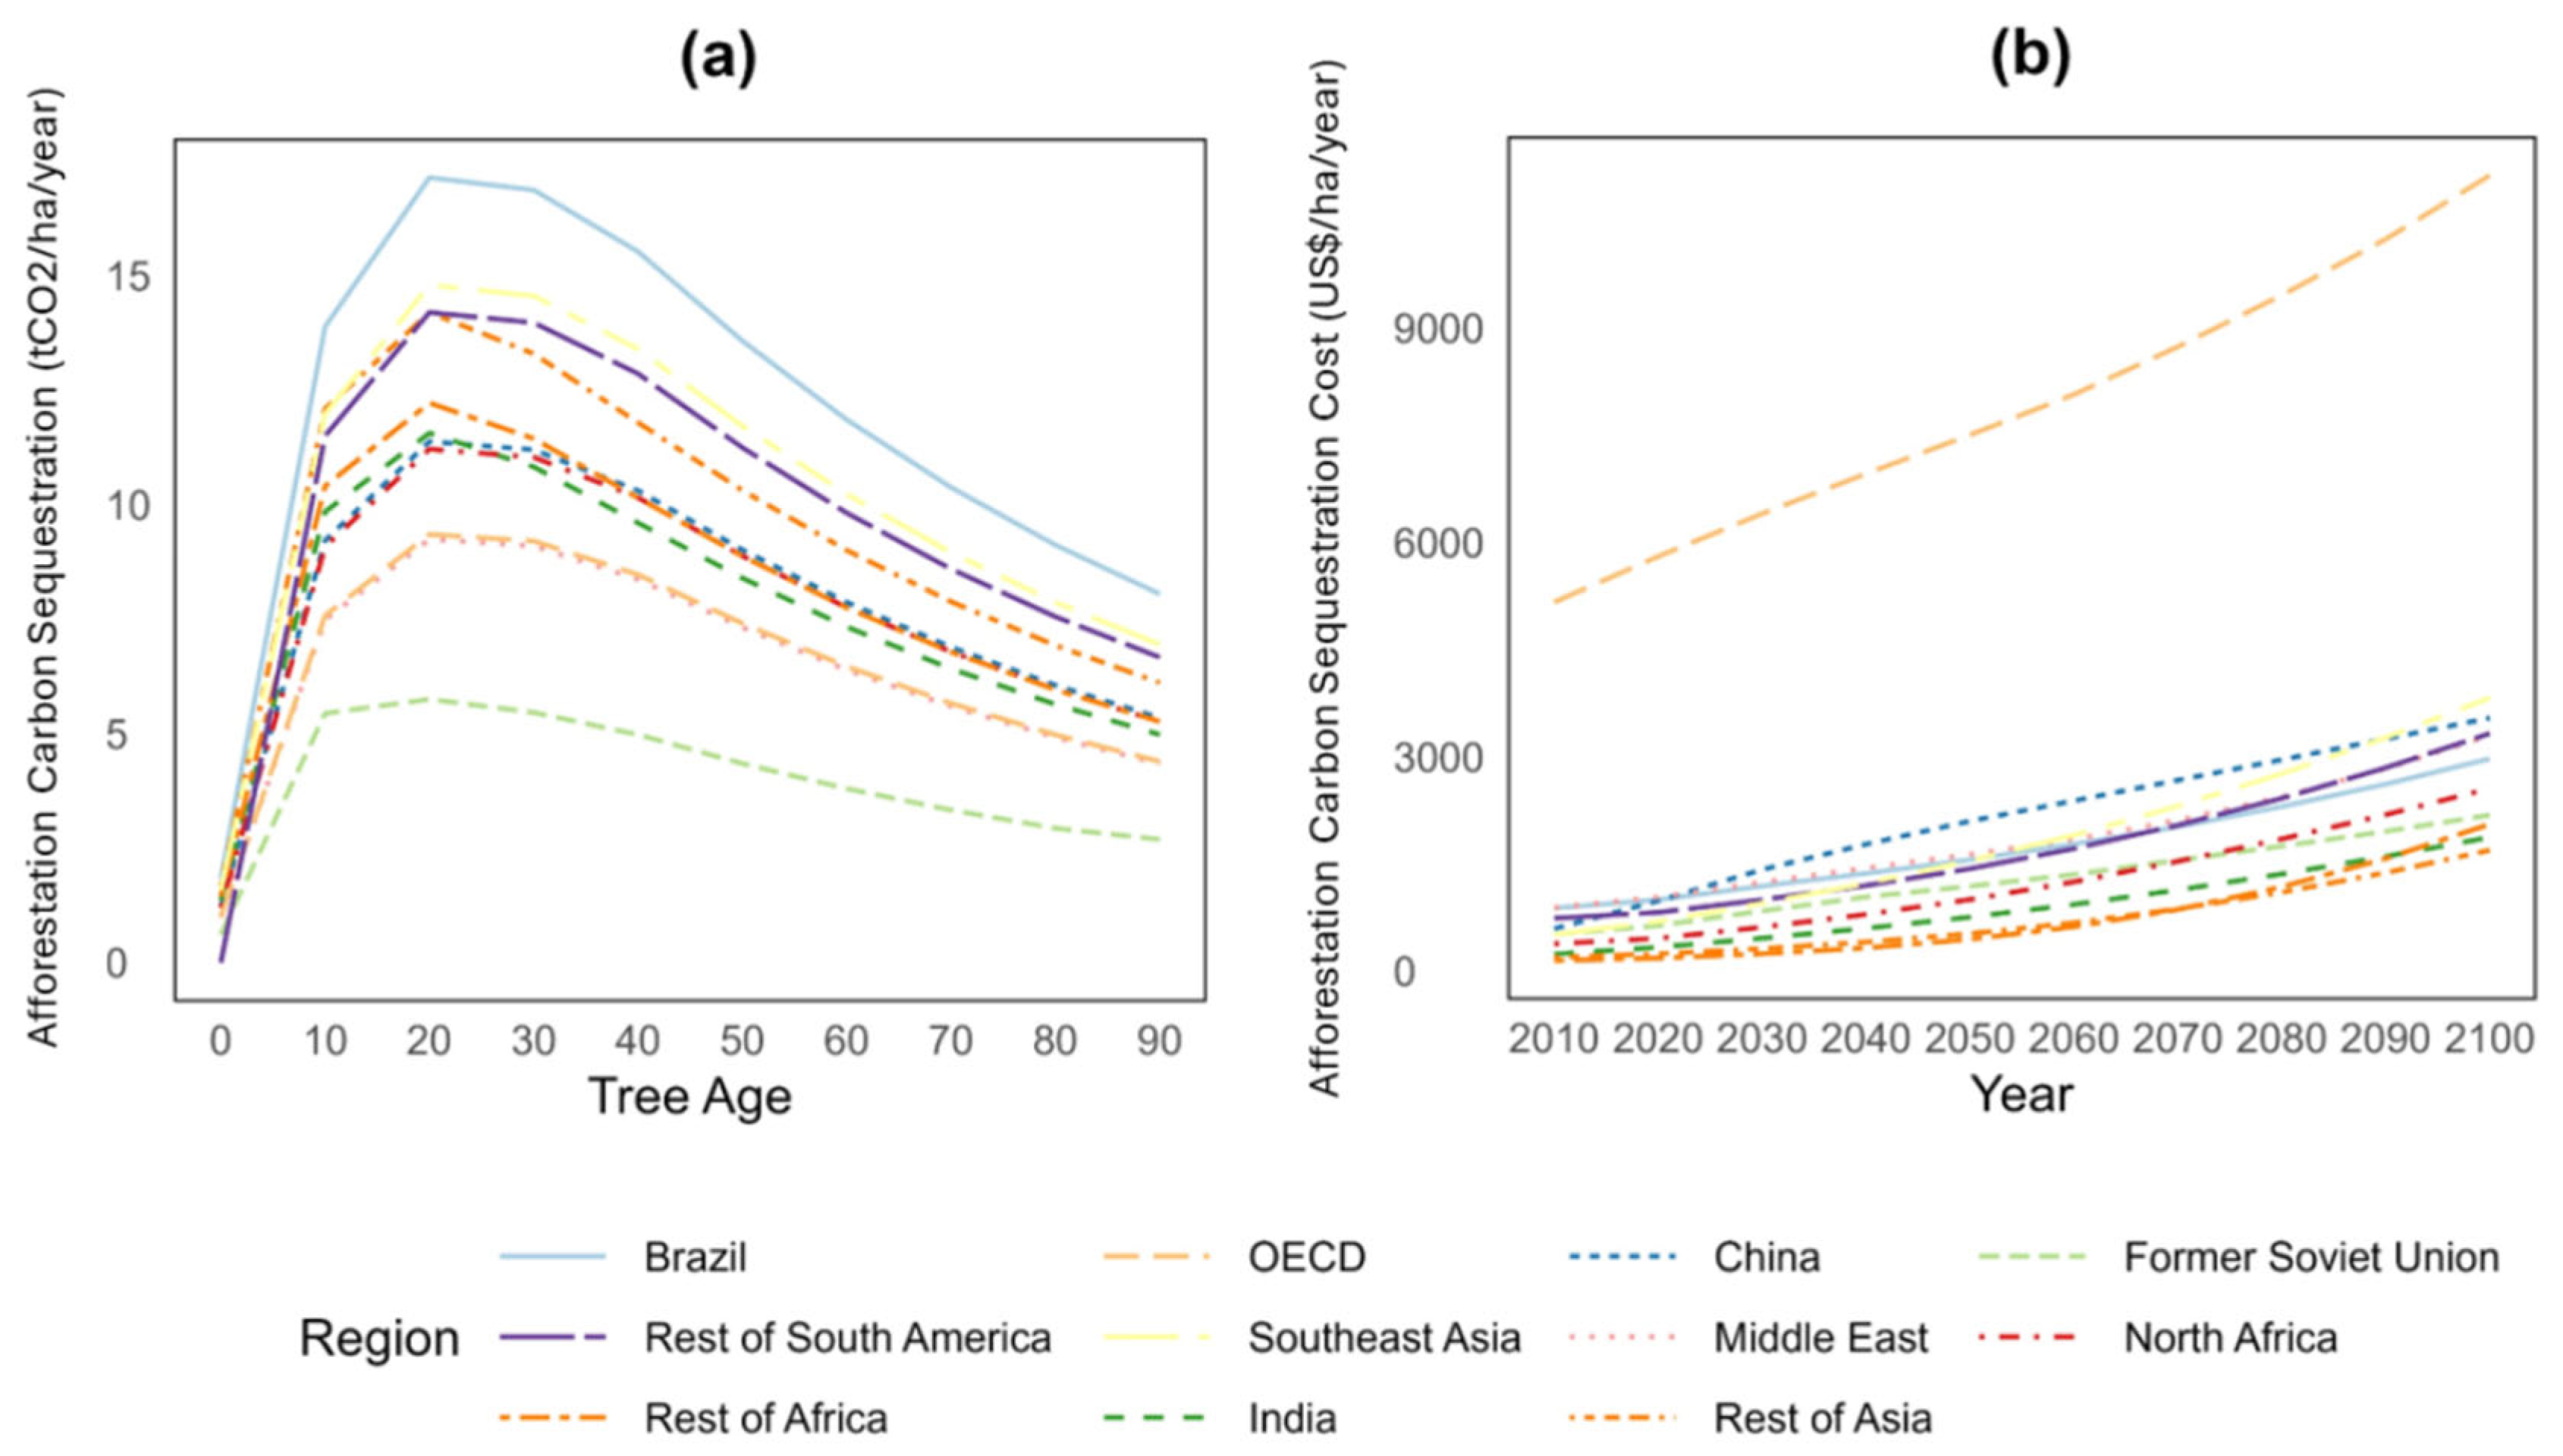
Finally, afforestation carbon sequestration potential was estimated by combining suitable afforestation area with age-dependent forest biomass growth (Equation (2)). Biomass accumulation was calculated using the timber yield function developed by Sohngen et al. [43], while potential biomass carbon stock densities were derived from IPCC agroecological zone (AEZ) data. The timber yield function captures variations in forest growth throughout stand development, allowing carbon sequestration rates to vary over time and across regions according to regional climatic and ecological conditions (Figure 2a).
Figure 2.
Regional average afforestation carbon sequestration potential under different tree ages (a) and costs over time (b).
= Afforested land area (Mha);
= Potential land available for afforestation (Mha);
= Annual afforestation rate based on global forest target;
= Number of years (e.g., 100 years).
= Global afforestation carbon sequestration potential (GtCO2/year);
= Forest biomass growth or carbon uptake (tCO2/ha).
- c.
- Cost estimation and supply curve construction
The economic feasibility of afforestation carbon sequestration potential was evaluated by estimating implementation costs and constructing carbon supply curves. Afforestation carbon sequestration potential costs were calculated as the sum of land transition and monitoring costs. Opportunity costs were not included because afforestation was restricted to land that was not allocated to competing uses within the model framework. Consequently, the estimated costs represent the direct expenditures required for afforestation establishment and management.
Land transition costs represent the initial cost of converting non-forest land to forest. These costs are treated as a one-time payment and include site preparation, planting, maintenance (e.g., mowing, weed control, herbicide application, tilling, and protection from herbivores), and replanting, based on Doelman et al. [18] (Figure 2b). Monitoring costs for verifying carbon stocks for carbon payment eligibility are also considered. Winsten et al. [44] estimated these costs at US$71.70/ha over a 20-year project in the United States. Using a 4% discount rate, this corresponds to US$5.25/ha/year. To estimate costs for other regions, we assume that half of the cost represents capital costs that are similar across regions, while the other half represents labor costs that vary with regional GDP per capita. Based on this approach, conversion costs range from approximately US$862/ha in Eastern Africa to US$1633/ha in the United States, while monitoring costs range from US$2.66 to US$5.25/ha/year. These estimates are broadly consistent with previous studies [11,12]. Over time, U.S. conversion and monitoring costs are assumed to increase with U.S. GDP per capita. Costs in other regions are adjusted according to changes in their GDP per capita relative to the United States.
Spatially explicit carbon supply curves were constructed by estimating afforestation carbon sequestration potential and associated costs for each 0.5° × 0.5° grid cell [44,45]. Grid cells were ranked according to their mitigation costs, and cumulative afforestation carbon sequestration potential was calculated across progressively increasing cost thresholds to derive regional and global supply curves. These supply curves illustrate the quantity of carbon sequestration that can be achieved at different cost levels and provide a basis for evaluating the economic feasibility of afforestation program (Figure S3).
3. Scenario Settings
Our study was designed around seven scenarios, each with several environmental considerations and sustainable food systems, as outlined in Table 1. The socioeconomic conditions for all scenarios were based on the ‘middle-of-the-road’ SSP2 scenario narrative, which anticipates intermediate challenges for adaptation and mitigation [46]. This scenario assumes that current trends will persist in social, economic, and technological development with no influence from climate change impacts and mitigation policies. The model parameters are based on Fujimori et al. [36].
Table 1.
Scenario Settings.
3.1. Biodiversity Protections
We used two sources to obtain spatial information on protected areas: the World Database for Protected Areas (WDPA) [47] and the World Database of Key Biodiversity Areas (KBAs) [48]. As of 2018, the WDPA covered an area of 33.6 million km2, and the KBA covered an area of 19.9 million km2. We identified biodiversity sensitive areas using a spatially explicit biodiversity index provided by AIM/Biodiversity. This index was used with climate variables and the proportion of land use types in 2005 to predict the potential habitat of 9025 species using the MaxEnt model [49]. It was used to calculate a biodiversity index for each grid cell based on the distribution of potential habitat for the 9025 species [23].
In the baseline scenario (BAU), no environmental consideration and no sustainable food system were applied. We only protected forest protected areas (WDPA) from the land allocation projection, including afforestation. In biodiversity protection, we designated areas rich in biodiversity protected zones, including key biodiversity areas (KBAs) identified by BirdLife International [48], and other biodiversity sensitive regions. This designation excluded these areas from the potential allocation of activities such as afforestation. While afforestation projects may sometimes benefit biodiversity, their implementation requires careful consideration to avoid unintended ecological consequences. Furthermore, approximately 54% of KBA areas are covered by forests [50], with the remainder made up of a range of natural habitats, from reefs and mountains to marshes and ocean depths. Given this rich biodiversity, we prioritized these areas as protected zones to safeguard their ecological significance and prevent habitat loss or degradation.
3.2. Soil Quality Enhancements
Restoring degraded land through afforestation and sustainable forest management (SFM) practices is essential to ensure ecological stability and sustainability in the face of climate change [51]. To enhance soil quality, we prohibited the use of degraded land for other purposes and allocated it specifically to afforestation. Degraded lands typically have low stocks of soil organic carbon (SOC), presenting a significant opportunity for SOC restoration. Because soil plays a crucial role in carbon capture and storage, identifying management practices to restore SOC stocks in degraded lands is imperative. In this context, afforestation not only improves land quality but also contributes to ecological restoration and long-term climate change mitigation.
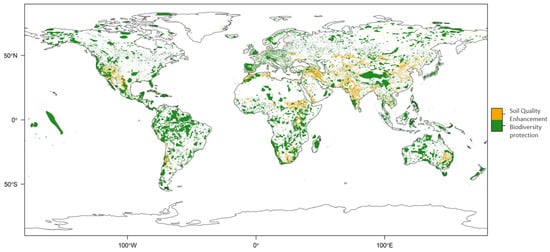
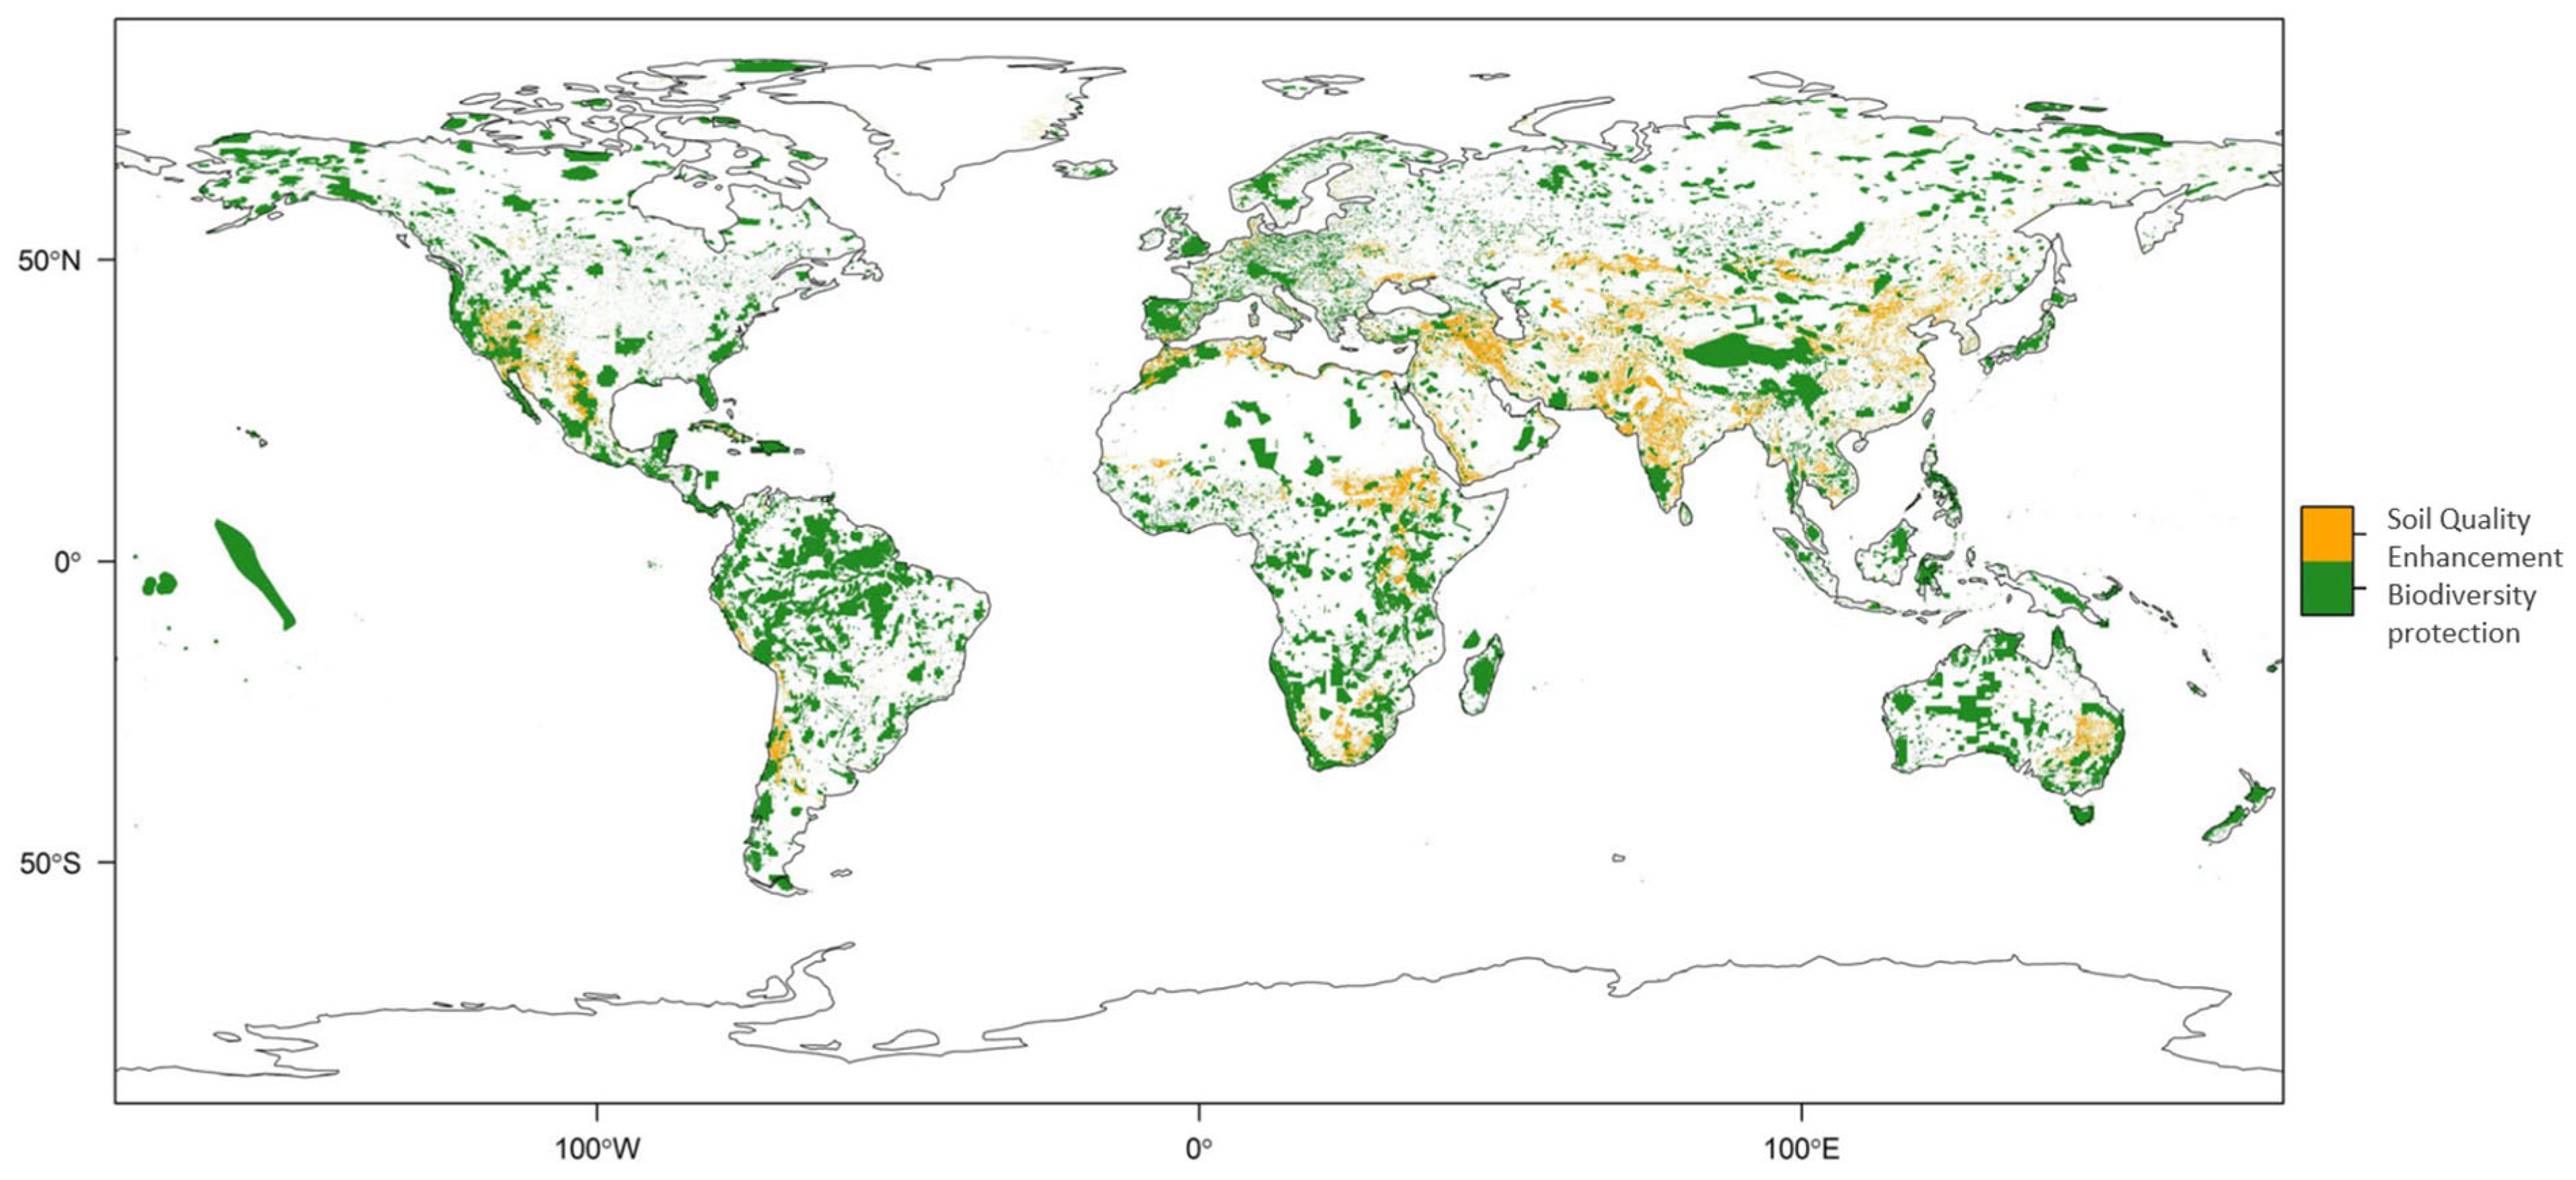
Compared to agriculture or grassland, the reforestation of arid land with a low initial SOC stock results in the land having a greater potential to function as a carbon sink [52]. The degraded land information in this study was based on data estimated by the Global Land Degradation Information Systems (GLADIS) dataset [53,54]. A map illustrating the environmental consideration scenario settings is presented in Figure 3.
Figure 3.
Map for environmental consideration scenario settings. Biodiversity protected zone (World Database for Protected Areas (WDPA) (forest protected area) [47] combined with World Database of Key Biodiversity Areas (KBAs) 47 and biodiversity sensitive area (for biodiversity protection scenario)). Severe and serious degraded land information estimated by Global Land Degradation Information Systems (GLADIS) dataset [53] (for soil quality enhancement scenario) (yellow). The Figure was reconstructed based on Wu et al. [19].
In our study, environmental considerations are framed from a land use perspective. It focuses on factors that directly constrain or influence land allocation within the integrated assessment model. Biodiversity protection is represented by excluding ecologically sensitive and high-biodiversity areas from afforestation and other land use options, which limits afforestation to environmentally suitable land. Moreover, soil quality enhancement is considered implicitly through afforestation. Although we do not explicitly model changes in soil physical, chemical, or biological properties—including soil organic carbon (SOC)—extensive literature shows that afforestation, particularly on degraded or underutilized land, improves soil quality over time (e.g., [55]). These improvements occur through increased organic matter inputs, reduced erosion, and enhanced nutrient cycling. Based on this evidence, we assume that afforestation contributes to soil quality enhancement. Other environmental dimensions—such as water availability, soil salinization, and nutrient runoff—are not explicitly represented in this global land use framework.
3.3. Dietary Shifts and Food Waste Reductions
In the dietary shift and food waste reduction scenario, we assumed a transition toward a healthier, more sustainable diet, with a significant increase in plant-based protein consumption. Specifically, people would consume more beans, lentils, and pulses, reducing their intake of red meat and dairy products. This shift aligns with the recommendations of the EAT-Lancet Commission, which advocates for a 50% reduction in red meat and sugar consumption by 2050 to improve both public health and environmental sustainability [56]. Additionally, the total daily food demand per capita was capped at 2503 kcal, in accordance with global dietary guidelines, to ensure balanced and sustainable nutrition.
This dietary transformation was coupled with food loss and waste reduction, as outlined in SDG 12.3, which aims to reduce global per capita food waste by 50% by 2030 [57]. These targets, extending through to 2100, require long-term commitment to both dietary shifts and food waste reduction, forming a crucial component of our overarching sustainability strategy. By reducing food waste and promoting plant-based diets, less farmland would be needed to meet global food demands, thus freeing up agricultural land for other uses.
One key outcome of this scenario is the potential to increase the land available for afforestation, which could enhance carbon sequestration and facilitate the restoration of natural vegetation. This, in turn, would contribute to climate change mitigation by boosting carbon capture in the form of restored forests and other ecosystems, as supported by [32].
3.4. Trade and Irrigation Intensifications
In this study, trade openness was modeled by adjusting trade elasticities to reflect changes in global economic conditions. For both the baseline and the environmental consideration scenarios, the default trade elasticities of AIM-Hub (based on the SSP2 scenario) were used. These elasticities represent a moderate pathway with balanced economic growth and trade flows. In terms of crop irrigation, we considered both rain-fed and irrigated systems, following the assumptions outlined by the Agricultural Model Intercomparison and Improvement Project (AgMIP) [58], which provides a comprehensive framework for agricultural modeling under different climate and socioeconomic conditions.
To account for changes in global trade and technological advancements, we modified the trade and irrigation parameters in the food trade and technological advancement scenarios. In the SSP1 scenario, which assumes a more globally integrated economy with reduced trade barriers, international trade volumes were increased. This scenario envisions greater economic openness, where barriers to trade are lowered, which facilitates the flow of goods and services across borders and, thus, promotes greater market efficiency.
Regarding irrigation technology, we adopted the advancements described by Hanasaki et al. [59], which predict an annual growth rate of 0.6% in irrigation technology adoption under SSP1. The rapid development of irrigation systems significantly enhances agricultural productivity, particularly by increasing crop yields. As irrigation technologies improve, agricultural intensification becomes more feasible. This development reduces the pressure to expand agricultural land, contributing to both higher efficiency in crop production and the potential for more sustainable land use.
Regarding both trade and irrigation, intensifications and dietary shifts and food waste reduction have been incorporated the environmental considerations. The scenario design details, including the assumptions for trade, technological advancement, and irrigation, are summarized in Table 1. Further information on scenario design can be found in past research [3,38,60,61].
4. Results
4.1. Global Afforestation Carbon Sequestration Potential
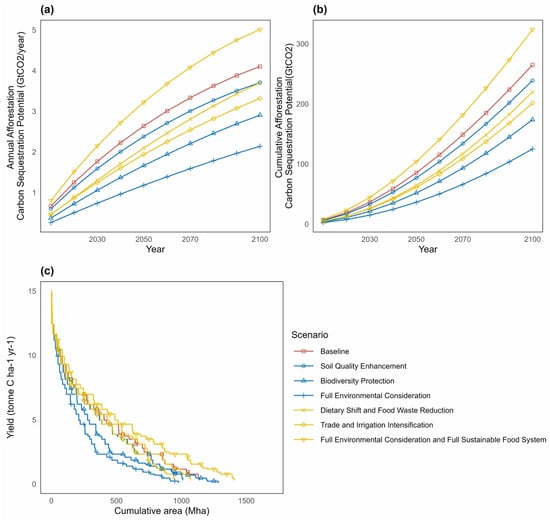
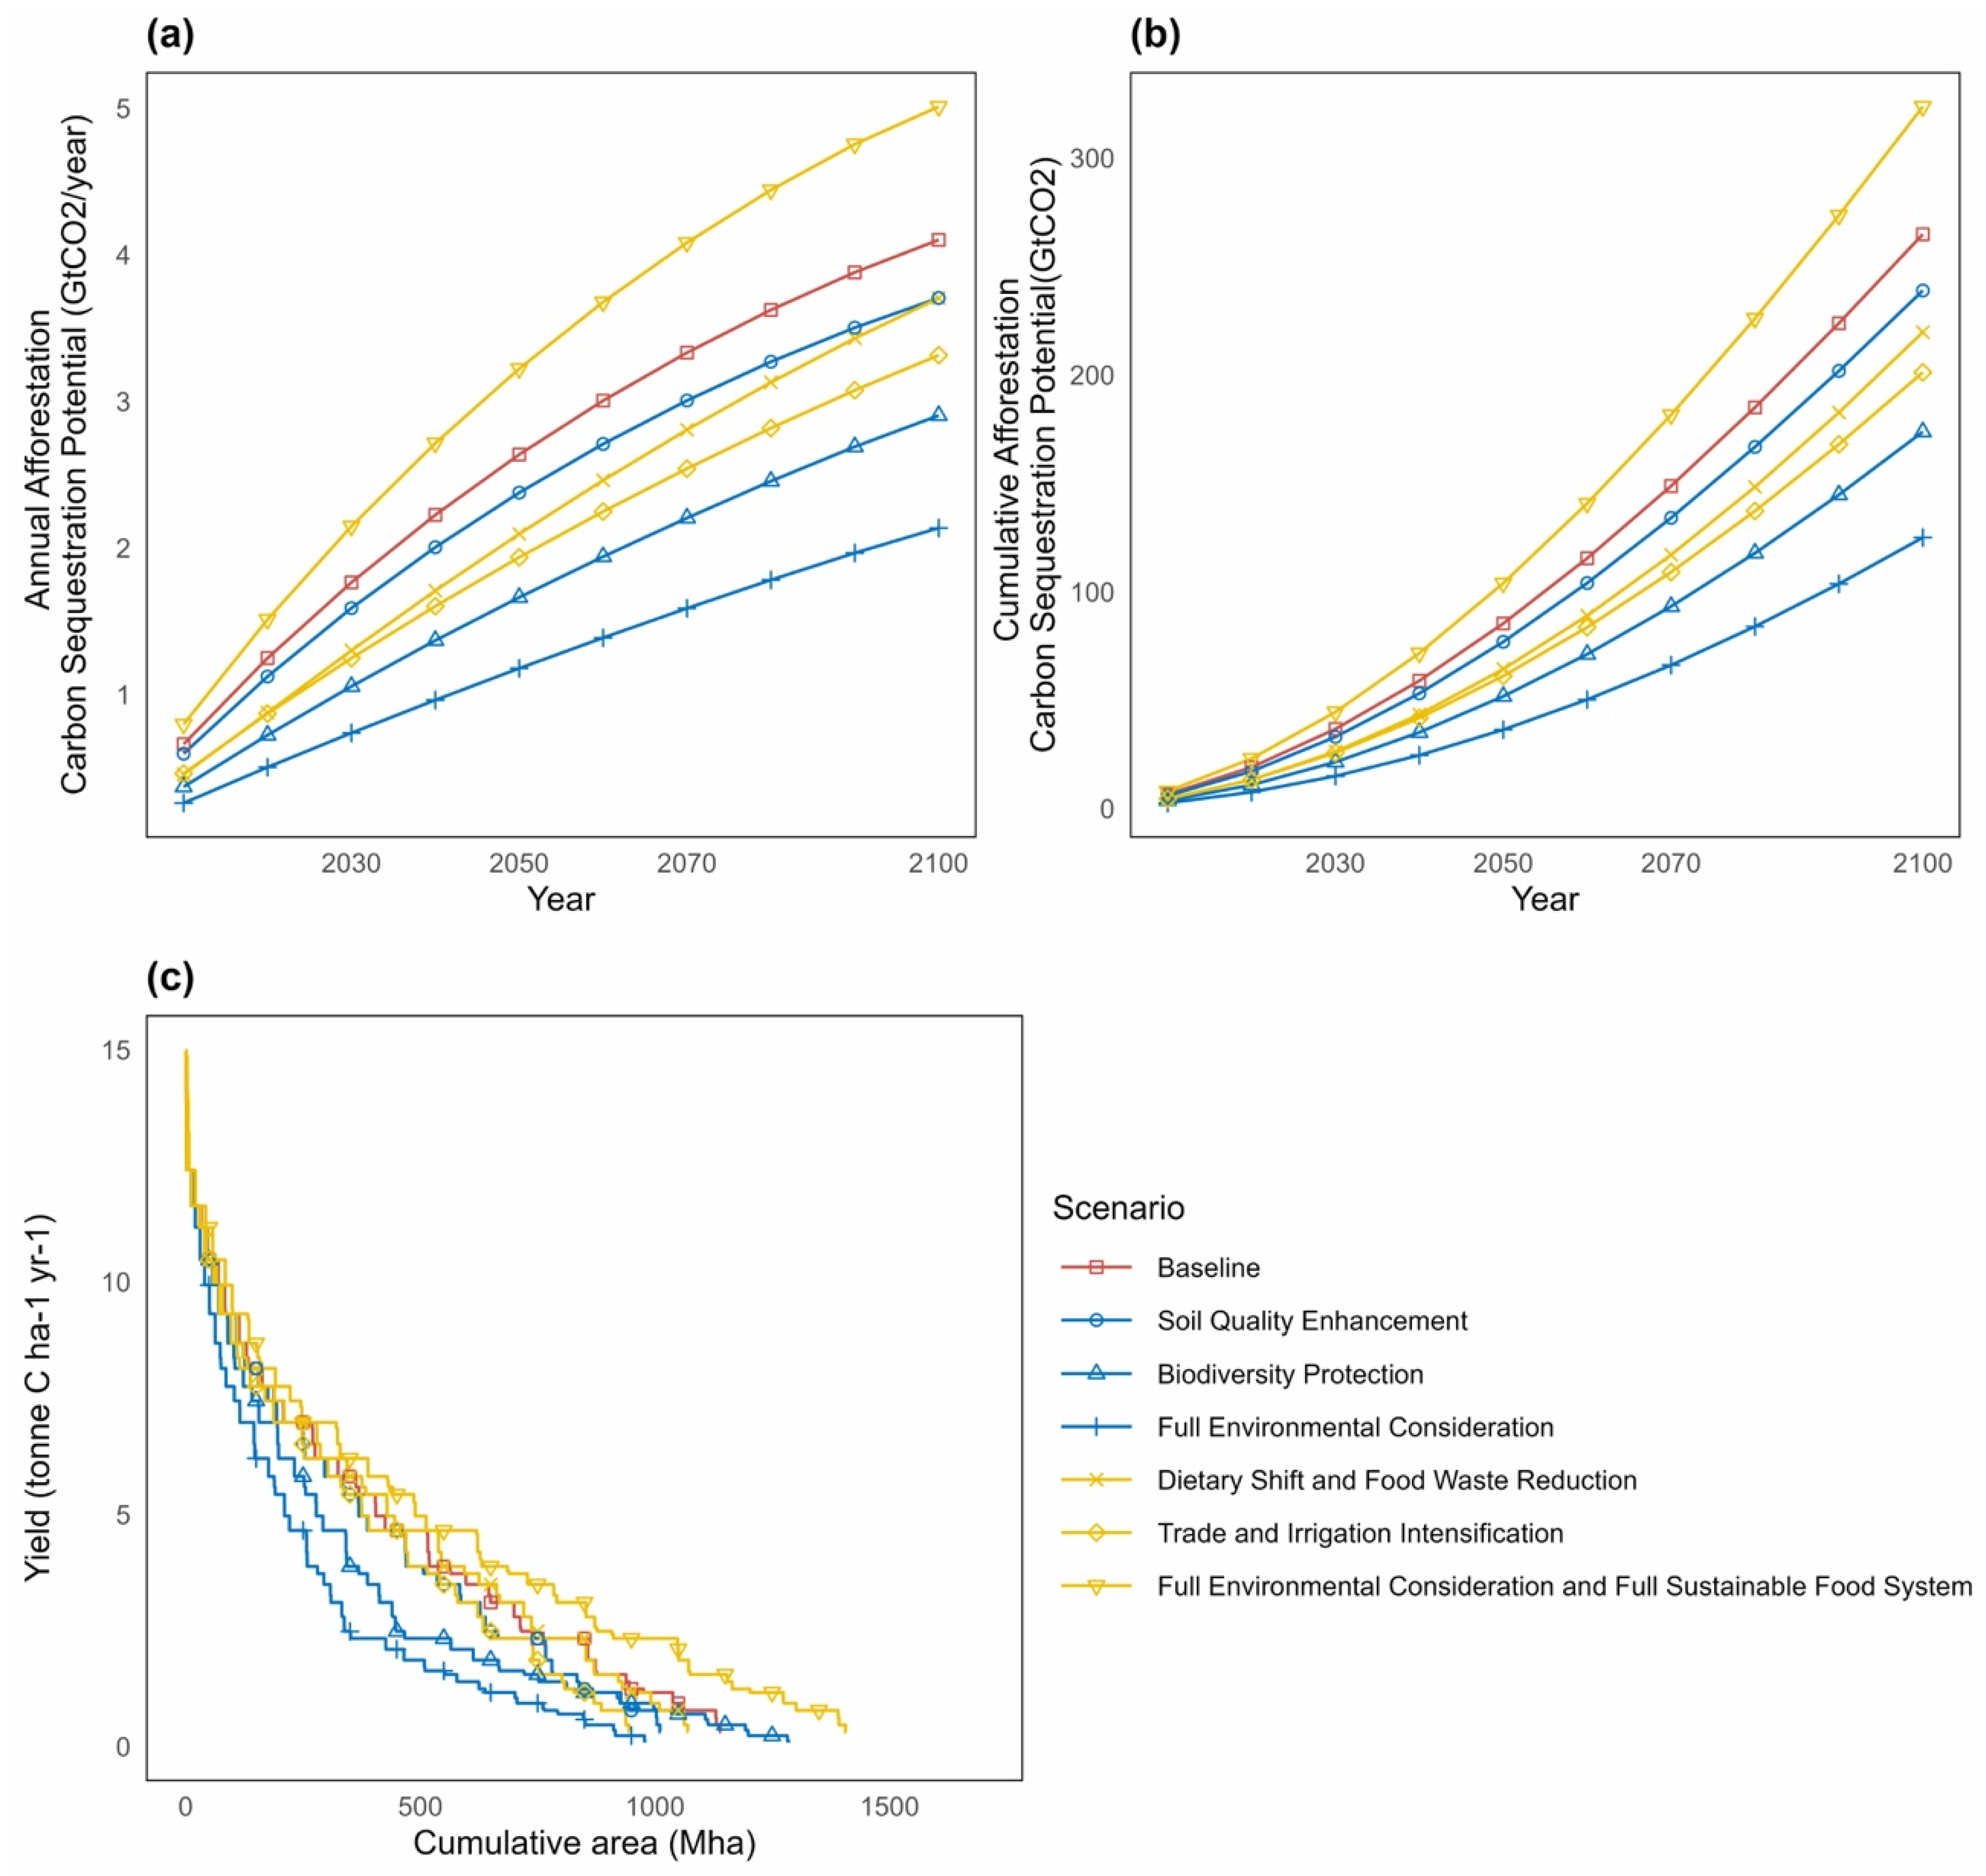
Our results show that, without environmental constraints, global afforestation could sequester up to 4.10 GtCO2 yr−1 by 2100 (264 GtCO2 cumulatively). When soil quality enhancement was introduced, this potential declined slightly to 3.70 GtCO2 yr−1. By contrast, biodiversity conservation had a stronger effect, reducing the sequestration potential to 2.90 GtCO2 yr−1 by 2100 (Figure 4a). When both soil quality enhancement and biodiversity protection were applied together (full environmental consideration scenario), the total afforestation carbon sequestration potential fell further to 2.13 GtCO2 yr−1 (124 GtCO2 cumulatively).
Figure 4.
Global annual (a) and cumulative (b) afforestation carbon sequestration potential and area–carbon sequestration supply curve under each scenario (c).
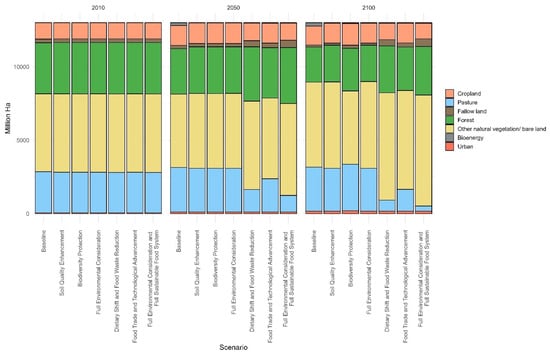
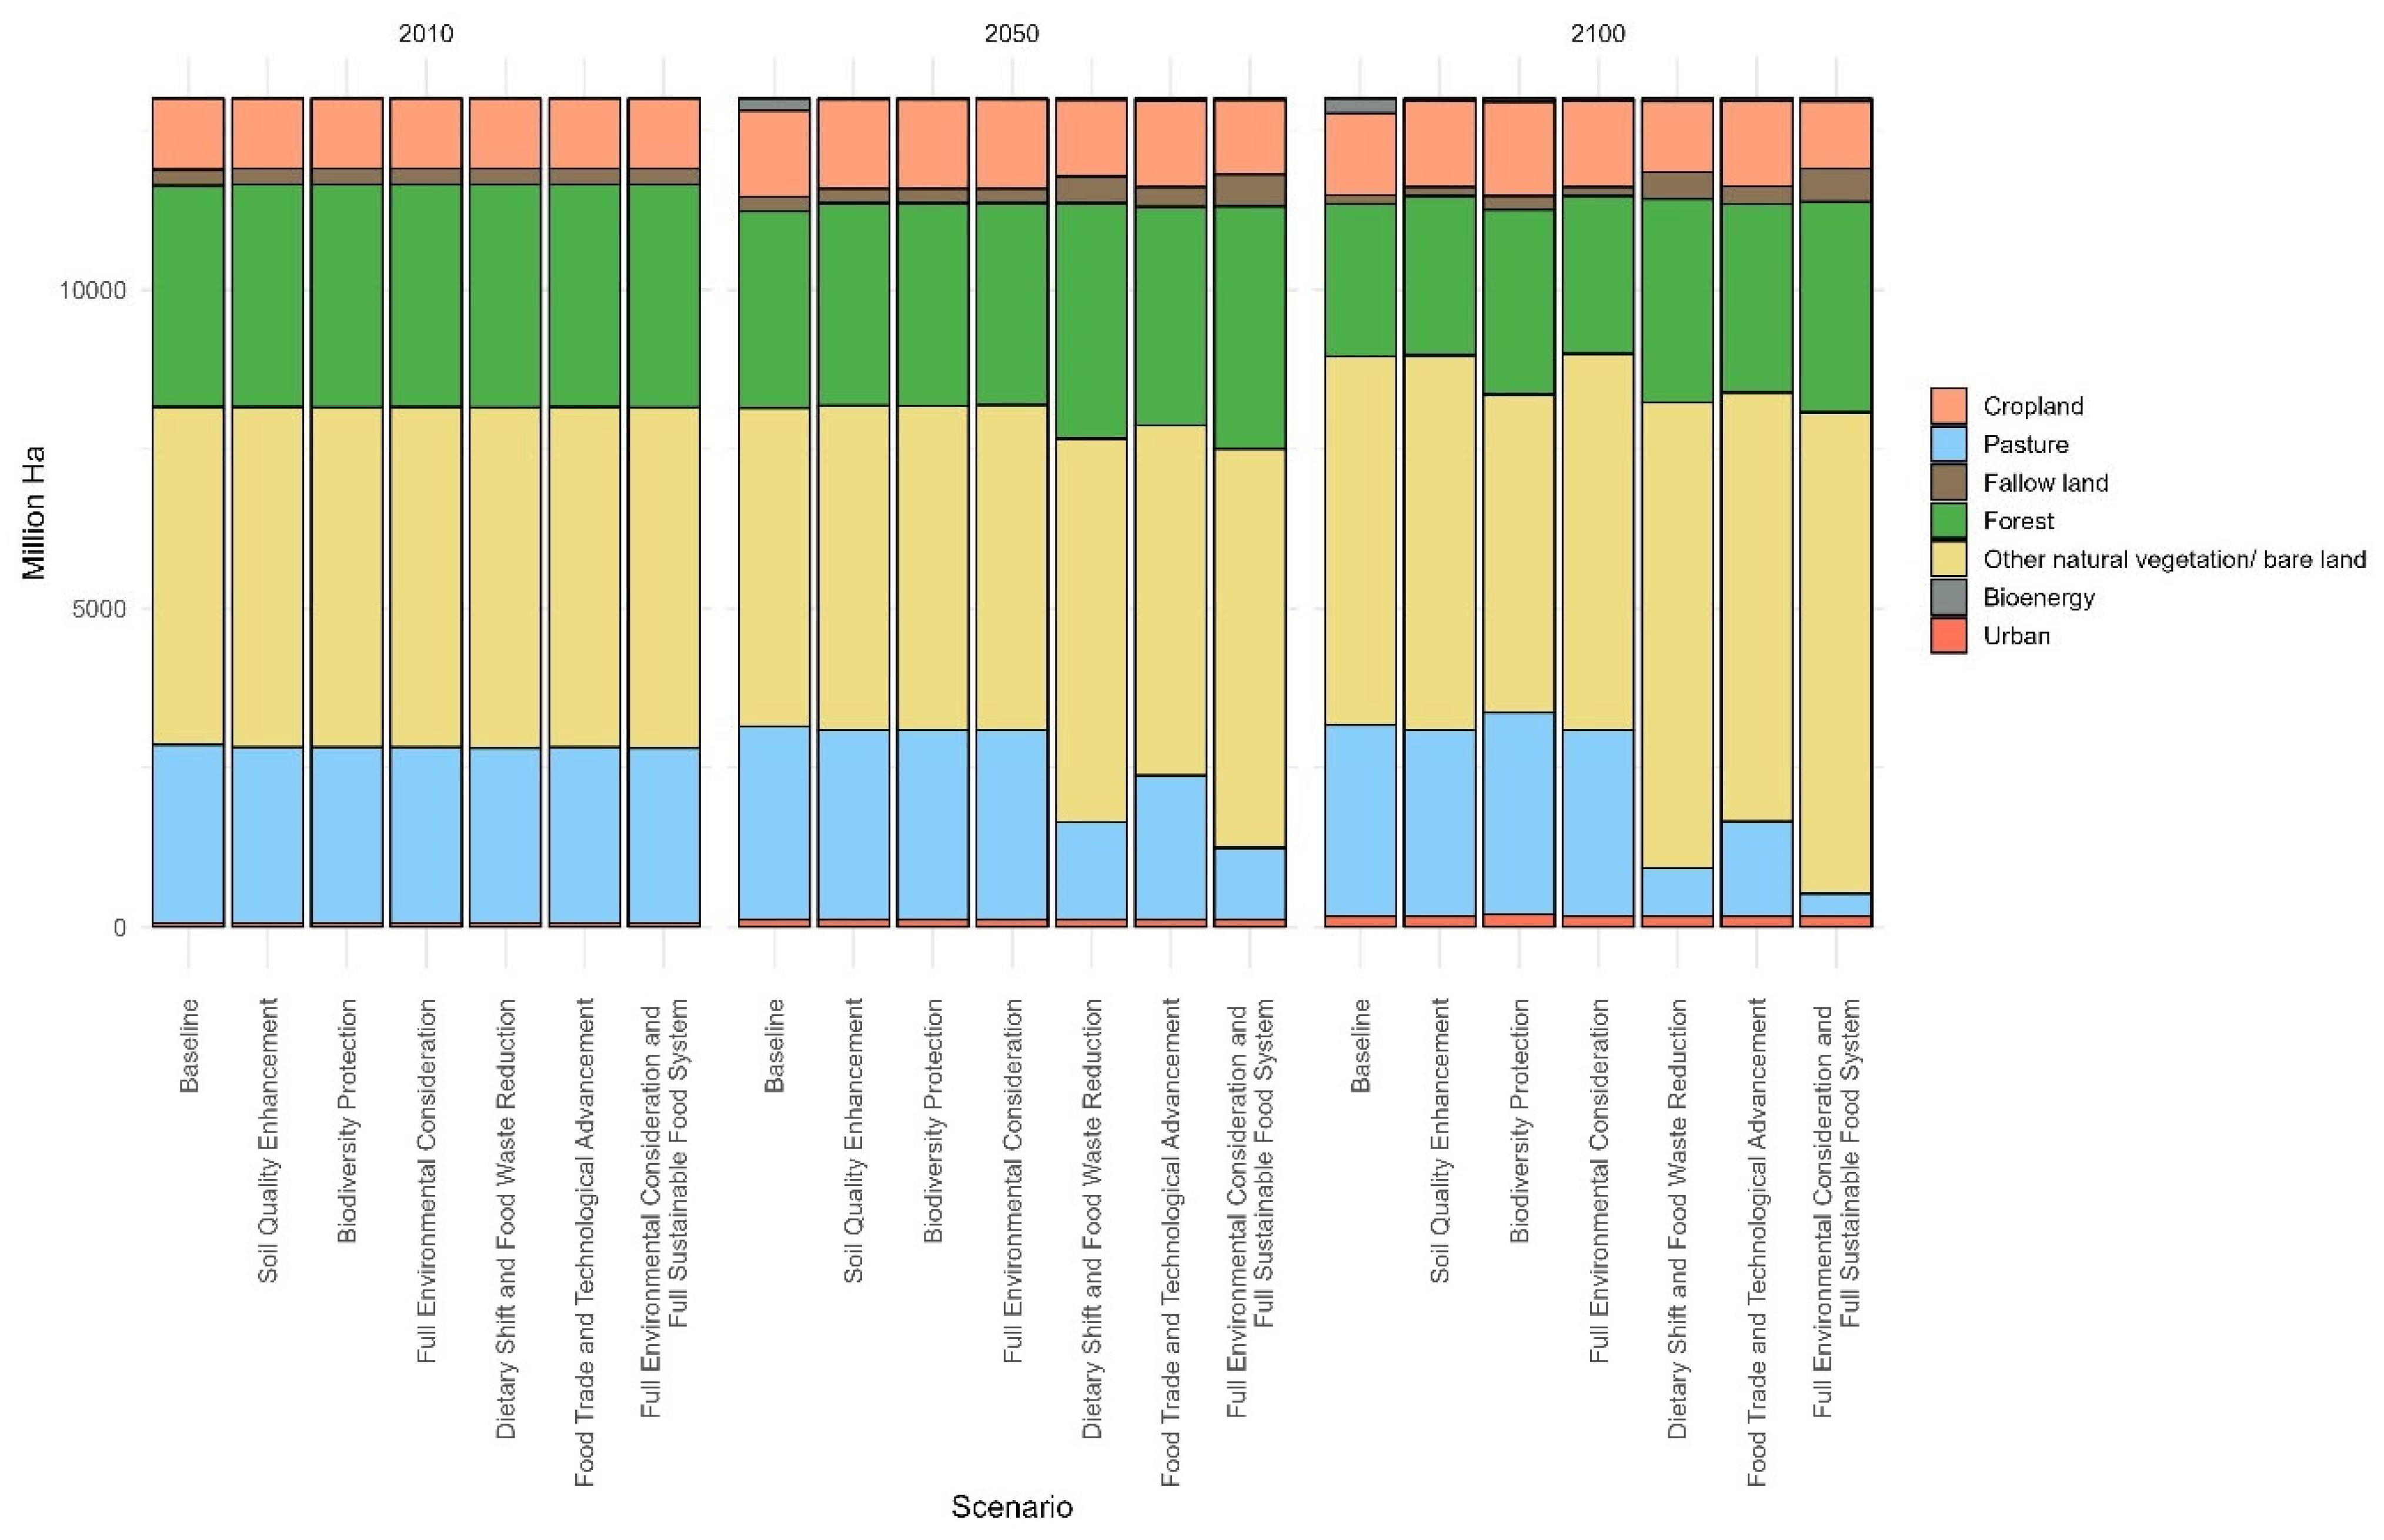
The reduction in carbon sequestration potential under scenarios incorporating environmental considerations is mainly driven by a reduction in the available land, particularly highly productive land. Environmental policies do not directly reduce agricultural land demand (Figure 5); rather, they protect certain areas and, consequently, shift land use allocation. As afforestation is considered only on land remaining after other land use allocations, environmental protection can reduce the area available for afforestation. These highly productive areas often contain rich ecosystems and are therefore prioritized for protection. Figure 4b illustrates the relationship between available land area and carbon sequestration rates across scenarios. Compared with the baseline scenario, all scenarios incorporating environmental considerations show a leftward shift in the curves, which indicates a reduction in the availability of land with high carbon sequestration rates. At very high sequestration rates, however, land availability decreases only slightly under environmental constraints.
Figure 5.
Global land use distribution in 2010, 2050, and 2100 under each scenario related to the land demand output from AIM-Hub.
A sustainable food system substantially enhances afforestation-driven carbon sequestration by increasing land availability (Figure 4b and Figure 5). Dietary shifts combined with food waste reduction increase it to 3.70 GtCO2 yr−1, while trade and irrigation intensification may increase it to 3.32 GtCO2 yr−1 in 2100. With the full implementation of a sustainable food system, the carbon sequestration potential could reach 5.01 GtCO2 yr−1 (323 GtCO2 cumulatively) even under full environmental considerations. The increased carbon sequestration potential under the sustainable food system scenario stems from additional high-productivity land, primarily due to reduced pasture land resulting from dietary shifts, food waste reduction, and improvements in trade and technology (Figure 5).
4.2. Regional Potential
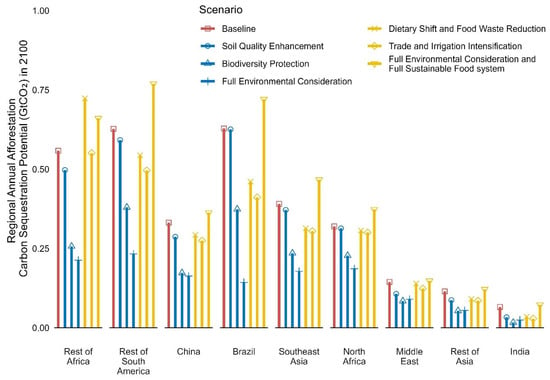
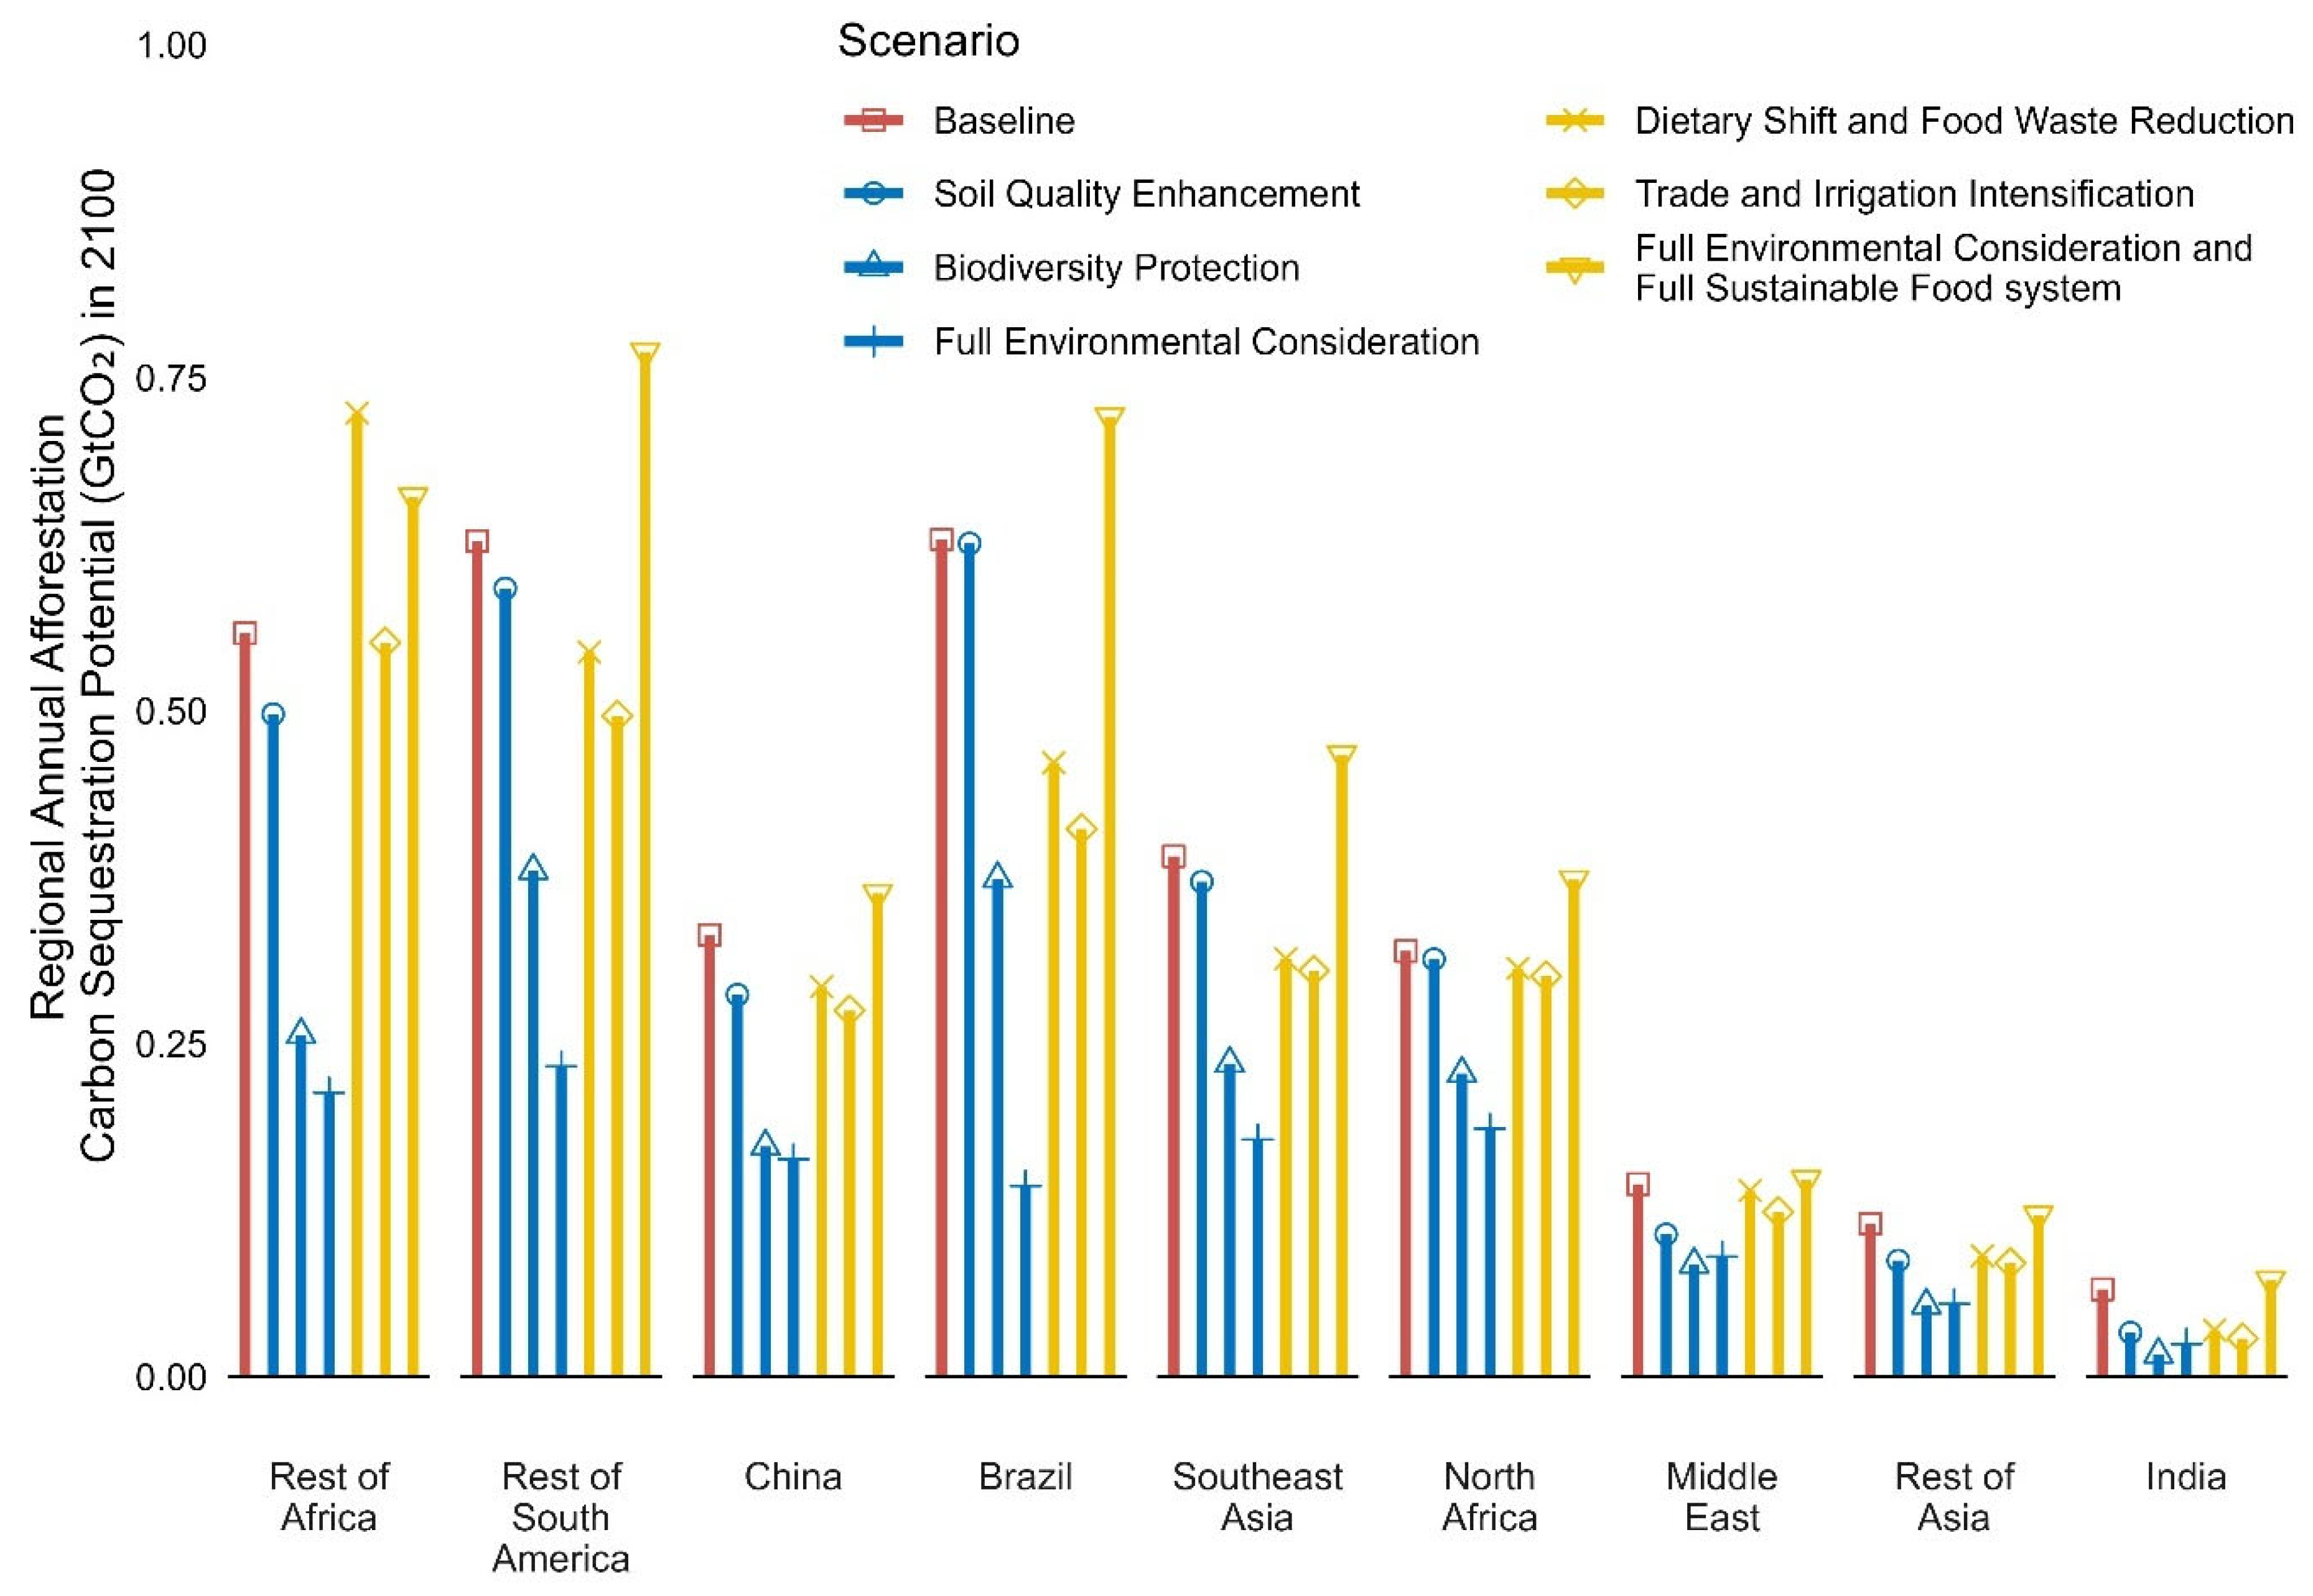
At the regional level, afforestation potential varies widely, as do the effects of environmental considerations and sustainable food system measures across regions. In the baseline scenario, Brazil and the Rest of South America were projected to be the largest suppliers of afforestation (0.7 GtCO2 yr−1 each region), accounting for 34% of the global amount, followed by the Rest of Africa (0.58 GtCO2 yr−1, 14%) and Southeast Asia (0.4 GtCO2 yr−1, 9%). These four regions accounted for more than half (57%) of the global carbon sequestration potential (Figure 6).
Figure 6.
Regional annual afforestation carbon sequestration potential under each scenario.
Environmental considerations reduced afforestation carbon sequestration potential unevenly across regions. Consistent with the global results, biodiversity protection constrained afforestation more strongly than soil quality enhancement across all regions. In China, India, the Middle East, North Africa, and the Rest of Asia, environmental considerations had only a limited effect on carbon sequestration potential. This is because these regions already have little suitable land available for afforestation. By contrast, the impact is stronger in the Rest of South America, Africa and Brazil, where large areas fall within biodiversity protected zones (Figure 3 and Figure 6). In OECD regions—including the United States, Türkiye, Australia, and parts of Europe—substantial areas of degraded land exist, yet environmental constraints reduced afforestation potential only modestly.
Sustainable food system strategies can substantially increase afforestation potential by freeing up more land for tree planting (Figure 6). Dietary shifts and reductions in food waste lower global food demand, reducing the amount of agricultural land required and easing pressure on land from the demand side. By contrast, food trade and technological improvements act on the supply side by increasing production efficiency through higher yields and more flexible trade. Overall, dietary shifts and food waste reduction deliver larger gains than trade and irrigation intensifications. The benefits are uneven across regions. South America shows the largest increase (+0.21 GtCO2/year in 2100), which reflects its high levels of meat consumption, with additional substantial gains in the Rest of Africa and Southeast Asia. On the other hand, regions like India and the Rest of Asia see limited gains from sustainable food system implementation.
While land availability is the most visibly impacted factor by scenario implementation, land productivity is also a key determinant of a region’s afforestation potential. For instance, Brazil and Southeast Asia have high biomass yields, enabling significant carbon sequestration with comparatively smaller land areas (Figure S3 and Figure 2a). By contrast, regions like the Rest of Africa, despite having large areas of land suitable for afforestation, experience lower biomass yields, which constrain their sequestration potential.
4.3. Cost of Carbon Sequestration
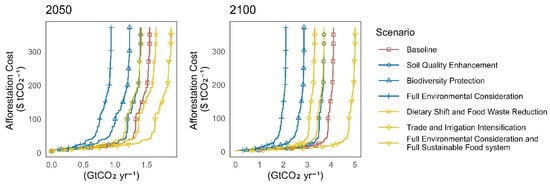
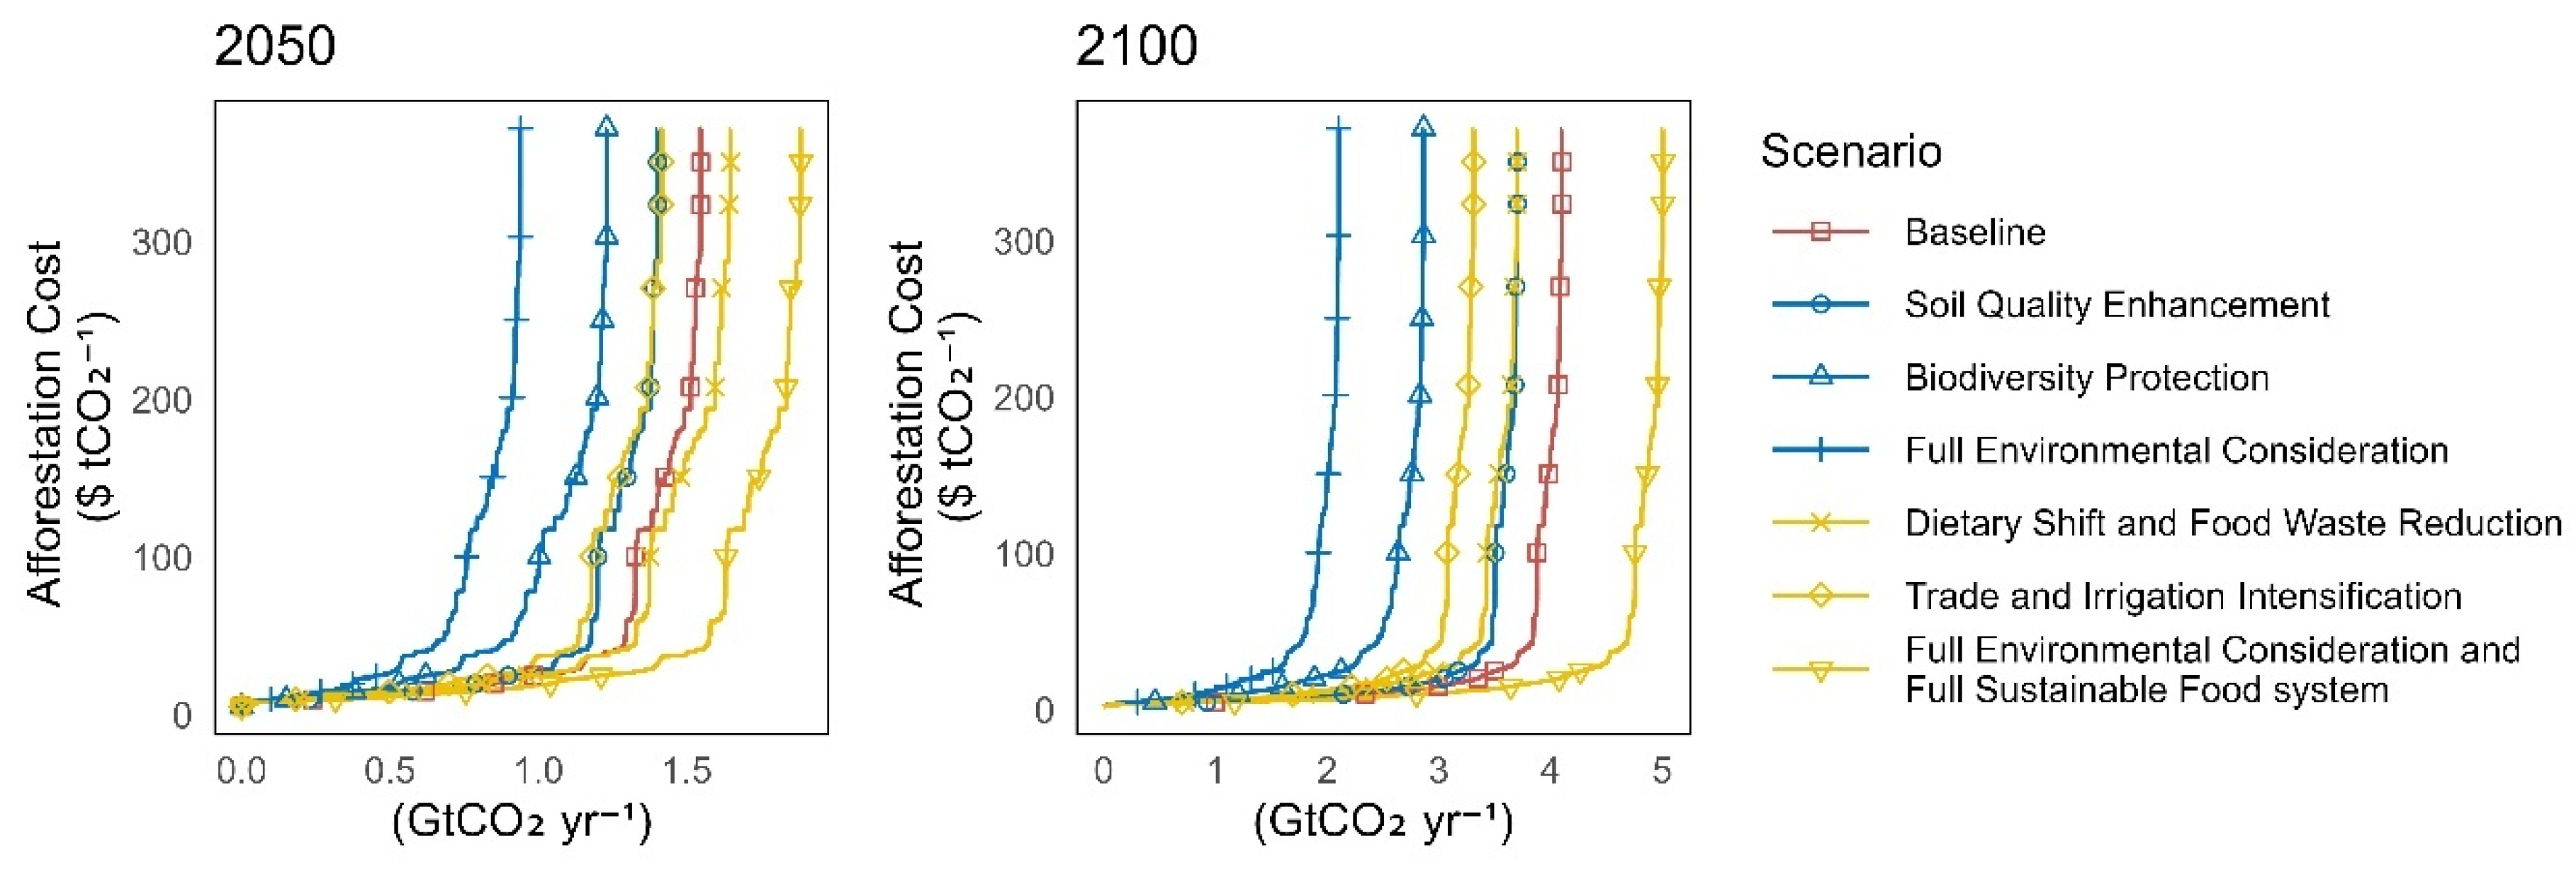
The supply curves illustrate how much carbon can be sequestered at different cost levels (Figure 7). Compared with the baseline scenario (red lines), all scenarios incorporating environmental constraints shift the curves to the left. This indicates that less carbon can be sequestered at a given price or, equivalently, that higher costs are required to achieve the same level of sequestration.
Figure 7.
Carbon sequestration supply curve in 2050 and 2100 under each scenario.
For instance, by 2100, the baseline scenario achieves about 3.9 GtCO2 yr−1 at a cost of US$50 per tCO2. When soil quality constraints are applied, this potential declines slightly to around 3.5 GtCO2 yr−1. The reduction becomes much more pronounced when biodiversity conservation is included, lowering the sequestration potential to approximately 2.1 GtCO2 yr−1 at the same cost.
By contrast, sustainable food system measures partially offset these increases in cost by shifting the afforestation supply curves to the right (yellow lines). Under this scenario, afforestation can sequester up to about 4.8 GtCO2 yr−1 at the same cost of US$50 per tCO2.
Additionally, afforestation becomes more cost-effective over longer time horizons, as the upfront land conversion costs are amortized over time. This trend is evident when comparing the results for 2050 and 2100 in Figure 7.
Finally, afforestation costs vary substantially across regions. Under the full sustainable food system scenario, most regions can achieve sequestration at costs below US$50 per tCO2 by 2100. Southeast Asia, Brazil, and the Rest of the Americas emerge as the lowest-cost regions, likely due to higher land productivity. By contrast, Canada, the Former Soviet Union, and the Rest of Europe exhibit the highest costs. Detailed regional cost estimates are reported in Table S3.
5. Discussion
5.1. Afforestation Carbon Sequestration Potential Is Restricted Under Environmental Considerations
Environmental protections reduced the global maximum afforestation potential to 2.13 GtCO2 yr−1, primarily because protected areas limit the land available for afforestation. As the extent of protected land increases, competition for suitable land intensifies, reducing the area that can be allocated to afforestation [62].
Biodiversity protection imposed the strongest constraint because of its larger coverage area. By excluding ecologically important and species-rich areas from land conversion, afforestation was displaced to less suitable locations, reducing the achievable carbon sequestration potential. This finding illustrates the trade-off between maximizing carbon removal and protecting biodiversity [24]. While afforestation contributes to biodiversity conservation through climate stabilization [63], inappropriate forest expansion can also accelerate biodiversity loss by altering natural ecosystems [28].
Soil quality enhancement had a smaller effect. This strategy prioritizes degraded land for restoration by preventing its conversion to competing land uses [64]. Although this approach promotes ecosystem recovery and long-term soil rehabilitation, degraded lands generally support slower tree growth and lower biomass accumulation because of poor soil fertility and limited nutrient availability. Consequently, the carbon sequestration potential of afforestation is lower than that on more productive lands. This mechanism is consistent with [6], which highlighted reduced carbon uptake on degraded lands, and [65], which similarly found that afforestation on abandoned cropland delivers lower mitigation potential despite its restoration benefits.
Overall, this study’s findings reinforce recent assessments showing that land availability and environmental protections substantially constrain the climate mitigation potential of afforestation. The magnitude of the reduction is consistent with previous estimates. For example, ref. [66] reported that biodiversity priorities could reduce afforestation potential by up to 25%, while [30] estimated a reduction of 45.8 GtCO2 by 2050 under water and biodiversity constraints. Similarly, this study’s results show a cumulative reduction of 49 GtCO2 by 2050, increasing to 140 GtCO2 by 2100 under combined environmental protections.
The effects were highly heterogeneous across regions, with the largest reductions occurring in Brazil and South America, where extensive land suitable for afforestation and high biomass productivity [18] coincide with biodiversity priority areas (Figure 2 and Figure 3). Consequently, protecting these ecosystems results in disproportionately large reductions in carbon sequestration potential.
5.2. Sustainable Food Systems Can Help Compensate for These Land Constraints
Although environmental protections reduce the land available for afforestation, sustainable food system interventions can recover much of this lost mitigation potential. Nearly half of the Earth’s habitable land is used for agriculture, of which approximately 77% supports livestock production [67]. Consequently, reducing the demand for animal-sourced foods releases substantial areas of pasture and feed cropland, creating opportunities for afforestation and carbon sequestration [32]. In this study’s simulations, combining dietary shifts with food waste reduction increased global afforestation potential by approximately 70%, from 2.13 to 3.70 GtCO2 yr−1, with total carbon sequester reaching 323 GtCO2. The largest gains occurred in the Rest of Africa, South America, Brazil, and Southeast Asia, consistent with previous studies showing that these regions account for the majority of AFOLU mitigation achieved through dietary transitions [7,32,68].
These regional gains are not necessarily driven by local dietary changes but instead emerge from the interconnected nature of global food systems [69,70]. Dietary shifts in high-income and emerging economies reduce the demand for livestock products, lowering global requirements for pasture and feed crops [32,71]. As agricultural production adjusts through international markets, land pressure is alleviated in major producing regions, allowing additional land to become available for restoration. For example, the Rest of Africa experiences one of the largest increases in afforestation potential despite relatively modest local dietary changes, which reflects reduced global demand for feed and pasture rather than domestic consumption patterns [72]. This demonstrates that consumption changes in one region can generate substantial land use and climate benefits elsewhere.
Trade and technological improvement progress further increase afforestation potential by improving agricultural efficiency and reallocating production across regions. Under the SSP1 pathway, lower trade barriers and continued yield improvements increase global afforestation potential by a further 15%. More productive agricultural systems require less land to satisfy future food demand, while a greater reliance on international trade allows some countries to meet domestic consumption through imports, reducing the pressure to expand agricultural land. These findings support previous studies showing that agricultural intensification and open trade can reduce land demand and increase opportunities for ecosystem restoration [73].
The dietary shift scenario had a larger effect on cumulative afforestation carbon sequestration than the trade and technology scenario, increasing cumulative sequestration by approximately 95 GtCO2 compared with 77 GtCO2, respectively. However, the combined effect of dietary shifts and trade was smaller than the sum of their individual contributions, which indicates that there are important interactions between demand- and supply-side interventions. Dietary shifts primarily reduce land demand by lowering the consumption of livestock products [74], whereas trade and technological improvements alter where and how food is produced. Because these mechanisms operate within the same land system, part of the land savings generated by dietary change overlaps with those achieved through improvements in production efficiency and trade reallocation. Consequently, their combined effect exhibits diminishing marginal gains relative to the sum of their individual effects [31]. This finding highlights that sustainable food systems should be viewed as an integrated portfolio of demand- and supply-side interventions rather than as independent measures [75]. Maximizing land-based carbon removal therefore requires coordinated strategies that simultaneously address food consumption, agricultural productivity, and international trade.
Figure S4 further illustrates how these mechanisms translate into changes in land availability and realized afforestation across scenarios and over time. The potential land availability for afforestation is generally lower under the biodiversity and soil quality scenarios than under the baseline because environmentally sensitive or high-priority areas are excluded from afforestation. These differences remain broadly stable over time because the environmental constraints are based on the same protected area information throughout the projection period, while the small changes across years mainly reflect changes in overall land demand. By contrast, under the sustainable food system scenarios, differences among scenarios become increasingly pronounced toward 2050 and 2100 as changes in food demand, agricultural productivity, and international trade accumulate over time. These changes progressively reduce land demand for food production, thereby increasing the land potentially available for afforestation and ultimately increasing realized afforestation.
Overall, our results imply that sustainable food system transitions can enhance afforestation carbon sequestration without compromising other environmental objectives. Relative to the baseline with environmental protection, the sustainable food system scenario increases cumulative afforestation carbon sequestration by approximately 199 GtCO2, reaching 323 GtCO2 over the projection period. This increase is enabled by substantial reductions in land demand for food production, with approximately 1000 Mha of additional high-productivity land becoming available relative to the baseline (Figure S4a) and about 750 Mha afforested (Figure S4b). Nevertheless, the additional land made available through food system transitions remains insufficient to meet projected CDR requirements on its own [2]. Afforestation should therefore be considered as one component of a broader CDR portfolio, complemented by other approaches.
6. Limitations and Uncertainties
While our study incorporated several approaches to assess the feasibility of sustainable afforestation, several limitations and uncertainties remain. First, the effects of afforestation on soil quality were not explicitly quantified in our model. In the soil quality scenario, we prioritized degraded land for afforestation and assumed that afforestation on these lands would contribute to soil quality improvement. However, the model does not explicitly simulate changes in soil physical, chemical, or biological properties or quantify the resulting changes in soil organic carbon. Therefore, the soil quality benefit of afforestation is represented through land prioritization rather than through an explicit assessment of soil quality changes. Future studies could incorporate more detailed soil processes and restoration treatments to better quantify these effects across different locations.
Second, the available land may not be fully utilized because of the afforestation rate constraint. While our analysis was primarily designed to assess the effect of land availability on afforestation potential, the results suggest that the rate at which afforestation can expand may instead become the binding constraint. Under the “full environmental consideration + sustainable food system” scenario, approximately 2250 Mha of land was theoretically available for afforestation, yet only about 1850 Mha was afforested by 2100 because of the imposed expansion rate constraint, leaving approximately 400 Mha unused (Figure S4).
To examine the influence of this constraint, we conducted a sensitivity analysis by varying the baseline afforestation expansion rate by ±10% (Figure S7). Increasing the rate increased both the afforested area and cumulative carbon sequestration, whereas decreasing it produced the opposite effect. Nevertheless, the overall pattern of the results remained consistent, which indicates that the main conclusions are robust to moderate changes in the assumed expansion rate. This finding is supported by [18], who showed that assumptions regarding the afforestation expansion rate can substantially affect estimated carbon sequestration, with changes ranging from −44% under a pessimistic rate to +30% under an optimistic rate.
Third, the sensitivity of afforestation potential to alternative model parameters and scenario drivers was not explicitly assessed. Forest productivity and carbon dynamics in AIM-Hub are derived from outputs of external forest growth models and incorporated into AIM-Hub as prescribed inputs. Therefore, independently varying these parameters would require modifying the underlying forest growth modeling framework and falls beyond the scope of the present study. Other drivers, including dietary shifts, food loss and waste reduction, international trade, technological change, and irrigation, are represented through the scenario assumptions and model structure of AIM-Hub. Because these factors are embedded in the model formulation and scenario design, they were not independently varied in the sensitivity analysis. A comprehensive uncertainty assessment would require systematic variation of both the externally prescribed model inputs and scenario assumptions, which is beyond the scope of this study.
Fourth, long-term afforestation projections to 2100 are subject to uncertainties associated with disturbances and carbon losses, including forest fires, drought, pests, forest mortality, and other climate-related disturbances. These processes are not explicitly represented in our current modeling framework. Therefore, our estimates should be interpreted as the potential carbon sequestration associated with afforestation under the assumed land use and forest-growth trajectories rather than as a fully disturbance-adjusted estimate of realized long-term carbon storage. Incorporating climate-dependent disturbance processes, forest mortality, and other mechanisms of carbon loss would provide a more comprehensive assessment of realized long-term carbon sequestration and represents an important direction for future research.
Fifth, the afforestation program considered here is based on plantation forests. However, natural and plantation forests may have different carbon sequestration potential [3], which is not explicitly considered in this study.
7. Conclusions
This study provides a novel integrated assessment of global carbon sequestration potential and associated costs by integrating environmental considerations with a sustainable food system framework. We developed seven scenarios: (1) baseline, (2) soil quality enhancement, (3) biodiversity protection, (4) full environmental consideration, (5) dietary shift with food waste reduction, (6) improvements in food trade and agricultural technology, and (7) full environmental consideration combined with a sustainable food system.
Our results demonstrate that environmental protection can substantially constrain afforestation potential by reducing land availability. Biodiversity protection has a stronger effect than soil quality enhancement, resulting in greater reductions in carbon sequestration potential and higher associated costs. By contrast, sustainable food system measures, particularly dietary shifts and food waste reduction, can reduce agricultural land demand and create additional opportunities for afforestation. Overall, our results imply that sustainable food system transitions can enhance afforestation carbon sequestration without compromising other environmental objectives. Relative to the baseline with environmental protection, the sustainable food system scenario increases cumulative afforestation carbon sequestration by approximately 199 GtCO2, reaching 323 GtCO2 in 2100. A substantial share of this potential can be achieved at costs below US$50 tCO2−1, which highlights the continued role of afforestation as a cost-effective land-based mitigation option.
Our results suggest that there are still possible pathways for managing climate change while also considering environmental aspects. Our findings can be used by the integrated assessment modeling community to highlight the nexus of environmental consideration and societal transformation measures, such as, in this case, focusing on sustainable food systems and the carbon sequestration potential from afforestation.
Supplementary Materials
The following supporting information can be downloaded at: https://www.mdpi.com/article/10.3390/land15091733/s1. References [76,77] are cited in the Supplementary file.
Author Contributions
D.F.K.: Original draft preparation, analysis, methodology, model advancement, and visualization. S.F.: Conceptualization, model developer, reviewing and editing, and supervising. T.H.: Model developer, reviewing and editing, and supervising. S.S.V.: Reviewing and editing and supervising. All authors have read and agreed to the published version of the manuscript.
Funding
This study was supported by the Environment Research and Technology Development Fund of the Environmental Restoration and Conservation Agency of Japan (JPMEERF20241001), Ritsumeikan Advanced Research Academy (RARA).
Data Availability Statement
This study provides the analysis code used to generate the figures presented in both the main text and the Supplementary Information for reference purposes, which can be freely accessed at https://github.com/hanadianti/Ranalysis-AFRCSP.git (accessed on 11 September 2026). The data supporting the findings related to this study are available upon reasonable request from the corresponding author. Due to privacy, data size and confidentiality considerations, the underlying research data cannot be shared publicly. The land use demand and allocation used in this study are provided by the AIM-Hub and AIM-PLUM models, which can be accessed at: https://github.com/KUAtmos/AIMHubdoc (accessed on 11 September 2026) and https://github.com/KUAtmos/AIMPLUM (accessed on 11 September 2026). All figures, tables, and graphical materials presented in this manuscript are original and were created by the authors. No previously published figures, tables, or copyrighted materials from other sources have been reproduced. Data obtained from previous studies and databases have been appropriately cited and, where applicable, were reanalyzed or visualized by the authors.
Acknowledgments
During the preparation of this work, the authors used ChatGPT to assist with language editing and wording refinement. After using this tool, the authors reviewed and edited all content thoroughly and take full responsibility for the content of the published article. The simulations were conducted using the AIM-Hub and AIM-PLUM models, implemented in the General Algebraic Modeling System (GAMS) version 37.1.0. Data processing and figure preparation were performed using R version 4.3.1.
Conflicts of Interest
The authors declare no conflicts of interest.
References
- Intergovernmental Panel on Climate Change. Climate Change 2022: Impacts, Adaptation, and Vulnerability; IPCC: Geneva, Switzerland, 2022; Available online: https://www.ipcc.ch/report/ar6/wg2/ (accessed on 29 July 2025).
- Gidden, M.J.; Roe, S.; Ganti, G.; Gasser, T.; Hasegawa, T.; Lamb, W.F.; Ochi, Y.; Strefler, J.; Vaughan, N.E. Chapter 8: Paris-consistent CDR scenarios. In The State of Carbon Dioxide Removal 2024, 2nd ed.; Smith, S.M., Geden, O., Gidden, M.J., Lamb, W.F., Nemet, G.F., Minx, J.C., Buck, H., Burke, J., Cox, E., Edwards, M.R., et al., Eds.; 2024; Available online: https://osf.io/8xk7h/files/mkgqv (accessed on 11 September 2026).
- Hasegawa, T.; Fujimori, S.; Ito, A.; Takahashi, K. Careful selection of forest types in afforestation can increase carbon sequestration by 25% without compromising sustainability. Commun. Earth Environ. 2024, 5, 171. [Google Scholar] [CrossRef] [Scilit]
- Lewis, S.L.; Wheeler, C.E.; Mitchard, E.T.A.; Koch, A. Restoring natural forests is the best way to remove atmospheric carbon. Nature 2019, 568, 25–28. [Google Scholar] [CrossRef] [Scilit] [PubMed]
- Rogelj, J.; Popp, A.; Calvin, K.V.; Luderer, G.; Emmerling, J.; Gernaat, D.; Fujimori, S.; Strefler, J.; Hasegawa, T.; Krey, V.; et al. Scenarios towards limiting global mean temperature increase below 1.5 °C. Nat. Clim. Change 2018, 8, 325–332. [Google Scholar] [CrossRef] [Scilit]
- Griscom, B.W.; Adams, J.; Ellis, P.W.; Houghton, R.A.; Lomax, G.; Miteva, D.A.; Schlesinger, W.H.; Shoch, D.; Siikamäki, J.V.; Smith, P.; et al. Natural climate solutions. Proc. Natl. Acad. Sci. USA 2017, 114, 11645–11650. [Google Scholar] [CrossRef] [Scilit] [PubMed]
- Roe, S.; Streck, C.; Obersteiner, M.; Frank, S.; Griscom, B.; Drouet, L.; Fricko, O.; Gusti, M.; Harris, N.; Hasegawa, T.; et al. Contribution of the land sector to a 1.5 °C world. Nat. Clim. Change 2019, 9, 817–828. [Google Scholar] [CrossRef] [Scilit]
- Intergovernmental Panel on Climate Change. Summary for policymakers. In Global Warming of 1.5 °C.; Masson-Delmotte, V., Zhai, P., Pörtner, H.-O., Roberts, D., Skea, J., Shukla, P.R., Pirani, A., Moufouma-Okia, W., Péan, C., Pidcock, R., et al., Eds.; IPCC: Geneva, Switzerland, 2018. [Google Scholar]
- Smith, P. Chapter 11: Agriculture, forestry and other land use (AFOLU). In Climate Change 2014: Mitigation of Climate Change: Contribution of Working Group III to the Fifth Assessment Report of the Intergovernmental Panel on Climate Change; Cambridge University Press: Cambridge, UK, 2014. [Google Scholar]
- Calvin, K.; Wise, M.; Clarke, L.; Edmonds, J.; Kyle, P.; Luckow, P. Implications of simultaneously mitigating and adapting to climate change: Initial experiments using GCAM. Clim. Change 2014, 123, 125–137. [Google Scholar] [CrossRef] [Scilit]
- Humpenöder, F.; Popp, A.; Dietrich, J.P.; Klein, D.; Lotze-Campen, H.; Bonsch, M.; Bodirsky, B.L.; Weindl, I.; Stevanović, M.; Müller, C.; et al. Investigating afforestation and bioenergy CCS as climate change mitigation strategies. Environ. Res. Lett. 2014, 9, 064029. [Google Scholar] [CrossRef] [Scilit]
- Sathaye, J.; Makundi, W.; Andrasko, K. Forestry Mitigation Potential and Costs in Developing Countries Preface. Mitig. Adapt. Strateg. Glob. Change 2001, 6, 183–184. [Google Scholar] [CrossRef] [Scilit]
- Busch, J.; Engelmann, J.; Cook-Patton, S.C.; Griscom, B.W.; Kroeger, T.; Possingham, H.; Shyamsundar, P. Potential for low-cost carbon dioxide removal through tropical reforestation. Nat. Clim. Change 2019, 9, 463–466. [Google Scholar] [CrossRef] [Scilit]
- Bastin, J.-F.; Finegold, Y.; Garcia, C.; Mollicone, D.; Rezende, M.; Routh, D.; Zohner, C.M.; Crowther, T.W. The global tree restoration potential. Science 2019, 365, 76–79. [Google Scholar] [CrossRef] [Scilit] [PubMed]
- Krause, A.; Pugh, T.A.M.; Bayer, A.D.; Doelman, J.C.; Humpenöder, F.; Anthoni, P.; Khabarov, N.; Stehfest, E. Global consequences of afforestation and bioenergy cultivation on ecosystem service indicators. Biogeosciences 2017, 14, 4829–4850. [Google Scholar] [CrossRef] [Scilit]
- Hasegawa, T.; Fujimori, S.; Shin, Y.; Takahashi, K.; Masui, T.; Tanaka, A. Consequence of climate mitigation on the risk of hunger. Environ. Sci. Technol. 2015, 49, 7245–7253. [Google Scholar] [CrossRef] [Scilit] [PubMed]
- Hasegawa, T.; Fujimori, S.; Havlík, P.; Valin, H.; Bodirsky, B.L.; Doelman, J.C.; Fellmann, T.; Kyle, P.; Koopman, J.F.L.; Lotze-Campen, H.; et al. Risk of increased food insecurity under stringent global climate change mitigation policy. Nat. Clim. Change 2018, 8, 699–703. [Google Scholar] [CrossRef] [Scilit]
- Doelman, J.C.; Stehfest, E.; van Vuuren, D.P.; Hof, A.F.; Braakhekke, M.C.; Gernaat, D.E.H.J.; van den Berg, M.; van Zeist, W.-J.; Daioglou, V.; van Meijl, H.; et al. Afforestation for climate change mitigation: Potentials, risks and trade-offs. Glob. Change Biol. 2020, 26, 1576–1591. [Google Scholar] [CrossRef] [Scilit] [PubMed]
- Fujimori, S.; Wu, W.; Doelman, J.; Frank, S.; Hristov, J.; Kyle, P.; Sands, R.; van Zeist, W.-J.; Havlik, P.; Domínguez, I.P.; et al. Publisher correction: Land-based climate change mitigation measures can affect agricultural markets and food security. Nat. Food 2022, 3, 294. [Google Scholar] [CrossRef] [Scilit] [PubMed]
- Kreidenweis, U.; Humpenöder, F.; Stevanović, M.; Bodirsky, B.L.; Kriegler, E.; Lotze-Campen, H.; Popp, A. Afforestation to mitigate climate change: Impacts on food prices under consideration of albedo effects. Environ. Res. Lett. 2016, 11, 085001. [Google Scholar] [CrossRef] [Scilit]
- Frank, S.; Havlík, P.; Stehfest, E.; van Meijl, H.; Witzke, H.P.; Pérez-Domínguez, I.; van Dijk, M.; Doelman, J.C.; Fellmann, T.; Koopman, J.F.L.; et al. Agricultural non-CO2 emission reduction potential in the context of the 1.5 °C target. Nat. Clim. Change 2017, 7, 870–874. [Google Scholar] [CrossRef] [Scilit]
- Lawrence, D.; Coe, M.; Walker, W.; Verchot, L.; Vandecar, K. The unseen effects of deforestation: Biophysical effects on climate. Front. For. Glob. Change 2018, 1, 6. [Google Scholar] [CrossRef] [Scilit]
- Ohashi, H.; Yonekura, Y.; Hirata, A.; Takano, K.; Nishijima, S.; Matsui, T. The effect of climate change on the extinction risk of living organisms on the global scale: Evaluation of the effect and side effects of mitigation measures. In Proceedings of the 64th Annual Meeting of the Ecological Society of Japan, Organized Session T05: Mitigation/Adaptation Measures of Climate Change: Relationship from Ecosystem Impact Prediction to Human Activities, Tokyo, Japan, 14–18 March 2017. [Google Scholar]
- Ohashi, H.; Hasegawa, T.; Hirata, A.; Fujimori, S.; Takahashi, K.; Tsuyama, I.; Nakao, K.; Kominami, Y.; Tanaka, N.; Hijioka, Y.; et al. Biodiversity can benefit from climate stabilization despite adverse side effects of land-based mitigation. Nat. Commun. 2019, 10, 5240. [Google Scholar] [CrossRef] [Scilit] [PubMed]
- Houghton, R.A.; Byers, B.; Nassikas, A.A. A role for tropical forests in stabilizing atmospheric CO2. Nat. Clim. Change 2015, 5, 1022–1023. [Google Scholar] [CrossRef] [Scilit]
- Seddon, N.; Smith, A.; Smith, P.; Key, I.; Chausson, A.; Girardin, C.; House, J.; Srivastava, S.; Turner, B. Getting the message right on nature-based solutions to climate change. Glob. Change Biol. 2021, 27, 1518–1546. [Google Scholar] [CrossRef] [Scilit] [PubMed]
- Pörtner, H.-O.; Scholes, R.J.; Agard, J.; Archer, E.; Arneth, A.; Bai, X.; Barnes, D.; Burrows, M.; Chan, L.; Cheung, W.L.; et al. Scientific Outcome of the IPBES-IPCC Co-Sponsored Workshop on Biodiversity and Climate Change; IPBES Secretariat: Bonn, Germany, 2021. [Google Scholar] [CrossRef] [Scilit]
- Hirata, A.; Ohashi, H.; Hasegawa, T.; Fujimori, S.; Takahashi, K.; Tsuchiya, K.; Matsui, T. The choice of land-based climate change mitigation measures influences future global biodiversity loss. Commun. Earth Environ. 2024, 5, 259. [Google Scholar] [CrossRef] [Scilit]
- Benítez, P.C.; McCallum, I.; Obersteiner, M.; Yamagata, Y. Global potential for carbon sequestration: Geographical distribution, country risk and policy implications. Ecol. Econ. 2007, 60, 572–583. [Google Scholar] [CrossRef] [Scilit]
- Wang, Y.; Zhu, Y.; Cook-Patton, S.C.; Sun, W.; Zhang, W.; Ciais, P.; Li, T.; Smith, P.; Yuan, W.; Zhu, X.; et al. Land availability and policy commitments limit global climate mitigation from forestation. Science 2025, 389, 931–934. [Google Scholar] [CrossRef] [Scilit] [PubMed]
- Wu, W.; Hasegawa, T.; Ohashi, H.; Hanasaki, N.; Liu, J.; Matsui, T.; Fujimori, S.; Masui, T.; Takahashi, K. Global advanced bioenergy potential under environmental protection policies and societal transformation measures. GCB Bioenergy 2019, 11, 1275–1292. [Google Scholar] [CrossRef] [Scilit]
- Sun, Z.; Scherer, L.; Tukker, A.; Spawn-Lee, S.A.; Bruckner, M.; Gibbs, H.K.; Behrens, P. Dietary change in high-income nations alone can lead to substantial double climate dividend. Nat. Food 2022, 3, 29–37. [Google Scholar] [CrossRef] [Scilit] [PubMed]
- Fujimori, S.; Masui, T.; Matsuoka, Y. AIM-HUB [Basic] Manual; Discussion Paper Series, Center for Social and Environmental Systems Research; National Institute for Environmental Studies: Tsukuba, Japan, 2012.
- Hasegawa, T.; Fujimori, S.; Ito, A.; Takahashi, K.; Masui, T. Global land-use allocation model linked to an integrated assessment model. Sci. Total Environ. 2017, 580, 787–796. [Google Scholar] [CrossRef] [Scilit] [PubMed]
- Fujimori, S.; Hasegawa, T.; Masui, T.; Takahashi, K. Land use representation in a global CGE model for long-term simulation: CET vs. logit functions. Food Secur. 2014, 6, 685–699. [Google Scholar] [CrossRef] [Scilit]
- Fujimori, S.; Abe, M.; Kinoshita, T.; Hasegawa, T.; Kawase, H.; Kushida, K.; Yoshikawa, M. Downscaling global emissions and its implications derived from climate model experiments. PLoS ONE 2017, 12, e0169733. [Google Scholar] [CrossRef] [Scilit] [PubMed]
- Fujimori, S.; Hasegawa, T.; Rogelj, J.; Su, X.; Havlík, P.; Krey, V.; Takahashi, K.; Riahi, K. Inclusive climate change mitigation and food security policy under 1.5 °C climate goal. Environ. Res. Lett. 2018, 13, 074033. [Google Scholar] [CrossRef] [Scilit]
- Kamasela, D.F.; Fujimori, S.; Hasegawa, T.; Vishwanathan, S.S. Global soil organic carbon sequestration potential under sustainable food systems and climate mitigation. Environ. Res. Lett. 2025, 20, 124062. [Google Scholar] [CrossRef] [Scilit]
- Hasegawa, T.; Fujimori, S.; Tsuchiya, K.; Ito, A.; Takahashi, K. National land-based climate mitigation scenarios dataset. Sci. Data 2025, 12, 1077. [Google Scholar] [CrossRef] [Scilit] [PubMed]
- Intergovernmental Panel on Climate Change. 2006 IPCC Guidelines for National Greenhouse Gas Inventories; Eggleston, H.S., Buendia, L., Miwa, K., Ngara, T., Tanabe, K., Eds.; Institute for Global Environmental Strategies: Kanagawa, Japan, 2006. [Google Scholar]
- Dutschke, M. Permanence of CDM Forests or Non-permanence of Land Use Related Carbon Credits? HWWA Discussion Paper No. 132; Hamburg Institute of International Economics: Hamburg, Germany, 2001. [Google Scholar]
- United Nations. United Nations Strategic Plan for Forests 2017–2030: Resolution Adopted by the General Assembly on 27 April 2017, A/RES/71/285; United Nations: New York, NY, USA, 2017. [Google Scholar]
- Sohngen, B.; Golub, A.A.; Hertel, T.W. The role of forestry in carbon sequestration in general equilibrium models. In Economic Analysis of Land Use in Global Climate Change Policy; Hertel, T.W., Rose, S.K., Tol, R.S.J., Eds.; Routledge: Abingdon, UK, 2009; pp. 279–302. [Google Scholar]
- Winsten, J.; Walker, S.; Brown, S.; Grimland, S. Estimating carbon supply curves from afforestation of agricultural land in the Northeastern U.S. Mitig. Adapt. Strateg. Glob. Change 2011, 16, 925–942. [Google Scholar] [CrossRef] [Scilit]
- Hoogwijk, M.; Faaij, A.; de Vries, B.; Turkenburg, W. Exploration of regional and global cost-supply curves of biomass energy from short-rotation crops at abandoned cropland and rest land under four IPCC SRES land-use scenarios. Biomass Bioenergy 2009, 33, 26–43. [Google Scholar] [CrossRef] [Scilit]
- O’Neill, B.C.; Kriegler, E.; Ebi, K.L.; Kemp-Benedict, E.; Riahi, K.; Rothman, D.S.; van Ruijven, B.J.; van Vuuren, D.P.; Birkmann, J.; Kok, K.; et al. The roads ahead: Narratives for shared socioeconomic pathways describing world futures in the 21st century. Glob. Environ. Change 2017, 42, 169–180. [Google Scholar] [CrossRef] [Scilit]
- IUCN; UNEP-WCMC. The World Database on Protected Areas (WDPA) [January 2018 Version]. UNEP-WCMC. 2018. Available online: https://www.protectedplanet.net/ (accessed on 29 June 2024).
- BirdLife International. World Database of Key Biodiversity Areas. KBA Partnership. 2017. Available online: https://www.keybiodiversityareas.org/ (accessed on 21 September 2024).
- Phillips, S.J.; Anderson, R.P.; Schapire, R.E. Maximum entropy modeling of species geographic distributions. Ecol. Model. 2006, 190, 231–259. [Google Scholar] [CrossRef] [Scilit]
- Crowe, O.; Beresford, A.E.; Buchanan, G.M.; Grantham, H.S.; Simkins, A.T.; Watson, J.E.M.; Butchart, S.H.M. A global assessment of forest integrity within Key Biodiversity Areas. Biol. Conserv. 2023, 286, 110293. [Google Scholar] [CrossRef] [Scilit]
- Oraon, P.R.; Sagar, V.; Beauty, K. Ecological restoration of degraded land through afforestation activities. In Land and Environmental Management Through Forestry; Raj, A., Jhariya, M.K., Banerjee, A., Nema, S., Bargali, K., Eds.; Wiley: Hoboken, NJ, USA, 2023; pp. 201–216. [Google Scholar] [CrossRef] [Scilit]
- Chazdon, R.L.; Peres, C.A.; Dent, D.H.; Sheil, D.; Lugo, A.E.; Lamb, D.; Stork, N.E.; Miller, S.E. The potential for species conservation in tropical secondary forests. Conserv. Biol. 2009, 23, 1406–1417. [Google Scholar] [CrossRef] [Scilit] [PubMed]
- Freddy, N.; Monica, P. Mapping Land Use Systems at Global and Regional Scales for Land Degradation Assessment Analysis; Technical Report of the LADA FAO/UNEP Project; FAO: Rome, Italy, 2011. [Google Scholar]
- Oldeman, R.; Hakkeling, R.; Sombroek, W. World Map of the Status of Human-Induced Soil Degradation: An Explanatory Note, 2nd ed.; International Soil Reference and Information Centre (ISRIC): Wageningen, The Netherlands, 1991; Available online: https://edepot.wur.nl/287507 (accessed on 11 September 2026).
- Lefebvre, D.; Williams, A.G.; Kirk, G.J.D.; Burgess, P.J.; Meersmans, J.; Silman, M.R.; Román-Dañobeytia, F.; Farfan, J.; Smith, P. Assessing the carbon capture potential of a reforestation project. Sci. Rep. 2021, 11, 19907. [Google Scholar] [CrossRef] [Scilit] [PubMed]
- Willett, W.; Rockström, J.; Loken, B.; Springmann, M.; Lang, T.; Vermeulen, S.; Garnett, T.; Tilman, D.; DeClerck, F.; Wood, A.; et al. Food in the Anthropocene: The EAT–Lancet Commission on healthy diets from sustainable food systems. Lancet 2019, 393, 447–492. [Google Scholar] [CrossRef] [Scilit] [PubMed]
- Ardra, S.; Barua, M.K. Halving food waste generation by 2030: The challenges and strategies of monitoring UN Sustainable Development Goal target 12.3. J. Clean. Prod. 2022, 380, 135042. [Google Scholar] [CrossRef] [Scilit]
- von Lampe, M.; Willenbockel, D.; Ahammad, H.; Blanc, E.; Cai, Y.; Calvin, K.; Fujimori, S.; Hasegawa, T.; Havlik, P.; Heyhoe, E.; et al. Why do global long-term scenarios for agriculture differ? An overview of the AgMIP global economic model intercomparison. Agric. Econ. 2014, 45, 3–20. [Google Scholar] [CrossRef] [Scilit]
- Hanasaki, N.; Kanae, S.; Oki, T.; Masuda, K.; Motoya, K.; Shirakawa, N.; Shen, Y.; Tanaka, K. An integrated model for the assessment of global water resources—Part 2: Applications and assessments. Hydrol. Earth Syst. Sci. 2013, 17, 1069–1080. [Google Scholar] [CrossRef] [Scilit]
- Jansakoo, T.; Sekizawa, S.; Fujimori, S.; Hasegawa, T.; Oshiro, K. Benefits of air quality for human health resulting from climate change mitigation through dietary change and food loss prevention policy. Sustain. Sci. 2024, 19, 1391–1407. [Google Scholar] [CrossRef] [Scilit]
- Intergovernmental Panel on Climate Change. Special Report on Emissions Scenarios; Nakicenovic, N., Alcamo, J., Davis, G., de Vries, B., Fenhann, J., Gaffin, S., Gregory, K., Grübler, A., Jung, T.Y., Kram, T., et al., Eds.; Cambridge University Press: Cambridge, UK, 2000. [Google Scholar]
- Dudley, N. (Ed.) Guidelines for Applying Protected Area Management Categories; IUCN: Gland, Switzerland, 2008. [Google Scholar]
- Wijenayake, P.R.; Rangani, P.; Hasegawa, T.; Ohashi, H.; Hirata, A.; Takahashi, K. Afforestation and reforestation have varying biodiversity impacts across and within biomes. Environ. Res. Lett. 2026, 21, 024031. [Google Scholar] [CrossRef] [Scilit]
- Intergovernmental Science-Policy Platform on Biodiversity and Ecosystem Services. The IPBES Assessment Report on Land Degradation and Restoration; IPBES: Bonn, Germany, 2018. [Google Scholar]
- Gvein, M.H.; Hu, X.; Næss, J.S.; Watanabe, M.D.B.; Cavalett, O.; Malbranque, M.; Kindermann, G.; Cherubini, F. Potential of land-based climate change mitigation strategies on abandoned cropland. Commun. Earth Environ. 2023, 4, 39. [Google Scholar] [CrossRef] [Scilit]
- Strassburg, B.B.N.; Iribarrem, A.; Beyer, H.L.; Cordeiro, C.L.; Crouzeilles, R.; Jakovac, C.C.; Junqueira, A.B.; Lacerda, E.; Latawiec, A.E.; Balmford, A.; et al. Global priority areas for ecosystem restoration. Nature 2020, 586, 724–729. [Google Scholar] [CrossRef] [Scilit] [PubMed]
- Ritchie, H.; Roser, M. Half of the World’s Habitable Land is Used for Agriculture. Our World in Data. 2019. Available online: https://ourworldindata.org/global-land-for-agriculture (accessed on 29 September 2025).
- FABLE. Food, Agriculture, Biodiversity, Land-use, and Energy Pathways to 2050; Food, Agriculture, Biodiversity, Land-Use, and Energy Consortium: Laxenburg, Austria, 2021. [Google Scholar]
- Pendrill, F.; Persson, U.M.; Godar, J.; Kastner, T.; Moran, D.; Schmidt, S.; Wood, R. Agricultural and forestry trade drives large share of tropical deforestation emissions. Glob. Environ. Change 2019, 56, 1–10. [Google Scholar] [CrossRef] [Scilit]
- Rasmussen, L.V.; Bierbaum, R.; Oldekop, J.A.; Agrawal, A. Bridging the gap between sustainable development and land system science. Nat. Sustain. 2021, 4, 392–399. [Google Scholar]
- Weindl, I.; Lotze-Campen, H.; Popp, A.; Müller, C.; Havlík, P.; Herrero, M.; Schmitz, C.; Rolinski, S. Livestock in a changing climate: Production system transitions as an adaptation strategy for agriculture. Environ. Res. Lett. 2017, 12, 094003. [Google Scholar] [CrossRef] [Scilit]
- Adolph, B.; Griffiths, G.; Hou-Jones, X. Analysis of the Implications of Africa’s Food Systems Development on Environmental Sustainability: Discussion Document; International Center for Tropical Agriculture (CIAT): Palmira, Colombia, 2023; Available online: https://hdl.handle.net/10568/135521 (accessed on 31 December 2023).
- Yu, Q.; Xiang, M.; Sun, Z.; Wu, W. The complexity of measuring cropland use intensity: An empirical study. Agric. Syst. 2021, 192, 103180. [Google Scholar] [CrossRef] [Scilit]
- Wang, H.; Sui, W.; Zhang, W.; Guo, Y.; Wang, S.; Jiang, L. Dietary shift can enhance the environmental benefits of crop redistribution. Environ. Impact Assess. Rev. 2024, 106, 107494. [Google Scholar] [CrossRef] [Scilit]
- Long, W.; Zhu, X.; Weikard, H.P.; Oenema, O.; Hou, Y. Exploring sustainable food system transformation options in China: An integrated environmental-economic modelling approach based on the applied general equilibrium framework. Sustain. Prod. Consum. 2024, 51, 42–54. [Google Scholar] [CrossRef] [Scilit]
- Nilsson, S.; Schopfhauser, W. The carbon-sequestration potential of a global afforestation program. Clim. Change 1995, 30, 267–293. [Google Scholar] [CrossRef] [Scilit]
- Byers, E.; Krey, V.; Kriegler, E.; Riahi, K.; Schaeffer, R.; Kikstra, J.; Lamboll, R.; Nicholls, Z.; Sandstad, M.; Smith, C.; et al. AR6 Scenarios Database; International Institute for Applied Systems Analysis (IIASA): Laxenburg, Austria, 2022. [Google Scholar] [CrossRef]

Disclaimer/Publisher’s Note: The statements, opinions and data contained in all publications are solely those of the individual author(s) and contributor(s) and not of MDPI and/or the editor(s). MDPI and/or the editor(s) disclaim responsibility for any injury to people or property resulting from any ideas, methods, instructions or products referred to in the content. |
© 2026 by the authors. Licensee MDPI, Basel, Switzerland. This article is an open access article distributed under the terms and conditions of the Creative Commons Attribution (CC BY) license.