


Abstract
Landslide susceptibility mapping identifies terrain prone to slope failure under comparable environmental and triggering conditions. Grid-based machine-learning outputs can be spatially fragmented and difficult to translate into slope-scale mitigation. We developed a two-stage grid-to-slope-unit framework for rainfall-conditioned susceptibility assessment in Pingyuan County, Guangdong Province, China. Elevation, slope angle, slope aspect, normalized difference vegetation index, and rainfall were derived from an ALOS-PALSAR digital elevation model, Sentinel-2 imagery, and rainfall-station observations. A Random Forest model was trained at grid scale using 28 pre-2024 landslides and 28 pseudo-absence samples. Grid-scale scores and the five conditioning factors were then summarized within 4786 slope units and used in a second Random Forest model. An inventory of 359 landslides mapped after the June 2024 rainfall event was used for event-conditioned validation. High and very-high susceptibility classes occupied 21.10% of the modeled area and contained 299 validation landslides, yielding a capture rate of 83.3%. The very-high class contained 64.62% of validation landslides within 9.10% of the area. The framework produced geomorphically coherent terrain units for regional screening and field investigation, while detailed stability assessment remains necessary for individual sites.
1. Introduction
Rainfall-induced landslides are recurrent hazards in humid mountainous regions, where intense precipitation, antecedent soil wetness, steep topography, and weathered materials interact to reduce slope stability [1,2]. These failures can occur rapidly during storm events and can cause casualties, road disruption, and damage to settlements and agricultural land. Landslide susceptibility mapping (LSM) is therefore widely used to identify areas where future landslides are more likely under comparable environmental conditions and to support land-use planning, emergency preparedness, and targeted field investigation [3]. In subtropical monsoon regions of southern China, the problem is particularly important because rainfall is strongly seasonal, and short-duration extreme storms can occur after long wet periods, producing conditions favorable to shallow slope failure [4,5].
The reliability of LSM depends on the quality of landslide inventories, the representativeness of conditioning factors, the sampling strategy for stable terrain, and the spatial unit used for prediction. Conventional statistical approaches, including frequency ratio and logistic regression, have been widely applied because of their transparency and ease of interpretation [2]. However, landslide occurrence is often governed by nonlinear and spatially variable interactions among terrain morphology, hydrological concentration, vegetation condition, lithology, rainfall, and human disturbance. Machine-learning methods, including Random Forest (RF), gradient boosting, support vector machines, and neural networks, have therefore become common in LSM because they can represent complex predictor interactions and usually provide competitive predictive performance [6,7]. RF is especially useful for regional susceptibility analysis because it is relatively robust to noisy predictors, can model nonlinear effects, and produces spatially continuous probability estimates.
Although machine-learning algorithms can improve prediction, susceptibility patterns are also strongly affected by the mapping unit. Grid cells are computationally convenient and directly compatible with raster predictors, but their regular geometry may subdivide a single hillslope into many independent pixels and produce spatially fragmented maps. Such outputs can be difficult to interpret for field verification, road-section management, or catchment-scale mitigation. Slope units provide an alternative representation by partitioning the landscape into hydrologically and geomorphologically meaningful hillslope domains bounded by drainage and divide lines [8,9]. Because landslide initiation and runout are influenced by runoff routing, local relief, and slope continuity, slope-unit-based LSM can better align susceptibility results with natural terrain elements and can reduce pixel-scale noise [10,11,12].
A central challenge in landslide susceptibility mapping is to reconcile fine spatial resolution with geomorphic interpretability. Pixel-based machine-learning models preserve local variability and nonlinear relationships among raster predictors, whereas slope-unit maps express susceptibility within terrain partitions that more closely correspond to hillslope hydrological and geomorphic processes. The two representations are complementary: grid-scale modeling captures fine-scale predictor interactions, while slope-unit modeling translates this information into units suitable for terrain interpretation and local hazard management.
This study applies a two-stage grid-to-slope-unit strategy in Pingyuan County, Guangdong Province, using the June 2024 rainfall-induced landslide inventory for temporally separated validation [13]. The objectives were to: (1) generate a grid-based RF susceptibility surface; (2) integrate the aggregated RF score with slope-unit conditioning attributes in a second RF model; and (3) determine whether event landslides were concentrated within a limited proportion of high-susceptibility terrain. Because rainfall from the June 2024 event was included as a predictor, the validation is interpreted as event-conditioned rather than fully prospective.
2. Study Area
Pingyuan County is located in northeastern Guangdong Province, China, between approximately 24.4–24.9° N and 115.7–116.2° E. The selected study area includes mountainous and hilly uplands and covers approximately 474 km2, of which the classified slope-unit modeling domain represented 462.80 km2 based on the catchment areas. The region has a humid subtropical monsoon climate, with mean annual precipitation of about 1700 mm [4]. Rainfall is concentrated in the pre-flood and flood seasons, and the county is affected by typhoon-related and convective storms. The June 2024 event followed an extended wet period, creating conditions favorable to saturation-driven shallow landsliding [13].
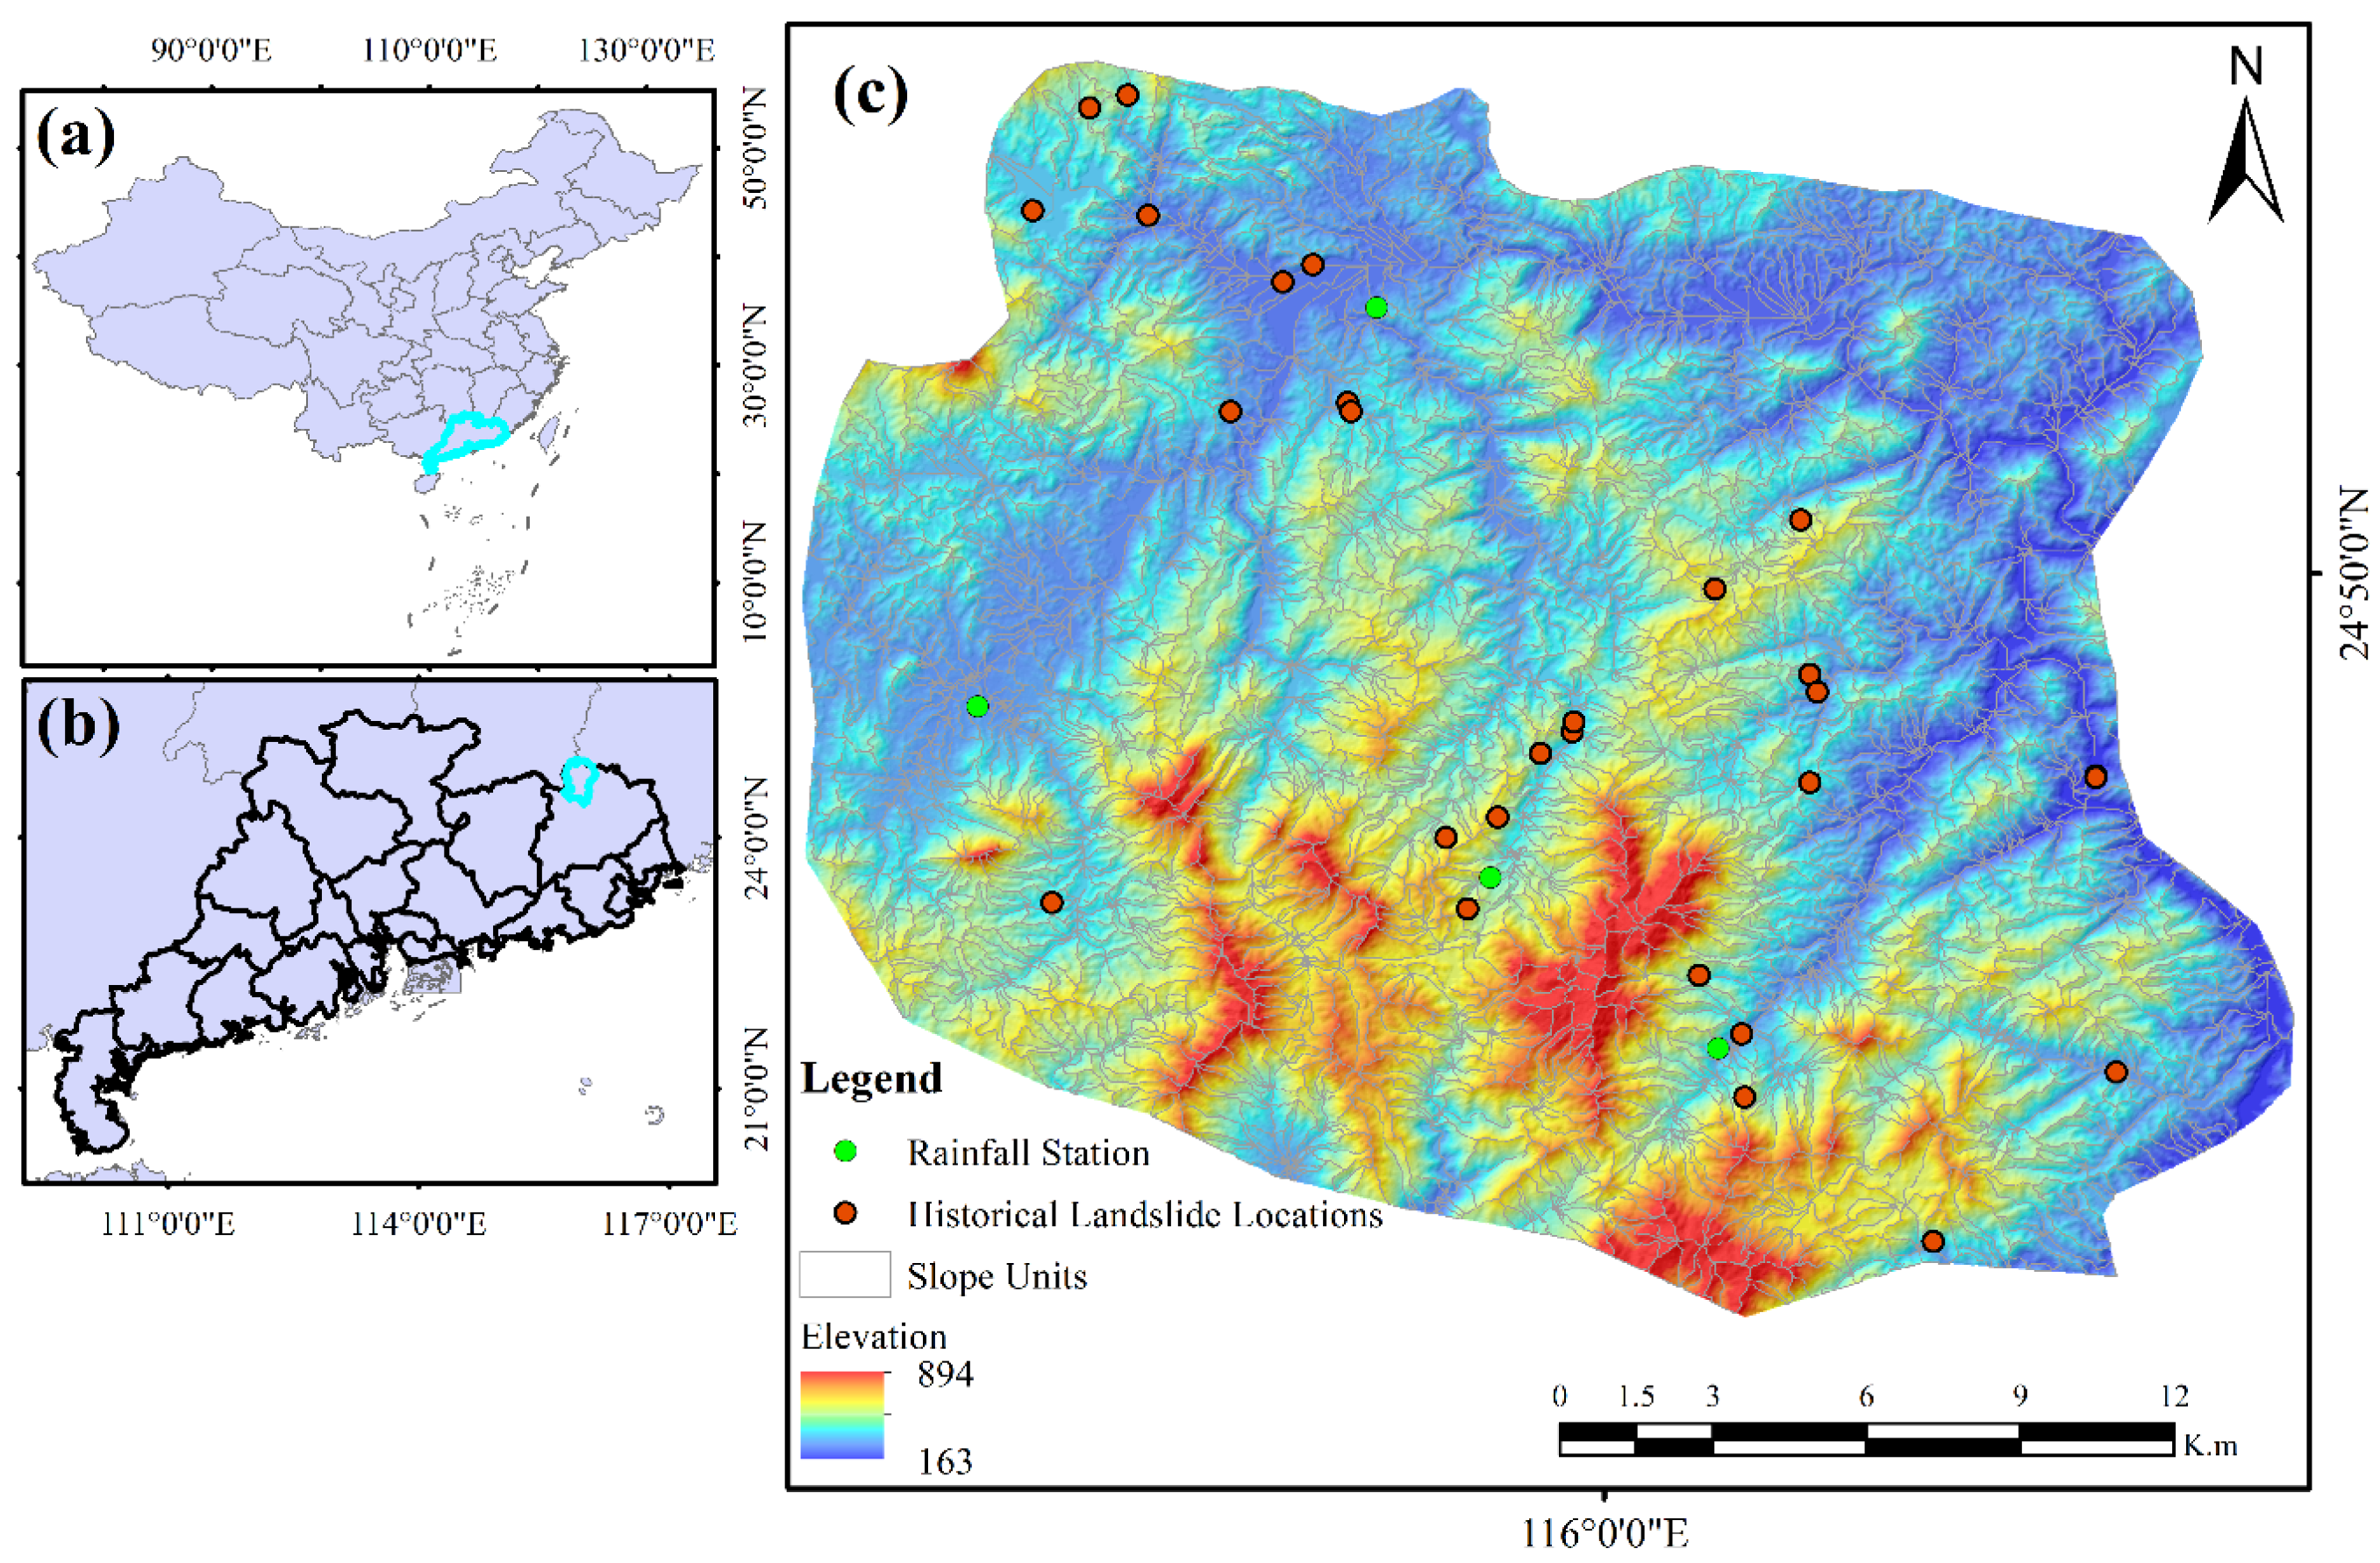
The terrain comprises narrow valleys, steep hillslopes, and locally strong relief, with elevations from 163 to 894 m above sea level. Roads, settlements, and cultivated land commonly occupy valley bottoms and lower hillslope positions. During intense rainfall, runoff from upper slopes can converge into channels and roadside drainage systems, potentially increasing erosion, undercutting, and pore-water pressure in weathered materials. The geological setting includes granite, sandstone, and other sedimentary and igneous rocks that may be deeply weathered under humid subtropical conditions. These characteristics make the area suitable for evaluating a slope-unit-based susceptibility framework.
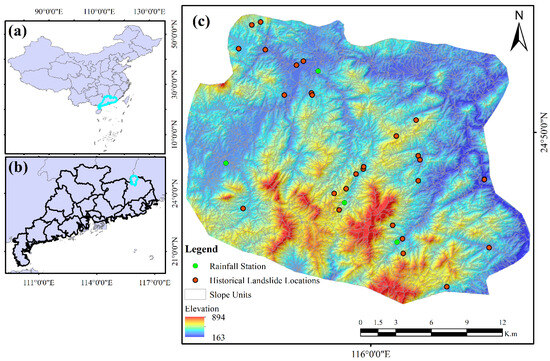
Figure 1 shows the location and terrain context of the study area. The distribution of upland catchments, valley corridors, transport routes, and mapped landslides provides the spatial context for interpreting the grid- and slope-unit-based results.
Figure 1.
Location and context of the study area: (a) China Provincial administrative boundaries; (b) City-based boundaries within Guangdong Province and (c) showing the spatial distribution of rainfall monitoring stations, historical landslides, and terrain setting for landslide susceptibility modeling.
3. Materials and Methods
3.1. Datasets
Topographic variables were derived from an ALOS-PALSAR digital elevation model (DEM) with a spatial resolution of 12.5 m, obtained from the Alaska Satellite Facility (https://asf.alaska.edu/). The DEM was pre-processed and used to generate elevation, slope angle, and slope aspect layers. Elevation represents terrain position and relief-related environmental gradients; slope angle reflects gravitational driving conditions; and aspect influences solar radiation, moisture retention, vegetation condition, and rainfall exposure. All raster layers were projected and clipped to a common spatial framework before modeling to ensure consistency between grid-based analysis and slope-unit aggregation.
A historical inventory compiled from Guangdong government records was used for model calibration. It comprised 28 mapped landslide locations that pre-dated the June 2024 rainfall event. The location and occurrence date are available from the data provider, subject to the stated access restrictions. A separate inventory of 359 landslides associated with the June 2024 event [13] was used only as validation labels. Vegetation condition was represented by NDVI derived from Sentinel-2 imagery used from April to May 2024, with a cloud cover threshold of >5% in the area. Rainfall was represented by station observation data taken from the 16 June 2024 event and interpolated through weighted inverse distance (IDW) across the study area. Because this event rainfall field was included as a predictor, the resulting map represents rainfall-conditioned susceptibility for the event scenario rather than a purely static susceptibility map. The final predictor set comprised elevation, slope angle, slope aspect, NDVI, and rainfall.
All datasets were harmonized before modeling to minimize spatial offsets arising from differences in projection, pixel size, and extent. DEM-derived terrain factors, Sentinel-2 vegetation information, interpolated rainfall, and landslide inventories were aligned to a common grid. Zonal statistics were calculated only after this alignment, which was particularly important in steep and narrow valleys.
3.2. Modeling Workflow
3.2.1. Slope-Unit Delineation
Slope units were delineated from the 12.5 m DEM using r.slopeunits (v.2.0), which partitions terrain into drainage- and divide-bounded units. Such units approximate hillslope domains within which runoff routing, mass movement, and local terrain morphology are relatively coherent [8,9]. The final layer contained 4786 slope units.
Slope-unit delineation was governed by a minimum area threshold of 500 m2, a circular variance of 0.10 applied over 20 iterations, and the D8 method for flow direction; together these parameters control how finely the landscape is partitioned, and this particular combination was chosen to balance geomorphic detail against statistical reliability, since units that are too small tend to capture fine-scale terrain variation at the cost of noisy attributes and too few landslide occurrences per unit for robust analysis, while units that are too large smooth out that noise but risk merging hillslopes with genuinely different failure mechanisms, flattening real differences in susceptibility into an overly generalized result.
3.2.2. Conditioning-Factor Aggregation
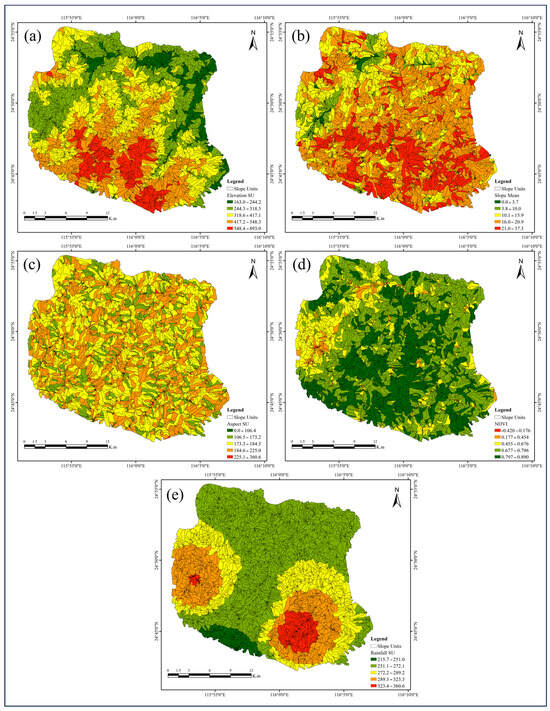
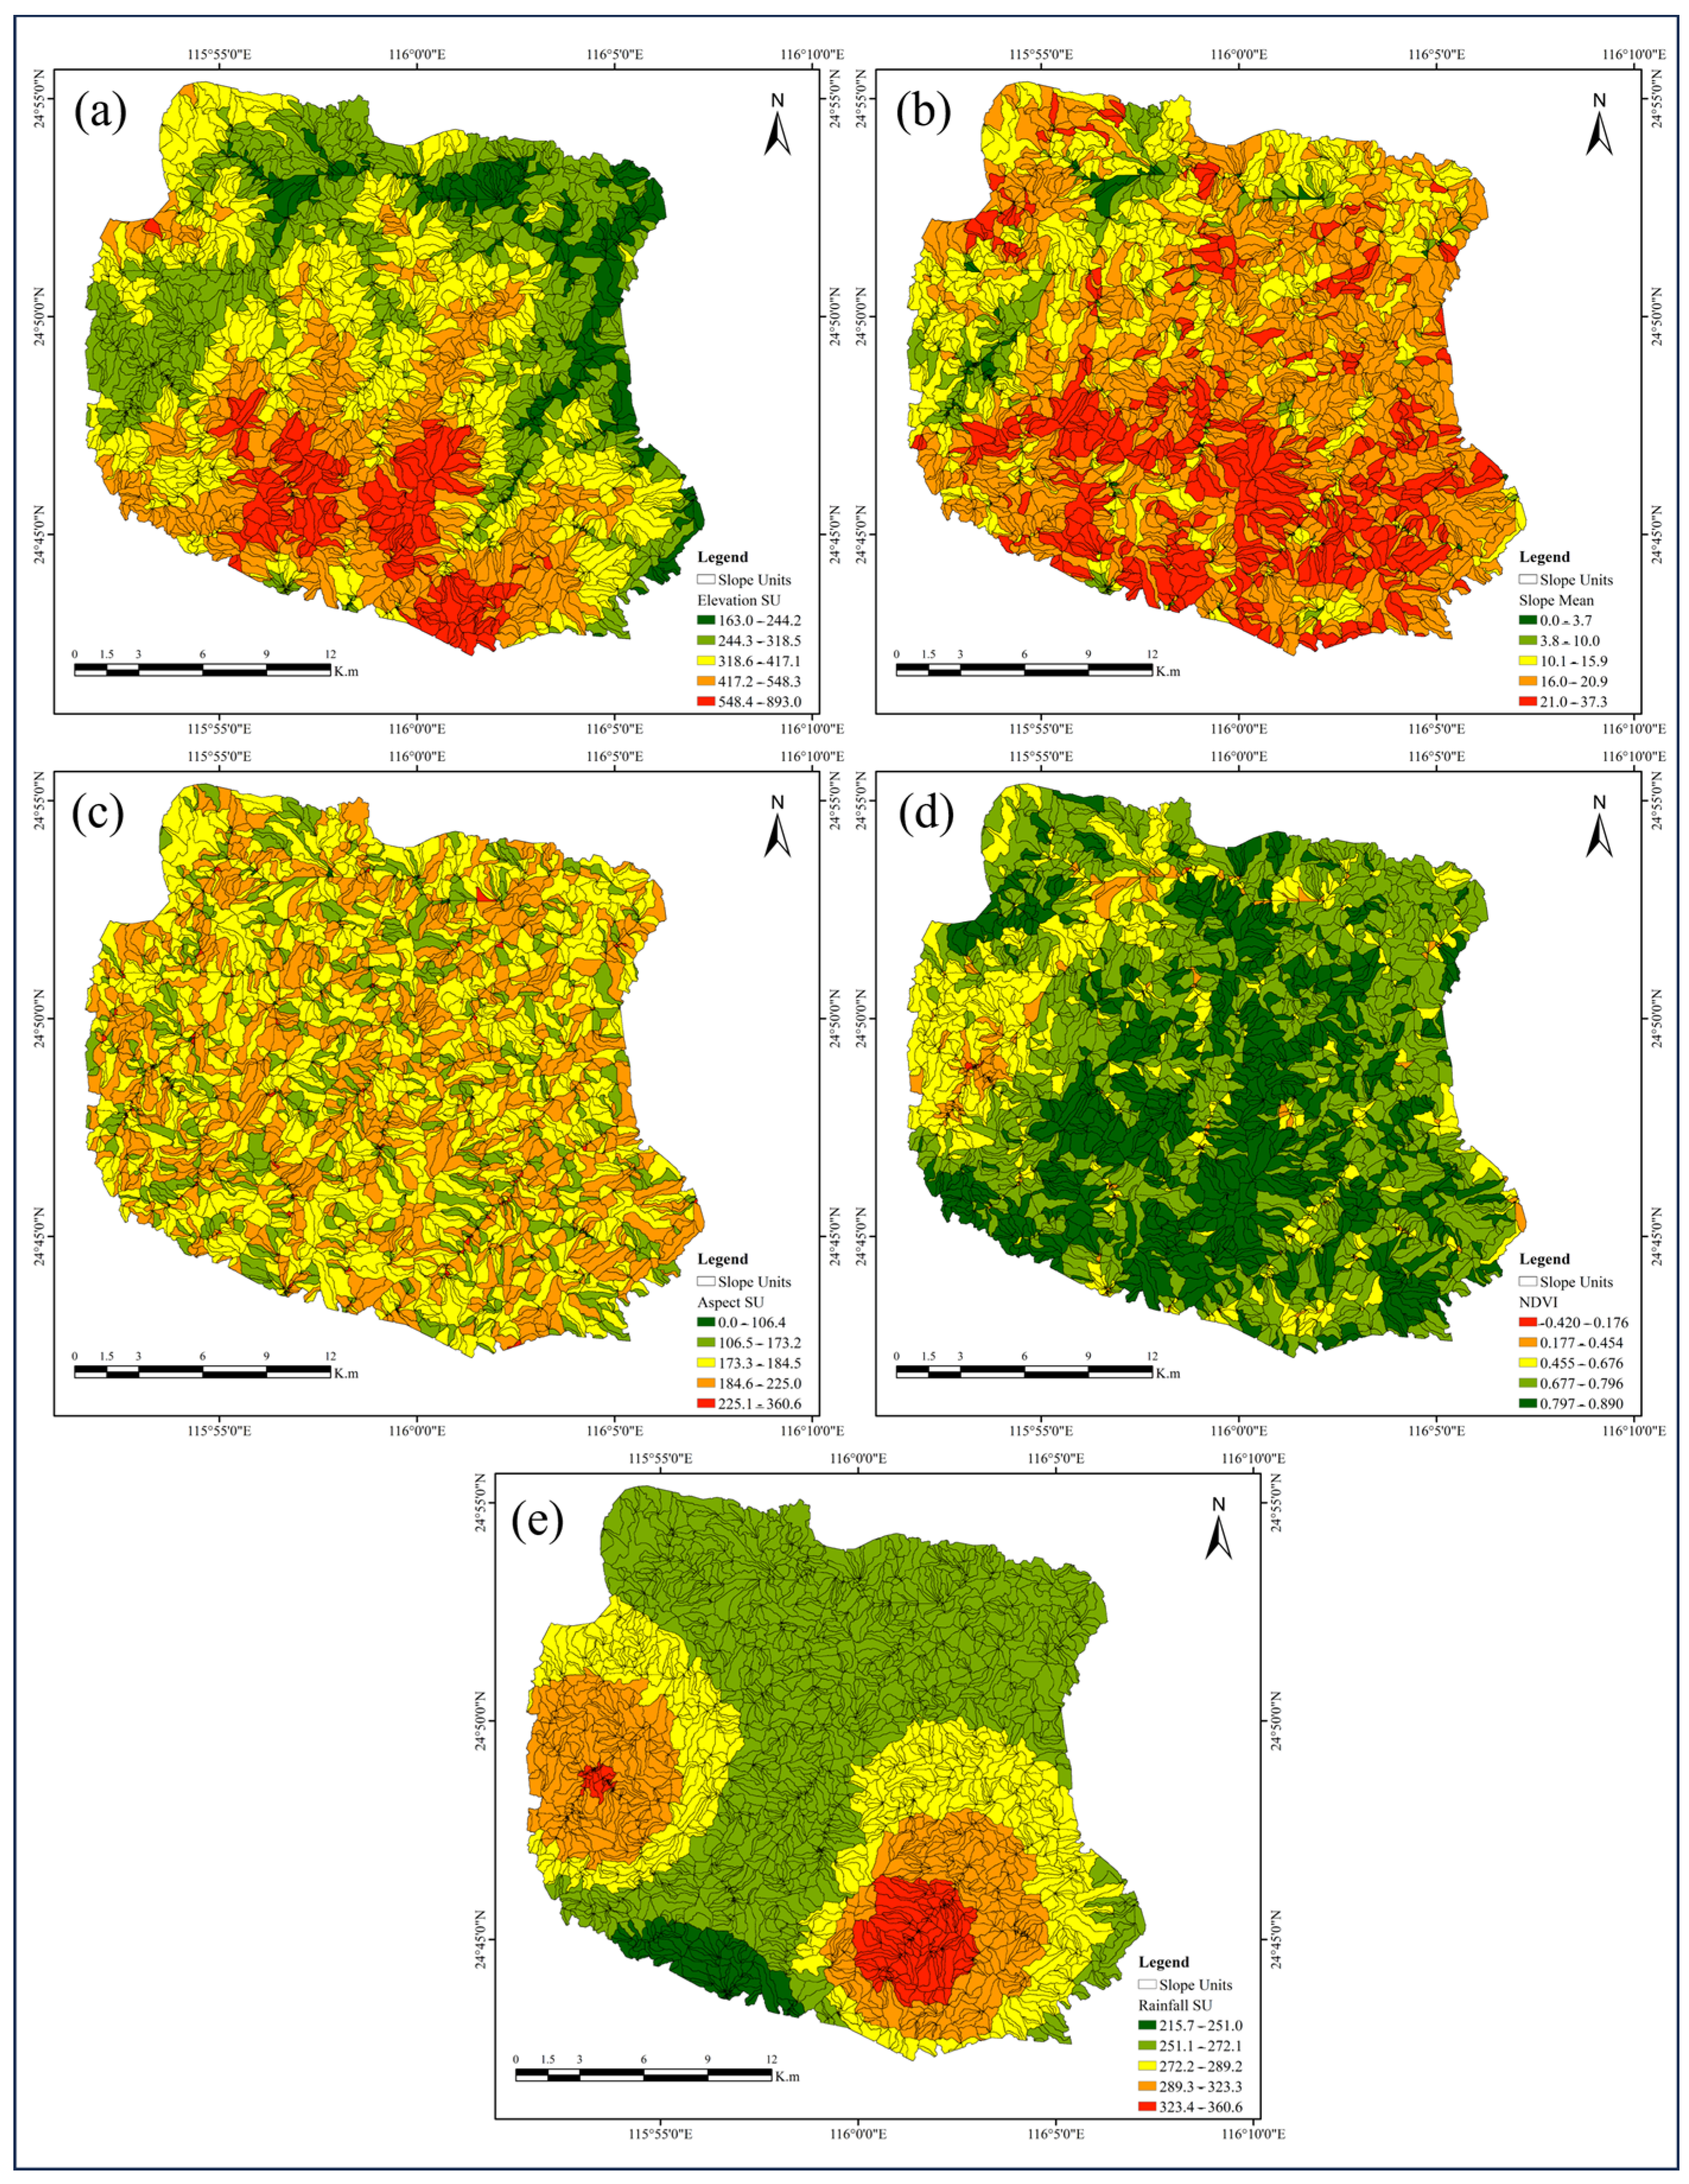
Five conditioning factors were used: elevation, slope angle, slope aspect, NDVI, and rainfall. They represent the topographic, vegetation, and hydrometeorological information available for this analysis and have been used in previous landslide susceptibility studies [2,14,15,16]. Raster values were summarized within each slope unit using zonal statistics in ArcGIS 10.8. We used arithmetic means for elevation, slope angle, NDVI, rainfall, and, in the current analysis, slope aspect, as shown in Figure 2. The same aggregation rule was retained to keep the predictor set parsimonious given the limited calibration inventory.
Figure 2.
Spatial distribution of the five conditioning factors used in the susceptibility analysis: (a) elevation, (b) slope angle, (c) slope aspect, (d) normalized difference vegetation index (NDVI), and (e) rainfall.
Elevation, slope angle, NDVI, rainfall, and RF-derived scores can vary substantially within a slope unit. The mean was adopted as the primary descriptor to summarize the general condition of each unit and limit model complexity. This aggregation may obscure small convergent hollows, road cuts, or channel margins within large or dissected units. The final classes should therefore support regional screening and field verification, not prediction of the exact within-unit failure location.
3.2.3. Grid-Based Random Forest Susceptibility Model
A grid-based RF model was developed from the five conditioning factors. RF combines decision trees fitted to bootstrap samples and random predictor subsets and aggregates their outputs. The calibration dataset contained 56 samples, comprising 28 landslide and 28 pseudo-absence locations. Pseudo-absence samples were drawn from selected areas with high vegetation cover with the threshold of (NDVI > 0.6) and gentle slopes with the threshold of (<20°), where landslide occurrence was considered relatively unlikely; several candidate samples were tested. Hyperparameters were selected through Bayesian optimization using mean cross-validation accuracy as the objective. The search included the number of trees, maximum tree depth, minimum split size, minimum leaf size, and number of predictors considered at each split.
The first-stage model was implemented with MATLAB TreeBagger (R2022B) after spatial data preparation in ArcGIS 10.8. The reported configuration used 100 trees and a maximum depth of 20, with candidate ranges informed by Zhang et al. [17]. Equal numbers of landslide and pseudo-absence samples (28 each) were used to maintain a balanced training dataset and reduce class imbalance during model development. Model training was conducted using spatially blocked 10-fold cross-validation in MATLAB. The Random Forest model was implemented using 100 decision trees (NumTrees = 100), with the maximum tree depth of 20. The TreeBagger model combines the predictions of multiple decision trees to improve model robustness and reduce prediction variance. The resulting output was interpreted as a relative landslide susceptibility index ranging from 0 to 1 rather than a calibrated probability of occurrence; it was later distributed into five classes based on natural breaks. Given the limited calibration dataset, the susceptibility map is intended for regional-scale exploratory screening rather than deterministic or site-specific prediction, and the results should be interpreted with appropriate caution because the limited sample size and model complexity may increase the potential risk of overfitting.
3.2.4. Integrated Grid-to-Slope-Unit Model and Validation
The integrated model transferred the grid-scale RF information into a second slope-unit RF model. First, the five conditioning factors were used to generate a grid-scale RF susceptibility index. Second, the grid-scale RF scores and the five conditioning factors were aggregated within each slope unit by calculating their mean values. Slope units containing one or more mapped landslides were assigned to the positive class (label = 1), whereas slope units without mapped landslides were assigned to the negative class (label = 0). A balanced set of positive and negative slope units (28 slope units, including the historical landslides) was used to train the second-stage RF model. The mean grid-scale RF susceptibility index was then combined with the five slope-unit conditioning factors as predictor variables for the second-stage RF classification. This hierarchical framework preserves the nonlinear relationships captured at the grid scale while integrating slope-unit characteristics to generate susceptibility estimates at the hillslope scale.
The final slope-unit scores were divided into very low, low, medium, high, and very-high classes using the Jenks natural breaks method [18,19]. Performance was evaluated by overlaying the classified maps with the 359 landslides from the June 2024 event. The natural-break classification provides a concise basis for evaluating the high and very-high classes against the validation inventory. The percentage of validation landslides in the high and very-high classes is reported as the validation capture rate. It is not reported as overall accuracy because the overlay does not enumerate true-negative and false-positive outcomes across the landscape. The validation is temporally separated with respect to landslide labels but conditioned on the rainfall field of the same event.
The workflow comprised six operations: data harmonization, grid-based RF modeling, slope-unit delineation, zonal aggregation, slope-unit RF modeling, and validation of the grid-based and integrated outputs. The 2024 landslide inventory was not used as a calibration label. However, the June 2024 rainfall field was used as a predictor, so the evaluation tests spatial ranking under an observed event scenario rather than a fully independent prospective forecast.
4. Results and Discussion
4.1. Grid-Based Landslide Susceptibility Pattern
The grid-based RF model produced a continuous susceptibility score from elevation, slope angle, slope aspect, NDVI, and rainfall. These variables represent the terrain, vegetation, and hydrometeorological information available for the study area and are commonly used in susceptibility studies in Guangdong [20]. Because the calibration inventory contained only 28 landslides, the grid output was interpreted through its broad spatial pattern and event-conditioned validation rather than as a precise site-scale probability forecast.
The RF map assigned each grid cell a relative susceptibility score from 0 to 1 (Figure 3). Higher scores occurred mainly on valley-side slopes, near drainage corridors, and in steep terrain. This probability map was later divided into five classes based on the natural break method into very low, low, moderate, high, and very-high susceptibility zones. The RF-based variable-importance analysis ranked the conditioning factors, from highest to lowest importance, as rainfall, slope, elevation, NDVI, and aspect. These spatial associations are consistent with, but do not independently demonstrate, effects of runoff concentration or local relief. Lower scores generally occurred on gentler terrain. The cell-based map also contained local patchiness that reduced its usefulness for slope-scale interpretation.
Figure 3.
Grid-based landslide susceptibility score generated by the Random Forest model using elevation, slope angle, slope aspect, NDVI, and rainfall.
The grid-based map showed higher scores in the central and northern parts of the study area and lower scores in the southern sector. High-score cells were frequently observed near stream networks and valley-side slopes. Isolated high-score pixels also occurred where local raster values resembled those at calibration landslides but did not form coherent hillslope-scale zones. This pattern motivated aggregation to slope units.
Grid-based RF scores were aggregated to slope units by calculating the mean score of all grid cells within each unit. This conversion transformed pixel-level scores into terrain-unit attributes and reduced isolated raster artifacts. The aggregated layer served as an intermediate product between the grid model and the integrated slope-unit model.
Figure 4 shows the mean grid RF score for each slope unit. Relative to the grid map, the slope-unit representation produced more terrain-consistent zones and greater visual coherence. It retained the broad contrast between lower scores in the south and higher scores in the northern and valley-side sectors. This representation is easier to use when the management target is a hillslope or small catchment rather than an individual raster cell.
Figure 4.
Slope-unit representation of the grid-based Random Forest output after averaging pixel-level RF susceptibility scores within each delineated slope unit.
The aggregated RF layer was an intermediate product rather than the final susceptibility map. A high mean score indicates that a larger share of cells within a slope unit resembled the conditions represented by historical calibration landslides. This transformation reduces the influence of isolated raster cells but may also smooth small high-score areas within a unit.
4.2. Integrated Slope-Unit Landslide Prediction
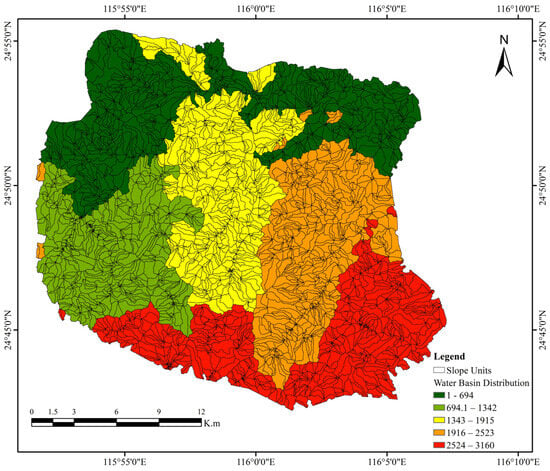
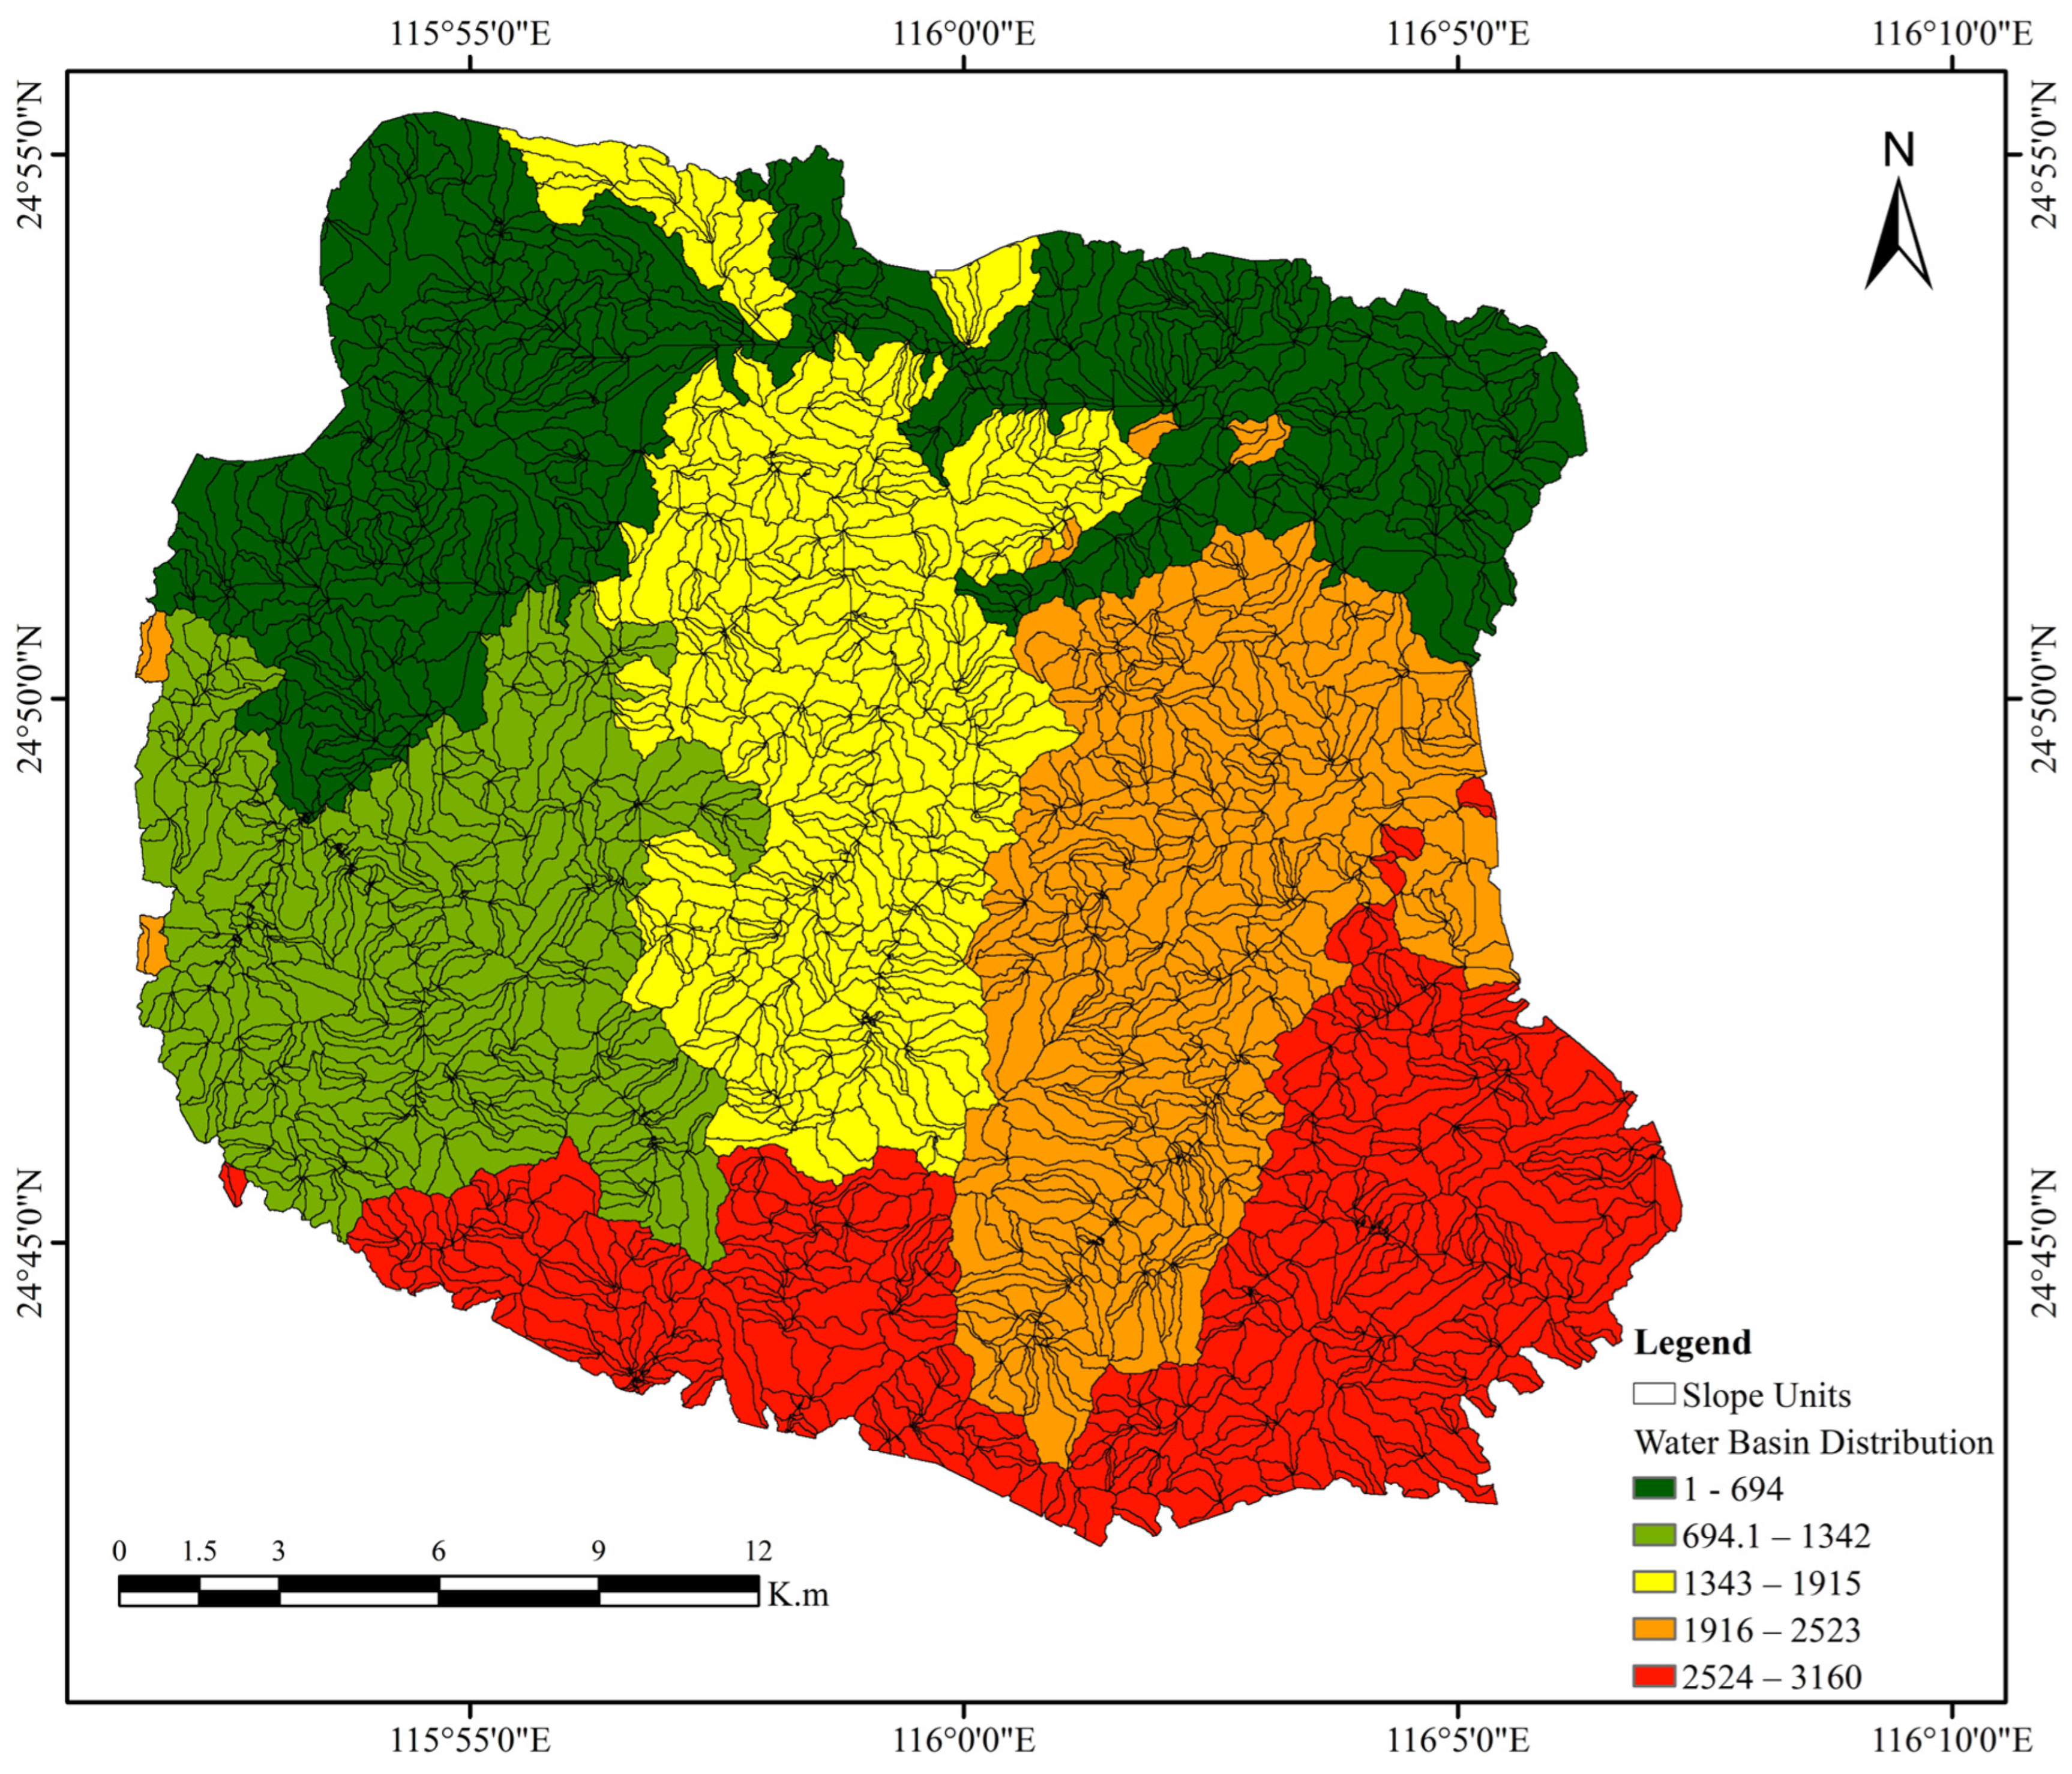
This section discusses the slope unit’s approximate hillslope and small-catchment domains, within which runoff routing and downslope material movement can be interpreted more directly than for individual grid cells. Figure 5 presents the basin and slope-unit delineation used in the integrated analysis. These units provide the spatial framework for translating susceptibility classes into field-scale management targets.
Figure 5.
Basin and slope-unit delineation used to aggregate raster predictors and grid-based RF susceptibility scores.
The integrated map was generated with a second RF model that combined mean slope-unit values of elevation, slope angle, slope aspect, NDVI, and rainfall with the mean grid-based RF score. The RF-based second stage variable-importance analysis ranked the conditioning factors, including the grid-based input of LSM, from highest to lowest importance, as grid-based LSM, slope, rainfall, NDVI, elevation, and aspect. This structure allowed the final score to reflect both the aggregated conditioning attributes and the nonlinear information transferred from the grid model. The output formed coherent hillslope-scale zones, although spatial coherence alone should not be interpreted as proof of greater predictive performance.
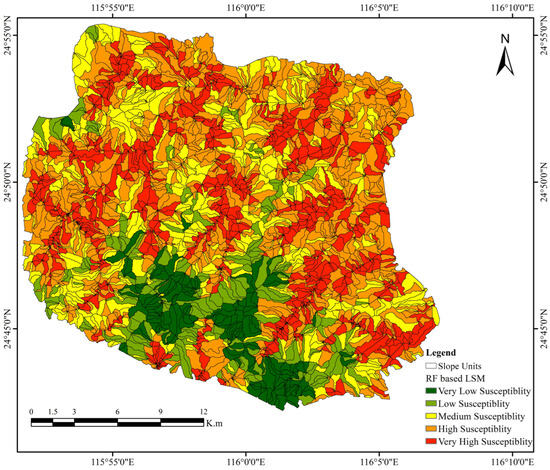
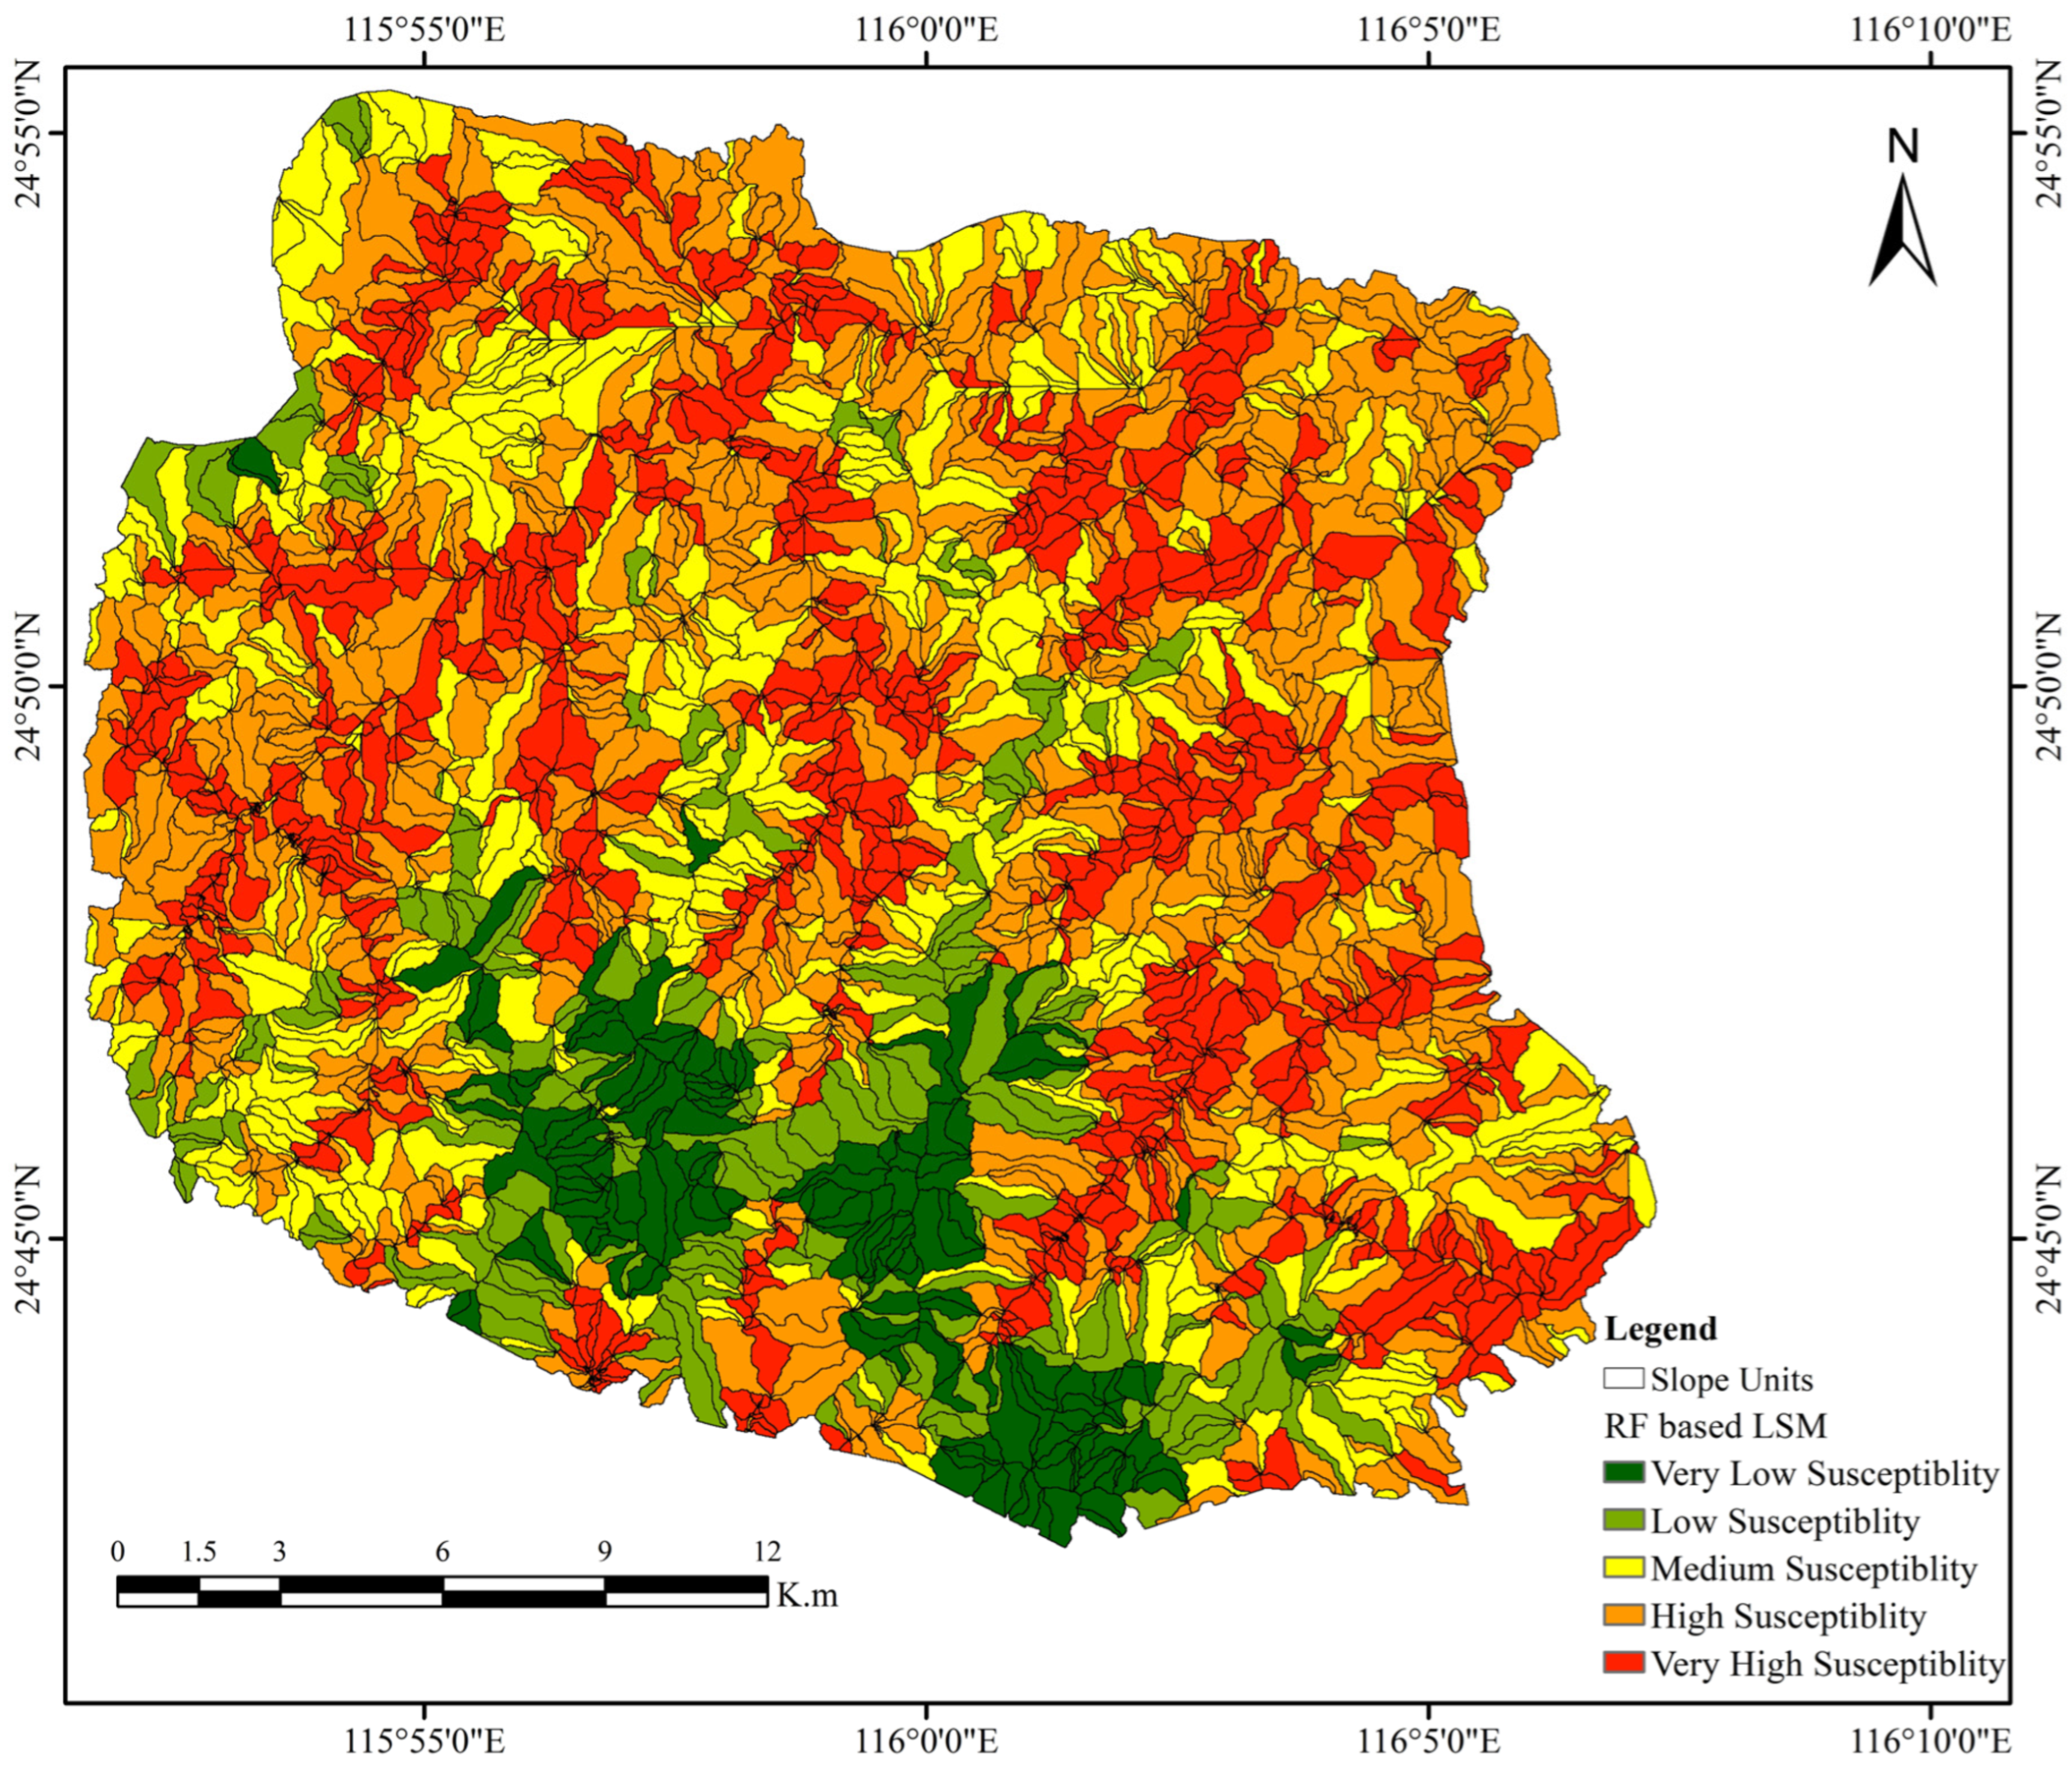
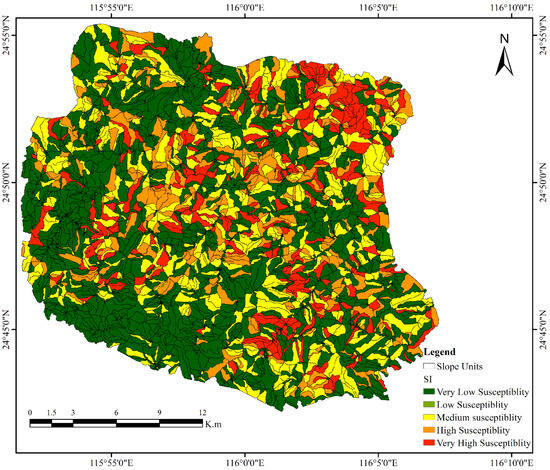
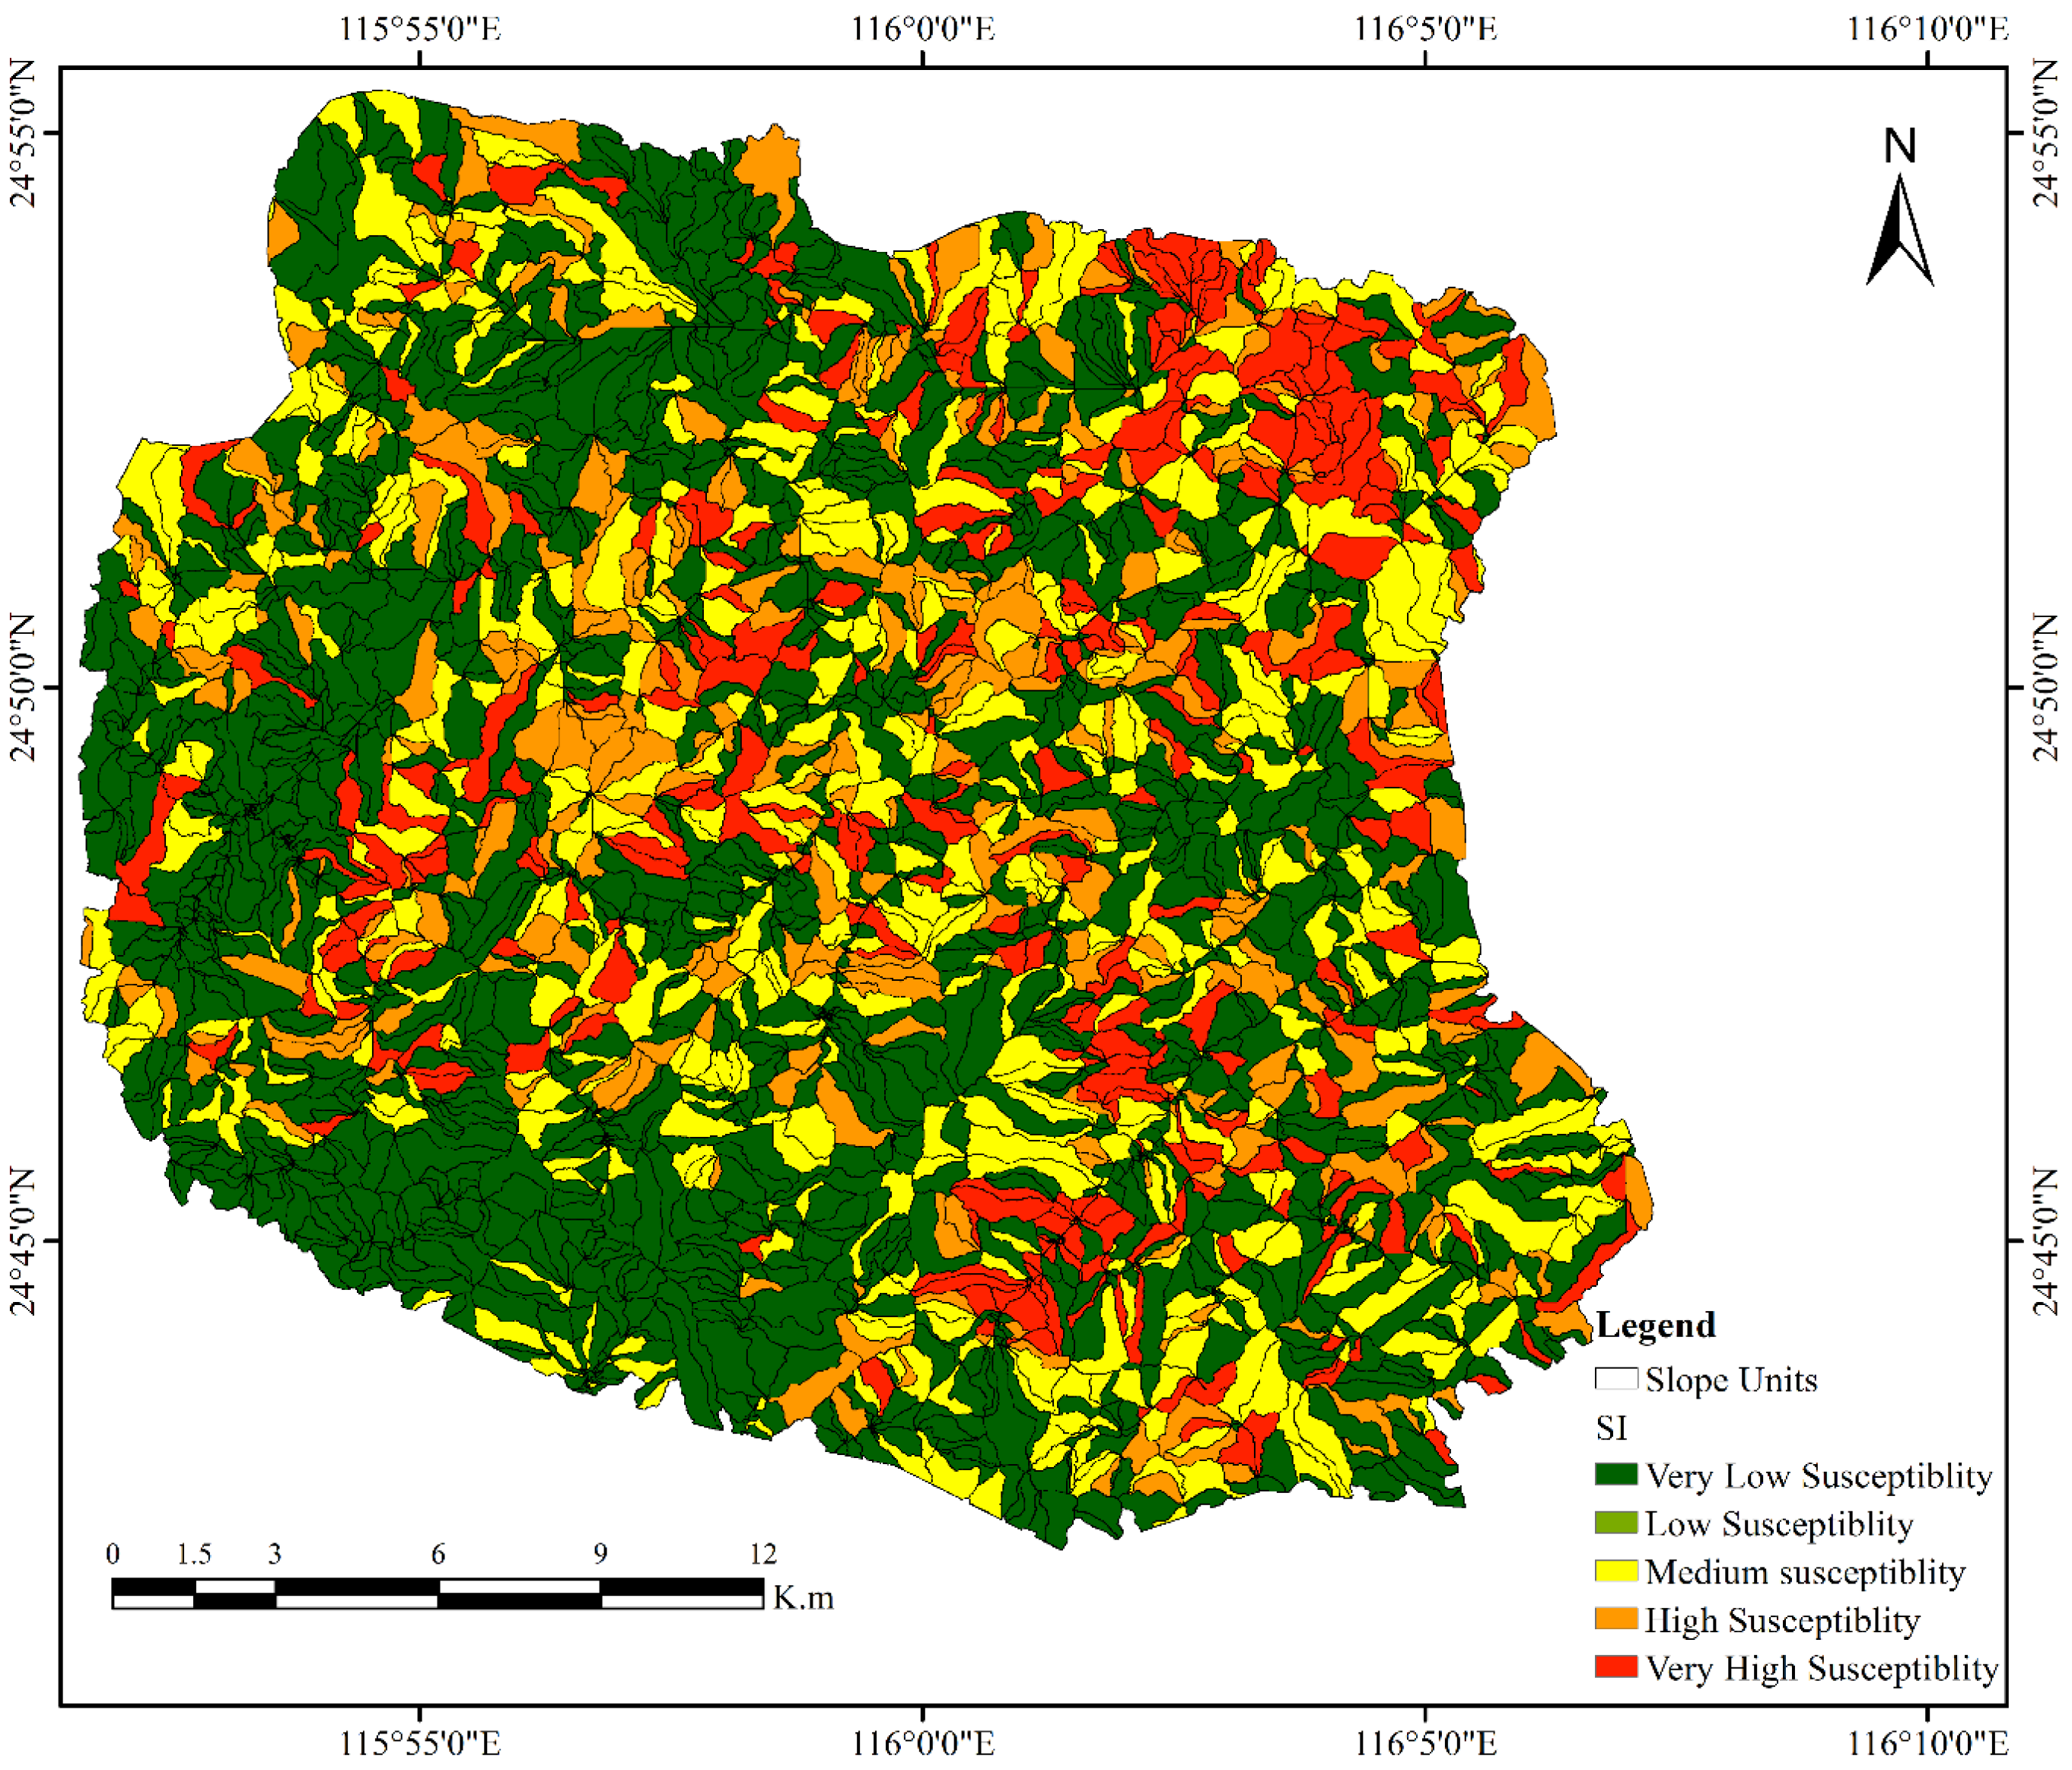
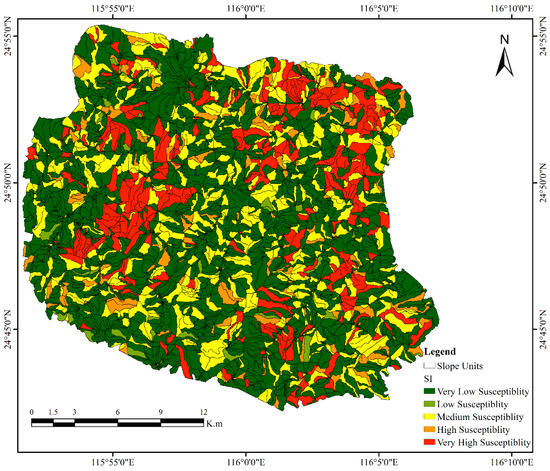
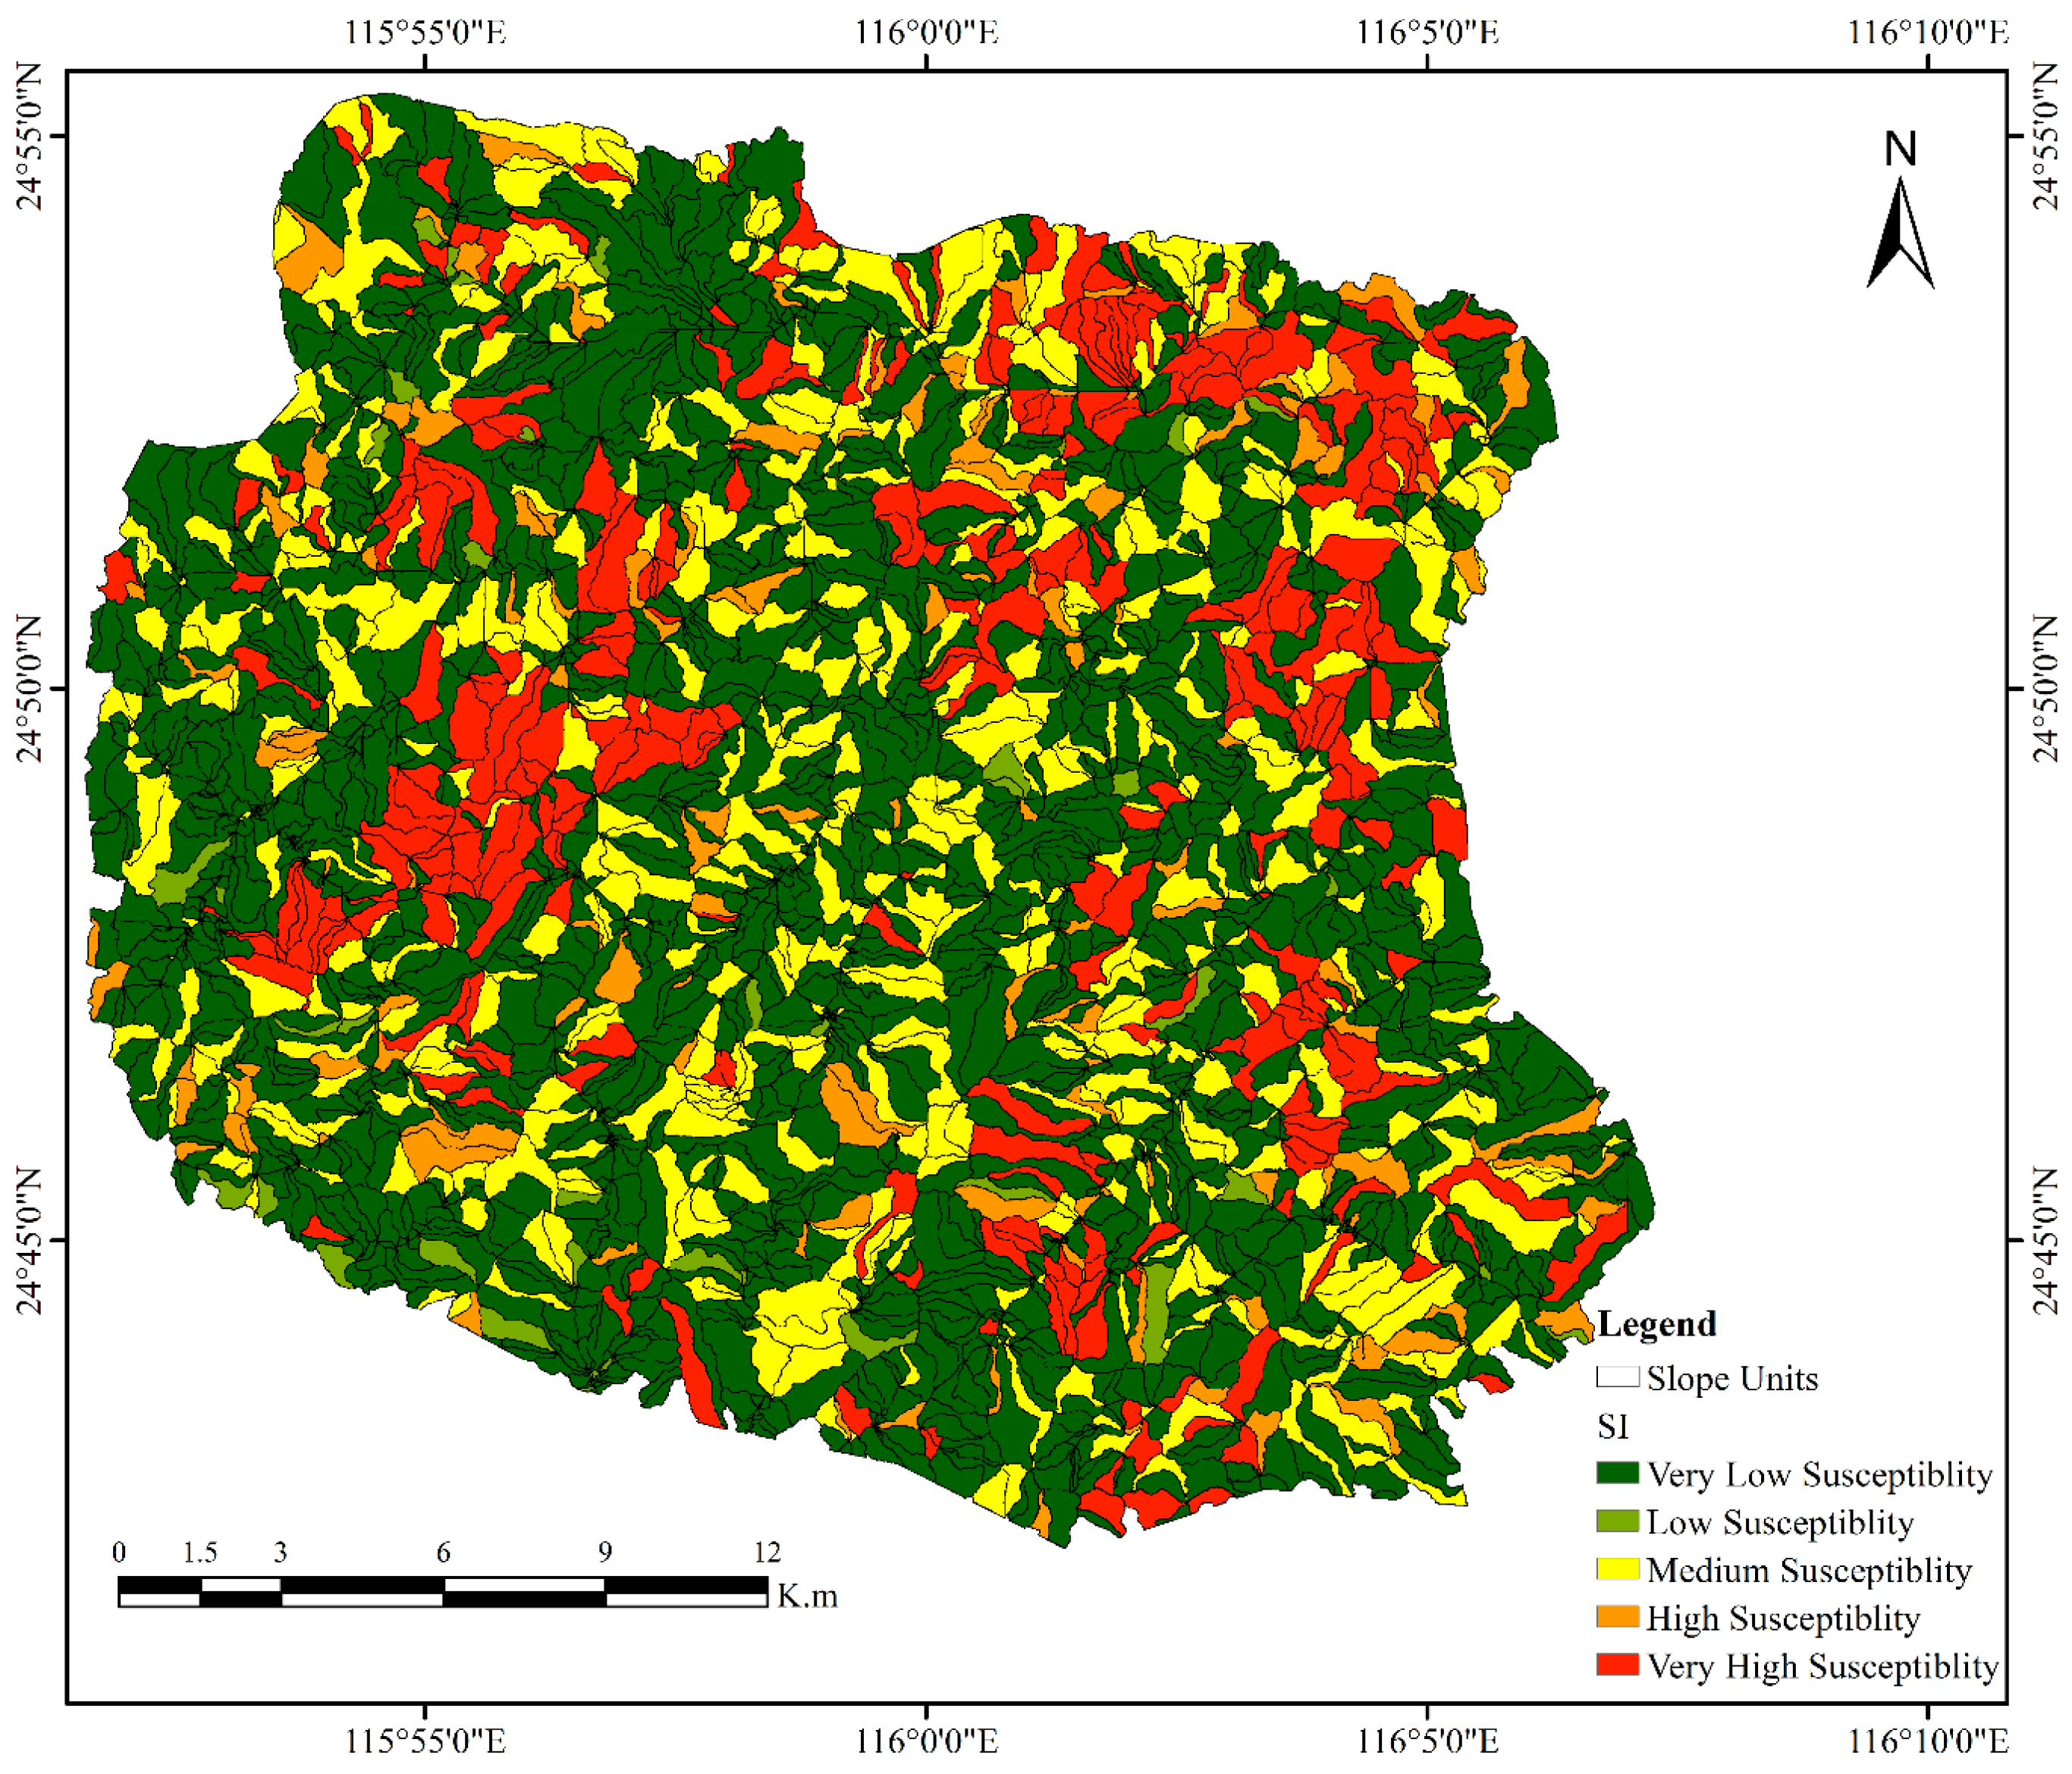
The continuous scores were classified into five levels using Jenks natural breaks. Figure 6 shows the slope-unit baseline derived from the aggregated conditioning factors, whereas Figure 7 shows the integrated model that additionally includes the aggregated grid RF score. These maps provide a descriptive comparison of how the transferred grid information changed the spatial distribution of slope-unit classes.
Figure 6.
Slope-unit landslide susceptibility map derived from aggregated conditioning factors before incorporation of the grid-based RF susceptibility score.
Figure 7.
Integrated slope-unit landslide susceptibility map generated from slope-unit conditioning attributes and the aggregated grid-based Random Forest susceptibility score.
The slope-unit baseline was evaluated with the temporally separated 2024 inventory. Its high and very-high classes contained 76.4% of the validation landslides, which is a capture rate rather than overall accuracy. After the mean grid RF score was added, the integrated model retained grid-scale information in a more interpretable terrain-unit representation. Because each map was classified using distribution-dependent Jenks breaks, the difference between the two capture rates is descriptive and should not be treated as a continuous-score performance test.
Most of the modeled area was classified as very low or low susceptibility, indicating relatively stable terrain under the prevailing environmental conditions. In contrast, the high and very-high susceptibility classes were predominantly concentrated along valley margins and steep hillslopes, where topographic conditions favor slope instability through increased gravitational stress, surface runoff, and localized erosion. Several highly susceptible slope units also coincided with road corridors, suggesting that slope cutting and associated anthropogenic disturbances may have reduced slope stability. In addition, areas characterized by sparse vegetation cover exhibited higher susceptibility, likely due to reduced root reinforcement and diminished soil protection against erosion. High-susceptibility zones were also frequently associated with drainage convergence areas, where concentrated surface and subsurface water flow can increase soil moisture, reduce shear strength, and promote slope failure. These spatial patterns are consistent with the combined influence of topographic, hydrological, and anthropogenic factors on landslide occurrence.
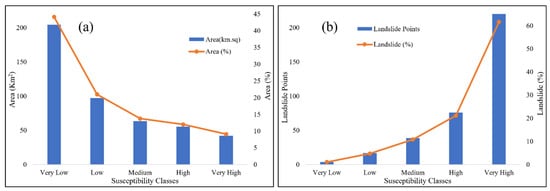
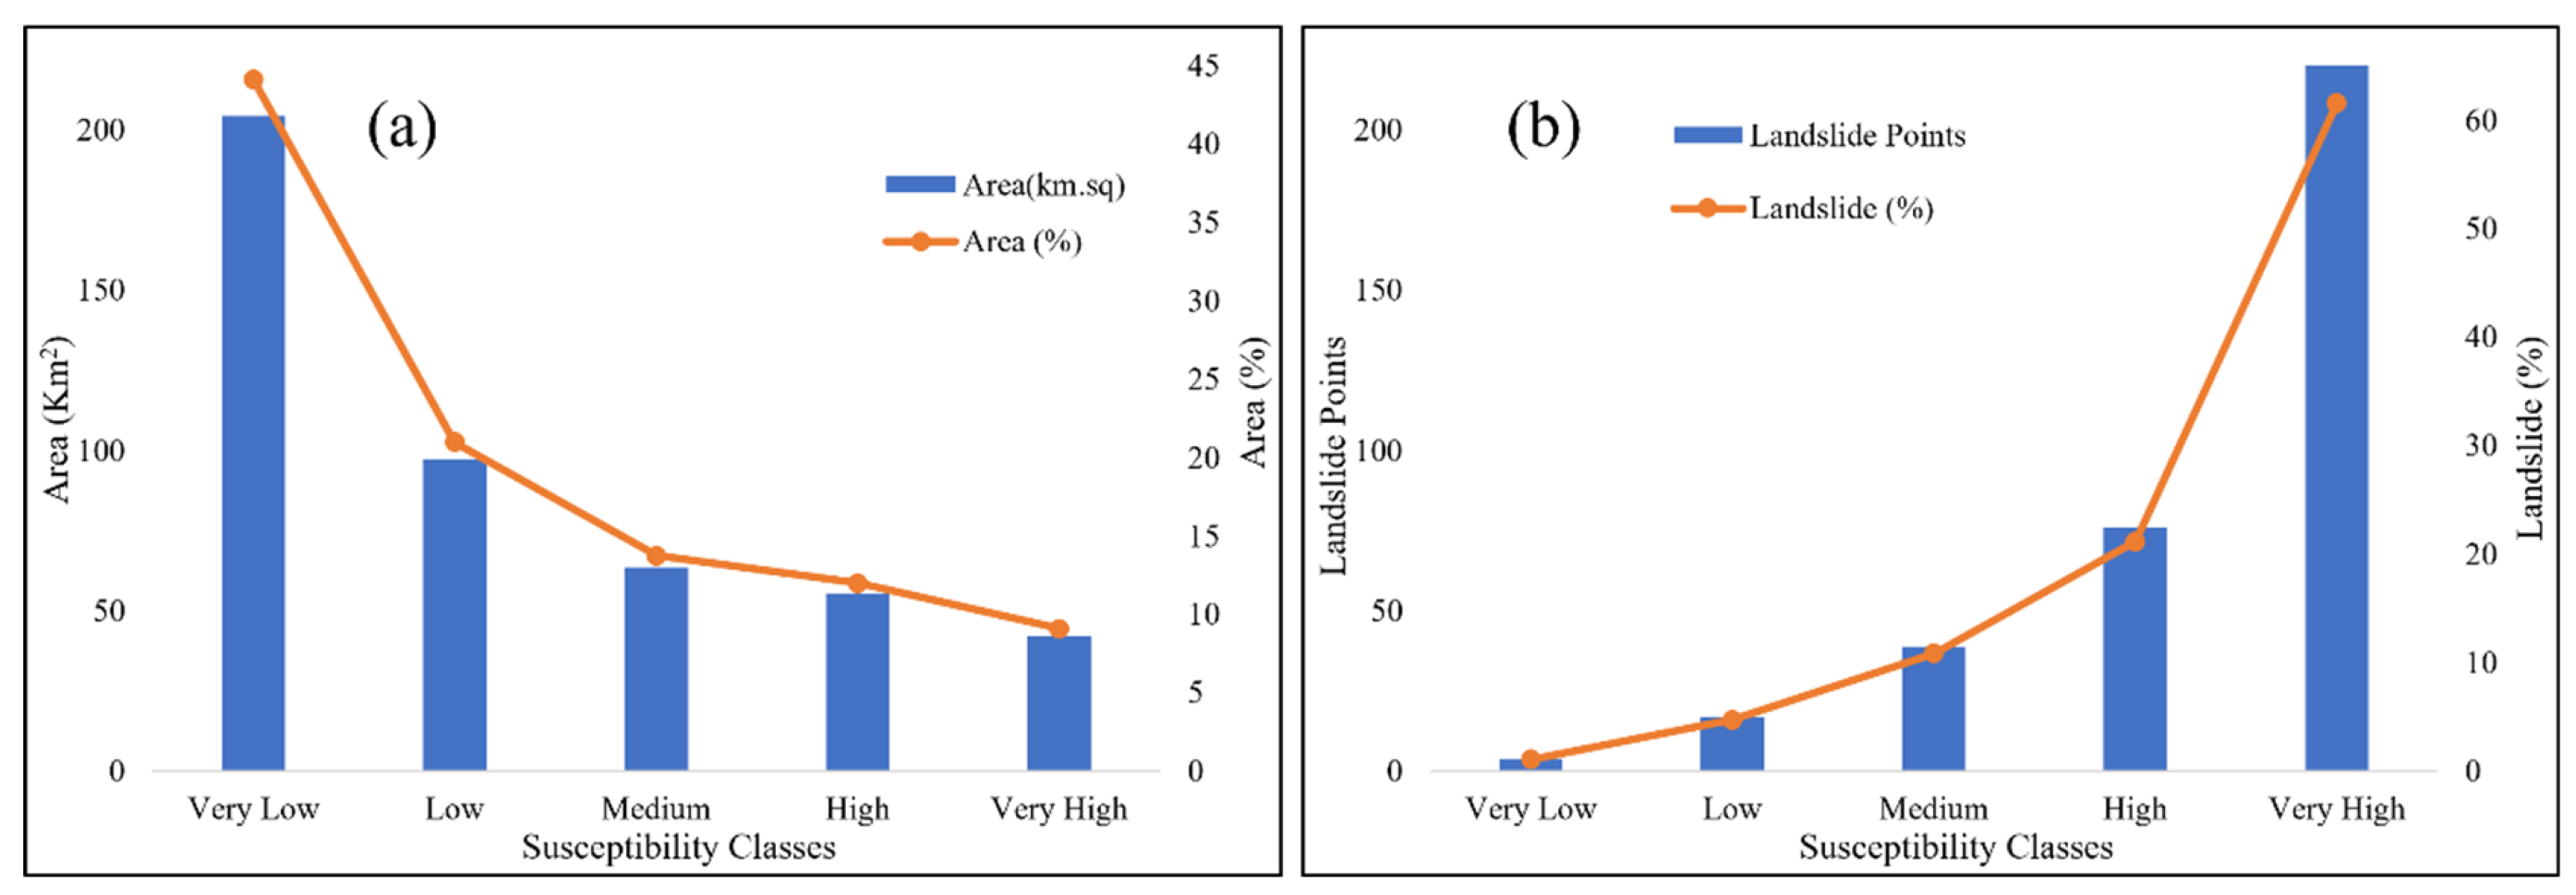
Table 1 and Figure 8 summarizes the susceptibility classes. Of the 4786 slope units, 1939 (40.51%) were very low and 1394 (29.13%) were low; together, these classes covered 65.16% of the modeled area. The high and very-high classes contained 608 units (12.71%) and covered 97.65 km2, or 21.10% of the modeled area. They contained 299 of the 359 validation landslides, giving a capture rate of 83.3%. The corresponding baseline capture rate was 76.4%, but this descriptive difference is affected by the model-specific Jenks class boundaries. Only 21 validation landslides (5.9%) occurred in the very low and low classes. Landslide density increased from approximately 0.020 km−2 in the very low class to 5.508 km−2 in the very-high class, supporting the ordinal separation of the mapped classes.
Table 1.
Area, slope-unit, and temporally separated validation-landslide statistics for the integrated slope-unit map.
Figure 8.
Distribution of susceptibility classes: (a) slope-unit area and area percentage and (b) temporally separated validation landslides across classes.
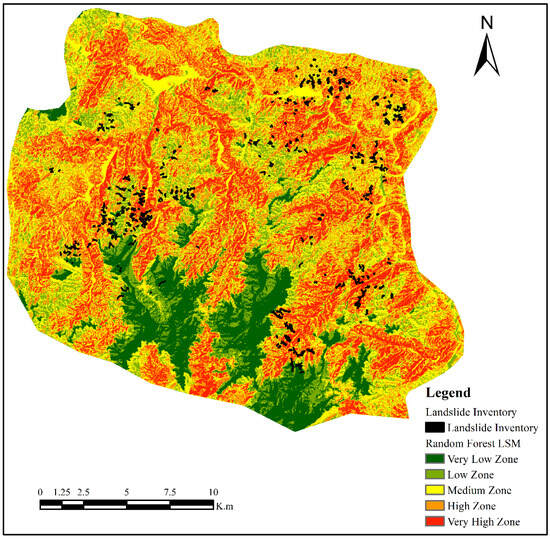
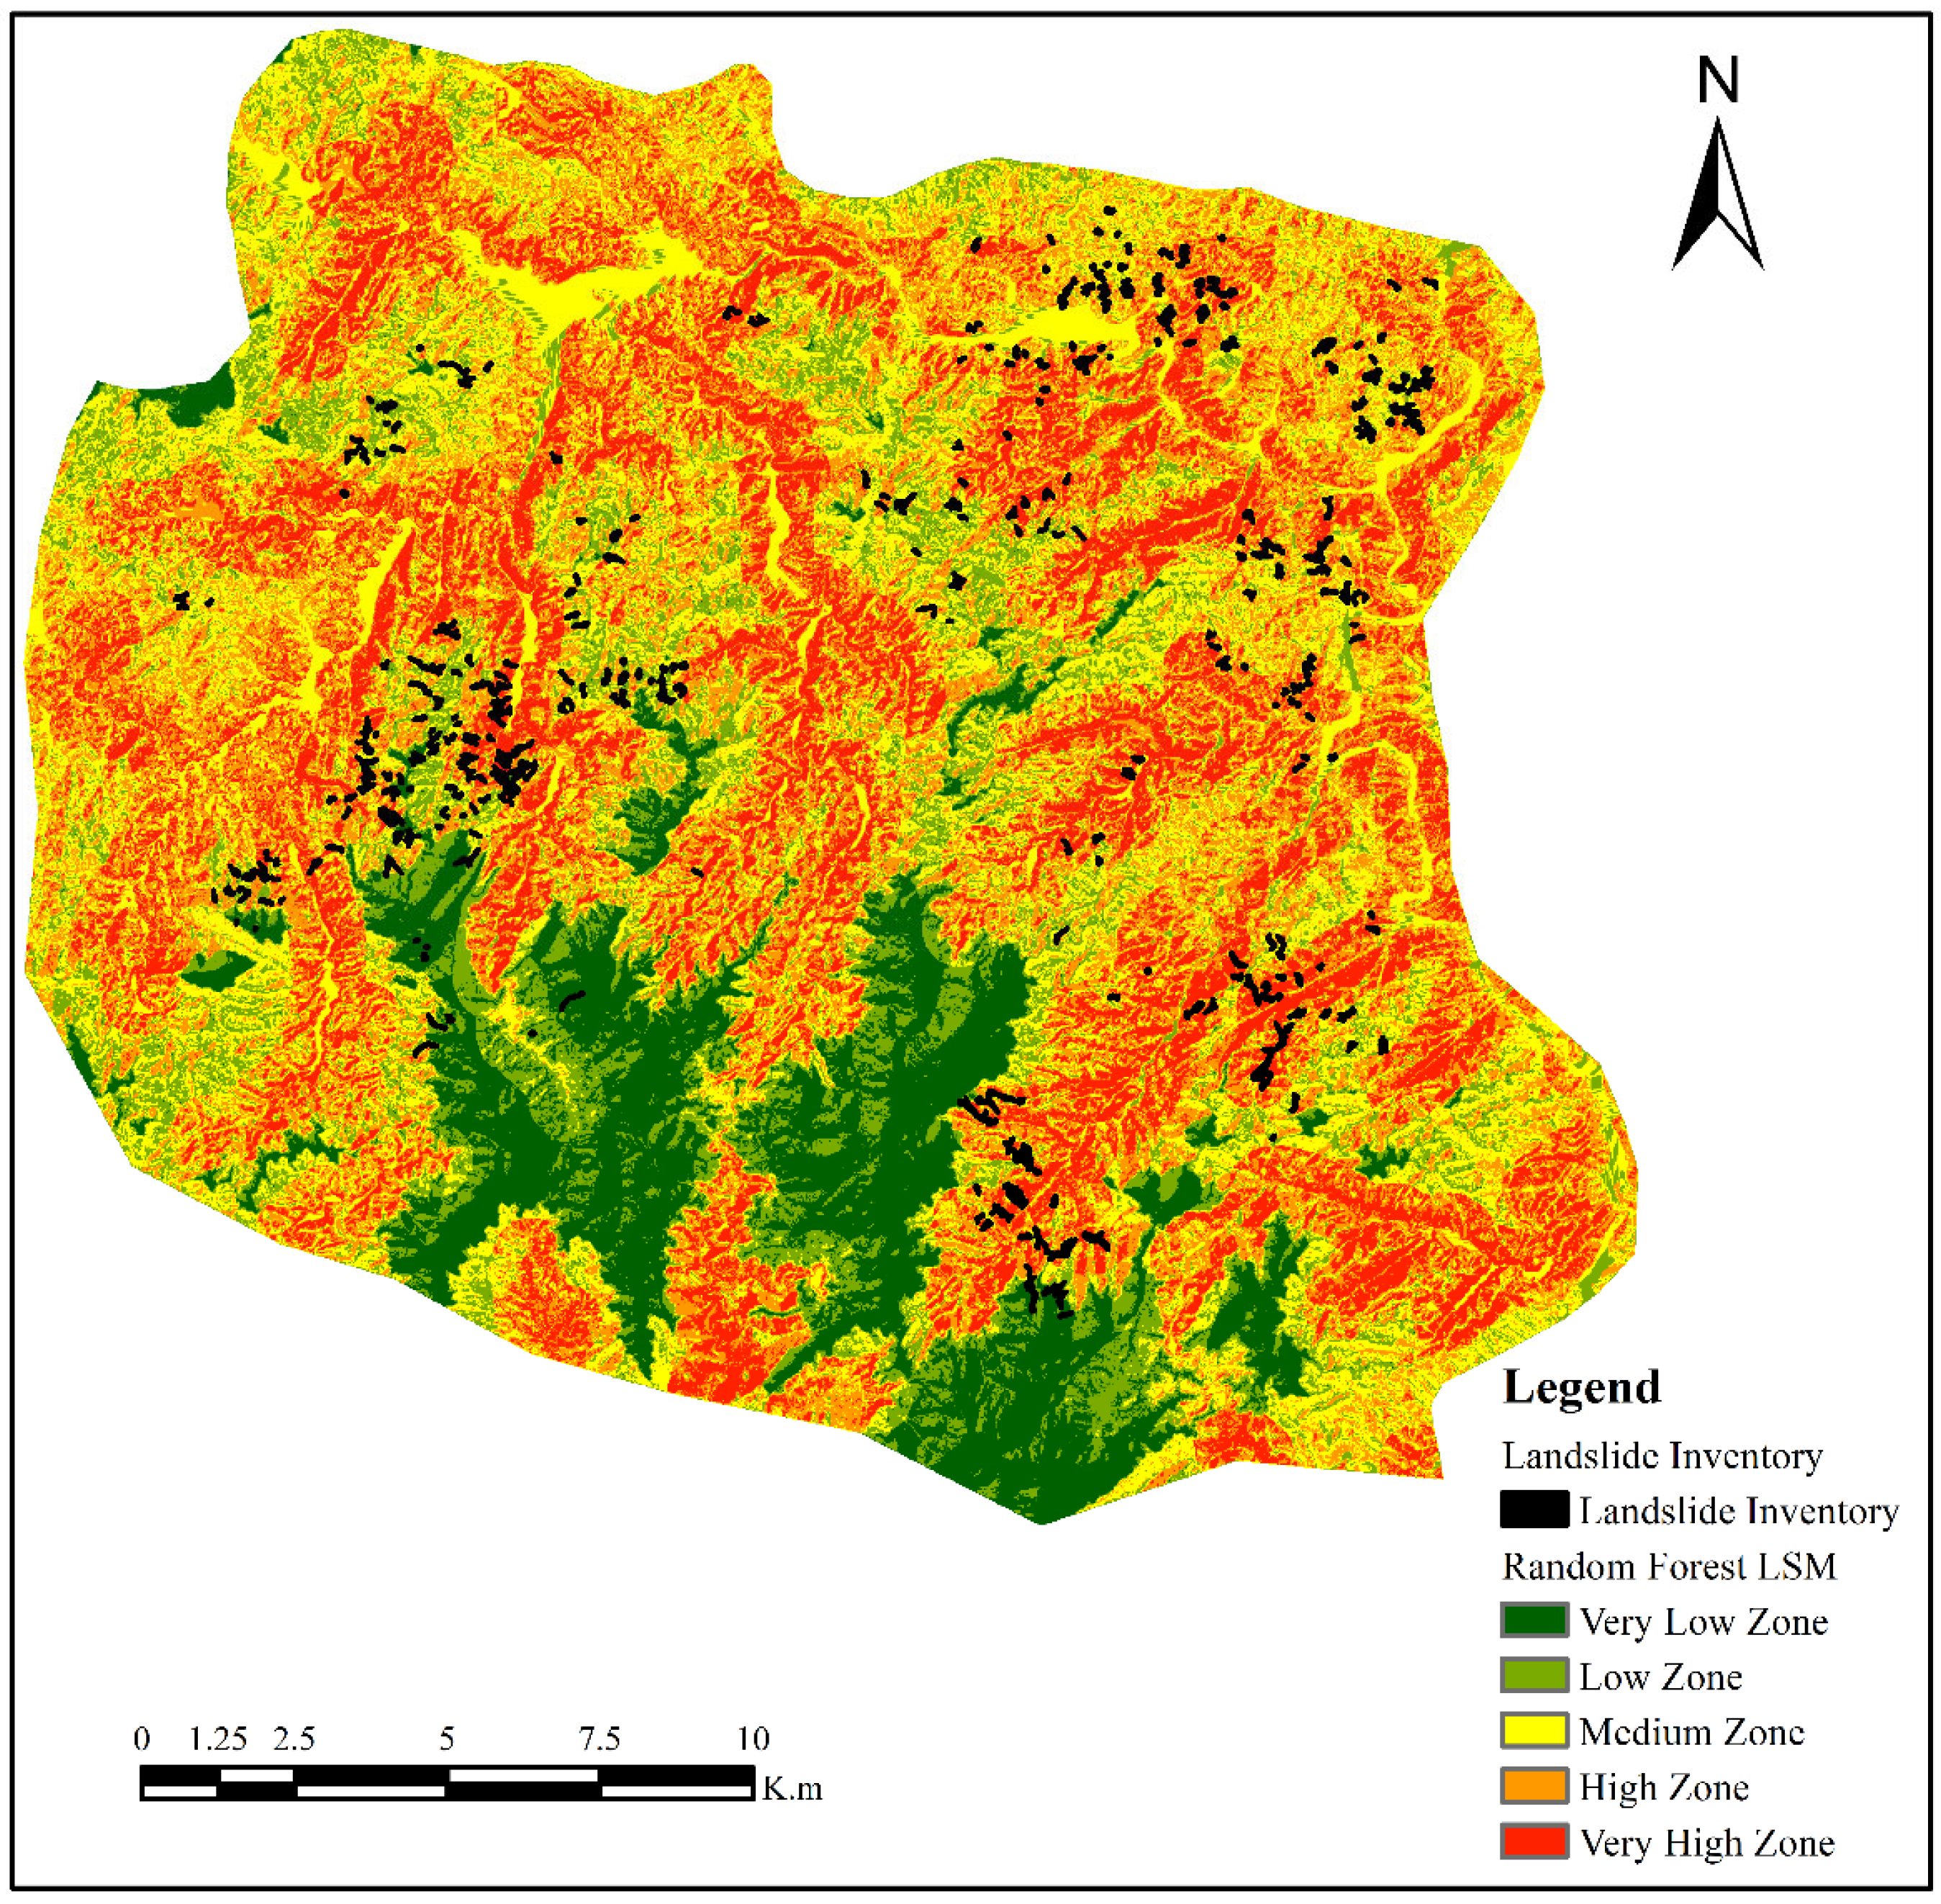
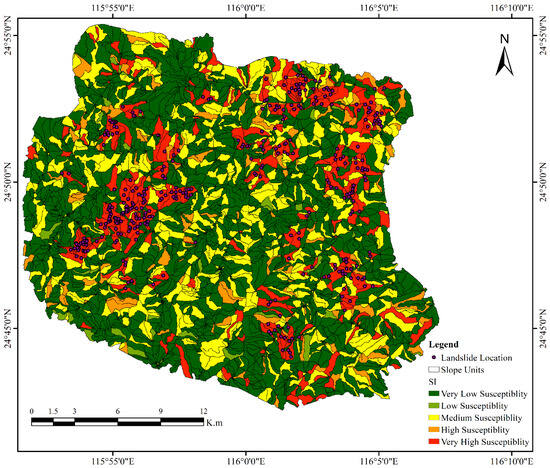
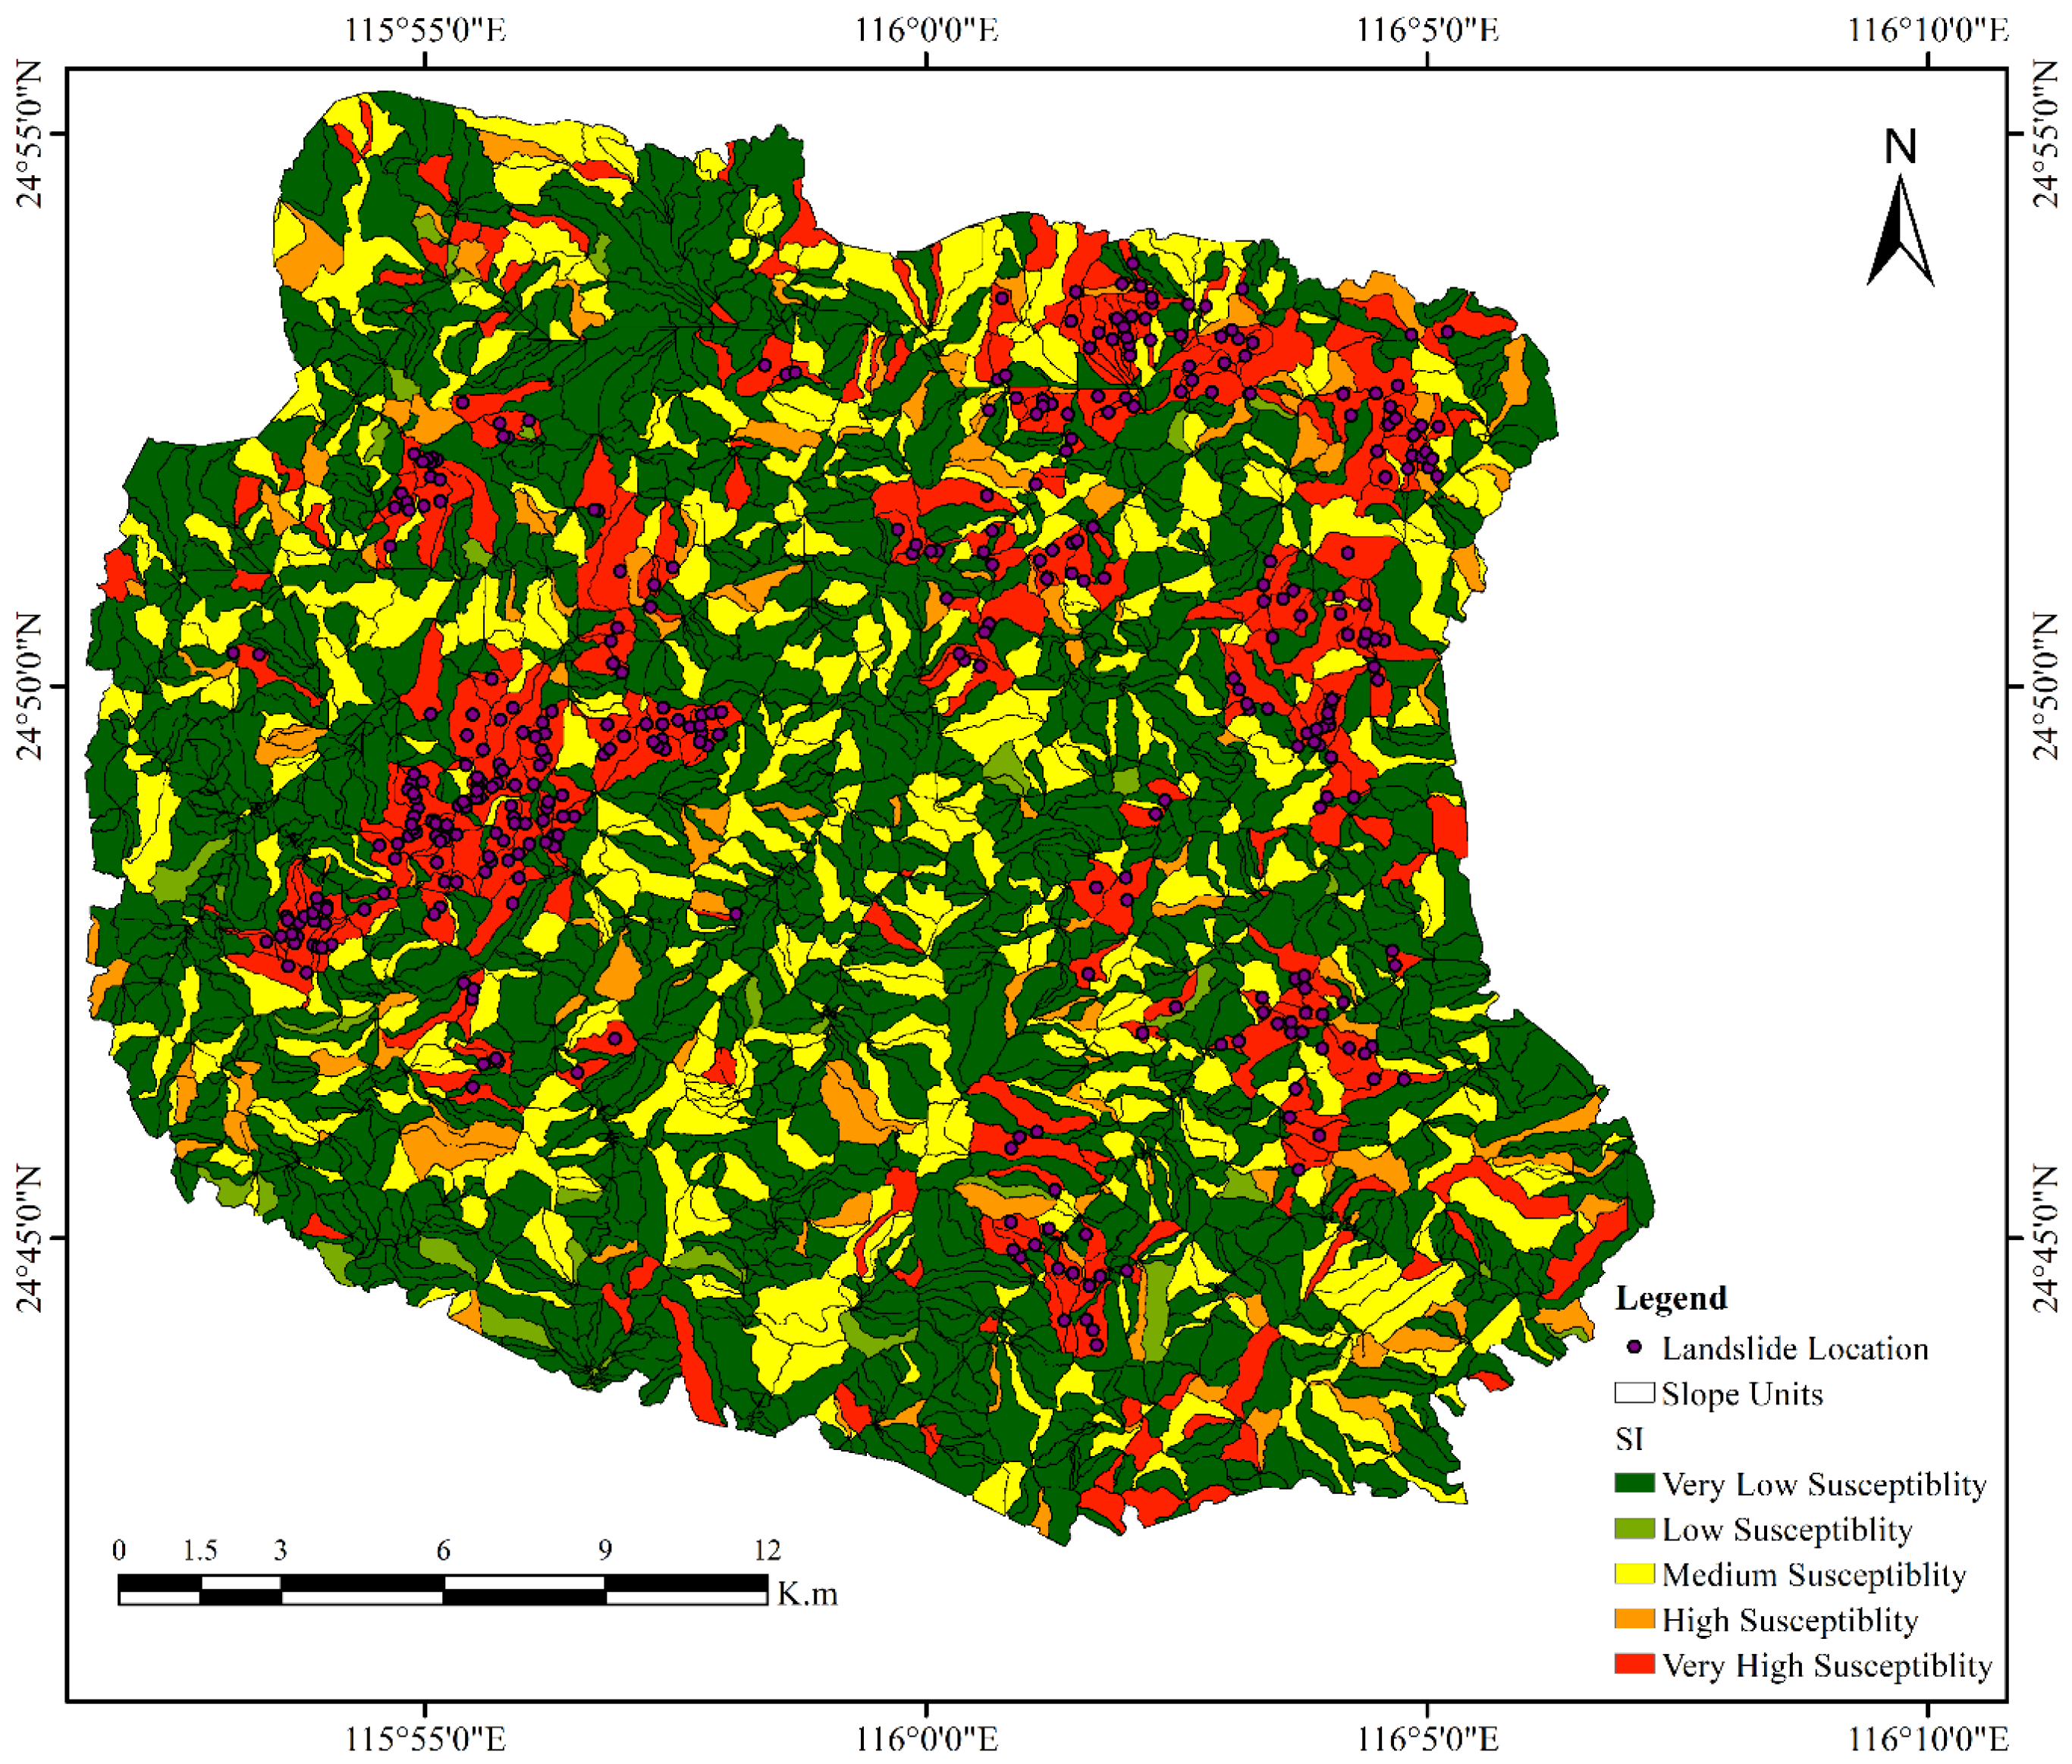
The 2024 inventory from Zhang et al. [13] provided a temporally separated set of landslide labels for evaluating the event-conditioned map (Figure 9). Very-high units covered 9.10% of the modeled area but contained 64.62% of the validation landslides, giving an area-normalized enrichment ratio of approximately 7.10. High and very-high units together contained 83.3% of the inventory within 21.10% of the area. These results support the model’s ability to rank slope units under the observed rainfall scenario. The slope-unit map also reduced isolated high-score pixels and provided clearer terrain-scale targets than the grid representation.
Figure 9.
Integrated slope-unit susceptibility map overlaid with the temporally separated June 2024 landslide inventory used for event-conditioned evaluation.
The map can support regional screening after extreme rainfall. High and very-high susceptibility units were spatially concentrated along valleys and steep hillslopes. Some of these units also coincided spatially with road-adjacent terrain, exposed surfaces, and areas of drainage convergence. Very low and low classes should not be interpreted as safe, but their lower event-landslide density makes them less urgent for first-stage screening. Detailed engineering investigation remains necessary for decisions concerning individual slopes, road cuts, and settlements.
4.3. Mapping-Unit Scale, Uncertainty, and Limitations
Mapping-unit choice is an important source of uncertainty. Grid-cell size affects model behavior and apparent spatial pattern, while slope-unit size controls the balance between geomorphic detail and regional generalization. Previous studies have shown sensitivity to mapping resolution and have emphasized the interpretability of drainage- and divide-bounded slope units [2,9,21]. Slope aspect was represented by the arithmetic mean of pixel-level aspect values within each slope unit. Since aspect is a circular variable, this approach may not fully represent slope units containing orientations near the 0°/360° boundary. The current study used one slope-unit configuration. Because alternative parameter settings were not tested, the robustness of the reported class distribution to delineation scale remains uncertain.
Sample selection is a further limitation. The calibration inventory contained only 28 landslides, restricting model complexity and increasing sensitivity to the selected pseudo-absence locations. Locations outside mapped landslides may still be susceptible or may contain unmapped failures. Alternative pseudo-absence and presence-only strategies have been proposed [22,23,24]. The 359 event landslides provide a useful external check on spatial concentration, but they do not remove uncertainty caused by the small calibration set. Moreover, validation labels were temporally separated while the rainfall predictor represented the same event. Potential controls such as lithology, road cutting, slope undercutting, and other anthropogenic disturbances were not included in the model and, therefore, their effects could not be evaluated. Future research should incorporate these variables to determine whether they improve model performance and provide a more complete representation of landslide susceptibility. The results therefore support event-conditioned ranking, not a fully independent probability forecast.
4.4. Practical Implications and Future Improvement
The integrated map converts model output into terrain units that can be linked to field operations. After extreme rainfall, authorities must prioritize road sections, villages, drainage corridors, and hillslopes for inspection. A pixel map may contain scattered high-score cells without indicating whether an entire slope warrants attention. In contrast, a high-class slope unit can serve as a coherent screening target. When cross-referenced with infrastructure and settlement data, high and very-high units can guide reconnaissance, drainage checks, crack surveys, and temporary traffic control.
The framework also illustrates how event rainfall can be linked to terrain susceptibility. In the current analysis, rainfall observations from the June 2024 event were included directly, so the output is an event-conditioned scenario map. Operational early warning would require a clearer separation between static terrain susceptibility and dynamic triggering information, followed by evaluation with rainfall data available before or during an event. Future work should also incorporate soil moisture, near-real-time observations, and additional storm inventories.
5. Conclusions
This study developed a two-stage grid-to-slope-unit framework for rainfall-conditioned landslide susceptibility mapping in Pingyuan County, Guangdong Province. A first RF model generated grid-scale scores from elevation, slope angle, slope aspect, NDVI, and event rainfall. These scores and the conditioning factors were summarized within slope units and entered a second RF model. The resulting event-driven LSM reflects the June 2024 rainfall conditions and requires updated rainfall data for long-term application. The workflow transferred grid-scale nonlinear information into geomorphically meaningful terrain units. The slope-unit baseline captured 76.4% of the validation landslides in its high and very-high classes; this value is a capture rate, not overall accuracy.
In the integrated map, high and very-high classes occupied 21.10% of the modeled area and contained 299 of 359 validation landslides, yielding a capture rate of 83.3%. The very-high class had a validation-landslide density of approximately 5.508 km−2, compared with 0.020 km−2 in the very low class. High-class units were visually associated with valleys, steep slopes, and some road-affected terrain, but factors not included in the model should not be interpreted causally. The small number of landslide-positive slope units (n = 28) may limit model generalizability; therefore, the susceptibility estimates should be interpreted cautiously despite the use of spatially blocked cross-validation. The main contribution is a more coherent terrain-unit representation with strong event-landslide concentration. The 10-fold cross-validation yielded an AUC of 0.73 ± 0.06 for the grid-based model and 0.81 ± 0.03 for the slope-unit-based model. Its use should remain limited to regional screening because the calibration inventory was small, the rainfall predictor came from the validation event, pseudo-absence sampling was uncertain, and slope-unit sensitivity was not tested.
Author Contributions
Conceptualization, W.Z.; methodology, M.Z.A.; software, J.L. and M.Z.A.; validation, J.N.; formal analysis, J.L.; investigation, W.Z.; data curation, J.N.; writing—original draft preparation, J.L. and M.Z.A.; writing—review and editing, W.C.; visualization, J.L. and M.Z.A.; supervision, W.C.; project administration, J.N. and W.Z.; funding acquisition, W.Z. All authors have read and agreed to the published version of the manuscript.
Funding
This research was funded by South China Field Scientific Observation and Research Station for Climate-Driven Landslide Risk, Ministry of Natural Resources.
Institutional Review Board Statement
Not applicable.
Informed Consent Statement
Not applicable.
Data Availability Statement
The ALOS-PALSAR and Sentinel-2 datasets are publicly available from their respective data repositories, while the processed data and landslide inventory data will be made available upon reasonable request.
Acknowledgments
We thank the developers and contributors of ArcGIS for offering a robust platform for spatial data processing and geographic analysis, which played a crucial role in our research.
Conflicts of Interest
The authors declare no conflicts of interest.
References
- Guzzetti, F.; Peruccacci, S.; Rossi, M.; Stark, C.P. Rainfall thresholds for the initiation of landslides in central and southern Europe. Meteorol. Atmos. Phys. 2007, 98, 239–267. [Google Scholar] [CrossRef] [Scilit]
- Reichenbach, P.; Rossi, M.; Malamud, B.D.; Mihir, M.; Guzzetti, F. A review of statistically-based landslide susceptibility models. Earth-Sci. Rev. 2018, 180, 60–91. [Google Scholar] [CrossRef] [Scilit]
- Shano, L.; Raghuvanshi, T.K.; Meten, M. Landslide susceptibility evaluation and hazard zonation techniques—A review. Geoenviron. Disasters 2020, 7, 18. [Google Scholar] [CrossRef] [Scilit]
- Feng, W.; Bai, H.; Lan, B.; Wu, Y.; Wu, Z.; Yan, L.; Ma, X. Spatial–temporal distribution and failure mechanism of group-occurring landslides in Mibei village, Longchuan County, Guangdong, China. Landslides 2022, 19, 1957–1970. [Google Scholar] [CrossRef] [Scilit]
- Zhou, C.; Cao, Y.; Yin, K.; Intrieri, E.; Catani, F.; Wu, L. Characteristic comparison of seepage-driven and buoyancy-driven landslides in Three Gorges Reservoir area, China. Eng. Geol. 2022, 301, 106590. [Google Scholar] [CrossRef] [Scilit]
- Di Napoli, M.; Carotenuto, F.; Cevasco, A.; Confuorto, P.; Di Martire, D.; Firpo, M.; Pepe, G.; Raso, E.; Calcaterra, D. Machine learning ensemble modelling as a tool to improve landslide susceptibility mapping reliability. Landslides 2020, 17, 1897–1914. [Google Scholar] [CrossRef] [Scilit]
- Merghadi, A.; Yunus, A.P.; Dou, J.; Whiteley, J.; ThaiPham, B.; Bui, D.T.; Avtar, R.; Abderrahmane, B. Machine learning methods for landslide susceptibility studies: A comparative overview of algorithm performance. Earth-Sci. Rev. 2020, 207, 103225. [Google Scholar] [CrossRef] [Scilit]
- Carrara, A.; Cardinali, M.; Guzzetti, F.; Reichenbach, P. GIS technology in mapping landslide hazard. In Geographical Information Systems in Assessing Natural Hazards; Carrara, A., Guzzetti, F., Eds.; Springer: Dordrecht, The Netherlands, 1995. [Google Scholar] [CrossRef] [Scilit]
- Alvioli, M.; Marchesini, I.; Reichenbach, P.; Rossi, M.; Ardizzone, F.; Fiorucci, F.; Guzzetti, F. Automatic delineation of geomorphological slope units with r.slopeunits v1.0 and their optimization for landslide susceptibility modeling. Geosci. Model Dev. 2016, 9, 3975–3991. [Google Scholar] [CrossRef] [Scilit]
- Schlögel, R.; Marchesini, I.; Alvioli, M.; Reichenbach, P.; Rossi, M.; Malet, J.-P. Optimizing landslide susceptibility zonation: Effects of DEM spatial resolution and slope unit delineation on logistic regression models. Geomorphology 2018, 301, 10–20. [Google Scholar] [CrossRef] [Scilit]
- Tanyas, H.; Rossi, M.; Alvioli, M.; van Westen, C.J.; Marchesini, I. A global slope unit-based method for the near real-time prediction of earthquake-induced landslides. Geomorphology 2019, 327, 126–146. [Google Scholar] [CrossRef] [Scilit]
- Deng, H.; Wu, X.; Zhang, W.; Liu, Y.; Li, W.; Li, X.; Zhou, P.; Zhuo, W. Slope-unit scale landslide susceptibility mapping based on the Random Forest model in deep valley areas. Remote Sens. 2022, 14, 4245. [Google Scholar] [CrossRef] [Scilit]
- Zhang, W.; Ali, M.Z.; Cui, W.; Sun, C.; Zheng, Z.; Chen, K. Severe rainfall-induced landslides in Pingyuan County, Guangdong, China, in June 2024. Landslides 2025, 22, 2623–2639. [Google Scholar] [CrossRef] [Scilit]
- Tang, Y.; Feng, F.; Guo, Z.; Feng, W.; Li, Z.; Wang, J.; Sun, Q.; Ma, H.; Li, Y. Integrating principal component analysis with statistically-based models for analysis of causal factors and landslide susceptibility mapping: A comparative study from the Loess Plateau area in Shanxi (China). J. Clean. Prod. 2020, 277, 124159. [Google Scholar] [CrossRef] [Scilit]
- Ali, M.Z.; Chu, H.-J.; Chen, Y.-C.; Ullah, S. Machine learning in earthquake- and typhoon-triggered landslide susceptibility mapping and critical factor identification. Environ. Earth Sci. 2021, 80, 233. [Google Scholar] [CrossRef] [Scilit]
- Chang, Z.; Catani, F.; Huang, F.; Liu, G.; Meena, S.R.; Huang, J.; Zhou, C. Landslide susceptibility prediction using slope unit-based machine learning models considering the heterogeneity of conditioning factors. J. Rock Mech. Geotech. Eng. 2023, 15, 1127–1143. [Google Scholar] [CrossRef] [Scilit]
- Zhang, W.; He, Y.; Wang, L.; Liu, S.; Meng, X. Landslide susceptibility mapping using Random Forest and extreme gradient boosting: A case study of Fengjie, Chongqing. Geol. J. 2023, 58, 2372–2387. [Google Scholar] [CrossRef] [Scilit]
- Lee, J.-J.; Song, M.-S.; Yun, H.-S.; Yum, S.-G. Dynamic landslide susceptibility analysis that combines rainfall period, accumulated rainfall, and geospatial information. Sci. Rep. 2022, 12, 18429. [Google Scholar] [CrossRef] [Scilit]
- Ke, C.; He, S.; Qin, Y. Comparison of natural breaks method and frequency ratio dividing attribute intervals for landslide susceptibility mapping. Bull. Eng. Geol. Environ. 2023, 82, 384. [Google Scholar] [CrossRef] [Scilit]
- Zhuo, L.; Huang, Y.; Zheng, J.; Cao, J.; Guo, D. Landslide susceptibility mapping in Guangdong Province, China, using Random Forest model and considering sample type and balance. Sustainability 2023, 15, 9024. [Google Scholar] [CrossRef] [Scilit]
- Cama, M.; Conoscenti, C.; Lombardo, L.; Rotigliano, E. Exploring relationships between grid cell size and accuracy for debris-flow susceptibility models: A test in the Giampilieri catchment (Sicily, Italy). Environ. Earth Sci. 2016, 75, 238. [Google Scholar] [CrossRef] [Scilit]
- Xiao, C.; Tian, Y.; Shi, W.; Guo, Q.; Wu, L. A new method of pseudo absence data generation in landslide susceptibility mapping with a case study of Shenzhen. Sci. China Technol. Sci. 2010, 53, 75–84. [Google Scholar] [CrossRef] [Scilit]
- Huang, F.; Yin, K.; Huang, J.; Gui, L.; Wang, P. Landslide susceptibility mapping based on self-organizing-map network and extreme learning machine. Eng. Geol. 2017, 223, 11–22. [Google Scholar] [CrossRef] [Scilit]
- Zhu, A.-X.; Miao, Y.; Yang, L.; Bai, S.; Liu, J.; Hong, H. Comparison of the presence-only method and presence–absence method in landslide susceptibility mapping. CATENA 2018, 171, 222–233. [Google Scholar] [CrossRef] [Scilit]

Disclaimer/Publisher’s Note: The statements, opinions and data contained in all publications are solely those of the individual author(s) and contributor(s) and not of MDPI and/or the editor(s). MDPI and/or the editor(s) disclaim responsibility for any injury to people or property resulting from any ideas, methods, instructions or products referred to in the content. |
© 2026 by the authors. Licensee MDPI, Basel, Switzerland. This article is an open access article distributed under the terms and conditions of the Creative Commons Attribution (CC BY) license.