4.1. Rainfall Erosivity (R)
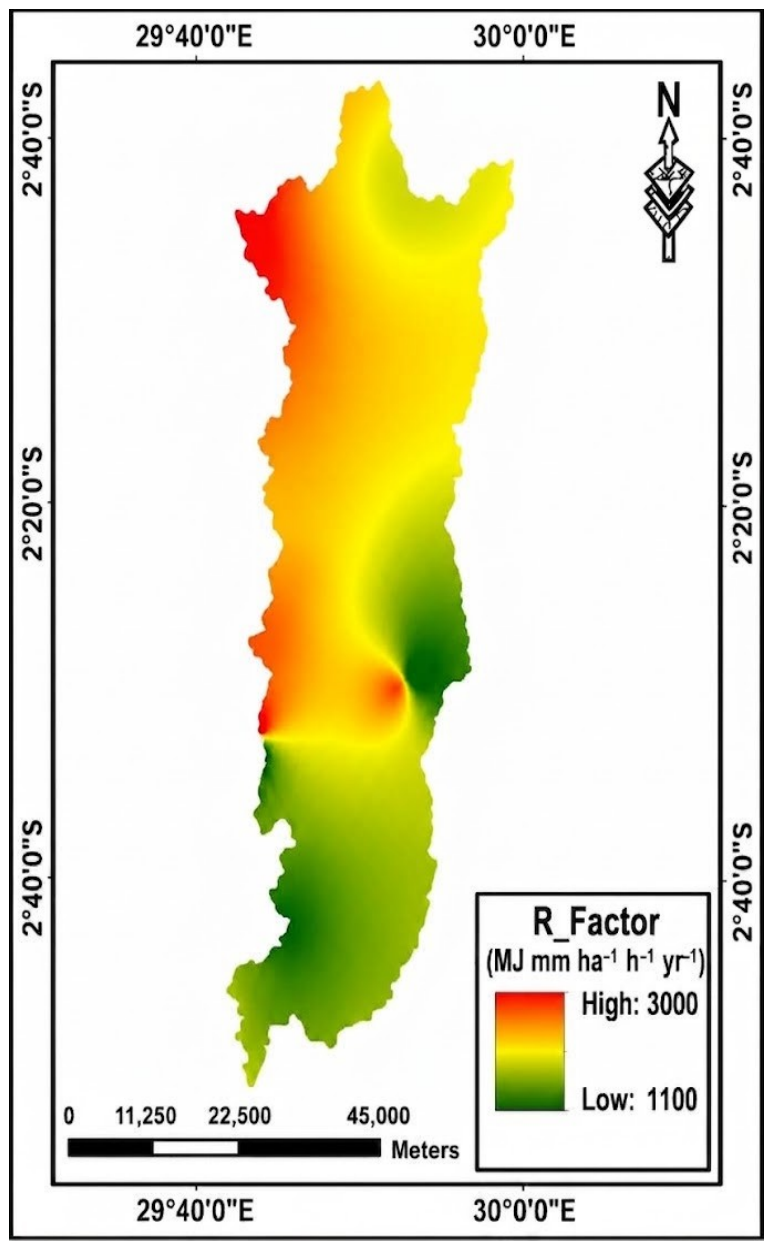
The observed variation reflects spatial differences in rainfall intensity and distribution across the catchment, which is consistent with patterns in tropical highland environments. Based on the rainfall erosivity of Akanyaru Sub-catchment (R = 1100–2400 MJ mm ha
−1 h
−1 yr
−1), the Akanyaru Sub-catchment falls within the medium to high erosivity class, typical of humid climates [
36].
The higher R-factor values suggest a considerable risk of soil erosion, particularly in cultivated and steep slope areas, where intense rainfall can accelerate rill and gully formation. These findings are consistent with previous studies. Similar ranges have been reported in tropical highland regions, including studies by [
13,
37] in Ethiopia, and [
38] in Nigeria.
In Rwanda, the results align with findings by [
39], who reported rainfall erosivity values ranging from 1000 to 3000 MJ mm ha
−1 h
−1 yr
−1, influenced by altitude and rainfall patterns. Additionally, ref. [
40] observed that Rwanda’s mid-altitude zones experience bimodal rainfall erosivity linked to short and long rainy seasons, with values between 1000 and 2500 MJ mm ha
−1 h
−1 yr
−1.
Overall, the classification of the Akanyaru Sub-catchment within the medium to high erosivity range highlights the importance of incorporating rainfall Erosivity into RUSLE-based soil erosion modeling and implementing climate-resilient watershed management strategies to support sustainable land use under current and future climate variability.
4.2. Soil Erodibility (K)
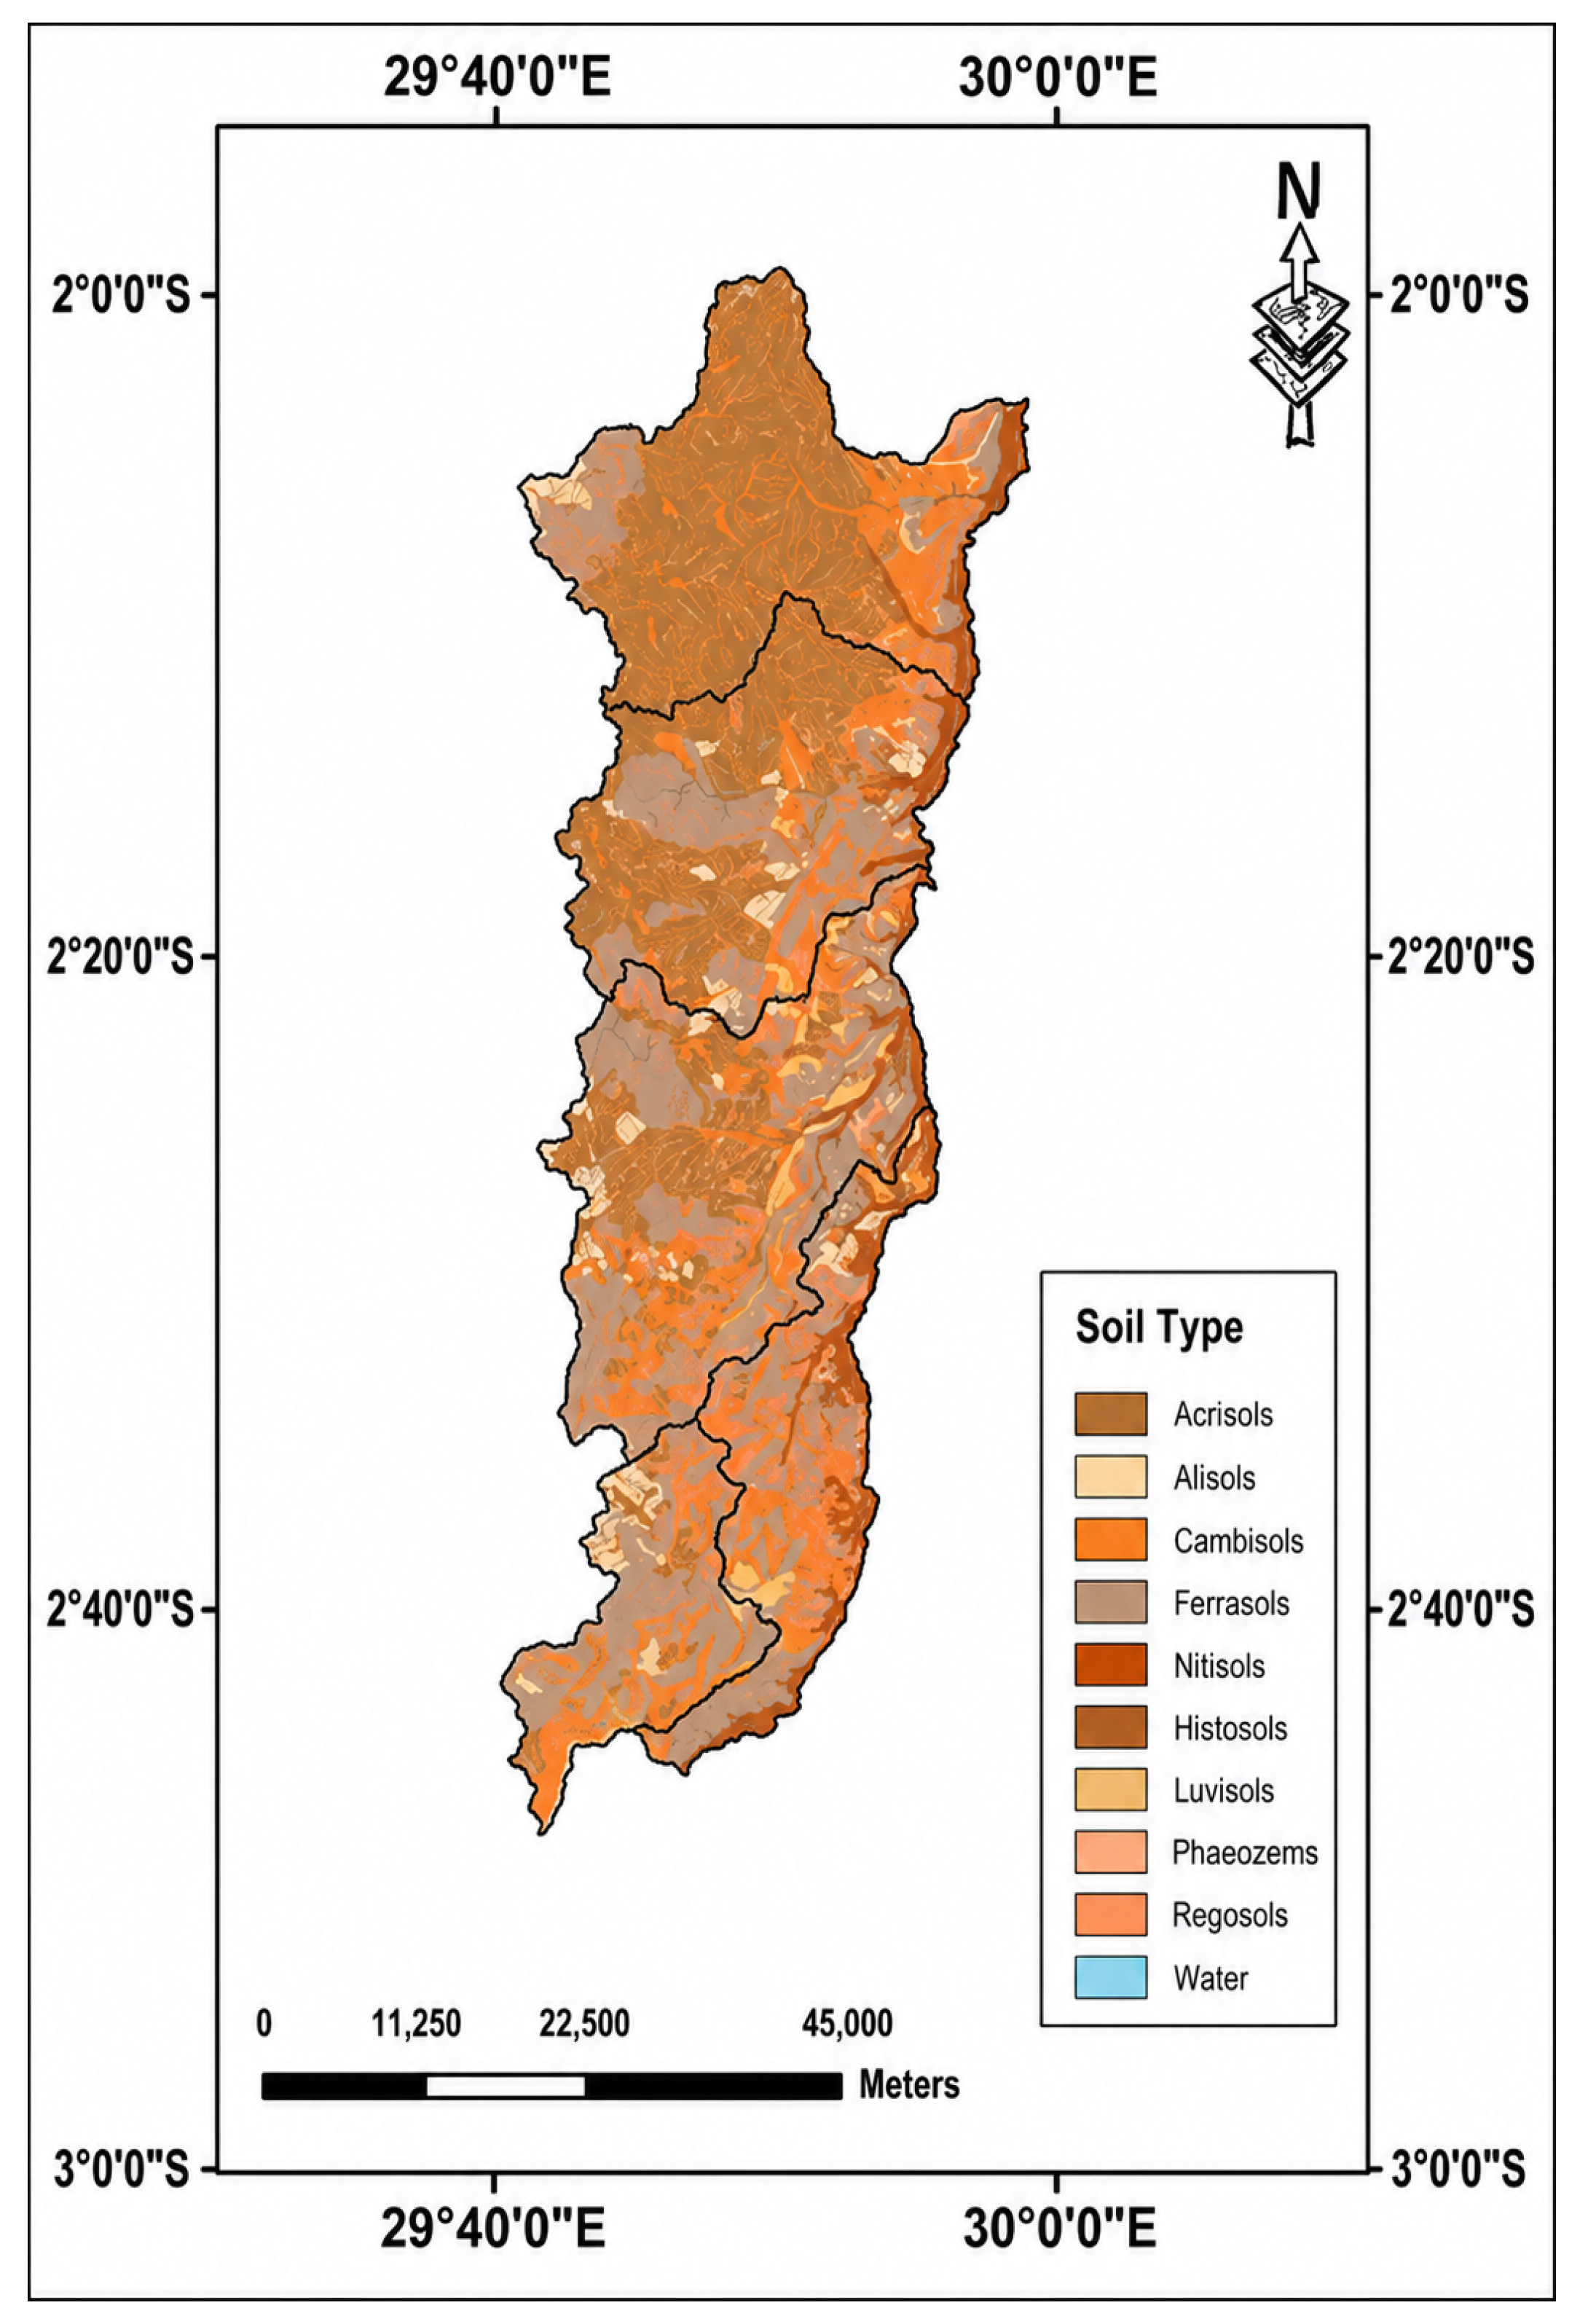
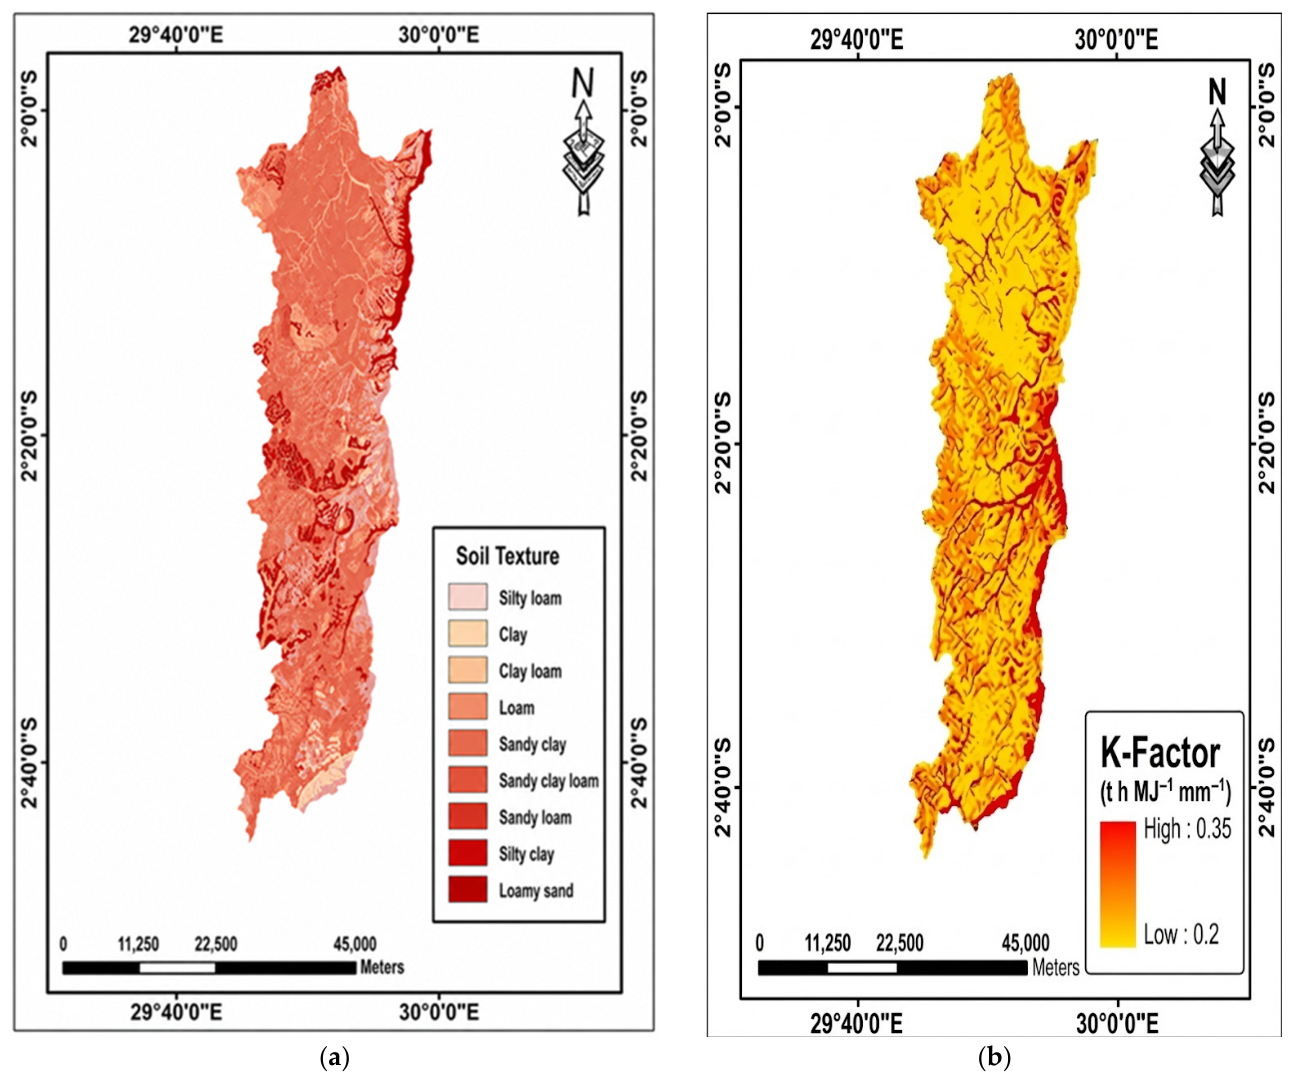
The observed variability in soil erodibility reflects differences in soil texture, structure, organic matter content, and permeability. Soils with higher silt content and lower organic matter are more prone to detachment and transport by rainfall and runoff, resulting in higher K-values [
10,
13]. Land use also plays an important role. Upland cultivated areas tend to have higher K-values due to frequent tillage, reduced organic matter, and exposure to raindrop impact, whereas forested and lowland areas show lower erodibility because of better soil structure and higher organic content [
41,
42].
The spatial heterogeneity observed in the Akanyaru Sub-catchment highlights the need for site-specific soil conservation strategies. The range of K-values found in this study is consistent with findings from other regions. Globally, K-values range from about 0.05 in clay soils to over 0.40 in silt loams [
13]. In Europe, values between 0.15 and 0.40 have been reported [
43], and in Africa, studies in Ethiopia show similar ranges (0.20–0.38). In Rwanda, previous studies also align with these findings, including [
5], which reported values between 0 and 0.24, and [
44], which found values between 0.25 and 0.40 in the Sebeya watershed.
Overall, the Akanyaru Sub-catchment falls within the typical erodibility range of humid tropical regions, where strong weathering and organic matter depletion influence soil erosion processes.
4.3. Slope Length and Slope Steepness (LS)
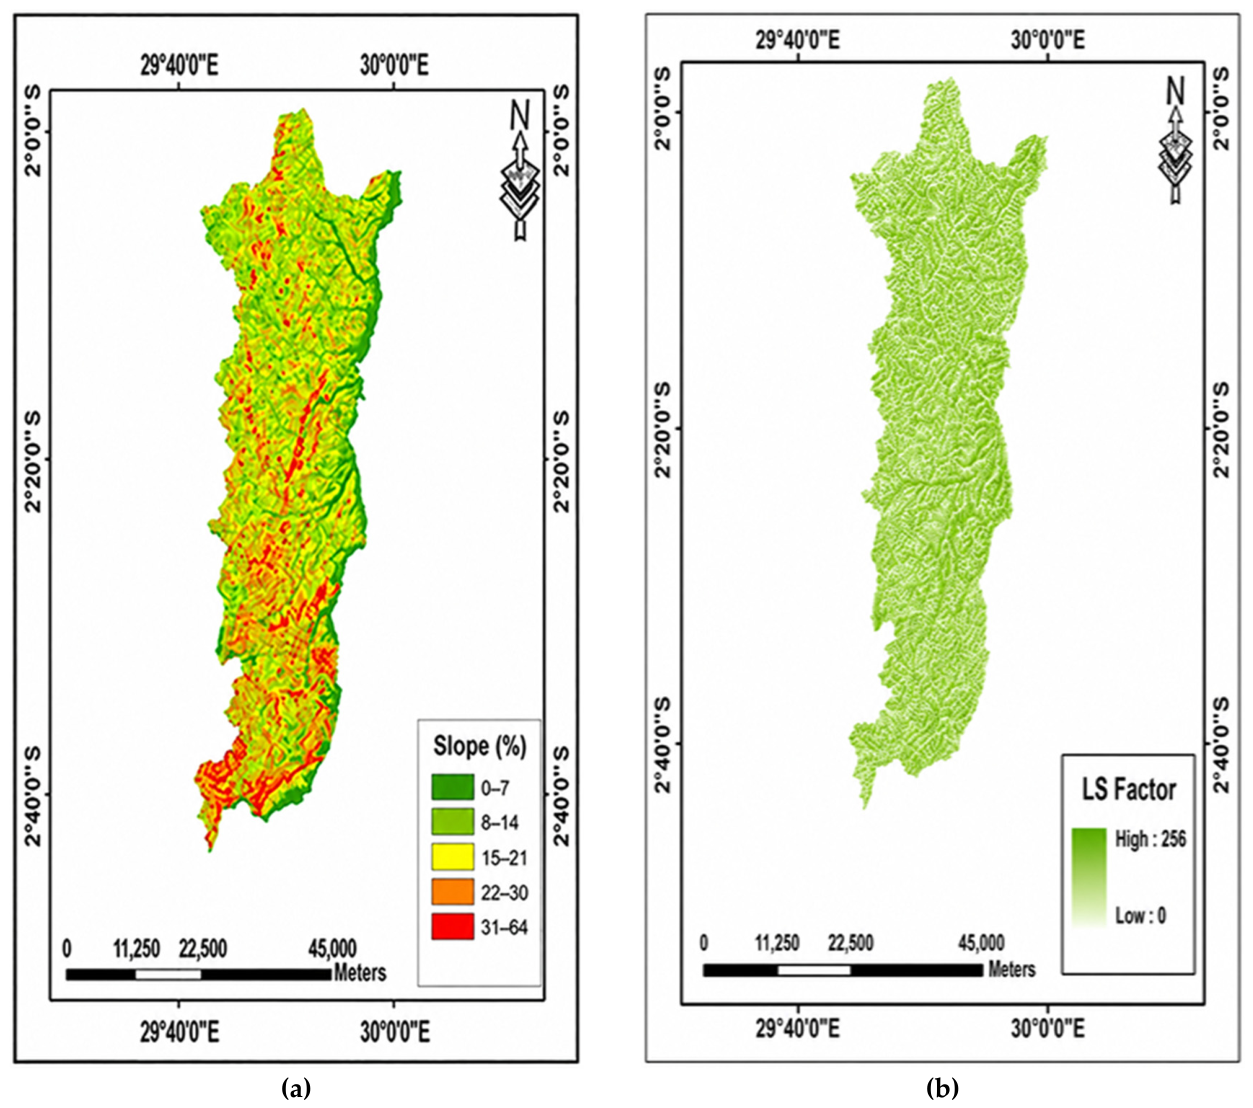
The variation in LS values shows that topography plays a significant role in soil erosion. In many parts of the catchment, the combined effect of slope length and steepness is limited, resulting in lower erosion risk. However, in areas with steep and long slopes, runoff velocity increases, leading to higher soil detachment and transport. These findings are consistent with other studies in Rwanda and the region. Ref. [
5] reported LS values ranging from 0 to 322 at the national level, especially in western Rwanda. Similarly, ref. [
44] found LS values between 0 and 470 in the Sebeya watershed, where steep slopes contributed to high erosion rates. In Ethiopia, ref. [
45] reported even higher LS values (up to 3726), confirming that topography is a major driver of soil erosion in East Africa.
The LS range observed in the Akanyaru Sub-catchment falls within that of humid tropical highlands, where steep slopes accelerate surface runoff and increase erosion risk. This suggests that steep and cultivated upland areas are particularly vulnerable. Therefore, appropriate soil and water conservation measures such as terracing, contour farming, and vegetative barriers are necessary to reduce slope length, slow runoff, and minimize soil loss, especially in high-risk zones.
4.4. Cover Management (C)
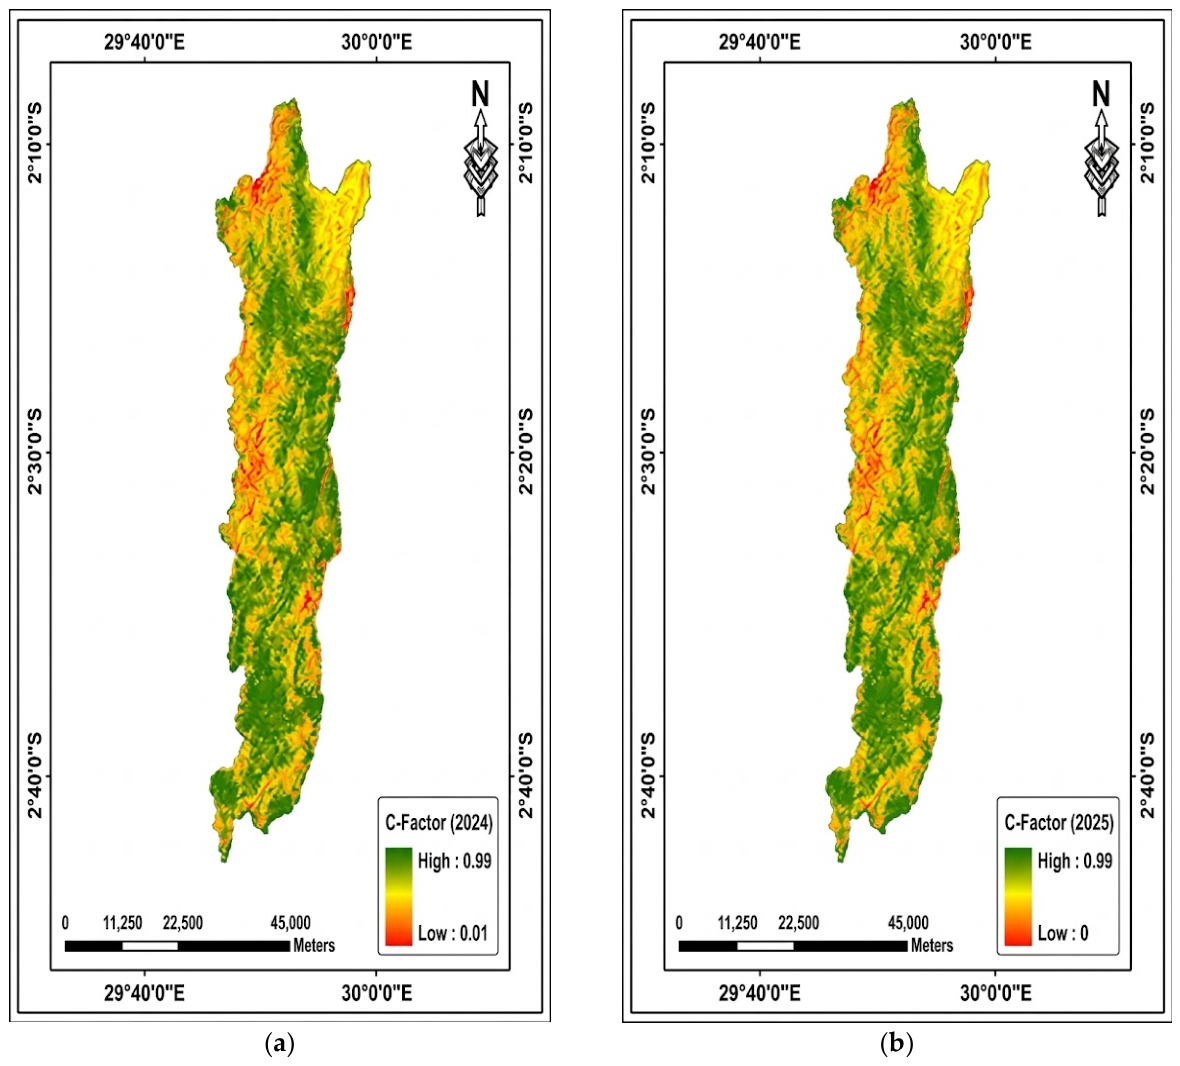
The C-factor values in the Akanyaru Sub-catchment ranged from 0.01 to 0.99 in 2024 and 0 to 0.99 in 2025. The lower minimum value observed in 2025 indicates improved vegetation cover and greater soil protection compared to 2024. However, the maximum value remained unchanged at 0.99, suggesting that areas with sparse vegetation cover or bare soil continued to exist and remained highly susceptible to soil erosion. Overall, the decrease in the minimum C-factor value reflects a slight improvement in land cover conditions and a potential reduction in soil loss within well-protected areas.
The wide range of C-factor values demonstrates the significant influence of vegetation cover and land management on soil erosion processes. Areas characterized by low C-factor values are associated with dense vegetation cover, forests, grasslands, or well-managed agricultural systems that effectively reduce raindrop impact, surface runoff, and soil detachment. In contrast, areas with high C-factor values represent cultivated lands, degraded landscapes, or exposed soils where limited ground cover increases vulnerability to erosion.
This finding is consistent with previous studies. Ref. [
46] reported significant variation in C-factor values in Rwanda, with values approaching 1 in poorly covered areas. Similarly, ref. [
47] emphasized that the C-factor (ranging from 0 to 1) is strongly linked to land use and land cover, and its variability can lead to large differences in soil erosion estimates. Ref. [
5] also found C-values ranging from 0.003 to 0.63 in Rwanda, showing that better vegetation cover reduces erosion risk.
The results indicate that poorly managed croplands and bare soils remain the most erosion-prone areas within the Akanyaru Sub-catchment, whereas areas with dense vegetation provide greater protection against soil loss. Therefore, strengthening sustainable land management practices such as agroforestry, mulching, cover cropping, and conservation agriculture is essential for enhancing vegetation cover and reducing soil erosion across the catchment. The observed reduction in the minimum C-factor value from 2024 to 2025 further suggests that improved land cover conditions can contribute to better soil conservation and watershed sustainability.
4.5. Conservation Practices (P)
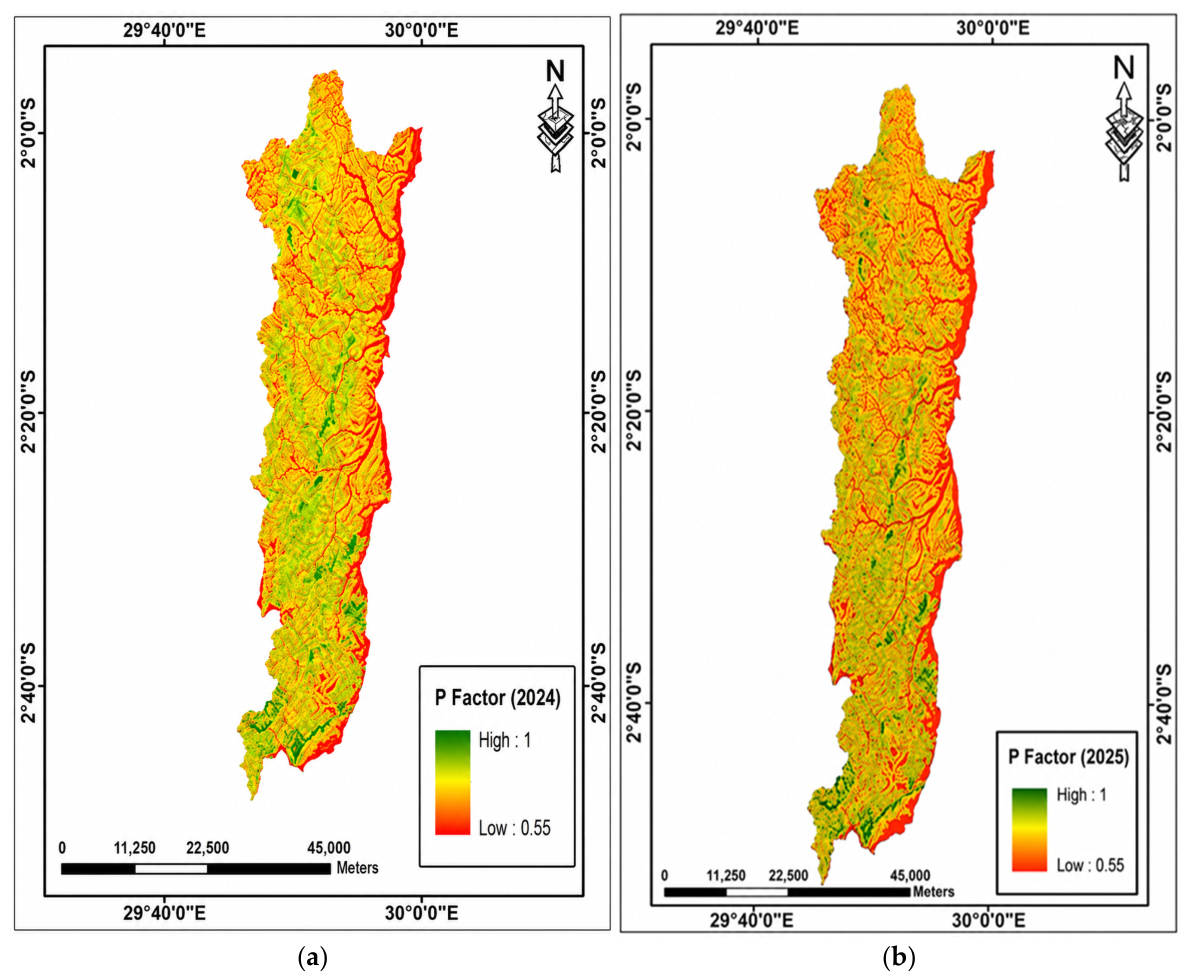
The variation in p-values reflects uneven implementation of soil conservation practices across the catchment. Areas with lower values demonstrate the effectiveness of practices like terracing and contour farming in reducing soil erosion, whereas higher values indicate zones where soils are more vulnerable due to lack of such measures.
These findings are consistent with previous studies in Rwanda and similar regions [
17]; reported higher
p-values in steep croplands of the Satinskyi Catchment located in Ngororero District, Western Province, Rwanda due to weak or absent conservation practices, while lower values were associated with areas where structural interventions were implemented. Similarly, ref. [
48] found that poor maintenance or absence of conservation measures in Rulindo led to increased erosion risk.
Other studies also support this pattern. Ref. [
49] reported
p-values ranging from 0.55 to 1.0, where higher values correspond to greater erosion vulnerability. Ref. [
50] similarly found that lower
p-values are linked to effective practices such as contour farming, reduced tillage, and cover cropping, which help reduce soil loss.
Overall, these results highlight that conservation practices are not uniformly applied, and scaling up effective soil and water conservation measures is essential to reduce erosion and sustain agricultural productivity.
4.6. Predicted Soil Loss Under Different Land-Use–Land-Cover Types from RUSLE in Akanyaru Sub-Catchment
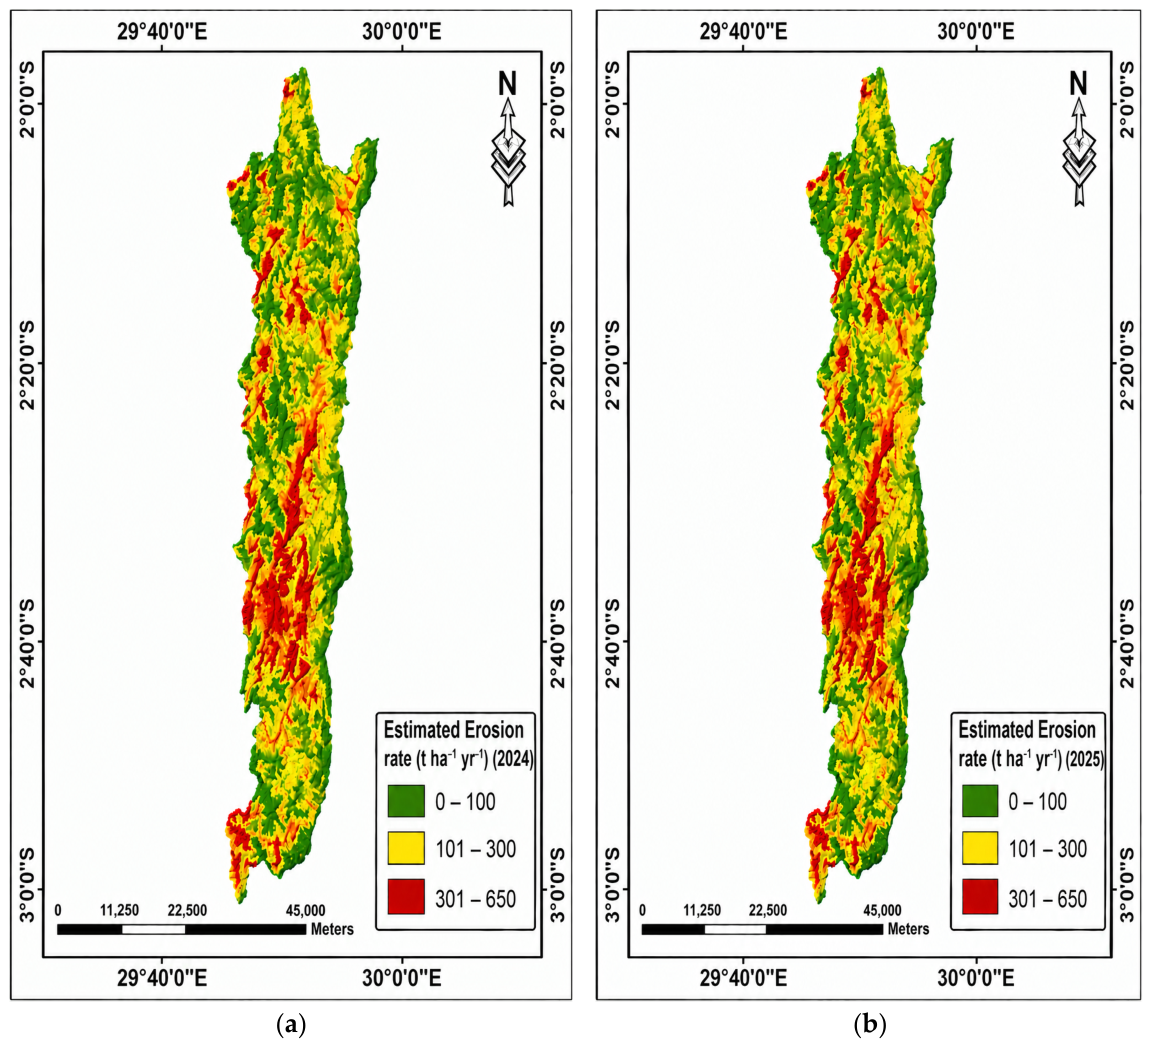
The predicted soil loss in the Akanyaru Sub-catchment ranged from 0 to 650 t ha
−1 yr
−1 in both 2024 and 2025. Based on the RUSLE model, soil loss was classified into three categories: low (0–100 t ha
−1 yr
−1), moderate (101–300 t ha
−1 yr
−1), and high (301–650 t ha
−1 yr
−1), with spatial patterns reflecting the combined effects of vegetation cover, topography, and land management practices. Areas experiencing low soil loss were mainly associated with forests and grasslands. Moderate soil loss was predominantly observed in cultivated areas on gentle to moderately steep slopes. The highest soil loss values were concentrated in steep croplands, degraded hillslopes, and areas near drainage channels, particularly within a prominent central longitudinal band extending through the catchment and clusters at the northern and southern extremes. The observed spatial variability in soil loss in 2024 and 2025 is influenced by key factors such as rainfall intensity, soil properties, slope characteristics, and land management practices [
51,
52,
53]. Areas with steep slopes, poor vegetation cover, and inadequate land management are particularly vulnerable to high erosion rates.
These findings are consistent with previous studies in Rwanda and beyond. For example, ref. [
54] reported that about 15% of Rwanda’s land experiences extreme erosion (>300 t ha
−1 yr
−1) contributing disproportionately to national soil loss. Similarly, ref. [
44] observed extreme erosion exceeding 1000 t ha
−1 yr
−1 in the Sebeya watershed, while ref. [
55] identified hotspots above 900 t ha
−1 yr
−1 in the upper Nyabarongo catchment.
Globally, studies such as [
10,
56] show that although average soil loss may be relatively low, localized hotspots on steep or bare land can exceed 500 t ha
−1 yr
−1, similar to the high values observed in Akanyaru. In Europe, refs. [
53,
57] also reported very high erosion rates in mountainous and intensively cultivated regions, driven by steep slopes, poor vegetation cover, and intense rainfall.
Overall, these comparisons indicate that the Akanyaru Sub-catchment follows patterns typical of mountainous and intensively cultivated landscapes, where erosion risk is highly uneven. The spatial distribution of soil loss identified distinct erosion hotspots, particularly in steep cultivated areas, while lower erosion rates were associated with forests and grasslands that provide effective soil protection. These spatial patterns offer valuable information for environmental planning by enabling decision-makers to identify priority areas for soil conservation and watershed management. The generated soil loss maps can support the implementation of targeted interventions, including terracing, contour farming, agroforestry, vegetation restoration, and improved land management, in areas most susceptible to erosion. Furthermore, the comparison of the 2024 and 2025 soil loss maps provides a basis for monitoring the effectiveness of conservation measures and land-use changes over time. Overall, these findings demonstrate that the spatial assessment of soil erosion can guide efficient allocation of conservation resources, reduce land degradation, and support sustainable agriculture and watershed management in the Akanyaru Sub-catchment.
4.7. Changes in Soil Erosion Across the Catchment Between 2024 and 2025
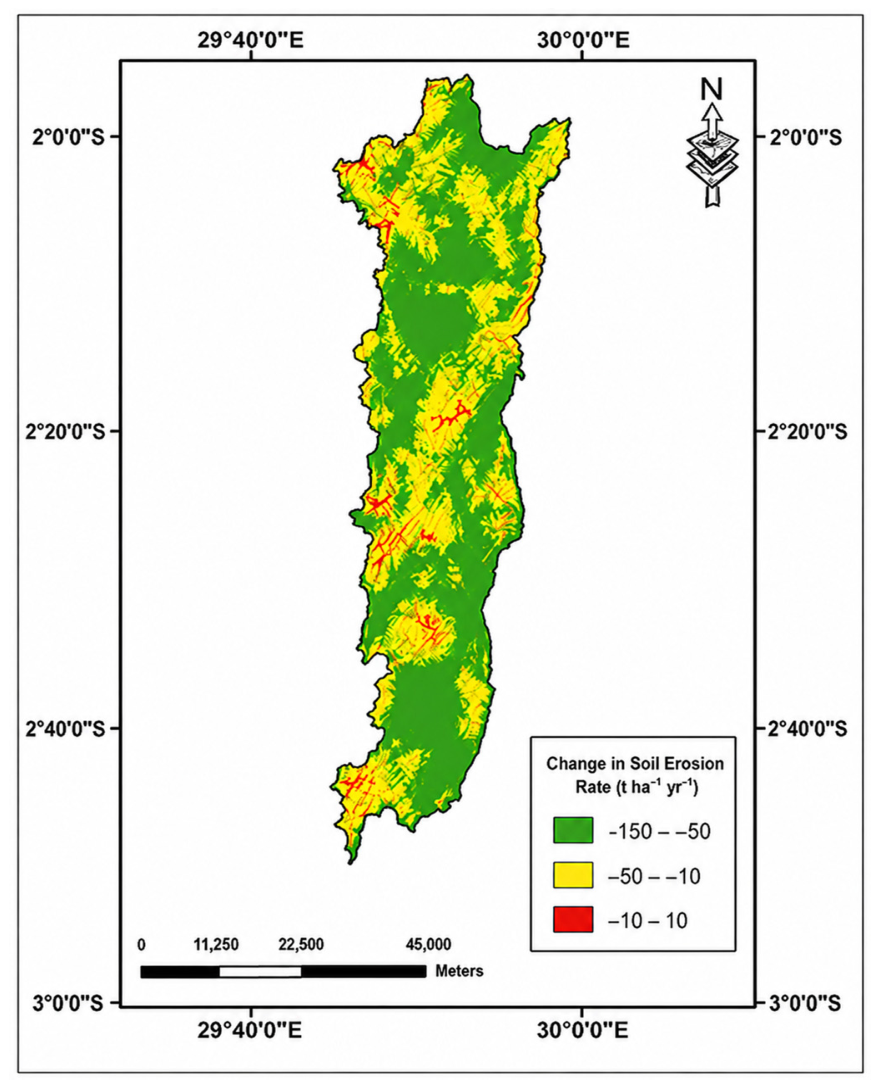
Soil erosion between 2024 and 2025 indicates a measurable improvement in catchment conditions and demonstrates the positive influence of changes in land management and land cover on soil conservation. The mean and median soil erosion rates decreased by 5.21 and 18.7 t ha
−1 yr
−1, respectively, while the total annual soil loss declined by 812,654 t (11.45%). These reductions suggest that the catchment became less susceptible to soil detachment and transport during the study period, reflecting improved protection of the soil surface against rainfall impact and surface runoff. Similar reductions in soil erosion have been associated with improvements in vegetation cover and the implementation of conservation practices in several watershed studies [
10,
57].
The spatial distribution of erosion changes further supports this finding. Most of the catchment was classified within the negative change categories (−150 to −50 and −50 to −10 t ha
−1 yr
−1), indicating that reductions in soil erosion were widespread rather than localized. In contrast, only 6.4% of the catchment experienced negligible change (−10 to 10 t ha
−1 yr
−1), confirming that the improvement occurred across a large proportion of the watershed. This spatially extensive decline suggests that the reduction in erosion resulted from catchment-scale changes rather than isolated site-specific interventions. Similar spatial patterns have been reported in East African watersheds, where land use changes and conservation measures produced substantial reductions in soil loss over extensive areas [
57,
58].
Increased vegetation cover, expansion of forested and grassland areas, improved crop management practices, and the implementation of soil and water conservation measures such as contour farming, terraces, and agroforestry can substantially reduce runoff velocity and enhance rainfall interception. These processes increase infiltration, strengthen soil structure through root development, and reduce the erosive energy of overland flow, thereby lowering sediment detachment and transport [
10,
17].
The results are consistent with studies conducted in Rwanda and other tropical highlands, where improved land management has significantly reduced soil erosion despite persistent steep slopes and high rainfall erosivity [
57,
59]. Therefore, the observed decline in annual soil loss likely reflects the cumulative effects of improved land cover conditions and the adoption of soil and water conservation practices throughout the catchment. Such interventions are essential to further reduce sediment production, improve agricultural sustainability, and minimize downstream impacts on water quality and reservoir sedimentation [
1,
51].
Overall, the reduction in both the magnitude and spatial extent of soil erosion demonstrates progress toward sustainable watershed management. Nevertheless, areas that continue to exhibit relatively high erosion rates should remain priorities for targeted conservation interventions, including afforestation, terracing, contour cultivation, and other integrated soil and water conservation measures.
4.9. Statistical Analysis Results
The mixed-effects model results (
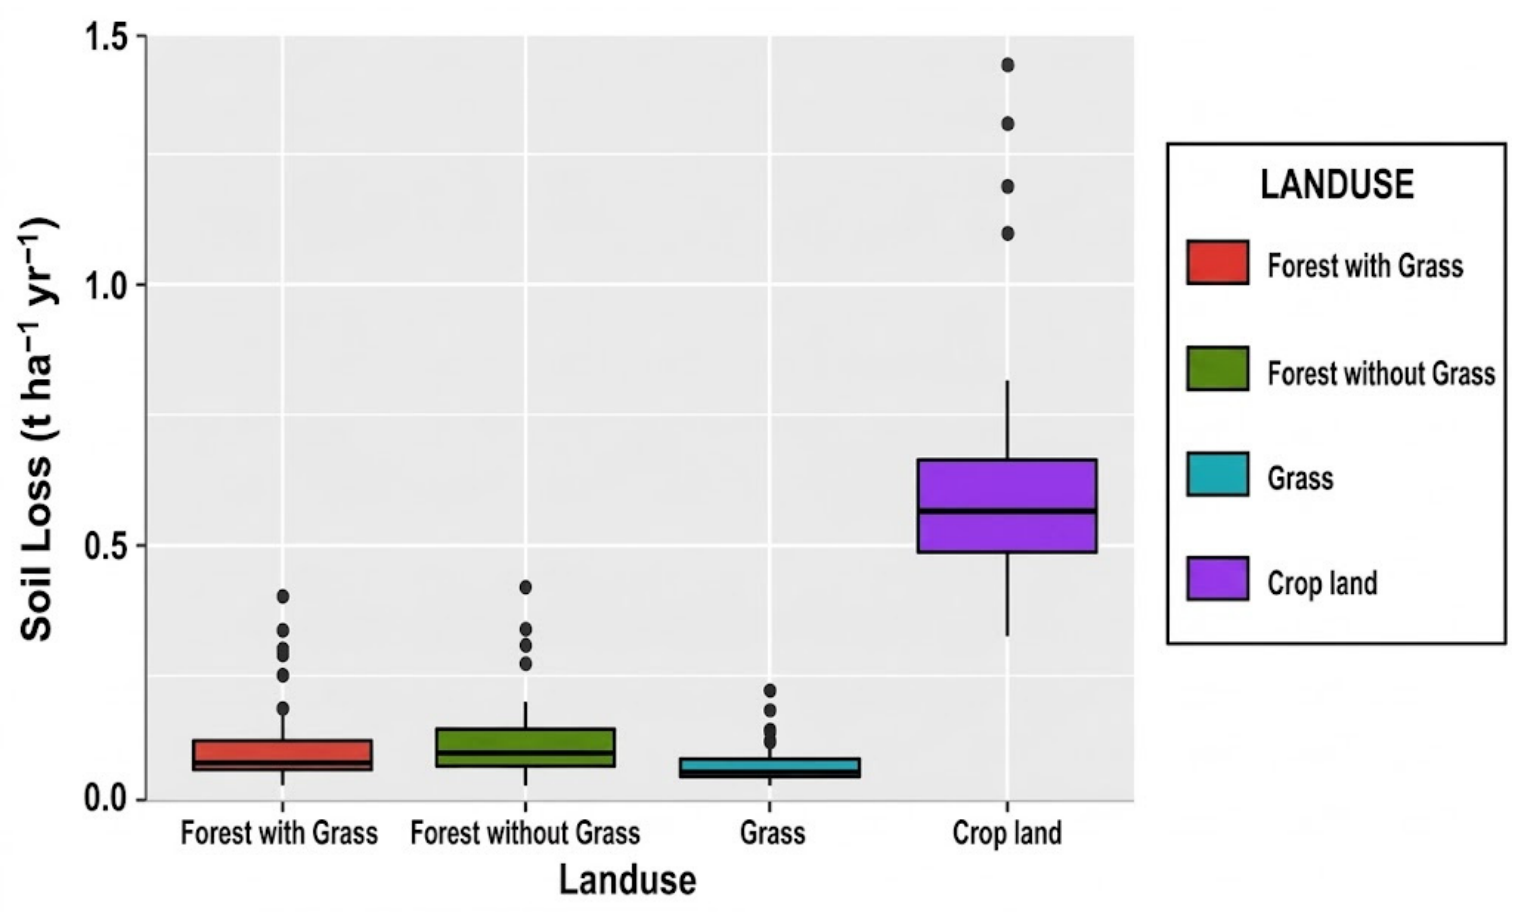
Table 15) demonstrate that land use and rainfall-related factors were the dominant controls of soil loss variability in the Akanyaru Sub-catchment, whereas soil physical properties such as bulk density, organic matter, and clay content showed limited influence during the study period. The significant effect of land use (F = 6.169,
p < 0.001) highlights the important role of vegetation cover and management practices in regulating erosion processes. Cropland areas, particularly maize fields, exhibited higher soil loss because of frequent tillage, limited surface residue during some crop growth stages, and reduced protection against raindrop impact and runoff generation.
Rainfall intensity was also a significant predictor of soil loss (F = 3.125, p < 0.001), confirming the strong relationship between erosive rainfall events and sediment detachment. The negative coefficient estimate suggests that variations in rainfall intensity contributed to changes in erosion response among land-use systems. High-intensity rainfall events increase raindrop kinetic energy, surface sealing, runoff generation, and transport capacity, thereby accelerating soil detachment and sediment movement. This finding agrees with previous erosion studies indicating that rainfall intensity, particularly short-duration high-intensity storms, is often more influential than total rainfall amount in determining erosion rates.
Precipitation amount also showed a significant influence on soil loss (F = 3.587, p < 0.001), with an estimated effect of 1.29. Although rainfall quantity alone does not directly determine erosion magnitude, greater seasonal rainfall generally increases cumulative runoff production and the frequency of erosive events. The combined effects of rainfall amount and intensity explain why erosion rates vary considerably between seasons, especially in tropical highland environments such as Rwanda where intense convective rainfall events are common.
Slope showed a relatively weaker but marginal effect on soil loss (F = 0.067, p = 0.079). The positive estimate (6.98) indicates that increasing slope steepness tends to increase erosion, although the relationship was not statistically significant at the 5% level. This may be attributed to the fact that slope effects were partly controlled by land use distribution; steep areas in the catchment were often associated with forests or grass-covered areas that reduced runoff and soil detachment. Therefore, slope alone was insufficient to explain soil loss variation without considering vegetation cover and rainfall conditions.
Soil properties including bulk density (p = 0.929), organic matter (p = 0.917), and clay content (p = 0.976) did not significantly affect observed soil loss variability. Although these properties influence soil erodibility by controlling infiltration capacity, aggregate stability, and resistance to detachment, their effect may have been reduced by the strong influence of land management and rainfall characteristics. In addition, the relatively small variation in soil properties within the study area may have limited their statistical contribution. Similar findings have been reported in tropical agricultural catchments where erosion dynamics are frequently controlled more strongly by vegetation cover and rainfall erosivity than by individual soil characteristics.
The Tukey HSD pairwise comparisons (
Table 16) further clarify the influence of land-use type on soil loss patterns. Significant differences were observed only between maize cropland and the other land-use categories. Soil loss in maize fields was significantly higher than in forest with grass (difference = −43.52 t ha
−1 yr
−1,
p < 0.001), forest without grass (difference = −43.00 t ha
−1 yr
−1,
p < 0.001), and grassland (difference = −49.00 t ha
−1 yr
−1,
p < 0.001). These results confirm that maize cultivation represents the most erosion-prone land use system in the catchment. The higher erosion rates observed in maize fields are likely associated with intensive cultivation practices, exposed soil surfaces after land preparation, and reduced vegetation cover during early crop development stages.
In contrast, no significant differences were detected among forest with grass, forest without grass, and grassland (p > 0.05). The difference between forest with grass and forest without grass was very small (0.52 t ha−1 yr−1) and statistically insignificant (p = 1.00), suggesting that both forest systems provide comparable soil protection. Similarly, forest and grassland areas showed similar erosion responses, indicating that continuous vegetation cover effectively reduces runoff velocity, enhances infiltration, and minimizes soil detachment. These findings demonstrate the importance of maintaining permanent vegetation cover as a key soil conservation strategy.
Overall, the statistical analysis confirms that land-use management and rainfall characteristics are the primary drivers of soil loss in the Akanyaru Sub-catchment. The significantly higher erosion rates observed under maize cultivation emphasize the need for improved agricultural conservation practices, including mulching, minimum tillage, contour farming, and maintenance of crop residue. Meanwhile, the similarity between forest and grassland areas highlights the protective role of permanent vegetation cover in reducing erosion risk. These results support watershed management interventions focused on sustainable land-use planning and climate-resilient agricultural practices to reduce soil degradation in Rwanda’s highland catchments.
Uncertainty and Model Limitations
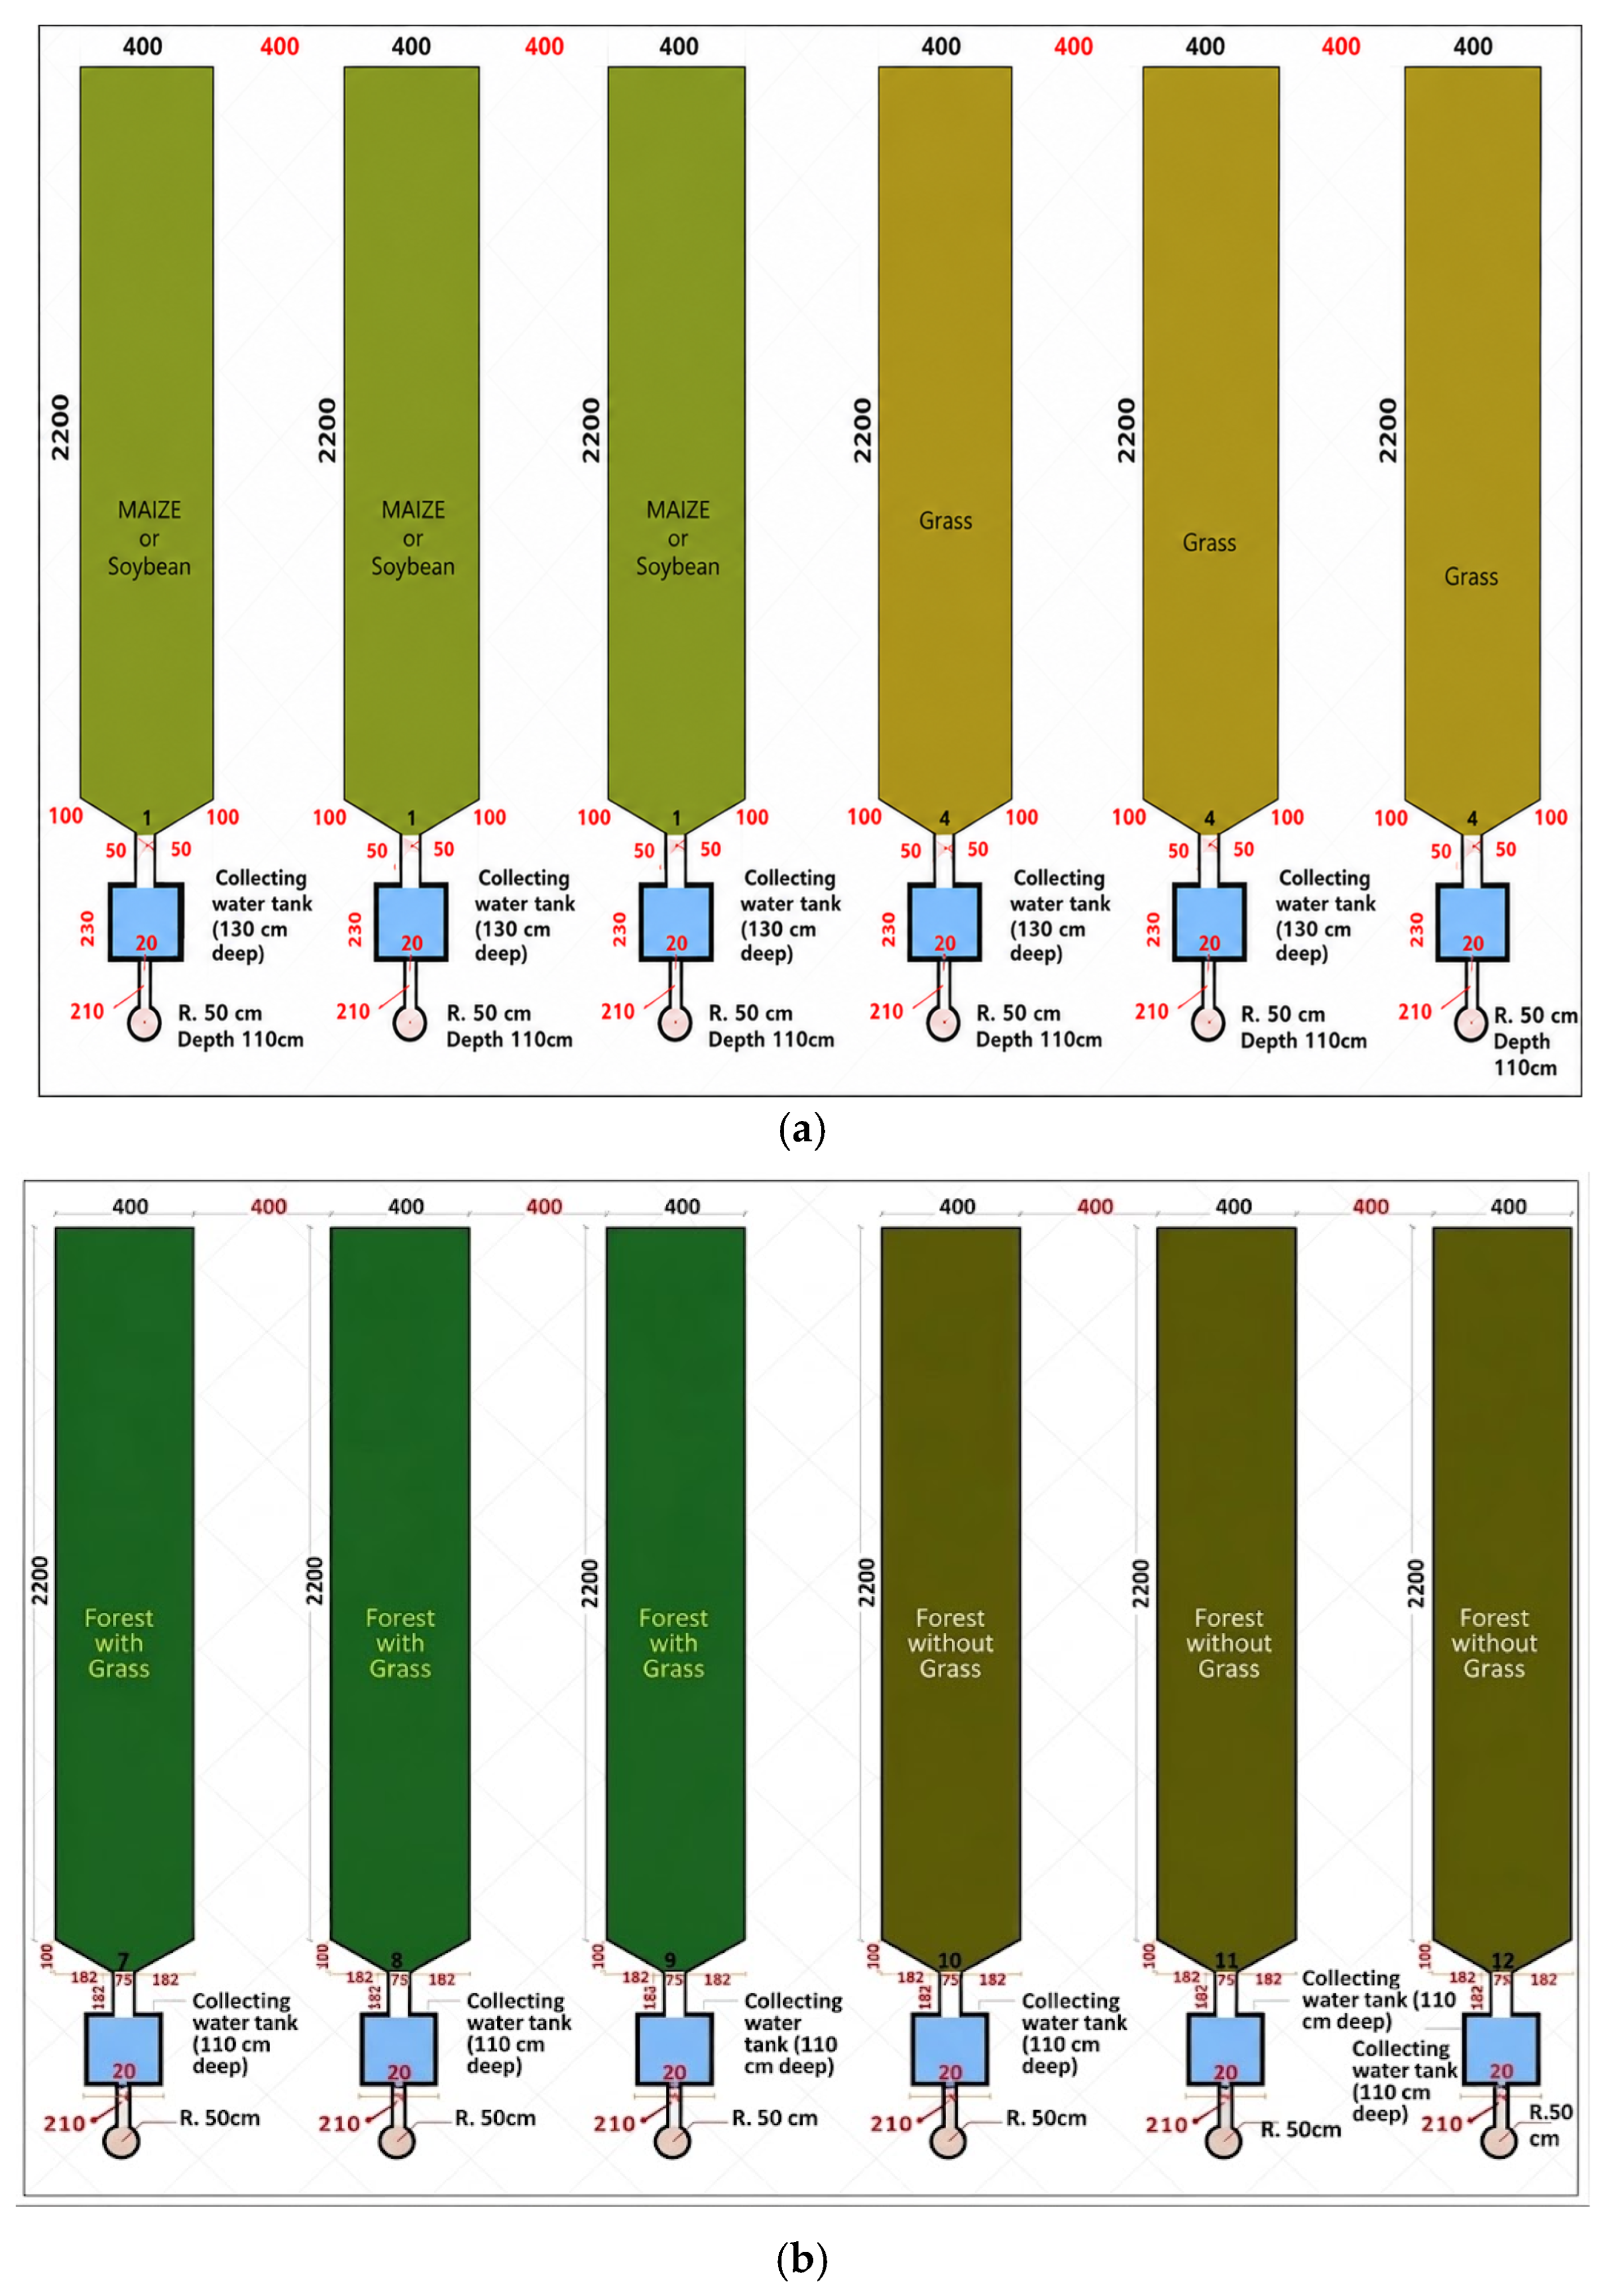
The soil loss estimates presented in this study are subject to uncertainties associated with the RUSLE model inputs. Uncertainty may arise from the estimation of the rainfall erosivity (R), soil erodibility (K), topographic (LS), cover management (C), and support practice (P) factors, as well as from the spatial resolution of the input datasets. During the calculation of LS, a Digital Elevation Model (DEM) of 30 m resolution was accessed as secondary data and may be prone to errors. The small errors in the elevation model, slope gradient, or flow accumulation may have propagated into substantial differences in predicted soil loss. Similarly, the C and P factors were assigned based on land-use classes and conservation practices and may not fully capture local management conditions or seasonal variations in vegetation cover. Although the R and K factors were derived from the best available rainfall and soil datasets, uncertainties in the spatial distribution and temporal variability of these data may also influence the predicted erosion rates. Furthermore, model validation was based on twelve runoff plots representing four land-use types, which provides confidence in the model performance but may not fully represent the spatial heterogeneity of the entire 1561 km2 Akanyaru Sub-catchment. Consequently, the predicted soil loss values should be interpreted as estimates of potential sheet and rill erosion rather than exact measurements, and additional long-term monitoring using a larger number of validation sites would further improve model reliability. Despite these limitations, the model successfully identified the spatial distribution of erosion-prone areas and provides a robust basis for prioritizing soil and water conservation interventions in the Akanyaru Sub-catchment.




 ,
,