Article

Cropland Resource Utilization Characteristics, Pattern Zoning, and Evolutionary Mechanisms in the Huang–Huai–Hai Region

1
Key Research Institute of Yellow River Civilization and Sustainable Development, Henan University, Kaifeng 475001, China
2
Faculty of Geographical Science and Engineering, Henan University, Zhengzhou 450046, China
*
Author to whom correspondence should be addressed.
Land 2026, 15(9), 1696; https://doi.org/10.3390/land15091696
Submission received: 1 August 2026 / Revised: 10 September 2026 / Accepted: 11 September 2026 / Published: 13 September 2026

Abstract

Against the backdrop of industrialization and urbanization, China’s cropland resource utilization has changed significantly, yet existing research lacks integrated zoning and formation mechanisms. Taking the Huang–Huai–Hai region as a case, this study constructed an indicator system covering quantitative endowment, landscape morphology, natural background, and production functions from the perspective of dominant and recessive land-use transitions. Based on the general characteristics and spatiotemporal evolution of different cropland resource utilization forms, we used 3S technology and the CART algorithm to classify the 52 cities in the Huang–Huai–Hai region into five cropland resource utilization patterns. From 2000 to 2020, these patterns evolved from fragmented and extensive to large-scale, intensive, and functional. Market reforms and land tenure interventions were closely associated with this evolution, as they affected labor allocation, property rights, farming practices, technology, and farmers’ risk aversion. This study enriches cropland resource utilization theory and supports territorial optimization for high-quality agriculture in the region.

1. Introduction

As a core factor of production that underpins food security and regional sustainable development, the rational utilization and effective protection of cropland resources are of great strategic significance [1]. China’s industrialization and urbanization have reduced cropland quantity and quality, threatening food security [2]. To maintain the total amount of cropland, China has implemented a compensation system for cropland occupation based on the principle of “cropland occupation–compensation balance”. However, in practice, imbalances remain between land taken and compensated; high-quality land is often replaced by low-quality land, and compensated land is used inefficiently [3,4]. For example, in the Huang–Huai–Hai region, both cropland natural quality and site conditions (climate, topography, landscape context, and locational factors) have degraded from 1990 to 2020, with site condition quality declining the most among China’s nine major agricultural regions [5]. In addition, issues such as the deterioration of the ecological environment of cropland, increased landscape fragmentation, inefficient land use, and declining soil fertility further hinder the sustainable use of cropland resources [6,7]. The complexity of these problems lies in the fact that cropland-use degradation is not a one-dimensional decline in quantity or quality, but rather a systemic predicament in which multiple processes are intertwined. Resolving this predicament requires systematically revealing the “pattern evolution laws” and “functional driving mechanisms” of cropland resource utilization. Therefore, building on an analysis of general cropland resource utilization characteristics, accurately identifying different patterns and delineating their zoning is a prerequisite for optimizing cropland resource allocation, implementing differentiated management, and advancing sustainable agricultural development.
Cropland resource utilization patterns refer to the overall approaches and integrated characteristics of cropland utilization at a given stage of economic development [8]. They manifest as relatively stable, identifiable, and transferable utilization paradigms. With regard to the identification and zoning of cropland resource utilization patterns, two parallel but not yet effectively integrated research lines have emerged in the academic community. The first is the classification of cropland resource utilization patterns, focusing on the spatial clustering characteristics and regional differentiation of cropland-use forms. This line of research is mostly based on a single analytical perspective. For instance, from a historical development perspective, they are categorized into primitive, traditional, and modern agriculture; from a spatial location perspective, into agricultural, peri-urban, and urban types [9]; and from a cropland-scale suitability perspective, into priority development, suitable development, and restoration–adjustment zones [10]. Furthermore, some scholars have already recognized the importance of an integrated perspective. By coordinating the spatial and non-spatial characteristics of cropland, they have identified four distinct patterns of cropland resource utilization in the Chaohu region: suburban compound operation (SC); grain and economic crop scale operation (GS); grain and economic crop extensive operation (GE); and grain, oil, and cotton scale operation (GOCS) [8]. The second is the cultivated land-use transition (CLUT) theory. This theory holds that changes in land-use morphology correspond to the transformation of regional socioeconomic development stages, driven by socioeconomic changes and innovations [11]. It encompasses two dimensions: cultivated land dominant transition (CLDT) and recessive transition (CLRT). The former emphasizes changes in cropland quantity structure, landscape pattern, and spatial pattern, while the latter involves shifts in intrinsic attributes such as cropland quality, property rights systems, management modes, inputs, outputs, and functions [12]. Early studies often took a single perspective. CLDT research mainly concentrated on spatial characteristics, such as landscape fragmentation, area, and quantity changes [13,14], whereas CLRT research centered on the evolution of functions and attributes related to agricultural development [15], food security, and land resource management [16]. Recently, more scholars have adopted a systematic, multidimensional approach, building comprehensive evaluation systems that incorporate both CLDT and CLRT [17,18].
Although existing pattern classification methods can characterize the spatial differentiation of cropland resource utilization patterns, they fail to reveal the internal evolutionary mechanisms of these patterns as space and process ensembles formed by the interactions of multidimensional factors over long time series, nor do they address the formation mechanisms underlying qualitative shifts in patterns driven by socioeconomic changes. To address this limitation, this study introduces the CLDT and CLRT framework of CLUT into cropland resource utilization pattern identification, advancing classification from “static typology” to “dynamic transition pathway analysis”, thereby partially compensating for the lack of a spatiotemporal coupling perspective in existing pattern classification research. Accordingly, this study proposes the following three progressive research questions: (i) What types of cropland resource utilization patterns can be identified in the Huang–Huai–Hai region at the three time points of 2000, 2010, and 2020? What characteristic combinations of dominant and recessive forms do these patterns exhibit, and what are their general features? (ii) From 2000 to 2020, what stage-specific characteristics and regional differentiation patterns are exhibited by the spatiotemporal evolution of each cropland-use form within each pattern? (iii) What are the driving mechanisms underlying the evolution of cropland resource utilization patterns? On this basis, what are the driving mechanisms that lead to differentiated evolutionary trajectories among different pattern types from 2000 to 2020? These three questions form a progressive logic from pattern identification to evolution analysis and then to mechanism attribution, aiming to compensate for the deficiencies of existing pattern classification in process interpretation and provide empirical evidence for the application of CLUT in pattern identification.
Accordingly, this study focuses on the Huang–Huai–Hai region, a key grain-producing area in China, as the study area. Drawing on the CLUT form framework of CLUT, we construct an evaluation index system for cropland resource utilization that encompasses four dimensions: quantitative endowment, landscape morphology, natural background, and productive functions. The first two correspond to the physical spatial attributes of CLDT, and the latter two to the functional efficiency attributes of CLRT. Using the 3S technology [19], we obtained data on various elements of cropland resource utilization for 2000, 2010, and 2020. We then applied the CART algorithm to classify the 52 prefecture-level cities for each time period [20], establishing classification rules for different cropland resource utilization patterns and revealing their spatiotemporal distribution patterns at the city level across different time points. On this basis, the study examined the generation mechanisms and formation processes of these patterns in the context of rapid socioeconomic development and systematically summarized their spatiotemporal evolution patterns and general characteristics. The aim is to support coordinated urban–cropland management and high-quality sustainable agricultural development, thereby strengthening food security and agricultural spatial governance.

2. Materials and Methods

2.1. Study Area

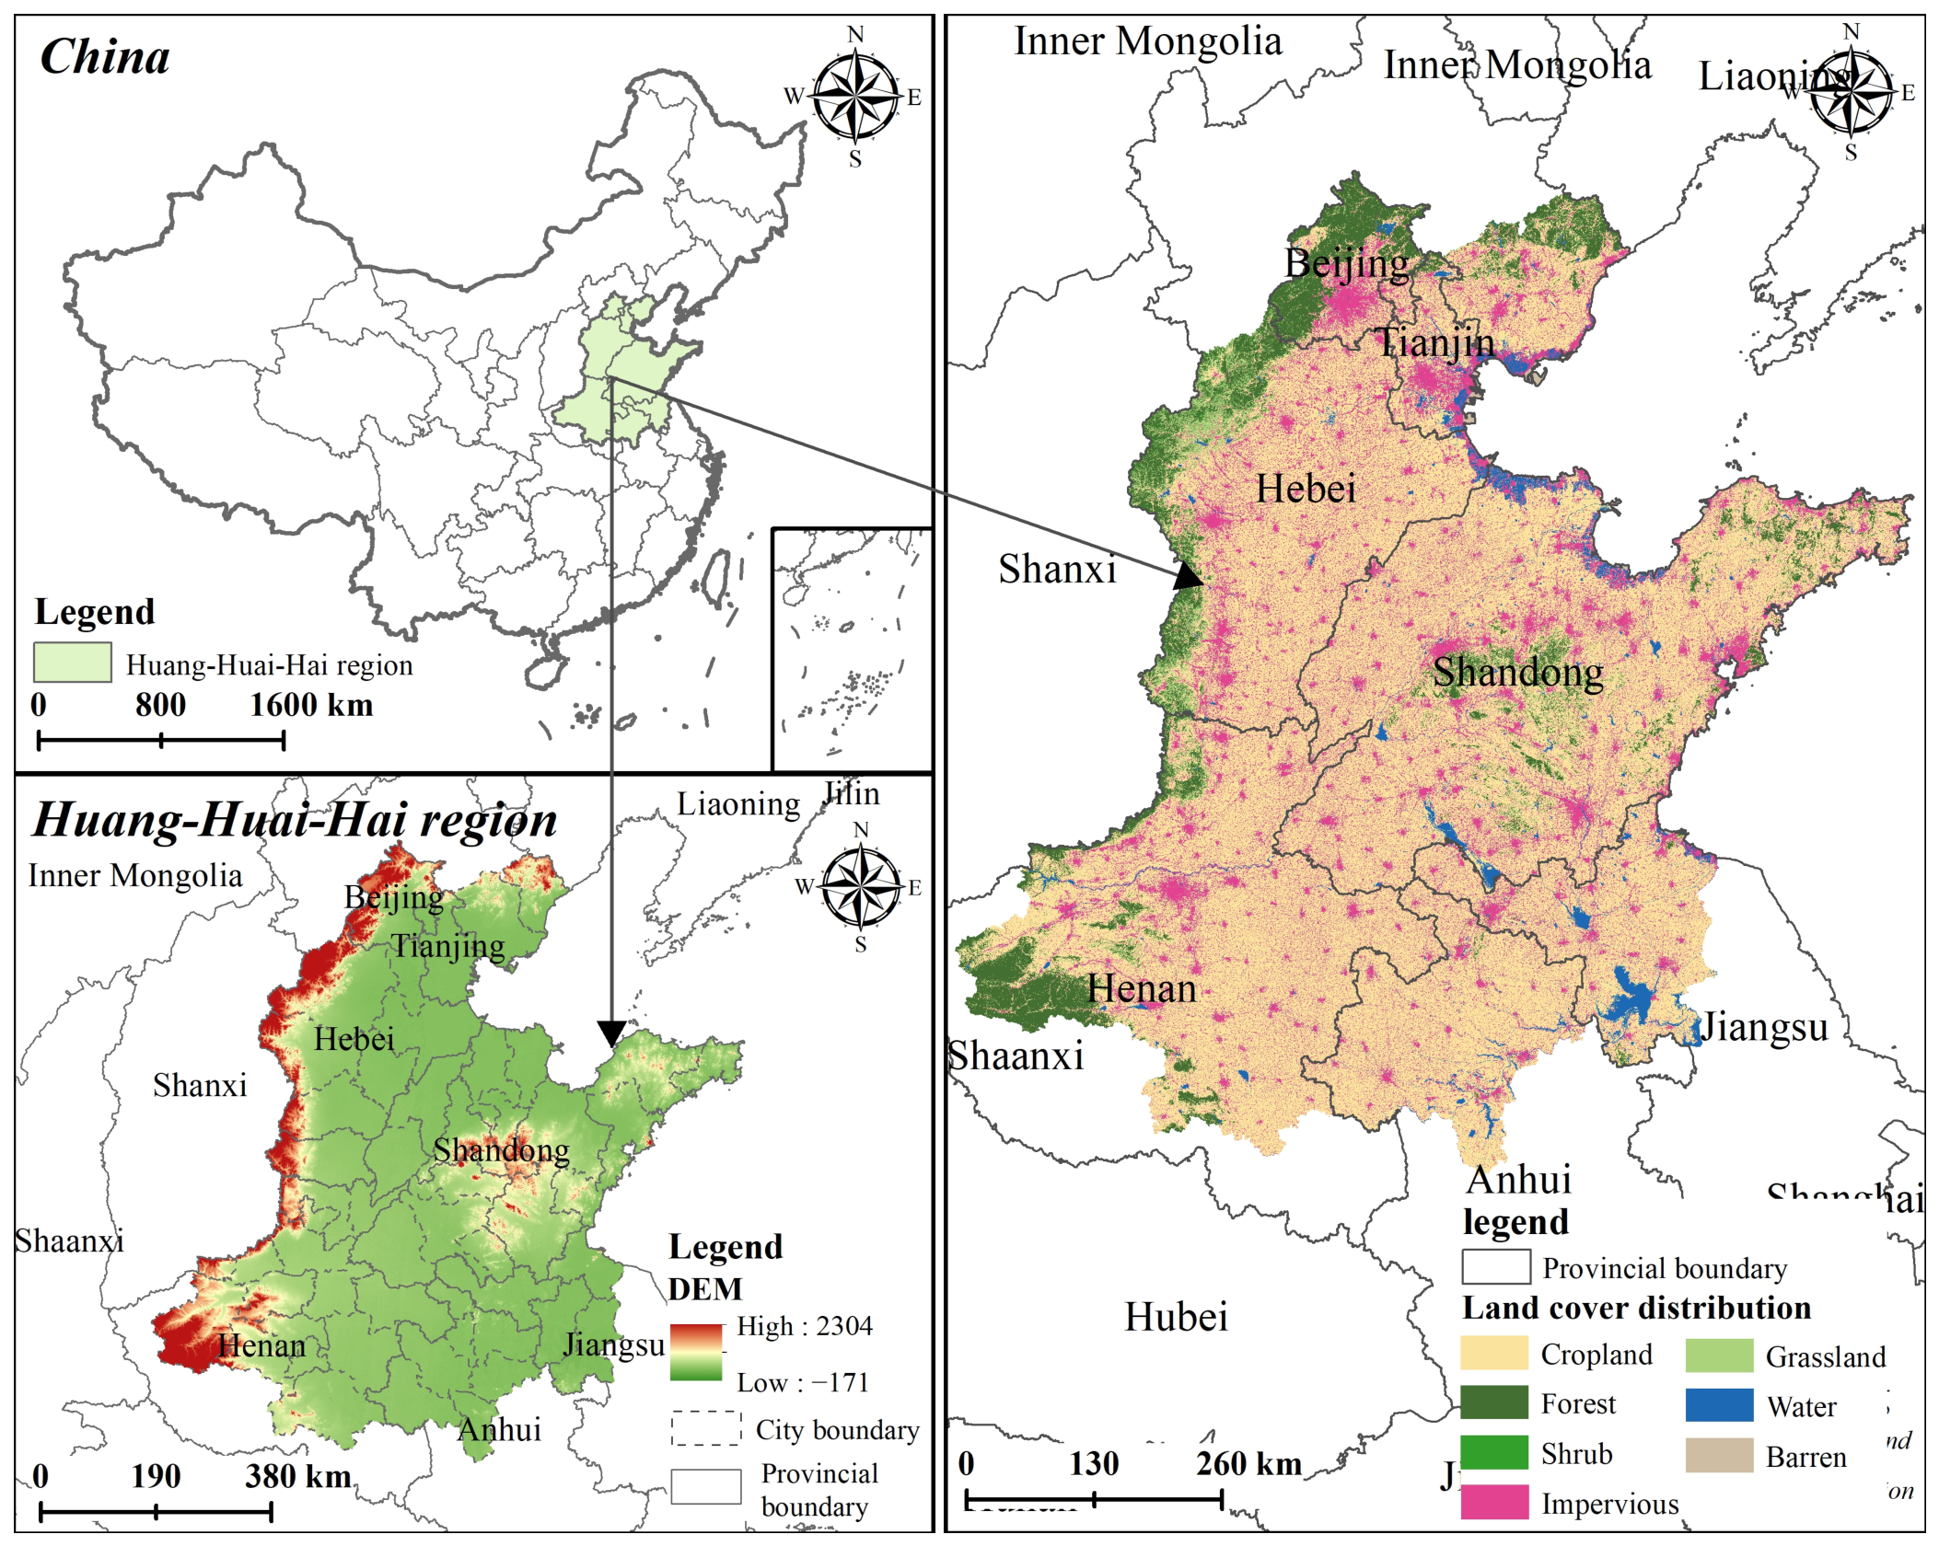
The Huang–Huai–Hai region is located from 32°00′ N to 40°24′ N and from 112°48′ E to 122°45′ E. It encompasses the entire territories of Beijing, Tianjin, and Shandong Province, most of Hebei and Henan Provinces, and parts of the Huai River basin in Jiangsu and Anhui Provinces, covering a total of 52 prefecture-level cities [21] (Figure 1). The region is a vast alluvial plain with flat topography and a warm temperate, semi-humid climate, offering favorable solar and thermal conditions. However, precipitation varies spatiotemporally, from about 460 mm to 1080 mm annually, with higher amounts in the south and lower in the north [22]. Precipitation is highly concentrated in specific seasons, with summer rainfall accounting for about 86% of the annual total [23]. It accounts for 4.3% of the country’s land area, supports 20.6% of national cropland and 22.5% of its population, and contributes 30.8% of national grain production, playing a vital role in safeguarding food security [24]. Nevertheless, rapid urbanization and long-term intensive use have contributed to cropland loss, fragmentation, soil organic matter decline, and ecological degradation, highlighting the urgent need for cropland protection. From 2000 to 2015, the region lost 2.57 million hectares of cropland, 72.25% of which was converted to construction land [24]. As a key area for safeguarding national food security and a typical region with prominent cropland issues amid rapid urbanization, this region is ideal for revealing the evolutionary trajectories and driving mechanisms of cropland resource utilization patterns.

2.2. Data Sources

This study built a multi-source, long-term database for the Huang–Huai–Hai region (2000–2020), including raster/vector data (land use, elevation, precipitation, hydrology, soil, roads, and administrative boundaries) and socioeconomic data. Land-use data were obtained from the China Land Cover Dataset (CLCD) of Wuhan University [25]. Monthly precipitation and soil property data were obtained from the National Qinghai–Tibet Plateau Scientific Data Center; the DEM was sourced from the Zenodo platform; hydrological network data were sourced from the OpenStreetMap platform; basic geographic data, such as administrative boundaries, were sourced from the Geospatial Data Cloud; and socioeconomic data were sourced from the statistical yearbooks of various provinces and municipalities. All datasets were uniformly projected to the WGS 1984 UTM Zone 49N coordinate system and resampled to a 1 km × 1 km grid. Cropland data for missing years were estimated using the proportional relationship between remote sensing and year-end statistical area in known years and were subsequently validated and corrected against adjacent known-year data to ensure that estimation bias remained within a reasonable range. Specifically, the 2010 cropland area for each city in Shandong Province was taken from the 2012 Shandong Statistical Yearbook. The data sources are shown in Table 1 below.

2.3. Development of an Evaluation Index System for the Characteristics of Cropland Resource Utilization

Drawing on CLCD, this study established an evaluation index system for cropland resource utilization characteristics, covering both CLDT and CLRT. By integrating GIS, multi-indicator evaluation, and decision tree algorithms, we identified cropland resource utilization patterns of 52 prefectural cities in the Huang–Huai–Hai region for 2000, 2010, and 2020 from four dimensions (quantitative endowment, landscape morphology, natural background, and production functions), and further analyzed their spatiotemporal evolution mechanisms (Table 2). It should be noted that slope changes over the 20-year period are negligible, soil properties lack annual observational data, and single-year precipitation is susceptible to extreme climate events and thus cannot reflect regional background climate characteristics. Accordingly, natural background indicators are unsuitable for temporal evolution analysis and are treated only as static background variables in pattern identification.
In addition, to reduce subjective bias in weight determination, we compared the Analytic Hierarchy Process (AHP), the traditional entropy method, and the CRITIC method. The analysis revealed that AHP is susceptible to expert preferences [26], as evidenced by the 22.42% weight assigned to the irrigation district indicator. The traditional entropy method is easily influenced by data dispersion, overemphasizing abnormal fluctuations [27]. For example, in the landscape morphology evaluation, PD weight rose by 6.97% from 2000 to 2020, while AI weight fell by 7.3%, severely affecting temporal stability. The CRITIC method avoids these issues. It incorporates indicator variability, contrast intensity, and inter-indicator conflict, suppressing redundancy among correlated indicators and yielding stable weights over time [28]. The comparison results of this study also confirm these findings. Therefore, the CRITIC method was selected for objective weighting, ensuring scientific rigor in subsequent analyses.

2.3.1. Endowment of Cropland

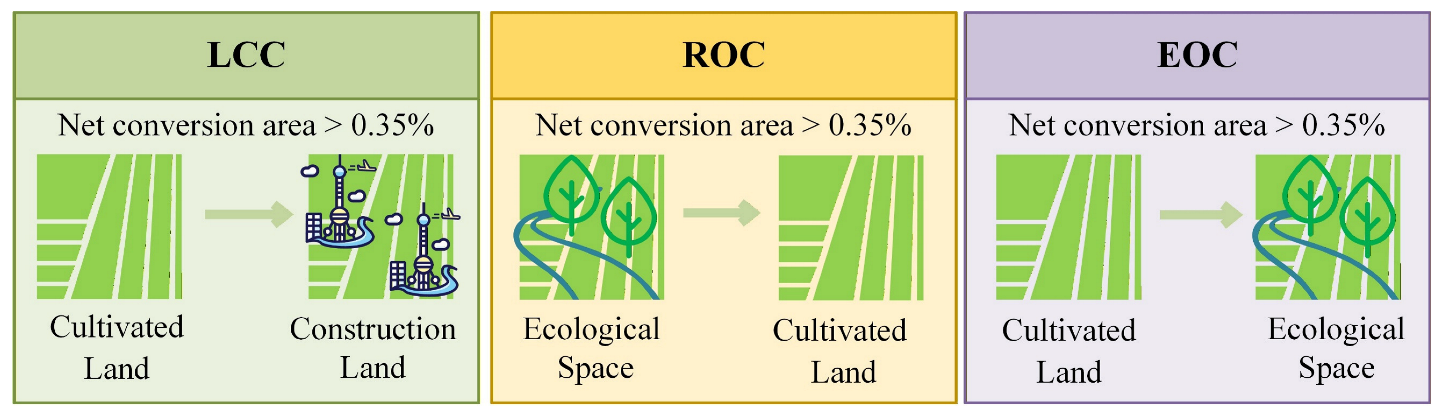
Cropland quantitative endowment reflects spatiotemporal changes in cropland. Using a land-use transition matrix, we analyzed cropland dynamics in the Huang–Huai–Hai region from 2000 to 2020. Rapid urbanization led to widespread cropland conversion to construction land, though cities responded differently. To capture these differences, we applied a threshold of 0.35% of the total municipal area for net cropland conversion to urban or ecological space, classifying 52 cities into three types: (i) Land-Consuming Cities (LCCs): cities where the net area of cropland converted to construction land accounts for more than 0.35% of the city’s total area. (ii) Reclamation-Oriented Cities (ROCs): cities where, apart from the conversion of cropland to construction land, the net area of ecological space (grassland, forestland, water bodies, etc.) converted to cropland accounts for no less than 0.35% of the city’s total area. (iii) Ecology-Oriented Cities (EOCs): cities where, apart from the conversion of cropland to built-up land, the net area of cropland converted to ecological space (grassland, forestland, water bodies, etc.) accounts for no less than 0.35% of the city’s total area. We further conducted a sensitivity analysis to verify the reliability of the threshold delineation. Lowering the threshold by 30% left the classification largely stable. Raising it by 10% increased the number of cropland-occupying cities, but the overall classification pattern was maintained. A further 20% increase shifted all reclassified cities to the cropland-occupying category, markedly weakening the discriminatory power of the three-category system. Overall, the 0.35% threshold achieves balanced differentiation among the three city types.
The land-use transition matrix quantifies the conversions among land-use types over time, revealing area changes, transformation directions, and underlying patterns of land-use structure dynamics. Its mathematical expression is as follows:
S i j = S 11 S 1 n S n 1 S n n
In the formula, S i j represents the area converted between different land-use types within the study area; n represents the number of land-use types; i and j denote the land-use types at the beginning and end of the study period, respectively.

2.3.2. Establishment of Landscape Morphology Indicators

Cropland quantity and spatial distribution change over time, and their landscape morphology changes accordingly. To assess landscape shape complexity and fragmentation of cropland in the Huang–Huai–Hai region, this study selected the Comprehensive Landscape Index (CLI) based on four dimensions (Area, Shape, Aggregation, Fragmentation) using four indicators: Patch Density (PD), Area-Weighted Mean Shape Index (AWMSI), Aggregation Index (AI), and Landscape Division Index (DIVISION) [29,30]. A dynamic analysis of the cropland landscape in 52 prefecture-level cities for 2000, 2010, and 2020 was conducted using these indicators [31,32]. We calculated landscape metrics using FRAGSTATS 4.3 (University of Massachusetts, Amherst, MA, USA) and applied the CRITIC weighting method to derive a composite index. The CRITIC method adjusts weights for indicators with inconsistent directions using inter-indicator correlation coefficients. This suppresses the excessive influence of directional bias from any single indicator on the composite result. We thus obtained CLI values for each city and period. The Jenks Natural Breaks Method was then applied to classify the CLI values of the 52 cities into corresponding categories, and the cities were grouped into the following three categories: (i) High-CLI Type (H-CLI): CLI > 0.7; the cropland landscape in this category exhibits a highly aggregated pattern, with large-scale, highly regular-shaped patches. (ii) Medium-CLI Type (M-CLI): 0.5 < CLI < 0.7; the cropland landscape in this category shows moderate aggregation, with medium patch sizes and relatively regular shapes. (iii) Low-CLI Type (L-CLI): CLI < 0.5; the cropland landscape in this category is highly fragmented, characterized by small, dispersed patches with complex and irregular shapes.

2.3.3. Assessment of Natural Background Suitability

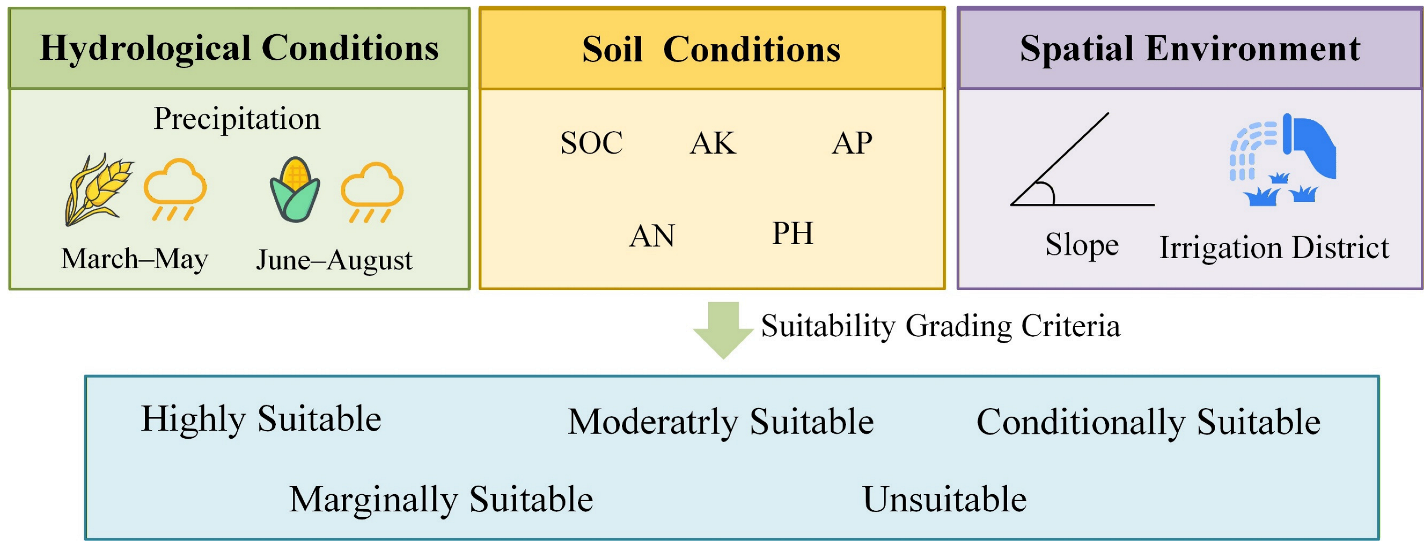
Hydrology, soil, and spatial environment are core dimensions of cropland suitability. Leveraging the region’s abundant solar and thermal resources, nine indicators were selected to construct the suitability evaluation index system (Table 3). Spring droughts and concentrated summer rainfall directly affect winter wheat and summer corn [33]. Therefore, we used multi-year average precipitation data for March–May and June–August (2000–2020) to represent water supply conditions during key agricultural seasons. For soil, organic carbon (OC), available nitrogen (AN), available phosphorus (AP), available potassium (AK), and pH in the 0–30 cm layer were selected to assess fertility and chemical environment [34,35]. Slope data reflect topographic constraints, while irrigation districts indicate irrigation capacity [36]. The dense road network also provides key transportation support for agriculture.
Based on the literature and relevant agricultural data [5,37], this study classified each indicator’s suitability levels (Table 4) and summarized the municipal cropland natural baseline suitability. The Jenks Natural Breaks Method was then applied to composite scores, dividing the 52 cities into five categories: highly suitable, moderately suitable, conditionally suitable, marginally suitable, and unsuitable. This reveals spatial variation in cropland natural baseline quality.

2.3.4. Establishment of Cropping Systems and Planting Structure

This study uses cropping index and planting structure to identify geographic variation in agricultural production functions across the Huang–Huai–Hai region. The cropping index is the ratio of total sown area to total cropland area, reflecting cropping system intensity [38]. In this study, a cropping index of less than 1.2 is defined as a single-crop system, a value between 1.2 and 1.8 is defined as a three-crop system over two years, and a value greater than 1.8 is defined as a double-cropping system [39,40]. Planting structure types are classified by crop area proportions. Based on the distribution of eight major crops in the Huang–Huai–Hai region, a 35% area share was set as the threshold, and types were defined accordingly [21]: (i) If one or two crops together exceed 35% of the total sown area, the planting structure type is defined by that crop combination. (ii) If no single crop exceeds 35%, the type is defined by the top three crops by planted area. Note that the crop combination indicates composition, not area ranking order.
Based on cropping index and planting structure, 52 prefectures in the Huang–Huai–Hai region were classified into four cropping system types: (i) Stable-yield staple crop regions: This type of cropping system involves single cropping per year or three crops in two years, primarily cultivating staple crops, such as wheat, maize, rice, soybeans, and tubers. It is a farming model designed to ensure basic food security under resource-constrained conditions. (ii) Stable grain–cash crop regions: This type of cropping system involves single cropping per year or three crops in two years, with a planting structure characterized by a stable combination of grain and cash crops, such as wheat–maize–vegetables and wheat–cotton. This represents a diversified livelihood strategy adopted by farmers in semi-intensive agricultural areas to balance risk and return. (iii) High-yield staple crop regions: This type of cropping system involves double cropping per year, with a planting structure concentrated on staple crops such as wheat and maize. These regions serve as intensive commercial grain production bases that benefit from favorable sunlight, heat, and infrastructure. (iv) High-yield grain–cash crop regions: This type of cropping system involves double cropping per year and features a highly efficient mixed cropping system of grain and cash crops. It represents a synergistic model of intensification and diversification aimed at maximizing profitability in the context of agricultural marketization and modernization.

2.4. Classification of Cropland Resource Utilization Patterns Using Decision Tree Algorithms

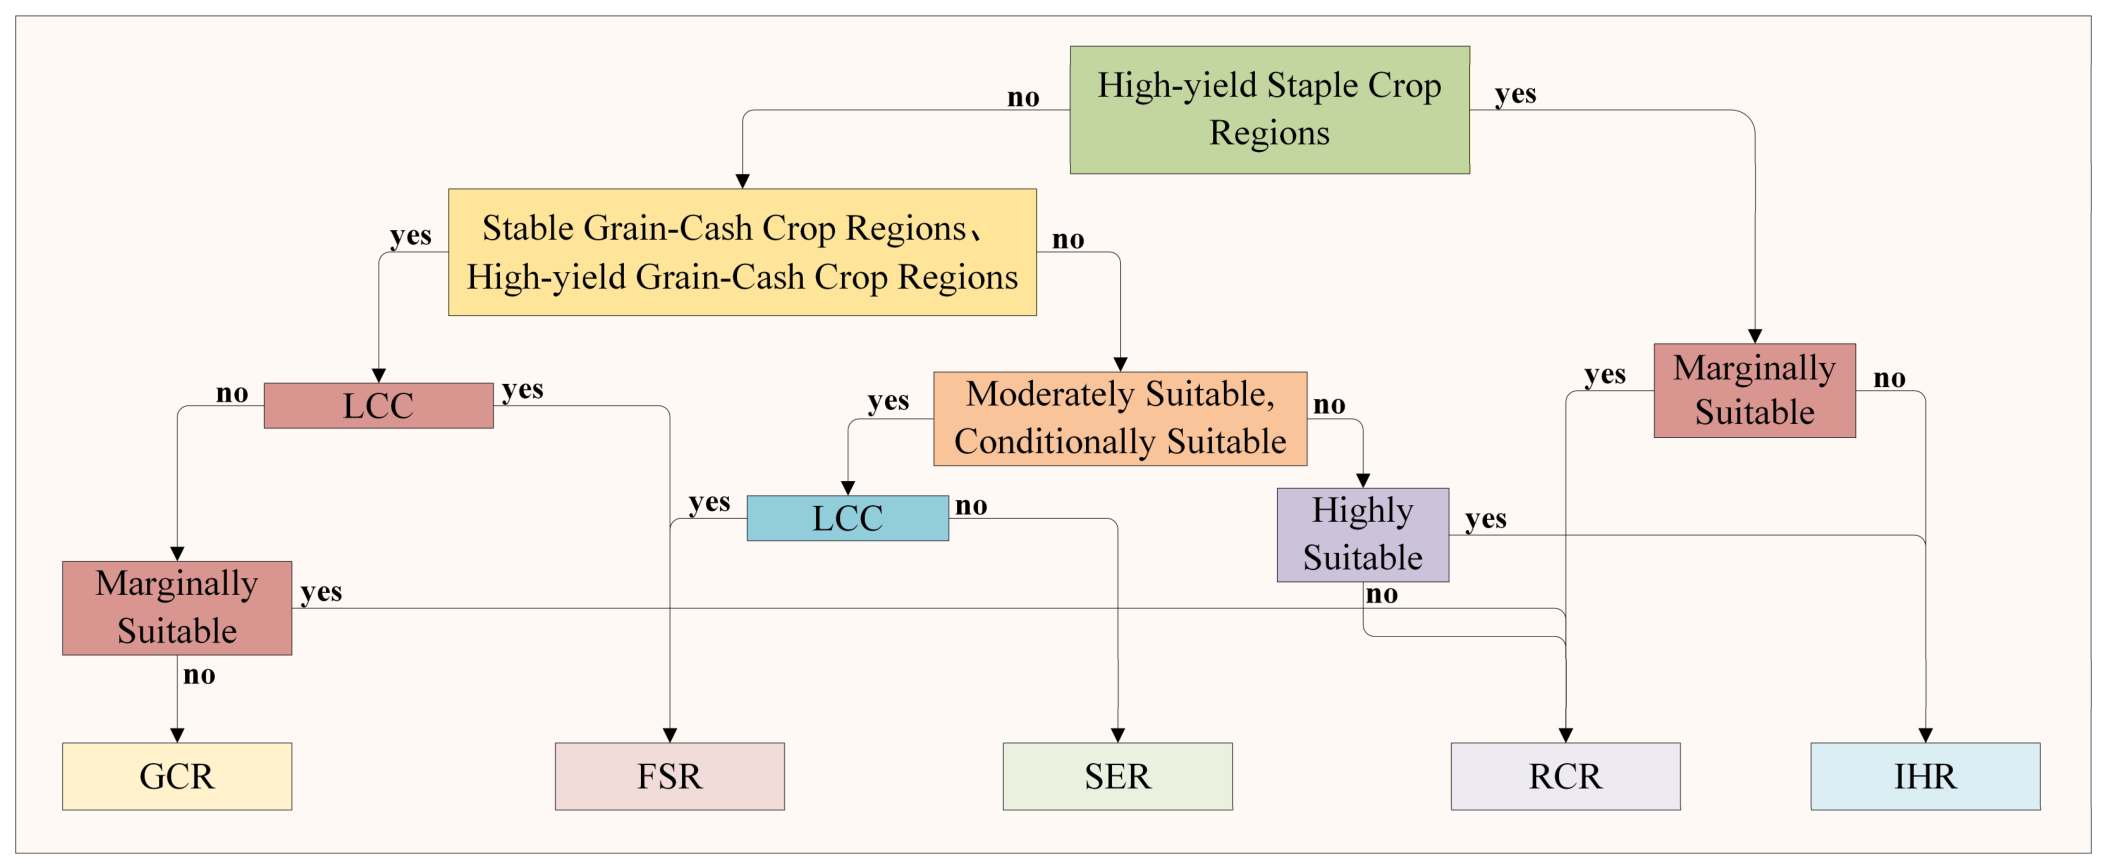
The decision tree is a widely used classification and regression algorithm that recursively splits nodes based on input features until a stopping criterion is met [41]. We applied the CART algorithm (rpart package in R) to classify the 52 prefecture-level cities in the Huang–Huai–Hai region, using the Gini index as the splitting criterion and the pattern categories derived from the four dimensions as the target variable. Five patterns were identified: intensive high-yield staple crop region (IHR), stable grain yield and ecological conservation region (SER), grain–cash crop composite high-value stable-yield region (GCR), functionally stressed region (FSR), and resource-constrained region (RCR). To verify the robustness of the classification results, the dataset was randomly divided into training and test sets at a 70%/30% ratio, and 10-fold cross-validation was employed to assess the model’s generalization ability. The cross-validation results showed an overall accuracy of 87.33% and a Kappa coefficient of 0.82. The classification process and rules are shown in Figure 2 and Table 5, respectively. We further used the Mean Center tool in ArcGIS 10.8 to calculate the spatial mean center of each pattern for 2000, 2010, and 2020. Mean center shifts were then used to detect directional spatial migration of each pattern [42].

3. Results

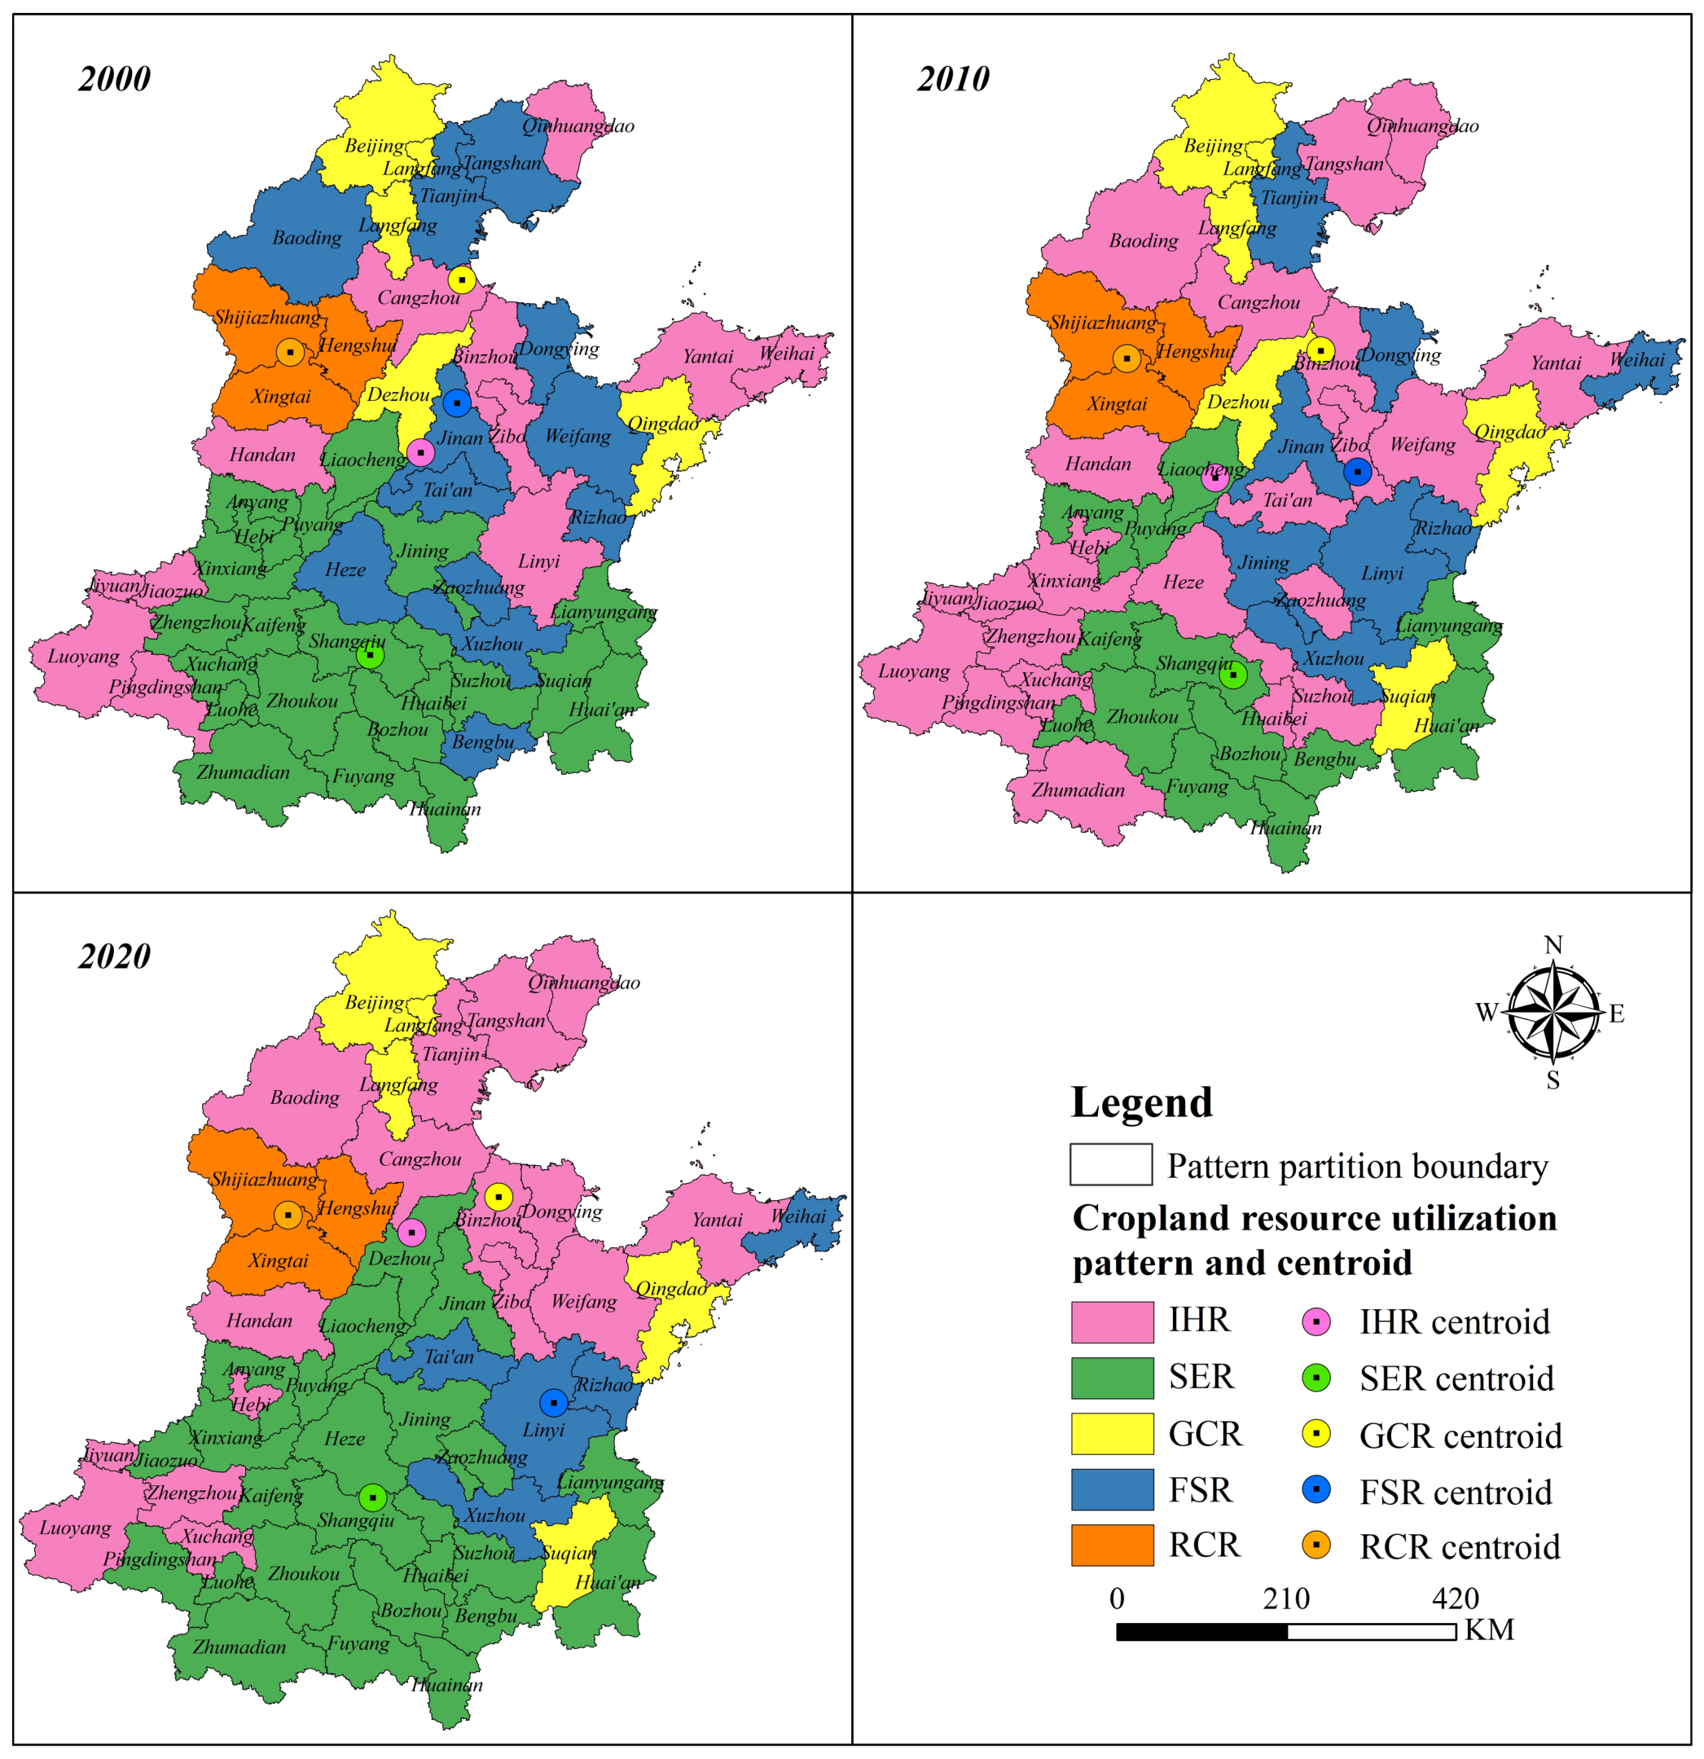
3.1. Results of the Identification of Different Cropland Resource Utilization Patterns

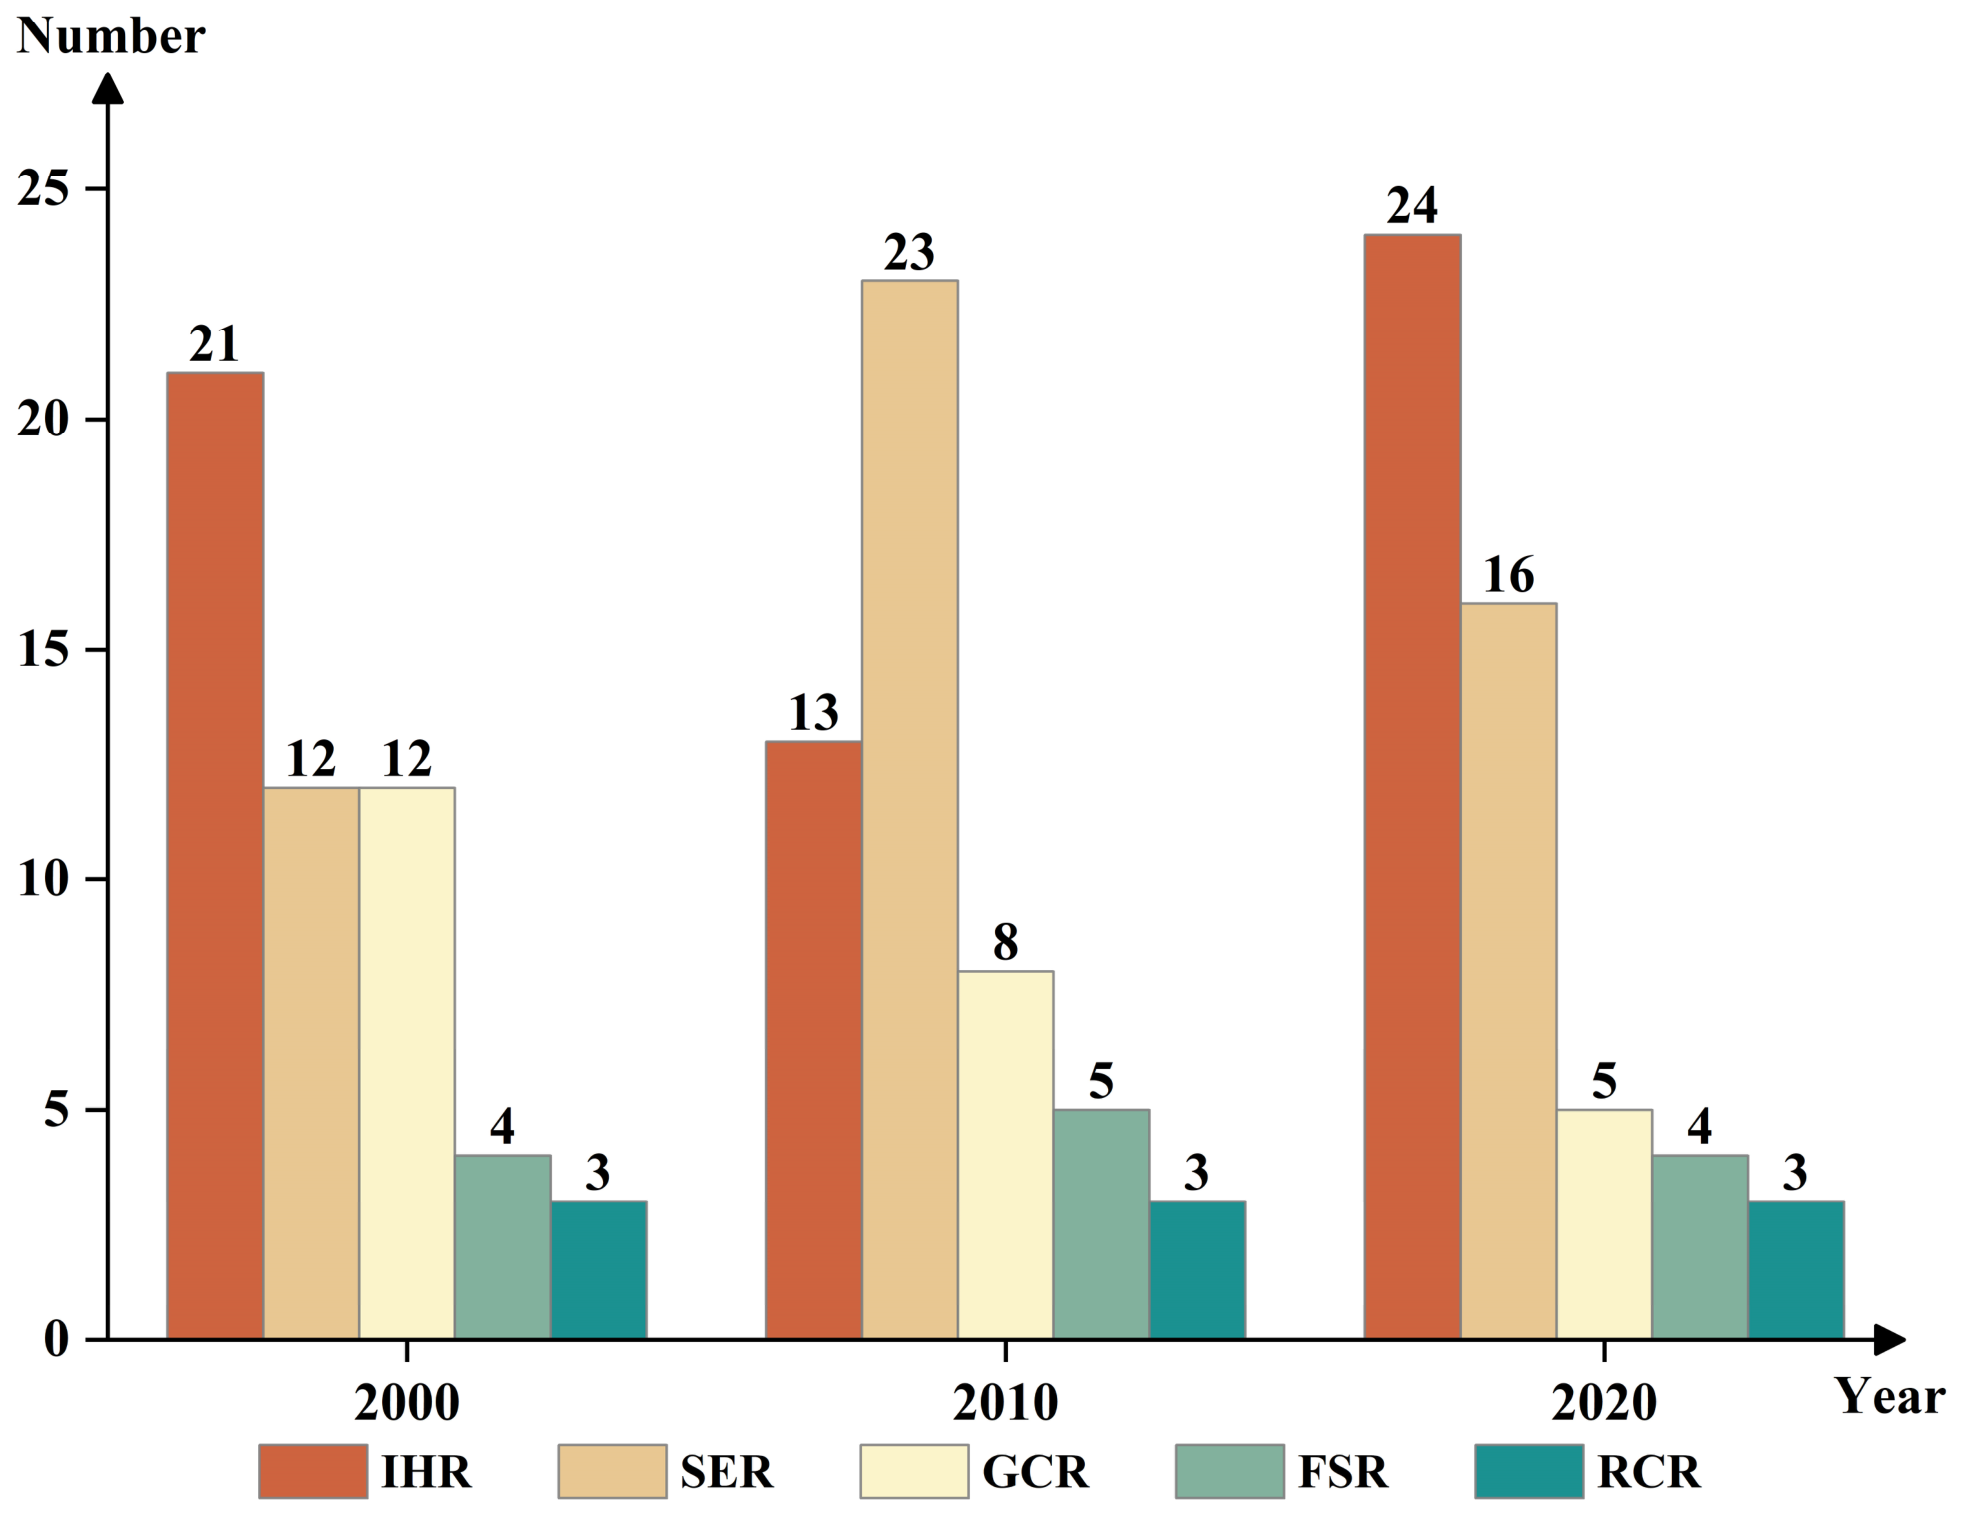
Decision tree classification (Figure 3 and Figure 4) shows that Hengshui, Xingtai, and Shijiazhuang were consistently classified as RCR throughout the study period. The number of FSRs changed relatively little, and their spatial distribution was relatively dispersed: four were identified in 2000; by 2010, Dezhou was added, while Suqian was removed by 2020. GCRs declined continuously, from 12 in 2000 to 8 in 2010, then to 5 in 2020. These zones were mainly concentrated in areas with good market access and flexible planting structures, such as Tianjin and Xuzhou. The spatial mean center of this pattern shifted markedly southwest during the study period. Cities exiting this pattern were concentrated in the northeast and mostly transitioned to SER, producing a pattern of northeast withdrawal and southwest stability. IHR and SER covered the largest areas in the Huang–Huai–Hai region, concentrated mainly in the central and southern areas. In 2000, IHR and SER accounted for 40.38% (21 cities) and 23.08% (12 cities) of all valid districts, respectively. By 2010, their shares shifted to 25% (13 cities) and 44.23% (23 cities), with seven cities transitioning from IHR to SER. By 2020, the shares were 46.15% (24 cities) and 30.77% (16 cities), with eight cities transitioning from SER to IHR. These shifts reflect significant dynamic adjustments in the spatial distribution of the two patterns at the municipal level. The spatial mean centers of the two patterns showed no marked directional migration during the study period, indicating that cities switching between the two patterns remained in the same area without diffusion or displacement.

3.2. Spatiotemporal Evolutionary Characteristics of Cropland Resource Utilization Patterns Under Different Utilization Patterns

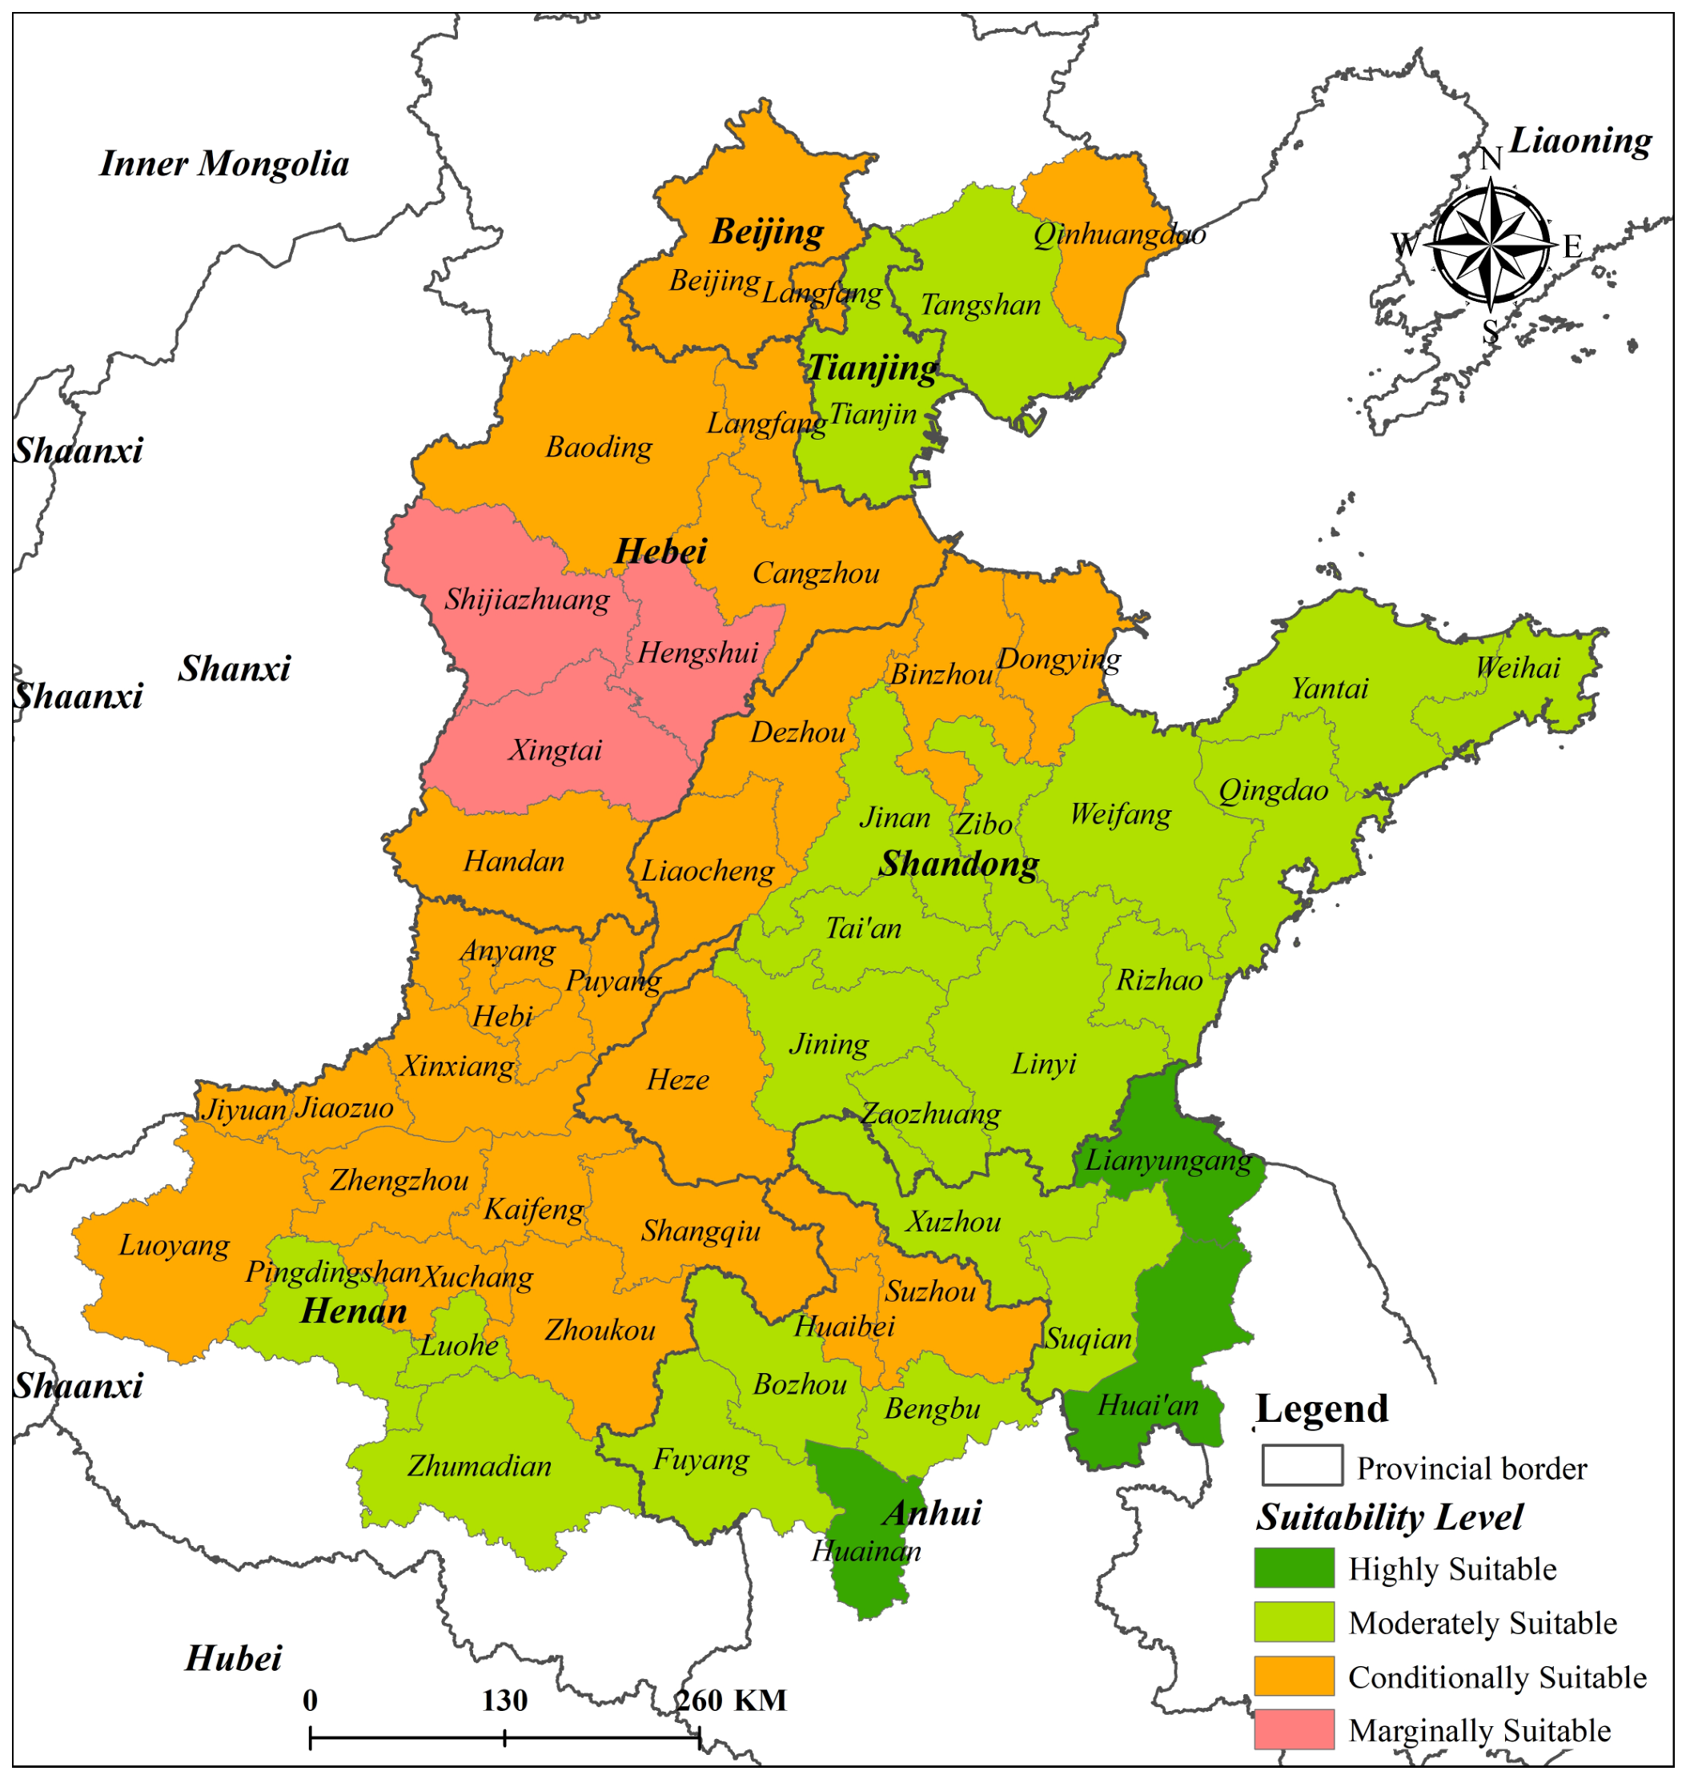
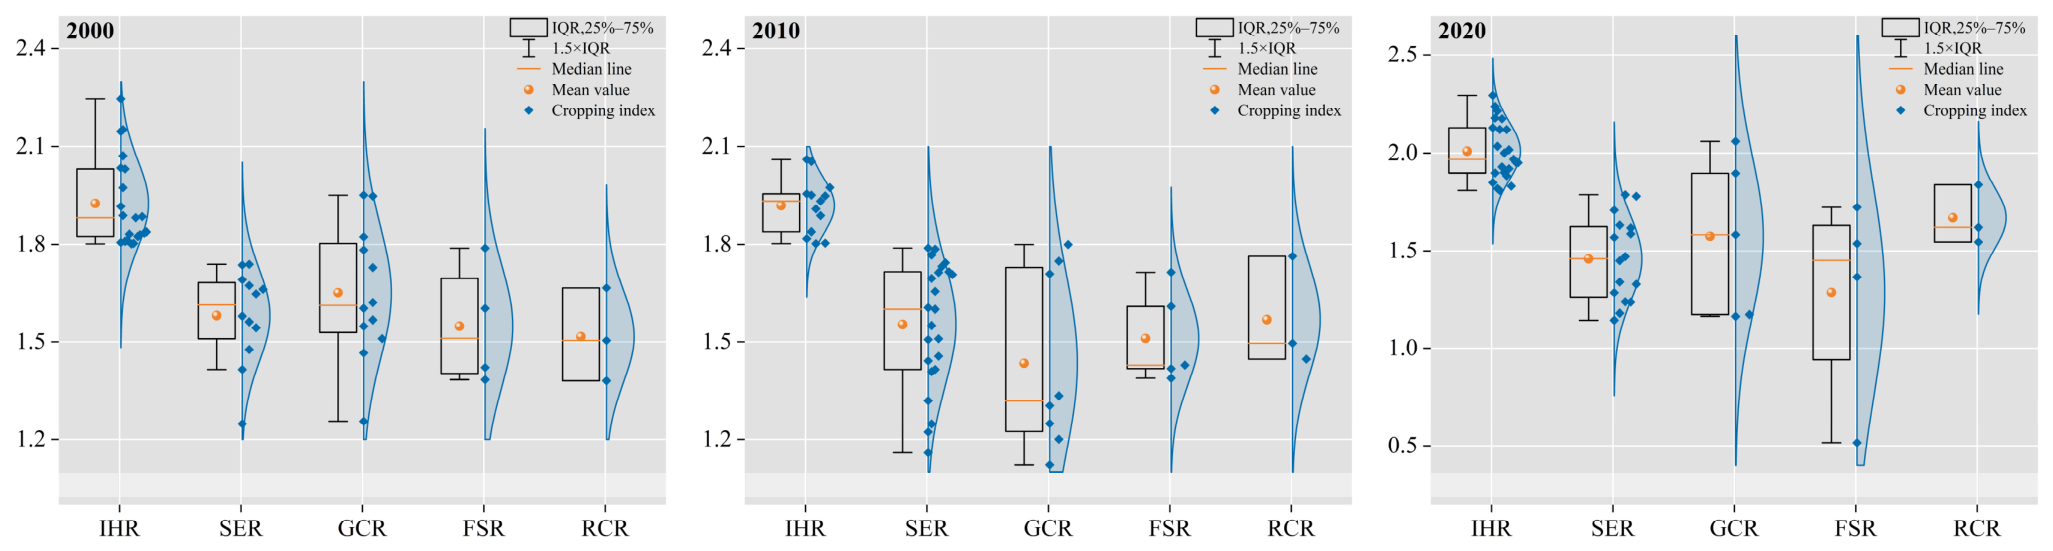
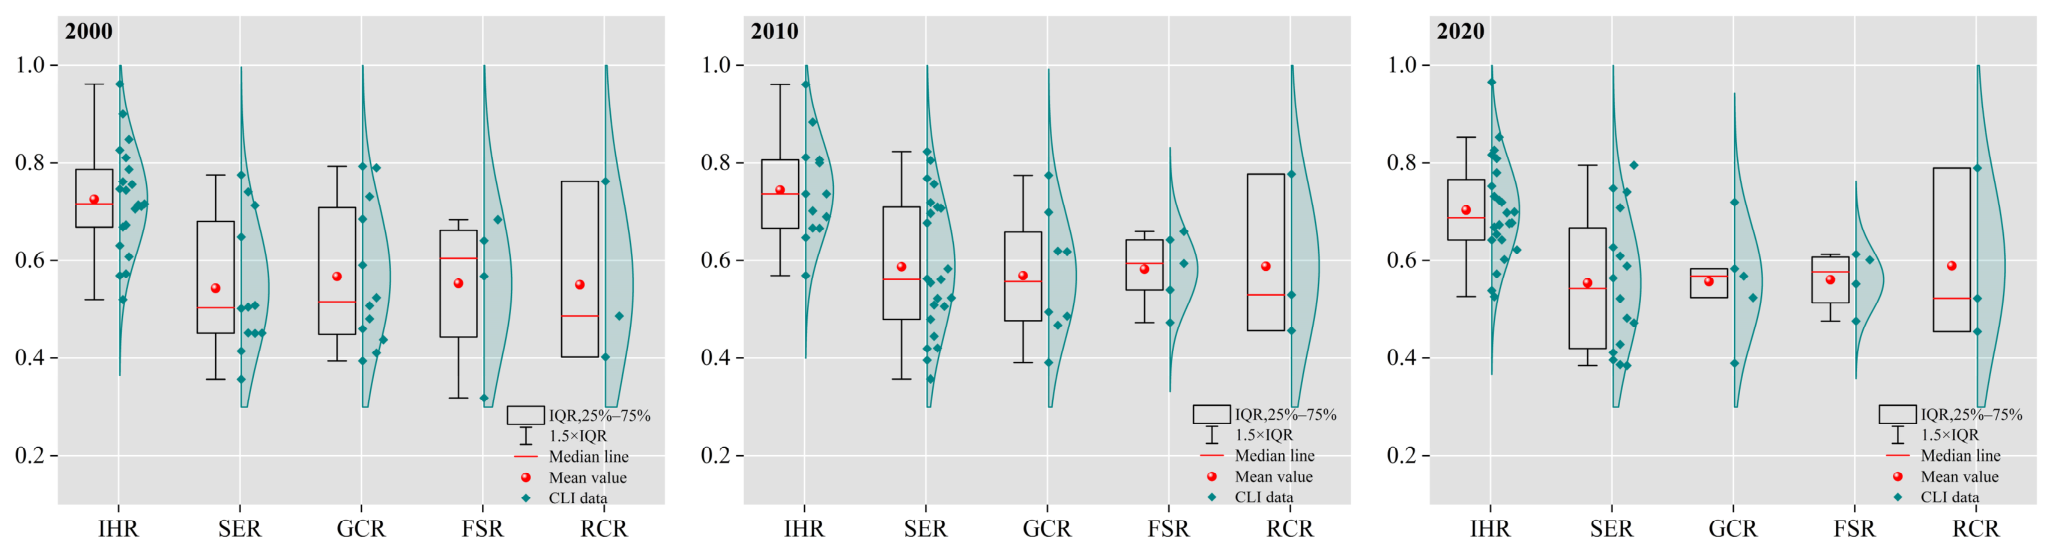
Remote sensing data show that cropland in the IHR first decreased and then increased. From 2000 to 2010, it declined by 54,128 km2, then increased substantially in the following decade (2010–2020). By 2020, the IHR accounted for 45.66% of the region’s cropland and was relatively concentrated (Table 6). This zone, consisting of EOCs, ROCs, and LCCs, has cropland conversion to construction land and significant exchanges with forest and grassland. From 2000 to 2020, the median and mean of the CLI both remained around 0.7, with no evident expansion in box width (Figure 5), indicating high spatial concentration and geometric regularity favorable for large-scale, mechanized agriculture, and internal differences did not widen significantly amid urbanization. Most cities are highly conditionally suitable, providing excellent natural conditions for high-quality farmland. Moderately suitable cities predominate, accounting for 57% in 2000 and 50% in 2020 (Figure 6). The regional cropping index remained high throughout the study period, with both median and mean approaching 2 in 2020 (Figure 7), reflecting double cropping for staple grain production and high yield potential, which makes this a vital area for food security in the Huang–Huai–Hai region.
In 2000, the SER had 78,811.79 km2 of cropland, accounting for 22.32% of the Huang–Huai–Hai region’s total. In 2010, nine additional cities were classified into this zone, increasing cropland area by 19.23% relative to 2000 and raising its share to 43.50%. By 2020, however, the share fell back to 30.32%, reflecting an initial increase and then decline. This zone includes EOCs and ROCs, reflecting a balance between ecological conservation and food security during urbanization. Cropland’s natural suitability was dominated by moderate or conditionally suitable classes. The proportion of conditionally suitable cities remained high and increased from 58.33% in 2000 to 68.75% in 2020, indicating that the region still had a favorable foundation for crop growth despite natural constraints. The CLI median and mean in 2020 were slightly higher than those in 2000, but a considerable proportion of cities still had values below 0.7. This suggests that although overall cropland landscape aggregation and regularity improved, internal differences remained pronounced and patch fragmentation in some cities persisted. The average cropping index declined markedly from 1.58 in 2000 to 1.46 in 2020, with some cities shifting from three crops in two years to single cropping per year.
Between 2000 and 2020, the GCR showed an overall contraction trend, with some cities no longer classified as GCR, while new ones were added. Total cropland area decreased by 56,036.52 km2, with faster losses before 2010 (33,440.45 km2, 59.7% of total cropland loss). Urban number distribution aligns with the SER. The average CLI remained stable while the median increased slightly, partly due to the exit of some cities from this pattern. Overall, cropland aggregation and regularity changed little, and the landscape structure remained stable. Conditionally suitable cities gradually exited, and all remaining cities were moderately suitable by 2020. This provided a solid natural foundation for a mixed grain–cash crop system, ensuring food security while enhancing regional economic benefits. The cropping index declined from 1.65 in 2000 to 1.60 in 2010 and further to 1.57 in 2020. This decline is associated with the gradual withdrawal of some cities from the three crops in two years, as well as the shift from that system to single cropping per year in others.
Due to urban expansion and spatial restructuring, cropland area in the FSR pattern increased by 4388.75 km2 (2000–2010) and then decreased by 9599.79 km2 (2010–2020). This region was severely affected by urban expansion, with cropland primarily converted to construction land. Despite this pressure, the cropland landscape did not exhibit progressive fragmentation or increasing complexity. The CLI fluctuated from 2000 to 2020, but changes in the latter decade were negligible. This indicates that cropland spatial patterns did not undergo sustained fragmentation or increased morphological complexity under rapid urbanization. Cropland suitability was dominated by moderate and conditionally suitable classes, with the proportion of conditionally suitable cities never below 50%. Water–heat conditions were favorable, and the cropping systems were mostly single cropping per year or three crops in two years. However, a gradual shift from high-intensity to low-intensity cropping in some cities was accompanied by the regional average cropping index declining by 0.26 from 2000 to 2020, with Beijing showing the largest decrease of 0.87.
The RCR pattern was spatially concentrated, with no urban expansion or contraction during the study period. Yet cropland area decreased by 1389.49 km2. The natural background was unfavorable, with all areas classified as marginally suitable. The landscape structure was relatively fragmented, with an average CLI of only 0.55 in 2000. However, between 2000 and 2020, the average CLI and cropping index increased by 0.04 and 0.15, respectively, indicating steadily increasing grain production potential.

4. Discussion

4.1. Formation Mechanisms of Cropland Resource Utilization Patterns

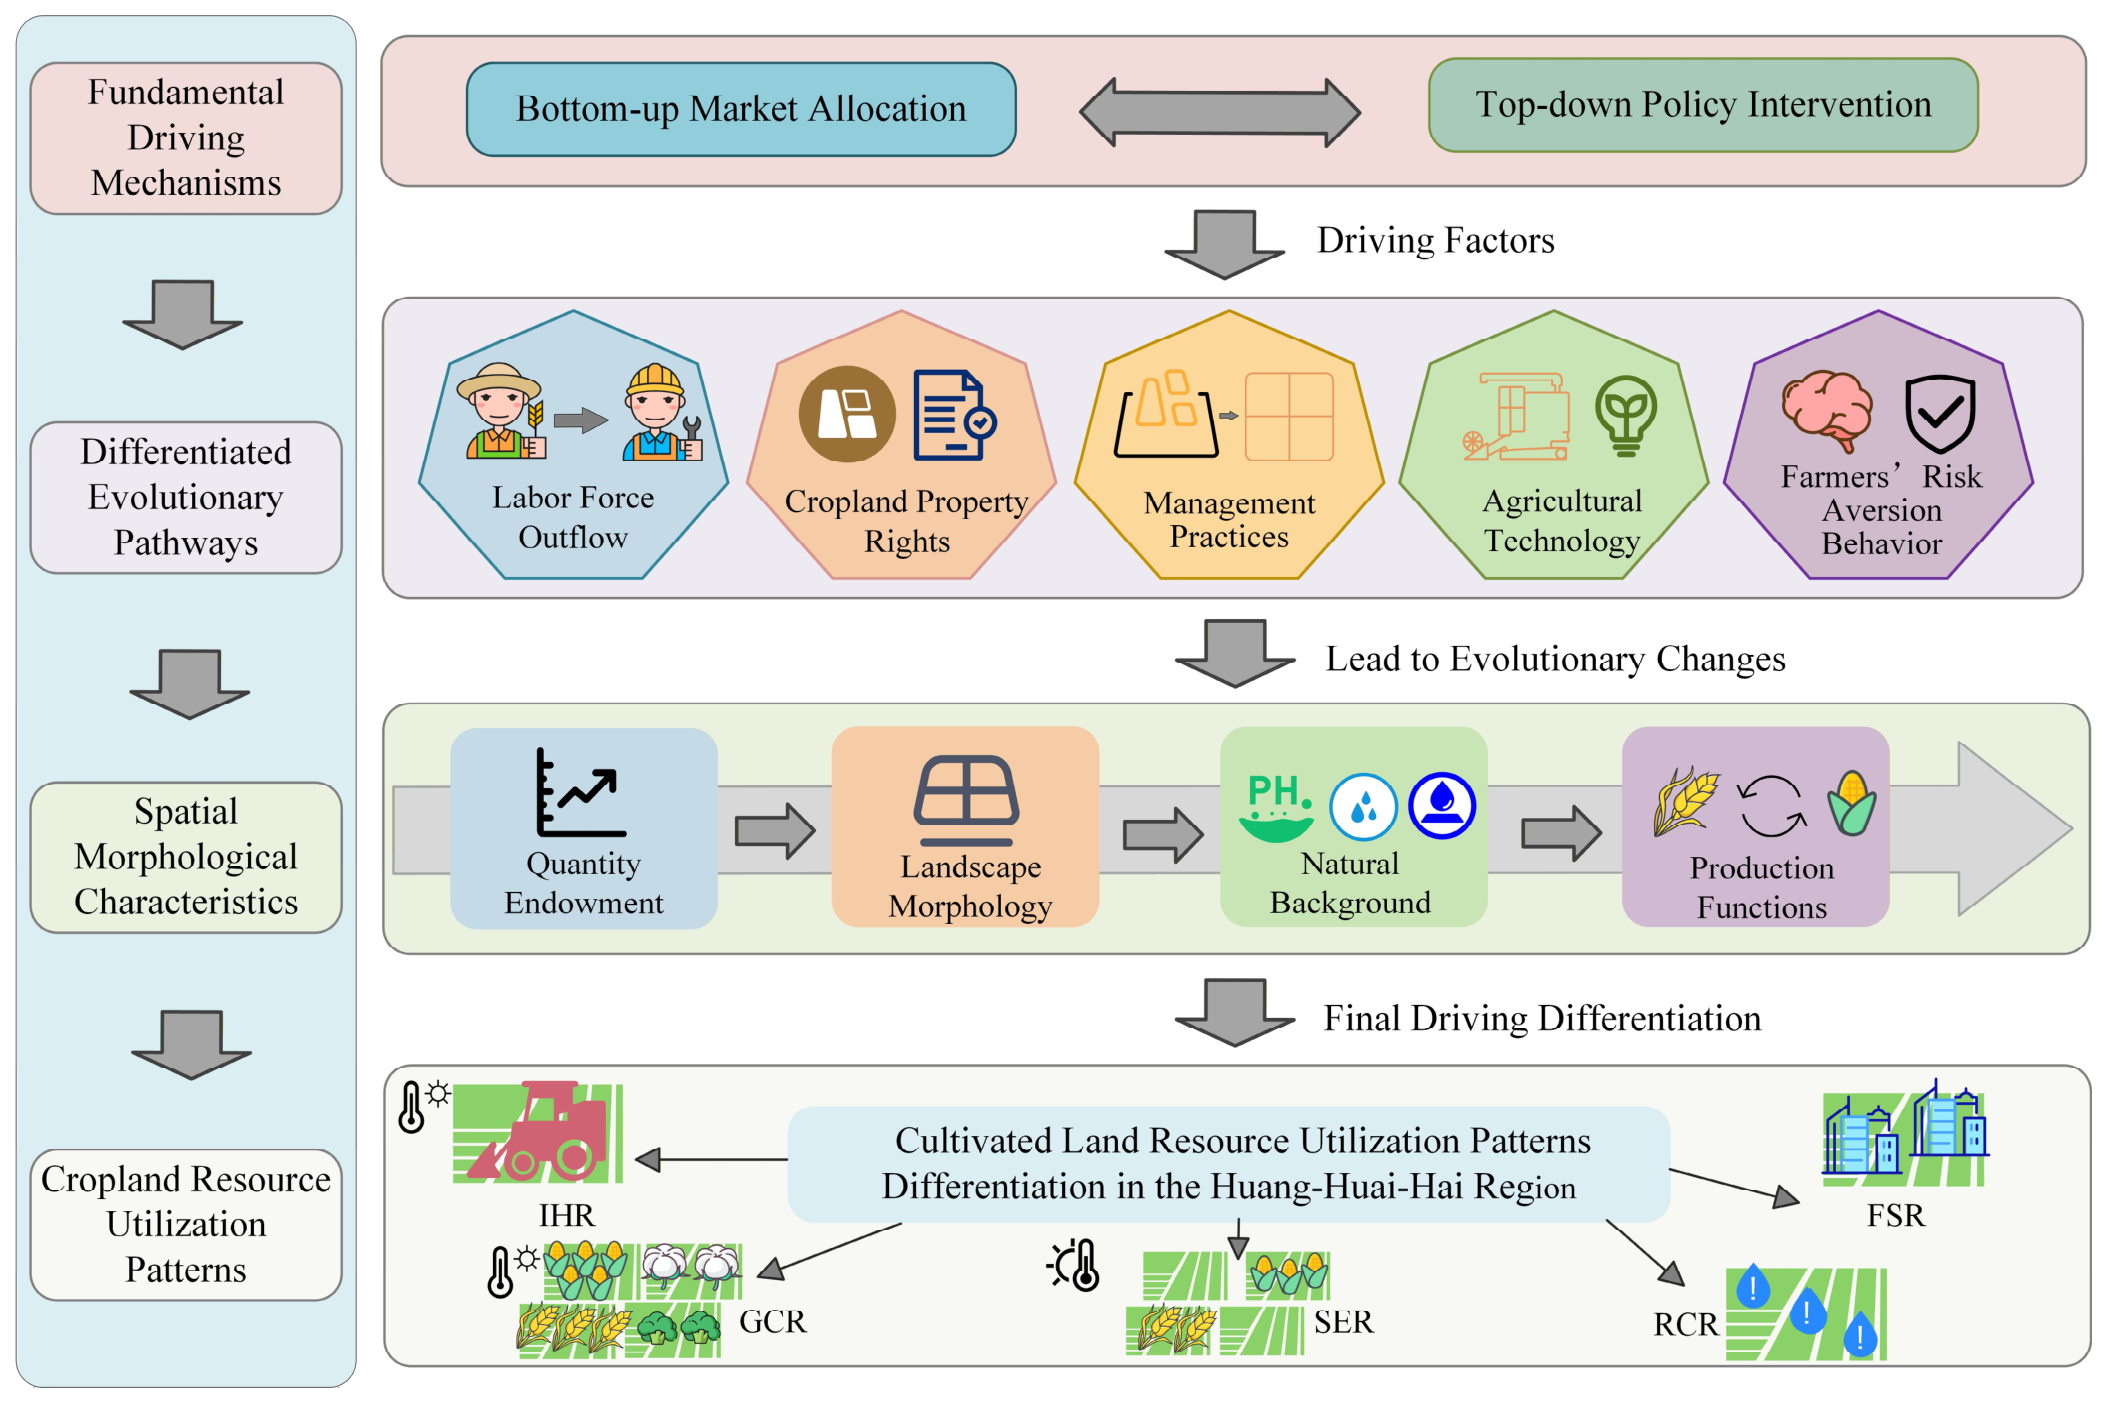
Cropland resource utilization patterns represent the general characteristics of cropland use at a given economic development stage. Their differentiation reflects the dynamic evolution of regional cropland utilization characteristics over time. This evolution primarily stems from stage-induced changes in labor outflow, property rights, management practices, agricultural technology, and farmers’ risk-averse behavior [43], with root causes lying in bottom-up market forces and top-down policy interventions [8]. Thus, the mechanisms underlying different cropland resource utilization patterns are as follows. Against the macro background of market economy transformation and land property rights system interventions, cities exhibit varying degrees of change responses in labor outflow, property rights, management practices, agricultural technology, and farmers’ risk aversion across cities in the Huang–Huai–Hai region. Spatial differences in these responses are associated with the differentiated evolution of cropland resource utilization characteristics, including quantitative endowment, landscape morphology, natural background, and productive functions, ultimately producing multiple cropland resource utilization patterns (Figure 8).

4.2. Mechanisms Underlying the Formation of Different Cropland Resource Utilization Patterns

In 1982, the Household Contract Responsibility System was formally established, shifting rural land management from collective to household-based systems. This stimulated agricultural production but also led to cropland dispersion and fragmentation. In 1992, a socialist market economy was established, driving major economic restructuring. The secondary and tertiary sectors grew, urbanization accelerated, and many rural workers migrated to cities. Under the combined influence of the rural land system and the urban–rural dual household registration system, some cities experienced unregulated cropland encroachment and unchecked urban expansion [44]. In response to the dual pressures of cropland protection and ecological conservation, the Chinese government introduced the “cropland occupation–compensation balance” policy (1997) and the “Grain for Green” policy (1999) [45]. Against this socioeconomic backdrop, five cropland resource utilization patterns had emerged in the Huang–Huai–Hai region by 2000. Due to the “agricultural tax” and the “Three Retentions and Five Consolidations policies”, local governments intervened in farmers’ cropping patterns. These farmer-levied fees were eliminated during China’s rural tax reforms after 2000, with the agricultural tax fully abolished in 2006. Combined with refined traditional farming practices, this contributed to IHR and SER becoming the dominant patterns, accounting for 63.46% of all cities in the region. In some areas, farmers expanded cash crop cultivation (e.g., cotton and oilseeds) based on traditional practices and local market demand, supplementing household food supplies and increasing income. As a result, GCR achieved high coverage during this phase. Additionally, pressures from urban expansion and natural constraints on cropland had already become apparent, giving rise to the FSR and RCR patterns. This initial framework provides an institutional baseline for understanding the spatiotemporal evolution of each pattern between 2000 and 2020. The following sections discuss the formation mechanisms and evolutionary characteristics of the five patterns.

4.2.1. Ihr

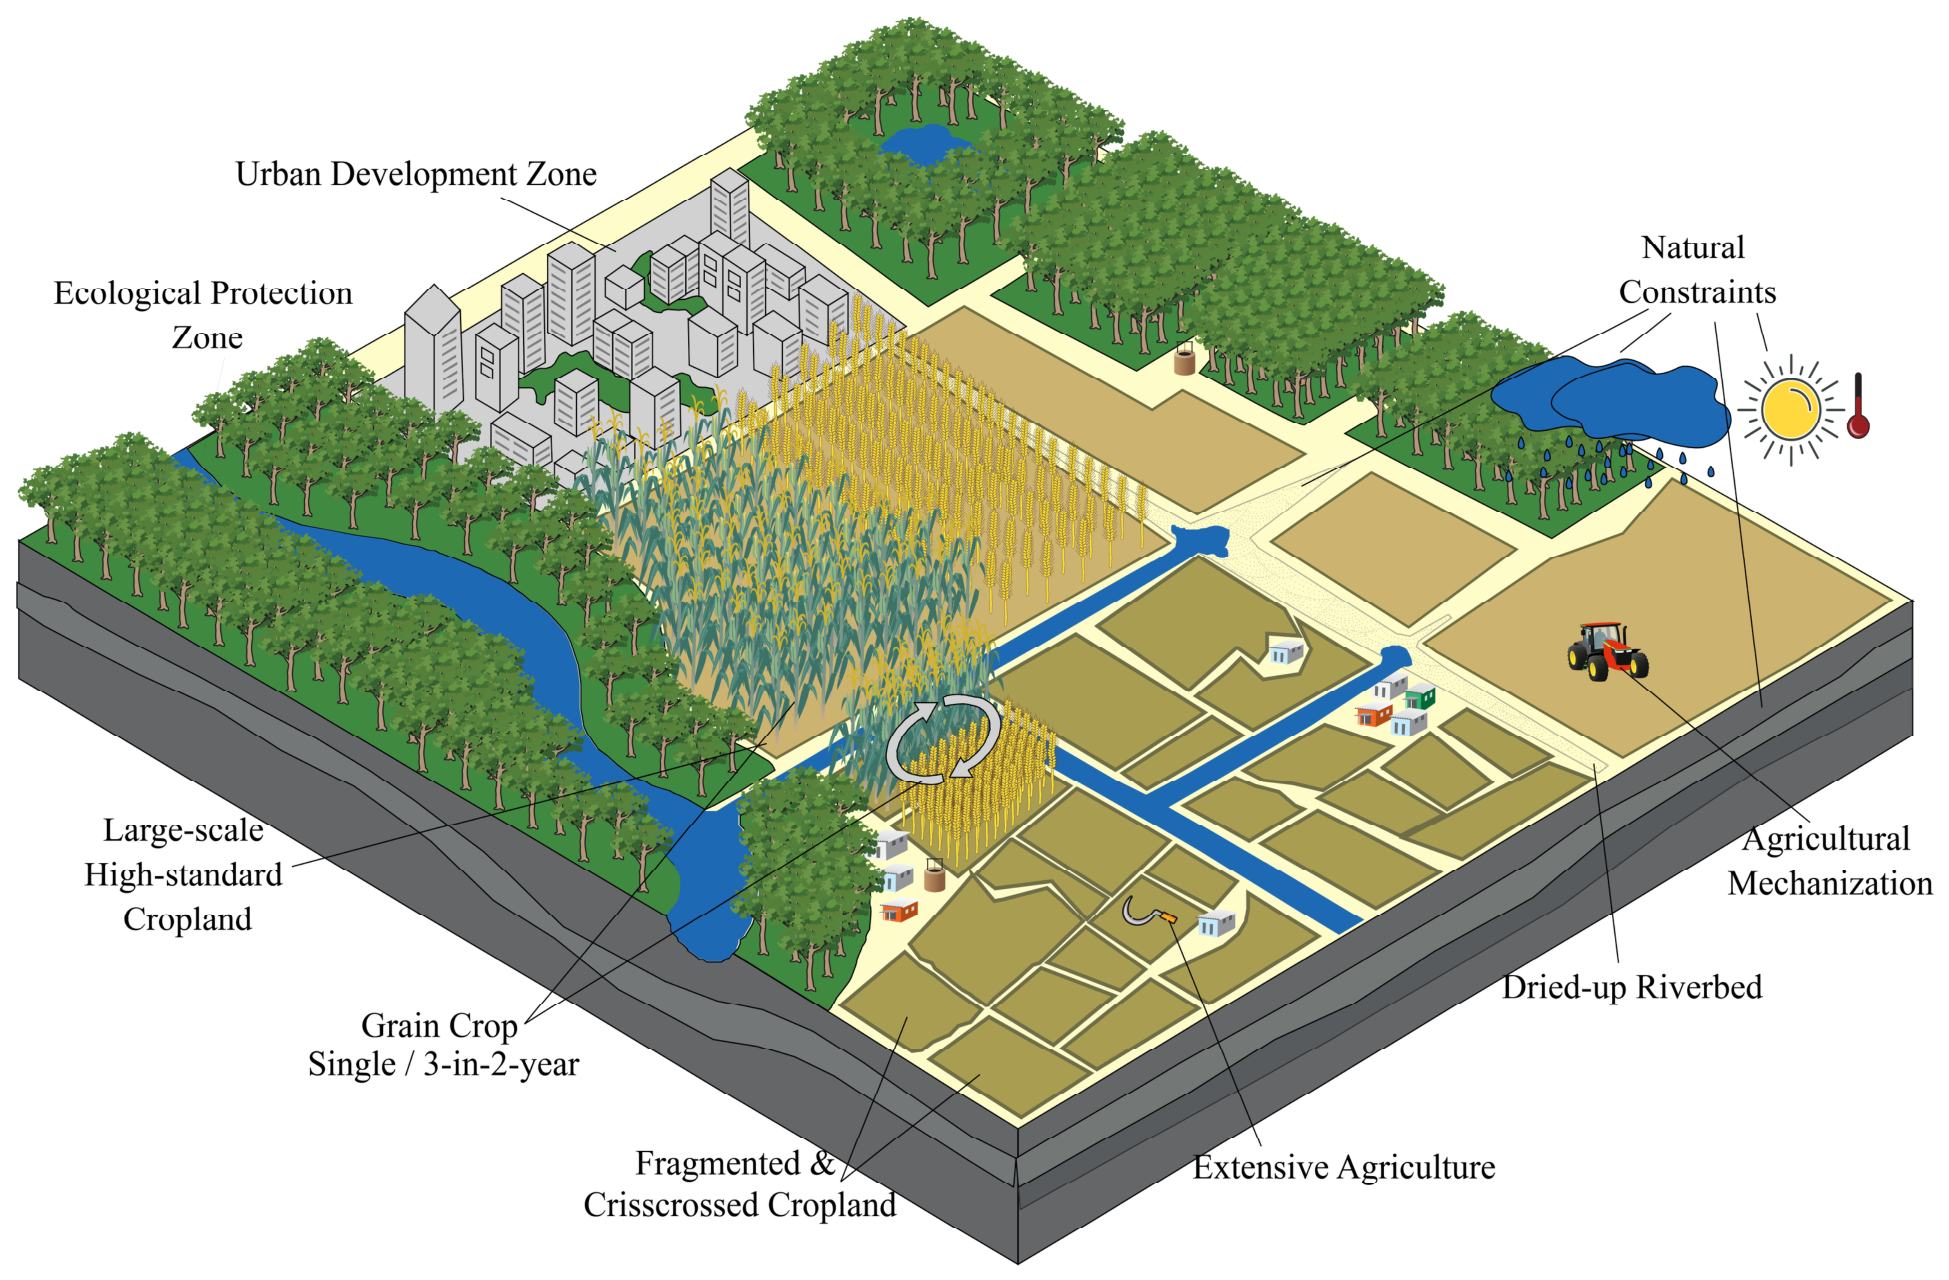
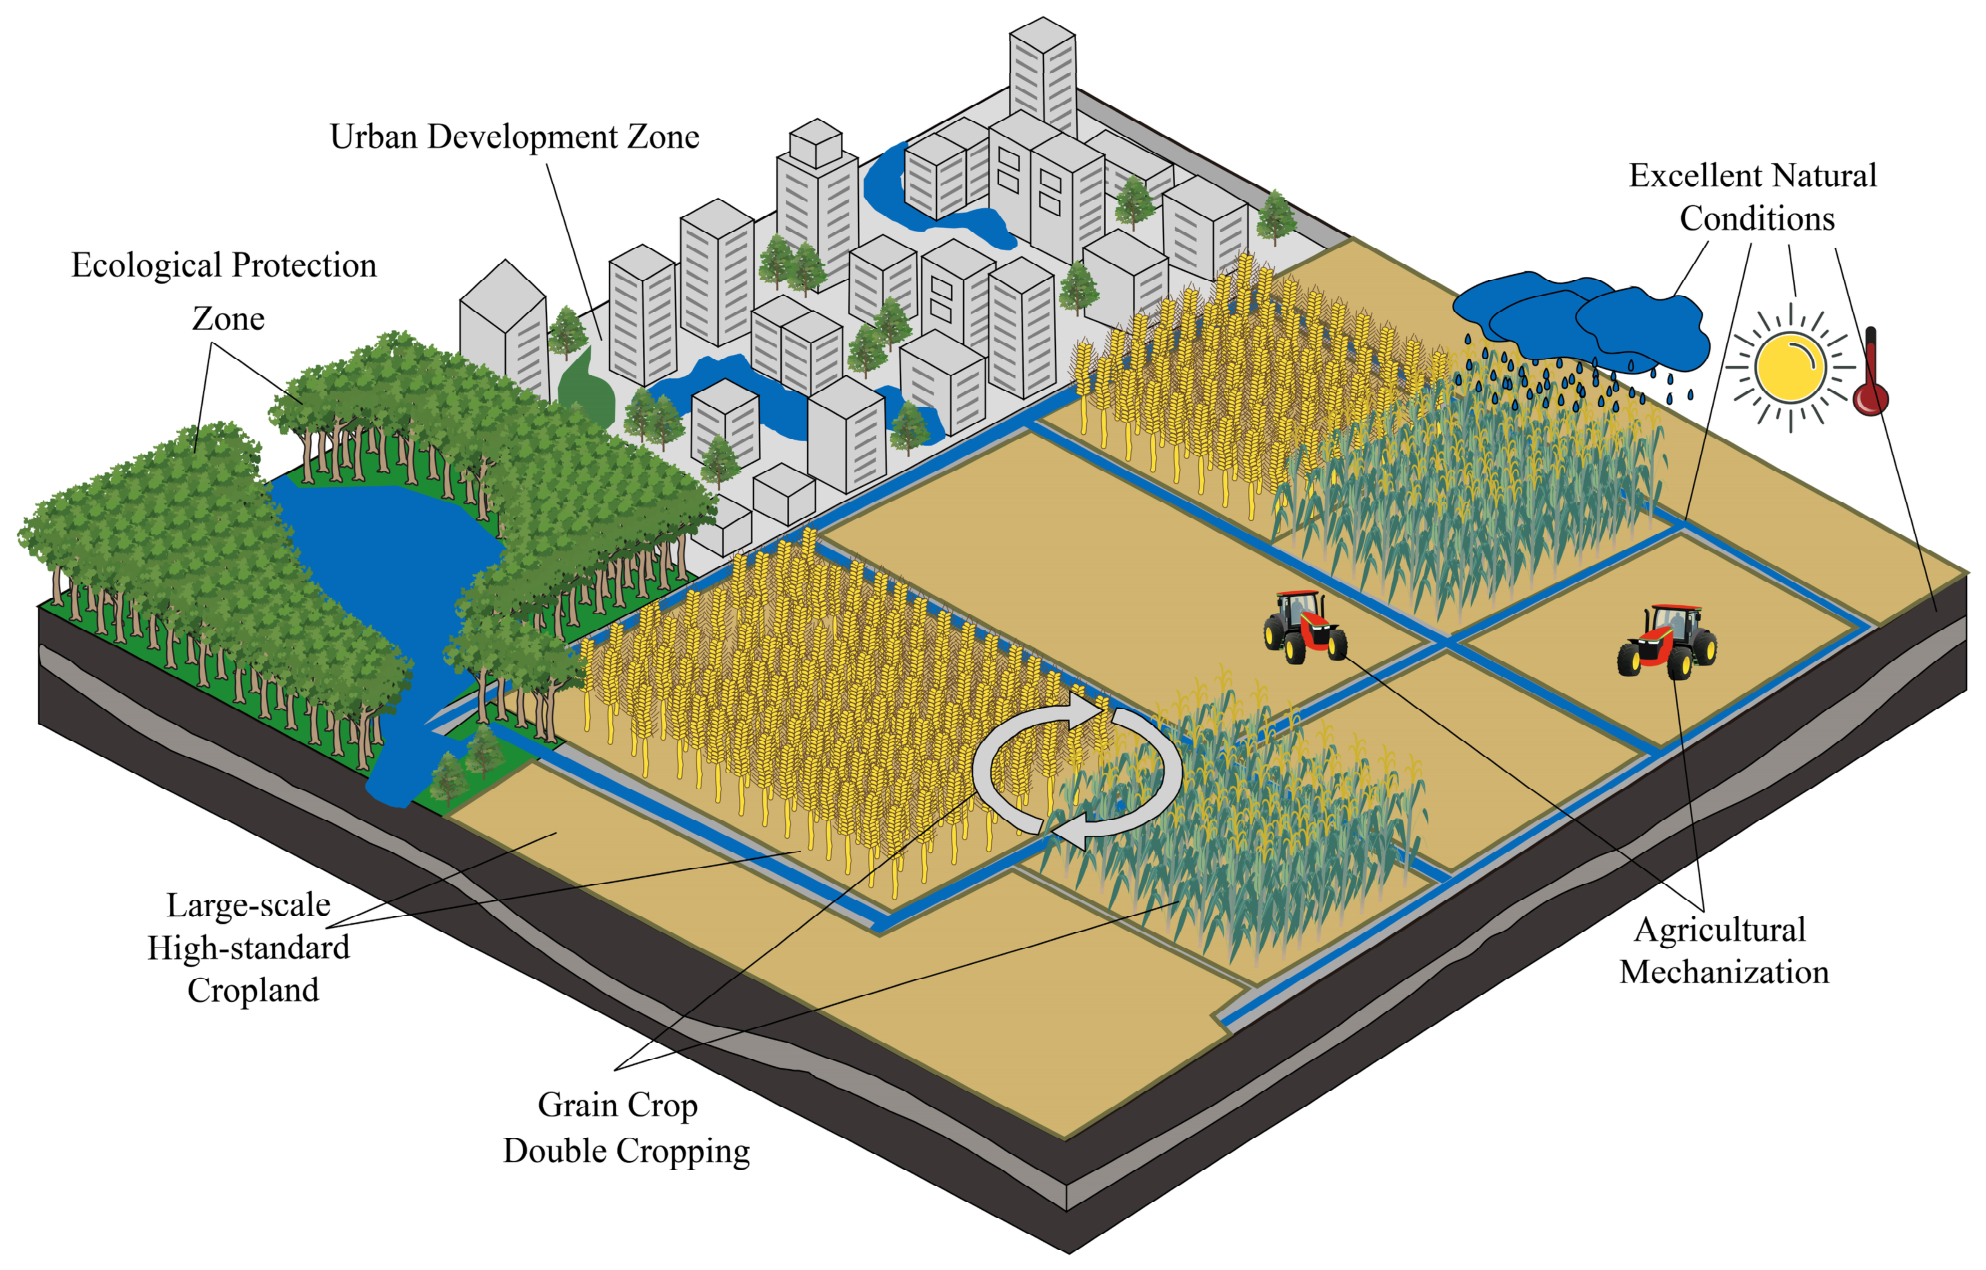
The IHR is concentrated in the hinterland of the Huang–Huai–Hai Plain, with flat terrain, abundant water resources, favorable irrigation conditions, and an excellent natural background. As a high-yield staple crop region dominated by double cropping per year, its cropping index consistently exceeds 1.8. Cropland is highly regular with minimal fragmentation, and the average CLI remains above 0.7, making it a vital grain production base (Figure 9). From 2000 to 2020, this pattern underwent a phased evolution of contraction and expansion, reflecting how labor reallocation and land management reorganization amid urbanization profoundly reshaped cropland utilization morphology.
From 2000 to 2010, rapid urbanization increased the urbanization rate from 36.22% to 49.68%, and rural laborers migrated to urban non-agricultural sectors [46]. Agricultural employment dropped from 64.38% to 48.23%, and the rural population share fell from 63.08% to 50.22% [47]. The declining agricultural labor force and deepening aging tightened labor supply in both quantity and age structure, rendering the traditional labor-intensive family farming model unsustainable. Farmers consequently reduced labor input and shifted from double cropping per year to three crops in two years or single cropping per year. Meanwhile, the land transfer market developed slowly, and limited land rent growth after the abolition of the agricultural tax hindered large-scale land transfers. Cropland remained predominantly under fragmented smallholder management, constraining large-scale agriculture [48]. With narrow profit margins from grain cultivation further weakening farmers’ willingness, the number of cities under this pattern decreased by eight during the decade, and the cropping index declined slightly.
Since 2010, the “separation of three rights” reform—a major institutional innovation in rural reform referring to ownership, qualification rights, and usage rights of residential land, of which ownership is collective, while qualification and usage rights belong to individual households— and improved grain price support policies have created new institutional conditions for pattern transformation. The reform reduced land transfer transaction costs and promoted the rapid development of family farms and farmers’ cooperatives. Through land swapping, subleasing, and leasing, new agricultural operators consolidated cropland, reducing fragmentation and forming a more contiguous and regular landscape for large-scale mechanized production [49]. By June 2020, the Ministry of Agriculture and Rural Affairs reported over one million family farms and more than 2.2 million farmers’ cooperatives nationwide. Large-scale farming reduced labor reliance and integrated capital with modern technology, shifting the agricultural technology system from labor-intensive to capital- and technology-intensive. This stabilized staple grain production, raising the average cropping index by 0.091 and increasing planting intensity. New operators mitigated natural and market risks through economies of scale and technological investment, while higher yields raised cropland value and incentivized conservation efforts such as land reclamation and high-standard farmland development. These mutually reinforcing mechanisms expanded the IHR pattern from 13 cities in 2010 to 24 in 2020, restoring it as the region’s dominant cropland-use pattern.

4.2.2. Ser

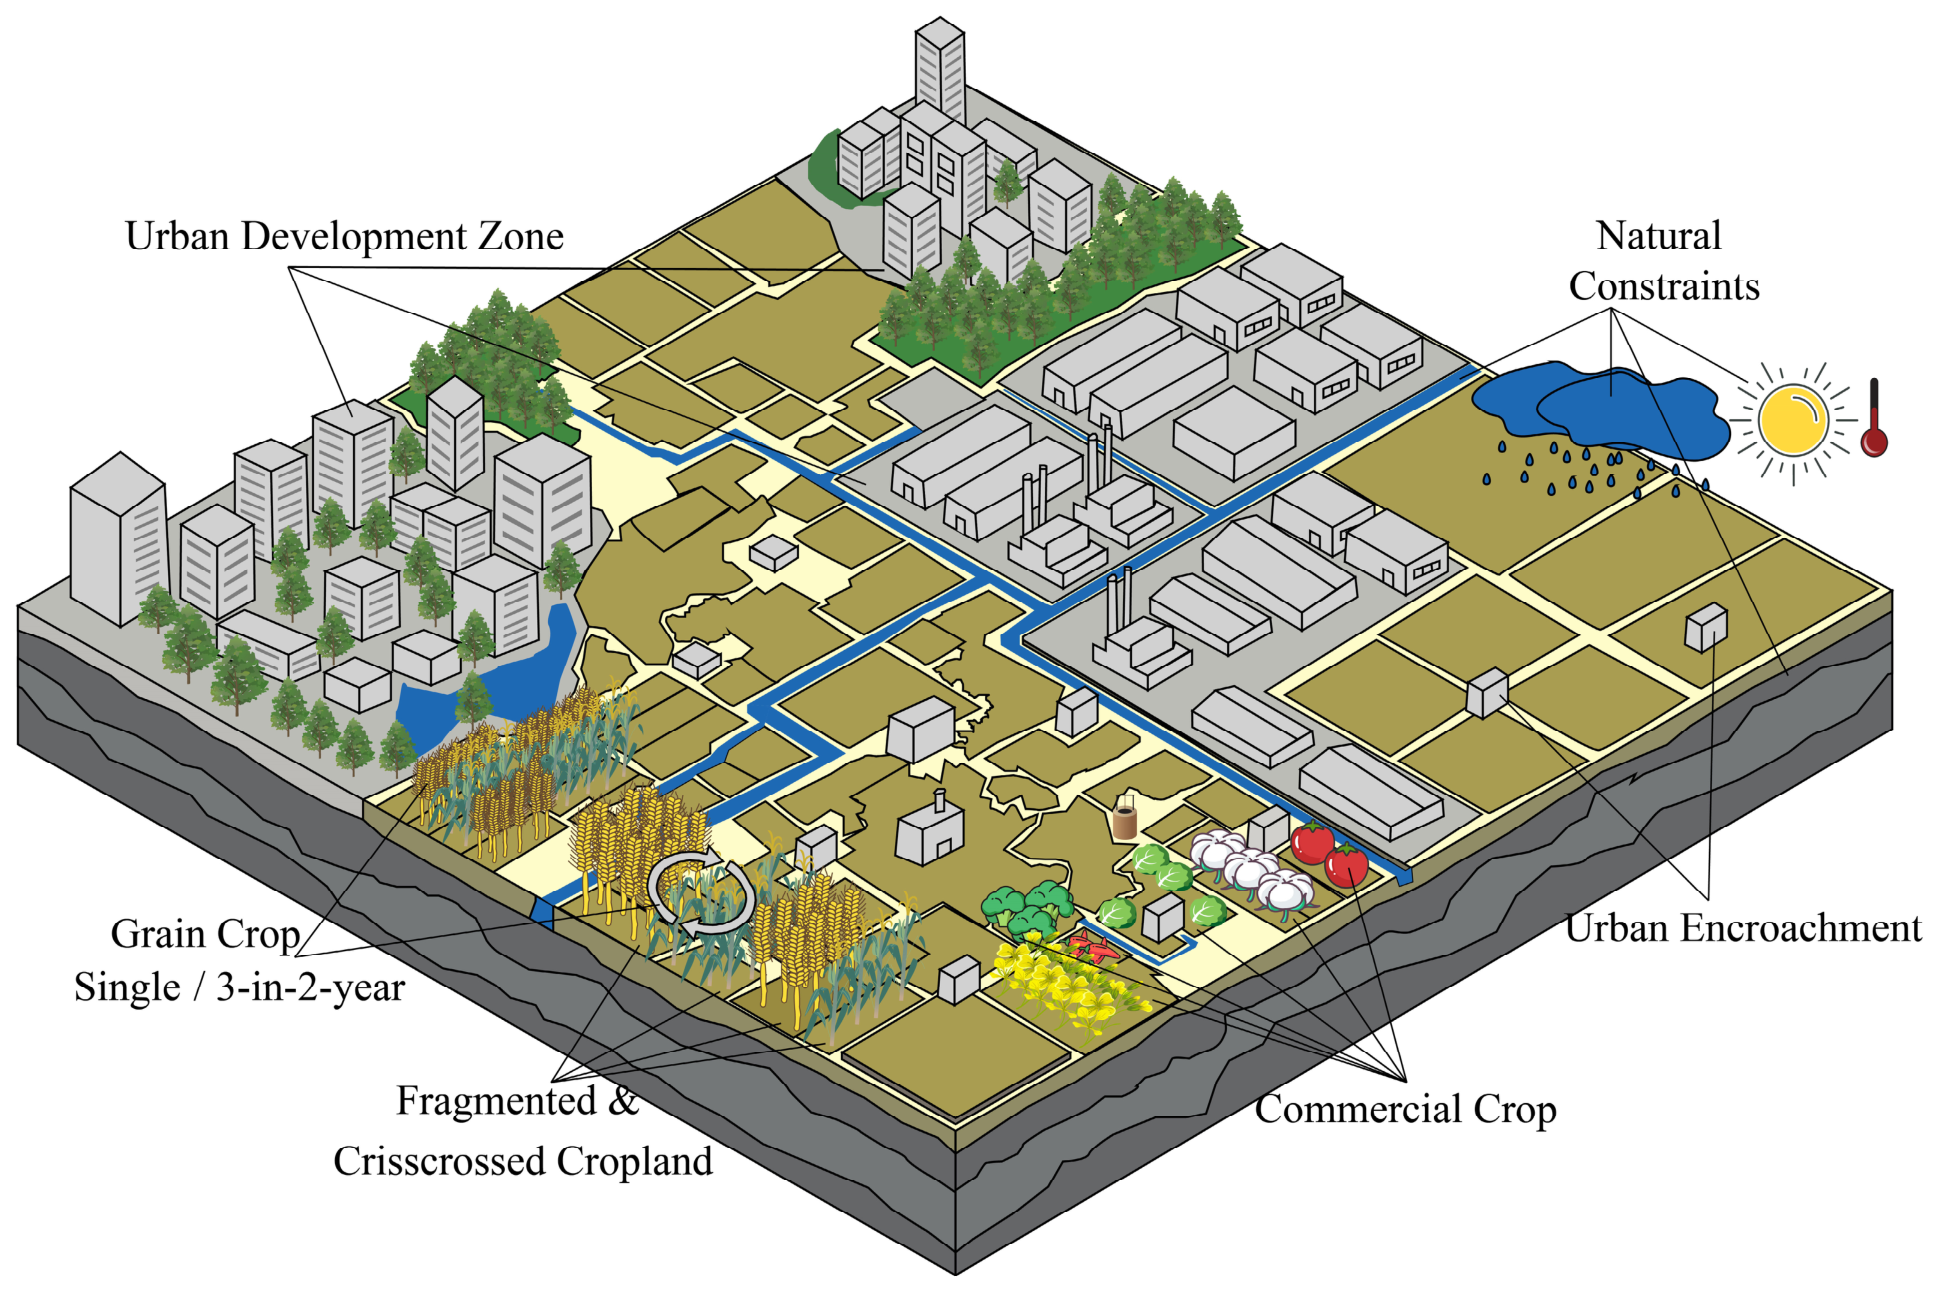
Under ecological conservation demands and land reclamation constraints, the SER pattern is somewhat curbed, and the cropland landscape remains relatively fragmented. Regional natural background conditions, including precipitation, irrigation, and soil fertility, are limited, and cropland-use intensity is relatively low. The average comprehensive landscape index in 2000 was the lowest among all patterns at 0.55, and the average cropping index in 2020 was 1.46. These conditions have formed a stable-yield cropping pattern dominated by staple crops such as wheat and maize (Figure 10).
Similar to the IHR, this region experienced a massive outflow of working-age adults during urbanization, leaving elderly residents as the primary agricultural labor force. However, poorer natural background conditions and higher cropland fragmentation, unlike the IHR, constrained mechanization and large-scale farming. Under the dual pressures of low grain returns and limited labor capacity from an aging population, farmers’ willingness to cultivate declined, forcing much cropland into extensive management or abandonment. The cropping index fell from 1.58 in 2000 to 1.46 in 2020, and fallow land in Henan, Shandong, and Hebei alone reached 8.144 × 10⁴ hm2 in 2017 [50]. Although this situation should theoretically have facilitated land transfer and scale operations, strict rural land regulations, high fragmentation, and natural constraints deterred large-scale operators from entering, creating a supply–demand mismatch in the rental market. Meanwhile, elderly farmers’ emotional attachment to land and need for retirement security led them to prefer self-cultivation over transfer [51,52]. Consequently, land transfers remained at the level of verbal agreements among relatives and neighbors, while market-based, contract transfers stayed low, hindering large-scale land consolidation. Between 2000 and 2020, the average CLI for this pattern increased by only 0.011, and cropland remained relatively fragmented and scattered. Constrained by traditional mixed farming, outdated technology, natural limits, and labor shortages, local farmers opted for low-input, easy-to-manage, stable-yield grain crops to mitigate economic risks. This shaped the pattern’s utilization characteristics: stable production while balancing ecological conservation and the maintenance of cropland functions.
This pattern also serves as a transitional phase in regional cropland-use dynamics. From 2000 to 2010, seven IHR cities transitioned to this pattern due to extensive farming practices, resulting in an average CLI increase of 0.044. From 2010 to 2020, eight cities transitioned out of this pattern due to the adoption of large-scale farming and upgraded agricultural technology, with an average CLI decrease of 0.033. This dynamic indicates that cities with better natural conditions can transition toward the IHR pattern through institutional reform and technological progress, while those with stronger natural constraints remain in the SER pattern. This reflects the buffering and screening function of this transitional phase in regional agricultural transformation.

4.2.3. Gcr

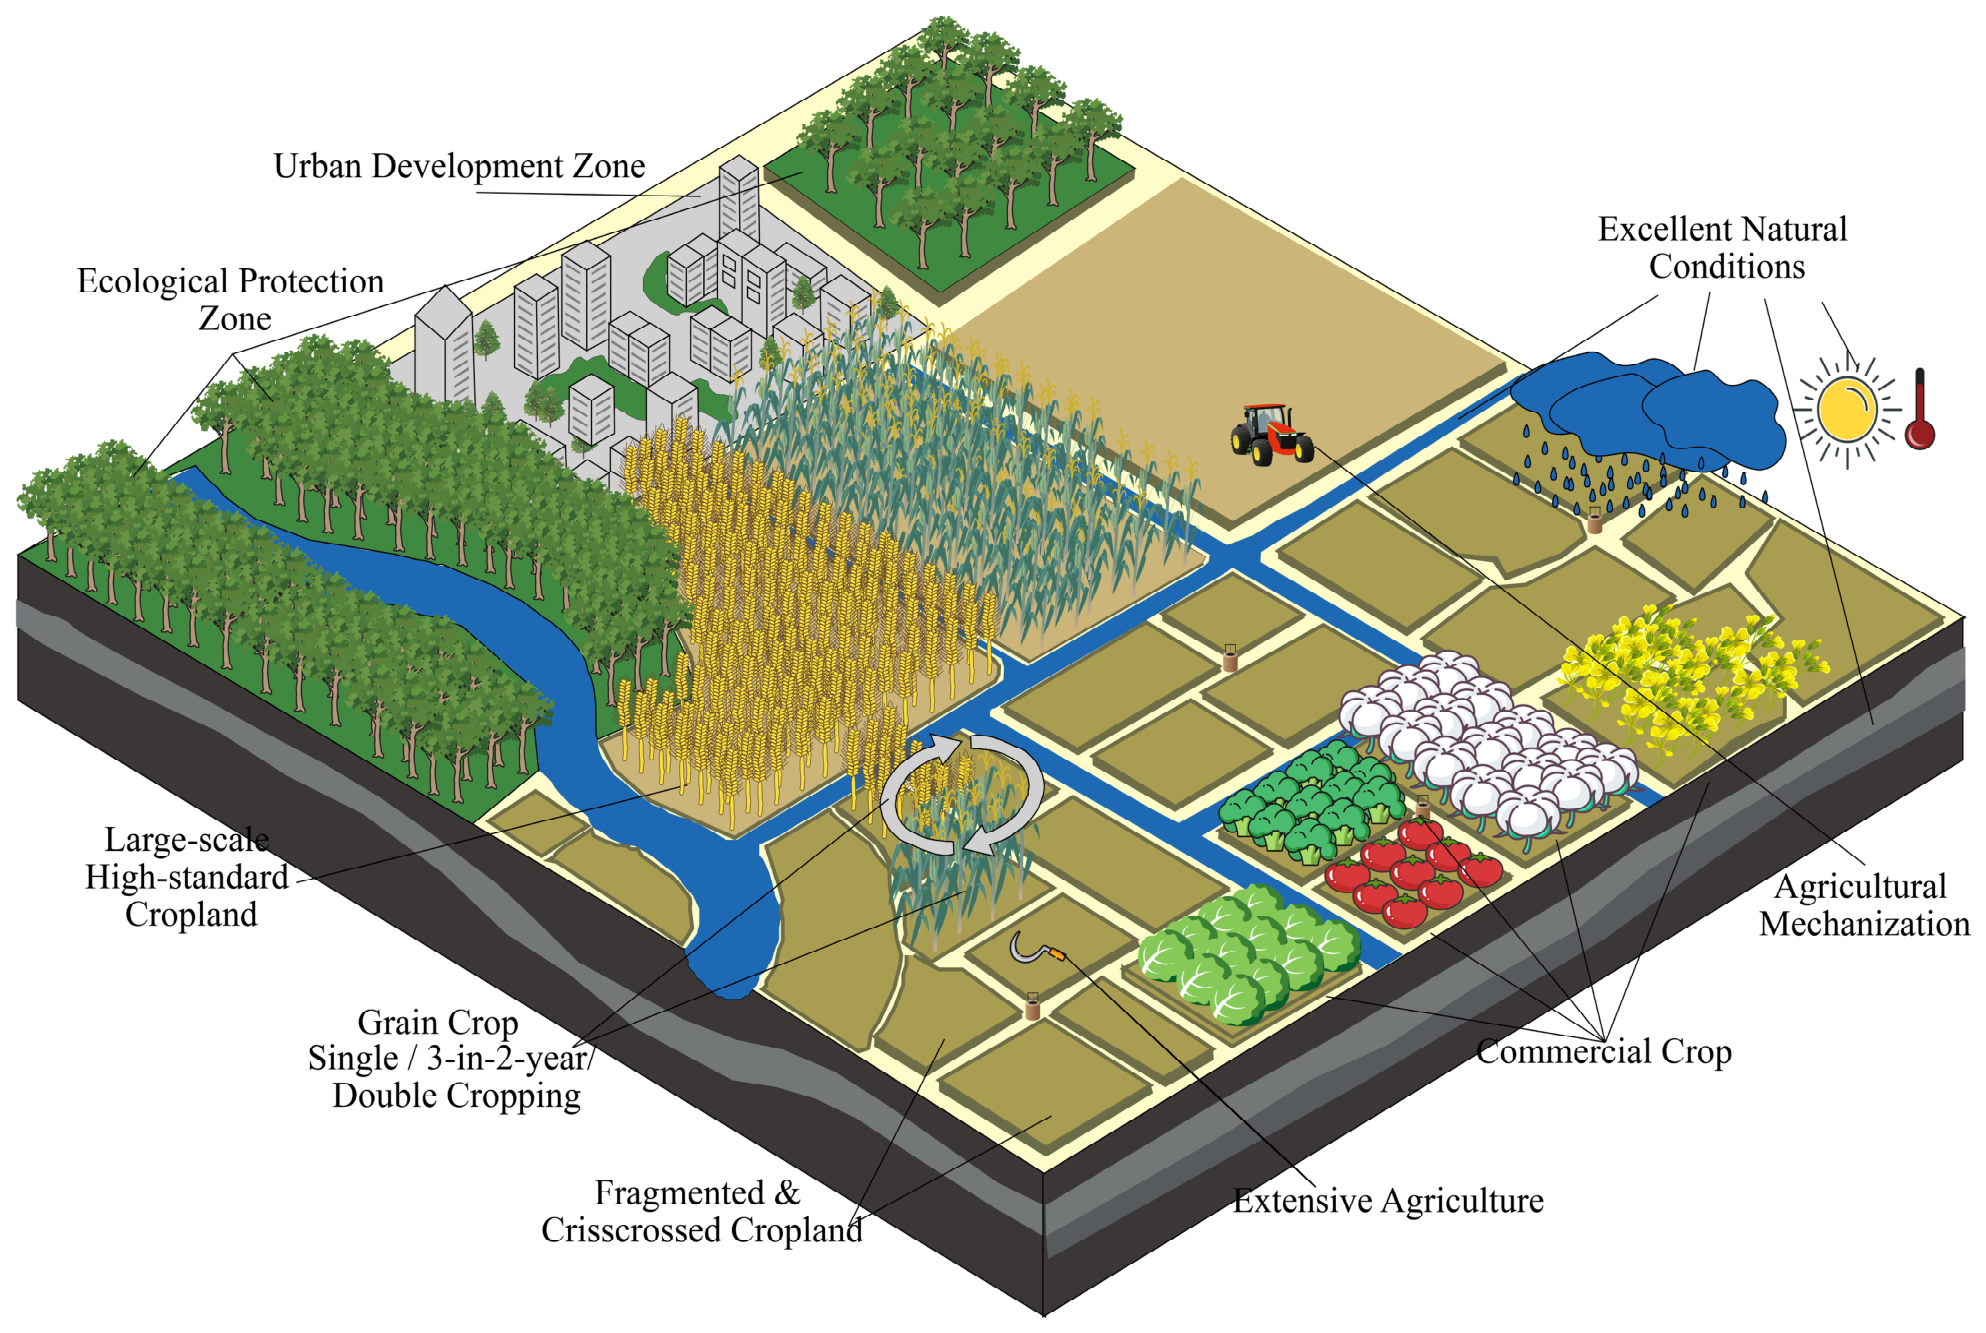
The GCR is concentrated in areas of the Huang–Huai–Hai region with notable locational advantages and convenient transportation. Its complex natural conditions support mixed grain and cash crop cultivation, but cropland plots are fragmented. In 2010, its average CLI peaked at 0.569—a relatively low level. This pattern represents an effort to maximize efficiency in agricultural modernization, showing synergy between intensification and diversification (Figure 11).
As agricultural markets became highly open, price signals drove resource allocation, and price fluctuations with diversified demand prompted farmers to weigh trade-offs between grain and cash crops. After China joined the WTO in 2001, international market prices for cash crops such as cotton and oilseeds exerted pressure on domestic markets, increasing the uncertainty of cash crop returns [53,54]. Compounded by labor outflows and older farmers’ difficulty mastering precision cash-crop techniques, cities diverged: those adjacent to consumer markets or with export channels maintained mixed grain–cash cultivation, while those lacking such conditions shifted toward staple crop production [55]. As a result, four cities exited this pattern, and the average cropping index decreased by 0.05; although some cities entered due to neighboring consumption demand or agricultural export expansion, this was insufficient to reverse the overall contraction. After 2010, the agricultural technology system transformed. Modern facility agriculture (e.g., greenhouses and drip irrigation) gradually became widespread, and smart farming and branding were introduced to enhance added value. Cropland property rights transfers also became more active, as some elderly laborers exited direct production through land transfer and became agricultural industrial workers, while land gradually concentrated with operators seeking high added value. Cities with moderately suitable natural conditions, advantageous locations, and strong capacity to absorb capital and technology achieved a transition toward specialized high-value cultivation through facility agriculture, thereby remaining in the GCR pattern. After the Rural Revitalization Strategy was introduced in 2017, some cities leveraged local resource endowments to cultivate distinctive agricultural products, driving rural economic revitalization through branding and scale expansion [56], which provided favorable policy support for retaining or entering this pattern. Cities lacking these conditions gradually exited, resulting in a predominance of moderately suitable cities by 2020. These differentiated pathways enabled the pattern to maintain dynamic renewal and structural transformation despite an overall decline in cropland quantity. However, facility agriculture construction in retained cities limited the improvement of cropland-use intensity and landscape patterns; in 2020, the average cropping index and average CLI reached their lowest levels during the study period: 1.57 and 0.557.

4.2.4. Fsr

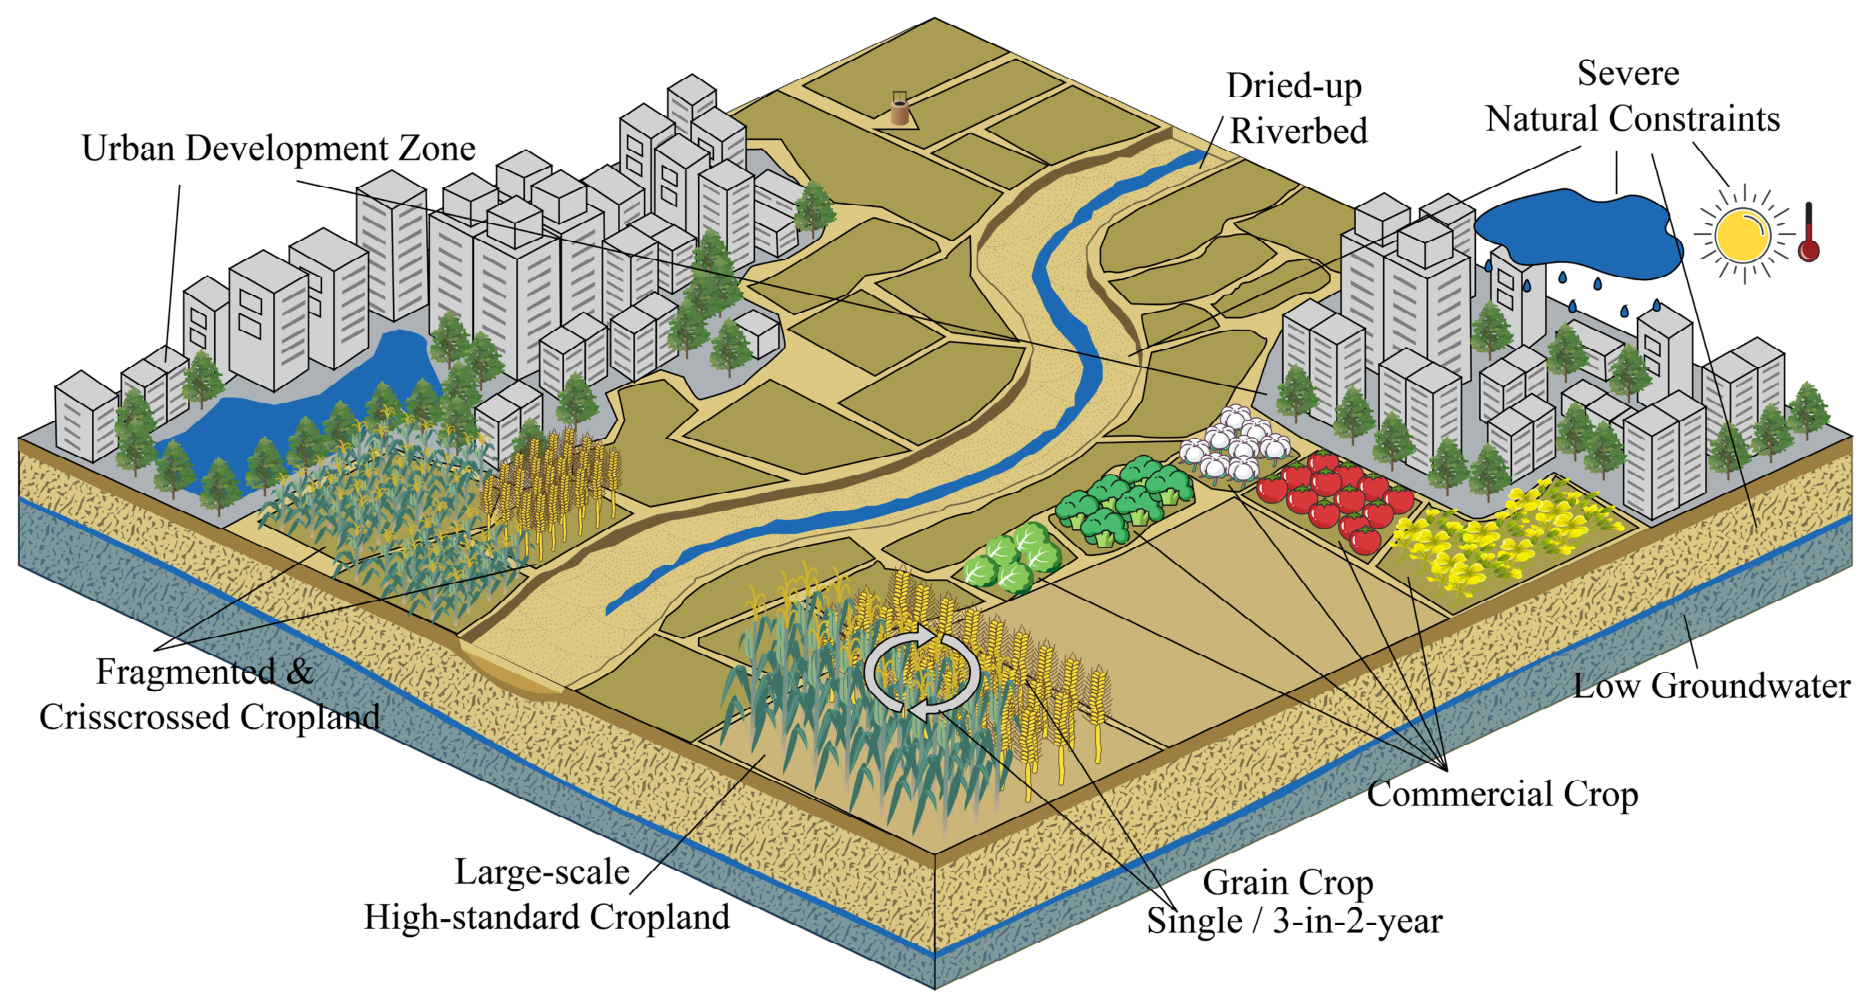
The FSR pattern is mainly distributed in areas under sustained pressure from urbanization and construction land expansion. The cropland area continued to shrink during the study period; in Beijing, the net conversion of cropland to construction land accounted for 7.71% of its total area. Natural background conditions impose certain constraints, allowing flexibility between a food-crop-only cropping structure and a food–cash crop mix. However, cropland-use intensity remains low, with an average cropping index of only 1.28 in 2020. Overall, this pattern exhibits functional degradation under urbanization stress (Figure 12).
Against the backdrop of urbanization and industrialization, the extremely high non-agricultural returns from construction land have driven economic growth [57,58]. However, the land expropriation system under the urban–rural dual structure placed cropland at sustained risk of occupation, resulting in a cumulative cropland reduction of 5211.04 km2 from 2000 to 2020 and further accelerating labor out-migration through a siphon effect [59]. Urban expansion encroached on fragmented suburban cropland and complicated the boundaries of remaining parcels; landscape fragmentation showed no substantial improvement, with an average CLI change of less than 0.01. For farmers, uncertainty over land expropriation weakened expectations of long-term returns, reducing continuous investments in soil improvement and facility maintenance. Production practices tended toward extensive management or even abandonment, and the cropland transfer market stagnated, hindering the formation of large-scale farming. To avoid sunk costs, farmers reduced their willingness to cultivate and switched to staple crops with lower input requirements and stable returns, causing the average cropping index to drop sharply from 1.548 in 2000 to 1.285 in 2020. Shifts in urban functional positioning further weakened the status of agriculture: Beijing and Langfang strengthened the capital’s political functions, Qingdao shifted to tourism and other low-land-consumption, high-value industries, and Linyi responded to cropland stress through policy measures and land consolidation. In short, this pattern gradually shifted from agricultural production dominance toward the coexistence of multiple functions, as the production function of cropland relatively weakened while living and ecological functions became increasingly prominent.

4.2.5. Rcr

RCR is a region constrained by a barely adequate natural baseline and relatively limited cropland resources (Figure 13). Its evolution clearly demonstrates the dominant role of top-down policy regulation under such natural constraints. This pattern primarily encompasses Hengshui, Xingtai, and Shijiazhuang in Hebei Province. Constrained by natural conditions of excessive groundwater extraction and insufficient precipitation, the region faces prominent water supply–demand contradictions; from 2000 to 2012, the growth rate of groundwater extraction in Xingtai City even exceeded the increase in precipitation, keeping the regional cropland suitability rating overall at a barely adequate level [60]. Under the impact of urbanization expansion, cropland area decreased by 1389.49 km2 during the study period. The regional natural baseline constraints have suppressed the regulatory function of market mechanisms. Agricultural economic returns are low, the land transfer market lacks attractiveness, cropland is difficult to concentrate toward new agricultural operators, transfer scale is limited, and large-scale operation is difficult to achieve. This means that the institutional window that should have been brought by labor out-migration in this region, due to low capital entry willingness and underdeveloped transfer markets, has not been effectively transformed into land allocation optimization, and improvements in cropland utilization depend on the intervention of external forces. Therefore, regional development is highly dependent on top-down large-scale infrastructure investments, such as the South-to-North Water Diversion Project and land consolidation projects, to overcome natural disadvantages [61]. Additionally, agricultural economic development exhibits a passive characteristic of conforming to national governance logic and macro-control policies. Despite these constraints, the region’s average CLI and cropping index increased by 0.04 and 0.15, respectively, during the study period. This indicates that, driven by sustained policy-led external inputs, property rights consolidation, and infrastructure improvements, cropland landscape and cropping conditions have steadily improved, resulting in a yield-oriented cropping system. In summary, through external engineering investments, this pattern has achieved steady improvements in farmland conditions and continues to serve as a cornerstone for regional food security.

4.3. Summary of General Characteristics of Different Cropland Resource Utilization Patterns

Based on decision tree classification results and classification rules, this study analyzed the formation mechanisms and spatiotemporal evolution characteristics of different cropland resource utilization patterns. The comprehensive characteristics of these patterns in the Huang–Huai–Hai region are summarized as follows:
(i)
IHR: Cities of this type balance urban development with food security and ecological conservation. Their concentrated and well-organized farmland parcels are well suited for high-level, large-scale, mechanized agriculture. Abundant precipitation, irrigation resources, and favorable sunlight and heat conditions enable double cropping per year, with crop rotation primarily consisting of wheat and corn or rice and corn. The region has significant grain production potential.
(ii)
SER: These cities are primarily characterized by EOCs and ROCs. Immature land transfer systems hinder large-scale, market-driven consolidation, leaving a predominantly smallholder agricultural economy. Constrained by natural conditions, agricultural production concentrates on staple crops with single cropping or three crops in two years, employing extensive practices to ensure stable grain yields.
(iii)
GCR: Cities in this category are primarily EOCs and ROCs. They face natural constraints and fragmented cropland, while growing a diverse range of crops that are highly susceptible to market fluctuations.
(iv)
FSR: Cities of this type are geographically dispersed, with significant cropland conversion to construction land leaving parcels fragmented and scattered. Natural suitability is rated as moderately or conditionally suitable. Urban development priorities vary, focusing on stable production models such as triple cropping in two years or single annual cropping. Crops primarily consist of food crops combined with cash crops, single-season food crops, or double-season food crops.
(v)
RCR: Cities of this type are stable, characterized by LCCs and ROCs, but face significant resource shortages, including limited precipitation and insufficient irrigation resources.

5. Conclusions

This study examines the spatial and temporal evolution of cropland resource utilization patterns in 52 prefecture-level cities across the Huang–Huai–Hai region from the perspectives of CLDT and CLRT. It analyzes these patterns across four dimensions—quantitative endowment, landscape morphology, natural background, and productive functions—and classifies them into five cropland resource utilization patterns using the CART algorithm: IHR, SER, GCR, FSR, and RCR. The spatiotemporal evolution of the five patterns exhibits distinct phased characteristics. The study finds that the spatiotemporal evolution of cropland resource utilization patterns from 2000 to 2020 exhibited distinct stage-specific characteristics. From 2000 to 2010, large-scale non-agricultural labor transfer was associated with the contraction of IHR and the expansion of SER, presenting regressive evolution. After 2010, with the advancement of the “separation of three rights” reform, land transfer and large-scale farming accelerated, driving some SER cities to transition to IHR, GCR to transform toward quality orientation, FSR to show clear functional differentiation, and RCR to achieve limited improvement in land-use efficiency. The fundamental driving force of this evolution lies in the interaction between market mechanisms and policy interventions: market forces prompt adjustments in farmers’ planting decisions through price signals and non-agricultural employment opportunities, but their direction of action is modulated by land property rights institutions and supporting policies. The varying combinations of these two forces largely explain whether cities can achieve the transformation of cropland-use patterns through land transfer and large-scale farming under the impact of labor out-migration, which is also key to understanding the spatial differentiation of cropland-use patterns in the Huang–Huai–Hai region. Accordingly, cropland protection policies should shift from uniform area control to differentiated measures: IHR should further consolidate production capacity through quality and efficiency enhancement of high-standard farmland and irrigation infrastructure upgrading; SER needs to alleviate fragmentation constraints through land consolidation and voluntary land swapping and merging; GCR could strengthen market risk prevention and brand-oriented development through agricultural insurance and regional public brand building; FSR strictly curb cropland loss through strict control of permanent basic farmland and enforcement of the occupation–compensation balance; and RCR should improve resource use efficiency by focusing on water-saving irrigation promotion and transformation of low- and medium-yield farmland. This study deepens theoretical understanding of the formation mechanisms of cropland resource utilization patterns. It reveals the fundamental evolutionary tendencies of agricultural spatial organization—from dispersed and extensive to scaled, intensive, and functional—against the backdrop of rapid urbanization. The findings provide a scientific basis for formulating differentiated cropland protection policies and selecting agricultural transformation pathways, while offering a representative case study from the Huang–Huai–Hai Plain for understanding the synergy between food security and agricultural spatial optimization.
Due to limitations in the author’s expertise, data availability, and study timeline, this study has the following limitations: (i) The mechanism analysis focuses on qualitative interpretation of pattern formation processes without separately conducting quantitative analysis of driving factors. (ii) Limited by the lack of annual observational data for soil properties, the natural background conditions could only be incorporated into the analysis as static background variables, and their own changes and effects on pattern evolution could not be fully characterized. (iii) Affected by the asynchronous updating of statistical and remote sensing data in recent years and difficulties in obtaining data for some key indicators, the study period ends in 2020 and has not been extended to 2025. Future research could further quantify differences among patterns in ecosystem service functions, such as carbon sequestration, water conservation, and soil retention, evaluate their trends and laws of pattern differentiation at different stages, and link cropland utilization patterns with ecological effects. These approaches would provide references for cropland protection pathways that enhance regional ecological functions while maintaining grain production capacity.

Author Contributions

Conceptualization and formal analysis, Y.P., H.L., and M.M.; data curation, Y.P., J.L., and Y.H.; visualization, J.L. and Y.H.; methodology, software and writing—original draft, Y.P.; writing—review and editing, M.M., H.L., and C.M.; supervision, M.M. and C.M. All authors have read and agreed to the published version of the manuscript.

Funding

This study was financially supported by the National Key R&D Program of China (grant number: 2024YFD1600700), the National Natural Science Foundation of China (grant numbers: 42101285 and 42201051), the General Project (grant number: 2023M730945) and Postdoctoral Fellowship Program (grant number: GZB20240196) of the China Postdoctoral Science Foundation (CPSF), the Key Scientific Research Project of Colleges and Universities in Henan Province (grant numbers: 24A170009 and 23A170017), the Henan Province Science and Technology Attack Project (grant numbers: 242102321120 and 242102320234), the Young Elite Scientists Sponsorship Program (grant number: 2025HYTP007) by the Henan Association for Science and Technology, China, and the Henan Provincial Postdoctoral Research Project (grant number: HN2025110).

Data Availability Statement

The data and related materials are available from the corresponding author upon reasonable request.

Conflicts of Interest

The authors have no relevant financial or non-financial interests to disclose.

References

  1. Jiang, G.; Wang, M.; Qu, Y.; Zhou, D.; Ma, W. Towards cultivated land multifunction assessment in China: Applying the “influencing factors-functions-products-demands” integrated framework. Land Use Policy 2020, 99, 104982. [Google Scholar] [CrossRef] [Scilit]
  2. Tu, Y.; Wu, S.; Chen, B.; Weng, Q.; Bai, Y.; Yang, J.; Yu, L.; Xu, B. A 30 m annual cropland dataset of China from 1986 to 2021. Earth Syst. Sci. Data 2024, 16, 2297–2316. [Google Scholar] [CrossRef] [Scilit]
  3. Song, W.; Pijanowski, B.C. The effects of China’s cultivated land balance program on potential land productivity at a national scale. Appl. Geogr. 2014, 46, 158–170. [Google Scholar] [CrossRef] [Scilit]
  4. Hu, Q.; Chen, Y.; Hu, J.; Cai, Z.; Wang, Z.; Yin, G.; Xu, B. A novel framework to integrate cropland quantity and quality from pixel to county level: Implications for requisition–compensation balance of farmland policy in China. Land Degrad. Dev. 2023, 35, 1155–1167. [Google Scholar] [CrossRef] [Scilit]
  5. Wang, H.; Chai, C.; Niu, W.; Qi, Y.; Zheng, W.; Kong, X.; Zhang, B. Cropland displacement results in changes in cropland site conditions and quality in China during 1990–2020. Agric. Syst. 2025, 227, 104362. [Google Scholar] [CrossRef] [Scilit]
  6. Bai, X.; Zhang, J.; Lyu, Y.; Fleskens, L.; Cui, Z.; Liu, X.; Zeng, X.; Ritsema, C.J.; Zhang, F. Policy-driven improvements in cultivated land productivity: Changed determinants in Huang-Huai-Hai Plain, China. J. Environ. Manag. 2025, 391, 126460. [Google Scholar] [CrossRef] [Scilit]
  7. Weng, H.; Chang, Y.; Dai, Y.; Zhang, L.; Zhang, D.; Huang, X.; Liu, Y.; Guan, Y.; Heiskanen, J. County-level cropland fragmentation in China (1990–2023): A bidirectional transformation perspective. Environ. Res. Lett. 2025, 20, 104021. [Google Scholar] [CrossRef] [Scilit]
  8. Min, M.; Miao, C.; Duan, X.; Yan, W. Formation mechanisms and general characteristics of cultivated land use patterns in the Chaohu Lake Basin, China. Land Use Policy 2022, 117, 106093. [Google Scholar] [CrossRef] [Scilit]
  9. Xu, S. Evaluation and Configuration Model of Intensive Cultivated Land Use. Master’s Thesis, Hunan Normal University, Changsha, China, 2005. [Google Scholar]
  10. Tang, F.; Wang, L.; Fu, M.; Huang, N.; Li, W.; Song, W.; Nath, B.; Ding, S.; Niu, Z. Spatio-temporal pattern evolution and regulatory zoning of suitability for farmland scale utilization in China based on multi-source data. Ecol. Indic. 2024, 166, 112475. [Google Scholar] [CrossRef] [Scilit]
  11. Long, H.; Qu, Y. Land use transitions and land management: A mutual feedback perspective. Land Use Policy 2018, 74, 111–120. [Google Scholar] [CrossRef] [Scilit]
  12. Long, H.; Ma, L.; Zhou, G. Progress and Prospect of Land Use Transition Research in China. Acta Geogr. Sin. 2025, 80, 1993–2015. [Google Scholar] [CrossRef]
  13. Zhou, J.; Xu, H.; Jim, C.Y.; Oke, S.A.; Ma, X.; Wei, L.; Yang, X.; Zhang, F. Spatiotemporal dynamics of land use and landscape in coastal zhejiang using multiple methods. iScience 2025, 28, 112898. [Google Scholar] [CrossRef] [Scilit]
  14. Zhou, X.; Chu, Z.; Ji, X. Changes in the land-use landscape pattern and ecological network of xuzhou planning area. Sci. Rep. 2024, 14, 8854. [Google Scholar] [CrossRef] [Scilit]
  15. Lu, X.; Li, Z.; Wang, H.; Tang, Y.; Hu, B.; Gong, M.; Li, Y. Evaluating impact of farmland recessive morphology transition on high-quality agricultural development in China. Land 2022, 11, 435. [Google Scholar] [CrossRef] [Scilit]
  16. Ge, D.; Zhou, G.; Qiao, W.; Yang, M. Land use transition and rural spatial governance: Mechanism, framework and perspectives. J. Geogr. Sci. 2020, 30, 1325–1340. [Google Scholar] [CrossRef] [Scilit]
  17. Niu, W.; Wang, H.; Luo, L.; Shi, Y.; Sui, Y.; Wu, L.; Zhang, B.; Yu, Q. Spatiotemporal impact of cultivated land use transition on grain production: Perspective of interaction between dominant and recessive transitions. Environ. Impact Assess. Rev. 2026, 117, 108170. [Google Scholar] [CrossRef] [Scilit]
  18. Qi, X.; Huang, Q.; Zheng, Y.; Zheng, W.; Yuan, W. Assessing the impacts of farmland use transition on the food–water–energy–pollution nexus in grain production: An integrated simulation framework. Land Use Policy 2026, 164, 107936. [Google Scholar] [CrossRef] [Scilit]
  19. Xiao, J. Application of “3s” technology in land resource management. J. World Archit. 2020, 4, 4–6. [Google Scholar] [CrossRef] [Scilit]
  20. Zhong, T.Y.; Zhang, X.Y.; Huang, X.J. Simulation of farmer decision on land use conversions using decision tree method in Jiangsu province, China. Span. J. Agric. Res. 2009, 7, 687. [Google Scholar] [CrossRef] [Scilit]
  21. Zhang, Z.; Chi, L.; Yang, H.; Shen, C. Spatiotemporal Changes of Crop Planting Structure in the Huang-Huai-Hai Region. China Agric. Resour. Reg. Plan. 2025, 46, 27–37. Available online: https://link.cnki.net/urlid/11.3513.S.20240516.1609.025 (accessed on 17 June 2025).
  22. Ling, M.; Han, H.; Wei, X.; Lv, C. Temporal and spatial distributions of precipitation on the Huang-Huai-Hai Plain during 1960–2019, China. J. Water Clim. Change 2021, 12, 2232–2244. [Google Scholar] [CrossRef] [Scilit]
  23. Guo, B.; Xing, W.; Li, Y.; Zhao, J.; Feng, K.; Huang, Z. Spatiotemporal Characteristics of Precipitation in the Huang-Huai-Hai Plain from 1998 to 2016 Based on TRMM 3B43 Product. Sci. Geogr. Sin. 2021, 41, 1285–1294. [Google Scholar] [CrossRef]
  24. Long, H.; Ge, D.; Zhang, Y.; Tu, S.; Qu, Y.; Ma, L. Changing man-land interrelations in China’s farming area under urbanization and its implications for food security. J. Environ. Manag. 2018, 209, 440–451. [Google Scholar] [CrossRef] [Scilit]
  25. Yang, J.; Huang, X. The 30 m annual land cover dataset and its dynamics in China from 1990 to 2019. Earth Syst. Sci. Data 2021, 13, 3907–3925. [Google Scholar] [CrossRef] [Scilit]
  26. Sadiq, R.; Tesfamariam, S. Environmental decision-making under uncertainty using intuitionistic fuzzy analytic hierarchy process (IF-AHP). Stoch. Environ. Res. Risk Assess. 2007, 23, 75–91. [Google Scholar] [CrossRef] [Scilit]
  27. Zhu, L.; Xing, X.; Yan, F. The abnormal phenomena of entropy weighting method in the dynamic evaluation of agricultural water conservation. Math. Probl. Eng. 2021, 2021, 7732970. [Google Scholar] [CrossRef] [Scilit]
  28. Diakoulaki, D.; Mavrotas, G.; Papayannakis, L. Determining objective weights in multiple criteria problems: The critic method. Comput. Oper. Res. 1995, 22, 763–770. [Google Scholar] [CrossRef] [Scilit]
  29. Liu, S.; Chen, Y.; Yang; Di Li, R.; Qiu, Y.; Lu, K.; Cao, X.; Chen, Q. Spatiotemporal dynamics of constructed wetland landscape patterns during rapid urbanization in Chengdu, China. Land 2024, 13, 806. [Google Scholar] [CrossRef] [Scilit]
  30. Asubonteng, K.O.; Pfeffer, K.; Ros-Tonen, M.A.F.; Baud, I.; Benefoh, D.T. Integration versus segregation: Structural dynamics of a smallholder-dominated mosaic landscape under tree-crop expansion in Ghana. Appl. Geogr. 2020, 118, 102201. [Google Scholar] [CrossRef] [Scilit]
  31. Feng, B.; Yang, H.; Ren, Y.; Zheng, S.; Feng, G.; Huang, Y. Study on change of landscape pattern characteristics of comprehensive land improvement based on optimal spatial scale. Land 2025, 14, 135. [Google Scholar] [CrossRef] [Scilit]
  32. Yu, D.; Wang, D.; Li, W.; Liu, S.; Zhu, Y.; Wu, W.; Zhou, Y. Decreased landscape ecological security of peri-urban cultivated land following rapid urbanization: An impediment to sustainable agriculture. Sustainability 2018, 10, 394. [Google Scholar] [CrossRef] [Scilit]
  33. Li, Y.; Xie, Z.; Qin, Y.; Zhou, S. Spatio-temporal variations in precipitation on the Huang-Huai-Hai Plain from 1963 to 2012. J. Earth Syst. Sci. 2018, 127, 101. [Google Scholar] [CrossRef] [Scilit]
  34. Delgado-Baquerizo, M.; Maestre, F.T.; Gallardo, A.; Bowker, M.A.; Wallenstein, M.D.; Quero, J.L.; Ochoa, V.; Gozalo, B.; García-Gómez, M.; Soliveres, S.; et al. Decoupling of soil nutrient cycles as a function of aridity in global drylands. Nature 2013, 502, 672–676. [Google Scholar] [CrossRef] [Scilit]
  35. Li, Y.; Ma, J.; Xiao, C.; Li, Y. Effects of climate factors and soil properties on soil nutrients and elemental stoichiometry across the Huang-Huai-Hai River Basin, China. J. Soils Sediments 2020, 20, 1970–1982. [Google Scholar] [CrossRef] [Scilit]
  36. Xie, Z.; Lin, X.; Jiang, C.; Dang, Y.; Kong, X.; Lin, C. Establishment of an inter-provincial compensation system for farmland protection in China: A framework from zoning-integrative transferable development rights. Land Use Policy 2025, 150, 107456. [Google Scholar] [CrossRef] [Scilit]
  37. Xiangyun, G.; Hebei Agricultural University, B.H.C.C.; Chi, Z.; Zihao, L.; Baozhong, Y.; Hong, W.; Xuguang, L.; Ruifang, Z.; Yongwei, C. Construction of a multifactor barrier evaluation system and classification of barrier types for arable land on the northern Huang-Huai-Hai Plain. Int. J. Agric. Biol. Eng. 2025, 18, 199–207. [Google Scholar] [CrossRef] [Scilit]
  38. Yan, H.; Liu, F.; Niu, Z.; Gu, F.; Yang, Y. Changes of multiple cropping in Huang-Huai-Hai agricultural region, China. J. Geogr. Sci. 2018, 28, 1685–1699. [Google Scholar] [CrossRef] [Scilit]
  39. Xie, H.; Liu, G. Spatiotemporal Differences and Driving Forces of Cropping Index in China from 1998 to 2012. Acta Geogr. Sin. 2015, 70, 604–614. [Google Scholar] [CrossRef]
  40. Zuo, L.; Zhang, Z.; Dong, T.; Wang, X. Progress in the Research on the Cropping Index of Cultivated Land at Home and Abroad. J. Nat. Resour. 2009, 24, 553–560. [Google Scholar] [CrossRef]
  41. Han, J.; Kamber, M.; Pei, J. Data Mining: Concepts and Techniques, 3rd ed.; Morgan Kaufmann: Waltham, MA, USA, 2011. [Google Scholar]
  42. Liu, X.; Zhou, Q.; Ma, Y.; Zhi, Z.; Liu, R.; Ma, W. Temporal and spatial variation characteristics of precipitation isohyets on the Qinghai–Tibet Plateau from 1961 to 2023. Atmosphere 2025, 16, 698. [Google Scholar] [CrossRef] [Scilit]
  43. Zhang, Y.; Long, H.; Ma, L.; Ge, D.; Tu, S.; Qu, Y. Farmland function evolution in the Huang-Huai-Hai Plain: Processes, patterns and mechanisms. J. Geogr. Sci. 2018, 28, 759–777. [Google Scholar] [CrossRef] [Scilit]
  44. Zhou, Y.; Zhong, Z.; Cheng, G. Cultivated land loss and construction land expansion in China: Evidence from national land surveys in 1996, 2009 and 2019. Land Use Policy 2023, 125, 106496. [Google Scholar] [CrossRef] [Scilit]
  45. Zhang, K.; Yu, Z.; Li, X.; Zhou, W.; Zhang, D. Land use change and land degradation in China from 1991 to 2001. Land Degrad. Dev. 2006, 18, 209–219. [Google Scholar] [CrossRef] [Scilit]
  46. Liu, X.; Cao, G.; Liu, T.; Liu, H. Semi-urbanization and evolving patterns of urbanization in China: Insights from the 2000 to 2010 national censuses. J. Geogr. Sci. 2016, 26, 1626–1642. [Google Scholar] [CrossRef] [Scilit]
  47. Wang, Y.; Lin, W. An analysis of changes in the Chinese family structure between urban and rural areas: On the basis of the 2010 national census data. Soc. Sci. China 2014, 35, 100–116. [Google Scholar] [CrossRef] [Scilit]
  48. Wang, X.; Shen, Y. The effect of China’s agricultural tax abolition on rural families’ incomes and production. China Econ. Rev. 2014, 29, 185–199. [Google Scholar] [CrossRef] [Scilit]
  49. Yu, S.; Qi, J.; Zhang, X.; Pueppke, S.G.; Ou, W.; Liu, H.; Cai, X.; Ren, T. Land use policy impacts on effective farmland planting area: A case study in Heilongjiang province, China. Land Use Policy 2024, 138, 107027. [Google Scholar] [CrossRef] [Scilit]
  50. Li, Y.; Ma, W.; Jiang, G.; Li, G.; Zhou, D. The Degree of Farmland Abandonment and Its Impact on Grain Yield in China’s Major Grain-Producing Areas. J. Nat. Resour. 2021, 36, 1439–1454. [Google Scholar] [CrossRef] [Scilit]
  51. Jiali, W.; Yanfang, L.; Xiaoling, Z. Conflict in informal rural construction land transfer practices in China: A case of hubei. Land Use Policy 2021, 109, 105573. [Google Scholar] [CrossRef] [Scilit]
  52. Cui, L.; Li, F.; Wang, Y. The Impact of Rural Population Transition on Non-Grain Cultivation in China. Geogr. Res. 2026, 45, 324–340. [Google Scholar] [CrossRef]
  53. Wu, Y. Study on the Price and Trade Fluctuation Relationship of China’s Cotton Market After Joining the WTO. Master’s Thesis, Nanjing Agricultural University, Nanjing, China, 2005. [Google Scholar]
  54. Xu, R. Study on the Regional Specialization of Oil Crops in China Based on Comparative Advantage and Location Advantage. Ph.D. Thesis, Nanjing Agricultural University, Nanjing, China, 2006. [Google Scholar]
  55. Li, T.; Lu, H.; Luo, Q.; Li, G.; Gao, M. The impact of rural population aging on agricultural cropping structure: Evidence from China’s provinces. Agriculture 2024, 14, 586. [Google Scholar] [CrossRef] [Scilit]
  56. Yang, C.; Yi, Z.; Bai, R.; Guo, H. From brand to prosperity: The impact of agricultural regional public brands on local economic growth in China. Food Policy 2026, 140, 103072. [Google Scholar] [CrossRef] [Scilit]
  57. Wu, F. Land financialisation and the financing of urban development in China. Land Use Policy 2022, 112, 104412. [Google Scholar] [CrossRef] [Scilit]
  58. Zhang, Y.; Wang, J.; Liu, Y.; Yue, W. Quantifying multiple effects of land finance on urban sprawl: Empirical study on 284 prefectural-level cities in China. Environ. Impact Assess. Rev. 2023, 101, 107156. [Google Scholar] [CrossRef] [Scilit]
  59. Long, H.; Chen, K. Land Use Transition and Urban-Rural Integrated Development Based on Land System Science. Acta Geogr. Sin. 2021, 76, 295–309. [Google Scholar] [CrossRef] [Scilit]
  60. Wang, L.; Jia, B.; Xie, Z.; Wang, B.; Liu, S.; Li, R.; Liu, B.; Wang, Y.; Chen, S. Impact of groundwater extraction on hydrological process over the Beijing-Tianjin-Hebei region, China. J. Hydrol. 2022, 609, 127689. [Google Scholar] [CrossRef] [Scilit]
  61. Feng, W.; Zhong, M.; Lemoine, J.M.; Biancale, R.; Hsu, H.T.; Xia, J. Evaluation of groundwater depletion in north China using the gravity recovery and climate experiment (GRACE) data and ground-based measurements. Water Resour. Res. 2013, 49, 2110–2118. [Google Scholar] [CrossRef] [Scilit]
Figure 1. Overview of the study area (Approval number: GS (2019)1822. The base map is from Geospatial Data Cloud (https://www.gscloud.cn, accessed on 10 September 2026), created with ArcGIS 10.8 (Esri, Redlands, CA, USA; http://desktop.arcgis.com/cn/, accessed on 10 September 2026).
Land 15 01696 g001
Figure 2. CART-based classification process for different cropland resource utilization patterns.
Land 15 01696 g002
Figure 3. Spatial distribution of different cropland resource utilization patterns and their mean centers in the Huang–Huai–Hai region across various years.
Land 15 01696 g003
Figure 4. Statistical Chart of the Number of Different Farmland Resource Utilization Models in the Huang–Huai–Hai Region, 2000–2020.
Land 15 01696 g004
Figure 5. Box plots of the CLI for different cropland resource utilization patterns in the Huang–Huai–Hai region, 2000–2020.
Land 15 01696 g005
Figure 6. Distribution map of natural suitability grades for cropland in the Huang–Huai–Hai region.
Land 15 01696 g006
Figure 7. Box plots of the cropping index by different cropland resource utilization patterns in the Huang–Huai–Hai region, 2000–2020.
Land 15 01696 g007
Figure 8. Diagram illustrating the mechanism underlying cropland resource utilization patterns.
Land 15 01696 g008
Figure 9. Example of an IHR.
Land 15 01696 g009
Figure 10. Example of a SER.
Land 15 01696 g010
Figure 11. Example of a GCR.
Land 15 01696 g011
Figure 12. Example of an FSR.
Land 15 01696 g012
Figure 13. Example of an RCR.
Land 15 01696 g013
Table 1. Sources of Data.
Data TypeFormatYearResolutionSource
Land-Use DataGrid2000, 2010, 202030 mhttps://zenodo.org/records/4417810 (accessed on 19 July 2025)
Monthly Precipitation DatasetGrid2000–20201 kmhttps://data.tpdc.ac.cn (accessed on 11 October 2025)
High-Precision Soil Dataset for ChinaGrid 1 kmhttps://doi.org/10.11888/Terre.tpdc.301235 (accessed on 24 September 2025)
DEM dataGrid202030 mhttps://zenodo.org/records/14511570 (accessed on 23 September 2025)
Road and Waterway DataVector2020 https://www.openstreetmap.org (accessed on 23 September 2025)
Administrative Boundaries
Data
Vector https://www.gscloud.cn/home (accessed on 19 July 2025)
Statistical
Yearbook
Data
2000, 2010, 2020 Official websites of provincial and municipal bureaus of statistics
Table 2. Evaluation System for the Characteristics of Cropland Resource Utilization.
Characteristics of Cropland Resource UtilizationIndicatorsMethod Diagram
CLDTQuantitative EndowmentTransferred Area/Total AreaLand 15 01696 i001
Landscape MorphologyLandscape Index
(PD, AWMSI, AI, DIVISION)
Land 15 01696 i002
CLRTNatural BackgroundEvaluation Criteria
(Hydrology, Soil, and Spatial Environment)
Land 15 01696 i003
Production FunctionsCropping Index
(Total Sown Area/Total Cropland Area)
Land 15 01696 i004
Crop Rotation
Note: LCCs, ROCs, and EOCs are abbreviations for Land-Consuming, Reclamation-Oriented, and Ecology-Oriented Cities, respectively; PD is Patch Density; AWMSI is Area-Weighted Mean Shape Index; AI is Aggregation Index; DIVISION is Landscape Division Index; CLI is Cultivated Land Intensity; H-CLI, M-CLI, and L-CLI represent high, medium, and low landscape intensity levels classified based on CLI; CLDT and CLRT refer to cultivated land dominant transition and recessive transition. All abbreviations are explained in detail in the main text.
Table 3. Establishment and Weight Distribution of the Evaluation Index System for Cropland Suitability.
Primary IndicatorWeightSecondary IndicatorsWeight
Indicator System for Evaluating the Natural Suitability of CroplandHydrological Conditions23.27%March–May precipitation11.15%
June–August precipitation12.12%
Soil Properties51.30%AN7.71%
OC9.84%
AP9.04%
AK10.88%
pH13.83%
Spatial Environment25.44%Slope11.64%
Irrigation District13.80%
Table 4. Appropriate Zoning of Evaluation Indicators for Cropland Suitability.
Primary IndicatorSecondary IndicatorsHighly SuitableModerately SuitableConditionally SuitableMarginally SuitableUnsuitable
Soil PropertiesAN>12095–12070–9545–70<45
AP>2010–206–104–6<4
AK>200150–200100–15080–100<80
OC>21.5–21–1.50.5–1<0.5
PH6.5–7.56–6.5
7.5–8
8–8.5
5.5–6
8.5–99–9.5
Hydrological ConditionsMarch–May precipitation>160135–160110–13585–11060–85
June–August precipitation>500450–500400–450350–400300–350
Spatial EnvironmentIrrigation District<20002000–40004000–60006000–8000>8000
Slope≤22–66–1515–25≥25
Table 5. Classification rules for utilization morphologies of different cropland resource utilization patterns in the Huang–Huai–Hai region.
Cropland EndowmentLandscape MorphologyNatural BackgroundCropping IntensityPlanting StructureProductive Functions
IHREOC/
ROC/
LCC
H-CLI/
M-CLI
Highly Suitable/
Moderately Suitable/
Conditionally Suitable
DoubleStaple CropsHigh-yield Staple Crop Regions
SEREOC/
ROC
H-CLI/
M-CLI
/L-CLI
Moderately Suitable/
Conditionally Suitable
Single/
3-in-2 years
Staple CropsStable-yield Staple Crop Regions
GCREOC/
ROC
I-CLI/
M-CLI
/L-CLI
Suitable/
Conditionally Suitable
Single/
3-in-2 years/
Double
Grain and Cash CropsStable Grain–Cash Crop Regions/High-yield Grain–Cash Crop Regions
FSRLCCM-CLI
/L-CLI
Moderately Suitable/
Conditionally Suitable
Single/
3-in-2 years
Grain and Cash CropsStable-yield Staple Crop Regions/Stable Grain–Cash Crop Regions
RCRLCC/
ROC
H-CLI/
M-CLI
/L-CLI
Marginally SuitableSingle/
3-in-2 years
Grain and Cash CropsStable-yield Staple Crop Regions/Stable Grain–Cash Crop Regions
Table 6. Changes in cropland area by different cropland resource utilization patterns in the Huang–Huai–Hai region, 2000–2020 (km2; %).
2000–20102010–20202000–2020
Area ChangeGrowth RateArea ChangeGrowth RateArea ChangeGrowth Rate
IHR−54,128.03−15.3367,021.3019.8712,893.273.65
SER67,918.9119.23−49,012.20−14.5318,906.705.35
GCR−33,440.45−9.47−22,596.08−6.70−56,036.52−15.87
FSR4388.751.24−9599.79−2.85−5211.04−1.48
RCR−540.34−0.15−849.15−0.25−1389.49−0.39
Disclaimer/Publisher’s Note: The statements, opinions and data contained in all publications are solely those of the individual author(s) and contributor(s) and not of MDPI and/or the editor(s). MDPI and/or the editor(s) disclaim responsibility for any injury to people or property resulting from any ideas, methods, instructions or products referred to in the content.