


Abstract
Understanding how ecological restoration and urban expansion jointly reshape ecosystem-service patterns remains challenging in medium-sized inland hilly cities undergoing rapid land-use change. Nanchong, a representative hilly city in southwestern China, provides an opportunity to examine changes in ecosystem services associated with restoration-related land-use transformation and urban development. Using multisource spatial data and the InVEST model, this study quantified changes in soil conservation, carbon storage, water yield, and habitat quality from 2018 to 2023 and established an integrated ecosystem-service zoning framework. Results showed substantial land-use restructuring during the study period, characterized by forest expansion and cropland reduction. Soil conservation increased by 9.52 × 10⁶ t (30.5%), and carbon storage increased by 2.38 × 10⁶ t (3.72%), with the major improvements concentrated in forested hilly regions. Water yield increased by 339.60 × 10⁶ m3 (43.3%), although this change was strongly associated with interannual precipitation variability. Mean habitat quality increased from 0.4443 to 0.4801, while the concurrent increase in habitat degradation indicated increasing spatial differentiation between restored areas and urban fringes. Integrated ecosystem-service zoning revealed a transition from medium-service dominance toward greater spatial polarization, with the proportion of relatively high- and high-service areas expanding from 14.54% to 23.20%. These findings indicate that restoration-related land-use changes were associated with increases in multiple ecosystem services but did not fully offset urbanization pressures, highlighting the need for spatially differentiated green-space management in hilly cities.
1. Introduction
Ecosystem services (ESs) encompass the material and nonmaterial benefits that people obtain from ecosystems and are widely recognized as a fundamental basis for human well-being and sustainable development [1,2]. Rapid urbanization has profoundly transformed land-use patterns and landscape structure, replacing natural vegetation with impervious surfaces and consequently reducing the capacity of urban ecosystems to provide ecosystem services that meet increasing societal demands [3]. As a result, improvements in material well-being have often been accompanied by ecosystem degradation and increasing mismatches between ecosystem-service supply and human demand [3]. Ecological restoration has therefore become an important strategy for enhancing ecosystem functions and improving the provision of ecosystem services in rapidly urbanizing regions [4,5]. Urban green spaces are among the principal providers of ecosystem services, and their composition, spatial configuration, and landscape pattern directly influence ecosystem-service capacity [6,7,8]. Accordingly, numerous studies have explored the relationships between urban green spaces and ecosystem services, including carbon storage, water regulation, soil retention, and habitat quality [9,10,11]. Quantitative and spatially explicit approaches have increasingly been adopted to assess urban ecosystem services, including biophysical assessment, GIS-based approaches, and ecosystem-service modeling [12]. At the same time, studies have increasingly examined multiple ecosystem services and their relationships, rather than treating individual services in isolation [13]. However, the existing evidence remains heterogeneous in terms of the ecosystem services assessed, spatial scales, modeling frameworks, and urban contexts, and the extent to which ecosystem-service assessments inform planning and management decisions varies among applications [12].
Different ecosystem-service modeling frameworks can also produce different estimates and scenario responses. A comparative assessment of three commonly used spatial modeling tools—InVEST, LUCI, and the Natural Capital Model—showed that model outputs for the same ecosystem services were generally positively correlated, but systematic differences remained in estimated service levels and responses to alternative vegetation scenarios. These differences were associated partly with variations in model structure and parameterization, highlighting the importance of interpreting modeled ecosystem services in relation to the ecological processes and planning questions represented by each modeling framework [14]. Within this broader modeling landscape, the Integrated Valuation of Ecosystem Services and Trade-offs (InVEST) suite of models provides a well-established, spatially explicit approach for quantifying and mapping multiple ecosystem services [15]. Its modular structure enables different ecosystem services to be assessed using service-specific biophysical relationships and spatially explicit inputs, and it has consequently been widely applied in ecological restoration, land-use assessment, and ecosystem-service planning. In China, existing studies have applied ecosystem-service and spatial ecological assessment approaches across diverse ecological and urban contexts, including the Loess Plateau, karst regions, urban–suburban areas, and blue–green infrastructure [16,17,18,19]. Studies in Wuhu, for example, have used InVEST together with additional analytical approaches to examine the spatial–temporal relationships among ecosystem services and their driving mechanisms, showing that urban expansion may increase the risk of ecosystem-service degradation and that the relationships among services vary spatially and temporally [20]. Other studies have further demonstrated the relevance of ecosystem-service assessment to ecological conservation, restoration, and land-use management [21,22].
Evidence from medium-sized and rapidly urbanizing cities shows that ecosystem-service assessment extends beyond large metropolitan regions. In Suizhou, China, ecosystem services were integrated with ecological sensitivity and landscape connectivity to identify ecological sources and corridors, highlighting the need to coordinate urban expansion with ecological protection and restoration [23]. In Trento, Italy, ecosystem-service information supported the comparison of brownfield-regeneration scenarios and urban-planning alternatives [24]. Similarly, in Asmara, Eritrea, spatially explicit ecosystem-service modeling was used to evaluate watershed investment scenarios related to soil erosion, water scarcity, and urban water security [25]. These studies demonstrate the growing use of ecosystem-service modeling in medium-sized cities for ecological planning, scenario assessment, and land-management decisions.
However, existing evidence remains fragmented across ecosystem services, modeling frameworks, spatial scales, and planning contexts. In particular, limited attention has been given to medium-sized inland hilly cities where rapid urban expansion and ecological restoration occur concurrently [20,21,22]. In such settings, restoration-related land-use transitions may interact with topography and urban development to produce spatially differentiated responses across multiple ecosystem services. This study therefore addresses the need for an integrated understanding of these responses and their implications for ecosystem-service zoning and differentiated planning strategies.
Nanchong represents a typical medium-sized inland hilly city experiencing the coupled processes of rapid urbanization and ecological restoration, providing a relevant context for investigating ecosystem-service responses to restoration-driven land-use change [26,27]. Located in the middle reaches of the Jialing River, Nanchong serves as an important regional economic center in northeastern Sichuan Province and an important node within the Chengdu–Chongqing Economic Circle. Its complex hilly terrain creates pronounced spatial heterogeneity between construction land and ecological land, making ecological restoration and urban expansion interact more strongly than in many cities located on plains [27,28]. Since 2018, the continuous implementation of the Grain for Green Program (GFGP) together with the construction of the Jialing River ecological corridor has substantially reshaped regional land-use patterns, providing a valuable opportunity to evaluate how restoration policies and urban expansion jointly influence multiple ecosystem services [13,29,30,31,32]. Although the ecological benefits of restoration programs have been widely demonstrated, previous studies have consistently shown that restoration outcomes vary considerably among different geographical settings because of differences in topography, land-use dynamics, and urbanization intensity [13,30,31,32,33]. However, whether ecological restoration can simultaneously enhance multiple ecosystem services in medium-sized inland hilly cities remains insufficiently understood. Therefore, evidence from Nanchong can not only improve understanding of restoration effectiveness under complex terrain conditions but also provide scientific support for sustainable land-use planning and ecological management in similar land-constrained cities [33].
To address these research gaps, this study employed the Integrated Valuation of Ecosystem Services and Trade-offs (InVEST) model to quantify spatiotemporal changes in four key ecosystem services—soil conservation, carbon storage, water yield, and habitat quality—in urban Nanchong during the period of ecological restoration from 2018 to 2023. Multi-temporal remote sensing data were used to characterize land-use changes throughout the study period [34,35]. Specifically, this study aimed to (i) quantify the spatiotemporal responses of multiple ecosystem services to ecological restoration and land-use change; (ii) identify hotspots of ecosystem-service provision and delineate integrated ecosystem-service zones; and (iii) provide scientific evidence for ecological restoration planning, differentiated ecological management, and sustainable urban green-space planning in medium-sized hilly cities.
Based on existing studies on ecological restoration and ecosystem services, two working hypotheses were formulated to guide the analysis.
H1.
Ecological restoration was expected to be associated with higher levels of multiple ecosystem services through restoration-induced land-use change, particularly forest expansion, although the magnitude of observed changes may differ among ecosystem services owing to their distinct ecological processes [13,29,36,37,38,39].
H2.
The spatial distribution of ecosystem services was expected to be associated with land-use type, with forest ecosystems generally providing higher levels of multiple ecosystem services. However, variations in topography, landscape configuration, and human disturbance were expected to generate considerable spatial heterogeneity in ecosystem-service patterns [13,40,41].
Evaluating these expectations through a two-period spatial comparison can contribute to a better understanding of ecosystem-service changes associated with ecological restoration in medium-sized inland hilly cities. Unlike previous studies that primarily focused on metropolitan regions or ecological restoration pilot areas, this study examines the associations among restoration-related land-use changes, ecosystem-service changes, and spatial heterogeneity under complex terrain conditions. The findings are expected to provide scientific evidence for territorial spatial planning, ecological restoration management, ecological compensation, and ecological conservation redline optimization in Nanchong and other comparable cities within the Chengdu–Chongqing Economic Circle.
2. Study Area
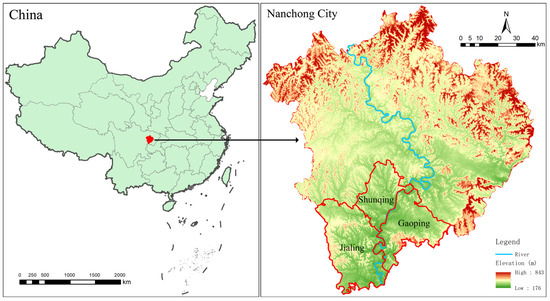
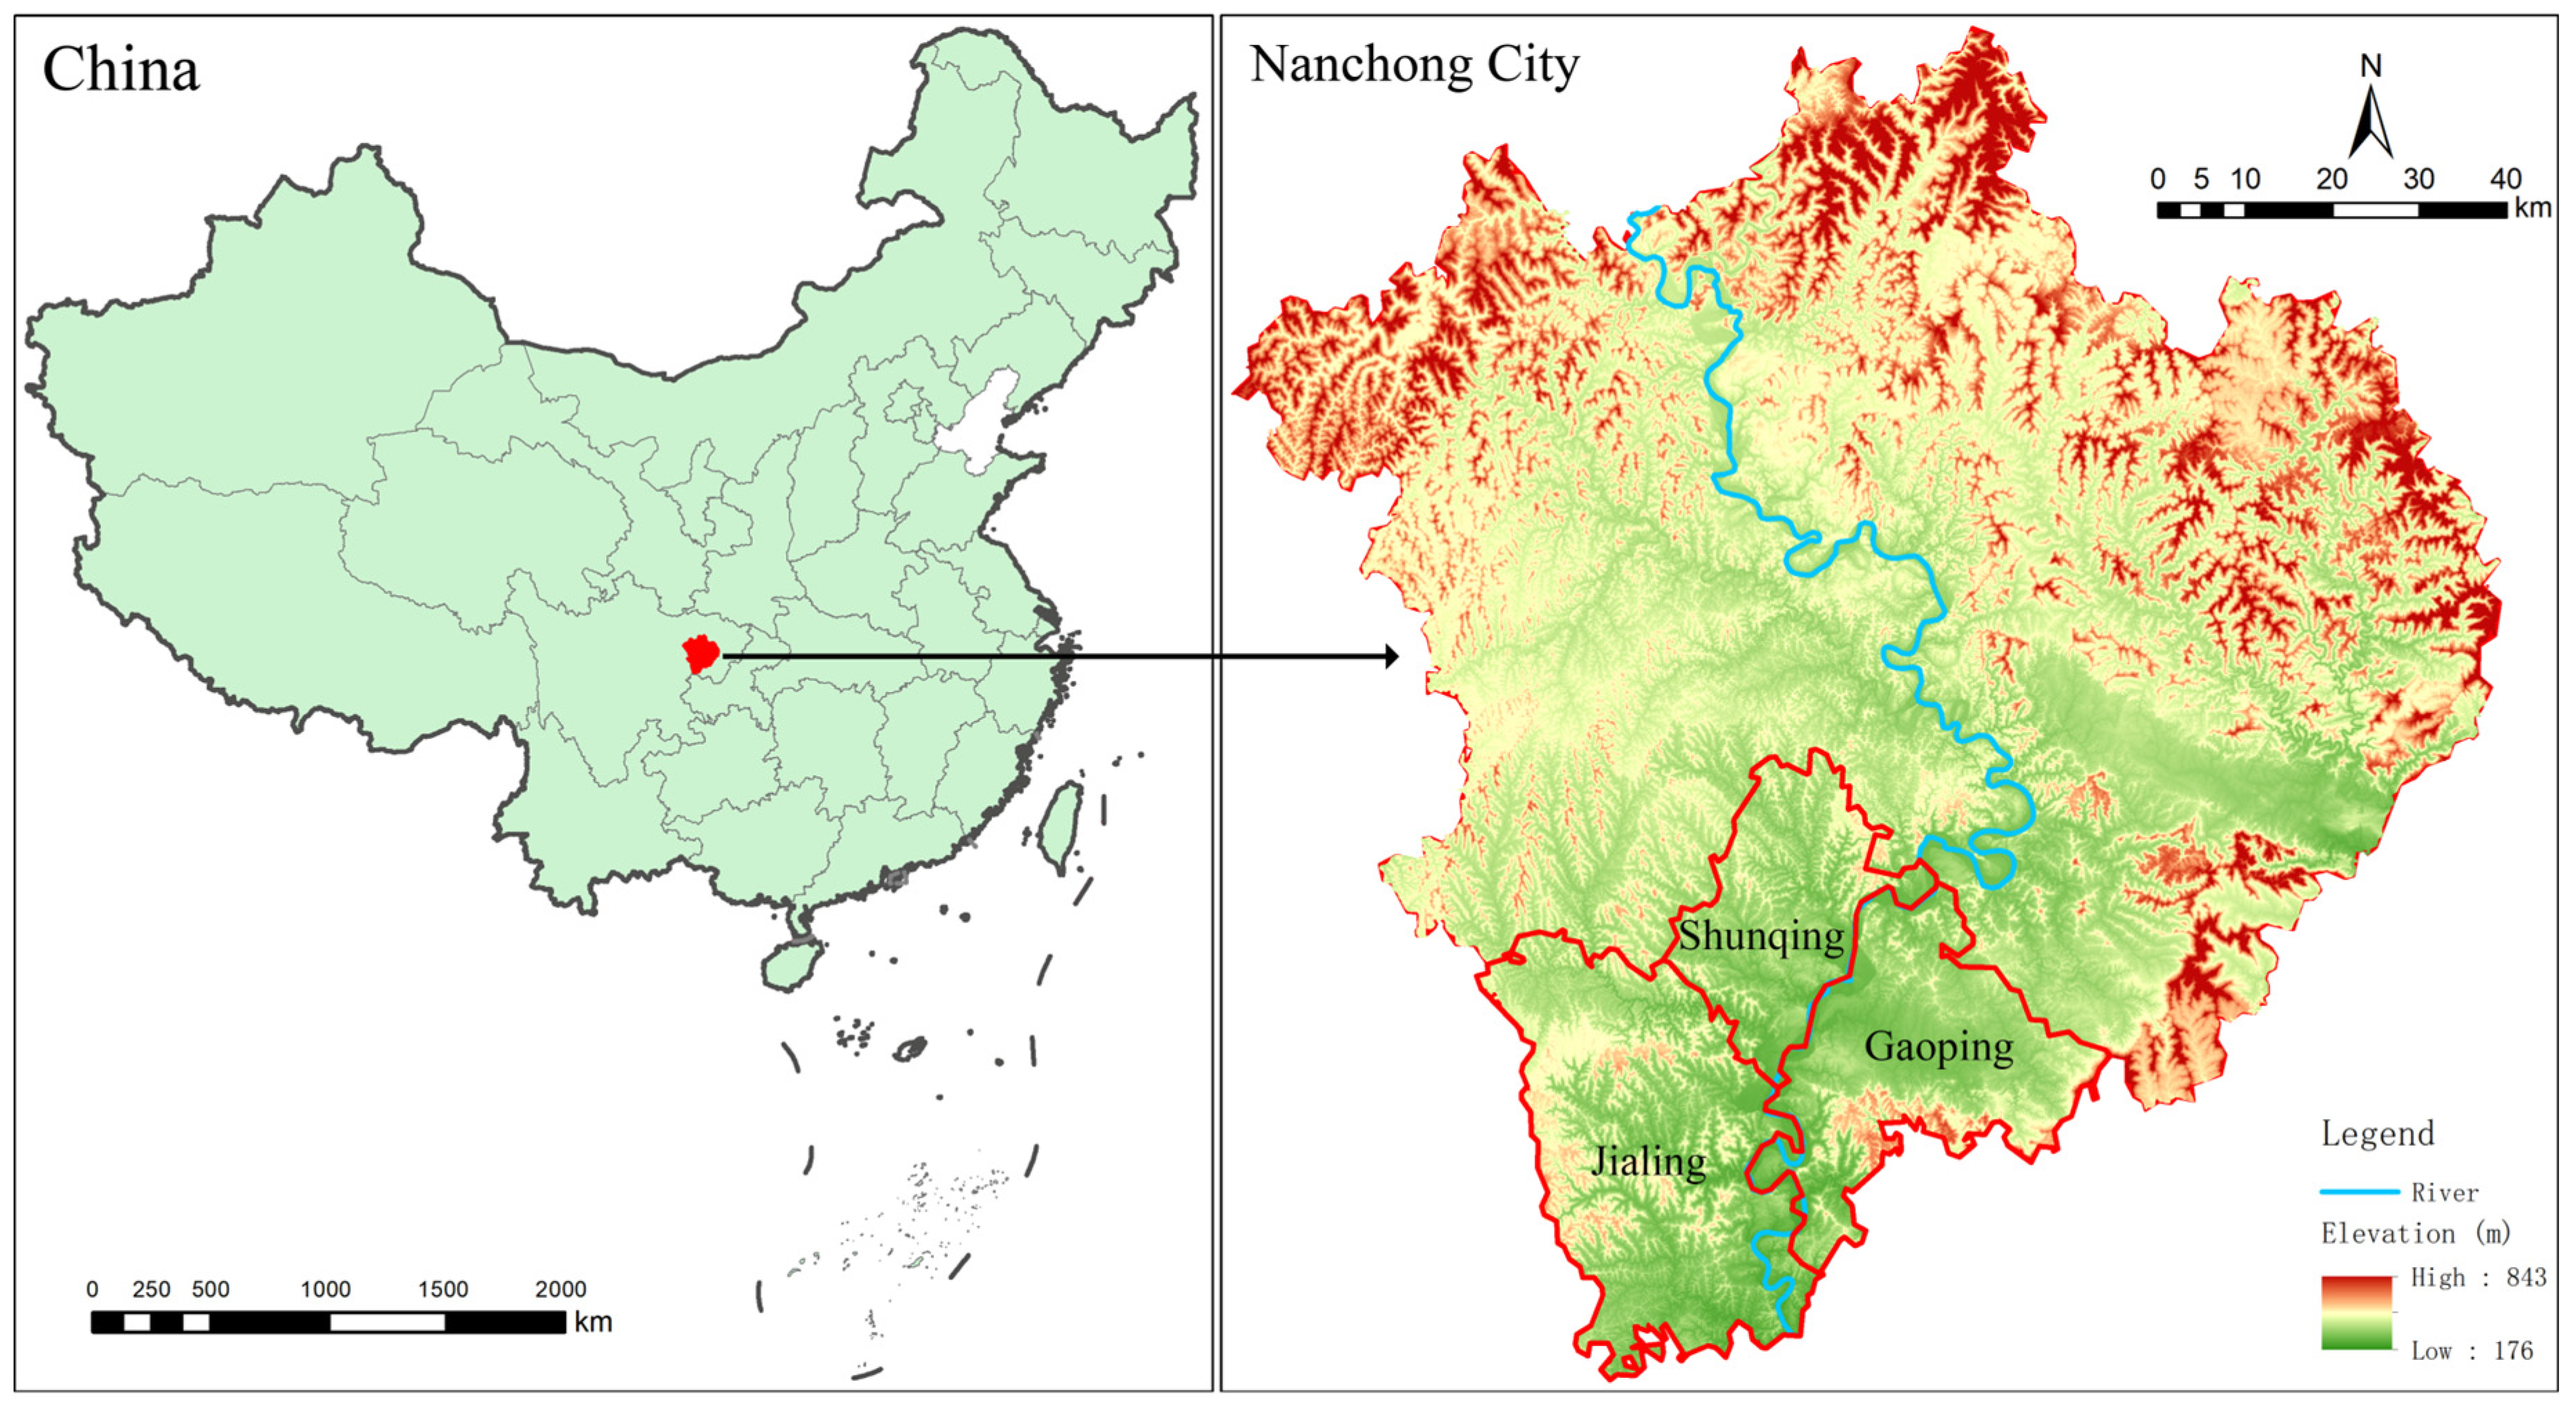
Nanchong is located in the northeastern Sichuan Basin, China, in the middle reaches of the Jialing River (30°35′–31°51′ N, 105°27′–106°58′ E). It is an important northern node of the Chengdu–Chongqing Economic Circle and represents a typical medium-sized inland hilly city undergoing rapid urban development and ecological restoration. The study area includes the main urban districts of Nanchong, namely Shunqing, Gaoping, and Jialing districts, covering an area of approximately 2526 km2 (Figure 1). Located at the intersection of expanding urban areas and ecologically sensitive hilly landscapes, Nanchong provides a representative case for examining how land-use transformation and ecological restoration influence ecosystem-service patterns [42].
Figure 1.
Location of the study area in Nanchong, China.
The study area is characterized by the typical hilly terrain of central Sichuan, with elevation gradually decreasing from north to south. The complex topographic gradient generates strong spatial heterogeneity in land-use distribution and ecosystem-service capacity. Purple soils dominate the hillslopes, whereas paddy soils are mainly distributed on river-valley terraces. Purple soils are highly susceptible to erosion because of their weak structural stability and intensive weathering characteristics, especially under steep slope cultivation and concentrated summer precipitation conditions [43]. Previous studies have demonstrated that slope gradient, rainfall intensity, and land-use practices are key factors controlling soil erosion processes in the purple-soil region of Southwest China [43,44]. Therefore, soil conservation represents an important ecosystem service in Nanchong and is strongly influenced by regional topography and land-use configuration.
The vegetation of Nanchong consists mainly of subtropical evergreen broad-leaved forests and planted forests. Forest ecosystems are concentrated in low-mountain areas, including Lingyun Mountain, Jincheng Mountain, and Fengya Mountain. Dominated by Pinus massoniana and cypress plantations, these forests provide important ecosystem functions, including soil conservation, carbon storage, and habitat maintenance. In contrast, cropland is widely distributed across suburban hills and river valleys and has historically supported agricultural production and regional water regulation. However, cropland areas have gradually decreased due to urban expansion and ecological restoration programs, particularly the Grain for Green Program (GFGP) [29,31]. Meanwhile, the expansion of built-up land and increasing impervious surfaces have altered landscape structure and may reduce ecosystem-service provision in urban areas [3].
In recent years, Nanchong has implemented multiple ecological restoration initiatives, including the Grain for Green Program, Jialing River ecological corridor construction, wetland restoration, and mine ecological rehabilitation. These interventions have promoted vegetation recovery and landscape restructuring, resulting in substantial land-use transitions. Previous studies have demonstrated that China’s ecological restoration policies have generated significant improvements in ecosystem functions, although restoration outcomes vary among regions due to differences in environmental conditions, land-use history, and human activities [31,32]. Therefore, Nanchong provides an appropriate spatial context for evaluating ecosystem-service responses during a period of restoration-oriented land-use change. In this study, the period from 2018 to 2023 was selected to capture recent ecological restoration processes and quantify changes in soil conservation, carbon storage, water yield, and habitat quality.
3. Data Processing and Research Methodology
3.1. Acquisition and Processing of Land-Use Imagery
3.1.1. Data Sources
Remote sensing imagery for 2018 and 2023 was obtained from the Geospatial Data Cloud platform. The 2018 image was acquired from the Landsat 8 Operational Land Imager (OLI), whereas the 2023 dataset consisted of Landsat 8/9 OLI and Thermal Infrared Sensor (TIRS) imagery. Both datasets were Collection 2 Level-1 products with a spatial resolution of 30 m (path 128, row 39).
To minimize the effects of seasonal variation and atmospheric interference, images acquired during the vegetation growing season (June–September) were selected, and scenes with cloud coverage lower than 10% were prioritized. Landsat imagery has been widely used for long-term land-use and land-cover change detection due to its consistent acquisition strategy, moderate spatial resolution, and extensive historical archive [34].
3.1.2. Image Preprocessing
Remote sensing images were preprocessed using ENVI 5.3. Digital numbers were first converted into top-of-atmosphere radiance through radiometric calibration. Atmospheric correction was subsequently performed using the Fast Line-of-sight Atmospheric Analysis of Spectral Hypercubes (FLAASH) module, which is based on the MODTRAN radiative-transfer model and accounts for atmospheric absorption, scattering, aerosol effects, and water-vapor influence on surface reflectance retrieval.
The rural aerosol model and mid-latitude seasonal atmospheric model were selected according to the geographic location and acquisition conditions of the study area. Cloud and cloud-shadow contamination were identified and removed using the Fmask algorithm, which has been widely applied for automated quality screening of Landsat and Sentinel imagery [35]. These preprocessing procedures ensured the consistency of multi-temporal remote sensing observations and reduced uncertainties associated with atmospheric variability during land-use classification [45].
3.1.3. Land-Use Classification and Accuracy Assessment
According to China’s Current Land Use Classification Standard (GB/T 21010–2017) and regional landscape characteristics, land use was classified into six categories: cropland, forestland, grassland, water bodies, built-up land, and unused land.
For the purpose of this study, “green space” refers to the combined area of cropland, forestland, grassland, and water bodies. Built-up land and unused land are classified as non-green land. This definition is used specifically for the aggregation and reporting of green-space composition and green-space transitions, while all six LULC categories are retained in the underlying land-use dataset and used as applicable in the ecosystem-service assessment.
Using ENVI 5.3 software, maximum likelihood classification was performed on preprocessed remote sensing images to select at least 30 sample points with a resolution greater than 1.8 from different land-cover classes as training samples. Additionally, the preliminary classification results were verified and corrected through manual visual interpretation. Finally, ArcGIS 10.8 software was used to perform visualization tasks.
Using the “Classification → Post-Classification → Confusion Matrix → Using Ground Truth ROIs” method in ENVI, the accuracy of the land-use classification results was verified using the confusion matrix feature. The results show that the overall accuracy of the classifications exceeded 85%, meeting the requirements for spatial analysis in subsequent ecosystem-service assessments.
3.2. Ecosystem-Service Assessment
We used InVEST version 3.14.1 to quantify ecosystem services. Developed by the Natural Capital Project at Stanford University, InVEST uses land-use/land-cover maps as core inputs to estimate individual services through spatially explicit modules and has been widely applied and validated [46]. We selected four services closely associated with urban green-space functions: soil conservation, carbon storage, water yield, and habitat quality.
3.2.1. Soil Conservation Model
The soil conservation module is based on the Revised Universal Soil Loss Equation (RUSLE) and estimates retained soil as the difference between potential and actual soil loss under current vegetation and conservation practices [47]:
Soil conservation was calculated as:
where SD denotes soil conservation, RKLS represents potential soil erosion, USLE represents actual soil erosion. R rainfall erosivity, K soil erodibility, LS the slope length–steepness factor, C the vegetation cover and management factor, and P the support-practice factor.
Model inputs comprised a 30 m digital elevation model (DEM; Geospatial Data Cloud) for deriving LS; a rainfall–erosivity raster generated using the Wischmeier monthly equation applied to daily precipitation records from the China Meteorological Data Service Center (http://data.cma.cn, accessed on 6 September 2026); a soil erodibility raster estimated with the EPIC model from soil texture and organic carbon data in the HWSD v1.2 database; and land-use/land-cover rasters; and associated biophysical parameter tables. Following the InVEST manual and regional studies [48,49], C values were assigned as follows: forestland, 0.005–0.050; grassland, 0.050–0.150; cropland, 0.230–0.500; and water bodies and built-up land, 0.000. p values were assigned by slope class: 0–5°, 0.10; 5–10°, 0.15; 10–15°, 0.22; 15–20°, 0.30; 20–25°, 0.35; and >25°, 0.45. Parameterization and implementation details are documented in previous studies [46,47,48,49,50,51].
3.2.2. Carbon Storage Model
① Model Principles
The carbon-storage module sums four carbon pools—aboveground biomass, belowground biomass, soil organic carbon, and dead organic matter—to estimate landscape-scale carbon storage [52]:
where Ci represents the total carbon density of land-use type i; Ci-above, Ci-below, Ci-soil, Ci-dead, and Ctotal represent, respectively, the carbon density of above-ground vegetation, the carbon density of below-ground living roots, the carbon density in the soil, the carbon density of dead vegetation, and the total carbon stock for land-use type i; Si represents the total area of land-use type i.
Required inputs were land-use/land-cover rasters and carbon-density values for each land-use type. Carbon densities were drawn primarily from measured and estimated values reported for the Sichuan Basin and surrounding areas, including a regional survey of terrestrial carbon density and storage [53] and an InVEST assessment of land-use effects on carbon storage in the Chengdu–Chongqing urban agglomeration [54]. Where local measurements were unavailable, values were extrapolated from regional and national datasets. To ensure the reliability of the parameters, the average of data from multiple sources was used as the carbon-density values for different land-cover types (Table 1).
Table 1.
Carbon-density values for various land-use types (t/hm2).
② Sensitivity and Uncertainty Analysis
Since this model does not propagate parameter uncertainties internally, a one-at-a-time (OAT) sensitivity analysis and a Monte Carlo (MC) uncertainty analysis were conducted to supplement the analysis and assess the extent to which the results depend on the carbon-density values used [55].
OAT sensitivity analysis. For each “land-use type × carbon pool” parameter, a ±20% perturbation was applied while keeping all other parameters constant, and the sensitivity coefficient (SC) was calculated. The results are shown in Supplementary S1 Tables S1 and S2.
Monte Carlo uncertainty analysis. Each carbon-density parameter was treated as an independent random variable, following a triangular distribution with the baseline value as the mode and upper and lower limits at ±20%. A total of 10,000 random samples were drawn to assess the uncertainty in the total carbon stock estimates. Uncertainty was quantified using the mean, coefficient of variation (CV), and 95% confidence interval of the simulation results. The results are shown in Supplementary S1 Figures S1–S3.
3.2.3. Water Yield Model
The water-yield module applies the Budyko hydroclimatic framework to estimate annual water yield from the water balance [56]:
where Yx is annual water yield in grid cell x (mm), Px is annual precipitation (mm), and AETx is annual actual evapotranspiration (mm). The AET/P ratio is defined by the Budyko curve and is controlled jointly by potential evapotranspiration relative to precipitation and by the plant-available water coefficient ω, which represents land-surface properties [57]. Kc is the reference crop evapotranspiration coefficient; ET0 is the evapotranspiration of the reference crop; AWCx is the available water content; w is a non-physical parameter; Z is the Zhang coefficient.
Inputs comprised a 30 m precipitation raster interpolated from meteorological station data by kriging; mean annual potential evapotranspiration estimated with the modified Hargreaves method; land-use/land-cover rasters; soil depth and plant-available water content derived from HWSD v1.2; watershed and subwatershed boundaries derived from the DEM; and biophysical parameters, including root depth and the crop evapotranspiration coefficient (Kc) (Table 2). Based on module testing, this study determined that the Z-factor is 7.6, a value that has been repeatedly verified.
Table 2.
Evapotranspiration coefficients and root-depth parameters for different Land-Use types.
3.2.4. Habitat Quality Model
The habitat-quality module estimates habitat condition from the effects of anthropogenic threats on habitat suitability. For grid cell x of land-use type j, habitat quality was calculated as [58]:
where Hj is the habitat-suitability score for land-use type j (0–1), Dxj is the total threat level affecting grid cell x, z is the scaling parameter (default = 2.5), and k is the half-saturation constant (default = 0.5).
Inputs comprised current land-use/land-cover rasters; raster layers for three threats—built-up land, cropland, and major roads—derived from land-use data and OpenStreetMap and processed by buffer analysis; threat attributes (maximum impact distance, weight, and decay function); habitat-type sensitivity to each threat; and the half-saturation constant k. Threat weights and impact distances followed the InVEST manual and were adjusted using regionally calibrated schemes developed for mountainous cities [58]. Values of habitat suitability and sensitivity for each land-use type were likewise based on the manual and comparable studies. The habitat suitability and ecological sensitivity parameters for various land-use types and the threat factors are as follows (Table 3 and Table 4).
Table 3.
Suitability of habitat types and their sensitivity to threat factors.
Table 4.
Threat factor categories.
3.2.5. Integrated Ecosystem-Service
Integrated ecosystem services enable a systematic assessment of the interactions among various ecosystem services, thereby revealing the spatial characteristics of ecosystem-service functions within the study area. Given the significant differences among the indicators in terms of attributes and units of measurement, we performed a cross-year joint range normalization on the four indicators. Specifically, for each ecosystem-service indicator, we combined the data from 2018 and 2023 to determine a unified maximum and minimum value, and then standardized the data from both years using the same range of extremes. Soil and water conservation, carbon storage, water discharge, and habitat quality were all standardized to a range of 0–1. Subsequently, the standardized raster maps were overlaid using the equally weighted summation method. The standardized rasters were then overlaid using an equal-weighted sum [59]:
where ESj is the integrated ecosystem-service index for year j, Wi is the weight assigned to service i (Wi = 0.25 for all services), and Sij is the standardized value of service i in year j. Equal weighting is a common and robust approach when no defensible prior weighting scheme is available [60]. The composite index was classified as low, medium, relatively high, or high using the natural breakpoint method in ArcGIS.
4. Analytical Framework
4.1. Land-Use and Land-Cover Change Analysis
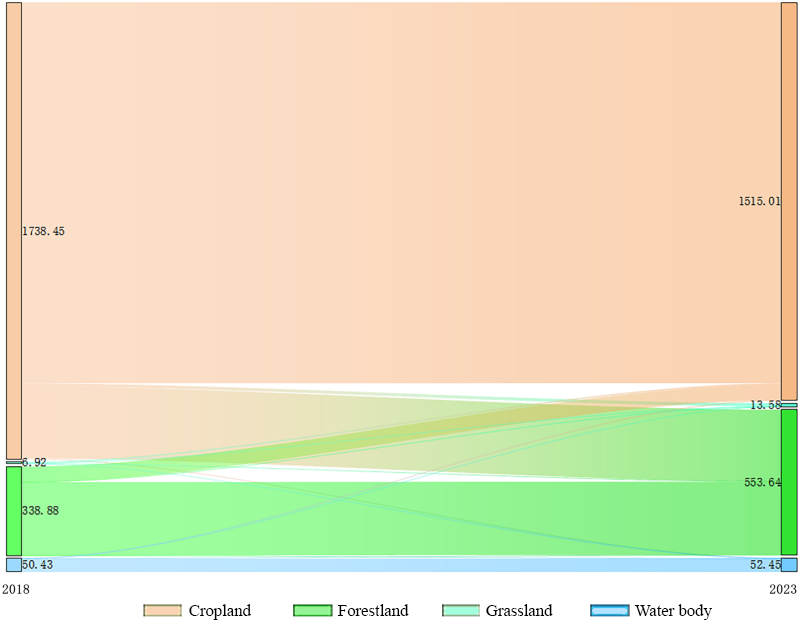
Land-use transitions between 2018 and 2023 were analyzed to identify the dominant pathways of landscape transformation. The transition matrix revealed substantial reorganization within green space, primarily characterized by the conversion of cropland to forestland. Specifically, 212.40 km2 of cropland was converted into forestland, accounting for 62.96% of total cropland outflow. These conversions were mainly distributed in areas targeted by ecological restoration programs, including the Grain for Green Program (GFGP) and forest-city initiatives, suggesting that restoration policies likely contributed to the observed land-use transition.
Meanwhile, 159.59 km2 of green space was converted to non-green land, mainly occurring along urban fringes and transportation corridors. Such concurrent patterns of ecological restoration and urban expansion have been widely reported in rapidly urbanizing regions of China, where land-use policies and socioeconomic development jointly reshape landscape structure and ecosystem functions [29].
4.2. Analysis of Ecosystem-Service Changes
We quantified soil conservation, carbon storage, water yield, and habitat quality for 2018 and 2023 using four InVEST modules. Topographic and soil-related inputs were maintained constant between the two periods. Therefore, temporal variations in ecosystem services represent the combined effects of land-use change and climatic variability rather than land-use change alone.
For soil conservation, the K and LS factors were held constant, and temporal differences reflected the combined effects of rainfall erosivity (R) and land-use-related changes in vegetation cover and management conditions (C). The C-factor assignments followed the parameterization described in Section 3.2.1 and were supported by previous RUSLE-based ecosystem-service assessments [47]. In the hilly purple-soil landscapes of Nanchong, vegetation restoration substantially influenced erosion-control capacity. For cropland located on slopes steeper than 15°, conversion to forest reduced the C factor from 0.230–0.500 to 0.005–0.050, representing a decline exceeding 90%. Consequently, soil conservation improvements were more pronounced in steep mountainous areas than in relatively flat regions. Evaluating ecosystem-service responses along topographic gradients is therefore important for identifying restoration priorities in hilly cities [51].
Carbon-density specification represented a major source of uncertainty in carbon-storage estimation. Carbon-density parameters derived from the Sichuan Basin and surrounding regions were considered appropriate because of their similar climatic conditions, vegetation characteristics, and soil environments [53,61]. However, the use of regional parameters rather than site-specific measurements inevitably introduces uncertainty, which has been widely recognized in ecosystem-service modeling applications [50]. Furthermore, newly established forests under ecological restoration programs may not immediately reach mature-forest carbon densities; therefore, the estimated increase likely represents an early-stage carbon accumulation response following ecological restoration.
Water-yield estimates were sensitive to precipitation variability, and observed differences between 2018 and 2023 reflected the combined effects of climate fluctuations and land-use transformation. Therefore, the contribution of ecological restoration programs to water-yield changes cannot be directly isolated without scenario simulations or climate-normalized comparisons. Previous studies based on the Budyko framework demonstrated that vegetation changes influence water balance through interactions among evapotranspiration, precipitation, and soil-water availability [54,56]. Although forests may reduce annual water yield because of increased evapotranspiration, they can enhance infiltration processes and regulate hydrological functions through improved soil structure and root systems.
For habitat quality, threat weights and maximum impact distances followed the InVEST framework and were adjusted according to previous studies of mountainous urban systems [58]. The habitat-quality index represents habitat suitability, whereas the degradation index reflects exposure to anthropogenic disturbances. Due to Nanchong’s hill-enclosed urban morphology, built-up land represented the dominant threat source, with impacts gradually decreasing away from urban areas. Meanwhile, simultaneous increases in habitat quality and degradation indicate spatial differentiation: ecological restoration expanded high-quality habitats, whereas some restored areas remained affected by nearby urban and transportation-related disturbance sources.
4.3. Integrated Ecosystem-Service Zoning Analysis
We constructed an integrated ecosystem-service index by equally weighting the four standardized service indicators, a commonly applied approach when explicit prior weights or stakeholder-based weighting schemes are unavailable [61,62,63]. Using the natural breakpoint method, it was divided into four levels, thereby reducing reliance on manually set thresholds. Jenks natural breaks were subsequently applied to classify the composite index into four levels according to its empirical spatial distribution, thereby reducing dependence on manually defined thresholds. The resulting zoning framework identified areas with contrasting levels of multiservice provision and provided a spatial basis for differentiated ecological management. This approach is consistent with ecosystem-service-based spatial planning frameworks that integrate service supply patterns with landscape ecological conditions and management objectives [64,65].
For Nanchong and comparable hilly cities, ecosystem-service zoning should consider not only the magnitude of service provision but also the underlying topographic constraints. In particular, purple-soil slopes exceeding 15° represent areas with elevated erosion sensitivity and may require greater consideration in future conservation and ecological restoration planning.
5. Results
5.1. Land-Use and Land-Cover Change
Based on the six-class LULC classification, green space was defined as cropland, forestland, grassland, and water bodies, whereas built-up land and unused land were grouped as non-green land. Under this operational definition, green space in urban Nanchong decreased from 2294.28 to 2211.00 km2 between 2018 and 2023, representing a net loss of 83.28 km2; its proportion of the study area declined from 90.86% to 87.56%. Correspondingly, non-green land expanded by 83.28 km2 during the same period.
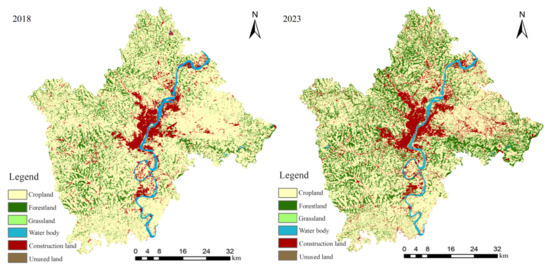
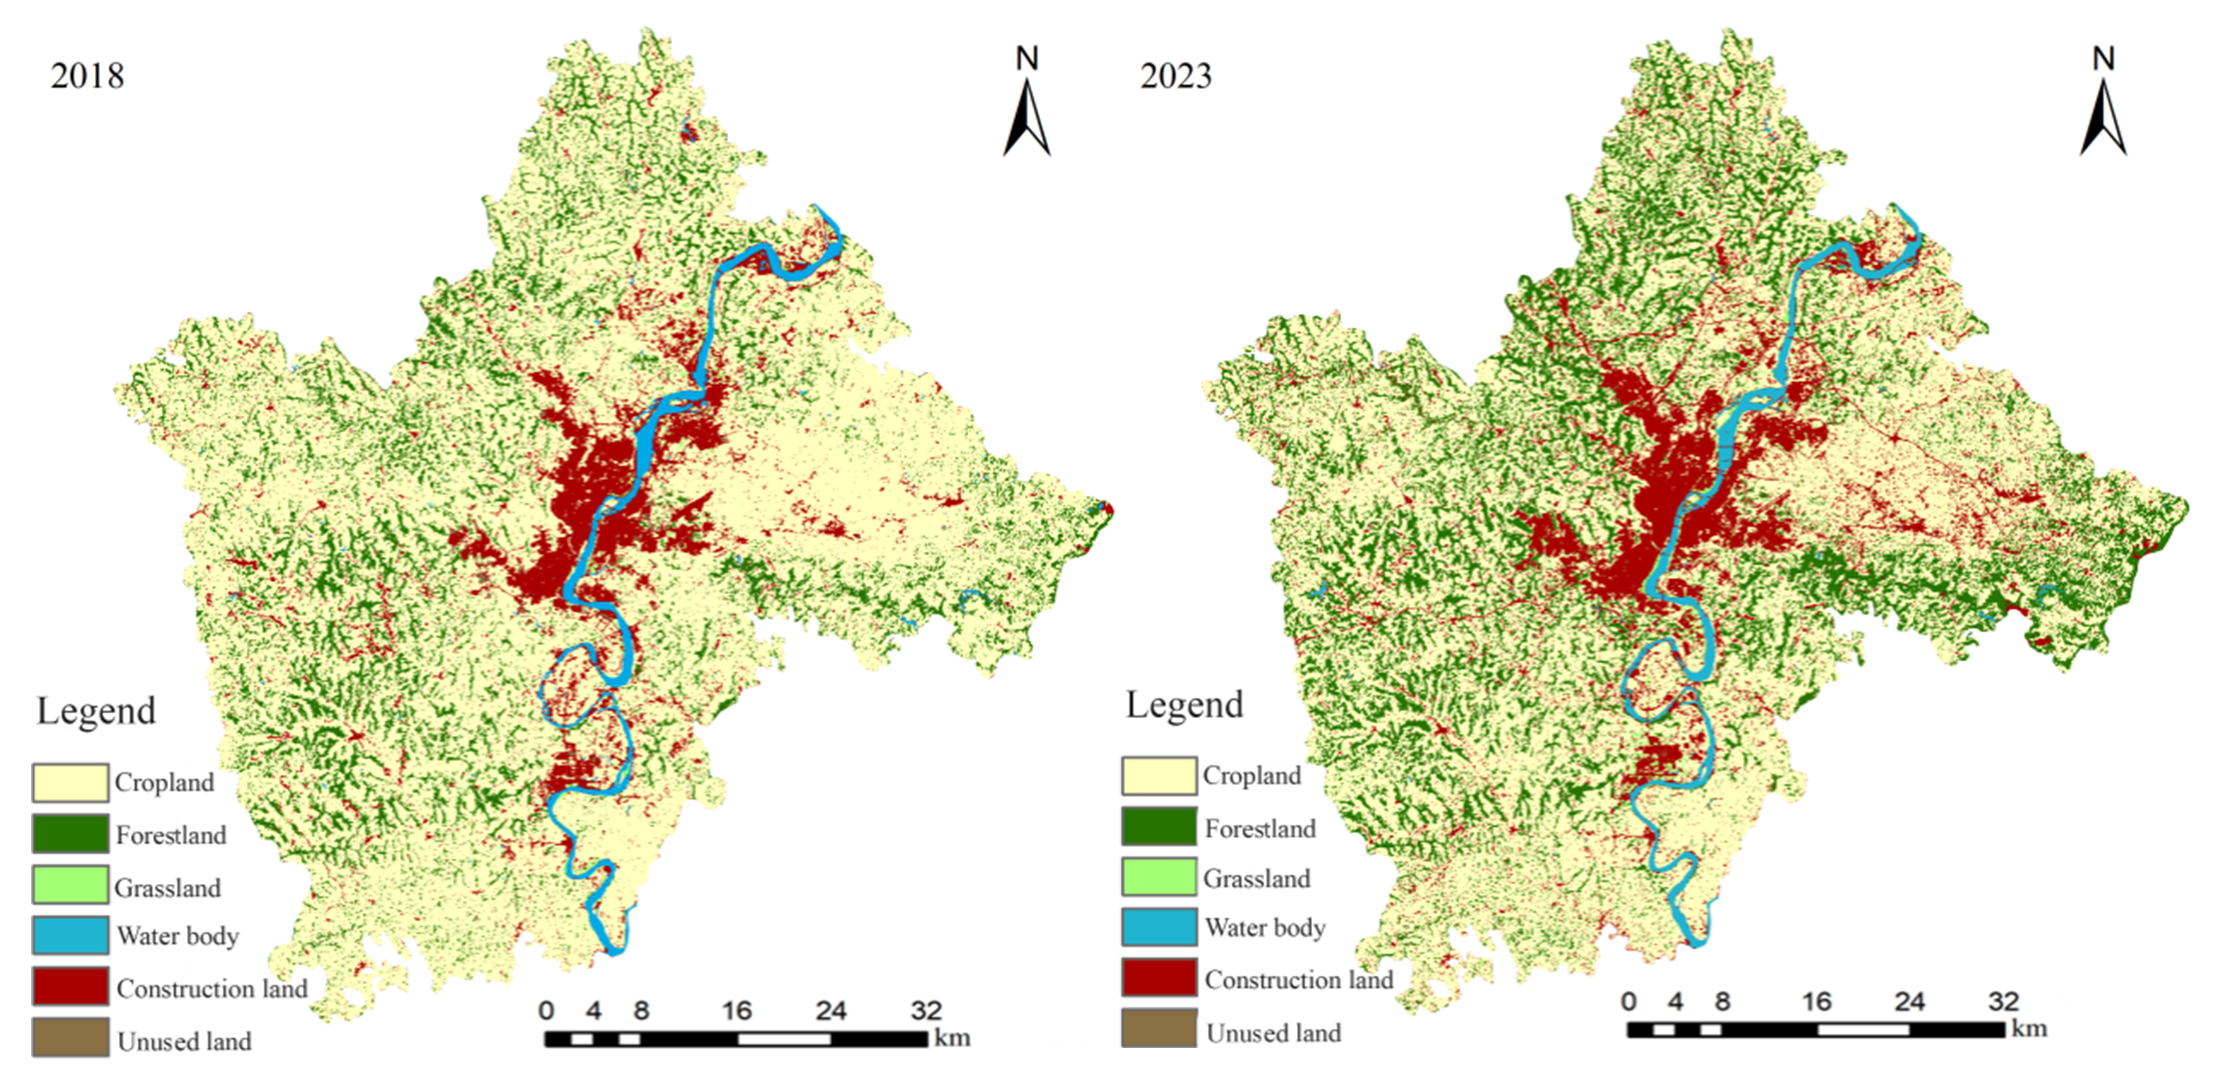
Within green space, three land-use categories increased, whereas cropland exhibited a substantial decline (Table 5, Figure 2). Cropland decreased by 309.39 km2 (16.4%), from 1885.24 to 1575.85 km2. In contrast, forestland expanded by 210.00 km2 (60.7%), increasing from 346.02 to 556.02 km2. Grassland increased from 9.11 to 24.00 km2, and water bodies increased from 53.91 to 55.13 km2.
Table 5.
Composition of land-use categories and green-space/non-green-land groups in Nanchong City in 2018 and 2023.
Figure 2.
Land-use spatial distribution in the study area in 2018 and 2023.
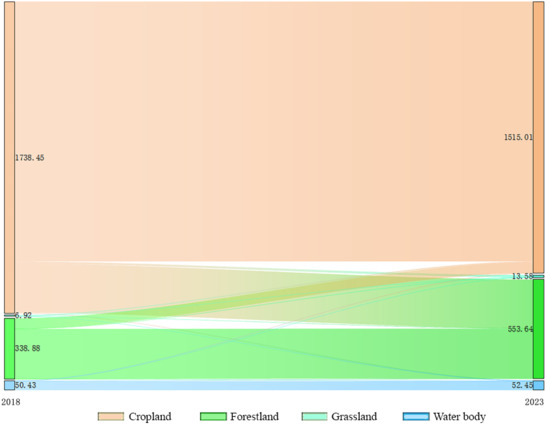
Among the four green-space categories defined above, the land-use transition matrix (Figure 3) indicated that 353.58 km2 underwent transitions among green-space categories. Cropland-to-forest conversion represented the dominant transition pathway, accounting for 212.40 km2, or 62.96% of total cropland loss. Meanwhile, 66.52 km2 of forestland was converted to cropland. In addition, 159.59 km2 of green space was converted to non-green land, whereas 76.31 km2 of non-green land transitioned into green space.
Figure 3.
Land-use transitions among green-space categories from 2018 to 2023.
5.2. Soil Conservation
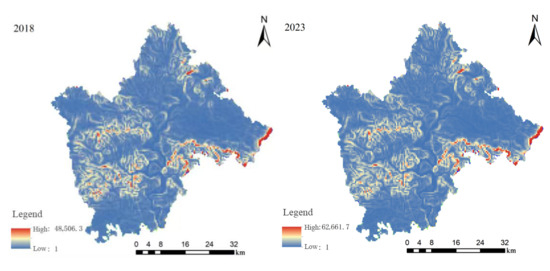
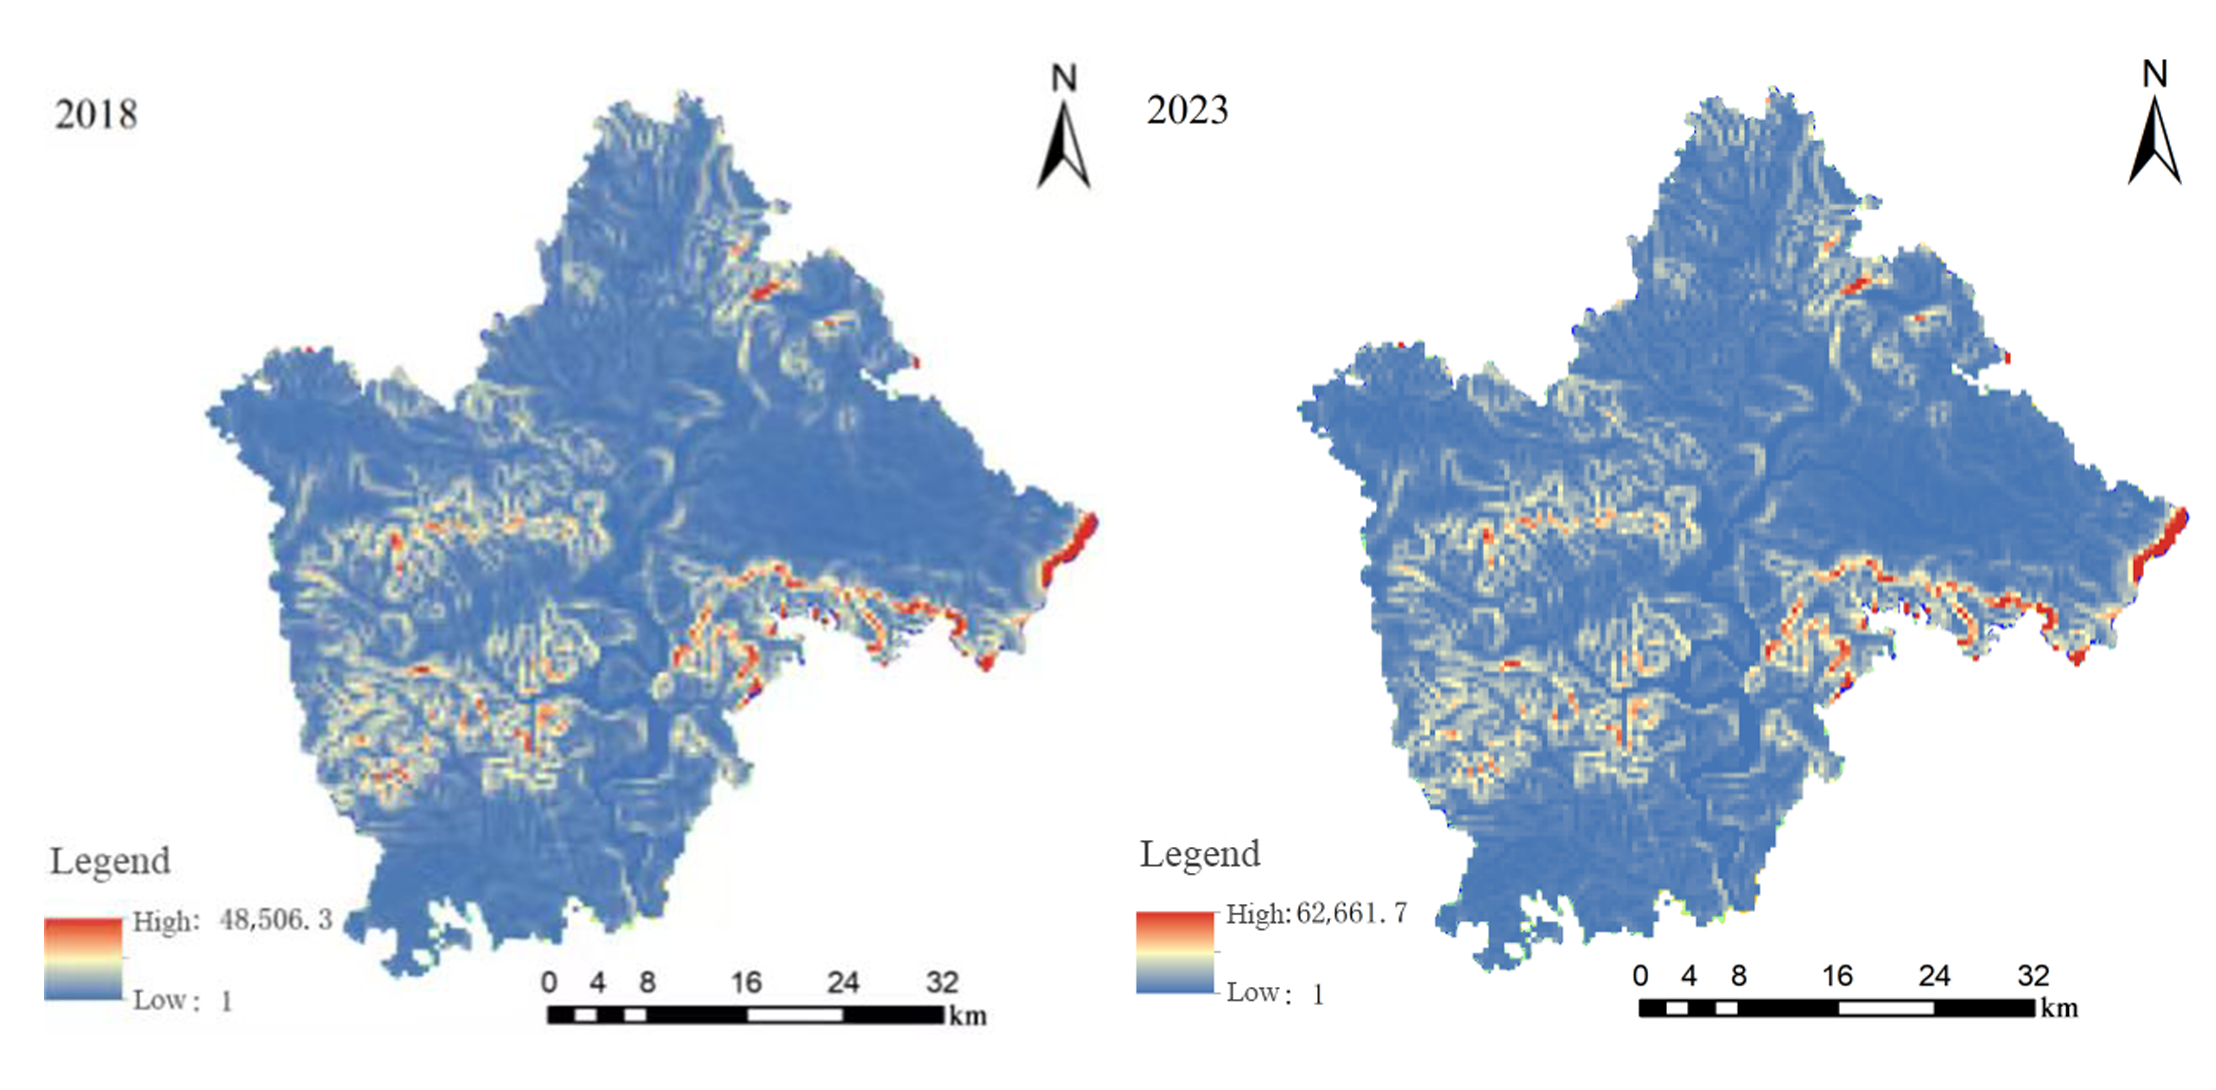
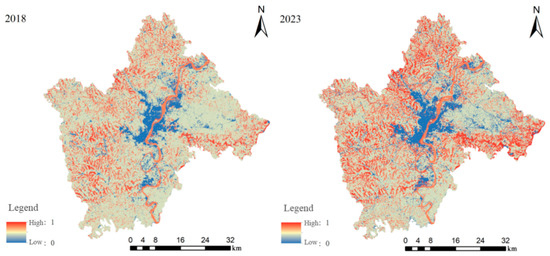
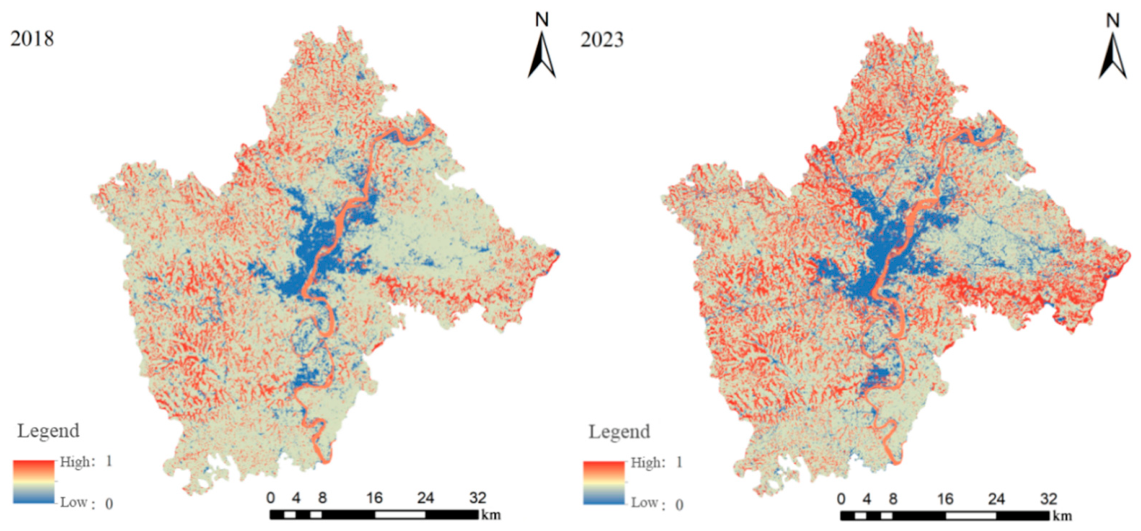
Total soil conservation increased from 31.19 × 10⁶ t in 2018 to 40.71 × 10⁶ t in 2023, representing a net increase of 9.52 × 10⁶ t (30.5%). The total amount of soil retained in green spaces also rose from 29.22 × 10⁶ t to 37.19 × 10⁶ t, an increase of 7.98 × 10⁶ t. Forestland accounted for 71.1% of the total increase, with retained soil increasing from 19.35 × 10⁶ to 26.12 × 10⁶ t. During the same period, soil conservation in cropland increased from 9.87 × 10⁶ to 11.07 × 10⁶ t. In 2023, mean soil conservation per unit area reached 469.7 t ha−1 in forestland, compared with 70.2 t ha−1 in cropland and 33.5 t ha−1 in grassland.
Spatially, soil conservation exhibited clear heterogeneity across the study area (Figure 4). Higher values were mainly distributed in the eastern and southwestern regions, whereas lower values occurred in the northeastern and southern areas. High-value zones were concentrated in forest-dominated landscapes, including southeastern Gaoping, central Jialing, and northeastern Shunqing, while low-value areas were primarily associated with built-up land and unused land.
Figure 4.
Spatial distribution of soil conservation in the study area in 2018 and 2023.
5.3. Carbon Storage
The total carbon storage in the study area increased from 63.90 × 10⁶ t in 2018 to 66.28 × 10⁶ t in 2023, representing a net increase of 2.38 × 10⁶ t (3.72%). Mean carbon density increased from 22.78 to 23.63 t C ha−1 during the same period. Carbon storage increased across all three districts, increasing from 20.04 × 10⁶ to 20.83 × 10⁶ t in Gaoping, from 30.17 × 10⁶ to 31.10 × 10⁶ t in Jialing, and from 13.69 × 10⁶ to 14.35 × 10⁶ t in Shunqing. The total carbon stock in green spaces increased from 60.10 × 10⁶ t to 61.06 × 10⁶ t, representing a net increase of approximately 0.96 × 10⁶ t, or about 1.60%.
Forestland exhibited the largest increase in carbon storage, rising by 60.6% from 13.15 × 10⁶ to 21.12 × 10⁶ t, and its contribution to total carbon storage increased from 20.58% to 31.84%. In contrast, cropland carbon storage declined by 16.4%, from 45.79 × 10⁶ to 38.27 × 10⁶ t, with its proportion decreasing from 71.68% to 57.76%. Carbon density followed the order of forestland (37.96 t C ha−1) > cropland (24.28 t C ha−1) > grassland (16.67 t C ha−1) > water bodies (15.80 t C ha−1).
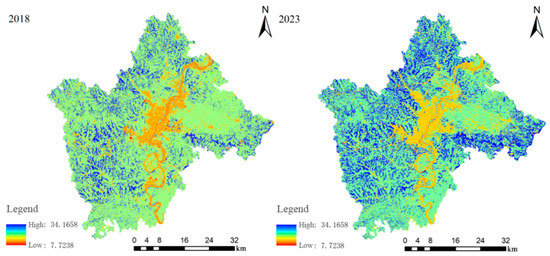
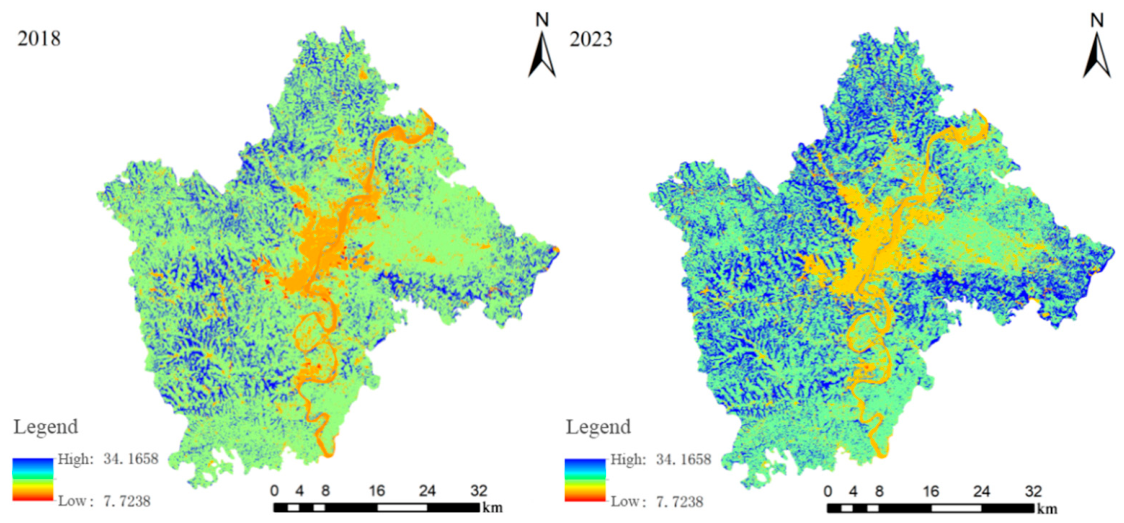
Spatially, carbon storage exhibited a peripheral accumulation pattern, with lower values concentrated in the urban core and higher values distributed mainly in surrounding forest landscapes (Figure 5). High carbon-storage zones were mainly located in the Lingyun–Jincheng Mountain region in eastern Nanchong, the Laojun Mountain–Tianxiangu area in the north-central region, and forest-dominated areas of central Jialing. Grid-cell carbon-density values ranged from 7.72 to 34.17 t C ha−1.
Figure 5.
Spatial distribution of green-space carbon storage in the study area in 2018 and 2023.
5.4. Water Yield
Total water yield across the study area increased from 784.21 × 10⁶ m3 in 2018 to 1123.81 × 106 m3 in 2023, representing a net increase of 339.60 × 10⁶ m3 (43.3%). Mean water yield increased from 310.58 to 445.08 mm during the study period. Within green spaces, water yield increased from 688.95 × 10⁶ to 945.12 × 10⁶ m3, corresponding to an increase of 37.18%.
Cropland remained the dominant contributor to green-space water yield, increasing from 608.48 × 10⁶ to 744.08 × 10⁶ m3; however, its contribution decreased from 88.3% to 78.7%. Forestland water yield increased from 75.36 × 10⁶ to 186.36 × 10⁶ m3, with its contribution increasing from 10.9% to 19.7%. Water yield per unit area differed among land-use types, following the order of cropland (4723.7 m3 ha−1) > grassland (4550.0 m3 ha−1) > forestland (2494.1 m3 ha−1), while water bodies exhibited the lowest estimated values.
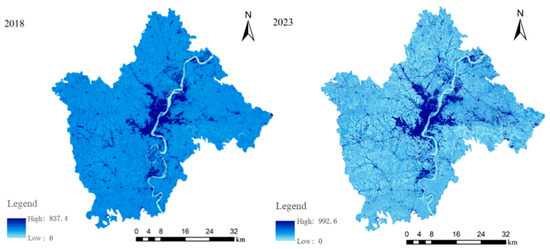
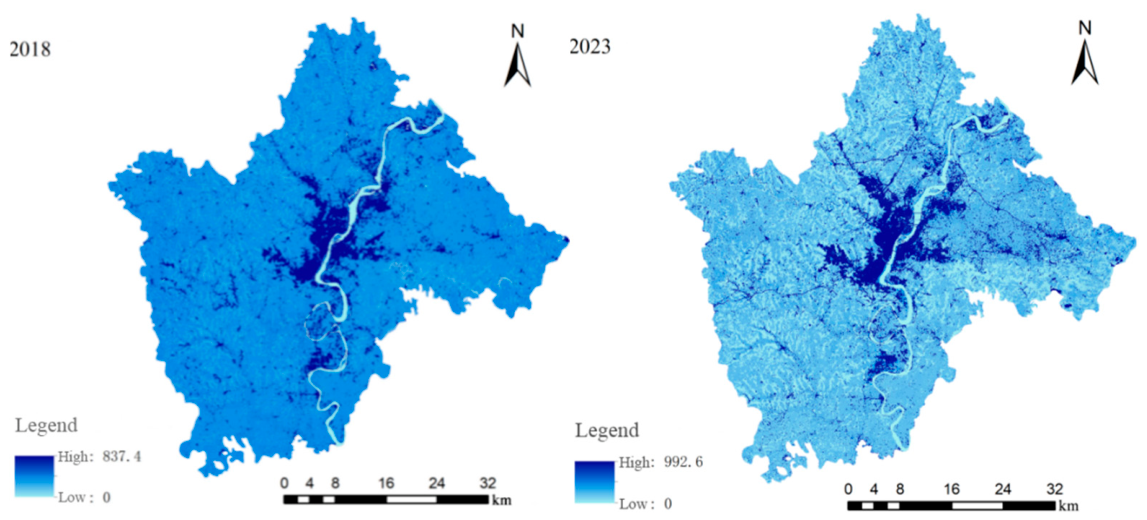
Spatially, water yield displayed clear heterogeneity across Nanchong (Figure 6). Lower values occurred mainly in the northern and southern regions, whereas higher values were concentrated in central areas. High water-yield zones were primarily distributed in cropland-dominated landscapes in southern Shunqing and western Gaoping, while lower values were mainly associated with the Jialing River corridor and extensive forest-covered regions.
Figure 6.
Spatial distribution of water yield in the study area in 2018 and 2023.
5.5. Habitat Quality
The average habitat-quality indices for green spaces in the study area were 0.4443 and 0.4801 in 2018 and 2023, respectively. The average habitat degradation indices were 0.0858 and 0.0905 in 2018 and 2023, respectively. Among different land-use types, forestland exhibited the highest habitat quality, increasing from 0.82 to 0.85, while its degradation index increased from 0.12 to 0.14. Cropland habitat quality declined from 0.38 to 0.35, accompanied by a decrease in its degradation index from 0.06 to 0.05. Habitat quality increased from 0.55 to 0.62 in grassland and from 0.70 to 0.72 in water bodies.
Spatially, high-quality habitat areas were mainly distributed within contiguous forest landscapes in southeastern Gaoping, central and northern Jialing, and central and northern Shunqing (Figure 7). In contrast, low-quality habitat areas were primarily concentrated in built-up regions of northwestern Gaoping, northeastern Jialing, and southern Shunqing.
Figure 7.
Spatial distribution of habitat quality in the study area in 2018 and 2023.
5.6. Integrated Ecosystem-Service Zoning
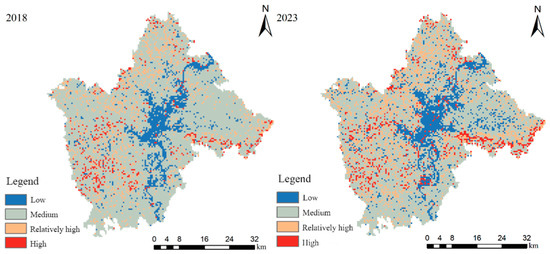
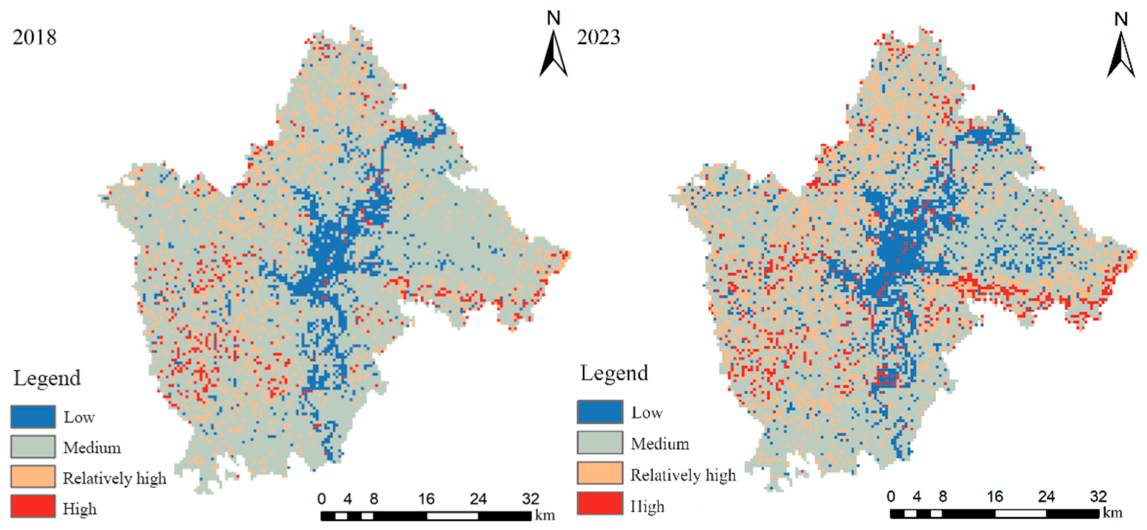
During the study period, the overall fluctuations in ecosystem-service zones within Nanchong City’s administrative area were significant, showing a trend of “three increases and one decrease” (Table 6, Figure 8). The area of low-service zones increased from 283.68 km² (11.23%) to 365.49 km² (14.47%). The area of zones with moderate ecosystem services decreased from 1875.27 km² (74.23%) to 1574.61 km² (62.33%). In contrast, the area with relatively high service levels increased from 310.26 km² (12.28%) to 457.13 km² (18.09%), while the area with high service levels increased from 57.12 km² (2.26%) to 129.09 km² (5.11%).
Table 6.
Proportion of ecosystem service sub-areas in the Nanchong urban area.
Figure 8.
Spatial distribution of integrated ecosystem-service zones in the study area in 2018 and 2023.
Spatially, high and relatively high integrated-service zones were mainly distributed in low-mountain and hilly forest landscapes in northern, eastern, and southwestern Nanchong. In contrast, low and medium integrated-service zones were primarily located in areas characterized by intensive agricultural use and urban development, particularly in northeastern, central, and southern regions. The simultaneous expansion of low- and high-service zones, together with the contraction of the medium-service zone, indicates a shift from a medium-service-dominated pattern toward greater spatial differentiation rather than uniform ecological improvement across the urban region.
6. Discussion
6.1. Land-Use Change and Ecological Restoration Policies
Between 2018 and 2023, forestland in urban Nanchong increased by 60.7%, and cropland-to-forest conversion was the dominant land-use transition pathway (212.40 km2). This transition occurred concurrently with the implementation of the Grain for Green Program (GFGP) and National Forest City initiatives and was concentrated in areas targeted for ecological restoration, suggesting that policy interventions likely contributed to the observed land-use restructuring. Previous evaluations of the GFGP have demonstrated that the program substantially altered land-use patterns in China, while also highlighting potential trade-offs between ecological restoration and agricultural production [29].
Ecological restoration policies have played an important role in reshaping China’s land system and improving ecosystem functions; however, their ecological outcomes vary considerably among regions because of differences in climate, topography, vegetation characteristics, and socioeconomic conditions [30,32]. In Nanchong, forest expansion occurred mainly in hilly landscapes, where increased vegetation cover coincided with improvements in multiple ecosystem services, including soil conservation, carbon storage, and habitat quality. Nevertheless, these improvements should be interpreted as associations between land-use transitions and ecosystem-service responses, rather than direct causal effects of individual policies.
However, ecological restoration did not eliminate the pressure associated with urban expansion. A total of 159.59 km2 of green space was converted to non-green land, resulting in an overall decline in green-space area. The coexistence of forest expansion and built-up land expansion indicates that Nanchong is undergoing a dual process of ecological restoration and urban development. Similar patterns have been reported in rapidly urbanizing regions of China, where ecological policies and development demands simultaneously reshape landscape structure and ecosystem-service provision [32]. A similar coexistence of ecological protection and urban development has been observed in other rapidly urbanizing small and medium-sized cities. For example, the Suizhou study highlighted that urban expansion can place increasing pressure on ecological space and should therefore be considered together with ecological protection in spatial planning [23]. This comparison suggests that the pattern observed in Nanchong is not unique to the study area, while its specific spatial expression remains dependent on local land-use and environmental conditions.
The spatial redistribution of integrated ecosystem-service zones further demonstrated that ecological improvement was not uniform across the urban region. Although relatively high- and high-service areas expanded between 2018 and 2023, low-service areas also increased, indicating that ecological gains were concentrated in specific restoration landscapes while some urbanized and intensively used areas remained under ecological pressure. The simultaneous expansion of high- and low-service zones, together with the contraction of the medium-service zone, suggests increasing spatial polarization in ecosystem-service provision. High-service areas were mainly associated with hilly forest landscapes, whereas low-service areas were more prevalent in intensively developed or urbanized areas. This spatial differentiation may increase the risk of ecological isolation between high-service ecological patches and urbanized areas, particularly where land-use conversion reduces the continuity of ecological spaces. However, because landscape fragmentation and connectivity were not directly quantified in this study, this interpretation should be regarded as a potential spatial implication rather than a demonstrated increase in fragmentation. Therefore, future ecological planning in hilly cities should not focus solely on increasing forest area, but should also prioritize the protection of high-service ecological patches, the maintenance of transitional and connective functions in medium-service areas, and the enhancement of blue–green connectivity across urban ecological interfaces.
6.2. Contrasting Responses and Drivers of Ecosystem Services
Although all four ecosystem services increased during the study period, their responses to land-use transitions differed substantially in magnitude, sensitivity, and underlying mechanisms.
Soil conservation increased by 30.5%, with forestland accounting for 71.1% of the total increase. Rainfall erosivity also varied between 2018 and 2023, while the K and LS factors were held constant in the analysis. Therefore, the observed change in soil conservation reflects the combined effects of climatic variability and land-use-related changes in vegetation cover and management, rather than land-use change alone. Forest expansion substantially reduced the C factor, particularly where cropland on steep slopes was converted to forest, providing a plausible mechanism for the observed improvement in soil conservation. However, the relative contributions of rainfall erosivity and vegetation recovery cannot be quantitatively separated using the two-period comparison adopted here. The result is consistent with global assessments showing that land-use transitions toward forest landscapes can substantially reduce soil erosion risks through improved vegetation protection and surface stability [51].
Carbon storage showed the smallest relative increase among the four ecosystem services (3.72%). Based on differences in carbon density among land-use types, areas converted from cropland to forest could theoretically contribute approximately 2.90 × 10⁶ t of additional carbon, which was close to the observed increase of 2.38 × 10⁶ t. The difference may reflect the early developmental stage of converted forests and the slower response of soil organic carbon pools. Therefore, the observed increase likely represents an initial carbon-storage response following land-use transition, while additional accumulation may occur as forest ecosystems mature. Similar studies have reported increased regional carbon storage following cropland-to-forest conversion in China, although the magnitude of carbon gains depends strongly on forest age, carbon-density assumptions, and regional environmental conditions [53]. Changes in land-use structure not only directly alter total carbon stocks but also reshape the relative contributions of various carbon pools to the regional total [66].
Water yield exhibited the largest relative increase (43.3%), but its interpretation requires careful consideration of climatic variability and land-use effects. The higher precipitation range in 2023 (1153–1234 mm) than in 2018 (997–1060 mm) may have contributed to the increase in estimated water yield, and the contribution of land-use change cannot be fully isolated using a two-period comparison. Although forestland showed lower water yield per unit area than cropland, forest ecosystems may provide broader hydrological regulation functions through interactions among vegetation structure, soil properties, and water-retention processes [54].
Mean habitat quality increased from 0.4443 to 0.4801, whereas the habitat degradation index also showed a slight increase. This combination indicates spatial restructuring rather than uniform ecological improvement. Areas undergoing cropland-to-forest conversion exhibited improved habitat suitability, while urban-fringe expansion increased exposure to anthropogenic disturbance. Similar patterns have been reported in mountainous urban regions, where ecological restoration and urban development simultaneously reshape habitat conditions and landscape structure [58].
Together, these results demonstrate that ecological restoration and urban expansion operate simultaneously within the same urban system, generating spatially heterogeneous ecosystem-service responses. Peripheral hilly landscapes provided increasing levels of multiple ecosystem services, whereas urban cores remained constrained by intensive land use and ecological fragmentation. This spatial mismatch between ecosystem-service supply and urban demand highlights the importance of improving ecological connectivity between high-service peripheral areas and high-demand urban regions. In Nanchong, blue–green corridors linking key ecological landscapes, such as Lingyun Mountain, the Jialing River corridor, and Fengya Mountain, may provide opportunities to enhance landscape connectivity and improve the delivery of ecosystem services.
6.3. Management Implications of Integrated Ecosystem-Service Zoning
Integrated ecosystem-service zoning revealed a transition from a medium-service-dominated pattern toward greater spatial differentiation, with both high-service and low-service areas expanding between 2018 and 2023. This pattern indicates that ecological restoration and urban development were associated with divergent spatial trajectories of ecosystem-service provision: restoration-related landscapes tended to move toward higher service levels, whereas intensively urbanized areas remained under greater ecological pressure. The resulting spatial differentiation highlights the need for management strategies that maintain ecological continuity across the gradient from high-service conservation areas to medium-service transitional areas and low-service urbanized areas.
Management priorities should therefore be differentiated among ecosystem-service zones. Areas with high levels of ecological service provision and areas with relatively high levels of ecological service provision should be prioritized for inclusion in ecological conservation strategies to ensure their protection. Medium-service areas undergoing landscape transition require adaptive management, including vegetation restoration and the maintenance of ecological connectivity, to retain their potential transitional and connective functions and prevent further degradation. Low-service areas should emphasize green infrastructure development and ecological improvement while accommodating necessary urban growth. Such differentiated management is consistent with ecosystem-service-based ecological zoning frameworks applied in mountainous regions [65]. This planning-oriented use of ecosystem-service information is also supported by studies in other urban contexts. For example, ecosystem-service assessment in Trento, Italy, was used to compare alternative brownfield-regeneration scenarios and inform planning choices [24]. Similarly, the zoning approach used here provides a spatial basis for differentiating conservation, restoration, and development-management priorities in Nanchong.
For Nanchong and comparable hilly cities, ecological planning should additionally consider topographic constraints and ecosystem-service interactions. Purple-soil slopes steeper than 15° represent priority areas where improvements in soil conservation and carbon storage may be achieved simultaneously, while potential effects on water-related services should be carefully evaluated. Integrating topographic sensitivity with ecosystem-service zoning can therefore improve the spatial targeting of restoration investments and support more balanced urban ecological management.
6.4. Limitations and Future Research
This study has several limitations that should be considered when interpreting the results. First, the five-year assessment period may not fully capture long-term or lagged ecosystem-service responses following ecological restoration. Processes such as forest succession, carbon accumulation, and habitat recovery generally occur over longer temporal scales than those represented by the present study. Future research should extend the observation period and incorporate longer-term land-use trajectories to better characterize restoration outcomes.
Second, several model parameters were derived from the regional literature rather than local field measurements, introducing uncertainty into ecosystem-service estimation. Such uncertainty is common in ecosystem-service modeling and highlights the importance of improving parameter calibration through field-based observations and regional datasets [50].
Third, the two-period comparison used here cannot quantitatively separate the relative contributions of precipitation variability and land-use change to climate-sensitive ecosystem-service changes, particularly water yield and soil conservation. Therefore, the results should be interpreted as descriptive changes between 2018 and 2023 rather than as evidence of long-term ecosystem-service trajectories or causal effects of ecological restoration. Future studies should apply scenario-based attribution approaches in which climate and land-use variables are independently controlled to better identify their relative effects on ecosystem-service dynamics.
Fourth, the 30 m land-use dataset may underestimate fine-scale variations in urban ecological infrastructure, particularly in fragmented urban landscapes. The present study also did not directly quantify landscape fragmentation or ecological connectivity, which limits the ability to verify whether the observed spatial polarization corresponds to measurable changes in landscape connectivity. Integrating higher-resolution remote sensing data, landscape-pattern metrics, field surveys, and detailed urban green-space inventories would improve future assessments of ecosystem-service heterogeneity and ecological connectivity.
7. Conclusions
Using InVEST and multisource spatial data, this study quantified changes in four ecosystem services—soil conservation, carbon storage, water yield, and habitat quality—in urban Nanchong from 2018 to 2023 and developed an integrated ecosystem-service zoning framework. The main conclusions are as follows:
- (1)
- Land-use structure underwent substantial transformation during the study period. Forestland increased by 60.7%, with cropland-to-forest conversion representing the dominant transition pathway. The gross conversion from cropland to forest reached 212.40 km2, while the net cropland-to-forest transition was 145.88 km2 after accounting for reverse conversions. This pattern was temporally consistent with the implementation of ecological restoration initiatives such as the GFGP.
- (2)
- All four ecosystem services increased between 2018 and 2023, broadly consistent with the expected direction of H1, but their observed changes differed among service types. Given the two-period comparison, these results indicate temporal change rather than a causal effect of ecological restoration. Soil conservation increased by 30.5%, with forest expansion accounting for most of the increase. The observed change reflected the combined effects of rainfall erosivity and land-use-related vegetation changes, although their relative contributions could not be quantitatively separated. Carbon storage increased by 3.72%, mainly associated with the expansion of forest carbon pools, while the delayed response of soil carbon suggests potential for continued carbon accumulation. Water yield increased by 43.3%, partly reflecting interannual climatic variability, indicating that long-term assessments are required to distinguish hydrological effects of land-use change from climate-driven variation. Habitat quality improved overall but showed increasing spatial differentiation, with persistent degradation pressures near urban expansion zones.
- (3)
- Ecosystem-service patterns were strongly associated with land-use characteristics, broadly consistent with the expectation in H2. Forest landscapes generally showed higher capacity for soil conservation, carbon storage, and habitat maintenance, whereas cropland remained the dominant contributor to water yield. High-service areas were mainly distributed in northern, eastern, and southwestern hilly regions, while built-up areas consistently exhibited lower ecosystem-service provision.
- (4)
- Integrated ecosystem-service zoning revealed a transition from medium-service dominance toward greater spatial differentiation. The proportion of relatively high- and high-service areas increased from 14.54% to 23.20%, while low-service areas also expanded, indicating that ecological improvement was spatially uneven rather than uniform across the urban region. The contraction of medium-service areas suggests that parts of the landscape were moving toward either higher service provision in restoration-related areas or lower service provision under urban development pressure. This polarization highlights the importance of conserving high-service ecological landscapes, maintaining ecological connectivity across transitional areas, and coordinating ecological restoration with urban growth management in hilly cities.
Overall, this study provides spatially explicit evidence of ecosystem-service changes associated with ecological restoration and urban transformation in medium-sized inland cities. Extending time-series observations, improving local parameter calibration, and applying scenario-based attribution approaches will be essential for further clarifying the interactions among climate variability, land-use change, and ecosystem-service responses.
Supplementary Materials
The following supporting information can be downloaded at: https://www.mdpi.com/article/10.3390/land15091668/s1, Table S1: Sensitivity analysis (2018); Table S2: Sensitivity analysis (2023); Figure S1: Monte Carlo uncertainty analysis (2018); Figure S2: Monte Carlo uncertainty analysis (2023); Figure S3: Monte Carlo analysis of uncertainty variations; Figure S4: Spatial distribution of annual precipitation in the study area (2018); Figure S5: Spatial distribution of annual precipitation in the study area (2023); Figure S6: Comprehensive ecosystem services index (2018); Figure S7: Comprehensive ecosystem services index (2023).
Author Contributions
Conceptualization, Z.W. and H.L.; methodology, Z.W. and H.L.; software, H.L.; validation, Z.W. and H.L.; formal analysis, Z.W. and H.L.; investigation, Z.W. and H.L.; resources, Y.W.; data curation, Z.W. and H.L.; writing—original draft preparation, Z.W.; writing—review and editing, Z.W., H.L., Y.W., Y.H. and R.S.; visualization, Z.W. and H.L.; supervision, Y.W.; project administration, Y.W.; funding acquisition, Y.W. All authors have read and agreed to the published version of the manuscript.
Funding
This research received no external funding.
Data Availability Statement
The minimal dataset files supporting the findings of this study are provided in the Supplementary Materials. The raw remote sensing data used in this study are available from the Geospatial Data Cloud (http://www.gscloud.cn, accessed on 6 September 2026). Precipitation data are available from the China Meteorological Administration (http://data.cma.cn, accessed on 6 September 2026). Land-use data are available from the corresponding author upon reasonable request. Processed data and model outputs are included in the Supplementary Materials.
Conflicts of Interest
The authors declare no conflict of interest.
References
- Daily, G.C. (Ed.) Introduction: What are ecosystem services. In Nature’s Services: Societal Dependence on Natural Ecosystems; Island Press: Washington, DC, USA, 1997; p. 1. [Google Scholar]
- Reid, W.V.; Mooney, H.A.; Cropper, A.; Capistrano, D.; Carpenter, S.R.; Chopra, K.; Dasgupta, P.; Dietz, T.; Duraiappah, A.K.; Hassan, R.; et al. Ecosystems and Human Well-Being: Synthesis; Island Press: Washington, DC, USA, 2005. [Google Scholar]
- Wang, Y.; Fu, Q.; Guo, J.; Wang, T.; Chen, J. Unveiling the dynamics of urbanization and ecosystem services: Insights from the Su-Xi-Chang Region, China. npj Urban Sustain. 2024, 4, 36. [Google Scholar] [CrossRef] [Scilit]
- Aronson, J.; Alexander, S. Ecosystem restoration is now a global priority: Time to roll up our sleeves. Restor. Ecol. 2013, 21, 293–296. [Google Scholar] [CrossRef] [Scilit]
- Huang, X.; Ye, C.; Tao, H.; Zou, J.; Zhou, Y.; Zheng, S. Integrating future multi-scenarios to evaluate the effectiveness of ecological restoration: A case study of the Yellow River Basin. Land 2024, 13, 1032. [Google Scholar] [CrossRef] [Scilit]
- La Rosa, D.; Spyra, M.; Inostroza, L. Indicators of Cultural Ecosystem Services for urban planning: A review. Ecol. Indic. 2016, 61, 74–89. [Google Scholar] [CrossRef] [Scilit]
- Yao, Y.; Zheng, H.; Ouyang, Z.; Gong, C.; Zhang, J.; Ying, L.; Wen, Z. Impact of urban green infrastructure on ecosystem services: A systematic review. Ecol. Indic. 2025, 178, 113885. [Google Scholar] [CrossRef] [Scilit]
- Deng, Q.-P.; Liu, G.-Y.; Yang, Q.; Chang, W.-C.; Chen, Y. From two to three dimensions: Advanced techniques for evaluating ecosystem services in urban green spaces. Chin. J. Appl. Ecol./Yingyong Shengtai Xuebao 2025, 36, 2541–2551. [Google Scholar] [CrossRef] [Scilit] [PubMed]
- Jiang, W.; Chen, Z.; Lei, X.; He, B.; Jia, K.; Zhang, Y. Simulation of urban agglomeration ecosystem spatial distributions under different scenarios: A case study of the Changsha–Zhuzhou–Xiangtan urban agglomeration. Ecol. Eng. 2016, 88, 112–121. [Google Scholar] [CrossRef] [Scilit]
- Tian, P.; Liu, Y.; Li, J.; Pu, R.; Cao, L.; Zhang, H. Spatiotemporal patterns of urban expansion and trade-offs and synergies among ecosystem services in urban agglomerations of China. Ecol. Indic. 2023, 148, 110057. [Google Scholar] [CrossRef] [Scilit]
- Ai, X.; Zheng, X.; Zhang, Y.; Liu, Y.; Ou, X.; Xia, C.; Liu, L. Climate and land use changes impact the trajectories of ecosystem service bundles in an urban agglomeration: Intricate interaction trends and driver identification under SSP-RCP scenarios. Sci. Total Environ. 2024, 944, 173828. [Google Scholar] [CrossRef] [Scilit] [PubMed]
- Haase, D.; Larondelle, N.; Andersson, E.; Artmann, M.; Borgström, S.; Breuste, J.; Gomez-Baggethun, E.; Gren, Å.; Hamstead, Z.; Hansen, R.; et al. A quantitative review of urban ecosystem service assessments: Concepts, models, and implementation. Ambio 2014, 43, 413–433. [Google Scholar] [CrossRef] [Scilit] [PubMed]
- Bennett, E.M.; Peterson, G.D.; Gordon, L.J. Understanding relationships among multiple ecosystem services. Ecol. Lett. 2009, 12, 1394–1404. [Google Scholar] [CrossRef] [Scilit] [PubMed]
- Veerkamp, C.; Loreti, M.; Benavidez, R.; Jackson, B.; Schipper, A. Comparing three spatial modeling tools for assessing urban ecosystem services. Ecosyst. Serv. 2023, 59, 101500. [Google Scholar] [CrossRef] [Scilit]
- Sharp, R.; Douglass, J.; Wolny, S.; Arkema, K.; Bernhardt, J.; Bierbower, W.; Chaumont, N.; Denu, D.; Fisher, D.; Glowinski, K.; et al. InVEST User’s Guide; The Natural Capital Project; Stanford University: Stanford, CA, USA, 2020. [Google Scholar]
- Wei, H.; Zhu, H.; Chen, J.; Jiao, H.; Li, P.; Xiong, L. Construction and optimization of ecological security pattern in the loess plateau of China based on the minimum cumulative resistance (MCR) model. Remote Sens. 2022, 14, 5906. [Google Scholar] [CrossRef] [Scilit]
- Li, S.; Zhao, X.; Pu, J.; Miao, P.; Wang, Q.; Tan, K. Optimize and control territorial spatial functional areas to improve the ecological stability and total environment in karst areas of Southwest China. Land Use Policy 2021, 100, 104940. [Google Scholar] [CrossRef] [Scilit]
- Zou, X.; Wang, C.; Que, X.; Ma, X.; Wang, Z.; Fu, Q.; Lai, Y.; Zhuang, X. Spatiotemporal heterogeneous responses of ecosystem services to landscape patterns in Urban–Suburban areas. Sustainability 2024, 16, 3260. [Google Scholar] [CrossRef] [Scilit]
- Sun, M.-M.; Lyu, J.-T.; Li, X.-W.; Li, P.; Xiao, Z.-Y.; Hao, J.-Y.; Zhi, L.-H. Urban-rural difference and scale effect of ecosystem services of blue-green infrastructure. Ying Yong Sheng Tai Xue Bao = J. Appl. Ecol. 2024, 35, 3295–3303. [Google Scholar] [CrossRef] [Scilit] [PubMed]
- Zhang, H.; Liu, S. Exploring the spatial–temporal patterns of urban ecosystem service relationships and their driving mechanisms: A case study of Wuhu City, China. Ecol. Indic. 2024, 167, 112726. [Google Scholar] [CrossRef] [Scilit]
- Wu, H.; Song, F.; Li, H.; Bai, J.; Cui, L.; Su, F.; Kalantari, Z.; Ferreira, C.S. The role of nature reserves in ecosystem services and urban ecological sustainable development. Land 2025, 14, 136. [Google Scholar] [CrossRef] [Scilit]
- Ji, Y.; Xie, M.; Liu, Y.; Zhu, R.; Tang, Z.; Hu, R. How Do Ecological Restoration Projects Affect Trade-Offs and Synergies between Ecosystem Services? Land 2024, 13, 384. [Google Scholar] [CrossRef] [Scilit]
- Chen, J.; Xue, J.; Gu, K.; Wang, Y. Balancing urban expansion with ecological integrity: An ESP framework for rapidly urbanizing small and medium-sized cities, with insights from Suizhou, China. Ecol. Inform. 2024, 80, 102508. [Google Scholar] [CrossRef] [Scilit]
- Cortinovis, C.; Geneletti, D. Mapping and assessing ecosystem services to support urban planning: A case study on brownfield regeneration in Trento, Italy. One Ecosyst. 2018, 3, e25477. [Google Scholar] [CrossRef] [Scilit]
- Esmail, B.A.; Geneletti, D. Design and impact assessment of watershed investments: An approach based on ecosystem services and boundary work. Environ. Impact Assess. Rev. 2017, 62, 1–13. [Google Scholar] [CrossRef] [Scilit]
- UN-Habitat. World Cities Report 2022: Envisaging the Future of Cities; United Nations: New York, NY, USA, 2022. [Google Scholar]
- Wu, J. Landscape sustainability science: Ecosystem services and human well-being in changing landscapes. Landsc. Ecol. 2013, 28, 999–1023. [Google Scholar] [CrossRef] [Scilit]
- Fang, C.; Yu, D. Urban agglomeration: An evolving concept of an emerging phenomenon. Landsc. Urban Plan. 2017, 162, 126–136. [Google Scholar] [CrossRef] [Scilit]
- Xu, Z.; Xu, J.; Deng, X.; Huang, J.; Uchida, E.; Rozelle, S. Grain for green versus grain: Conflict between food security and conservation set-aside in China. World Dev. 2006, 34, 130–148. [Google Scholar] [CrossRef] [Scilit]
- Feng, X.; Fu, B.; Lu, N.; Zeng, Y.; Wu, B. How ecological restoration alters ecosystem services: An analysis of carbon sequestration in China’s Loess Plateau. Sci. Rep. 2013, 3, 2846. [Google Scholar] [CrossRef] [Scilit] [PubMed]
- Liu, J.; Li, S.; Ouyang, Z.; Tam, C.; Chen, X. Ecological and socioeconomic effects of China’s policies for ecosystem services. Proc. Natl. Acad. Sci. USA 2008, 105, 9477–9482. [Google Scholar] [CrossRef] [Scilit] [PubMed]
- Bryan, B.A.; Gao, L.; Ye, Y.; Sun, X.; Connor, J.D.; Crossman, N.D.; Stafford-Smith, M.; Wu, J.; He, C.; Yu, D.; et al. China’s response to a national land-system sustainability emergency. Nature 2018, 559, 193–204. [Google Scholar] [CrossRef] [Scilit] [PubMed]
- Li, J.; Pan, Y.; Wang, X. Assessing the Cost-Effectiveness of Ecological Restoration Programs Across China’s Desert and Desertification-Prone Regions by Integrating Vegetation Dynamics and Investment Data. Land 2025, 14, 2220. [Google Scholar] [CrossRef] [Scilit]
- Zhu, Z.; Zhang, J.; Yang, Z.; Aljaddani, A.H.; Cohen, W.B.; Qiu, S.; Zhou, C. Continuous monitoring of land disturbance based on Landsat time series. Remote Sens. Environ. 2020, 238, 111116. [Google Scholar] [CrossRef] [Scilit]
- Zhu, Z.; Wang, S.; Woodcock, C.E. Improvement and expansion of the Fmask algorithm: Cloud, cloud shadow, and snow detection for Landsats 4–7, 8, and Sentinel 2 images. Remote Sens. Environ. 2015, 159, 269–277. [Google Scholar] [CrossRef] [Scilit]
- Peng, J.; Zhang, Z.; Lin, Y.; Tang, H.; Xu, Z.; Zheng, H. Unveiling decoupled social-ecological networks of great lake basin: An ecosystem services approach. Earth’s Future 2024, 12, E2024EF004994. [Google Scholar] [CrossRef] [Scilit]
- Gao, Y.; Song, C.; Wang, Y.; Ye, S.; Gao, P. Carbon storage prediction of terrestrial ecosystems and hotspot analysis in Sichuan Province by considering land use intensity and eco-economic trade-offs. Acta Ecol. Sin. 2024, 44, 3958–3969. [Google Scholar]
- Wang, R.-Y.; Mo, X.; Ji, H.; Zhu, Z.; Wang, Y.-S.; Bao, Z.; Li, T. Comparison of the CASA and InVEST models’ effects for estimating spatiotemporal differences in carbon storage of green spaces in megacities. Sci. Rep. 2024, 14, 5456. [Google Scholar] [CrossRef] [Scilit] [PubMed]
- Cord, A.; Bartkowski, B.; Beckmann, M.; Dittrich, A.; Hermans-Neumann, K.; Kaim, A.; Lienhoop, N.; Locher-Krause, K.; Priess, J.; Schröter-Schlaack, C.; et al. Towards systematic analyses of ecosystem service trade-offs and synergies: Main concepts, methods and the road ahead. Ecosyst. Serv. 2017, 28, 264–272. [Google Scholar] [CrossRef] [Scilit]
- Chaplin-Kramer, R.; Sharp, R.P.; Weil, C.; Bennett, E.M.; Pascual, U.; Arkema, K.K.; Brauman, K.A.; Bryant, B.P.; Guerry, A.D.; Haddad, N.M.; et al. Global modeling of nature’s contributions to people. Science 2019, 366, 255–258. [Google Scholar] [CrossRef] [Scilit] [PubMed]
- De Groot, R.S.; Alkemade, R.; Braat, L.; Hein, L.; Willemen, L. Challenges in integrating the concept of ecosystem services and values in landscape planning, management and decision making. Ecol. Complex. 2010, 7, 260–272. [Google Scholar] [CrossRef] [Scilit]
- Fu, B.; Zhang, L.; Xu, Z.; Zhao, Y.; Wei, Y.; Skinner, D. Ecosystem services in changing land use. J. Soils Sediments 2015, 15, 833–843. [Google Scholar] [CrossRef] [Scilit]
- Shi, Z.H.; Cai, C.F.; Ding, S.W.; Wang, T.W.; Chow, T.L. Soil conservation planning at the small watershed level using RUSLE with GIS: A case study in the Three Gorge Area of China. Catena 2004, 55, 33–48. [Google Scholar] [CrossRef] [Scilit]
- Fu, B.; Liu, Y.; Lü, Y.; He, C.; Zeng, Y.; Wu, B. Assessing the soil erosion control service of ecosystems change in the Loess Plateau of China. Ecol. Complex. 2011, 8, 284–293. [Google Scholar] [CrossRef] [Scilit]
- Foody, G.M. Status of land cover classification accuracy assessment. Remote Sens. Environ. 2002, 80, 185–201. [Google Scholar] [CrossRef] [Scilit]
- Benavidez, R.; Jackson, B.; Maxwell, D.; Norton, K. A review of the (Revised) Universal Soil Loss Equation ((R) USLE): With a view to increasing its global applicability and improving soil loss estimates. Hydrol. Earth Syst. Sci. 2018, 22, 6059–6086. [Google Scholar] [CrossRef] [Scilit]
- Alewell, C.; Borrelli, P.; Meusburger, K.; Panagos, P. Using the USLE: Chances, challenges and limitations of soil erosion modelling. Int. Soil Water Conserv. Res. 2019, 7, 203–225. [Google Scholar] [CrossRef] [Scilit]
- Teng, H.; Rossel, R.A.V.; Shi, Z.; Behrens, T.; Chappell, A.; Bui, E. Assimilating satellite imagery and visible–near infrared spectroscopy to model and map soil loss by water erosion in Australia. Environ. Model. Softw. 2016, 77, 156–167. [Google Scholar] [CrossRef] [Scilit]
- Li, H.; Chen, J.; Ling, M.; Chen, Z.; Lan, Y.; Huang, Q.; Li, X.; You, H.; Wang, F.; Han, X.; et al. A framework for dynamic assessment of soil erosion and detection of driving factors in alpine grassland ecosystems using the RUSLE-InVEST (SDR) model and Geodetector: A case study of the source region of the Yellow River. Ecol. Inform. 2025, 85, 102928. [Google Scholar] [CrossRef] [Scilit]
- Hamel, P.; Bryant, B.P. Uncertainty assessment in ecosystem services analyses: Seven challenges and practical responses. Ecosyst. Serv. 2017, 24, 1–15. [Google Scholar] [CrossRef] [Scilit]
- Borrelli, P.; Robinson, D.A.; Fleischer, L.R.; Lugato, E.; Ballabio, C.; Alewell, C.; Meusburger, K.; Modugno, S.; Schütt, B.; Ferro, V.; et al. An assessment of the global impact of 21st century land use change on soil erosion. Nat. Commun. 2017, 8, 2013. [Google Scholar] [CrossRef] [Scilit] [PubMed]
- Clerici, N.; Cote-Navarro, F.; Escobedo, F.J.; Rubiano, K.; Villegas, J.C. Spatio-temporal and cumulative effects of land use-land cover and climate change on two ecosystem services in the Colombian Andes. Sci. Total Environ. 2019, 685, 1181–1192. [Google Scholar] [CrossRef] [Scilit] [PubMed]
- Shao, Z.; Chen, C.; Liu, Y.; Cao, J.; Liao, G.; Lin, Z. Impact of land use change on carbon storage based on FLUS-InVEST model: A case study of Chengdu–Chongqing urban agglomeration, China. Land 2023, 12, 1531. [Google Scholar] [CrossRef] [Scilit]
- Donohue, R.J.; Roderick, M.L.; McVicar, T.R. Roots, storms and soil pores: Incorporating key ecohydrological processes into Budyko’s hydrological model. J. Hydrol. 2012, 436, 35–50. [Google Scholar] [CrossRef] [Scilit]
- Hu, Z.; Cao, L.; Li, J.; Liu, R. Carbon Storage Response to Land Use Change and SSP-RCP Scenario Simulation: A Case Study of Coastal Area in China. Land 2026, 15, 1137. [Google Scholar] [CrossRef] [Scilit]
- Zhang, L.; Dawes, W.R.; Walker, G.R. Response of mean annual evapotranspiration to vegetation changes at catchment scale. Water Resour. Res. 2001, 37, 701–708. [Google Scholar] [CrossRef] [Scilit]
- Nelson, E.; Mendoza, G.; Regetz, J.; Polasky, S.; Tallis, H.; Cameron, D.R.; Chan, K.M.A.; Daily, G.C.; Goldstein, J.; Kareiva, P.M.; et al. Modeling multiple ecosystem services, biodiversity conservation, commodity production, and tradeoffs at landscape scales. Front. Ecol. Environ. 2009, 7, 4–11. [Google Scholar] [CrossRef] [Scilit]
- Wei, W.; Bao, Y.; Wang, Z.; Chen, X.; Luo, Q.; Mo, Y. Response of habitat quality to urban spatial morphological structure in multi-mountainous city. Ecol. Indic. 2023, 146, 109877. [Google Scholar] [CrossRef] [Scilit]
- Li, W.; Kang, J.; Wang, Y. Distinguishing the relative contributions of landscape composition and configuration change on ecosystem health from a geospatial perspective. Sci. Total Environ. 2023, 894, 165002. [Google Scholar] [CrossRef] [Scilit] [PubMed]
- Wu, L.; Fan, F. Assessment of ecosystem services in new perspective: A comprehensive ecosystem service index (CESI) as a proxy to integrate multiple ecosystem services. Ecol. Indic. 2022, 138, 108800. [Google Scholar] [CrossRef] [Scilit]
- Piao, S.; Fang, J.; Ciais, P.; Peylin, P.; Huang, Y.; Sitch, S.; Wang, T. The carbon balance of terrestrial ecosystems in China. Nature 2009, 458, 1009–1013. [Google Scholar] [CrossRef] [Scilit] [PubMed]
- Gan, X.; Fernandez, I.C.; Guo, J.; Wilson, M.; Zhao, Y.; Zhou, B.; Wu, J. When to use what: Methods for weighting and aggregating sustainability indicators. Ecol. Indic. 2017, 81, 491–502. [Google Scholar] [CrossRef] [Scilit]
- You, C.; Qu, H.; Wang, C.; Feng, C.-C.; Guo, L. Trade-off and synergistic of ecosystem services supply and demand based on socio-ecological system (SES) in typical hilly regions of south China. Ecol. Indic. 2024, 160, 111749. [Google Scholar] [CrossRef] [Scilit]
- Liu, H.; Tang, D. Ecological zoning and ecosystem management based on landscape ecological risk and ecosystem services: A case study in the Wuling Mountain Area. Ecol. Indic. 2024, 166, 112421. [Google Scholar] [CrossRef] [Scilit]
- Burkhard, B.; Kroll, F.; Nedkov, S.; Müller, F. Mapping ecosystem service supply, demand and budgets. Ecol. Indic. 2012, 21, 17–29. [Google Scholar] [CrossRef] [Scilit]
- Chang, X.; Xing, Y.; Wang, J.; Yang, H.; Gong, W. Effects of land use and cover change (LUCC) on terrestrial carbon stocks in China between 2000 and 2018. Resour. Conserv. Recycl. 2022, 182, 106333. [Google Scholar] [CrossRef] [Scilit]

Disclaimer/Publisher’s Note: The statements, opinions and data contained in all publications are solely those of the individual author(s) and contributor(s) and not of MDPI and/or the editor(s). MDPI and/or the editor(s) disclaim responsibility for any injury to people or property resulting from any ideas, methods, instructions or products referred to in the content. |
© 2026 by the authors. Licensee MDPI, Basel, Switzerland. This article is an open access article distributed under the terms and conditions of the Creative Commons Attribution (CC BY) license.