


Abstract
Place attachment is important in urban planning and environmental psychology, yet the relationships among spatial, behavioral, and experiential factors and place attachment remain insufficiently understood. This cross-sectional study examined these associations among users engaged with Shimokitazawa, Tokyo. A purposive sample of 127 participants evaluated three spatial areas each, yielding 381 evaluations nested within respondents. Structural equation modeling (SEM) using maximum likelihood estimation with robust standard errors (MLR) and respondent-level clustering was complemented by exploratory group comparison and qualitative text analysis. The results distinguished Physical Environment from Natural Sensory Environment. Natural Sensory Environment was positively associated with Place Attachment (β = 0.452), whereas Physical Environment showed positive associations with Behavioral (β = 0.269) and Experiential Factors (β = 0.530), as well as a positive total indirect association with Place Attachment (β = 0.472). Exploratory analyses identified four descriptive orientations—identity-, everyday-life-, repeated-experience-, and perception-oriented—but provided no statistically robust evidence of between-group differences in structural associations. The findings provide preliminary support for a conceptual framework linking spatial, behavioral, and experiential factors with place attachment and highlight the potential importance of environmental quality and opportunities for repeated engagement. Given the cross-sectional, non-probability sample and single-case context, causal, developmental, and broader population-level generalizations require further investigation.
1. Introduction
1.1. Background
Rapid urbanization and large-scale redevelopment have significantly transformed contemporary cities. However, such processes have also contributed to the emergence of “placelessness”, characterized by the erosion of local distinctiveness and the increasing homogenization of urban landscapes [1]. Relph argued that modern development often leads to the “casual eradication of distinctive places” and the production of standardized environments. Subsequent studies have suggested that the weakening of place identity and sense of place may reduce people’s emotional connections with the urban environment [2].
At the same time, Japan is facing a rapidly aging and shrinking population. According to the Annual Report on the Ageing Society, people aged 65 years and over accounted for 29.3% of the national population in 2025 [3]. Population decline and aging have created serious challenges for local community management and regional sustainability, particularly through the shortage of future community actors [4].
Therefore, fostering place attachment and community participation has become an important issue for sustainable urban development.
1.2. Place Attachment
Place attachment, generally defined as an emotional bond between people and places [5], has attracted increasing attention as a potential driver of community participation and community sustainability. Previous research has shown that individuals with stronger place attachment are more willing to participate in community activities and contribute to local development [6]. Moreover, place attachment has been found to be positively associated with subjective well-being, life satisfaction, and sense of belonging [7]. Place attachment has increasingly become recognized as an important consideration in spatial planning, as it influences residents’ support for local development and contributes to community sustainability [8]. Accordingly, exploring the formation of place attachment may provide useful insights for sustainable community development and people-centered urban planning.
1.3. Previous Studies on Place Attachment Formation
The Person–Place–Process framework has been proposed [9] to conceptualize place attachment as an interaction among three dimensions: the Person dimension, referring to individual and collective meanings associated with a place; the Place dimension, referring to the physical and social characteristics of the environment; and the Process dimension, encompassing affective, cognitive, and behavioral mechanisms through which place attachment is formed. This framework provides an integrative perspective for understanding the diverse factors contributing to place attachment.
Previous studies have identified numerous factors influencing place attachment, including physical and social environments [10], individual characteristics [11], interactions with local culture [12], and temporal dimensions such as length of residence and accumulated experiences [13]. A review of place attachment research further suggested that place attachment emerges through the combined influence of personal, social, and environmental contexts [14]. More recent empirical research has also demonstrated associations between characteristics of the built or material environment and place attachment [15], while structural equation modeling (SEM)-based studies have examined relationships among material environment, social environment, place attachment, and quality of life [16]. However, these relationships have often been examined as selected antecedents or consequences of place attachment rather than as an integrated process linking spatial, behavioral, and experiential factors, and place attachment.
Differences among place users also warrant consideration. Previous studies have shown that residents, visitors, and work-related users may differ in the factors associated with place attachment, reflecting differences in their activities, involvement, and accumulated experiences with a place [17,18,19,20]. However, it remains unclear whether such differences are also reflected in the structural relationships among spatial environments, behaviors, experiences, and place attachment, or whether particular pathways become more prominent for different types of users.
Lewicka [21] pointed out that research on place attachment has disproportionately emphasized the Person dimension, whereas comparatively less attention has been paid to the Place and Process dimensions and their interactions. Thus, despite extensive evidence concerning individual antecedents of place attachment, how spatial, behavioral, and experiential factors are structurally connected within place attachment formation remains insufficiently understood.
From the perspective of urban design and spatial planning, understanding how place attachment emerges through interactions between spatial, behavioral, and experiential factors is particularly important. To address this gap, an exploratory qualitative study was recently conducted in Shimokitazawa [22]. A participatory workshop involving ten residents and visitors classified participants into three groups: long-term residents (living in the area for more than 10 years), short-term residents (living in the area for less than 10 years), and visitors. Participants identified places to which they felt attached by selecting photographs and explaining their reasons, and the workshop discussions were analyzed using KH Coder.
The analysis identified four preliminary categories of factors influencing place attachment—spatial, behavioral, short-term experiential, and long-term experiential factors—and suggested distinct patterns associated with place attachment across the three participant groups. Visitors emphasized spatial perception and consumption-related experiences, and short-term residents emphasized everyday activities and hobby-related participation; in contrast, long-term residents more frequently emphasized accumulated experiences, social relationships, and community involvement. Rather than representing observed transitions between developmental stages, these exploratory patterns informed the construction of the integrated conceptual model examined in the present study.
However, because the previous study relied on qualitative analysis based on a small sample, its preliminary patterns had not been quantitatively examined. Therefore, the present study suggests a spatially grounded conceptual framework linking spatial, behavioral, and experiential factors, and place attachment and examines the proposed structural associations using SEM. Group comparison is further conducted exploratorily to examine whether these associations show different patterns among users with different relationships with the area.
1.4. Theoretical Framework, Research Questions, and Hypotheses Model
The theoretical framework of this study is grounded in the Person–Place–Process framework of place attachment [9]. The confirmatory component focuses specifically on the relationships between the Place and Process dimensions, asking how spatial environments are associated with behavioral and experiential factors and, ultimately, with place attachment.
The concept of affordance [23] suggests that physical environments contain information that offer possibilities for action to individuals. These affordances are directly perceived through perceptual systems and shape how people interact with their surroundings. In this sense, spatial environments do not merely serve as passive settings but actively guide and constrain human behaviors.
From the perspective of experiential theory [24], experience is a continuous process of interaction between humans and environments. Experience emerges through action and reflection and is continuously reconstructed through ongoing engagement with the world. Taken together, these perspectives provide a theoretical basis for a possible sequential relationship in which environmental characteristics provide opportunities for action, and actions contribute to experience.
Furthermore, memory research has suggested that environmental information may be retained and reorganized through repeated processing, and gradually consolidated into long-term memory [25]. Extending this cognitive mechanism to urban environments, Hiroshi Hara’s theory of Urban Modality proposes that the overall image and meaning of a city emerge through the accumulation and integration of diverse spatial experiences [26]. These theories provide a conceptual basis for understanding how accumulated experiences may connect repeated interactions to more enduring emotional bonds with place.
Based on these theoretical perspectives and the preliminary hypotheses derived from the previous exploratory workshop [22], the present study addresses the following confirmatory research question:
RQ1. How are spatial, behavioral, and experiential factors structurally related to place attachment in an urban context?
The following directional hypotheses are proposed:
H1.
Spatial Factors are positively associated with Place Attachment.
H2.
Spatial Factors are positively associated with Behavioral Factors.
H3.
Spatial Factors are positively associated with Experiential Factors.
H4.
Behavioral Factors are positively associated with Experiential Factors.
H5.
Behavioral Factors are positively associated with Place Attachment.
H6.
Experiential Factors are positively associated with Place Attachment.
To operationalize H1–H6, an initial hypothesized SEM was constructed with four conceptual domains: Spatial Factors, Behavioral Factors, Experiential Factors, and Place Attachment. The observed indicators corresponding to each latent construct are shown in Figure 1.
Figure 1.
Hypothesized model of place attachment formation.
The measurement of place attachment was based on the scale proposed by Suzuki and Fujii [6], which conceptualizes place attachment consisting of three dimensions: Preference, Emotional Attachment, and Desire for Continuity. These three dimensions were adopted as observed variables representing the latent variable Place Attachment. In contrast, the observed indicators of Spatial Factors, Behavioral Factors, and Experiential Factors were developed from the categories identified in the previous workshop study [22] and reorganized according to the theoretical framework of the present study. Thus, Place Attachment was measured using an existing validated scale, whereas the other three constructs were operationalized using study-specific items derived from the preceding qualitative research.
Particular attention was given to the distinction between conceptually adjacent indicators. Within Experiential Factors, Familiarity represents knowledge, recognition, and spatial cognition accumulated through encounters with the area, whereas Recommendation Intention represents an evaluative response based on respondents’ experiences and assessment of the area. In contrast, Preference emphasizes respondents’ own affective liking, comfort, and positive feelings toward the area and was retained as an indicator of Place Attachment.
Although Person-related factors, including individual characteristics, social identity, and collective meanings, are important determinants of place attachment, they represent a different analytical dimension from the spatially oriented focus of the present study. The confirmatory hypothesized model therefore does not attempt to incorporate all possible individual and social determinants. To complement this spatially focused analysis, heterogeneity among users is further examined through an exploratory research question:
RQ2. How do structural associations related to place attachment vary across user groups characterized by different patterns of engagement with the area?
Through these confirmatory and exploratory analyses, the study seeks to clarify how spatial, behavioral, and experiential factors are structurally associated with place attachment and provide practical implications for urban planning and community design aimed at fostering meaningful relationships between people and place.
2. Materials and Methods
This section describes the research design adopted to examine the proposed structural framework, including the study area, questionnaire survey, sampling procedure, and analytical methods.
The theoretical hypothesis SEM was examined using questionnaire data collected in Shimokitazawa. Because each respondent evaluated three spatial units, the resulting observations had a clustered structure, with three spatial evaluations nested within each respondent. Accordingly, the hypothesized model was estimated in R (version 4.5.1) using the lavaan package (version 0.7.2), under maximum likelihood estimation with robust standard errors (MLR) and respondent-level clustering [27,28]. Multi-group analysis was subsequently conducted as an exploratory analysis to examine whether the estimated structural pathways exhibited varying patterns across users with different relationships with the area. Qualitative analysis of open-ended responses was used to complement the quantitative findings.
2.1. Study Area
Shimokitazawa is a neighborhood located in the northeastern part of Setagaya Ward, Tokyo. Shimokitazawa Station is located at approximately North latitude 35.6609°, east latitude 139.6666°, where the Odakyu Odawara Line and Keio Inokashira Line intersect. The area is characterized by a complex network of narrow streets and varied topography, with lower elevations to the south of the station and higher terrain toward the west. In this study, the research area was operationally defined as the area within a 1 km radius of the station, corresponding to approximately 3.19 km2. Figure 2 shows the study boundary, the Southwest and Northeast Areas, major urban features, and questionnaire recruitment locations.
Figure 2.
Map of the study area.
The historical development of Shimokitazawa is closely associated with railway expansion. Following the opening of the Odakyu Line in 1927 and the Inokashira Line in 1933, the area gradually transformed from a rural settlement into a suburban residential district. After World War II, population and commercial activities increased, leading to the formation of several shopping streets that still define the urban landscape today [29]. During the 1960s and 1970s, university campuses and youth culture contributed to the emergence of jazz cafés, live music venues, vintage clothing stores, and other cultural facilities, establishing Shimokitazawa as a center of music, theater, and subculture [30,31]. Since the 1990s, the area has also become known for its diverse curry restaurants and cultural events [32].
A major turning point occurred through the railway undergrounding and redevelopment projects associated with the Odakyu Line. The redevelopment process involved long-term discussions among residents, businesses, planners, and government agencies [33]. Following the undergrounding, new public and commercial spaces—including Shimokita Senrogai, Bonus Track, Nohara Hiroba, Mikan Shimokita, and Reload—were introduced along the former railway site after 2019. This combination of historically established residential and commercial environments, recent redevelopment, and diverse forms of everyday use makes Shimokitazawa particularly suitable for examining relationships between spatial environments and place attachment.
Previous research has shown that the two railway lines divide Shimokitazawa into four zones with distinct spatial characteristics [34]. Historically, the western and southern districts have remained predominantly residential, whereas commercial and cultural functions have become concentrated around the station and in the northern and eastern districts. More recent redevelopment has further reinforced the contrast between these areas. According to the Kitazawa Design Conference organized by Setagaya City [35], the former railway site on the southwest side includes newly developed open and green spaces, whereas the northeast side includes the station plaza and commercial facilities such as Reload. For the questionnaire, the Keio Inokashira Line was used as the operational boundary between the Southwest and Northeast Areas. Because the line runs largely on an elevated structure through Shimokitazawa, with crossings limited to several underpasses and level crossings, it forms a visually clear geographic landmark and a partial physical barrier between the two areas.
Today, Shimokitazawa attracts residents, workers, and visitors through its music, theater, fashion, food culture, shopping streets, and redeveloped railway spaces. At the same time, redevelopment and increasing visitor activity have generated challenges related to environmental management, public safety, and residential livability [36]. The coexistence of contrasting spatial environments and heterogeneous place users therefore provides an appropriate empirical setting for the present study.
2.2. Questionnaire Survey
The questionnaire was designed based on the hypothesized model and the measurement framework described in Section 1.4. The questionnaire was originally developed and administered in Japanese. For reporting and reproducibility, the Japanese questionnaire and its English translation are provided as Supplementary Materials S1. The English version was translated by the authors from the original Japanese questionnaire and was used for reporting purposes only; all participants completed the Japanese version.
The questionnaire consisted of five sections summarized in Table 1. Questionnaire Section 1 collected respondents’ personal attributes. Employment status was collected as a broad descriptive attribute of respondents and included categories reflecting their primary employment or social status. Section 2, Section 3 and Section 4 measured spatial, behavioral, and experiential factors, respectively, corresponding to the observed variables in the hypothesis model. Section 5 measured place attachment using the scale proposed by Suzuki and Fujii [6].
Table 1.
Summary of questionnaire design and measurement items.
Spatial and experiential evaluations and place attachment were measured using five-point Likert-type scales: 1 = “strongly disagree” (全く思わない), 2 = “somewhat disagree” (やや思わない), 3 = “neither agree nor disagree” (どちらともいえない), 4 = “somewhat agree” (やや思う), and 5 = “strongly agree” (非常に思う). Behavioral Factors were measured by the frequency of activities during the previous year using a five-point frequency scale: 1 = “almost never” (ほぼしない), 2 = “approximately 1–3 times per year” (年に1~3回程度), 3 = “approximately 1–3 times per month” (月に1~3回程度), 4 = “approximately 1–2 times per week” (週に1~2回程度), and 5 = “almost every day” (ほぼ毎日). Furthermore, open-ended questions were included to collect respondents’ reasons for place attachment or non-attachment and their suggestions for the future development of the area. These responses were subsequently used as material to complement the quantitative analysis.
Respondents evaluated the Southwest Area, Northeast Area, and Shimokitazawa as a whole using the same measurement items in Section 2, Section 3, Section 4 and Section 5. The evaluation blocks were presented in fixed order. Because the survey used open recruitment, respondents were not required to have an equivalent level of familiarity with both subareas. Familiarity was explicitly measured as an experiential indicator for each evaluated spatial unit, thereby allowing differences in respondents’ knowledge and recognition of the areas to be represented in the analysis.
Before the main survey, the questionnaire was pilot-tested with 10 participants to assess the clarity and comprehensibility of the wording, response options, and questionnaire structure. Based on participant feedback, the questionnaire was reviewed and minor adjustments were made before the formal survey.
2.2.1. Sampling and Recruitment
The questionnaire survey was conducted between August and September 2025 within the study area.
A purposive, non-probability sampling strategy was employed through multiple local and public recruitment channels (Figure 2). Importantly, the present study does not assume that this strategy produced a representative sample of all Shimokitazawa users or the full distribution of place attachment from non-attached to strongly attached individuals. Because several recruitment channels were connected to local organizations and place-related networks, respondents with an existing interest in or engagement with Shimokitazawa are likely to be overrepresented. The study should therefore be interpreted as examining structural relationships among users who had sufficient engagement with Shimokitazawa to evaluate the area, without estimating the distribution or formation of place attachment among the entire user population.
Paper questionnaires were placed at Shimokita Engeibu and the long-established local store Sankatu to reach older residents who actively participated in local activities but used social media less frequently. In addition, QR-code posters linking to the online questionnaire were displayed on 20 public bulletin boards around the station with permission from Setagaya City, enabling participation by ordinary residents and visitors who were not affiliated with local organizations. Online questionnaires were distributed via LINE and e-mail through local organizations, including Shimokita Engeibu, the Shopping Street Association, neighborhood associations (Chōkai/Jichikai), the Community Development Council (Machizukuri Kyōgikai), and Shimokita College, primarily targeting users with relatively high levels of community involvement. The survey was further disseminated through the online community I Love Shimokitazawa, extending the sample to include visitors and people interested in the area outside the local community. Brief descriptions of these local organizations, together with their official websites or reference sources, are provided in Appendix A. The incentive was a 500 yen Amazon gift certificate. The same incentive was provided for paper-based and online respondents.
These channels were intentionally combined to reach residents, workers, frequent users, and visitors with different forms of engagement with the area. However, recruitment through community organizations may have contributed to the relatively high proportion of respondents reporting local organizational membership. This sampling characteristic limits the generalizability to the broader population of Shimokitazawa users.
2.2.2. Data Screening and Analytical Data Structure
A total of 223 responses were collected. Following the dissemination of the online questionnaire through online community, a large number of responses were received within a short period. Given the possibility that some respondents might have submitted multiple responses or used automated methods to obtain the participation incentive, a stricter data-screening procedure was adopted to ensure data quality. As a result, 127 valid responses were retained for subsequent analyses. Because this represents a substantial proportion of the initial submissions (43.0%), the exclusion process is reported transparently in Table 2.
Table 2.
Data-screening criteria and number of uniquely excluded responses.
Potential duplicate submissions were identified by examining submission timestamps and response patterns. The attention-check item was placed at the end of the online questionnaire and instructed respondents: “If you are not a robot, please enter ‘了解です’ (‘Understood’).” A response was considered to have passed the attention check only when the response field contained exactly “了解です,” with no additional text. Because individual submissions could meet more than one exclusion criterion, each excluded submission was assigned a primary reason to avoid double counting. Table 2 reports the number of uniquely excluded responses under each primary criterion.
Before beginning the questionnaire, respondents were informed of the study purpose, the voluntary nature of participation, the intended use of the collected data, and their right to discontinue participation. Personally identifiable information was removed from the analytical dataset prior to analysis and stored separately from the data used for statistical analysis. During the de-identification process, each respondent was assigned a unique Respondent ID based on the chronological order of questionnaire submission. This ID contained no personally identifiable information and was used solely to link the three spatial evaluations provided by the same respondent and to account for respondent-level clustering in the subsequent statistical analyses. All analyses were conducted using the resulting de-identified dataset.
The final sample consisted of 127 respondents. Each respondent evaluated three spatial units, yielding 381 spatial evaluations. These 381 evaluations constitute repeated observations nested within 127 respondents. To assess the extent of within-respondent dependence, intraclass correlation coefficients (ICCs) were calculated for the five principal constructs using random-intercept models. The ICCs ranged from 0.580 to 0.727, indicating substantial clustering of the three spatial evaluations within respondents. Accordingly, all primary confirmatory factor analysis (CFA) and SEM analyses were estimated in R using the lavaan package under maximum likelihood estimation with robust standard errors (MLR) and respondent-level clustering. This approach retains the information contained in the three spatial evaluations while adjusting standard errors and test statistics for their non-independence.
2.3. Data Analysis
The analysis proceeded in five stages: (1) descriptive statistics; (2) measurement model assessment; (3) respondent-clustered robust SEM; (4) exploratory group comparison; and (5) qualitative analysis of open-ended responses.
Descriptive statistics were first examined to summarize respondent characteristics and overall evaluation tendencies. Questionnaire responses were numerically coded prior to statistical analysis. Five-point evaluative items were coded from 1 (strongly disagree) to 5 (strongly agree), and behavioral-frequency items were coded from 1 (almost never) to 5 (almost every day), referring to activities during the previous year.
Exploratory factor analysis (EFA) was applied to the 18 self-developed spatial, behavioral, and experiential indicators. Sampling adequacy was evaluated using the Kaiser–Meyer–Olkin (KMO) measure and Bartlett’s test of sphericity. Factor retention was determined using parallel analysis, and principal axis factoring (PAF) with oblimin rotation was applied to the polychoric correlation matrix [37]. Because the Spatial Factors constituted the starting domain of the proposed framework, a supplementary EFA was also conducted on the five spatial indicators to examine their dimensionality. Alternative measurement structures suggested by these analyses were subsequently evaluated through CFA model comparison.
CFA was subsequently conducted for all latent constructs, including Place Attachment. Because the data consisted of repeated spatial evaluations nested within respondents, the final CFA models were estimated in R using the lavaan package with MLR estimation and respondent ID specified as the clustering variable [27,28]. Competing measurement structures were compared using robust fit indices and Satorra–Bentler scaled chi-square difference test. The following were also assessed: internal consistency using Cronbach’s alpha (α); composite reliability using Composite Reliability (CR); convergent validity using standardized factor loadings and Average Variance Extracted (AVE); and discriminant validity using the Fornell–Larcker criterion and Heterotrait–Monotrait Ratio (HTMT).
The hypothesized model was estimated in R using the lavaan package under maximum likelihood estimation with robust standard errors (MLR) and respondent-level clustering [27,28]. Because the original Spatial Factors construct was represented by two correlated dimensions in the retained measurement model, H1–H3 were operationalized as corresponding paths from Physical Environment and Natural Sensory Environment, whereas H4–H6 remained unchanged. Model fit was evaluated primarily using robust comparative fit index (CFI), Tucker–Lewis index (TLI), root mean square error of approximation (RMSEA) with its confidence interval, and standardized root mean square residual (SRMR), together with robust/scaled chi-square statistics. The direction, magnitude, and statistical significance of standardized structural coefficients were examined in relation to the hypotheses.
Direct, indirect, and total effects were subsequently estimated within the Final Model. Confidence intervals were obtained using respondent-level cluster bootstraps with 5000 valid resamples. Supplementary sensitivity analyses examined the stability and interpretation of the structural results, including the reverse specification of the Behavioral Factors–Experiential Factors relationship and the exclusion of Community Participation from the Behavioral Factors construct. To further examine the negative conditional coefficient of Physical Environment, a sequential latent-variable decomposition was conducted using the same five-factor measurement specification. The results of this diagnostic analysis are interpreted in Section 4.1.2 [38]. Given the cross-sectional design, directional paths were interpreted as theoretically specified associations, not as evidence of temporal or causal sequence.
Descriptive differences among the Whole, Southwest, and Northeast Areas were additionally examined using linear mixed-effects models with Respondent ID specified as a random intercept, followed by Bonferroni-adjusted pairwise comparisons.
Multi-group analysis was conducted to address RQ2 as an exploratory component of the study. Four engagement profiles were defined according to respondents’ reported relationships with Shimokitazawa. Measurement invariance was first examined using latent-variable multi-group CFA [39]. Because adequate configural fit was not achieved and the groups contained only 20–39 independent respondents, subsequent comparisons used a lower-complexity path model based on the construct scores with respondent-level cluster-robust estimation. Overall equality of the seven structural associations was tested first, followed by pathway-specific omnibus tests with Holm adjustment for multiple comparisons. Group-specific standardized coefficients were interpreted descriptively when formal tests did not indicate statistically significant between-group differences.
Finally, open-ended responses were analyzed using KHcoder 3. Characteristic words associated with the four engagement profiles were identified using the Jaccard coefficient and interpreted in conjunction with the original responses. The qualitative analysis was used exploratorily to examine differences in thematic emphasis across the groups and to provide contextual interpretation of respondents’ place-related experiences.
3. Results
3.1. Descriptive Statistics
This section presents the descriptive statistics of the questionnaire survey, summarizing the characteristics of the respondents and comparing the mean evaluation scores across the three spatial units to provide an overview of the dataset.
Descriptive statistics for the 127 respondents are summarized in Table 3. The sample consisted predominantly of female respondents (70.9%), and the largest age group was 30–39 years (32.3%), followed by those aged 20–29 and 40–49 years (22.1% each). Company employees or corporate executives constituted the largest employment-status category (40.2%). Regarding respondents’ relationships with Shimokitazawa, frequent visitors accounted for 26.0%, while 26.8% selected the questionnaire category “occasionally visit Shimokitazawa/first-time visitor.” The remaining respondents included residents and workers with varying durations of engagement with the area. In addition, 45.7% reported membership in a local community organization. The main area of activity was nearly evenly distributed between the Southwest Area (51.2%) and Northeast Area (48.8%). The preferred landscape type was urban scenery with residential areas and commercial streets (49.6%), followed by informal streetscape with weeds and wild plants along the roadside (16.5%). These respondent characteristics, except for respondents’ relationship with the area, were collected primarily to describe the composition of the sample and were not included as explanatory variables in the SEM or as grouping variables in the subsequent multi-group analysis.
Table 3.
Characteristics of the survey respondents (n = 127).
Figure 3 compares the mean scores of the spatial, behavioral, experiential, and place attachment factors across the whole area, the Southwest Area, and the Northeast Area. Because the differences in scores among the three spatial units were relatively small, the original scores were mean-normalized for visualization and plotted as radar charts. The normalization was performed by centering each indicator on its mean and scaling it to the range −1 to 1, with 0 representing the indicator’s mean. For consistency, all radar charts were displayed using a common vertical axis ranging from −0.8 to 0.8. This transformation was applied only for visualization and did not affect the statistical analyses.
Figure 3.
Radar chart of mean normalized scores across the three areas: (a) Spatial Factors; (b) Behavioral Factors; (c) Experiential Factors; and (d) Place Attachment.
Overall, evaluations of the three spatial units showed broadly similar patterns, although some descriptive differences were observed. The Southwest Area tended to receive relatively higher evaluations for natural and sensory environments, social interaction, community participation, and preference, whereas the Northeast Area tended to receive relatively higher evaluations for streetscape, cultural and sensory experiences, distinctiveness, and the balance between old and new. Shimokitazawa as a whole generally received relatively high evaluations across the indicators. These differences are presented here as descriptive patterns rather than inferential comparisons.
Descriptive statistics for the observed variables used in the subsequent factor and structural analyses, including means, standard deviations, skewness, and kurtosis, are provided in Appendix B. Across the variables, skewness ranged from −1.151 to 0.860 and kurtosis ranged from −1.207 to 1.464, indicating no severe univariate distributional problems. All 21 observed variables contained 381 valid evaluations, with no missing values. The 381 evaluations were nested within 127 respondents, and this dependency was accounted for in the subsequent CFA and SEM analyses.
3.2. Measurement Model Assessment
Measurement model assessment was conducted in three stages. First, EFA was performed on the 18 self-developed indicators of Spatial, Behavioral, and Experiential Factors to examine their underlying dimensional structure. Second, the resulting factor structure was evaluated using respondent-clustered robust CFA. Third, internal consistency, convergent validity, and discriminant validity were assessed using Cronbach’s α, CR, AVE, standardized factor loadings, the Fornell–Larcker criterion, and HTMT.
A key finding of this section was that supplementary examination of the original Spatial Factors domain suggested a distinction between Physical Environment and Natural Sensory Environment. This revised measurement structure was therefore formally compared with the original structure in the CFA.
3.2.1. Exploratory Factor Analysis
Because the Place Attachment items were adopted from an established scale with previously reported reliability [6,40], EFA was conducted on the 18 self-developed indicators representing the initially hypothesized Spatial, Behavioral, and Experiential Factors. Place Attachment was excluded from the EFA because its measurement was based on an established scale [6]. Because the indicators were measured using five-category ordered response scales, a polychoric correlation matrix was used. Sampling adequacy was assessed using the KMO measure and Bartlett’s test of sphericity. Factor retention was determined using parallel analysis, and PAF with oblimin rotation was applied to identify correlated common factors.
The overall KMO value was 0.84, with item-level MSA values ranging from 0.69 to 0.91. Bartlett’s test of sphericity was significant (χ2(153) = 1562.30, p < 0.001), indicating that the correlation matrix was suitable for factor analysis. Parallel analysis supported a three-factor solution. The resulting factors correspond broadly to the three conceptual domains proposed in the hypothesized model (Table 4): Spatial, Behavioral, and Experiential Factors. The three-factor solution accounted for 60.8% of the total variance.
Table 4.
Exploratory factor analysis of the self-developed indicators.
Given the central role of the Spatial Factors as the starting point of the proposed place attachment-formation framework, and because several spatial indicators exhibited comparatively less distinct loading patterns in the overall EFA, the dimensionality of the five spatial indicators was further examined as a supplementary check. The spatial indicators showed an overall KMO value of 0.75, and Bartlett’s test was significant (χ2(10) = 277.11, p < 0.001). Parallel analysis suggested a two-factor structure. Exploratory two-factor solutions showed a tentative pattern in which Location, Streetscape, and Facilities were primarily associated with one factor, whereas Natural Environment and Sensory Environment tended to define the other. However, because the two-factor exploratory solutions exhibited estimation instability, this subdivision was treated as provisional and was formally evaluated through the subsequent CFA model comparison.
3.2.2. Confirmatory Factor Analysis
Following the EFA, CFA was conducted to evaluate the measurement structure and to examine whether separating the original Spatial Factors domain improved model fit. All CFA models were estimated in R using the lavaan package with MLR estimation incorporating respondent-level clustering to account for the three evaluations nested within each respondent. Following the scoring procedure of the original place attachment scale [6], the items within each of its three theoretical dimensions were averaged to form the observed indicators Preference, Emotional Attachment, and Desire for Continuity. These three dimension-level composite scores were subsequently specified as indicators of the latent Place Attachment construct.
Two competing measurement models were compared. The original 3 + 1 model specified Spatial Factors as a single latent construct together with Behavioral Factors, Experiential Factors, and Place Attachment. Based on the additional EFA of the spatial indicators, the alternative 4 + 1 model separated Spatial Factors into Physical Environment (Location, Streetscape, and Facilities) and Natural Sensory Environment (Natural Environment and Sensory Environment), while retaining the remaining constructs unchanged.
As shown in Table 5, the 4 + 1 model exhibited better fit than the original 3 + 1 model across all reported indices. A Satorra–Bentler scaled chi-square difference test further indicated that the improvement in model fit was statistically significant. Although some fit indices remained slightly below conventional guidelines (robust CFI = 0.912; robust TLI = 0.896), the 4 + 1 model showed consistently improved fit relative to the 3 + 1 model, with robust RMSEA = 0.074 and SRMR = 0.058. The results therefore provided comparative support for distinguishing Physical Environment and Natural Sensory Environment. The 4 + 1 measurement structure was retained for the subsequent structural analysis.
Table 5.
Comparison of CFA model fit indices.
3.2.3. Reliability and Construct Validity
Following selection of the 4 + 1 measurement structure, the reliability and construct validity of the 4 + 1 model were evaluated. Internal consistency was assessed using Cronbach’s α, while CR and AVE were calculated from the standardized CFA solution. Convergent validity was evaluated based on standardized factor loadings and AVE, and discriminant validity was assessed using the Fornell–Larcker criterion and HTMT.
As shown in Table 6, all standardized factor loadings were statistically significant and ranged from 0.558 to 0.935. Cronbach’s α values ranged from 0.734 to 0.885, and CR values ranged from 0.737 to 0.887, indicating satisfactory internal consistency. AVE values ranged from 0.529 to 0.646, exceeding the commonly used 0.50 guideline and supporting convergent validity.
Table 6.
Reliability and convergent validity.
Discriminant validity was evaluated using the Fornell–Larcker criterion and HTMT. As shown in Table 7 and Table 8, the square root of AVE for each construct exceeded its correlations with the remaining constructs, while all HTMT values were below 0.85 (range = 0.136–0.719), providing evidence of discriminant validity. Taken together, the results indicated acceptable reliability, convergent validity, and discriminant validity for the retained measurement structure, although the less-than-ideal global CFA fit was considered when interpreting the subsequent structural results.
Table 7.
Assessment of discriminant validity using the Fornell–Larcker criterion.
Table 8.
Heterotrait–monotrait ratio (HTMT) matrix.
3.3. Structural Equation Modeling
This section presents the process and results of SEM analysis. Two theoretically specified models were compared by MLR estimation with respondent-level clustering. Model 1 represented the structural relationships derived from the hypotheses, whereas Model 2 was a more parsimonious model obtained after removing unsupported structural paths. Model 2 was subsequently used as the Final Model to examine structural paths and explain variance as well as direct, indirect, and total effects. Sensitivity and alternative-model analyses were conducted to assess the robustness and interpretation of these structural relationships, and their theoretical implications are considered in the Discussion section.
A key finding of the analysis was that the two spatial dimensions showed distinct patterns of association with Place Attachment. Natural Sensory Environment was positively associated with Place Attachment through a direct pathway, whereas Physical Environment showed a negative direct association alongside positive indirect associations through Behavioral and Experiential Factors. The opposing direct and indirect effects resulted in a near-zero total effect of Physical Environment, a pattern consistent with inconsistent mediation or possible suppression. Accordingly, the negative direct coefficient should be interpreted as a conditional association within the specified model rather than as evidence that physical environmental qualities reduce Place Attachment.
3.3.1. Model Fit Assessment
To examine the proposed structure of place attachment formation, two structural models were estimated and compared (Figure 4).
Figure 4.
Development of the Structural Equation Models: (a) Initial model (Model 1); (b) Final Model (Model 2).Values represent standardized estimates. Red paths and coefficients in Model 1 indicate the paths removed in Model 2 during model refinement. * p < 0.05, ** p < 0.01, *** p < 0.001.
Following the measurement-model analysis, the originally hypothesized Spatial Factors domain was represented by two correlated dimensions: Physical Environment and Natural Sensory Environment. Accordingly, H1–H3 were operationalized as two corresponding structural paths in Model 1. Specifically, H1 was represented by Physical Environment → Place Attachment (H1-1) and Natural Sensory Environment → Place Attachment (H1-2); H2 by Physical Environment → Behavioral Factors (H2-1) and Natural Sensory Environment → Behavioral Factors (H2-2); and H3 by Physical Environment → Experiential Factors (H3-1) and Natural Sensory Environment → Experiential Factors (H3-2). This operationalization represents the measurement-level refinement of the original Spatial Factors domain, without the introduction of new hypotheses.
Model 1 tested the revised structural specification of H1–H6. H2-2 (Natural Sensory Environment → Behavioral Factors; β = −0.050, p = 0.754) and H3-2 (Natural Sensory Environment → Experiential Factors; β = −0.088, p = 0.511) were not supported. H1-1 (Physical Environment → Place Attachment) was statistically significant but opposite to the hypothesized positive direction (β = −0.504, p < 0.001), whereas the remaining hypothesized paths were positive and statistically significant.
Model 2 was therefore specified by removing these two unsupported paths (H2-2 and H3-2). Physical Environment and Natural Sensory Environment were specified as correlated exogenous constructs, not as a directional causal relationship. This covariance was retained because the two constructs originated from the same hypothesized Spatial Factors domain and represent related dimensions of respondents’ evaluations of the spatial environment. Accordingly, the relationship is represented by a bidirectional arrow in Figure 4 and is reported as a latent correlation.
A robust scaled chi-square difference test indicated that constraining these two paths to zero did not significantly worsen model fit, Δχ2(2) = 0.538, p = 0.764. Model 2 also showed essentially equivalent or slightly improved fit indices while using two fewer structural parameters (Table 9, robust CFI = 0.913, robust TLI = 0.898, robust RMSEA = 0.073, SRMR = 0.058). Accordingly, Model 2 was retained as the more parsimonious structural model (Final Model).
Table 9.
Comparison of structural model fit indices.
3.3.2. Structural Path Results
The standardized structural coefficients of the Final Model are presented in Table 10. Physical Environment was positively associated with Behavioral Factors (H2-1: β = 0.269, p = 0.003) and Experiential Factors (H3-1: β = 0.530, p = 0.003). Behavioral Factors were positively associated with Experiential Factors (H4: β = 0.186, p = 0.017). Both Behavioral Factors (H5: β = 0.356, p < 0.001) and Experiential Factors (H6: β = 0.648, p < 0.001) were positively associated with Place Attachment. Natural Sensory Environment also showed a positive association with Place Attachment (H1-2: β = 0.452, p < 0.001). In contrast, the direct association between Physical Environment and Place Attachment was negative (H1-1: β = −0.472, p < 0.001), opposite to the hypothesized positive direction.
Table 10.
Standardized structural path estimates of the Final Model (Model 2).
The Final Model explained 7.2% of the variance in Behavioral Factors (R2 = 0.072), 36.8% in Experiential Factors (R2 = 0.368), and 68.1% in Place Attachment (R2 = 0.681). Physical Environment and Natural Sensory Environment were positively correlated (r = 0.691, p < 0.001). This relationship represents the covariance between the two exogenous environmental dimensions, not as a directional structural path.
3.3.3. Direct, Indirect, and Total Effects
Direct, indirect, and total effects were examined using respondent-level cluster bootstraps with 5000 valid resamples. Physical Environment had a significant negative direct association with Place Attachment (β = −0.472, 95% CI [−0.742, −0.247]) (Table 11). In contrast, all three indirect pathways from Physical Environment to Place Attachment were significantly positive.
Table 11.
Direct, indirect, and total effects on Place Attachment with respondent-level cluster-bootstrap confidence intervals.
The total indirect effect of Physical Environment was therefore positive and significant (β = 0.472, 95% CI [0.328, 0.653]). Because this positive indirect effect approximately offsets the negative direct effect, the total effect of Physical Environment on Place Attachment was near zero and not statistically significant (β≈.000, 95% CI [−0.290, 0.267]). In contrast, Natural Sensory Environment showed a significant positive direct and total effect on Place Attachment (β = 0.452, 95% CI [0.240, 0.695]).
This pattern is consistent with an inconsistent-mediation or possible suppression pattern and indicates that the negative direct coefficient for Physical Environment should not be interpreted as evidence that physical environmental qualities themselves reduce place attachment.
3.3.4. Sensitivity and Diagnostic Analyses
Several supplementary analyses were conducted to assess the robustness of the structural results. First, diagnostic analyses indicated no severe multicollinearity among the predictors (maximum VIF = 1.70), suggesting that multicollinearity alone was unlikely to account for the negative Physical Environment coefficient. Although the bivariate association between Physical Environment and Place Attachment was positive, its direct coefficient became negative after the mediating and correlated constructs were simultaneously included, suggesting an inconsistent-mediation or suppression-like pattern. Constraining the Physical Environment → Place Attachment path to zero significantly worsened model fit, Δχ2(1) = 39.534, p < 0.001. Accordingly, the negative coefficient was retained as a conditional association within the specified model but was not interpreted as evidence that physical environmental qualities reduce Place Attachment.
Second, reversing the Behavioral Factors → Experiential Factors path produced virtually identical model fit (robust CFI = 0.913, robust TLI = 0.898, robust RMSEA = 0.073, SRMR = 0.058), indicating that the cross-sectional covariance structure could not empirically distinguish between the two directional specifications. The retained direction should therefore be interpreted as theoretically specified, not as evidence of temporal precedence.
Finally, Community Participation was removed from the Behavioral Factors construct to assess whether this indicator influenced the structural findings. All core paths retained the same direction and statistical significance, with changes in standardized coefficients ranging from 0.001 to 0.015 in absolute magnitude. The R2 values for Behavioral Factors, Experiential Factors, and Place Attachment also remained highly similar (.074, 0.370, and 0.689, respectively). Thus, the main structural findings were robust to the exclusion of Community Participation.
3.3.5. Spatial Profiles of the Southwest and Northeast Districts
Descriptive comparisons indicated that the three study districts exhibited different profiles across the environmental, behavioral, experiential, and place-attachment measures. To account for the repeated evaluations provided by each respondent, differences among the Whole, Southwest, and Northeast Areas were examined using linear mixed-effects models with Respondent ID specified as a random intercept, followed by Bonferroni-adjusted pairwise comparisons. Significant overall area effects were observed for Physical Environment (F(2, 252) = 24.05, p < 0.001), Natural Sensory Environment (F(2, 252) = 10.89, p < 0.001), Behavioral Factors (F(2, 252) = 20.85, p < 0.001), Experiential Factors (F(2, 252) = 11.42, p < 0.001), and Place Attachment (F(2, 252) = 4.36, p = 0.014).
As shown in Table 12, pairwise comparisons between the two subareas showed that the Northeast Area was rated higher in Physical Environment (mean difference [Southwest—Northeast] = −0.184, 95% CI [−0.313, −0.054]), whereas the Southwest Area was rated higher in Natural Sensory Environment (mean difference = 0.339, 95% CI [0.164, 0.513]). The corresponding standardized effect sizes were moderate (d = −0.429 and 0.586, respectively). Differences in Behavioral Factors, Experiential Factors, and Place Attachment between the Southwest and Northeast Areas were small and their Bonferroni-adjusted 95% confidence intervals included zero.
Table 12.
Southwest–Northeast comparisons from the repeated-measures mixed-effects models.
These results indicate contrasting spatial profiles. The Southwest Area was characterized more strongly by Natural Sensory qualities, whereas the Northeast Area received higher evaluations of the physical environment.
3.4. Exploratory Group Comparison by Relationship with the Area
To address RQ2, exploratory group comparisons were conducted according to respondents’ relationships with Shimokitazawa. Latent-variable multi-group CFA indicated inadequate fit of the full latent-variable specification in several groups, particularly the Short-term Engaged Group. Therefore, subsequent group comparisons used a lower-complexity model based on construct scores and were interpreted as exploratory.
The finding was that, although some structural coefficients varied descriptively across the four engagement profiles, formal between-group tests provided no statistically robust evidence of differences in the structural associations. Thus, RQ2 did not yield evidence supporting distinct place attachment processes according to respondents’ relationships with the area.
3.4.1. Group Definition and Measurement Invariance
Respondents were classified into four engagement profiles according to their reported relationship with Shimokitazawa. Respondents who were born and raised in Shimokitazawa or had lived or worked in the area for more than ten years were classified as the Long-term Engaged Group. Respondents who had lived or worked in the area for less than ten years were classified as the Short-term Engaged Group. Those who frequently visit Shimokitazawa were classified as the Frequent Visitors Group, whereas respondents selecting the questionnaire category “Occasionally visit Shimokitazawa/first-time visitor” were classified as the Occasional Visitors Group.
The four groups comprised 39 long-term engaged respondents (117 evaluations), 20 short-term engaged respondents (60 evaluations), 34 frequent visitors (102 evaluations), and 34 occasional visitors (102 evaluations). The respondent remained the independent sampling unit. The duration-based categories were treated as descriptive engagement profiles, not as developmental stages. The 10-year distinction was retained for comparability with the preceding exploratory workshop study [22]. It was not regarded as a theoretically established boundary or as evidence of a qualitative psychological transition.
Latent-variable multi-group CFA showed inadequate fit in several groups (Table 13), with robust CFI ranging from 0.718 to 0.852 and robust RMSEA from 0.090 to 0.145. The configural model also showed inadequate fit (robust CFI = 0.803, robust RMSEA = 0.111). Although constraining factor loadings produced little additional deterioration (ΔCFI = −0.003; ΔRMSEA = −0.003), this was not interpreted as established metric invariance because adequate configural fit had not been achieved. Scalar and residual invariance were not supported.
Table 13.
Latent-variable multi-group CFA fit and sequential measurement invariance assessment.
Given the limited number of independent respondents within groups (n = 20–39) and the repeated evaluation structure of the data, group differences were instead examined exploratorily using a lower-complexity construct-score path model.
3.4.2. Exploratory Group Comparison of Structural Associations
To provide a lower-complexity exploratory assessment, the construct scores were subsequently used in a respondent-clustered multi-group path model. The freely estimated model showed good overall fit (robust CFI = 1.000, robust TLI = 1.047, robust RMSEA = 0.000, SRMR = 0.033), although its low degrees of freedom (df = 8) warrant caution in interpreting these fit indices. Constraining all seven structural paths to equality across groups also yielded acceptable fit (robust CFI = 0.975, robust TLI = 0.966, robust RMSEA = 0.066), and the robust scaled chi-square difference test did not indicate a statistically significant overall deterioration in fit (Δχ2(21) = 29.634, p = 0.100).
Consistent with this result, none of the seven pathway-specific omnibus tests indicated statistically significant between-group heterogeneity (all unadjusted p ≥ 0.181), and none remained significant after Holm correction for multiple testing (Table 14). Group-specific standardized coefficients are shown descriptively in Figure 5. Although their magnitudes varied numerically across the four engagement profiles, these variations were not statistically supported as between-group differences. Accordingly, these patterns were not interpreted as evidence of distinct place attachment mechanisms among the four engagement profiles.
Table 14.
Exploratory omnibus tests of between-group differences in structural associations.
Figure 5.
Exploratory structural associations by relationship with the area based on construct scores. Note: Values are group-specific standardized path coefficients (β) estimated from the lower-complexity respondent-clustered path model. *** p < 0.001, ** p < 0.01, * p < 0.05; † p = 0.050. Significance markers refer to within-group tests of individual path coefficients and do not indicate statistically significant differences between groups.
3.5. Qualitative Text Analysis
Because quantitative group comparison did not provide statistically robust evidence of differences between structural pathways, the qualitative analysis was not used to explain or validate distinct structural mechanisms. Instead, open-ended responses were examined exploratorily to identify differences in the themes and place-related experiences emphasized by the four engagement profiles.
The corpus comprised 157 open-ended responses written in Japanese, containing 3433 tokens after preprocessing, with each response treated as the unit of analysis. Text preprocessing was conducted in KH Coder 3 using its built-in preprocessing functions for Japanese morphological analysis and tokenization. Non-substantive terms, including adverbs and auxiliary verbs, were excluded from the analysis. Semantically equivalent expressions were consolidated where appropriate; for example, terms referring to visiting (e.g., 行く and 訪れる) and to the town (e.g., 街 and エリア) were grouped into common categories. Characteristic words associated with each engagement profile were identified using the Jaccard coefficient, with higher values indicating a stronger association between a word and the corresponding group. The resulting characteristic words (Table 15) were interpreted in conjunction with the original responses.
Table 15.
Characteristic words in open-ended responses by relationship with the area.
Long-term Engaged respondents tended to emphasize life history and personal connections with the area, reflected in characteristic terms such as “self,” “living,” “growing up,” and “born.” Representative statements included “Shimokitazawa is my hometown.” Responses also included concerns about changes to familiar shops and increasing commercialization, such as “the shopping streets have become filled with vintage clothing stores and have become less interesting than before.” These accounts illustrate the prominence of accumulated memories and personal history in some long-term residents’ descriptions of the area.
For the Short-term Engaged Group, characteristic terms included “workplace,” “relationships,” “work,” “daily life,” and “every day.” One respondent referred to relationships developed through work, while another described the area as a place where they could relax after work. These responses suggest that work, everyday routines, and interpersonal relationships were salient themes within this group’s accounts.
Frequent Visitors often used terms related to “redevelopment,” “station front,” “Shimokita Engeibu,” and “meeting people.” Some respondents described observing changes associated with redevelopment over time, while others referred to experiences through Shimokita Engeibu, with responses including “through maintaining plants and interacting with people, I gradually developed attachment to the area.” These accounts highlight redevelopment, repeated visits, and participation as themes appearing in this group’s descriptions of Shimokitazawa.
Among Occasional Visitors, characteristic terms included “shops,” “atmosphere,” “vintage clothing,” “walking,” and “strolling.” For example, respondents referred to enjoying walks through streets with distinctive shops and to impressions of the area’s atmosphere and human-scale interactions. Thus, immediate environmental impressions and visit-related experiences were relatively prominent themes in these responses.
Overall, the qualitative analysis revealed differences in the themes emphasized in the four groups’ open-ended accounts, but these descriptive patterns should not be interpreted as evidence of statistically distinct place attachment processes. Because qualitative and quantitative data were obtained from the same respondents, the text analysis provides contextual interpretation of their reported experiences rather than independent triangulation or confirmation of the quantitative model.
4. Discussion
This study examined the structural associations among perceived spatial, behavioral, and experiential factors and place attachment in Shimokitazawa. The results supported several hypothesized associations while also revealing a more complex pattern than originally proposed, particularly the distinction between Physical Environment and Natural Sensory Environment and the contrasting direct and indirect associations of these constructs with Place Attachment. The following discussion interprets these findings in relation to previous research while distinguishing observed statistical results from possible theoretical mechanisms.
4.1. Interpretation of the Final Model
4.1.1. Two Spatial Dimensions and Their Relationship
One of the findings of this study was that the originally hypothesized Spatial Factors construct was separated into two distinct latent variables: the Physical Environment and the Natural Sensory Environment. This distinction was not anticipated in the original hypothesized model and may reflect two complementary dimensions of respondents’ evaluations of urban space. While the Physical Environment primarily reflects objective and functional characteristics of urban space, the Natural Sensory Environment represents subjective environmental perceptions associated with greenery, comfort, and multi-sensory experiences.
Although statistically distinct, the two dimensions were strongly correlated (r = 0.691, p < 0.001). This covariance indicates that they tend to vary together rather than that one caused the other. Such a relationship is reasonable because built, natural, and sensory characteristics coexist within the same urban setting. Streetscapes may incorporate greenery and open space, while commercial and public facilities also contribute visual, auditory, olfactory, and other sensory stimuli. The two dimensions can therefore be understood as related but distinguishable aspects of respondents’ evaluations of urban space.
4.1.2. Differential Associations of the Two Spatial Dimensions
The next important finding was that these two spatial dimensions showed different associations with place attachment. Following the measurement-level separation of Spatial Factors, H1–H3 were represented by corresponding paths from Physical Environment (H1-1–H3-1) and Natural Sensory Environment (H1-2–H3-2). In the Final Model, Physical Environment was positively associated with Behavioral Factors (H2-1: β = 0.269, p = 0.003) and Experiential Factors (H3-1: β = 0.530, p = 0.003), whereas its direct association with Place Attachment was negative (H1-1: β = −0.472, p < 0.001). Natural Sensory Environment showed a positive direct association with Place Attachment (H1-2: β = 0.452, p < 0.001). The paths from Natural Sensory Environment to Behavioral (H2-2) and Experiential Factors (H3-2) specified in Model 1 were not statistically significant and were therefore omitted from the more parsimonious Final Model. The negative coefficient for Physical Environment should not be interpreted as indicating that favorable physical characteristics reduce place attachment. Bootstrap analysis showed a significant positive total indirect effect of Physical Environment through Behavioral and Experiential Factors (β = 0.472, 95% CI [0.328, 0.653]), while its total effect was approximately zero and non-significant (95% CI [−0.290, 0.267]). The opposite signs of the direct and indirect effects are consistent with an inconsistent-mediation pattern.
A sequential model-adjustment diagnostic analysis provided further evidence that the negative coefficient emerged conditionally, without representing a simple negative relationship between the Physical Environment and Place Attachment. With the same five-factor measurement specification retained across diagnostic models, the Physical Environment coefficient was initially positive when entered alone (β = 0.448, p = 0.053) and remained positive after controlling for Natural Sensory Environment (β = 0.336). It approached zero when Behavioral Factors were additionally controlled (β = −0.016) and became negative when Experiential Factors were incorporated. When both Behavioral and Experiential Factors were included, the coefficient was significantly negative (β = −0.504, p < 0.001), closely corresponding to the Final Model (β = −0.472, p < 0.001). Thus, the negative coefficient appears primarily as a conditional effect after behavioral and experiential dimensions are statistically separated from Physical Environment. Because some intermediate estimates were imprecise, this decomposition is interpreted diagnostically. Low VIF values (maximum = 1.70) further suggest that severe multicollinearity is unlikely to account for the coefficient reversal. These results suggest different patterns of association for the two spatial dimensions. Natural Sensory Environment was directly and positively associated with Place Attachment, whereas Physical Environment showed positive indirect associations through Behavioral and Experiential Factors alongside a negative conditional direct coefficient. This does not demonstrate that physical characteristics weaken place attachment but suggests that their relationship with attachment may depend partly on how they relate to activities and experiences.
The distinction between Physical Environment and Natural Sensory Environment may nevertheless offer a useful interpretive perspective. Natural Sensory Environment may have a relatively direct relationship with Place Attachment, whereas the association of Physical Environment appears to be more closely intertwined with behavioral use and accumulated experience. Previous research provides possible contexts for interpreting these patterns. Studies of placelessness have suggested that commercialization, standardized redevelopment, and loss of local identity can potentially weaken emotional relationships with place [1]. However, these characteristics were not directly measured by the Physical Environment indicators in this study. In contrast, the positive association between Natural Sensory Environment and Place Attachment is broadly compatible with environmental–psychology research indicating that natural settings and multisensory environmental perceptions can elicit positive affective responses and contribute to emotional connections with place [41,42].
Taken together, the findings suggest two different ways in which Spatial Factors may be associated with Place Attachment. Natural Sensory Environment, such as greenery, comfort, and sensory experience, were directly associated with stronger attachment, whereas Physical Environment was more closely associated with how people use the area and the experiences they gain there. These relationships were interconnected, but the cross-sectional data cannot determine how they develop over time. Longitudinal research is needed to examine whether behavioral engagement and accumulated experiences contribute to changes in place attachment.
4.2. Exploratory Interpretation of Engagement Profiles
The exploratory group analysis provides a descriptive perspective on how different relationships with Shimokitazawa may be associated with different emphases in place-related engagement. Although the four groups showed numerical variation in their structural coefficients, none of the seven pathways differed significantly between groups after correction for multiple testing. The four profiles should therefore not be interpreted as statistically distinct mechanisms or developmental stages of place attachment. Nevertheless, the group-specific coefficients and open-ended responses suggest several differences in emphasis that may be useful for understanding how people relate to the area.
The Long-term Engaged Group showed an orientation toward accumulated experience and personal history. Their responses frequently referred to living, growing up, and changes in the neighborhood, suggesting that long-term engagement may be accompanied by greater salience of memories and accumulated experiences. The Short-term Engaged Group, in contrast, emphasized work, daily routines, and interpersonal relationships. Behavioral engagement and everyday social experience therefore appeared relatively prominent in their descriptions of Shimokitazawa.
Among visitors, the Frequent Visitors Group showed an experience-oriented profile, with references to redevelopment, repeated visits, community activities, and interactions with people. The Occasional Visitors Group placed relatively greater emphasis on shops, atmosphere, walking, and other immediate impressions of the area. These accounts indicate different descriptive emphases on immediate environmental perception and accumulated experience across the visitor groups.
Viewed conceptually, these four profiles suggest two conceptual contrasts. The first concerns a descriptive contrast associated with engagement duration: everyday behavioral and social themes were more salient among Short-term Engaged users, whereas accumulated memories and experiences were more prominent among Long-term Engaged users. The second concerns engagement frequency: Occasional Visitors emphasized immediate environmental impressions, whereas Frequent Visitors more often described repeated and participatory experiences. Conceptually, these contrasts may be described as behavior-oriented versus experience-oriented emphasis and perception-oriented versus experience-oriented emphasis, respectively.
Importantly, the present data do not demonstrate that an individual moves from one profile to another, nor that space perception, behavior, and experience relate to place attachment in a fixed order. Instead, the profiles provide an exploratory framework for considering how different forms of contact with an urban area may be associated with different aspects of place experience. They also raise a testable hypothesis for future research: longer or more frequent engagement may be accompanied by a greater emphasis on accumulated experience relative to immediate perception or everyday behavior. Longitudinal research could examine whether such differences correspond to changes within individuals over time.
4.3. Implications for Urban Planning and Community Design
The findings suggest potential value in considering not only the physical quality of space but also the experiential conditions through which people develop relationships with place. In particular, the positive association between the Natural Sensory Environment and Place Attachment highlights the potential importance of maintaining greenery, environmental comfort, and multisensory qualities in high-density urban districts. The positive indirect effects of the Physical Environment further suggest that attention should be given to whether urban spaces provide opportunities for everyday use, social interaction and meaningful experiences.
More broadly, the exploratory findings point to the potential importance of creating conditions that allow people to return to, participate in, and engage more deeply with a place over time. Opportunities for repeated use and participation may enable environmental encounters to become socially and personally meaningful experiences. However, because the present cross-sectional and exploratory group analyses did not demonstrate temporal changes in place attachment, this implication should be regarded as a theoretical and planning proposition rather than an empirically established developmental process.
For Shimokitazawa, these findings suggest the value of balancing spatial quality with diverse opportunities for activity and engagement as redevelopment continues. At the same time, planning should remain attentive to the existing emotional relationships that residents and visitors have developed with familiar places, local experiences, and the area’s distinctive character. Thus, place-making in established urban districts may benefit from improving environmental quality and enabling new forms of engagement while also respecting the emotional connections that have accumulated around existing places.
4.4. Limitations and Future Research
Several limitations should be considered when interpreting the findings. First, the study used a cross-sectional design, and therefore the observed associations cannot establish causal or developmental processes [43]. In particular, the engagement profiles represent differences between respondents with different relationships with Shimokitazawa, not changes within the same individuals over time. The possible shifts in emphasis discussed above should therefore be regarded as exploratory interpretations. Longitudinal studies following individuals as their relationships with an area change would be necessary to examine whether perception, behavior, and accumulated experience change sequentially over time.
Second, although the dataset contained 381 spatial evaluations, these were provided by 127 unique respondents, with each respondent evaluating three areas. The primary SEM accounted for this dependency using respondent-level cluster-robust estimation; however, this approach adjusts statistical inference for clustering without explicitly separating within-person and between-person associations. The limited number of independent respondents also constrained the multi-group analyses, with group sizes ranging from 20 to 39. The full latent-variable models showed inadequate group-specific and configural fit, and the subsequent group comparisons were therefore treated as exploratory using lower-complexity construct-score models. Future studies with larger independent samples could employ multilevel SEM to distinguish within-person from between-person associations and evaluate group differences more reliably.
Third, the engagement profiles themselves involve several measurement limitations. The 10-year threshold distinguishing Short-term and Long-term Engaged respondents was retained for comparability with the preceding exploratory study [22] and represents an operational rather than theoretically established boundary. Duration of engagement may also overlap with chronological age and does not capture differences in respondents’ autobiographical or social experiences. Accordingly, respondents assigned to the same profile may have substantially different relationships with the area. In addition, the descriptive “Employment Status” variable combines categories reflecting employment, occupational, and broader social status, such as employees, students, homemakers, and corporate executives. Although this variable was not included in the SEM, future surveys should distinguish these dimensions more precisely.
Fourth, the non-probability sampling strategy limits the representativeness of the sample. Recruitment through local organizations and community networks may have increased the participation of respondents who were already relatively engaged with Shimokitazawa, as reflected in the comparatively high proportion reporting community membership. The findings should therefore not be assumed to represent all residents or visitors to the area. Future studies could employ broader recruitment strategies or probability-based sampling where feasible and examine whether the observed associations are reproduced among less-engaged users. Generalizability is also constrained by the distinctive context of Shimokitazawa, including its strong cultural identity, ongoing redevelopment, substantial visitor activity, and active local organizations. Comparative research across urban districts with different social, cultural, and redevelopment contexts is needed to assess the broader applicability of the findings.
Finally, the theoretical model does not encompass all potential determinants of place attachment. It focuses on spatial, behavioral, and experiential factors, while individual characteristics such as personality and broader social and cultural contexts were not incorporated. Future research could extend the framework by examining these factors and their interactions with spatial environments.
5. Conclusions
This study examined the associations among spatial, behavioral, and experiential factors and place attachment in Shimokitazawa. Regarding the first research question (RQ1), concerning the associations among these factors, the results provided preliminary support for the proposed structural framework while distinguishing two dimensions of the originally hypothesized Spatial Factors. Natural Sensory Environment showed a direct positive association with Place Attachment (H1-2). Physical Environment was positively associated with Behavioral (H2-1) and Experiential Factors (H3-1), which in turn were positively associated with Place Attachment (H4~H6), although its conditional direct effect on Place Attachment (H1-1) was negative. Thus, the findings suggest that Natural Sensory qualities may relate more directly to attachment, whereas physical qualities may be more closely associated with how people use the area and the experiences they gain there.
Regarding the second research question (RQ2), concerning whether these associations differ according to users’ relationships with the area, exploratory analyses identified four descriptive orientations: identity-oriented among Long-term Engaged users, everyday-life-oriented among Short-term Engaged users, repeated-experience-oriented among Frequent Visitors, and perception-oriented among Occasional Visitors. Although statistically robust between-group differences in structural associations were not established, these profiles raise a testable hypothesis: longer or more frequent engagement with an area may be accompanied by a greater emphasis on accumulated experience relative to everyday behavior or immediate perception.
Overall, this cross-sectional study provides preliminary support for a process-oriented conceptual framework linking spatial, behavioral, and experiential factors and place attachment. For urban planning and community design, the findings highlight the potential value of maintaining greenery and environmental comfort while also providing opportunities for repeated use, social interaction and meaningful experience. The exploratory group patterns further provide a hypothesis for future research on how these associations may vary with the depth and frequency of engagement with place.
These conclusions require caution because the study was cross-sectional, the 381 area evaluations were nested within 127 unique respondents, the sample was non-probabilistic, and Shimokitazawa represents a distinctive single urban context. In particular, the exploratory group patterns should not be interpreted as demonstrated developmental trajectories or transitions between user groups. Larger and more diverse samples, comparative studies across urban contexts, and longitudinal research are needed to test whether these cross-sectional patterns correspond to changes in place attachment over time.
Supplementary Materials
The following supporting information can be downloaded at: https://www.mdpi.com/article/10.3390/land15091659/s1, File S1: Questionnaire (original Japanese version and English translation).
Author Contributions
Conceptualization, S.T., J.Y., Q.H., Y.J. and J.Z.; methodology, J.Y. and S.T.; software, J.Y. and S.T.; validation, J.Y.; formal analysis, J.Y.; investigation, J.Y.; resources, S.T.; data curation, J.Y.; writing—original draft preparation, J.Y.; writing—review and editing, J.Y., S.T. and J.Z.; visualization, J.Y.; supervision, J.Z. and S.T.; project administration, S.T. and J.Y.; funding acquisition, S.T. and J.Y. All authors have read and agreed to the published version of the manuscript.
Funding
This work was supported by the Japan Science and Technology Agency (JST) through the Support for Pioneering Research Initiated by the Next Generation (SPRING), Grant Number JPMJSP2109.
Data Availability Statement
The data supporting the findings of this study are available from the corresponding author upon reasonable request. The data are not publicly available because it contains information that could compromise the privacy of the research participants.
Acknowledgments
The author would like to express sincere gratitude to Mishima and Sekihashi, board members of Shimokita Engeibu, for their generous support and assistance throughout the fieldwork. The author also thanks the members of Shimokita Engeibu, local organizations Shimokita College and I Love Shimokitazawa, and all workshop and questionnaire participants for their generous cooperation and valuable contributions to this study.
Conflicts of Interest
The authors declare no conflicts of interest.
Abbreviations
The following abbreviations are used in this manuscript:
| AIC | Akaike Information Criterion |
| AVE | Average Variance Extracted |
| BIC | Bayesian Information Criterion |
| CFA | Confirmatory Factor Analysis |
| CFI | Comparative Fit Index |
| CI | Confidence Interval |
| CR | Composite Reliability |
| df | degrees of freedom |
| EFA | Exploratory Factor Analysis |
| HTMT | Heterotrait–Monotrait Ratio |
| ICC | Intraclass Correlation Coefficient |
| KMO | Kaiser–Meyer–Olkin Measure |
| MLR | Maximum Likelihood Estimation with Robust Standard Errors |
| PAF | Principal Axis Factoring |
| RMSEA | Root Mean Square Error of Approximation |
| SE | Standard Error |
| SEM | Structural Equation Modeling |
| SRMR | Standardized Root Mean Square Residual |
| TLI | Tucker–Lewis Index |
| VIF | Variance Inflation Factor |
Appendix A
This appendix provides brief descriptions of the local organizations, communities, and institutions mentioned in this study. Their primary roles and official websites or reference sources are included to help international readers better understand the local context of Shimokitazawa.
Table A1.
Local organizations mentioned in this study.
Appendix B
This Appendix provides detailed descriptive statistics for the observed variables included in the subsequent factor and structural analyses. Table A1 and Table A2 reports the mean, standard deviation (SD), skewness, and kurtosis for each variable. Across all observed variables, skewness ranged from −1.151 to 0.860 and kurtosis ranged from −1.207 to 1.464, indicating no severe univariate distributional problems.
Table A2.
Descriptive statistics of observed variables.
References
- Relph, E. Place and Placelessness; Pion: London, UK, 2008. [Google Scholar]
- Ujang, N. Place attachment and continuity of urban place identity. Asian J. Environ.-Behav. Stud. 2017, 2, 117–132. [Google Scholar] [CrossRef] [Scilit]
- Cabinet Office; Government of Japan. Annual Report on the Ageing Society; Cabinet Office: Tokyo, Japan, 2025. [Google Scholar]
- Ministry of Land; Infrastructure; Transport and Tourism (MLIT). White Paper on Land, Infrastructure, Transport and Tourism 2025; MLIT, Government of Japan: Tokyo, Japan, 2025. [Google Scholar]
- Hidalgo, M.C.; Hernández, B. Place attachment: Conceptual and empirical questions. J. Environ. Psychol. 2001, 21, 273–281. [Google Scholar] [CrossRef] [Scilit]
- Suzuki, H.; Fujii, S. Study on effects of place attachment on cooperative behavior local area. Infrastruct. Plan. Rev. 2008, 25, 357–362. [Google Scholar] [CrossRef] [Scilit]
- Harris, P.B.; Werner, C.M.; Brown, B.B.; Ingebritsen, D. Relocation and privacy regulation: A cross-cultural analysis. J. Environ. Psychol. 1995, 15, 311–320. [Google Scholar] [CrossRef] [Scilit]
- Li, X. Incorporating place attachment in spatial planning: A literature review. In Transformationsprozesse in Stadt und Land: Erkenntnisse, Strategien und Zukunftsperspektiven; Finger, A., Badelt, O., Dahmen, K., Heilen, L., Mai, N., Seegers, R., Seewald, E., Śnieg, F., Wiemer, L., Eds.; Verlag der ARL—Akademie für Raumentwicklung in der Leibniz-Gemeinschaft: Hannover, Germany, 2024; pp. 74–89. [Google Scholar]
- Scannell, L.; Gifford, R. Defining place attachment: A tripartite organizing framework. J. Environ. Psychol. 2010, 30, 1–10. [Google Scholar] [CrossRef] [Scilit]
- Hikichi, H.; Aoki, T.; Ohbuchi, K. Attachment to residence: Affect of physical environment and social environment. Doboku Gakkai Ronbunshuu D 2009, 65, 101–110. [Google Scholar] [CrossRef] [Scilit]
- Sekine, H.; Kadoho, T.; Takeda, H.; Kaga, A. The study on effects of personal attributes and area’s characteristics on place attachment. Proc. City Plan. Inst. Jpn. Kansai Branch 2022, 20, 105–108. [Google Scholar] [CrossRef] [Scilit] [PubMed]
- Suzuki, H.; Fujii, S. Study on effects of contact level to regional environment during travel on emotional attachment to local areas. Doboku Gakkai Ronbunshuu D 2008, 64, 179–189. [Google Scholar] [CrossRef] [Scilit]
- Smaldone, D. The role of time in place attachment. In Proceedings of the 2006 Northeastern Recreation Research Symposium, Bolton Landing, NY, USA, 9–11 April 2006; pp. 47–56. [Google Scholar]
- Oya, H. The affective bond between an individual and a place. Jpn. J. Environ. Psychol. 2013, 1, 58–66. [Google Scholar] [CrossRef] [PubMed]
- Li, J.; Koohsari, M.J.; Kaczynski, A.T.; Tanimoto, R.; Watanabe, R.; Nakaya, T.; Luo, Y.; Zhao, J.; Yasunaga, A.; Oka, K.; et al. The built environment and place attachment: Insights from Japanese cities. Prev. Med. Rep. 2025, 50, 102969. [Google Scholar] [CrossRef] [Scilit] [PubMed]
- Friesinger, J.G.; Haugland, S.H.; Vederhus, J.-K. The significance of the social and material environment to place attachment and quality of life: Findings from a large population-based health survey. Health Qual. Life Outcomes 2022, 20, 135. [Google Scholar] [CrossRef] [Scilit] [PubMed]
- Tuulentie, S.; Heimtun, B. New rural residents or working tourists? place attachment of mobile tourism workers in Finnish lapland and northern norway. Scand. J. Hosp. Tour. 2014, 14, 367–384. [Google Scholar] [CrossRef] [Scilit]
- Taniguchi, A.; Imai, Y.; Hara, F.; Ishida, H. Study on place attachment of stakeholders related to tourist spot—Case study on niseko and kucchan area. J. Jpn. Soc. Civ. Eng. Ser. D3 (Infrastruct. Plan. Manag.) 2012, 68, I_551–I_562. [Google Scholar] [CrossRef] [Scilit] [PubMed]
- Yang, L.; Liu, J.; Albert, C.; Guo, X. Exploring the effects of soundscape perception on place attachment: A comparative study of residents and tourists. Appl. Acoust. 2024, 222, 110048. [Google Scholar] [CrossRef] [Scilit]
- Strandberg, C.; Styvén, M.E.; Hultman, M. Places in good graces: The role of emotional connections to a place on word-of-mouth. J. Bus. Res. 2020, 119, 444–452. [Google Scholar] [CrossRef] [Scilit]
- Lewicka, M. Place attachment: How far have we come in the last 40 years? J. Environ. Psychol. 2011, 31, 207–230. [Google Scholar] [CrossRef] [Scilit]
- Yin, J.; Zhang, J.; Takeda, S. A study on the formation process of community attachment by multiple actors in Shimokitazawa area. Jpn. J. JSCE 2026, 82, 25–00194. [Google Scholar] [CrossRef] [Scilit]
- Gibson, J.J. The Ecological Approach to Visual Perception, Classic Edition; Psychology Press: New York, NY, USA, 2014. [Google Scholar]
- Dewey, J. Experience and Education; The Macmillan Company: New York, NY, USA, 1938. [Google Scholar]
- Atkinson, R.C.; Shiffrin, R.M. Human memory: A proposed system and its control processes. Psychol. Learn. Motiv. 1968, 2, 89–195. [Google Scholar] [CrossRef] [Scilit]
- Kita, Y. Street Walking and the Aspects of the City: Understanding the Wholeness of Spatial Experience; Kyoto University Press: Kyoto, Japan, 2023. [Google Scholar]
- Rosseel, Y. Lavaan: An r package for structural equation modeling. J. Stat. Softw. 2012, 48, 1–36. [Google Scholar] [CrossRef] [Scilit]
- Oberski; Lavaan, D. survey: An r package for complex survey analysis of structural equation models. J. Stat. Softw. 2014, 57, 1–27. [Google Scholar] [CrossRef] [Scilit]
- Nakauchi, N.; Yamada, K.; Kawasaki, M. A study on the building up of local rules on the commercial streets in Shimokitazawa district. J. Jpn. Soc. Civ. Eng. Ser. D1 (Archit. Infrastruct. Environ.) 2015, 71, 116–132. [Google Scholar] [CrossRef] [Scilit][Green Version]
- Naruse, A. Performing music in a place: Shimokitazawa around 2005. Geogr. Sci. 2012, 67, 1–23. [Google Scholar] [CrossRef] [PubMed]
- Okada, J.; Mengyu, J.; Miura, S.; Nakano, T.; Nakamura, F.; Deguchi, A. Location analytics of theater agglomeration in tokyo ward area. J. Archit. Plan. (Trans. AIJ) 2024, 89, 830–841. [Google Scholar] [CrossRef] [Scilit]
- Yomiuri Shimbun. Shimokitazawa: Why It Became the “Curry Town”… the Festival was a Huge Success, Drawing 120,000 Visitors over 18 Days. 2022. Available online: https://www.yomiuri.co.jp/economy/20220919-OYT1T50069/ (accessed on 23 July 2026).
- Miura, R. The Urban Sociology of “Symbiosis”: Thinking Within the Shimokitazawa Redevelopment Issue; Shinyosha: Tokyo, Japan, 2016. [Google Scholar]
- Hattori, K. Shimokitazawa: The study of organically developed shopping district in Tokyo. Bull. Inst. Res. Bus. Econ. Meiji Gakuin Univ. 2012, 29, 1–34. [Google Scholar]
- Setagaya City. The 7th Kitazawa Design Conference Materials; Setagaya City: Tokyo, Japan, 2023. [Google Scholar]
- Shimokitazawa Area Management Council. Shimokitazawa Future Vision. Vol. 01; Shimokitazawa Area Management Council: Tokyo, Japan, 2025. [Google Scholar]
- Marôco, J. Factor analysis of ordinal items: Old questions, modern solutions? Stats 2024, 7, 984–1001. [Google Scholar] [CrossRef] [Scilit]
- MacKinnon, D.P.; Krull, J.L.; Lockwood, C.M. Equivalence of the mediation, confounding and suppression effect. Prev. Sci. 2000, 1, 173–181. [Google Scholar] [CrossRef] [Scilit] [PubMed]
- Putnick, D.L.; Bornstein, M.H. Measurement invariance conventions and reporting: The state of the art and future directions for psychological research. Dev. Rev. 2016, 41, 71–90. [Google Scholar] [CrossRef] [Scilit] [PubMed]
- Tahara, H. The process of fostering place attachment: The elucidation of consumer behavior and influences: A case study of a non-permanent regional platform in the Akigawa area. Jpn. J. Reg. Policy Stud. 2021, 26, 84–93. [Google Scholar] [CrossRef] [PubMed]
- Kaplan, R.; Kaplan, S. The Experience of Nature: A Psychological Perspective; Cambridge University Press: Cambridge, UK, 1989. [Google Scholar]
- Ulrich, R.S. View through a window may influence recovery from surgery. Science 1984, 224, 420–421. [Google Scholar] [CrossRef] [Scilit] [PubMed]
- Maxwell, S.E.; Cole, D.A.; Mitchell, M.A. Bias in cross-sectional analyses of longitudinal mediation: Partial and complete mediation under an autoregressive model. Multivar. Behav. Res. 2011, 46, 816–841. [Google Scholar] [CrossRef] [Scilit] [PubMed]
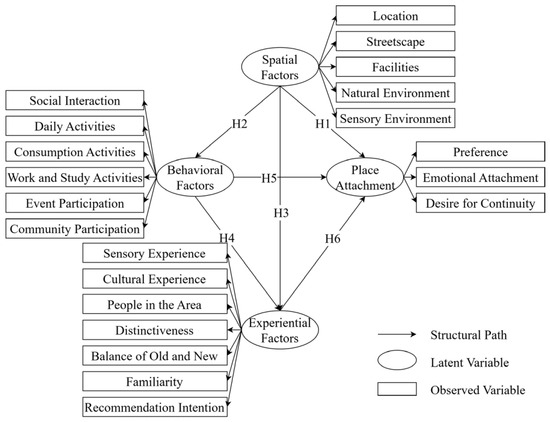
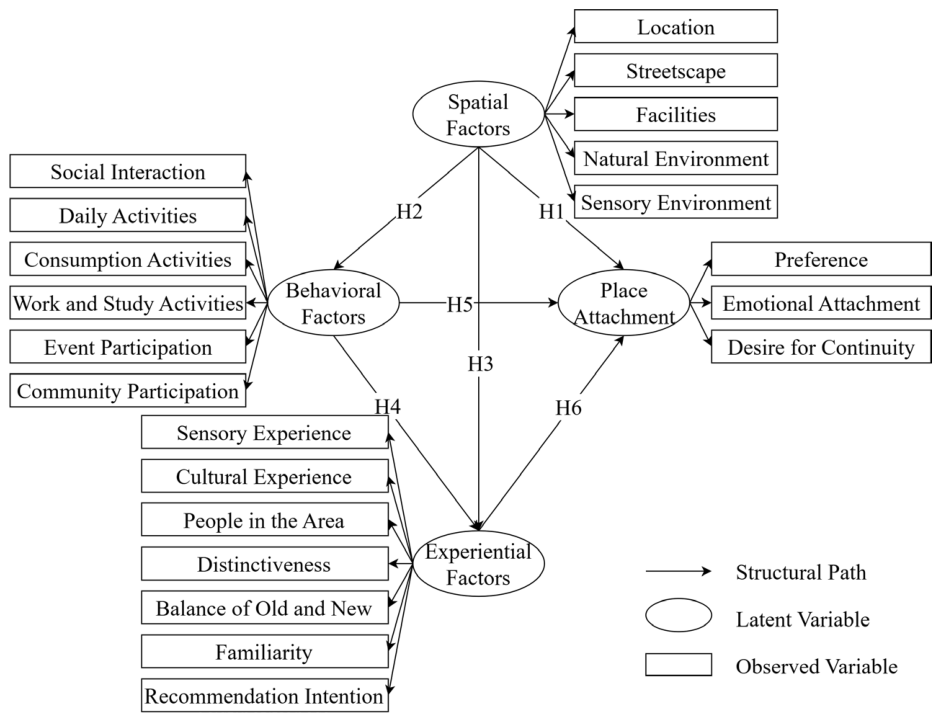
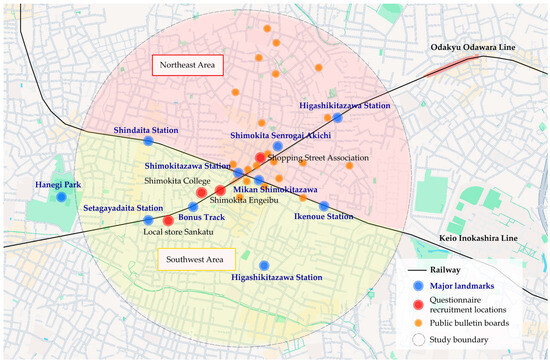
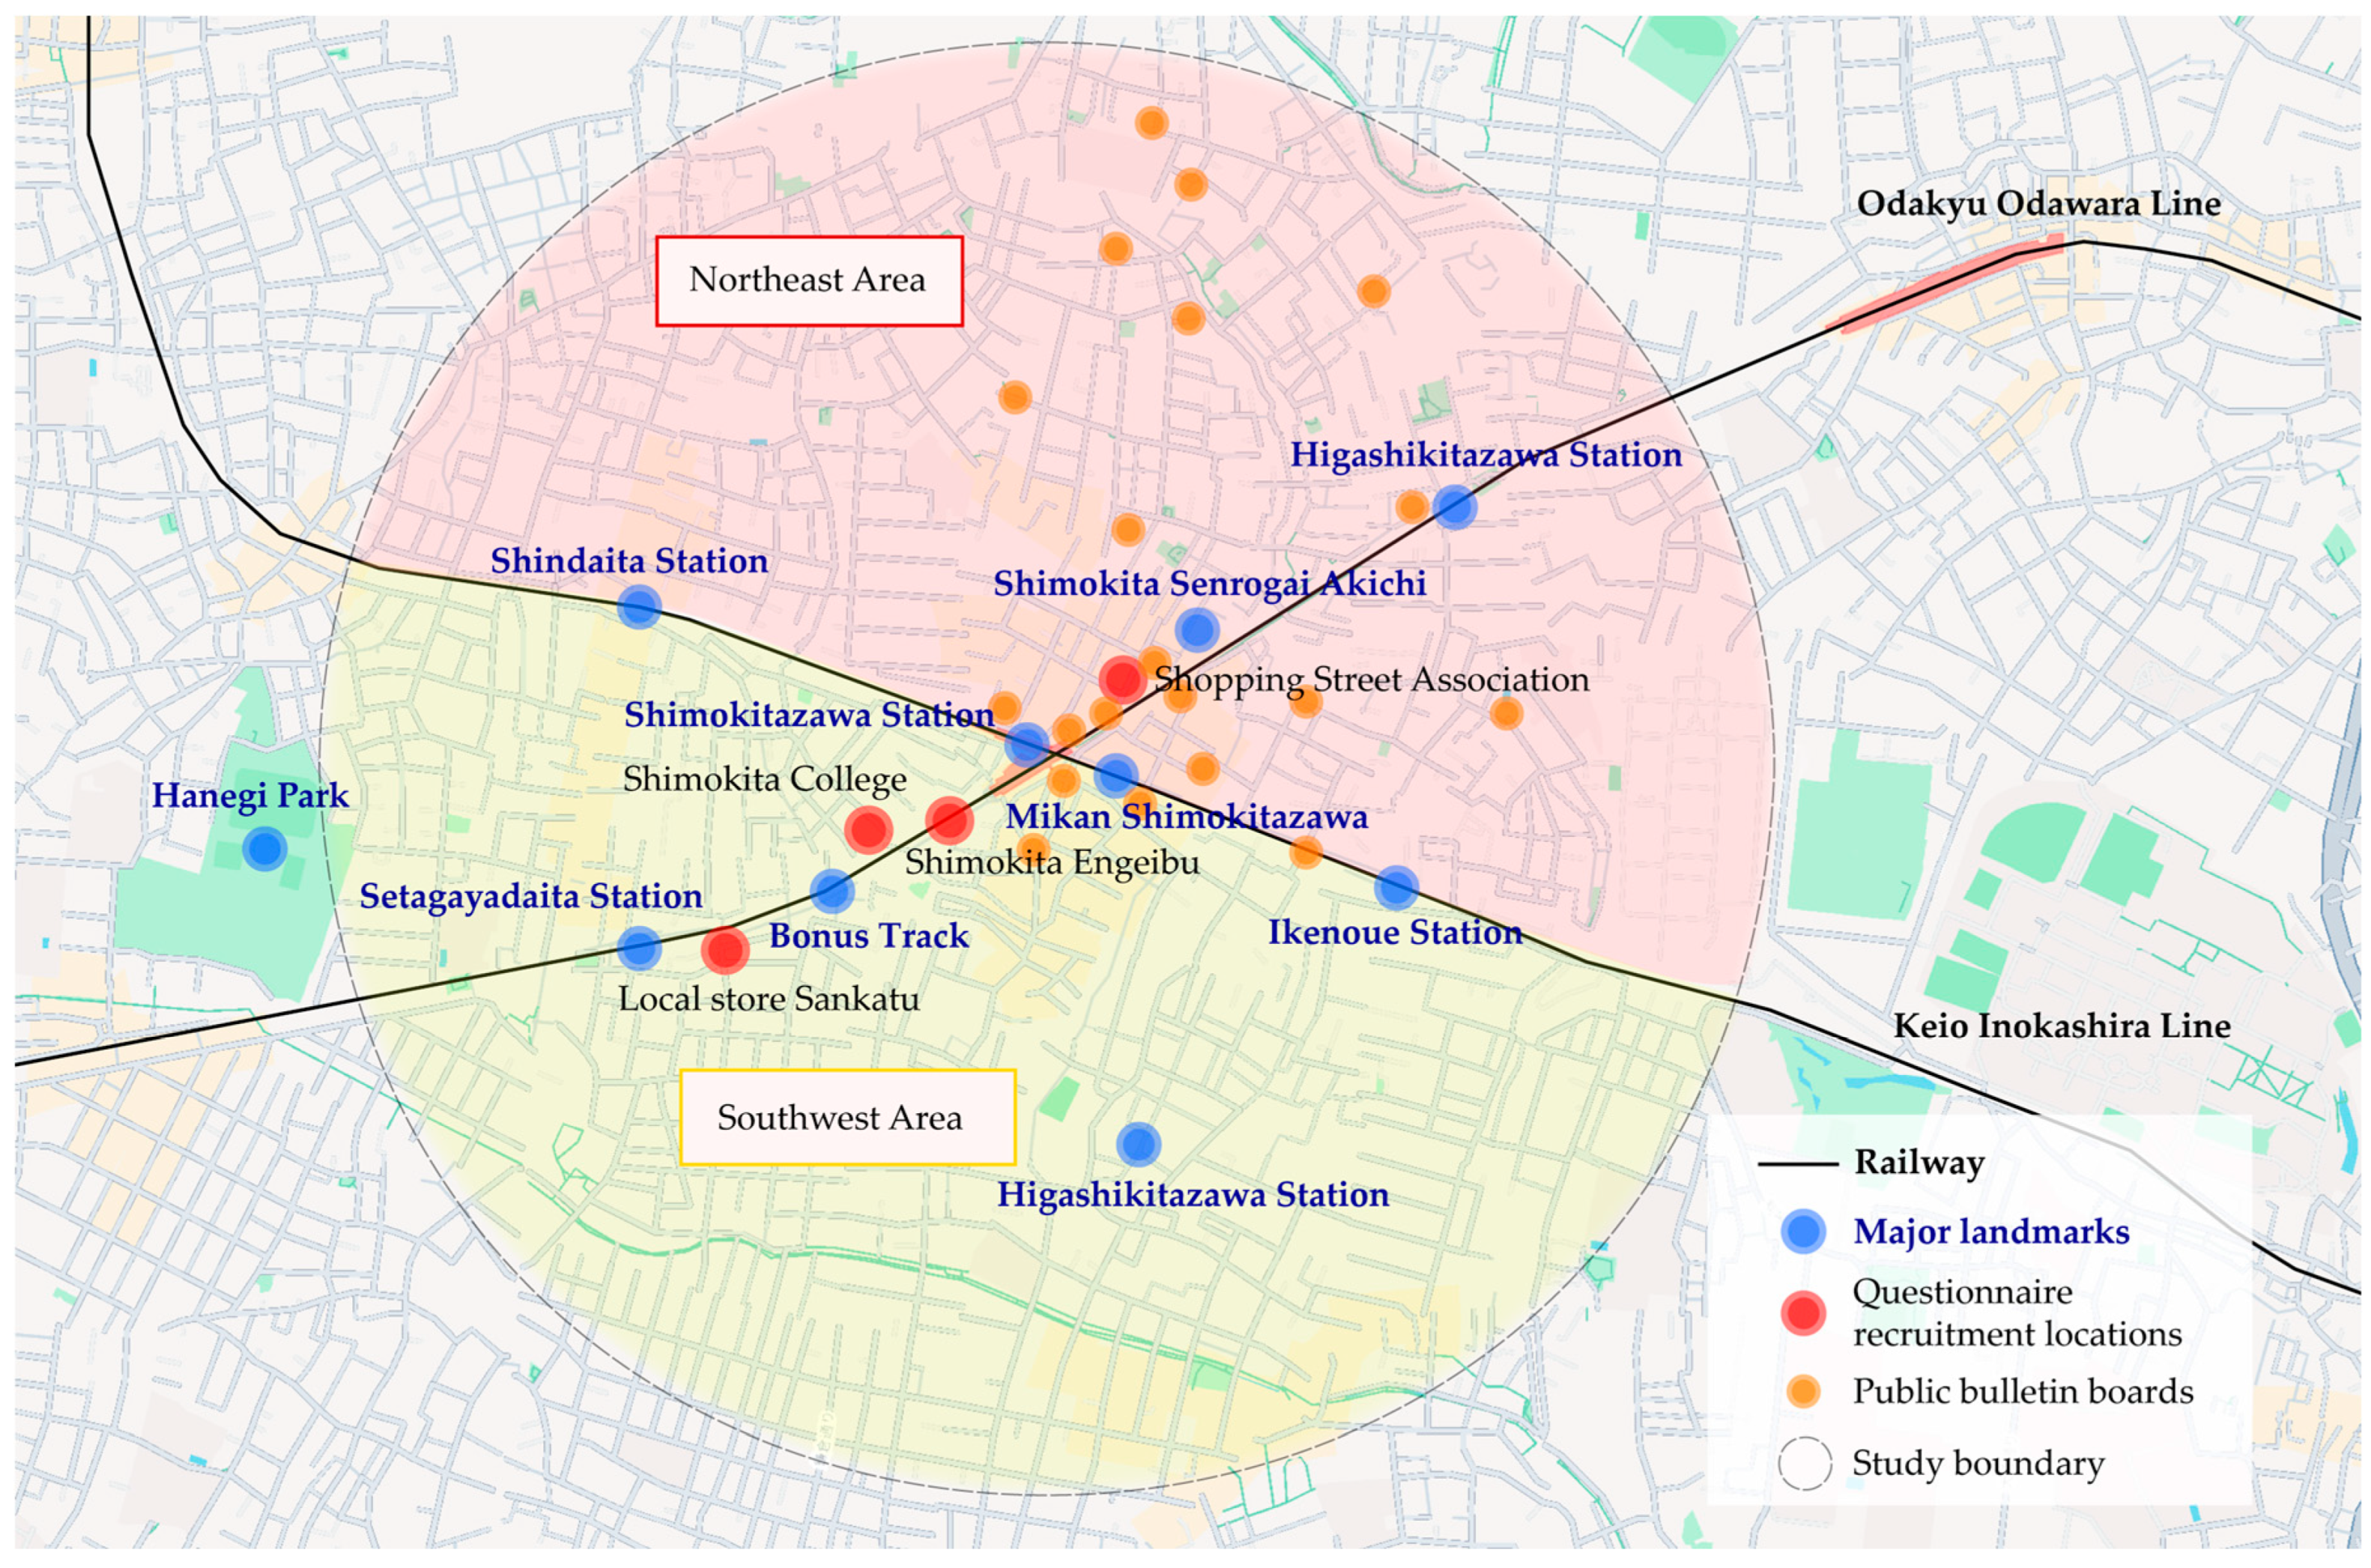
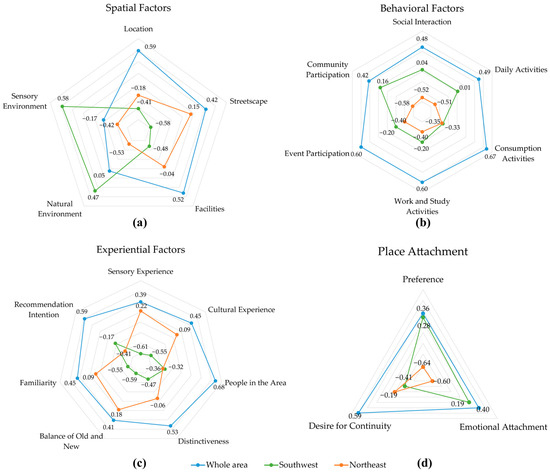
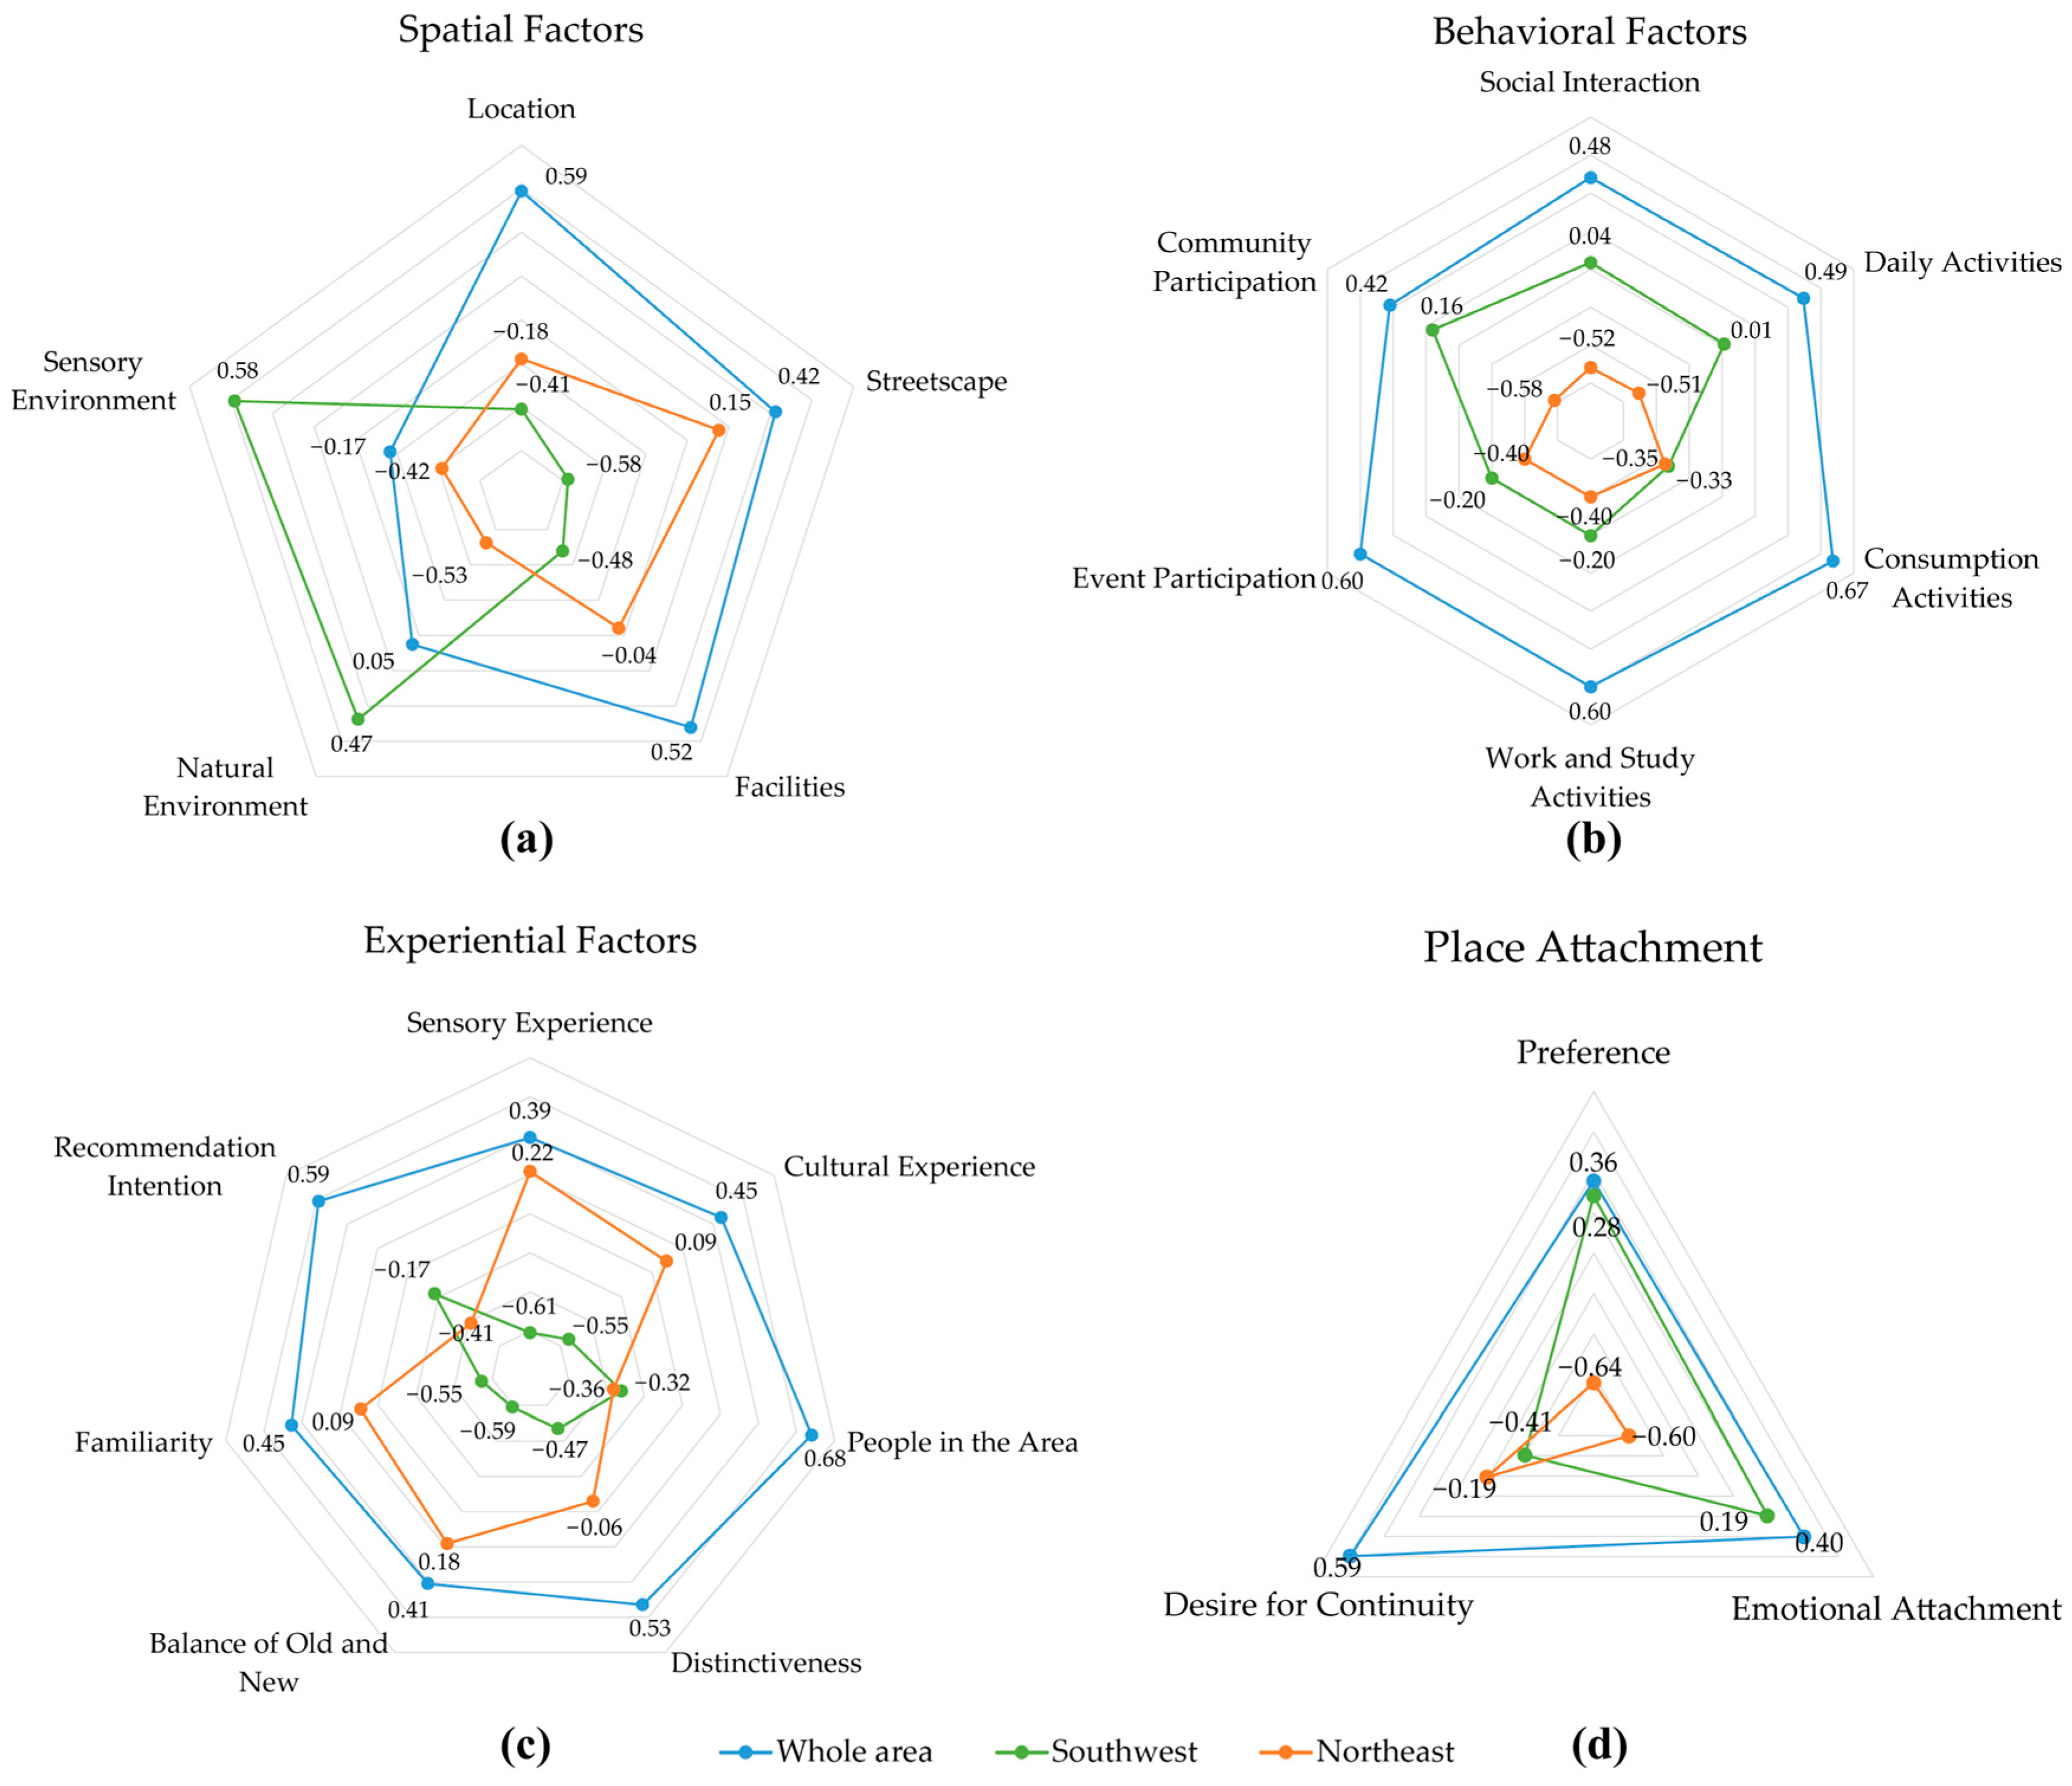
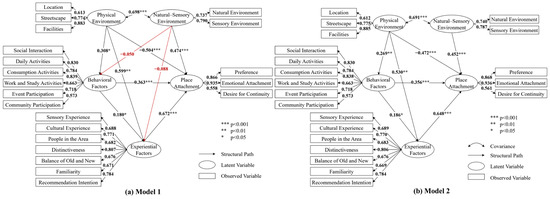
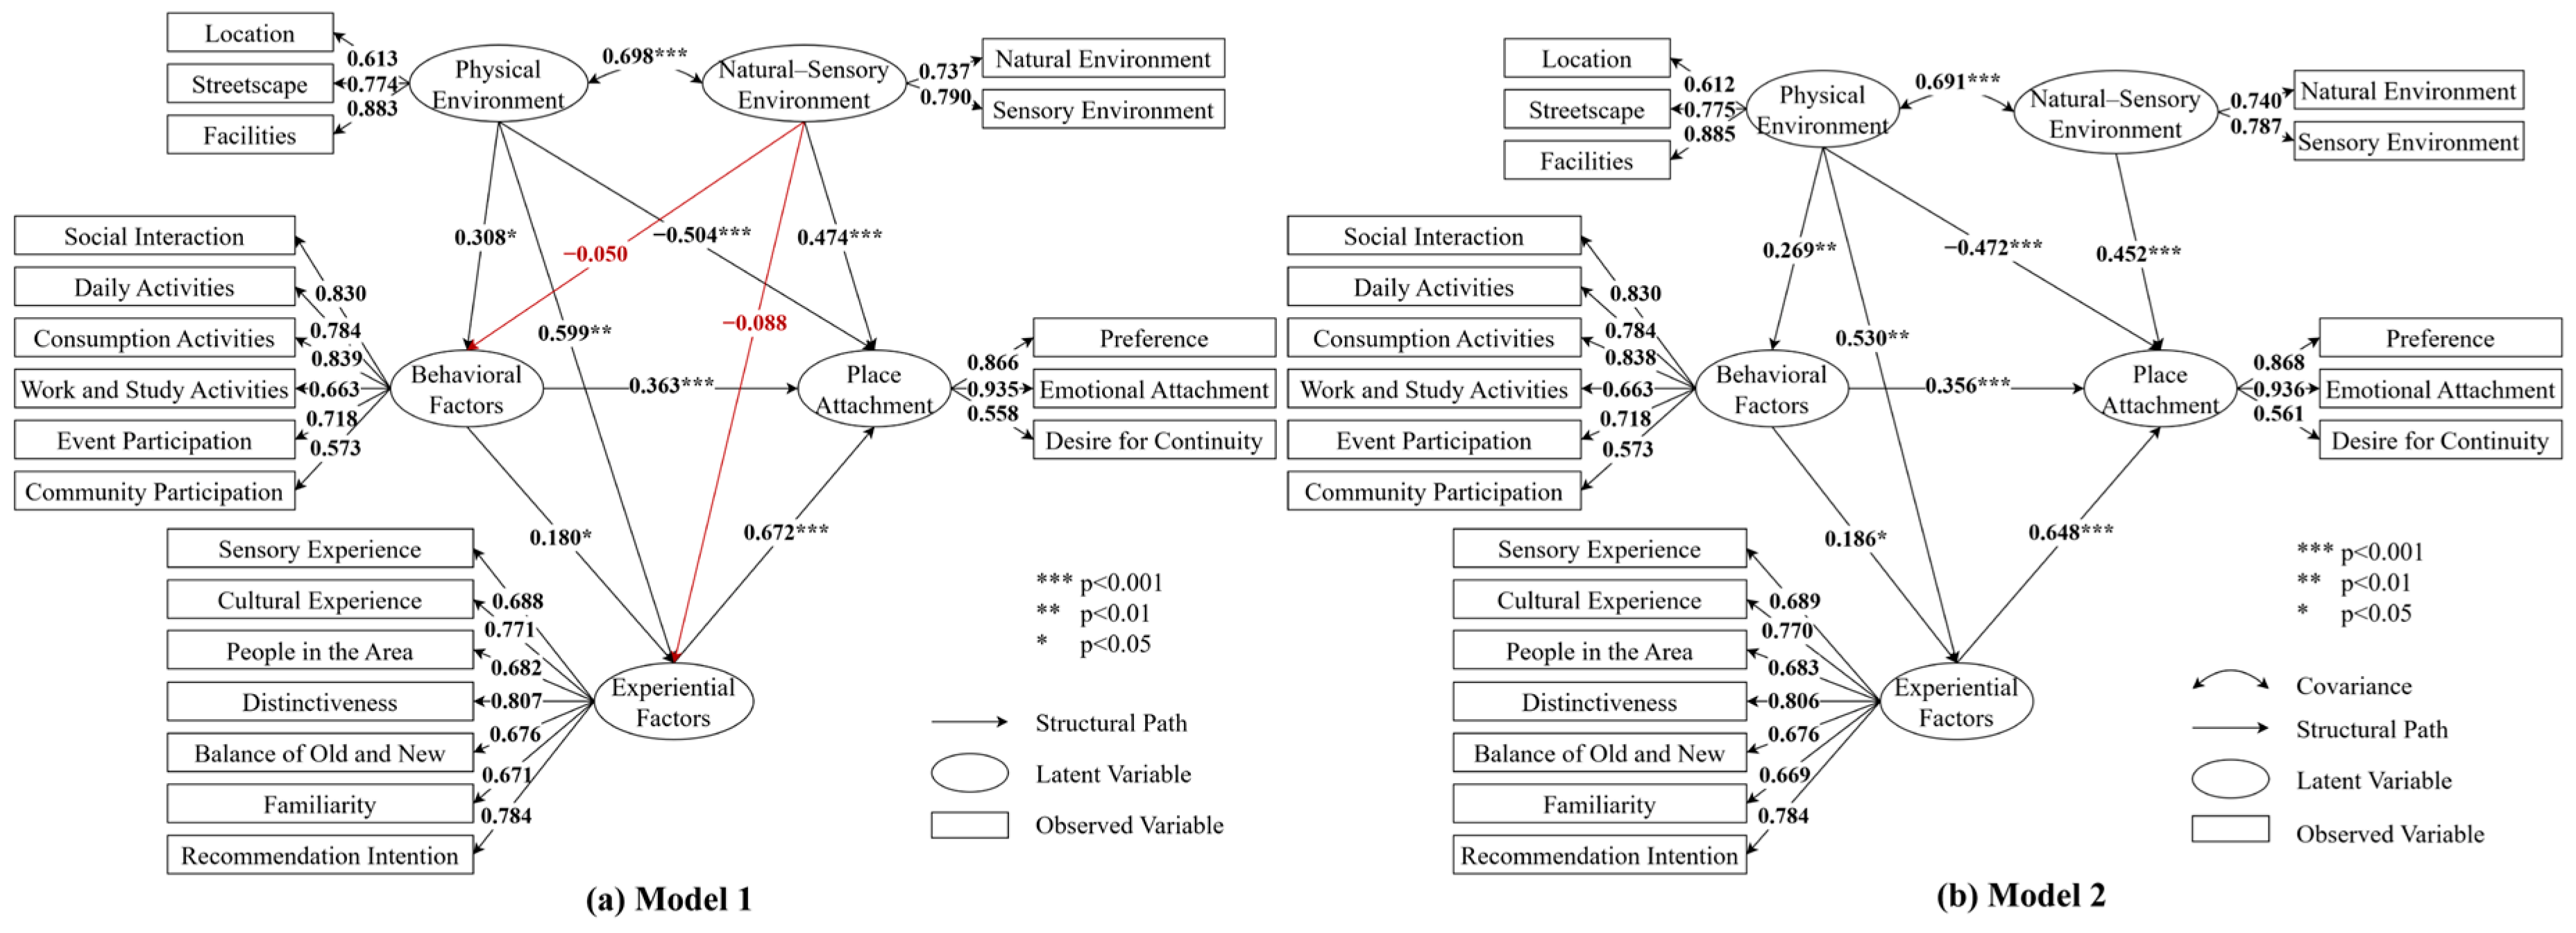
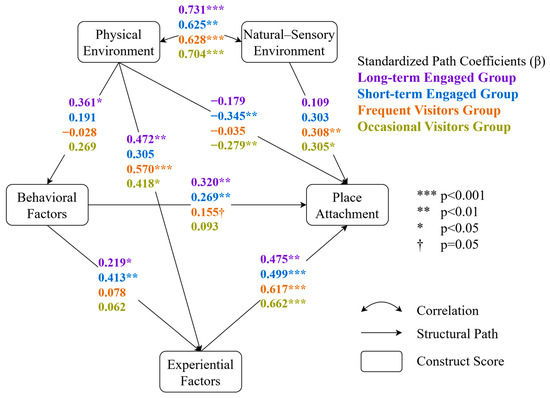
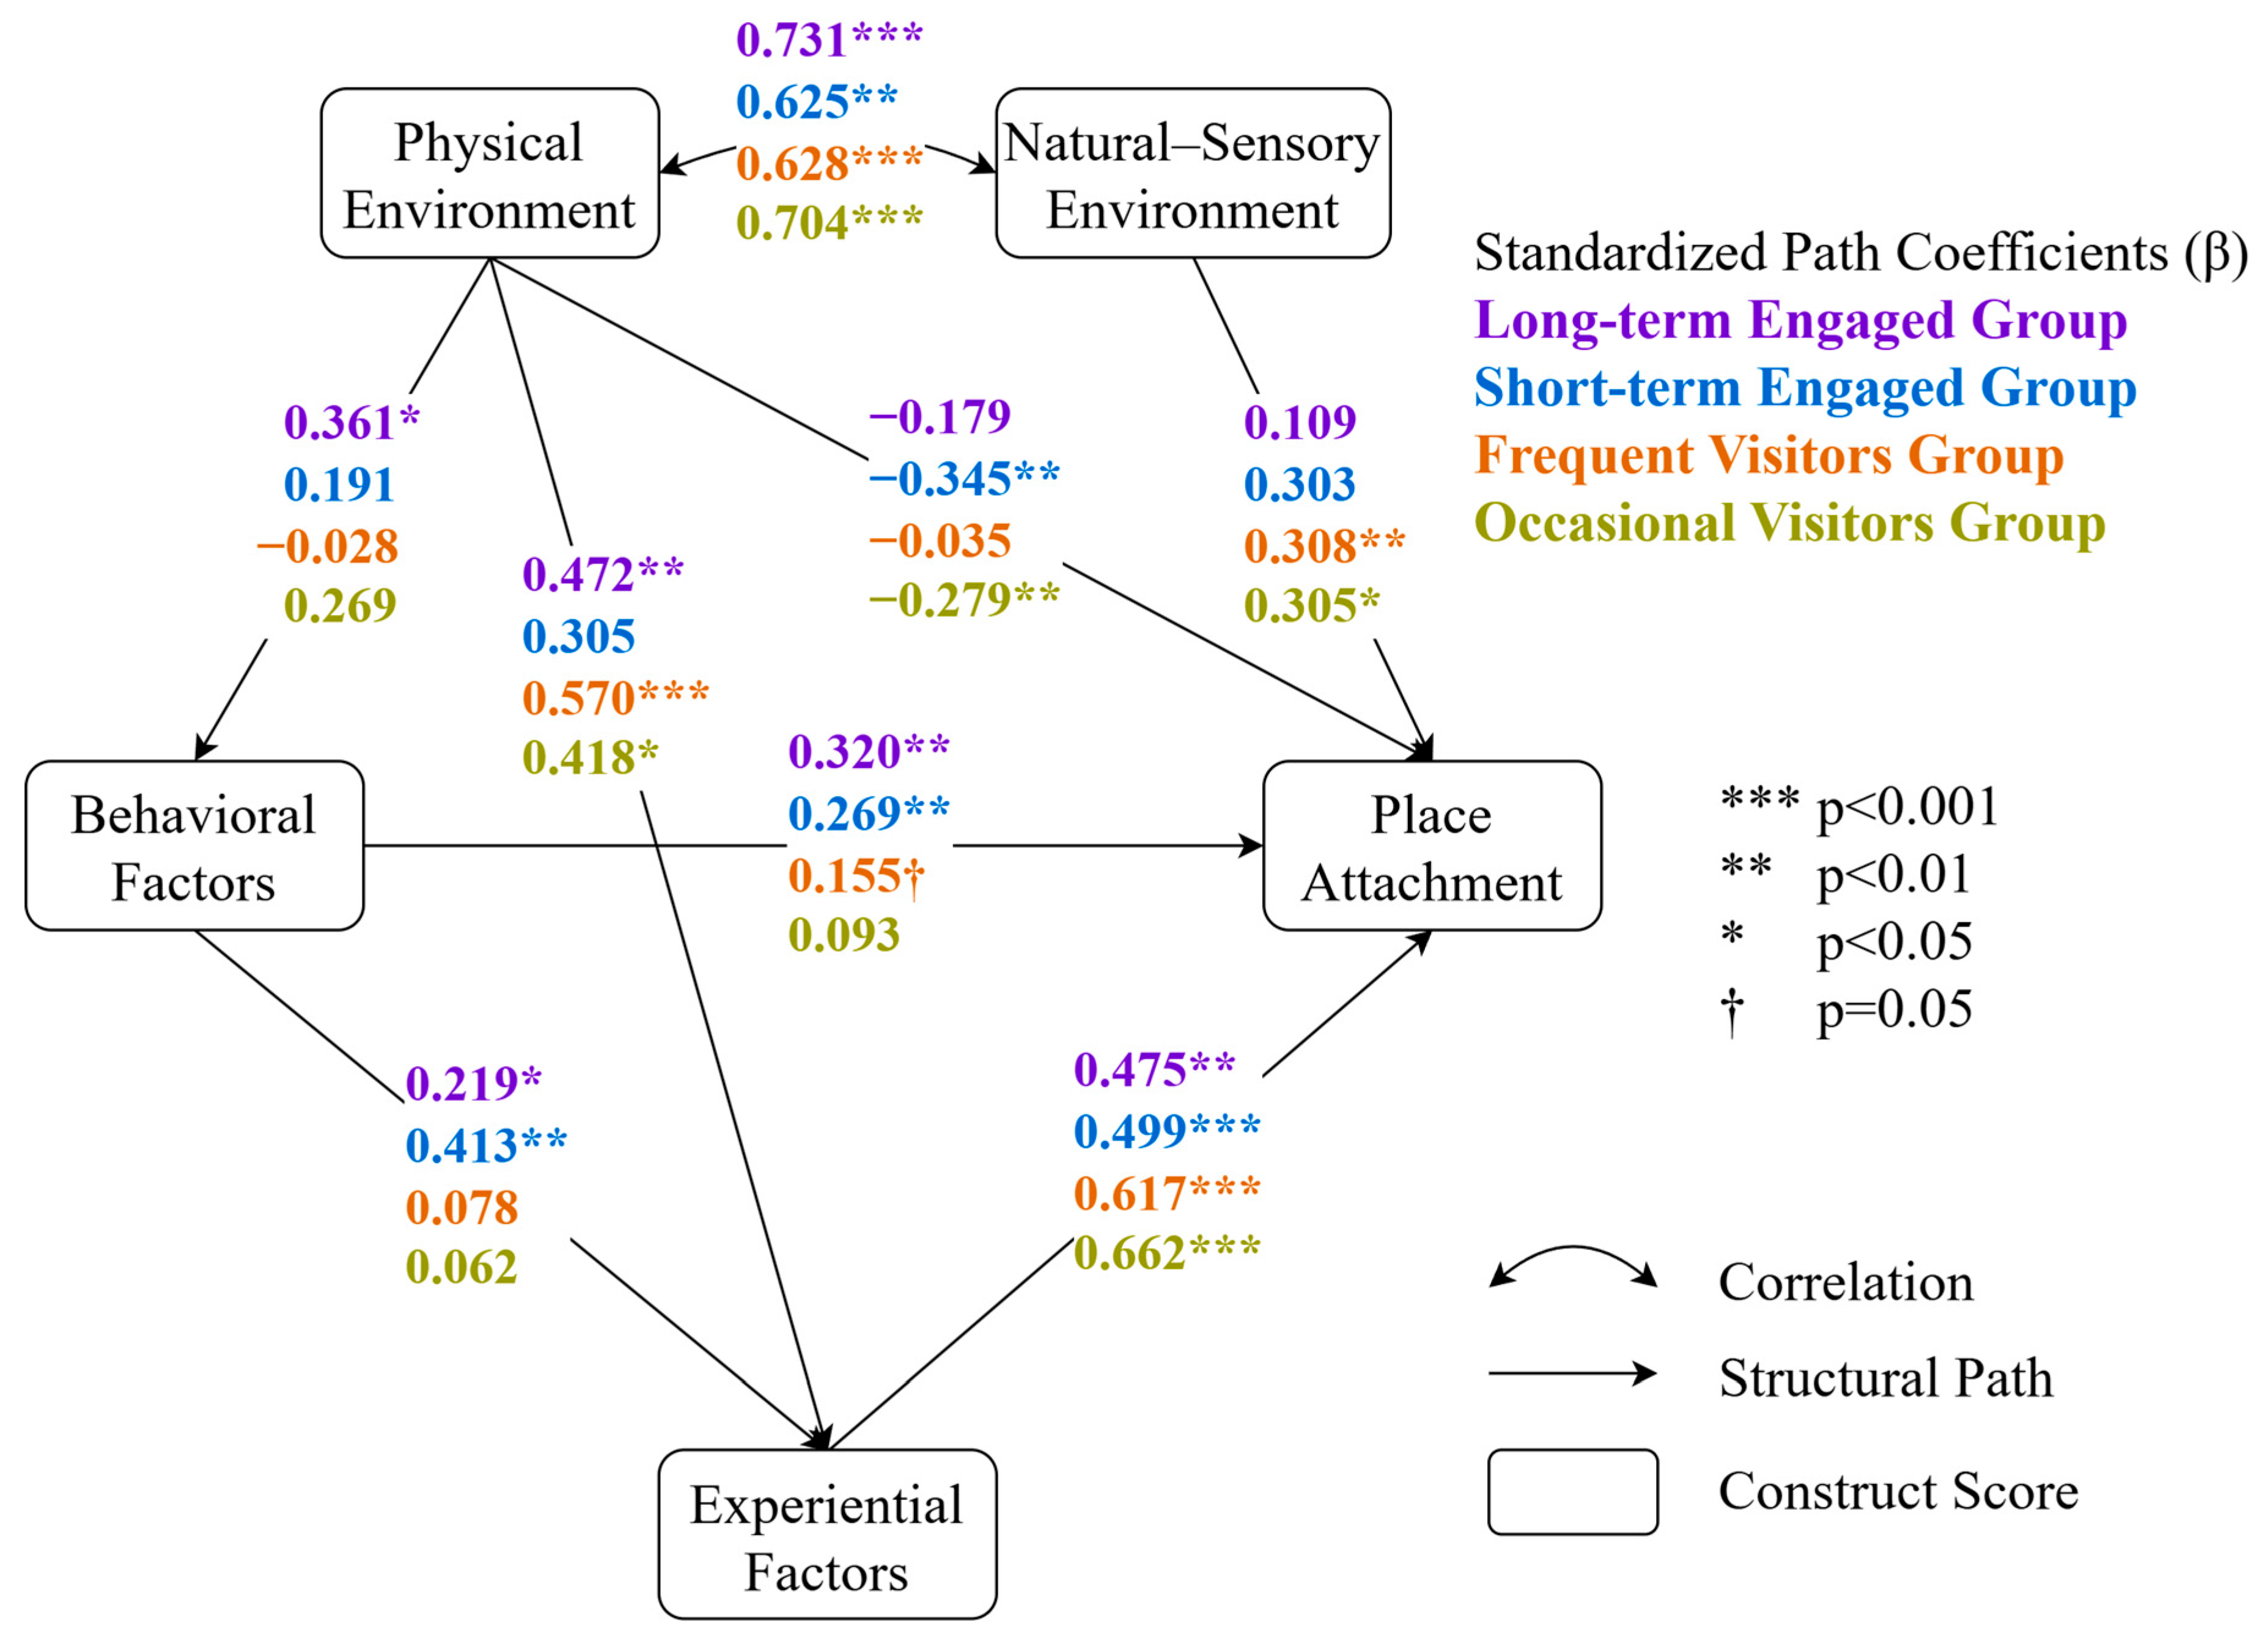

Disclaimer/Publisher’s Note: The statements, opinions and data contained in all publications are solely those of the individual author(s) and contributor(s) and not of MDPI and/or the editor(s). MDPI and/or the editor(s) disclaim responsibility for any injury to people or property resulting from any ideas, methods, instructions or products referred to in the content. |
© 2026 by the authors. Licensee MDPI, Basel, Switzerland. This article is an open access article distributed under the terms and conditions of the Creative Commons Attribution (CC BY) license.