


Abstract
The co-evolution of urban–rural spatial transformation and ecosystem services represents a key scientific issue for high-quality basin development and metropolitan ecological governance. As a core growth pole in the lower Yellow River Basin, the Jinan Metropolitan Area (JMA) faces the overlapping pressures of rapid urbanization and ecological constraints, making it an appropriate case for exploring the interactions between the urban–rural gradient and ecosystem service value (ESV). Based on multisource spatiotemporal datasets for 2000–2024, this study deploys a modified equivalent-factor method, a multidimensional urban–rural gradient model, and a geographic detector to investigate ESV dynamics, the evolution of the urban–rural gradient, and their coupling relationship at a 1 km × 1 km grid scale. The results show that: (1) Total ESV in the JMA increased slightly from 2000 to 2024, with pronounced spatial heterogeneity. High-ESV areas were distributed in the southern mountainous region and along the Yellow River, whereas low-ESV areas were mainly distributed across the northern plains and urban built-up areas. Forestland and water bodies provided the primary foundation for regional ESV stability. (2) Inner-suburban areas expanded rapidly and became the dominant urban–rural transition zone, while rural areas continued to contract. Urban areas exhibited both polarization and sprawl along transportation corridors. (3) The coupling coordination between ESV and the urban–rural gradient exhibited a “high-periphery, low-middle” spatial pattern and declined slightly over time. Land-use change, population density and normalized difference vegetation index (NDVI) serve as core driving factors, with nonlinear threshold effects; pairwise factor interactions exert stronger explanatory power than individual factors. This study advances the analytical framework for examining ESV in basin-metropolitan areas and provides a reference for integrated urban–rural development and ecological protection in similar regions.
1. Introduction
Urbanization is accelerating globally. Population, industry, capital, and other factors are rapidly being concentrated in urban areas, profoundly altering the surface landscape and ecosystem processes. This has led to a series of ecological and environmental problems, such as reduced biodiversity, a decline in ecological service supply, and deterioration of the quality of the living environment; these global challenges affect the sustainable development of human society. In its “2022 Global Cities Report: World Cities Outlook Report”, UN-Habitat predicts that the global urbanization rate will increase from 56% in 2021 to 68% in 2050. Developing regions will become the main areas for urbanization, and the contradiction between high-intensity anthropogenic activities and ecosystem protection will further intensify. Against this global background, ecosystem service-related research has gained growing attention as an effective tool to interpret human–nature interactions.
Ecosystem services refer to various benefits that humans obtain from ecosystems and include both tangible material products and intangible service provisions. They can be divided into four main types: supply services, regulatory services, cultural services, and support services necessary to maintain other types of services [1]. The value of ecosystem services reflects an estimation of ecosystem services and natural capital using economic laws [2]. Ecosystem services have become core indicators for measuring regional ecological security, ecological quality, and the level of sustainable development. In 1997, Costanza proposed a method for estimating ecosystem service value [1], which sparked extensive research on ecosystem services in the scientific community both in China and abroad [3]. In China, building on the research of Xie Gaodi et al. [4], the ecological service equivalent factor table has been adjusted according to the actual situation of each region to scientifically estimate the ESV of the study area and provide a basis for regional ecological environment construction [5]. At present, research focuses on the measurement of ecosystem service value and the analysis of driving factors. From the fine spatial simulation of single administrative units to multi-scale grid units [6], methods such as GLOBIO models and machine learning [7] have been widely introduced, but insufficient attention has been paid to the response of ecosystem services under human activities in heterogeneous urban and rural Spaces. In particular, urban–rural transition zones, where the intensity of human disturbance varies substantially, represent a critical yet understudied scenario for ESV response research.
The urban–rural gradient is an important characteristic of the spatial structure of urban ecosystems and is a significant feature of urban spatial heterogeneity [8], as reflected in the spatial changes in elements, structures, processes, functions, and services of urban ecosystems [9]. These zones provide a feasible spatial framework for quantifying the gradual variation in human disturbance across urban and rural territories. At present, most studies on the spatial heterogeneity of urbanization are based on single-dimensional measures such as topographic gradient [10] and urban land use structure [11]. These studies have explored the spatial differentiation of urbanization at the micro scale, but due to the limitation of a single analytical dimension, it is still difficult to fully reflect the multi-dimensional characteristics of the spatial gradient of urbanization and its environmental impact. Against this backdrop, it is necessary to further clarify how ESV responds to gradient-driven changes in landscape patterns under varying levels of urbanization intensity.
Rapid urbanization alters the regional landscape pattern, and changes in landscape patterns inevitably affect the components, structure, and ecological processes of an ecosystem, thereby altering ecosystem services [12]. Ecosystem services mainly constrain urban, economic, and social development through supply services, regulatory services, cultural services, and support services [13]. Urbanization and ecosystem services form a complex dynamic mutual feedback relationship. Research on the mutual feedback mechanism between urbanization and ESV still mostly focuses on the one-way impact of urbanization on ESV, and often adopts methods such as structural equation models [14], vector autoregressive models [15], and coupling coordination degree models. Therefore, investigating the spatiotemporal response, coupling relationships, and driving mechanisms of ESV under multidimensional urban–rural gradients are essential for understanding urbanization–ecosystem interactions, improving territorial spatial planning and ecological protection, and promoting high-quality regional development.
In this paper, the Jinan Metropolitan Area (JMA) is taken as a typical research area. As the core growth pole in the lower Yellow River basin, the JMA lies at the intersection of the Yellow River national strategy and rapid urbanization, where ecological constraints and urban expansion are sharply superimposed. This makes the JMA an ideal setting for examining human–ecosystem interactions under intensified anthropogenic disturbance. In addition, the JMA is currently undergoing a transitional phase characterized by core polarization, suburban sprawl and rural contraction—a pattern widely observed in other basin-type metropolitan areas in northern China. On the basis of long-term series of multisource data, a three-dimensional urban–rural gradient of land, population, and industry is constructed, the spatiotemporal evolution of ESV is calculated, the coupling between the urban–rural gradient and ESV is analysed, and geographic detectors are used to reveal the driving forces behind the spatial heterogeneity of elements. This study aims to answer the following scientific questions: (1) What spatiotemporal differentiation patterns have emerged in the multidimensional urban–rural gradients of the JMA over the past 24 years? (2) How does ESV respond to the evolution of the urban–rural gradient, and what are the spatial patterns and trends? (3) What spatiotemporal characteristics describe the coupling between urban–rural gradients and ESV? (4) What factors dominate the distribution pattern of ESV, and what is the mechanism of their interaction? The research conclusion can provide transferable analytical paradigms and decision-making references for the integrated urban–rural development and ecological protection management of similar metropolitan areas in the Yellow River Basin and even across the country.
2. Materials and Methods
2.1. Research Area and Data Sources
2.1.1. Overview of the Study Area
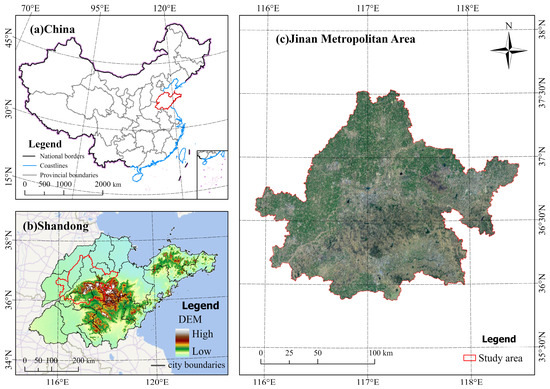
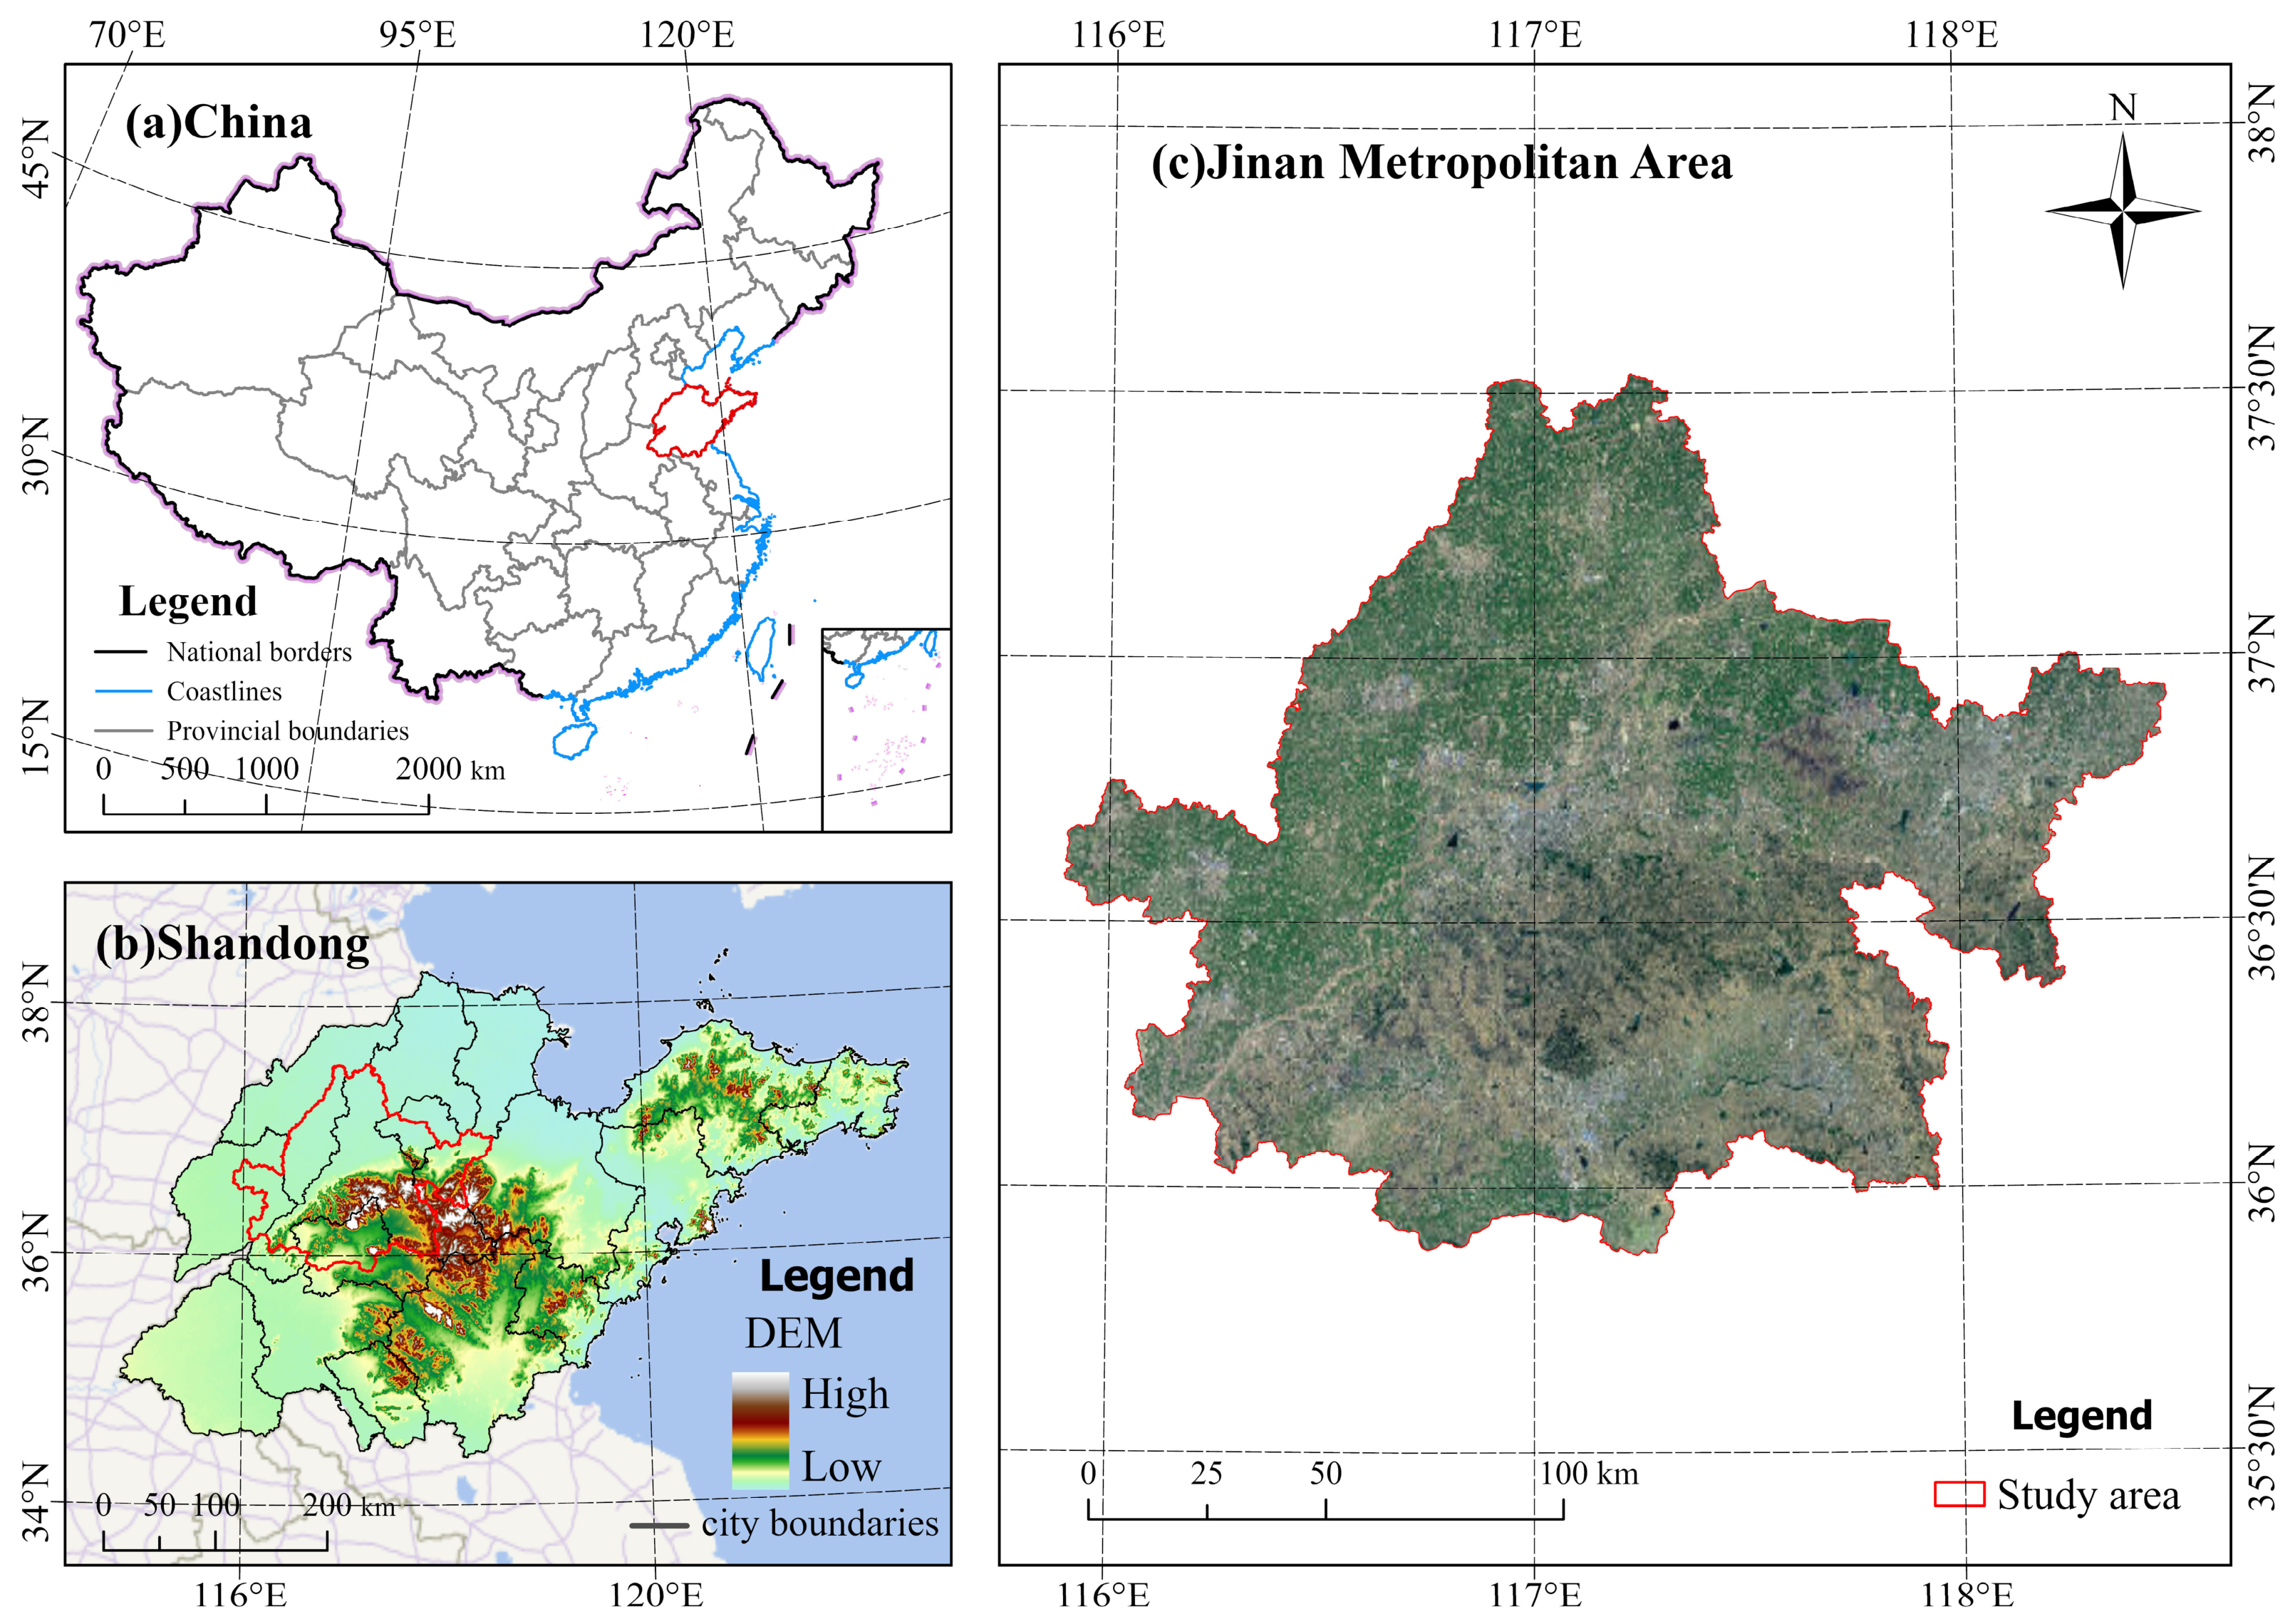
The JMA is located in the lower reaches of the Yellow River and the central and western parts of the Shandong Peninsula Urban Agglomeration (Figure 1). It is an important component of the coastal vertical axis in China’s urbanization strategic pattern and a key carrier area for ecological protection and high-quality development strategies in the Yellow River Basin. It plays an important strategic role in expanding regional economic openness, promoting coordinated development from east to west, and supporting the country’s emerging regional development strategy. As a key regional growth pole, the JMA plays an important role in advancing regional modernization under national strategic initiatives. The JMA is centred on Jinan city and includes parts of the surrounding prefecture-level cities of Zibo, Tai’an, Dezhou, Liaocheng, and Binzhou, covering approximately 22,300 km2.
Figure 1.
Overview of the study area. (a) The position of Shandong in China. (b) The location of the JMA in Shandong Province. (c) Remote sensing image of the JMA. The base image in (c) is a true-color satellite image reflecting the surface coverage.
By the end of 2023, the permanent resident population of the JMA was approximately 16.712 million, and its gross domestic product was 1928.716 billion yuan. The study area features a rich variety of landforms, with the elevation being high in the south and low in the north, and the elevation difference exceeds 1500 m. Since 2000, the urbanization rate of the JMA has continued to increase, the urban area has expanded rapidly, the industrial structure has been continuously optimized, the intensity of anthropogenic activities has significantly increased, and the urban–rural spatial pattern has undergone major changes. The contradiction between ecological protection and urbanization has become increasingly prominent [16]. Jinan thus represents a typical case for studying the interactive relationships between urban–rural gradients and ecosystem services.
2.1.2. Data Sources and Processing
The data used in this study and their sources are shown in Table 1. All the data were from 2000, 2005, 2010, 2015, 2020, and 2024 and were processed using ArcGIS 10.8. The remote sensing data were uniformly resampled to a spatial resolution of 1 km × 1 km, and the coordinate system was uniformly WGS 84/UTM Zone 50N. The Min-Max Scaling method was adopted for data preprocessing.
Table 1.
Data information and sources.
2.2. Research Methods
2.2.1. Measurement of Ecosystem Service Value
On the basis of the ecosystem service characteristics of the JMA, in this paper, the equivalent factor table of ESV per unit area proposed by Xie Gaodi in China [4] was revised, and wheat, corn, and rice were selected to represent the grain production status in the study area. Using the average grain price in 2020, the standard equivalent coefficient for the study area was calculated as one-seventh of the regional average grain market value [17]. The formula is as follows:
where Ea represents the value of farmland ecosystem services per unit area (yuan/hm2) and is one-seventh of the market economic value of crops per unit area, i represents the type of food crop, M represents the total planting area of food crops (hm2), mi represents the area of the i-th food crop (hm2), pi represents the average price of the i-th food crop (yuan/kg), and qi represents the yield per unit area of the i-th food crop (kg). The formula for calculating the ESV of a single land use type is as follows:
The formula for calculating the service value is as follows:
ESVi represents the ESV of the first type of land use in a grid cell (yuan/(hm−2∙a−1)), VCi represents the ESV coefficient of the i-th land use type, and m represents the total number of land use types. AESVt1 and AESVt2 represent the values of terrestrial ecosystem services in different periods (yuan/hm2); C represents the rate of change in the ESV per area (%); and n represents the number of land use types.
2.2.2. Urban–Rural Gradient Quantification Method
On the basis of land use, night lighting, and population density data, a comprehensive urban–rural gradient is obtained by superimposing different dimensions of land, population, and industry [18]. The JMA is divided into four areas: urban, inner suburbs, outer suburbs, and rural areas.
- (1)
- Urban–rural land gradient [19]. On the basis of the characteristics of urban and rural land use changes, a 1 km × 1 km grid was created. The urban and rural land gradients were calculated by taking the proportion of impermeable surfaces within each grid.
- (2)
- Population gradient between urban and rural areas [19]. Nighttime lighting data and population density data represent the status of human activities and population distribution, respectively, and weighted superposition yields the urban–rural population gradient.where PG represents the urban–rural population gradient, NL represents the corrected night light data, PD represents the 1 km population density data of the JMA, and α and β are the weight coefficients.
- (3)
- Urban–rural industrial gradient [19]. According to POI data for the JMA, the secondary industry is characterized by factories and industrial parks, whereas the tertiary industry is represented by corporate enterprises, catering services, shopping services, and accommodation services. A 1 km × 1 km grid is constructed, and the number of POI points in each grid is counted for kernel density and normalization processing to calculate the industrial gradient between urban and rural areas.
The threshold values for each gradient category were defined with reference to previous studies on multidimensional urbanization measurement (Table 2). The Delphi method was then used to determine the weights of each dimension, which were combined to derive the comprehensive urban–rural spatial gradient. Among the three-dimensional indicators, population was assigned the highest value. The essence of the urban–rural gradient lies in the spatial variation in the intensity of human disturbance, and population concentration is the most direct manifestation of human social activity. The land dimension was assigned the lowest weight because land-use patterns primarily represent the external landscape outcome of population and industrial agglomeration. For newly built urban districts with limited population inflows, relying solely on land-use indicators may lead to an inaccurate assessment of the actual intensity of urbanization. The industrial dimension characterizes the degree of economic agglomeration and serves as an intermediate link between population agglomeration and land expansion. Finally, the three dimensions were weighted and integrated to construct a multidimensional comprehensive urban–rural gradient index.
Table 2.
Classification of urban–rural gradient types in the JMA.
2.2.3. Coupling Coordination Model
Coupling coordination models are used to represent the degree of mutual influence between two or more systems [25]. Multidimensional urbanization systems and ecosystem service systems interact independently to a certain extent [26]. Therefore, a coupling coordination model is adopted in this study. The calculation process is not described in detail here. The mathematical expression is as follows:
where C represents the degree of coupling and U1 and U2 represent the composite indices of multidimensional urbanization and ecosystem services, respectively. Here, the value of C is [0, 1]. The closer it is to 1, the higher the degree of coupling [19].
The degree of coupling coordination is used to quantify the level of coordinated development between the two systems and is calculated as follows:
where D represents the degree of coupling coordination, which has a range of [0, 1], and α and β are undetermined coefficients. In this study, α = β = 0.5 is set following [20]. The closer D is to 1, the greater the degree of coupling coordination between the two systems [27].
2.2.4. Geographic Detector
Geographic detectors can detect the driving forces behind the spatial heterogeneity of elements on the basis of the geographic spatial elements of independent variables (discretized variables) and dependent variables [21]. The independent variables were discretized using the visual banding function in IBM SPSS Statistics 27. The ESV for 2000 and 2024 were selected as the dependent variables. The data were gridded to a 1 km × 1 km grid over the JMA. In accordance with previous studies [28], eight natural socioeconomic factors, namely, land use type (X1), nighttime light (X2), normalized vegetation index (X3), population density (X4), elevation (X5), annual average precipitation (X6), annual average temperature (X7), and slope (X8), were selected as independent variables, and 22,278 sample points were randomly generated in ArcGIS 10.8. After the elimination of outliers, geographical exploration and analysis were conducted on the remaining 22,103 sample points.
3. Results
3.1. Temporal Evolution of Ecosystem Service Value
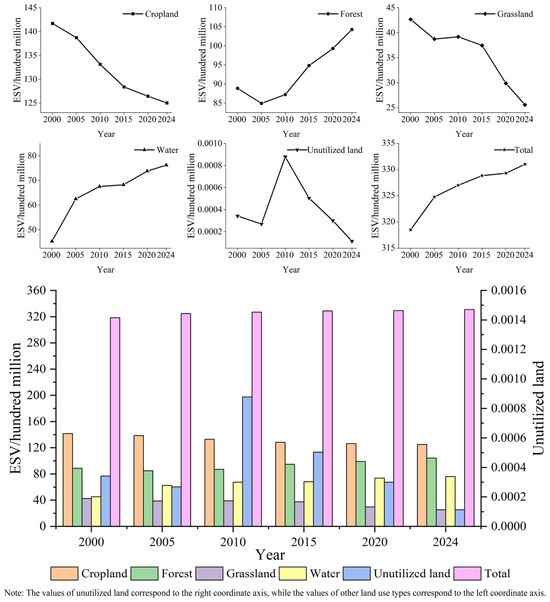
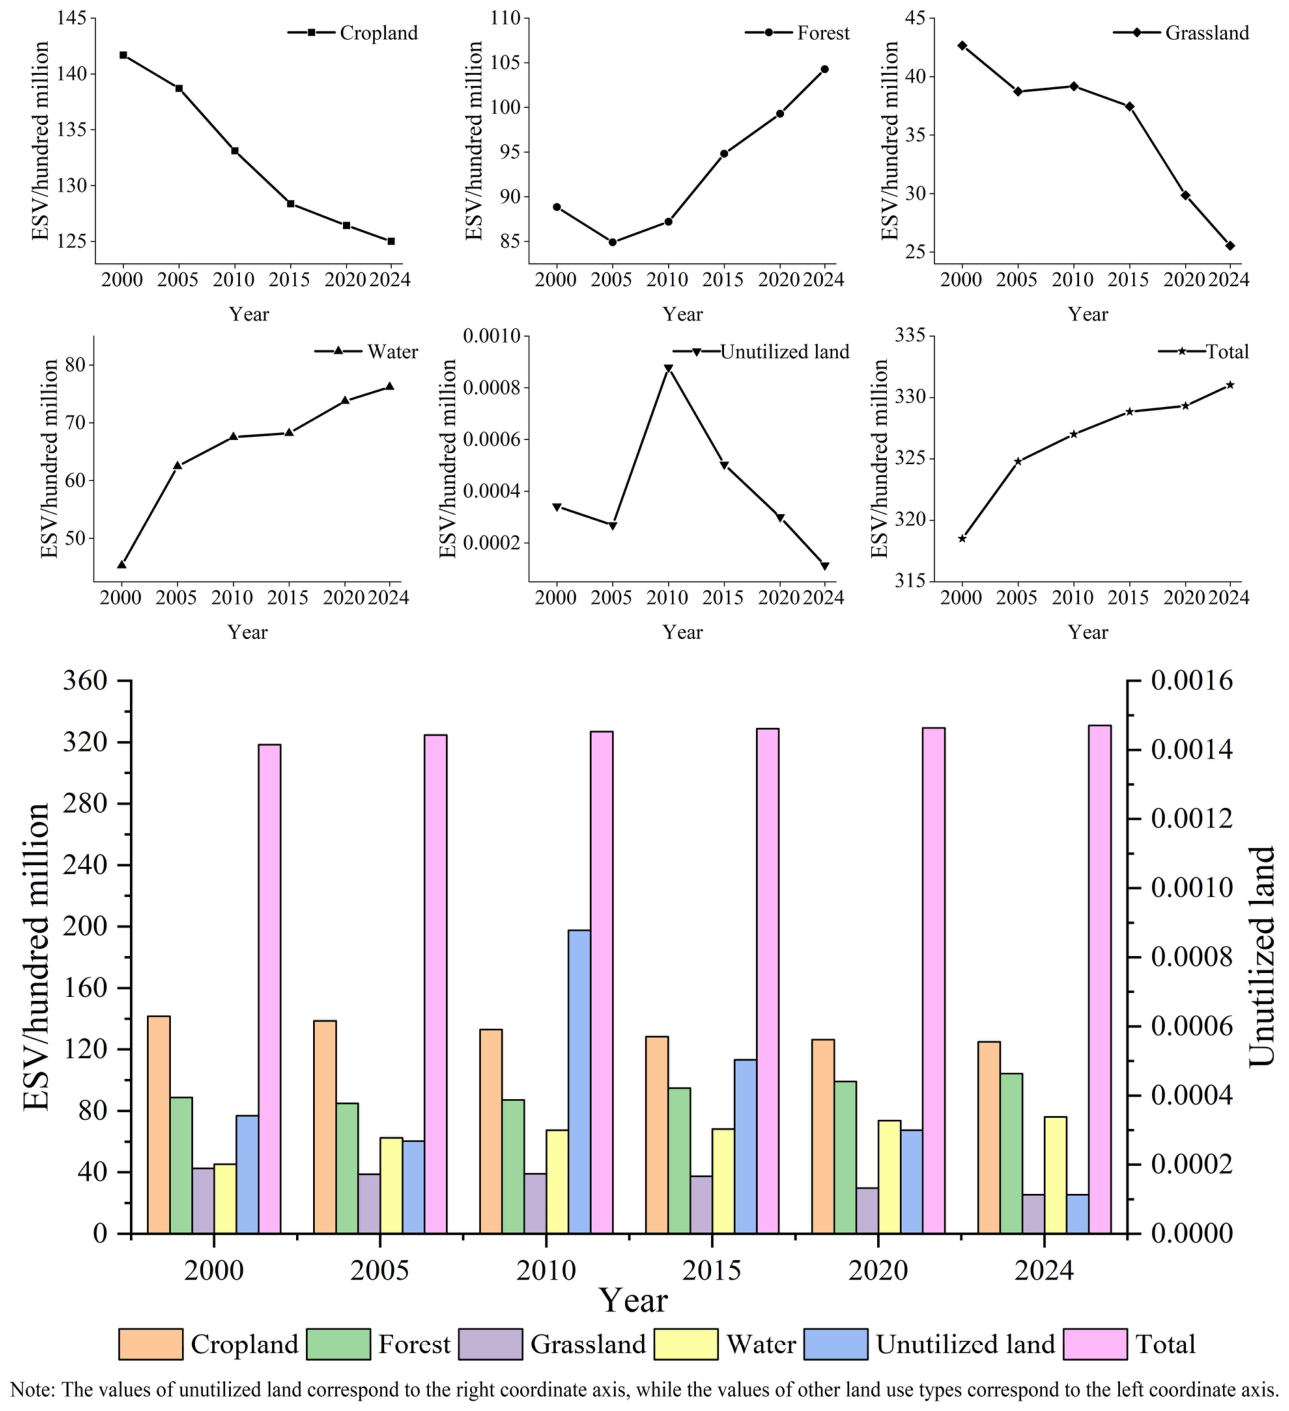
As shown in Figure 2, the total ESV of the region exhibited a continuous upward trend from 2000 to 2024. This overall growth was mainly driven by a significant increase in the value of water and forest services. Among them, the ESV increase in water areas was the most significant, showing a continuous upward trend. After experiencing a brief trough, since 2005, the value of forest ecosystem services has maintained a stable upward trend. On the contrary, the ESV of cultivated land and grassland showed a continuous downward trend, especially the decline of grassland was relatively large in the later stage. Although the value of unused land experiences a sharp fluctuation of first rising and then falling, due to its extremely small base, its overall impact is negligible. Overall, the positive growth in the ecological value of water areas and forests has effectively offset the negative impact brought about by the reduction in the value of cultivated land and grassland, jointly promoting the steady increase in the total value of regional ecosystem services as a whole. Several abrupt changes can be observed in the ESV time series for different land-use types. These changes mainly resulted from two factors. First, actual land-cover conversions within the JMA occurred as a result of human activities and ecological engineering. For example, the sharp increase in the value of aquatic ecosystem services between 2000 and 2005 corresponded to the implementation of the Yellow River water and sediment regulation plan as well as the expansion of reservoirs and aquaculture ponds. In 2010, the ESV of unused land reached its peak, reflecting large-scale land expropriation associated with the construction of new urban areas: cultivated land was temporarily converted to bare land prior to development and construction. Continuous afforestation projects have driven a steady increase in the ESV of forest land ecosystem services, to keep increasing since 2005. Secondly, inconsistencies among long-term land-use datasets may also generate artificial fluctuations. Different LUCC products employ different remote-sensing interpretation thresholds, which can result in classification discrepancies among water bodies, bare land, and grassland.
Figure 2.
Temporal evolution of ecosystem service values in the JMA.
3.2. Spatial Variation in Ecosystem Service Value
The ecosystem service value in the JMA exhibited a spatial pattern characterized by high values in the central and eastern regions and low values in the surrounding and western regions (Figure 3). Overall, high ESVs were concentrated in areas with abundant water resources, including the main stem of the Yellow River and around Xueye Lake and Baiyun Lake. The mountainous area of central Shandong also exhibited high ESVs owing to its favourable natural conditions and extensive forest cover. These findings indicate that areas with relatively large proportions of water and forestland provide greater ecosystem services and represent important ecological spaces supporting regional ecosystem function [18]. From 2000 to 2024, ESVs increased significantly in water-rich areas, such as Baiyun Lake, Jixi National Wetland Park, and the Muwen River, as well as the mountainous region of central Shandong, whereas ESVs generally decreased elsewhere.
Figure 3.
Spatial characteristics of ecosystem service values in the JMA from 2000 to 2024.
3.3. Spatiotemporal Variations in the Urban–Rural Gradient
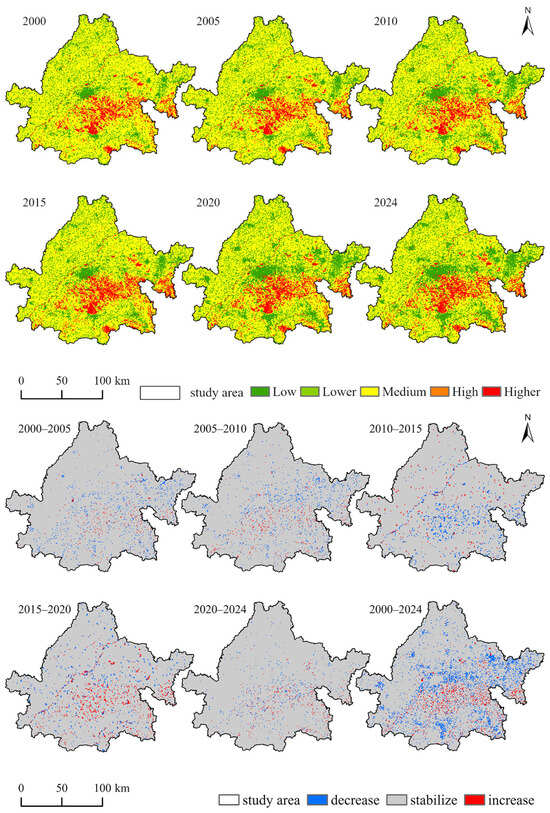
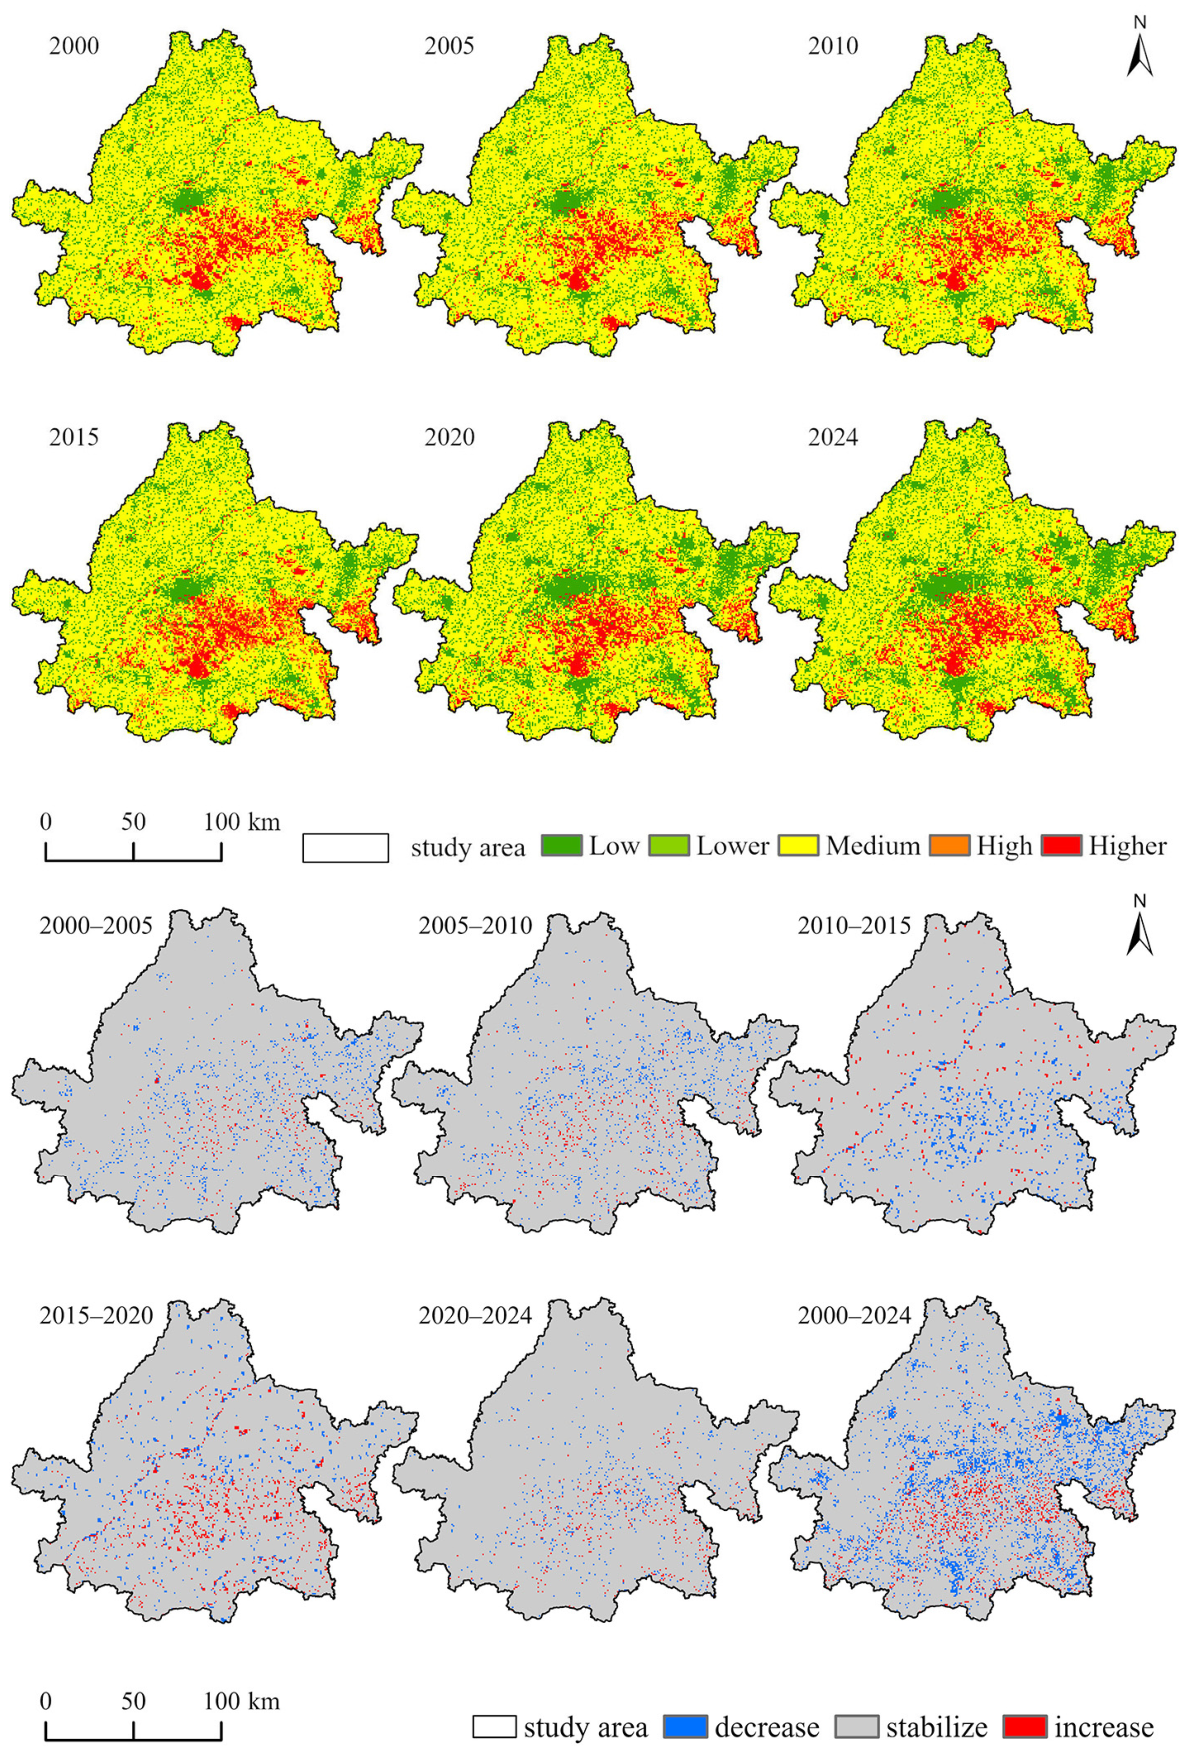
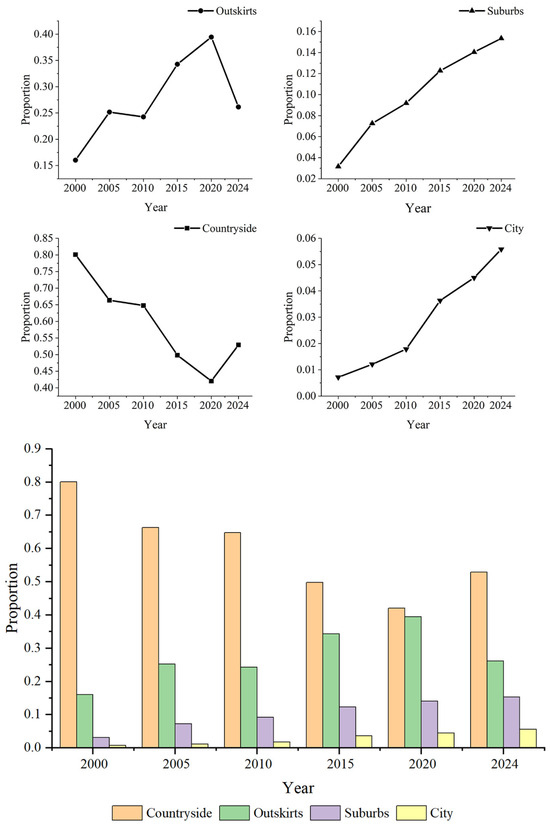
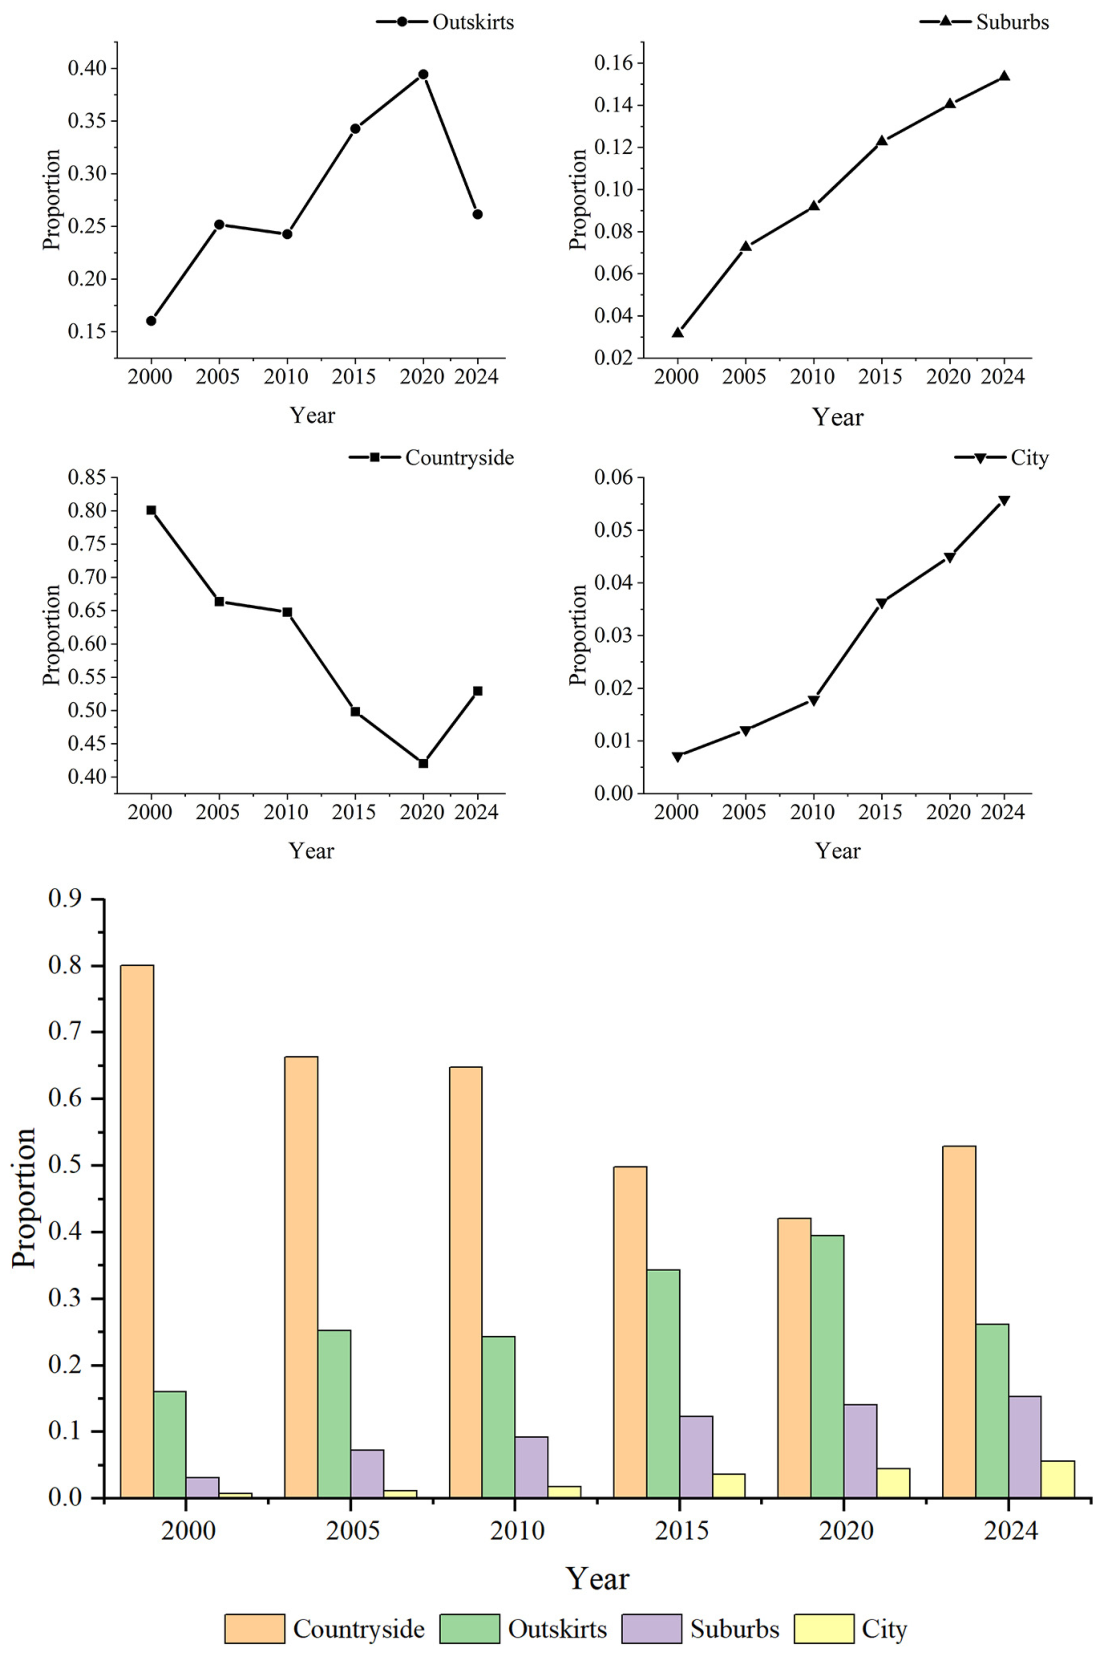
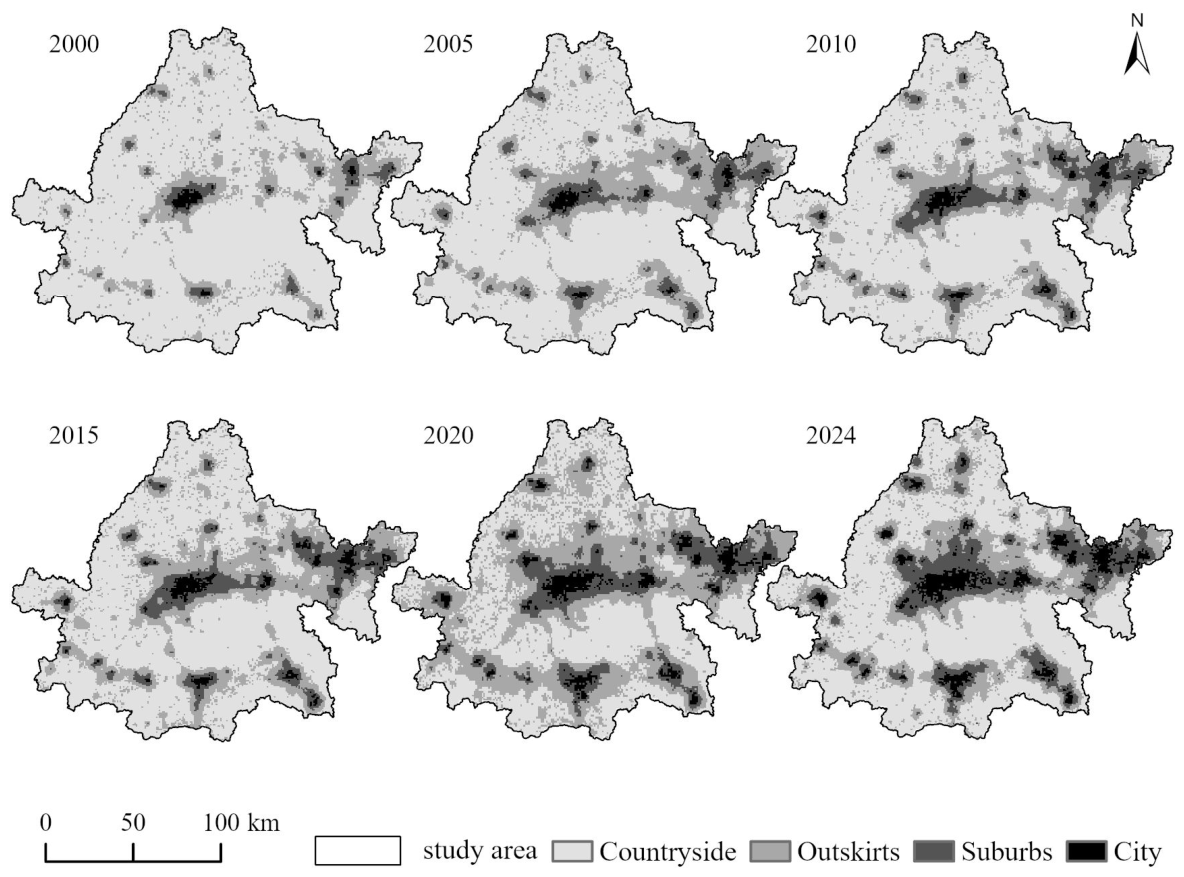
The spatial type changes from 2000 to 2024 in Figure 4 indicate that although rural areas remain the dominant spatial type, they continue to decline and have the largest overall contraction. Outer suburban areas expanded steadily, primarily through the conversion of rural land and were distributed around the periphery of the urban core. Inner suburban areas exhibited the greatest increase in area, reflecting the rapid urbanization of the JMA. Urban areas expanded gradually, with growth concentrated in the existing urban areas, resulting in an increasingly polarized spatial pattern.
Figure 4.
Changes in urban and rural areas in the JMA from 2000 to 2024.
From 2000 to 2024, the JMA presented a stable spatial pattern of multidimensional urban–rural gradients characterized by one leading core, two expanding axes, and multiple supporting nodes (Figure 5). The one core refers to the central urban area of Jinan, which is the high-value area of the urban–rural gradient. The two axes are the Jining–Zibo Integrated Development Axis and the Jining–Taizhou Ecological and Cultural Tourism development axis, which have expanded along the major transportation corridors. The multiple nodes include the secondary central cities, such as Zibo, Tai’an, Liaocheng, Dezhou, and Binzhou, which form local high-value areas. Overall, the urban–rural gradient in the JMA exhibits significant spatiotemporal variation, and urbanization is characterized by three major patterns: core polarization, peripheral expansion, and rapid growth of the inner suburbs.
Figure 5.
Evolution of the urban–rural gradient in the JMA from 2000 to 2024.
3.4. Coupling Coordination Analysis of the Urban–Rural Gradient and Ecosystem Service Value
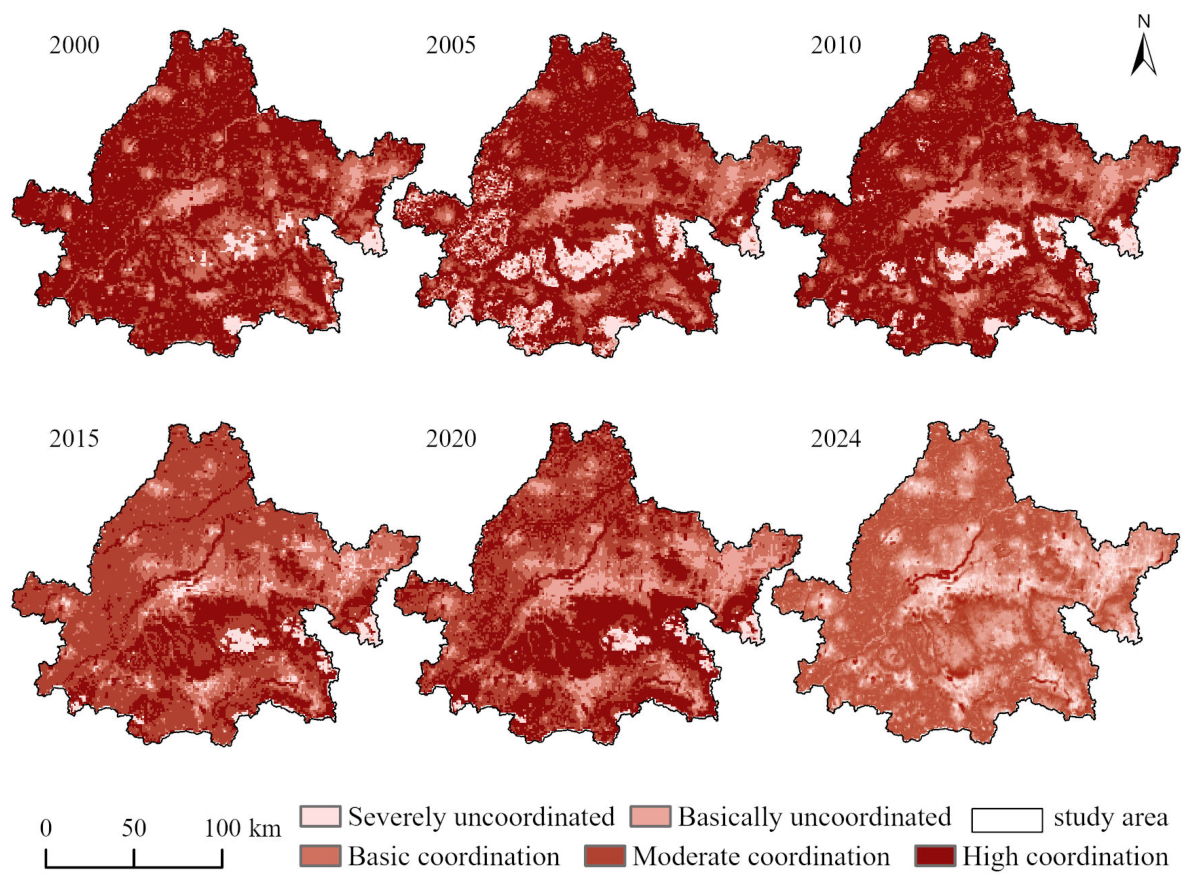
On the basis of previous studies [29,30] and characteristics of the study area, the natural breaks method was used to classify the degree of coupling coordination between the urban–rural gradient and ecosystem service value into five categories: severely uncoordinated, basically uncoordinated, essentially coordinated, moderately coordinated, and highly coordinated. From 2000 to 2024, the degree of coupling coordination exhibited a spatial pattern characterized by higher values in the peripheral and western regions and lower values in the central and eastern regions (Figure 6). The mean degree of coupling coordination decreased from 0.76 to 0.66, indicating a slow decline over the study period. Nevertheless, the JMA remained with the coordinated development category overall.
Figure 6.
Spatiotemporal pattern of the degree of coupling coordination in the JMA from 2000 to 2024.
Spatially, the degree of coupling coordination in the Taishan Mountain area in the JMA from 2000 to 2024 was significantly lower than that in the surrounding areas. High values of coupling coordination occurred in along the Yellow River. The degree of coupling coordination of the main urban area of Jinan was stable at an intermediate level, showing a downward trend with slight variability. The high coupling coordination observed along the Yellow River is likely attributable to the coexistence of abundant water resources, which support high ESVs, and a relatively high level of urbanization. In contrast, the Taishan Mountains are characterized by well-preserved ecosystems and high ESVs but relatively low levels of urbanization due to topographic constraints, resulting in a lower state of coordination [31].
3.5. Drivers of Ecosystem Service Value
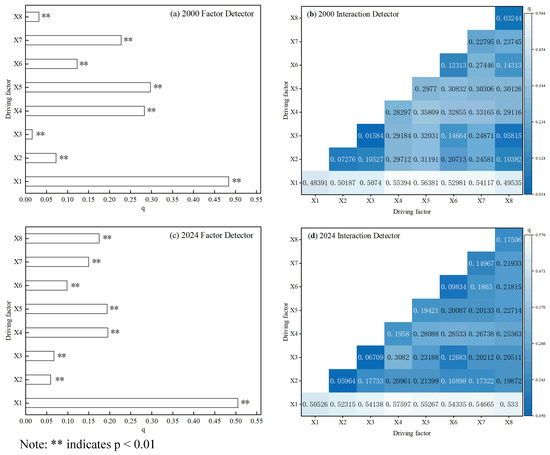
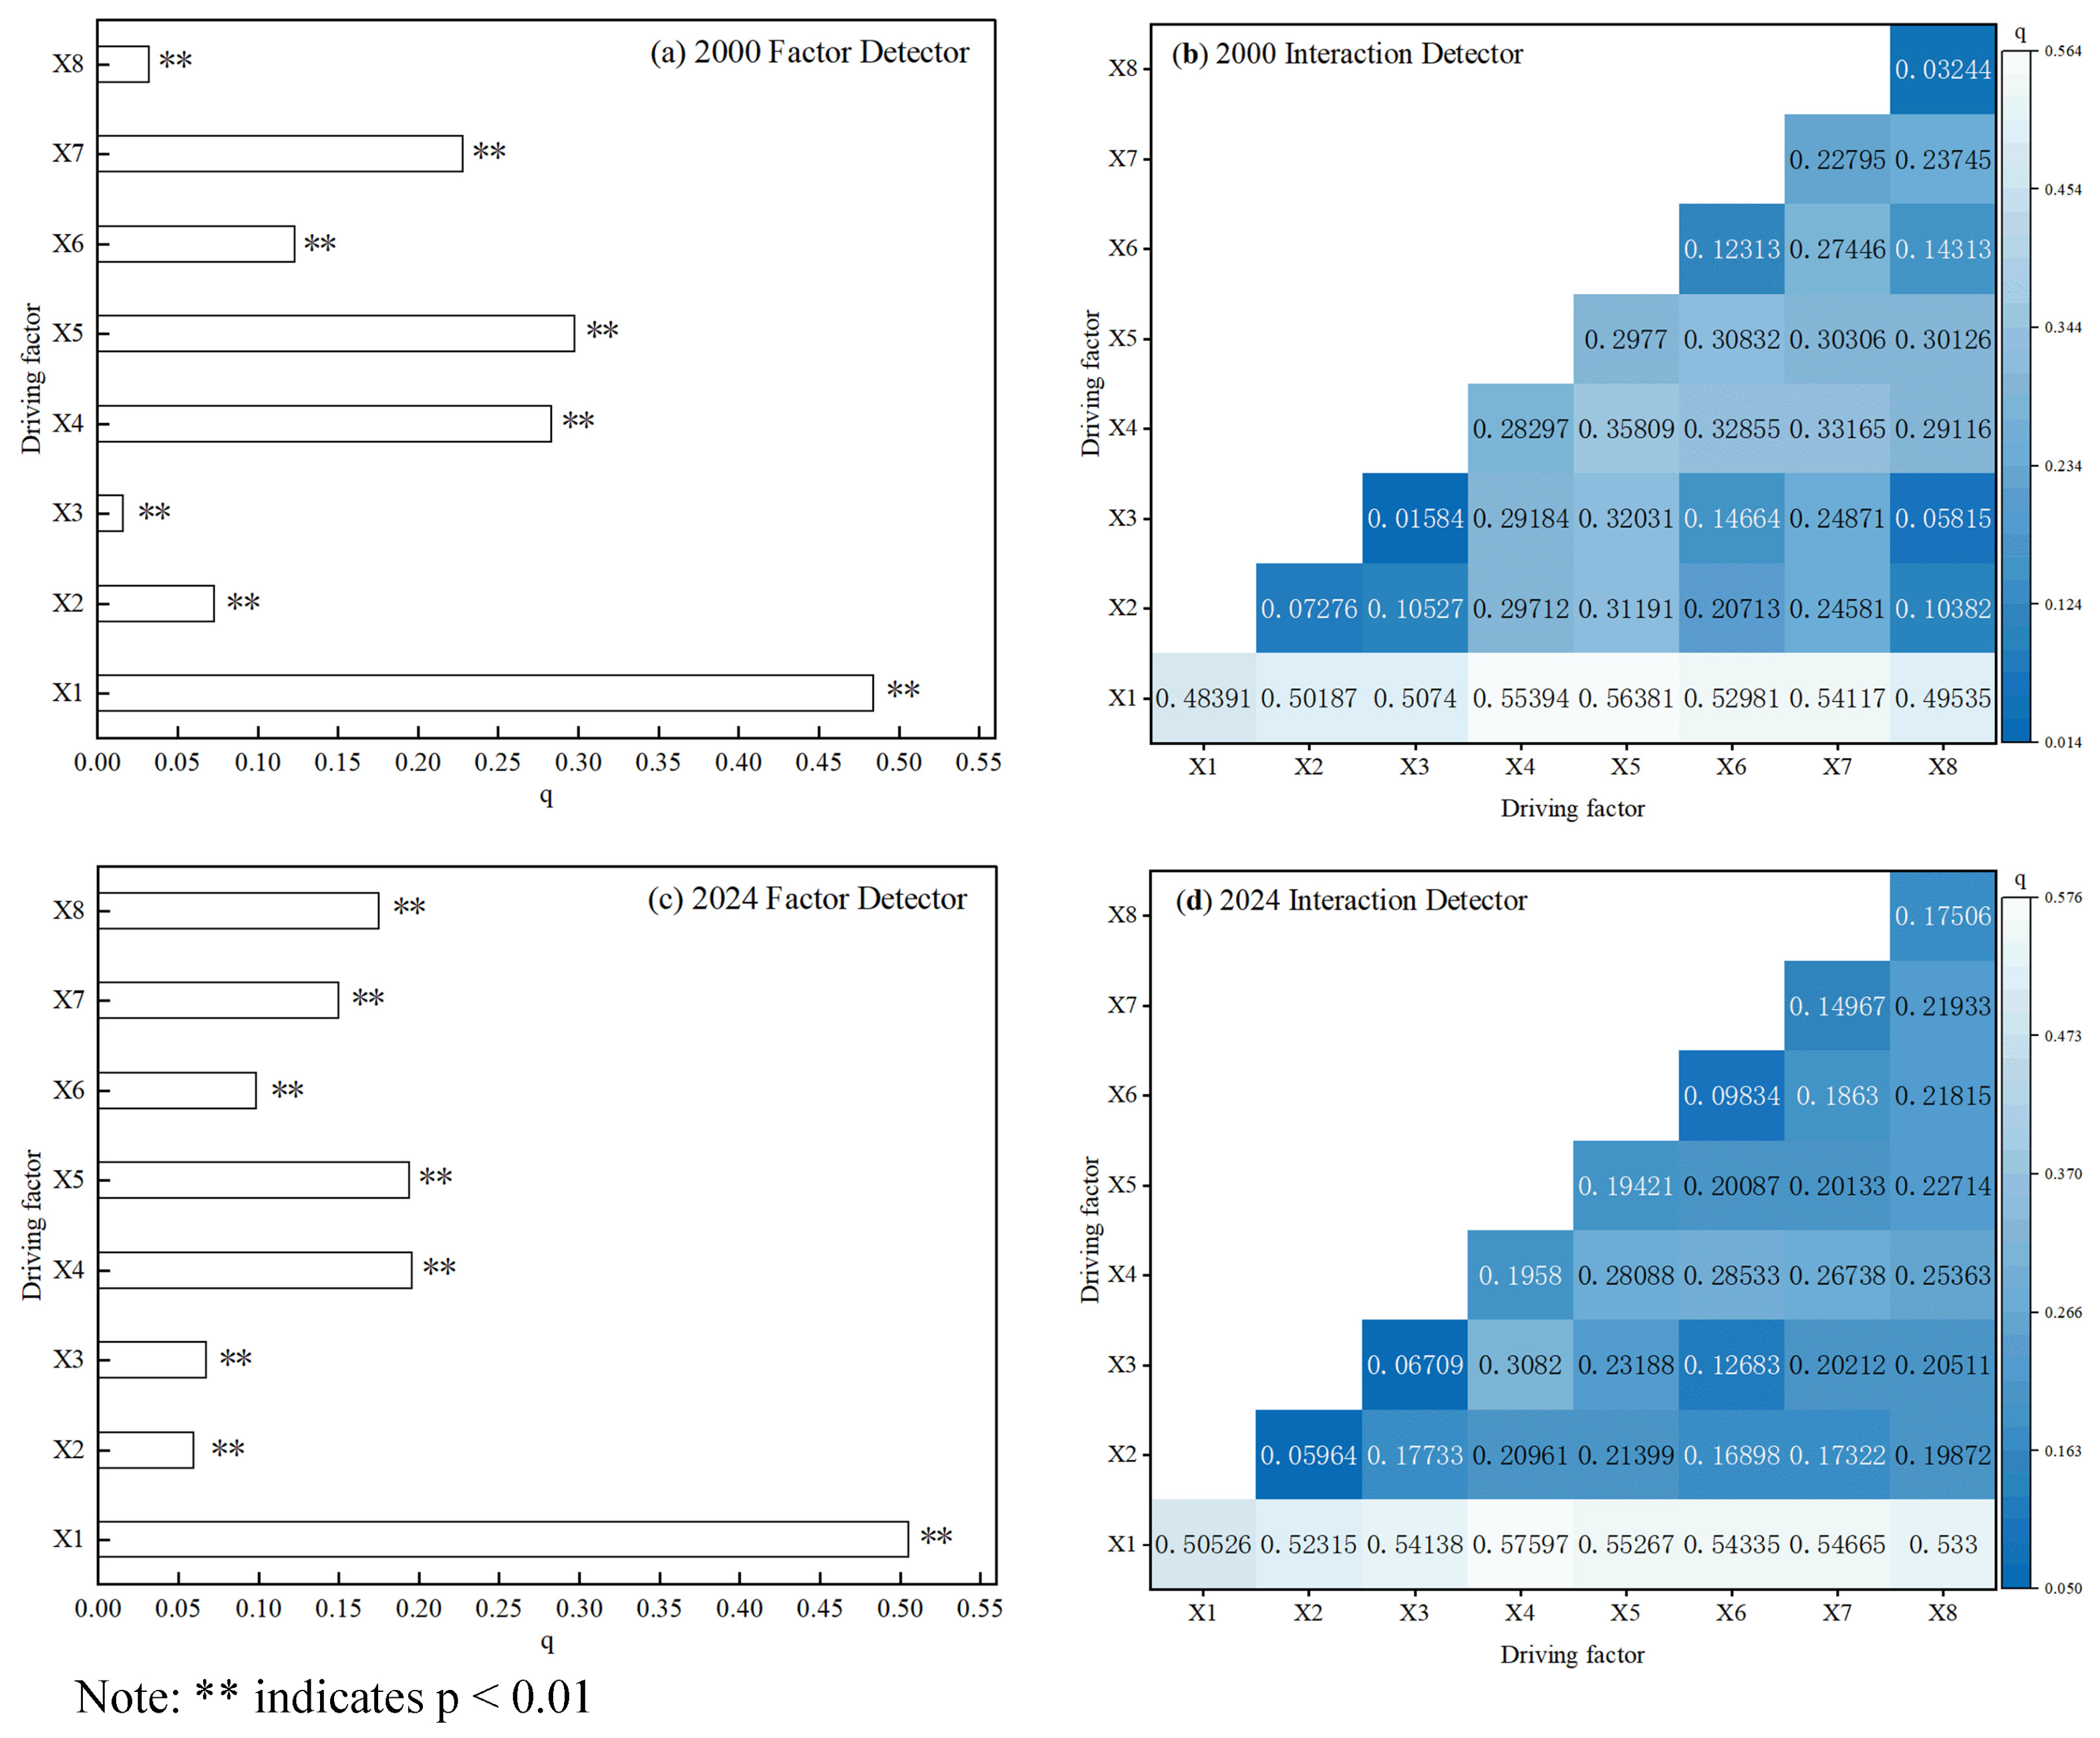
The single-factor detection results [Figure 7a,c] revealed that the q values of each driving factor in 2024 followed the order X1 > X4 > X5 > X8 > X7 > X6 > X3 > X2, and the q values of each driving factor in 2000 followed the order X1 > X5 > X4 > X7 > X6 > X2 > X8 > X3. Among them, land use type (2024: 0.505; 2000: 0.484) and elevation (2024: 0.194; 2000: 0.298) significantly impacted the ESV of the JMA (p < 0.01), and the explanatory power of both exceeded 19%, indicating that natural factors have played a dominant role in the ESV of the region. Among the human factors, population density (2024: 0.196; 2000: 0.283) was the most significant socioeconomic factor influencing the ESV (p < 0.01), which reflects the impact of regional human intervention intensity on the region’s ecosystem. Humans can indirectly affect the ecosystem service value by changing land use patterns and influencing vegetation coverage [32].
Figure 7.
Geographical exploration results of the factors driving ecosystem service value in the JMA. (a) Single-factor detection results in 2000. (b) Detection results of interaction factors in 2000. (c) Single-factor detection results for 2024. (d) Detection results of interaction factors in 2024.
The interactive detection results [Figure 7b,d] revealed that the differences in the spatial distribution of the ESV in the JMA resulted from the combined interaction of multidimensional natural and social factors. The explanatory power of the interaction between any two factors exceeded that of any individual factor, indicating significant two-factor enhancement or nonlinear enhancement. Accordingly, integrated management approaches that combine land-use planning, vegetation conservation and restoration, population management, and ecological engineering may be more effective than single-factor interventions [33].
The interactions between land use types and other factors exhibited a dominant effect on the coupling coordination of ecosystem services. The explanatory power of the 2024 data exceeded 52%, and that of the 2000 data was greater than 49%. Therefore, the relationship between the development of the economy and society and the stability of ecosystem service functions should be emphasized to prevent unreasonable human activities from causing changes in land use types and thus leading to the decline of ecosystem service functions [34].
4. Discussion
4.1. Spatiotemporal Characteristics of Ecosystem Service Value
At the regional scale, total ESV in the JMA exhibited a slight upward trend from 2000 to 2024, driven primarily by land-cover transitions. Although the contraction of cultivated land and grassland resulted in continuous ESV losses, substantial gains associated with the expansion of forestland and water bodies offset these losses and contributed to the overall increase. Rather than focusing solely on aggregate temporal trends, our analysis highlights prominent spatial heterogeneity across the JMA. Consistent with existing regional evidence, high-ESV zones were concentrated in the forested terrain of the south and along the Yellow River wetland system, where water conservation, soil retention, and hydrological regulation functions predominate [35]. By contrast, urban built-up areas dominated by impervious surfaces exhibited substantially lower ecosystem service capacity.
Spatially, ESV exhibited marked heterogeneity, with high values in the southern mountainous areas and along the Yellow Rier and low levels in the northern plains and urban developed areas. The mountainous region of central Shandong supports extensive forest cover, high vegetation density, and a stable ecological structure, providing important ecosystem services, such as water conservation, soil retention, and biodiversity maintenance [36]. Similarly, the Yellow River and its associated lakes and wetlands provide substantial hydrological regulation and water purification services, resulting in high ESVs. In contrast, urban developed areas are dominated by impervious surfaces that have substantially altered natural ecosystems and reduced ecological service value. These findings indicate that forestland and water bodies are the principal contributors to regional ecosystem services and are consistent with previous studies demonstrating that terrain, hydrology, vegetation, and land use are the primary controls on the spatial distribution of ESVs [28,37].
4.2. Spatiotemporal Characteristics of the Urban–Rural Gradient
Traditional studies of urban–rural gradients in Chinese metropolitan areas have largely relied on single-dimensional indicators, such as nighttime light intensity or population density, to characterize urban–rural differences and have often treated suburban areas as homogeneous transition zones. Our multidimensional measurement supports the view that inner-suburban zones represent the most dynamically changing region within metropolitan systems, which coincides with case findings from the Yellow River downstream megacity clusters. Our results extend previous research by further distinguishing the divergent evolutionary trajectories of population, industry, and land dimensions, thereby revealing asynchronous changes in demographic, economic, and land-use urbanization.
Table 3 presents changes in the spatial structure of the urban–rural gradient in the JMA and shows the changes in the areas of different spatial types. In terms of the evolution of spatial types, the proportion of inner suburban areas has increased the most. Inner suburban areas became the dominant zone of urban–rural integration. Rural areas have continued to contract, whereas outer suburban areas have steadily expanded. Urban areas have become slightly polarized and have spread along transportation corridors [38]. These findings indicate that urbanization in the JMA has shifted from one-way agglomeration of the core city to a composite model of core polarization, peripheral expansion, and rapid transformation of the inner suburbs. The suburbs have become the main receivers of the spillover of urban functions and the relocation of people and industries. They are the areas with the most active flow of urban and rural elements and the most intense spatial transformation. The outer suburbs have gradually transformed from rural areas into a buffer zone between urban and rural areas. The continuous reduction in rural areas reflects the weakening of traditional rural regional functions and the accelerated advancement of urban–rural integration. The population gradient is characterized by central concentration and peripheral expansion, the industrial gradient extends outwards along transportation corridors, and the land gradient reflects the expansion of developed land. The coordinated changes across three dimensions suggest a transition from expansion focused primarily on urban growth to a more spatially integrated pattern of regional development characterized by multiple urban centres and stronger intercity connectivity [39].
Table 3.
Changes in the spatial structure of the urban–rural gradient in the JMA.
4.3. Coupling Coordination Between the Ecosystem Service Value and Urban–Rural Gradient
Many existing studies of coupling coordination across the Yellow River Basin report low-to-moderate coordination levels within metropolitan areas. However, most analyses are conducted at the county or municipal administrative level and therefore lack a fine-scale, gradient-specific interpretation. Consistent with basin-scale findings, our results indicate that rapid metropolitan expansion may generate phased imbalances between human activities and ecosystem services. However, in contrast to previous research based on administrative units, this study reveals that declining coordination is not evenly distributed across the territory but is concentrated along urban–rural transition belts.
The overall slight decline in the degree of coupling coordination indicates that during rapid urbanization (Table 4), there is a phased imbalance between the expansion of urban areas and the protection of ecosystems. The spillover of urban functions and the expansion of developed land have contracted the ecological spaces in the inner and outer suburbs [40]. As a result, some ecological land has been transformed, leading to a decrease in the degree of correspondence between ecosystem service supply and urbanization. This imbalance is not irreversible but is a typical feature of the development and transformation period of metropolitan areas: while regions pursue economic growth and spatial expansion, the synchronization and coordination of ecological protection still need to be strengthened. Spatial differentiation among high-coordination zones, medium-coordination zones, and low-coordination zones also provides a basis for differentiated territorial space management: ecologically important areas should be protected from further development, urban cores should promote compact and efficient land use [41], and inner and outer suburbs should balance development and ecological conservation to better integrate urban growth and ecosystem services.
Table 4.
Temporal changes in the degree of coupling between the urban–rural gradient and ESV.
4.4. Mechanisms Driving Ecosystem Service Value
The geographic detector results indicate that land-use change, population density, and the elevation digital elevation model (DEM) were the core factors driving the spatial differentiation of ESV in 2000 and 2024. Natural and socioeconomic factors jointly shaped the spatial distribution of ESV and exhibited prominent nonlinear enhancement effects through their interactions, reflecting the dynamic mechanisms underlying regional ecosystem services. According to the single-factor detection results presented in Table 5, LULC consistently had the highest explanatory power for ESV differentiation in both 2000 and 2024. The conversion of forestland and water bodies to built-up land directly triggers ESV loss, while ecological restoration and optimized land-use structure contribute to ESV improvement. Meanwhile, the relative importance of other driving factors experienced notable temporal shifts. In 2000, top-ranked drivers also included DEM and POP; by 2024, population density remained a core socioeconomic driver, whereas SLOP rose substantially in explanatory power and ranking, indicating the growing influence of topographic constraints on ESV spatial heterogeneity during the urban–rural transition. Population density reflects the intensity of human activities and indirectly affects an ecosystem through development and construction, resource consumption, and other means [42]. Normalized difference vegetation index (NDVI) is an indicator of vegetation coverage and condition and is closely associated with ecosystem functioning. It exhibits a threshold effect, whereby increases in vegetation cover beyond a certain level area associated with greater increases in ESV.
Table 5.
Ranking of core drivers of spatial differentiation in 2000 and 2024.
Consistent with the extensive literature on ESV drivers in the Yellow River Basin, land-use change and vegetation status are universally recognized as core determinants of ESV spatial variation, and nonlinear enhancement among multiple factors is frequently observed in geographic-detector outputs. Where this study extends existing knowledge is that we link these detected driving mechanisms explicitly to multidimensional urban–rural gradient zonation.
4.5. Research Contribution
Based on the existing research, there are still three key knowledge gaps in the current field: First, the research on the value of ecosystem services mostly focuses on overall measurement and driving analysis, and the ecological service response laws of heterogeneous human activities under the continuous gradient of urban and rural areas are insufficiently revealed. Second, the spatial gradient of urbanization mostly relies on single-dimensional index measurement, making it difficult to fully match the multi-dimensional and compound characteristics of urban–rural transformation. Thirdly, the coupling research between urbanization and ESV mostly focuses on one-way influence, and the analysis of the nonlinear interaction mechanism of driving factors is insufficient. Against these research gaps, this study seeks to address the above-mentioned deficiencies in model construction, fine-scale analysis, and mechanism exploration. The multi-dimensional urban–rural gradient identification model constructed in this study overcomes the methodological limitations of single-dimensional quantities. The raster-scale coupling analysis refines the gradient response rules of ESV, and the factor interaction detection deepens the analysis of the human–land coupling mechanism. This analytical framework can be transferred to other river basin metropolitan areas.
5. Conclusions
This study constructed a multidimensional urban–rural gradient index for the JMA from population, industry, and land dimensions. By combining the equivalent-factor method for ecosystem service value (ESV) evaluation, the coupling-coordination model, and the geographic detector, we systematically analysed the spatiotemporal evolution of ESV, urban–rural gradient characteristics, their coupling relationship, and underlying driving mechanisms. The main conclusions are summarized as follows.
First, total ESV in the JMA exhibited a slight upward trend from 2000 to 2024, accompanied by pronounced spatial heterogeneity. High-ESV areas were concentrated in the southern mountainous region and along the Yellow River, whereas low ESV was mainly distributed in the northern plains and urban built-up zones. Gains in ESV from forestland and water bodies offset the ecological losses caused by the shrinkage of cropland and grassland. Forestland and water bodies act as the critical ecological foundation that guarantees regional ecosystem service capacity. Moreover, ESV exhibited clear gradient-dependent spatial characteristics: high-value ecological patches were predominantly distributed in rural and outer-suburban areas, whereas low-ESV regions corresponded primarily to urban cores and rapidly transforming inner suburban areas.
Second, the multidimensional urban–rural gradient of the JMA has formed a stable spatial pattern of “one leading core, two expanding axes, and multiple supporting nodes”. Inner-suburban zones have experienced the fastest growth in proportion and have become the dominant area for urban–rural transition. Rural territories have continuously contracted, and urban areas show dual characteristics of polarization and sprawl along traffic corridors. Metropolitan urbanization has therefore evolved from simple single-core agglomeration toward a more complex development pattern characterized by core polarization, peripheral expansion, and rapid restructuring of inner suburbs. Population, industrial, and land-use urbanization followed asynchronous evolutionary trajectories, while inner-suburban areas became the most active zones for cross-boundary flows of urban–rural factors and land-use conversion.
Third, the coupling-coordination degree between ESV and the multidimensional urban–rural gradient shows a “high-periphery, low-middle” spatial pattern and declines slightly over the study period. Notably, the decline in coupling-coordination is not triggered by the reduction of total regional ESV but originates from serious spatial mismatch. Ecological land degradation mainly occurs in inner-suburban transition belts, while newly increased ecosystem services are concentrated in southern mountainous rural areas and cannot compensate for suburban ecological pressure. Geographic-detector results indicate that land-use change, population density and NDVI were the core drivers of ESV spatial differentiation. Each factor exerted nonlinear effects characterized by distinct thresholds. The explanatory power of pairwise factor interactions is significantly higher than that of any individual factor, demonstrating that regional ESV patterns are jointly governed by natural background and human socioeconomic disturbances.
These findings have important practical implications for territorial spatial governance in metropolitan areas of the lower Yellow River. Decision-makers should fully recognize the spatial mismatch between ecological service supply and urban–rural transformation. For urban core areas, compact and intensive land-use patterns should be promoted to reduce the occupation of ecological space. Inner-suburban zones, as hotspots of human–ecosystem conflict, need to balance urban construction demands and ecological conservation and implement strict protection for key ecological patches. Rural and outer-suburban ecological zones, particularly the southern mountainous areas and the Yellow River wetlands, should maintain their ecological functions and serve as the stable supply base of regional ecosystem services. Integrated regulatory strategies combining land-use optimization, vegetation restoration and ecological engineering are preferred over isolated single-measure interventions.
Nevertheless, several limitations of this study should be acknowledged. Owing to limitations in historical data availability, the industrial-gradient layer for 2000 and 2005 was substituted with 2010 data. Long-term land-use datasets may exhibit temporal inconsistencies arising from remote-sensing interpretation methods. When land-use type is adopted both for ESV calculation and geographic-detector detection, inherent statistical correlation cannot be entirely eliminated. In addition, the weight assignment for constructing the multidimensional urban–rural gradient retains a degree of subjectivity. Future research should compile more consistent long-term multi-source datasets, test alternative weighting schemes, and adopt multi-model comparative analysis to improve result robustness. The analytical framework developed in this study can provide a useful reference for human–land coupling research in other river-basin metropolitan regions.
Author Contributions
Conceptualization, Y.Z. and Y.L.; Methodology, Y.Z. and C.F.; Data curation, Y.Z., Y.L. and H.Y.; Supervision, H.Y., C.F. and Y.L.; Writing—original draft, Y.Z.; Writing—review and editing, H.Y., C.F. and Y.L.; Project administration, Y.L.; Funding acquisition, Y.L. All authors have read and agreed to the published version of the manuscript.
Funding
This research was supported by the Shandong Provincial Natural Science Foundation (No. ZR2023QD178); the Youth Innovation Team Science and Technology Support Project in Colleges and Universities of Shandong Province (No. 2023KJ298); and the National Natural Science Foundation of China (No. 42301240).
Institutional Review Board Statement
Not applicable.
Informed Consent Statement
Not applicable.
Data Availability Statement
The data presented in this study are available on request from the corresponding author due to privacy reason.
Conflicts of Interest
The authors declare no conflicts of interest.
Abbreviations
The following abbreviations are used in this manuscript:
| JMA | Jinan Metropolitan Area |
| ESV | Ecosystem service value |
| ES | Ecosystem service |
| SPSS | Statistical Product and Service Solutions |
| NDVI | Normalized difference vegetation index |
| POI | Point of interest |
References
- Costanza, R.; d’Arge, R.; De Groot, R.; Farber, S.; Grasso, M.; Hannon, B.; Limburg, K.; Naeem, S.; O’neill, R.V.; Paruelo, J. The value of the world’s ecosystem services and natural capital. Nature 1997, 387, 253–260. [Google Scholar] [CrossRef] [Scilit]
- Li, L.; Wang, X.-Y.; Luo, L.; Ji, X.-Y.; Zhao, Y.; Zhao, Y.-C.; Nabil, B. A systematic review on the methods of ecosystem services value assessment. Chin. J. Ecol. 2018, 37, 1233. [Google Scholar] [CrossRef]
- Costanza, R.; de Groot, R.; Braat, L.; Kubiszewski, I.; Fioramonti, L.; Sutton, P.; Farber, S.; Grasso, M. Twenty years of ecosystem services: How far have we come and how far do we still need to go? Ecosyst. Serv. 2017, 28, 1–16. [Google Scholar] [CrossRef] [Scilit]
- Xie, G.D.; Zhang, C.; Zhang, C.; Xiao, Y.; Lu, C. The value of ecosystem services in China. Resour. Sci. 2015, 37, 1740–1746. [Google Scholar]
- Wang, L.; Zhang, Z.; Li, G.; Ma, F.; Chen, L. Landscape pattern change in Beijing fringe area and its impact on the ecosystem services: A case study in Niulanshan-Mapo town. Acta Ecol. Sin. 2018, 38, 750–759. [Google Scholar] [CrossRef] [Scilit]
- Yang, X.-F.; Yu, S.-K.; Luo, Z.-J.; Luo, S.-K.; Nie, X.-R. Interaction and Zoning Management of Landscape Ecological Risk and Ecosystem Services around Poyang Lake from Multi-scale Perspective. Environ. Sci. 2025, 46, 7918–7934. [Google Scholar] [CrossRef] [Scilit] [PubMed]
- Veerkamp, C.J.; Dunford, R.W.; Harrison, P.A.; Mandryk, M.; Priess, J.A.; Schipper, A.M.; Stehfest, E.; Alkemade, R. Future projections of biodiversity and ecosystem services in Europe with two integrated assessment models. Reg. Environ. Change 2020, 20, 103. [Google Scholar] [CrossRef] [Scilit]
- Romagosa, C.M.; Morse, W.C.; Lockaby, B.G. Emerging issues along urban–rural interfaces: An introduction to the special issue. Urban Ecosyst. 2013, 16, 1–2. [Google Scholar] [CrossRef] [Scilit]
- McDonnell, M.J.; Pickett, S.T. Ecosystem structure and function along urban-rural gradients: An unexploited opportunity for ecology. Ecology 1990, 71, 1232–1237. [Google Scholar] [CrossRef] [Scilit]
- Li, P.; Zuo, D.; Xu, Z.; Gao, X. Land use/cover and landscape patterns based on terrain in the Yarlung Tsangpo River basin. J. Mt. Sci. 2022, 40, 136–150. [Google Scholar] [CrossRef]
- Liu, M.; Du, G.; Yu, F.; Kuang, W. Remote Sensing Monitoring and Analysis of Urban-Rural Gradient Construction Land and Impervious Surface in Harbin. Remote Sens. Technol. Appl. 2020, 35, 1206–1217. [Google Scholar] [CrossRef]
- Su, S.; Xiao, R.; Jiang, Z.; Zhang, Y. Characterizing landscape pattern and ecosystem service value changes for urbanization impacts at an eco-regional scale. Appl. Geogr. 2012, 34, 295–305. [Google Scholar] [CrossRef] [Scilit]
- Du, L.; Liu, H.; Xu, J.; Zhang, F.; Li, J. Review of bidirectional effects of urbanization and ecosystem services. Ecol. Sci. 2017, 36, 233–240. [Google Scholar] [CrossRef]
- Gao, J.; Zuo, Y.; Lu, Y.; He, K. Health assessment of secondary forests of Betula platyphylla based on structural Baoku River Basin in Datong County. Acta Ecol. Sin. 2025, 45, 5941–5954. [Google Scholar] [CrossRef]
- Yu, H.; He, Z.; Gu, X.; Xu, M.; Tan, H.; Yang, S.; Yang, Q. Impulse Response Mechanism of Agricultural Drought to Local Climate Factor at Different Time Scales in Karst Region. J. Soil Water Conserv. 2024, 38, 296–304. [Google Scholar] [CrossRef]
- Fang, C.; Wang, J. A theoretical analysis of interactive coercing effects between urbanization and eco-environment. Chin. Geogr. Sci. 2013, 23, 147–162. [Google Scholar] [CrossRef] [Scilit]
- Xie, G.D.; Lu, C.X.; Leng, Y.F.; Zheng, D.; Li, S.C. Ecological assets valuation of the Tibetan Plateau. J. Nat. Resour. 2003, 18, 189–196. [Google Scholar]
- Vizzari, M. Spatio-temporal analysis using urban-rural gradient modelling and landscape metrics. In Proceedings of the International Conference on Computational Science and Its Applications, Santander, Spain, 20–23 June 2011; pp. 103–118. [Google Scholar]
- Pei, X.Y.; Zhang, J.Y.; Qiu, D.E. Analysis of ecosystem service value response and driving factors along the multidimensional urban-rural gradient in the Chengdu-Chongqing Economic Circle. China Environ. Sci. 2026, 46, 329–341. [Google Scholar] [CrossRef]
- Li, R.; Xu, Q.; Yu, J.; Chen, L.; Peng, Y. Multiscale assessment of the spatiotemporal coupling relationship between urbanization and ecosystem service value along an urban–rural gradient: A case study of the Yangtze River Delta urban agglomeration, China. Ecol. Indic. 2024, 160, 111864. [Google Scholar] [CrossRef] [Scilit]
- Zhang, Y.J.; Chi, H.J.; Lin, S. Centralization or decentrallization? The evolution trends and influential factors of population density distribution of Chinese cities at prefectrue level or above from 2000 to 2020. Hum. Geogr. 2023, 38, 137–144. [Google Scholar] [CrossRef]
- Xue, B.; Li, J.; Xiao, X.; Xie, X.; Lu, C.; Ren, W.; Jiang, L. Overview of man-land relationship research based on POI data: Theory, method and application. Geogr. Geo-Inf. Sci. 2019, 35, 51–60. [Google Scholar] [CrossRef]
- Lin, P.; Yu, B.; Wu, J.M. Study on the Spatio-temporal Correlation between Multidimensional Urbanization and the Evolution of Rural Territorial Functions: A Case Study of Jianghan Plain. J. Ecol. Rural Environ. 2024, 40, 345–362. [Google Scholar] [CrossRef]
- Tian, H.; Qin, Y.; Li, Z.; Han, C.; Ding, Q.; Li, Q.; Ren, Q.; Dai, W.; Qin, H.; Chen, H.; et al. Changes of ecosystem services in Beijing and its multi-scale response to urbanization. Acta Ecol. Sin. 2025, 45, 2209–2224. [Google Scholar] [CrossRef]
- Wang, Y.; Guan, Z.; Zhang, Q. Exploring the magnitude threshold of urban PM2.5 concentration: Evidence from prefecture-level cities in China. Environ. Dev. Sustain. 2023, 26, 14095–14112. [Google Scholar] [CrossRef] [Scilit] [PubMed]
- Ernstson, H.; van der Leeuw, S.E.; Redman, C.L.; Meffert, D.J.; Davis, G.; Alfsen, C.; Elmqvist, T. Urban Transitions: On Urban Resilience and Human-Dominated Ecosystems. Ambio 2010, 39, 531–545. [Google Scholar] [CrossRef] [Scilit] [PubMed]
- Zhao, Y.; Hou, P.; Jiang, J.; Zhai, J.; Chen, Y.; Wang, Y.; Bai, J.; Zhang, B.; Xu, H. Coordination study on ecological and economic coupling of the Yellow River Basin. Int. J. Environ. Res. Public Health 2021, 18, 10664. [Google Scholar] [CrossRef] [Scilit] [PubMed]
- Wei, X.; Xin, S.; Zhang, Y.; Long, Y.; Zhang, X. Spatial difference of ecological services and its influencing factors under different scales: Taking the Nanchang Urban Agglomeration as an example. Acta Ecol. Sin. 2023, 43, 7585–7597. [Google Scholar] [CrossRef]
- Wang, S.; Ma, H.; Zhao, Y. Exploring the relationship between urbanization and the eco-environment—A case study of Beijing–Tianjin–Hebei region. Ecol. Indic. 2014, 45, 171–183. [Google Scholar] [CrossRef] [Scilit]
- Du, X.; Meng, Y.; Fang, C.; Li, C. Spatio-temporal characteristics of coupling coordination development between urbanization and eco-environment in Shandong Peninsula urban agglomeration. Acta Ecol. Sin. 2020, 40, 5546–5559. [Google Scholar] [CrossRef]
- Yang, C.; Zeng, W.; Yang, X. Coupling coordination evaluation and sustainable development pattern of geo-ecological environment and urbanization in Chongqing municipality, China. Sustain. Cities Soc. 2020, 61, 102271. [Google Scholar] [CrossRef] [Scilit]
- Wang, G.; Peng, W. Quantifying spatiotemporal dynamics of vegetation and its differentiation mechanism based on geographical detector. Environ. Sci. Pollut. Res. 2022, 29, 32016–32031. [Google Scholar] [CrossRef] [Scilit] [PubMed]
- Yang, M.; Wang, Z.; Zhang, Z.; Chen, P.; Zhao, D.; Cheng, E.; Wang, C.; Yan, Y. Pathways for ecological restoration of territorial space based on ecosystem integrity: A case study of approach to protecting and restoring mountains, rivers, forests, farmlands, lakes, and grasslands in Beijing, China. Ecol. Front. 2024, 44, 1214–1223. [Google Scholar] [CrossRef] [Scilit]
- Gómez-Baggethun, E.; De Groot, R. Natural capital and ecosystem services: The ecological foundation of human society. Ecosyst. Serv. 2010, 30, 105–121. [Google Scholar] [CrossRef] [Scilit]
- Yin, Z.; Feng, Q.; Zhu, R.; Wang, L.; Chen, Z.; Fang, C.; Lu, R. Analysis and prediction of the impact of land use/cover change on ecosystem services value in Gansu province, China. Ecol. Indic. 2023, 154, 110868. [Google Scholar] [CrossRef] [Scilit]
- Aerts, R.; Honnay, O. Forest restoration, biodiversity and ecosystem functioning. BMC Ecol. 2011, 11, 29. [Google Scholar] [CrossRef] [Scilit] [PubMed]
- Wang, H.; Qin, F.; Zhu, J.; Zhang, C. The effects of land use structure and landscape pattern change on ecosystem service values. Acta Ecol. Sin. 2017, 37, 1286–1296. [Google Scholar] [CrossRef] [Scilit]
- Garmendia, M.; de Ureña, J.M.; Ribalaygua, C.; Leal, J.; Coronado, J.M. Urban residential development in isolated small cities that are partially integrated in metropolitan areas by high speed train. Eur. Urban Reg. Stud. 2008, 15, 249–264. [Google Scholar] [CrossRef] [Scilit]
- Huang, L.; Wang, J.; Cheng, H. Spatiotemporal changes in ecological network resilience in the Shandong Peninsula urban agglomeration. J. Clean. Prod. 2022, 339, 130681. [Google Scholar] [CrossRef] [Scilit]
- Wang, L.; Kundu, R.; Chen, X. Building for what and whom? New town development as planned suburbanization in China and India. Res. Urban Sociol. 2010, 10, 319–345. [Google Scholar] [CrossRef] [Scilit]
- Gao, J.; Wang, Y.; Zou, C.; Xu, D.; Lin, N.; Wang, L.; Zhang, K. China’s ecological conservation redline: A solution for future nature conservation. Ambio 2020, 49, 1519–1529. [Google Scholar] [CrossRef] [Scilit] [PubMed]
- Meyer, W.B.; Turner, B.L. Human population growth and global land-use/cover change. Annu. Rev. Ecol. Syst. 1992, 23, 39–61. [Google Scholar] [CrossRef]

Disclaimer/Publisher’s Note: The statements, opinions and data contained in all publications are solely those of the individual author(s) and contributor(s) and not of MDPI and/or the editor(s). MDPI and/or the editor(s) disclaim responsibility for any injury to people or property resulting from any ideas, methods, instructions or products referred to in the content. |
© 2026 by the authors. Licensee MDPI, Basel, Switzerland. This article is an open access article distributed under the terms and conditions of the Creative Commons Attribution (CC BY) license.