


Abstract
Understanding land-use carbon emissions (LUCE) requires accounting for both spatial heterogeneity and intercity linkages, yet most studies treat cities as isolated units, overlooking network-level interactions and their implications for regional ecological support and functional zoning. Using the Beijing–Tianjin–Hebei urban agglomeration as a case study, we estimated LUCE from 2005 to 2020 via the carbon emission coefficient method, constructed potential intercity association networks using a gravity model and social network analysis (SNA), and integrated ecological support capacity (ESC) with network structural roles to develop a two-dimensional carbon balance zoning framework. Results indicate that LUCE exhibited an overall increasing trend with a stable south-high and north-low spatial pattern. The association network remained connected and exhibited a persistent core–periphery structure, with Beijing and Tianjin occupying core positions and the network showing increasing concentration after 2010. ESC displayed an opposite spatial gradient to LUCE, indicating stronger ecological support in northern and northwestern cities and weaker support in central-southern areas. Integrating ESC and network structural roles identified four carbon balance functional zones. The integrated framework provides a basis for differentiated low-carbon land-use management and collaborative carbon governance in urban agglomerations.
1. Introduction
Land-use change alters land-cover patterns, human activity spaces, and ecosystem processes, thereby reshaping regional carbon sources and sinks and affecting territorial spatial optimization and sustainable development [1,2]. Land-use carbon emissions (LUCE) reflect both anthropogenic activities—particularly built-up land expansion, industrial agglomeration, and population concentration—and changes in carbon sequestration by natural ecosystems [3,4]. Unlike the relatively well-defined emission pathways of the energy sector, LUCE are embedded in spatial restructuring processes associated with urban expansion, industrial relocation, and socioeconomic interactions, resulting in pronounced spatial heterogeneity and intercity linkages [5,6]. Under China’s carbon-peaking and carbon-neutrality goals, understanding such intercity linkages is essential for coordinating emission reduction, ecological conservation, and low-carbon territorial governance.
Previous studies have developed a relatively mature framework for LUCE accounting, ecological assessment, and spatial regulation. The carbon emission coefficient method is widely used because of its transparent procedure, accessible data requirements, and suitability for multitemporal regional comparisons [7,8,9]. Ecological indicators such as the ecological support capacity (ESC) extend this analysis by measuring the ratio of cities’ carbon sequestration contributions to their carbon emission shares [10,11]. Spatial autocorrelation and spatial econometric models have further identified emission clustering, neighborhood effects, and spatial spillovers [12,13,14]. Carbon balance zoning frameworks integrating emission characteristics and ESC have also provided a basis for differentiated regional management [9,11]. However, existing studies either analyze spatial units individually or rely on predefined adjacency-based spatial-weight matrices, limiting their ability to characterize structured associations among non-adjacent cities arising from economic linkages, industrial specialization, and factor mobility, as well as the networked characteristics of LUCE.
Economic integration, industrial relocation, and infrastructure connectivity have increasingly embedded cities within regional association networks [15,16]. Accordingly, gravity models have been used to construct potential intercity association networks by integrating emissions, economic scale, population size, development disparities, and geographical distance [17,18,19]. Social network analysis (SNA) is then applied to examine network structures, node positions, centrality, block roles, and temporal evolution [10,20]. This combination can therefore reveal associations that extend beyond geographical adjacency. This combined approach is particularly important for urban agglomerations, where carbon-related interactions are shaped not only by geographical proximity but also by industrial relocation, functional specialization, and regional integration. Nevertheless, three gaps remain: long-term analyses of LUCE association networks at the urban agglomeration scale are limited; the relationship between ESC and network roles remains insufficiently examined; and network findings have not been adequately translated into differentiated policies for emission reduction, ecological compensation, and land-use regulation.
The Beijing-Tianjin-Hebei urban agglomeration provides a representative setting for this analysis. As a major economic and population agglomeration in northern China, it has strong industrial and transport linkages but substantial disparities in economic development, land-use structure, and ecological conditions. Beijing and Tianjin are characterized by high concentrations of population and economic activity and extensive built-up land, whereas Chengde and Zhangjiakou perform important ecological conservation functions. Previous studies have also identified pronounced spatial differences in carbon sources and sinks across the region [21,22]. These contrasts, together with the Beijing-Tianjin-Hebei coordinated development strategy, make the region suitable for examining the integration of ESC and network structural roles and for informing cross-jurisdictional carbon governance.
Specifically, this study aims to: (1) quantify the spatiotemporal patterns of LUCE and assess the ESC of the 13 cities from 2005 to 2020; (2) construct a gravity-model-based potential intercity association network and examine its overall structure, city positions, and evolution of block roles; and (3) integrate ESC and block roles to delineate carbon balance functional zones, identify spatial mismatches between the two dimensions, and propose differentiated low-carbon land-use governance strategies. The remainder of this paper is organized as follows. Section 2 describes the study area, data sources, and methods. Section 3 presents the LUCE patterns, network characteristics, and carbon balance zoning results. Section 4 discusses the implications, theoretical contributions, and limitations of the study. Section 5 summarizes the main findings.
2. Materials and Methods
2.1. Study Area Overview
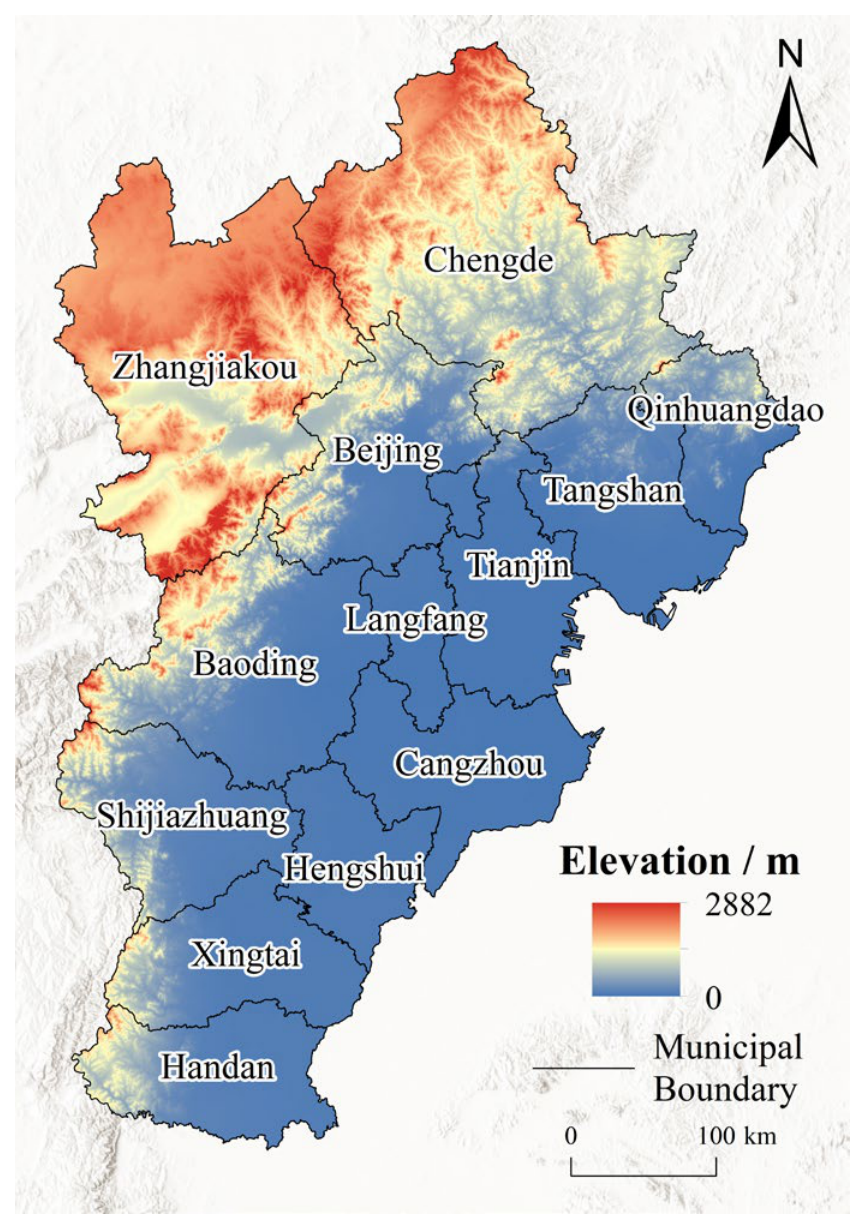
The Beijing–Tianjin–Hebei urban agglomeration (113°27′–119°50′ E, 36°03′–42°40′ N) comprises Beijing, Tianjin, and 11 prefecture-level cities in Hebei Province, covering approximately 218,000 km2 (Figure 1) [21,23]. Mountainous and hilly terrain dominates the north and west, whereas the central and southern areas lie on the North China Plain. These topographic differences produce marked spatial variation in land use and ecological functions [24]. The region is highly urbanized and industrialized, with economic activity concentrated around Beijing and Tianjin, but substantial disparities remain in population, economic development, built-up land expansion, and ecological endowment [25]. The combination of intensive development, ecological constraints, and strong intercity linkages makes the region suitable for examining LUCE patterns and their potential spatial associations.
Figure 1.
Overview of the study area.
2.2. Data Sources and Descriptions
This study used land-use and socioeconomic data for 2005–2020. Land-use data with a spatial resolution of 30 m were obtained from the Resource and Environmental Science and Data Center of the Chinese Academy of Sciences (https://www.resdc.cn/ (accessed on 15 September 2025). Socioeconomic data, including energy consumption, population, and economic indicators, were collected from the Beijing Statistical Yearbook, Tianjin Statistical Yearbook, Hebei Statistical Yearbook, and China Energy Statistical Yearbook. Because the land-use dataset is available at five-year intervals and the latest available dataset at the time of this study only covered 2020, this year was selected as the final study year to ensure data consistency and comparability.
2.3. Research Methods
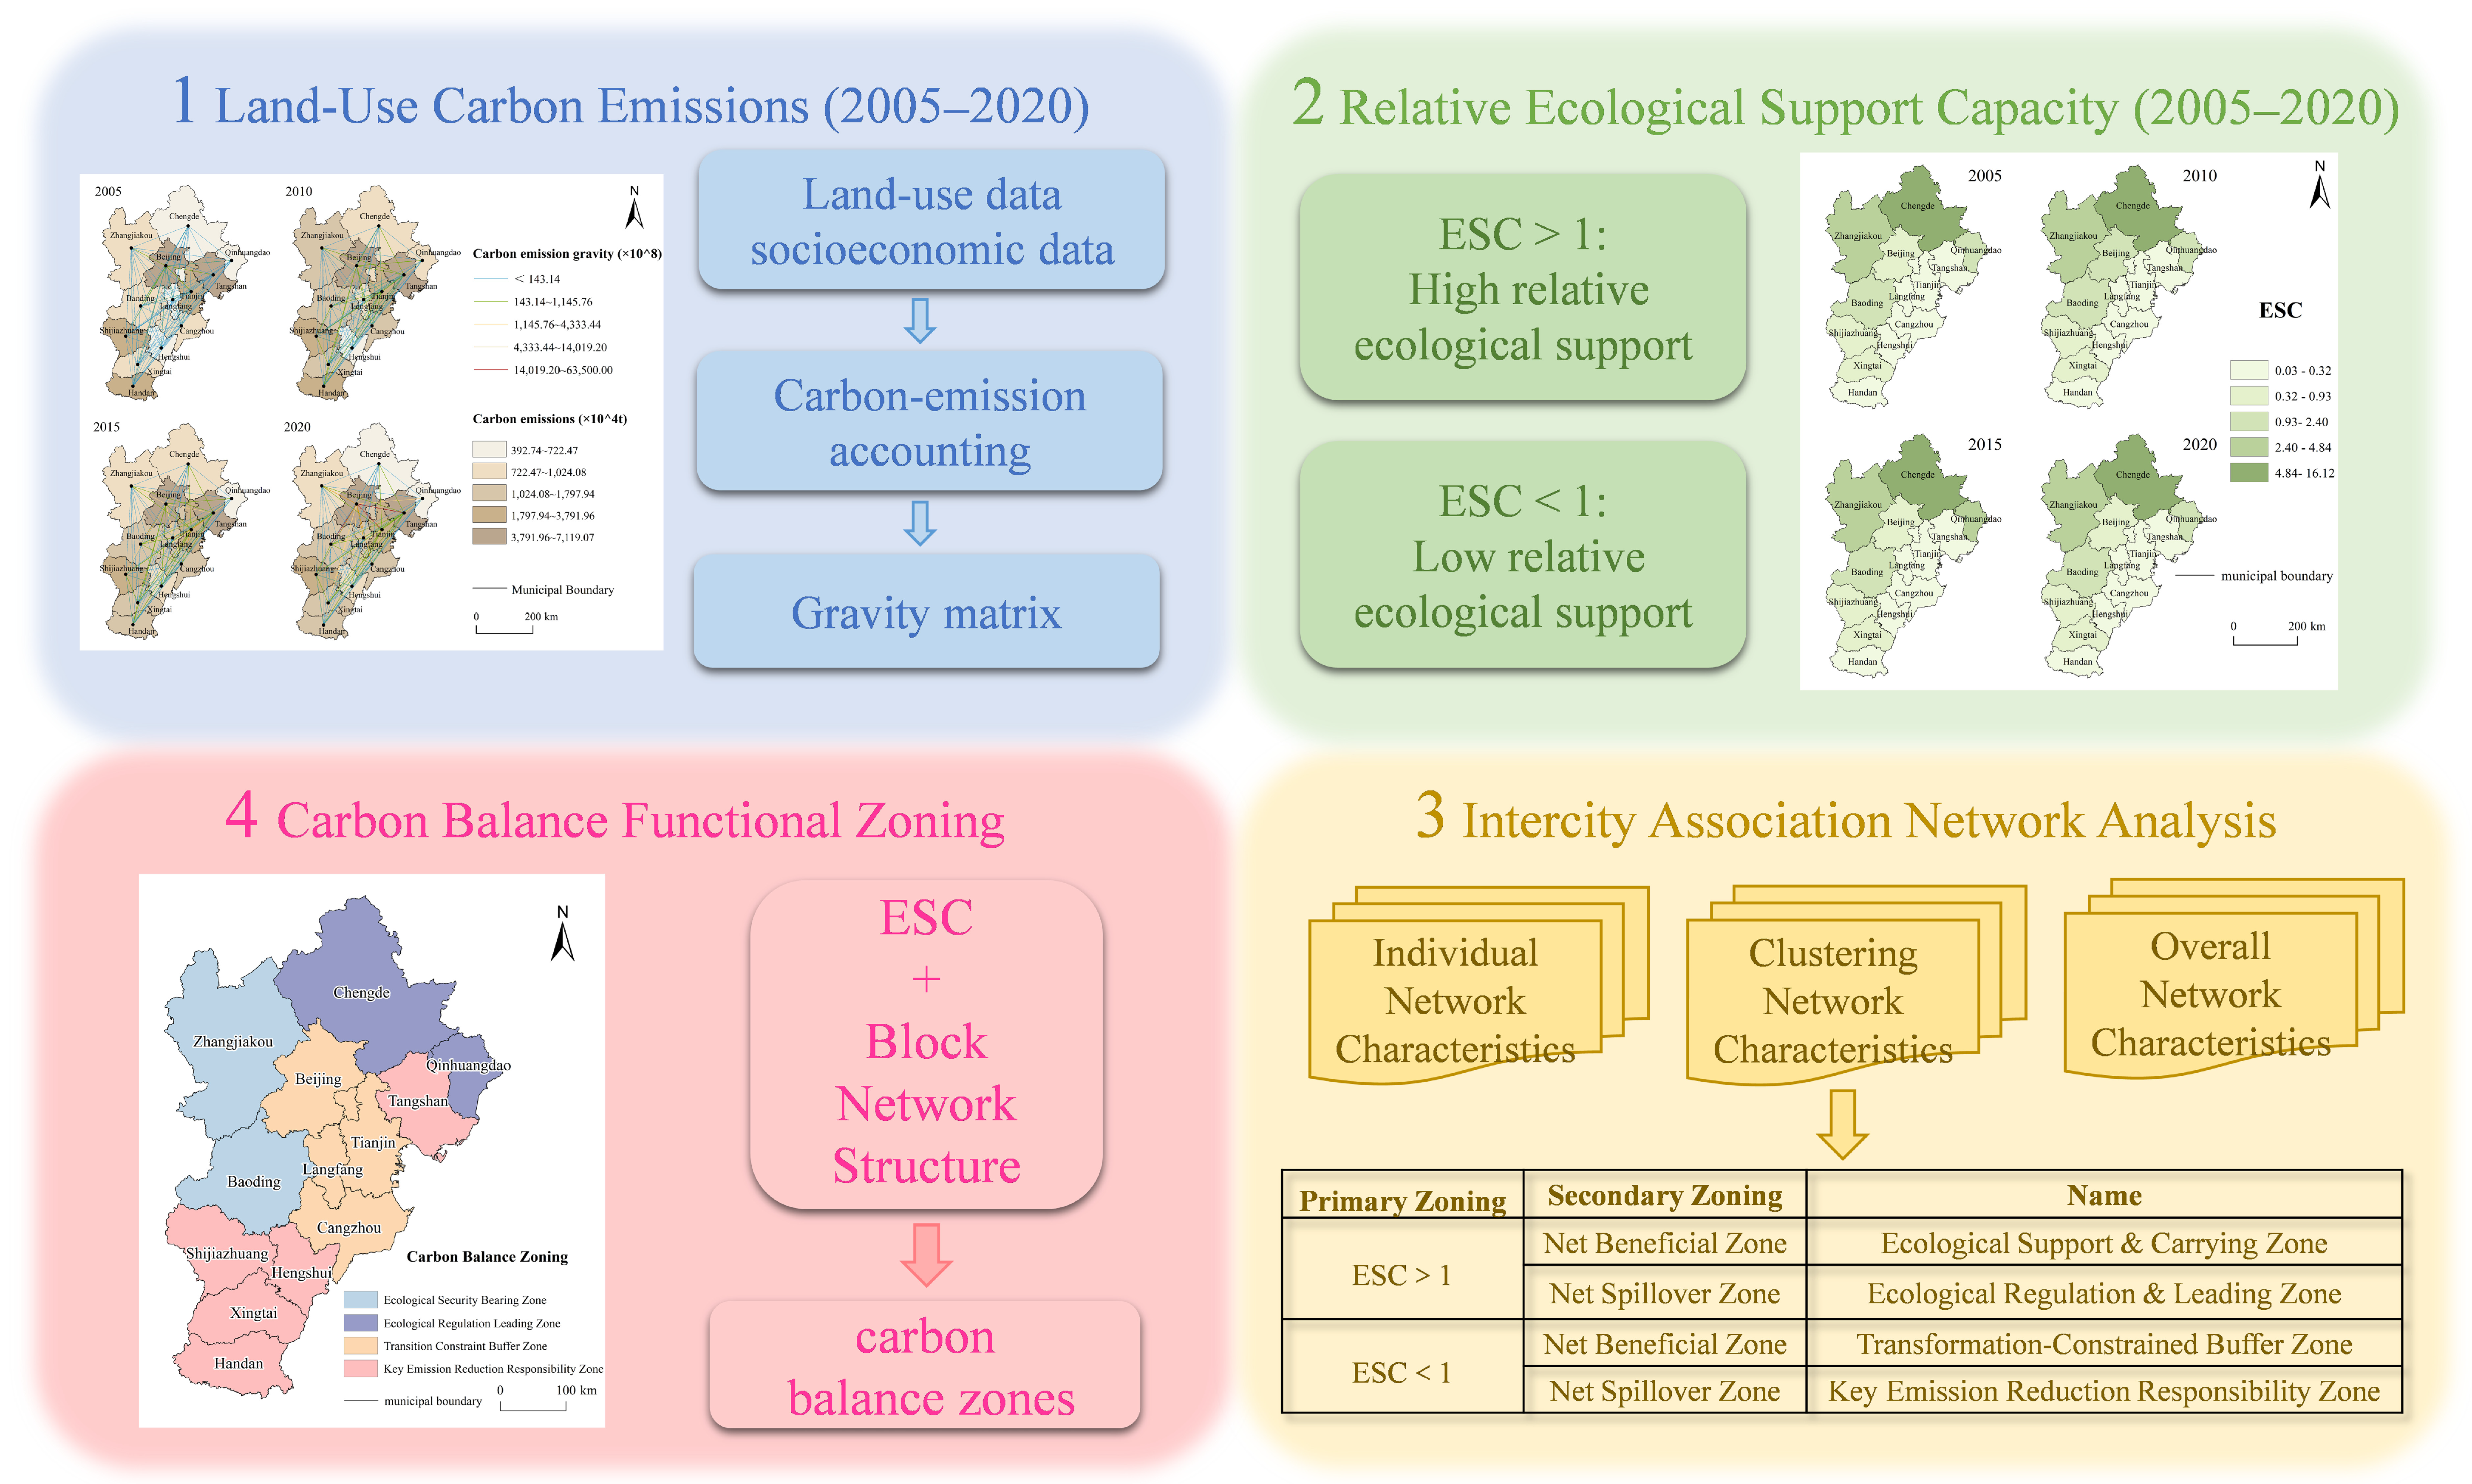
Figure 2 summarizes the analytical procedure: LUCE estimation, ESC assessment, construction of a gravity-model-based potential intercity association network, SNA of its overall network characteristics, node-level positions, and block structures, followed by two-dimensional carbon balance zoning.
Figure 2.
Analytical framework for assessing land-use carbon balance based on ecological support capacity (ESC) and intercity association network.
2.3.1. Estimation of Land-Use Carbon Emissions
The carbon emission coefficient method was used to estimate LUCE by multiplying the area of each land-use type by its corresponding coefficient. Positive coefficients represent emissions, whereas negative coefficients represent carbon sequestration. Total LUCE comprised direct emissions or sequestration from non-built-up land and indirect emissions associated with built-up land [9].
- (1)
- Direct carbon emission estimation
Direct carbon emissions and sequestration were estimated for cropland, forestland, grassland, water bodies, and unused land. Coefficients were selected from previous studies [10,26] and adjusted to the land-use classification of the Beijing–Tianjin–Hebei region (Table 1). Direct LUCE was calculated as follows:
where represents the total direct carbon emissions of city x, while , , and denote the carbon emissions, area, and carbon emission coefficient of land use type i, respectively.
Table 1.
Carbon emission coefficients of land-use types.
- (2)
- Indirect carbon emission estimation
Built-up land supports industrial production, transportation, and residential activities; therefore, the carbon emissions associated with it were estimated indirectly based on energy consumption. Following previous research [25,26] indirect emissions were calculated using GDP, energy intensity, and the carbon emission coefficient of standard coal.
where represents the indirect carbon emissions of city x; denotes the energy consumption of city x; represents the gross domestic product (GDP) of city x; represents the energy consumption per unit of GDP in city x; and denotes the carbon emission coefficient of standard coal, with a value of 0.6700 t c·tce−1.
2.3.2. Ecological Support Capacity
The ESC measures the ratio between a city’s share of regional carbon sequestration and its share of regional carbon emissions [11,28]. An ESC greater than 1 indicates higher-than-average ecological support capacity, whereas an ESC below 1 indicates lower-than-average ecological support capacity [10,11]. It should be noted that this threshold does not necessarily mean that local carbon sequestration exceeds or falls below local carbon emissions. The ESC was calculated as follows:
where and represent the total carbon sequestration and carbon emissions of city x, respectively.
2.3.3. Spatiotemporal Association Network Analysis of LUCE
- (1)
- Potential LUCE association matrix based on the gravity model
A modified gravity model was used to estimate the potential intercity association intensity related to LUCE. The model incorporated LUCE, GDP, year-end resident population, per capita GDP differences, and geographical distance as key variables [19,29,30]. The gravity model is expressed as follows:
where represents the potential association intensity of LUCE between cities i and j; and denote the land-use carbon emissions of cities i and j, respectively; and represent the GDP of cities i and j, respectively; and denote the year-end resident populations of cities i and j, respectively; and represent the per capita GDP of cities i and j, respectively; and denotes the geographical distance between cities i and j.
The cube-root transformation reduces scale disparities among emissions, GDP, and population while preserving their joint contribution. Squared geographical distance represents spatial impedance [10]. Because Equation (4) divides squared distance by the squared difference in per capita GDP, a larger per capita GDP difference increases the estimated association under this model specification. This adjustment can therefore be interpreted as reflecting potential economic complementarity and functional specialization rather than conventional economic resistance. The resulting gravity matrix was converted into a directed binary matrix using the mean value of each row as its threshold. Values above the row mean were coded as 1 and the remaining values as 0. A directed tie from city i to city j thus indicates that their estimated association exceeds the average association level of city i. These ties represent model-derived potential associations rather than actual carbon, energy, or embodied-carbon flows. Therefore, the network is used to characterize structural relationships among cities and identify potential directions for collaborative governance rather than physical carbon-transfer processes.
To further test the robustness of the network structure under alternative model specifications, two additional specifications were applied: (1) a pure geographic distance model, retaining only the term and excluding per capita GDP differences; and (2) an absolute economic distance model, replacing the squared per capita GDP difference with . The results remained generally consistent across the three specifications, with network connectivity maintained and the overall evolutionary patterns and major structural characteristics preserved. Detailed results are provided in Appendix A, Table A1.
- (2)
- Overall network characteristics
Network density, connectedness, hierarchy, and efficiency were used to characterize the overall network structure [31] and all four indicators range from 0 to 1 [10,32]. Network density measures the proportion of observed ties among all possible ties, with a larger value indicating denser intercity associations. Connectedness measures network reachability, with a value of 1 indicating that all cities are reachable through direct or indirect paths. Hierarchy captures asymmetry in reachability, with a larger value indicating greater differentiation between core and peripheral cities. Network efficiency reflects the redundancy of association paths; a larger value indicates fewer redundant paths, whereas a smaller value indicates more alternative paths and greater structural redundancy [10,30].
- (3)
- Individual network characteristics
Degree, closeness, and betweenness centrality were used to identify the relative positions of cities in the network [33]. Degree centrality measures the number of direct ties; in the binary network, it reflects the number rather than the intensity of associations. Closeness centrality measures how efficiently a city can reach other cities through the shortest paths. Betweenness centrality measures how frequently a city lies on the shortest paths between pairs of other cities and therefore indicates its potential bridging role. A betweenness centrality of zero does not imply an absence of LUCE or actual economic linkages; it only indicates that the city does not occupy an identified shortest-path bridging position.
- (4)
- Block Network Characteristics
Block model analysis was applied to the directed binary matrix to identify internal network differentiation. Network indicators and inter-block associations were calculated using the igraph and SNA packages within R software (Version 4.4.2; R Foundation for Statistical Computing, Vienna, Austria). Blocks were classified according to the relative numbers and directions of their internal and external ties. A primary beneficiary block receives more external ties from other blocks than it sends to them, whereas a net spillover block sends more external ties to other blocks than it receives. An agent block maintains bidirectional ties with multiple blocks and performs a cross-block linking role.
Based on these analyses, the overall network characteristics, individual centrality, and block structures were analyzed. A summary of the network indicators and their interpretations is provided in Appendix A Table A2.
2.3.4. Construction of Carbon Balance Zoning
Based on the ESC and block roles in the gravity-model-derived LUCE association network, a two-dimensional carbon balance zoning framework was developed for the Beijing–Tianjin–Hebei urban agglomeration. The two dimensions represent relative ecological support and network structural position, respectively.
Cities with an ESC greater than 1 were classified as having high relative ecological support capacity, whereas those with an ESC below 1 were classified as having low relative ecological support capacity. This threshold compares each city’s shares of regional carbon sequestration and emissions; it does not independently identify local net carbon-sink or net carbon-source status. Cities were also assigned to the primary beneficiary, net spillover, or agent blocks according to the direction of their model-derived ties.
The final zoning was based on the 2020 results, which represent the latest study year. Because no agent block was identified in 2020, the two ESC categories were cross-classified with the primary beneficiary and net spillover roles, producing four functional zones. These roles represent potential association directions rather than actual carbon-flow pathways. The framework provides a basis for differentiated emission-reduction responsibilities, ecological conservation priorities, and regional collaborative governance.
3. Results
3.1. Spatiotemporal Association of Land-Use Carbon Emissions
3.1.1. Spatiotemporal Pattern of LUCE and Intercity Association Characteristics
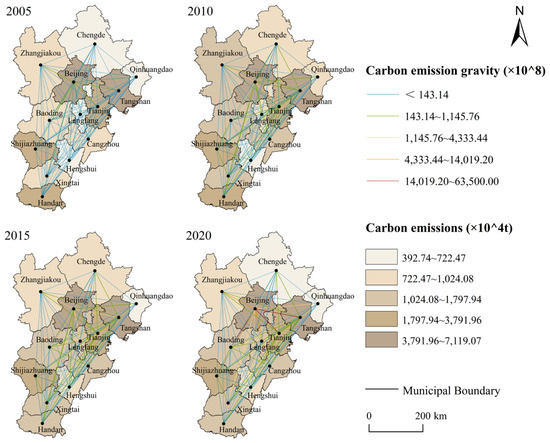
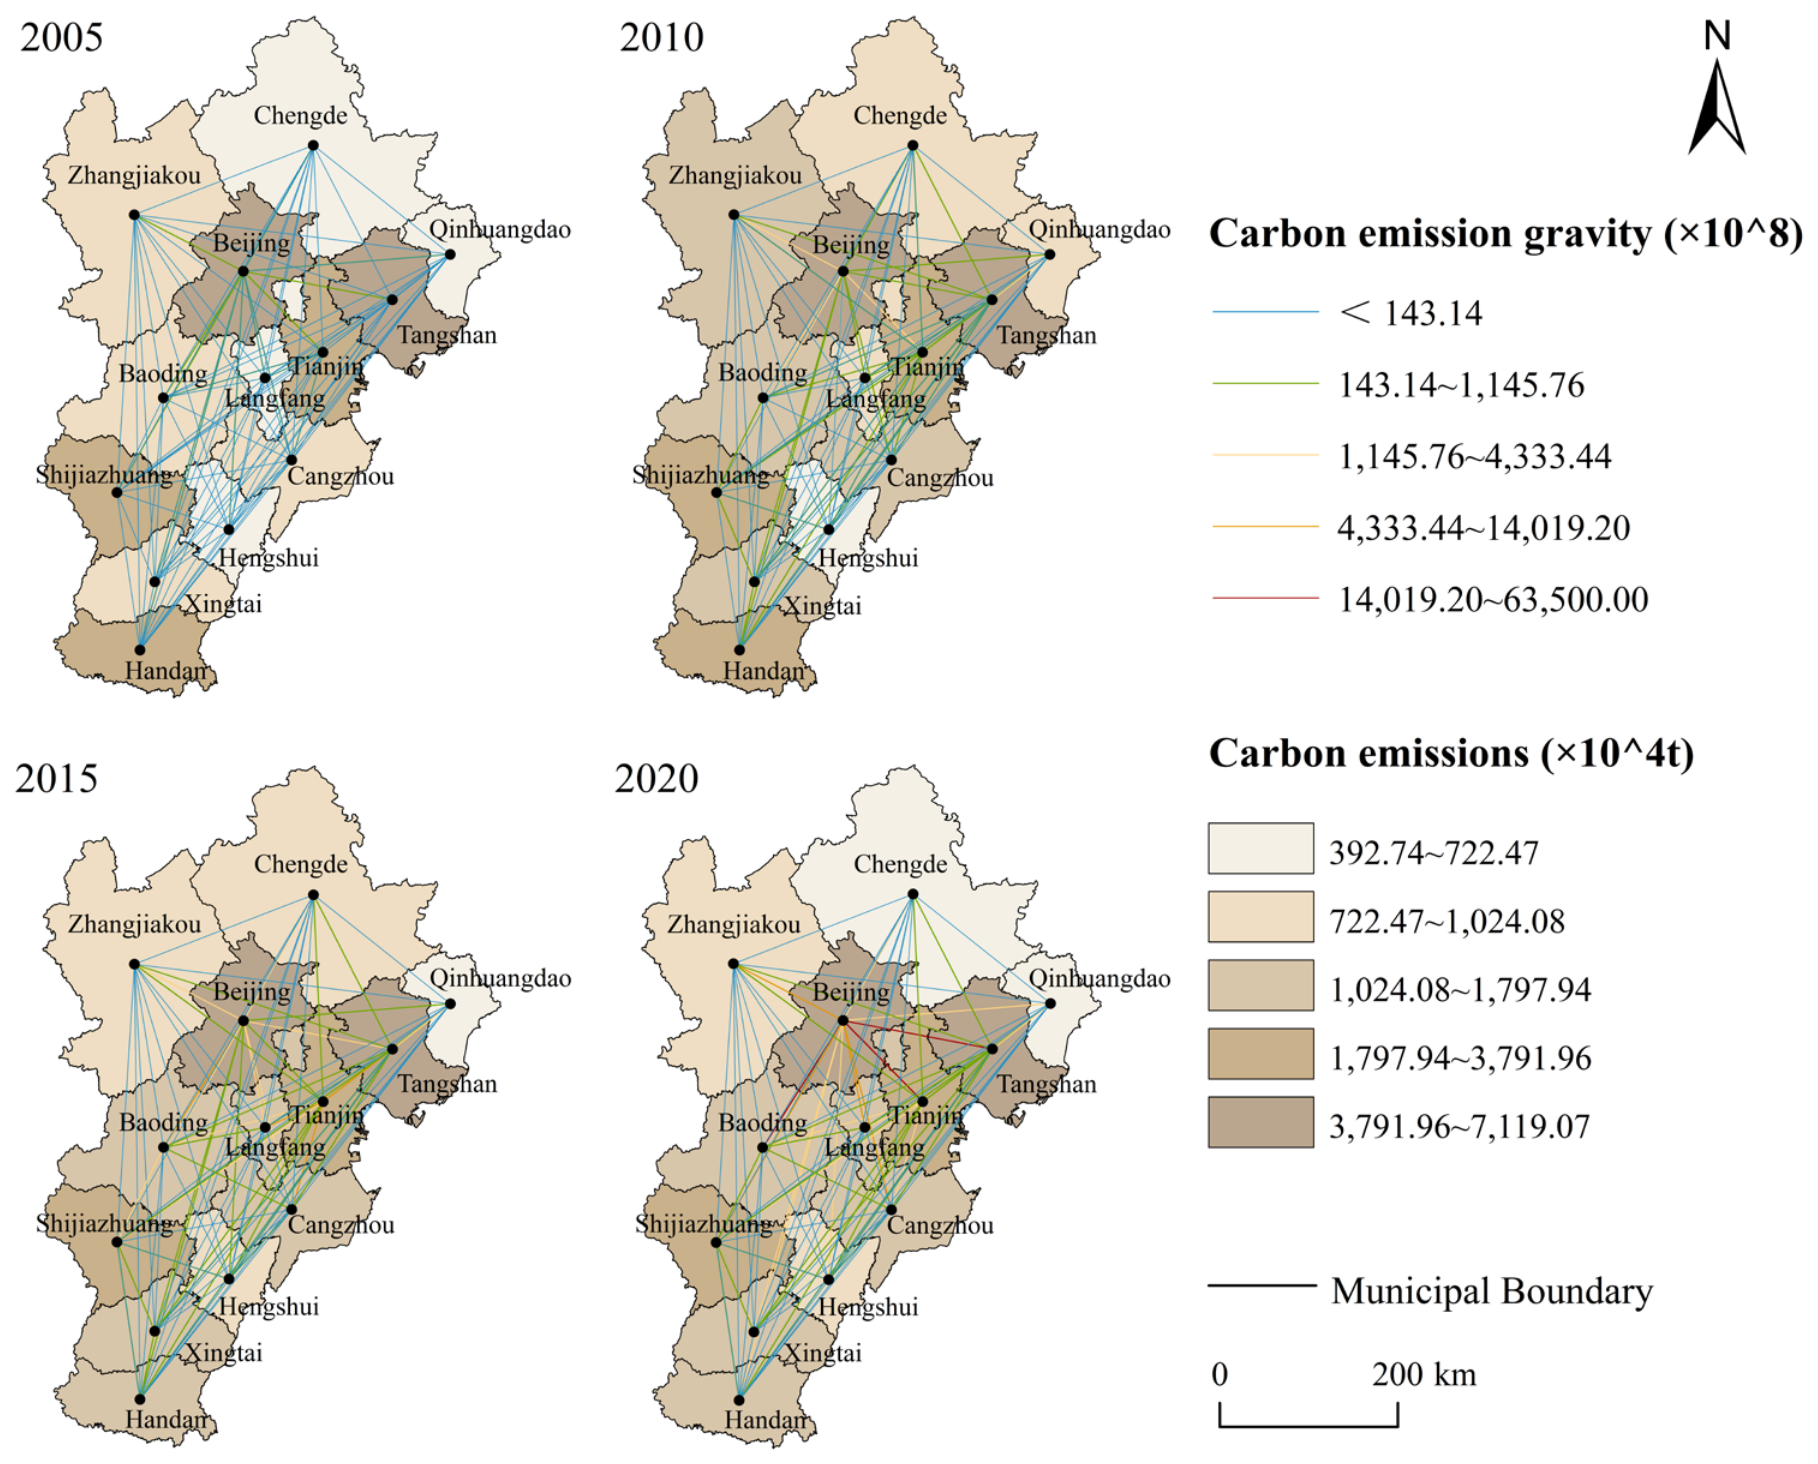
Between 2005 and 2020, LUCE showed an overall increasing trend with temporal fluctuations, while the relative intercity pattern remained broadly stable (Figure 3). Beijing recorded consistently high emissions, peaking at 52.16 Mt C in 2015. Tianjin’s emissions increased by 86.60%, from 20.32 Mt C in 2005 to 37.92 Mt C in 2020, while Tangshan peaked at 71.19 Mt C in 2010. By contrast, emissions in Chengde, Zhangjiakou, Qinhuangdao, Baoding, and Langfang generally remained below 10 Mt C. Overall, the region exhibited a clear spatial pattern characterized by higher emissions in the south and lower emissions in the north. Beijing, Tianjin, and Tangshan formed a persistent high-emission cluster, whereas northern Hebei maintained relatively low emission levels.
Figure 3.
Spatiotemporal patterns of land-use carbon emissions and potential intercity associations in the Beijing-Tianjin-Hebei urban agglomeration, 2005–2020.
The potential LUCE association matrix derived from the gravity model revealed uneven and increasingly hierarchical potential associations. Beijing and Tianjin consistently exhibited the strongest associations with surrounding cities; for example, the association intensity between Beijing and Baoding increased from 7.98 × 10¹¹ in 2010 to 6.35 × 10¹² in 2020. Tangshan acted as a secondary node in eastern Hebei, while Shijiazhuang, Xingtai, and Handan formed a local cluster in central-southern Hebei. The LUCE association network therefore evolved from a relatively dispersed structure toward a multilevel configuration comprising a Beijing-Tianjin dual core, secondary nodes, and local clusters.
3.1.2. Spatiotemporal Pattern of ESC
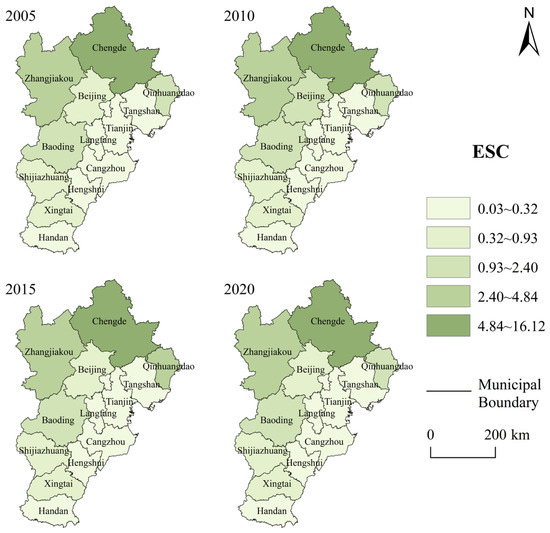
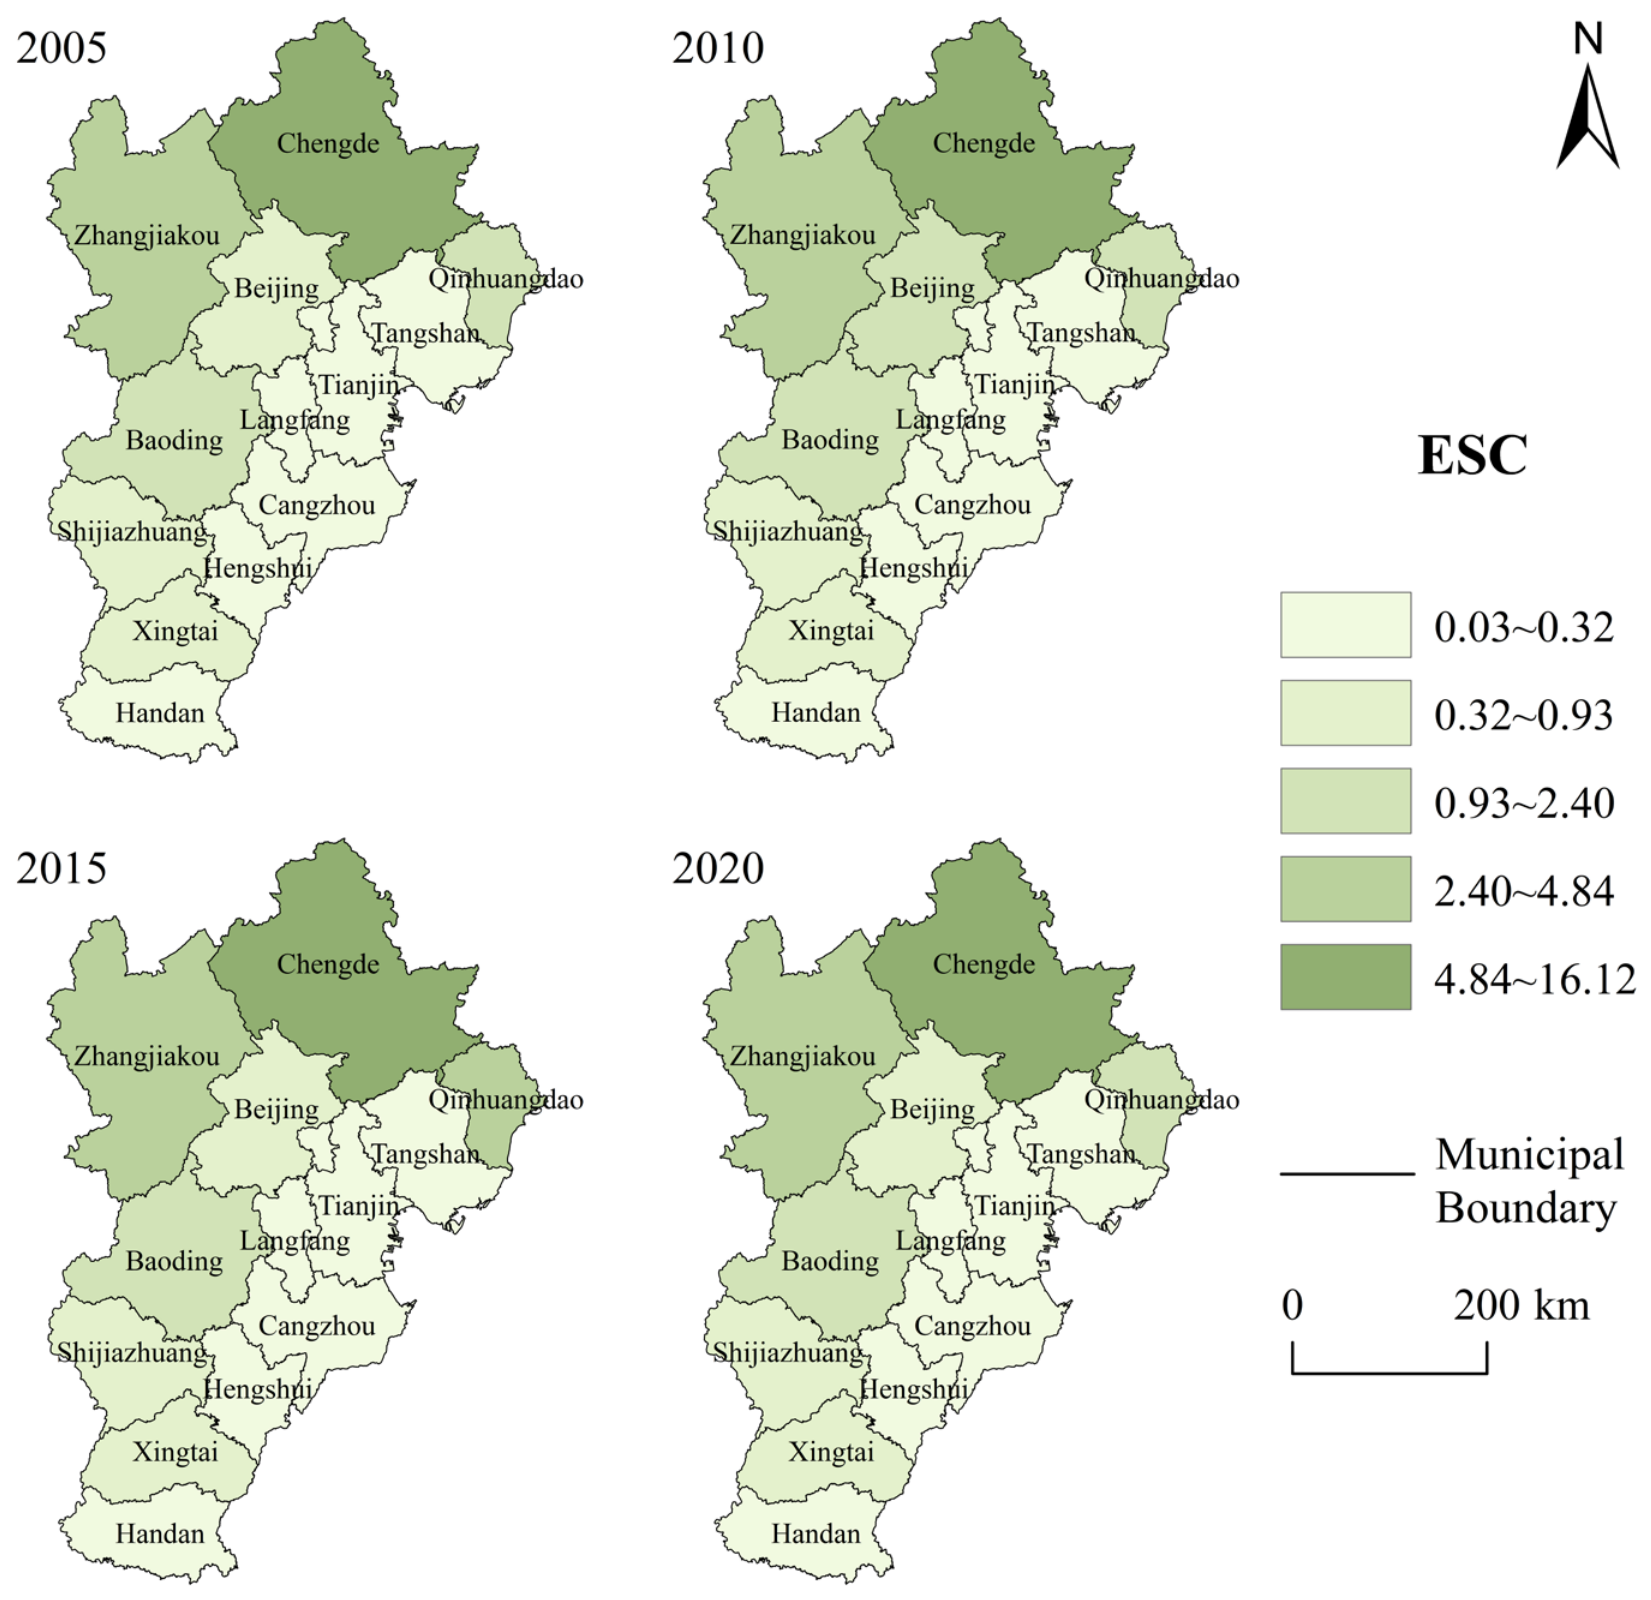
From 2005 to 2020, ESC exhibited a spatial pattern characterized by higher values in the north and lower values in the south (Figure 4). Chengde consistently showed the highest ESC values, although its ESC declined by 22.60%, from 16.12 to 12.48. Zhangjiakou showed the second-highest values, ranging from 3.42 to 4.84. Together, these cities constituted the major high relative ecological support areas in northern and northwestern Hebei. By contrast, ESC remained below 0.25 in Tianjin, Tangshan, and Langfang, indicating that their shares of regional emissions substantially exceeded their shares of regional sequestration. ESC generally declined in Beijing and Baoding but increased slightly in Zhangjiakou and Qinhuangdao. Overall, northern and northwestern cities maintained stronger relative ecological support, whereas the central-southern plains and coastal industrial areas exhibited weaker relative ecological support.
Figure 4.
Spatiotemporal patterns of ecological support capacity (ESC) in the Beijing-Tianjin-Hebei urban agglomeration, 2005–2020.
3.2. Social Network Analysis of Land-Use Carbon Emissions
3.2.1. Overall Network Characteristics
The LUCE association network contained all 13 cities in each study year. Network connectedness remained 1.00 throughout 2005–2020 (Table 2), indicating that all cities were reachable through direct or indirect ties and that no city was isolated from the network. The number of identified ties increased from 35 in 2005 to 40 in 2010, returned to 35 in 2015, and declined to 30 in 2020. Network density followed the same sequence, with values of 0.22, 0.26, 0.22, and 0.19, respectively. Thus, intercity associations expanded initially but became progressively more selective after 2010.
Table 2.
Overall network characteristics of the potential intercity association in the Beijing-Tianjin-Hebei urban agglomeration, 2005–2020.
Network hierarchy decreased from 0.71 in 2005 to 0.50 in 2010, before increasing to 0.71 in 2015 and 0.79 in 2020. Network efficiency remained at 0.70 from 2005 to 2015 and increased to 0.77 in 2020. The 2010 network was therefore the densest and least hierarchical configuration observed during the study period. After 2010, the number of retained ties declined, while positional differentiation increased and tie redundancy decreased. Because connectedness remained at 1.00, this change represents structural concentration rather than fragmentation: the network preserved overall reachability while relying on fewer, more selectively distributed ties.
The robustness results show that the main network characteristics were generally consistent across the three model specifications (Appendix A, Table A1). First, network connectedness remained at 1.00 under all specifications, indicating that the network remained fully connected. Second, network density declined overall from 2005 to 2020, suggesting that the network retained fewer but more selective intercity associations over time. Third, Beijing maintained its core position in models incorporating economic factors, whereas Chengde and Handan exhibited higher centrality when only geographical distance was considered. This difference highlights the role of socioeconomic factors, in addition to geographical proximity, in shaping intercity associations. Finally, differentiated block structures were identified across all specifications. Overall, the main network-level findings remained robust, although the centrality of individual cities was partly sensitive to model specification.
3.2.2. Individual Network Characteristics
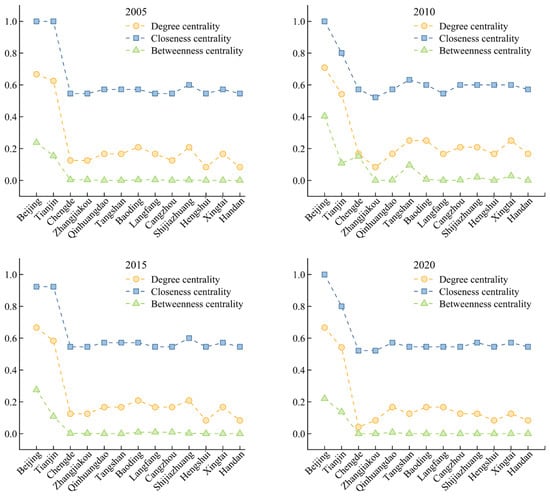
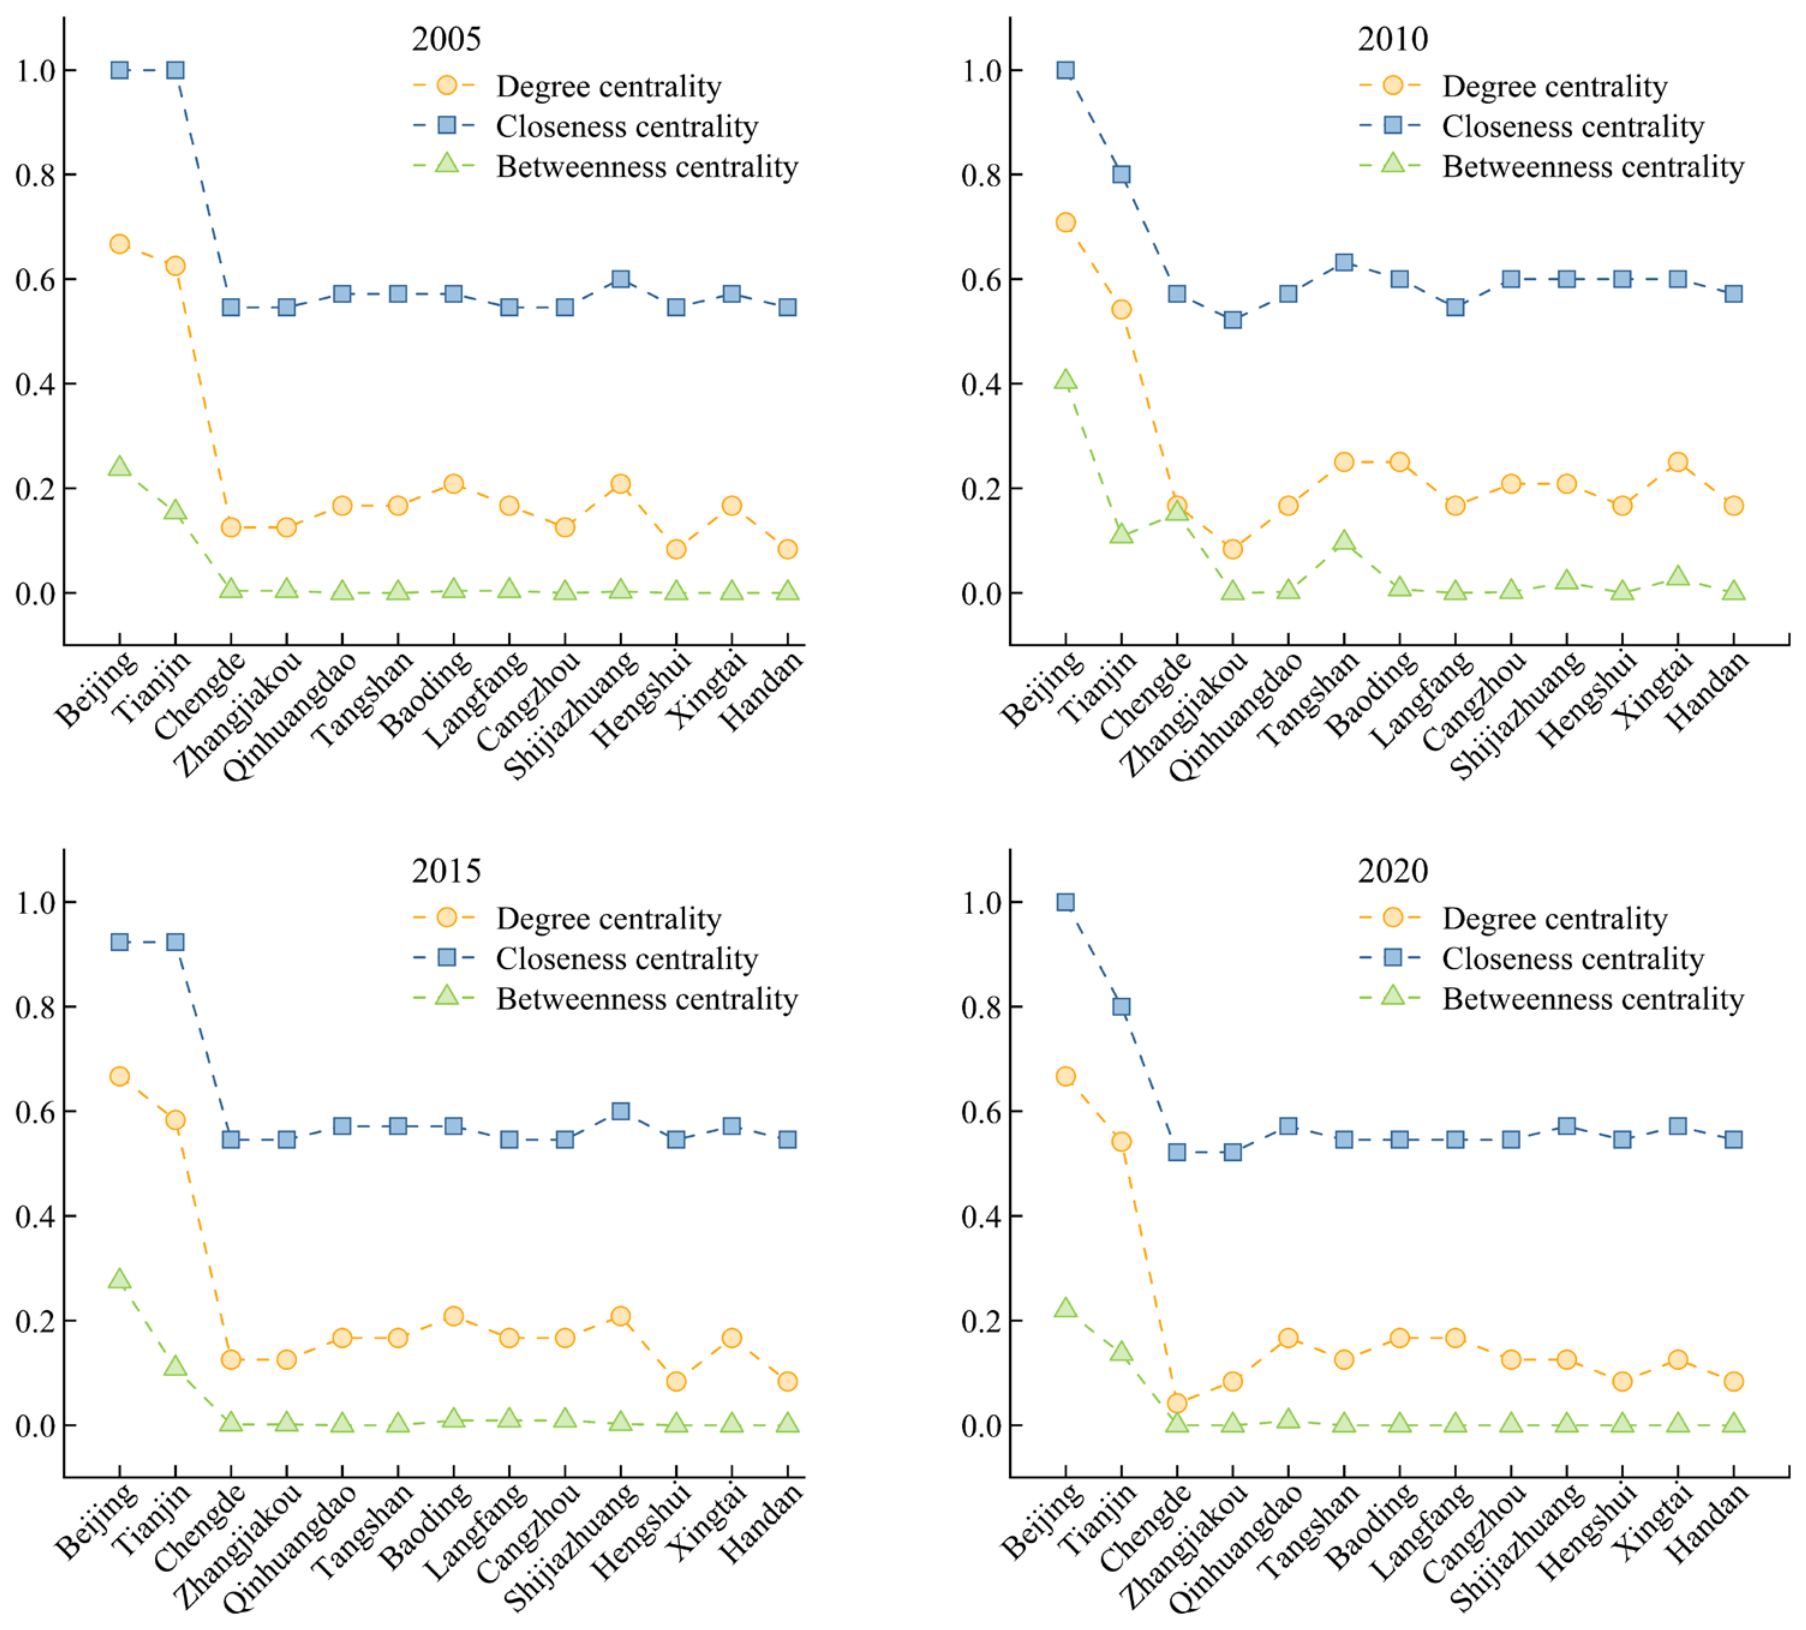
The centrality measures revealed a persistent core–periphery structure (Figure 5; Table 3). Beijing recorded the highest degree centrality in every study year, with values of 0.67, 0.71, 0.67, and 0.67 from 2005 to 2020. Its closeness centrality was 1.00 in 2005, 2010, and 2020, and 0.92 in 2015. Beijing also had the highest betweenness centrality, which rose from 0.24 in 2005 to 0.40 in 2010, before declining to 0.28 in 2015 and 0.22 in 2020. Tianjin remained the secondary core: its degree centrality ranged from 0.54 to 0.63, closeness centrality from 0.80 to 1.00, and betweenness centrality from 0.11 to 0.15. These values indicate that Beijing had the broadest direct reach, greatest accessibility, and strongest potential bridging position, with Tianjin consistently ranking second.
Figure 5.
Individual city centrality characteristics in the potential intercity association network of the Beijing-Tianjin-Hebei urban agglomeration, 2005–2020.
Table 3.
City-level centrality characteristics of the potential intercity association network in the Beijing-Tianjin-Hebei urban agglomeration, 2005–2020.
Cities in Hebei generally occupied less central and more weakly connected positions. Their degree centrality ranged from 0.04 to 0.25, and their closeness centrality ranged from 0.52 to 0.63. Temporary bridging roles were most evident in 2010, when Chengde and Tangshan recorded betweenness centralities of 0.15 and 0.10, respectively; smaller nonzero values were observed for Shijiazhuang, Xingtai, and Baoding. By 2020, betweenness centrality was zero for all Hebei cities except Qinhuangdao (0.01), indicating that shortest-path brokerage had become increasingly concentrated in Beijing and Tianjin, with limited involvement of other cities. A zero value does not indicate an absence of emissions or intercity relationships; it means only that the city did not lie on a shortest path between other city pairs in the identified association network.
3.2.3. Block Network Characteristics
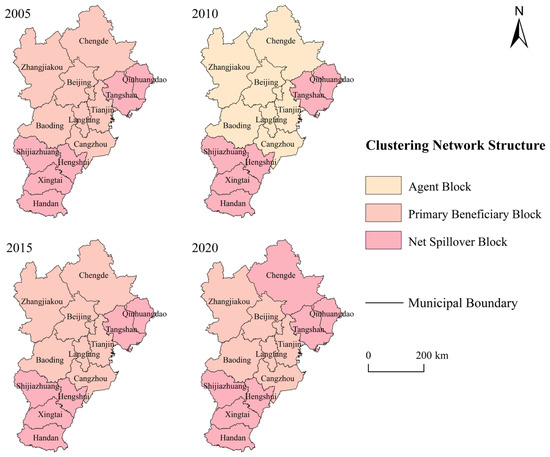
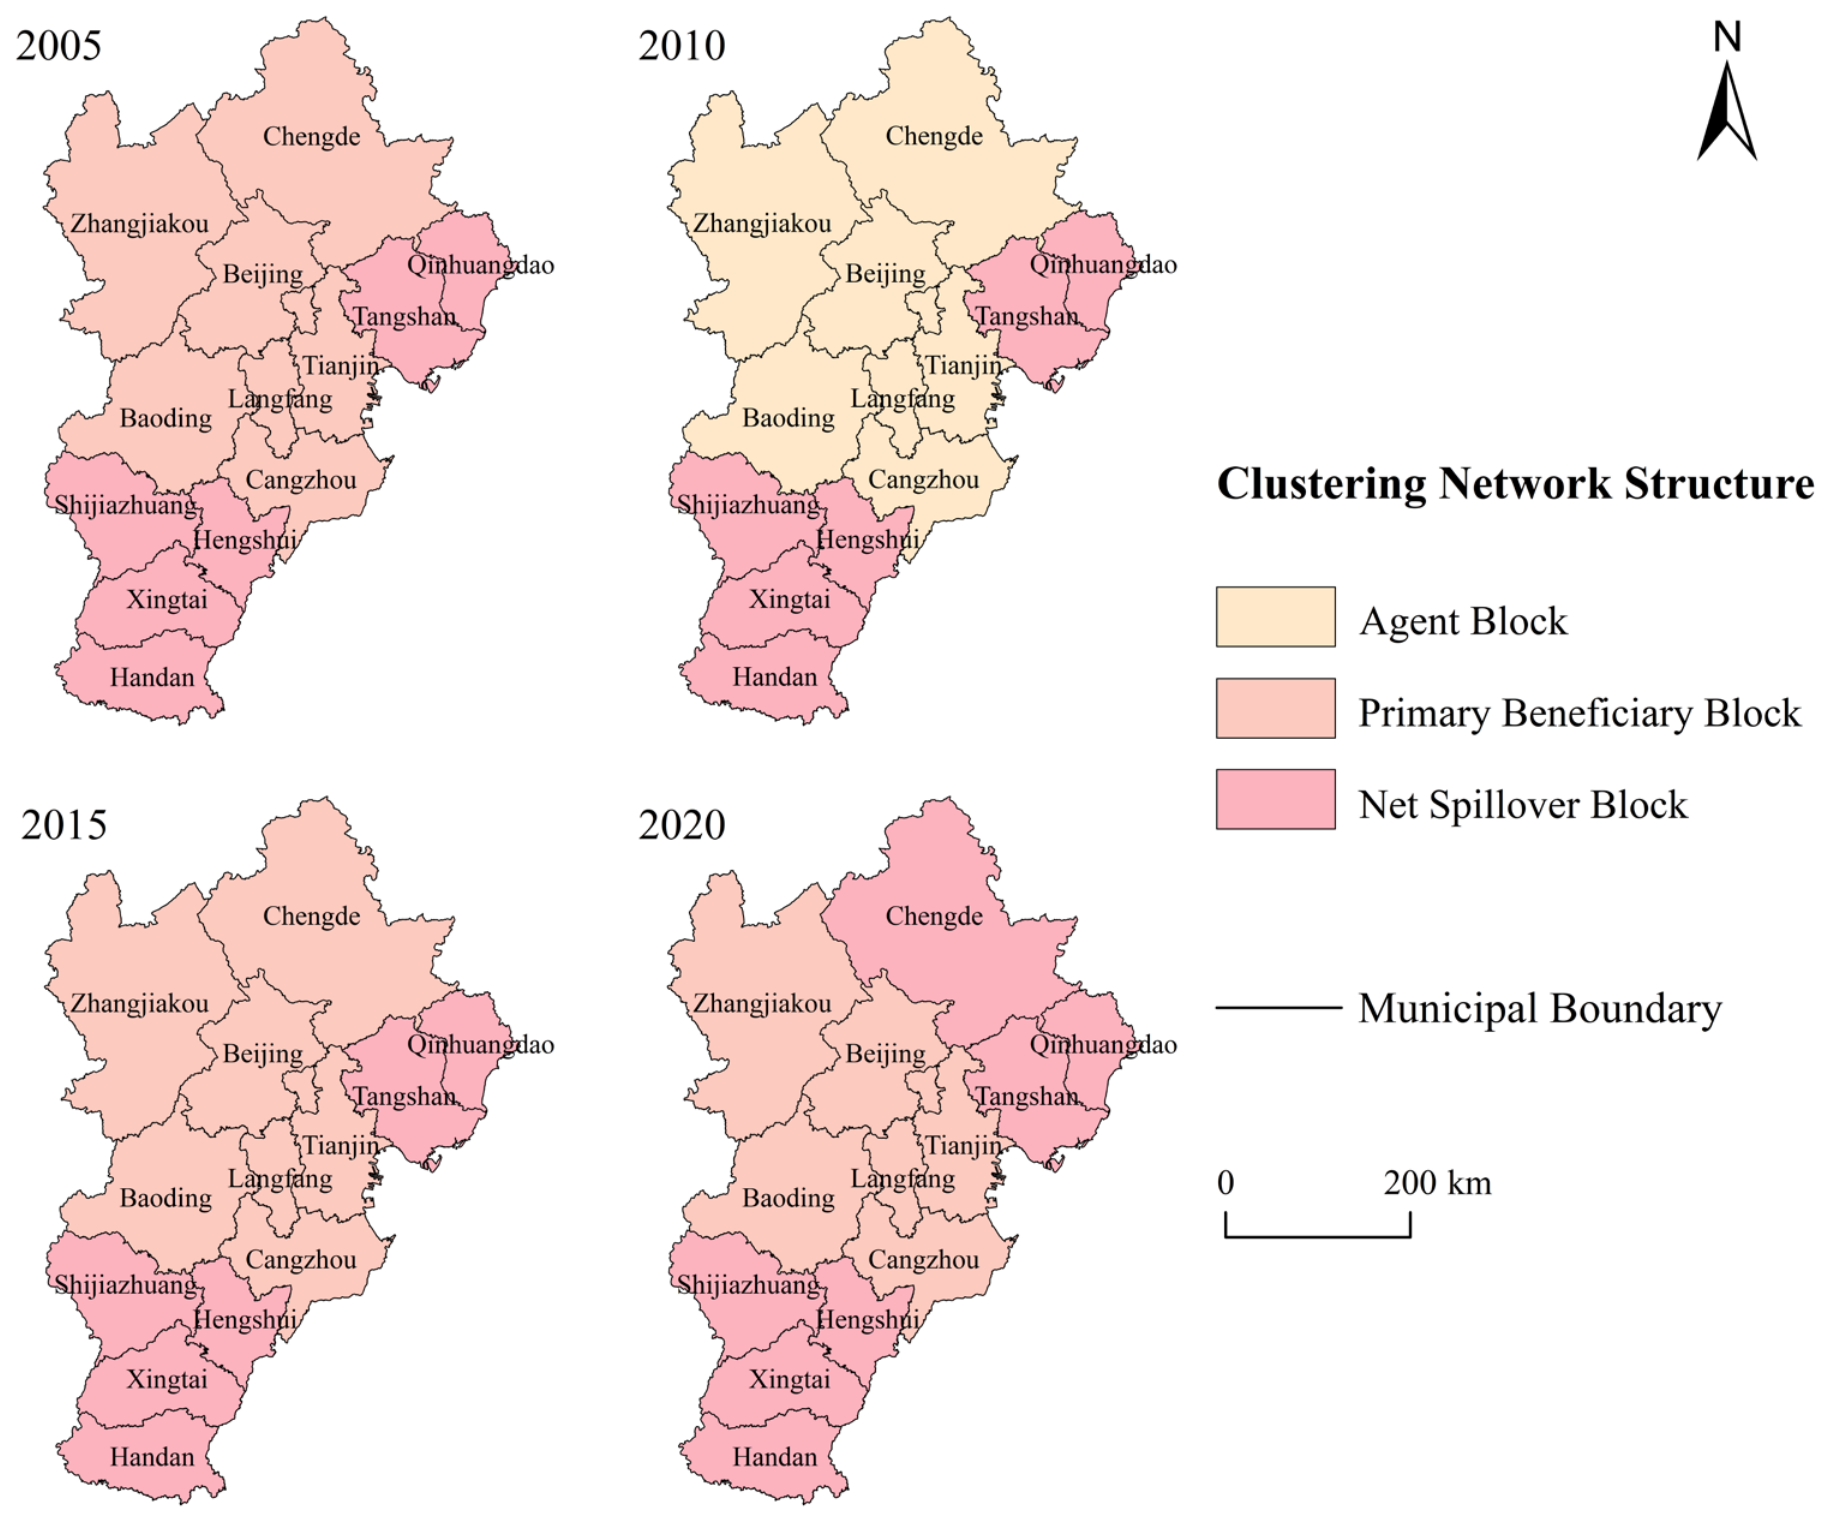
Block model analysis revealed a stage-specific reconfiguration of network roles (Figure 6; Table 4). In 2005, Beijing, Tianjin, Chengde, Zhangjiakou, Baoding, Langfang, and Cangzhou formed the primary beneficiary group, whereas Qinhuangdao, Tangshan, Shijiazhuang, Hengshui, Xingtai, and Handan formed the net spillover group. In 2010, the seven former primary beneficiary cities were reassigned to an agent block that maintained ties with multiple blocks in both directions. The six-city net spillover group was unchanged. The 2005 configuration reappeared in 2015. By 2020, Chengde had shifted from the primary beneficiary to the net spillover group, leaving six cities in the former and seven in the latter.
Figure 6.
Spatial distribution of block structures in the potential intercity association network of the Beijing-Tianjin-Hebei urban agglomeration, 2005–2020.
Table 4.
Block model classification of the potential intercity association network in the Beijing-Tianjin-Hebei urban agglomeration, 2005–2020.
In 2020, the primary beneficiary group comprised Beijing, Tianjin, Zhangjiakou, Baoding, Langfang, and Cangzhou, whereas the net spillover group comprised Chengde, Qinhuangdao, Tangshan, Shijiazhuang, Hengshui, Xingtai, and Handan. The positions of Beijing and Tianjin demonstrate that high node-level centrality can coexist with a primary beneficiary block role: centrality measures direct reach, accessibility, and shortest-path brokerage, whereas block roles compare the direction of ties between groups. Chengde’s change further shows that block roles can evolve even when the broader core–periphery pattern persists.
3.3. Carbon Balance Zoning Based on Relative Ecological Support and Network Roles
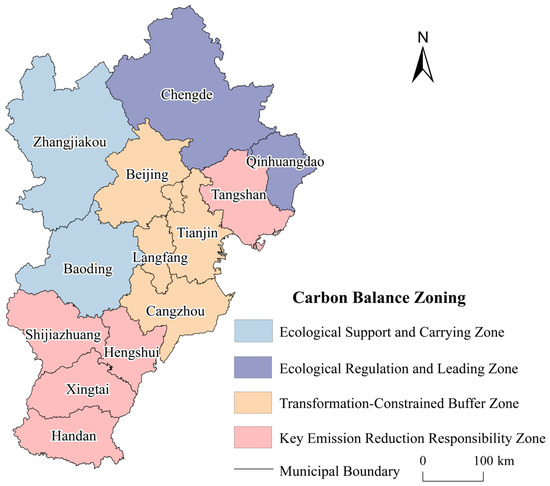
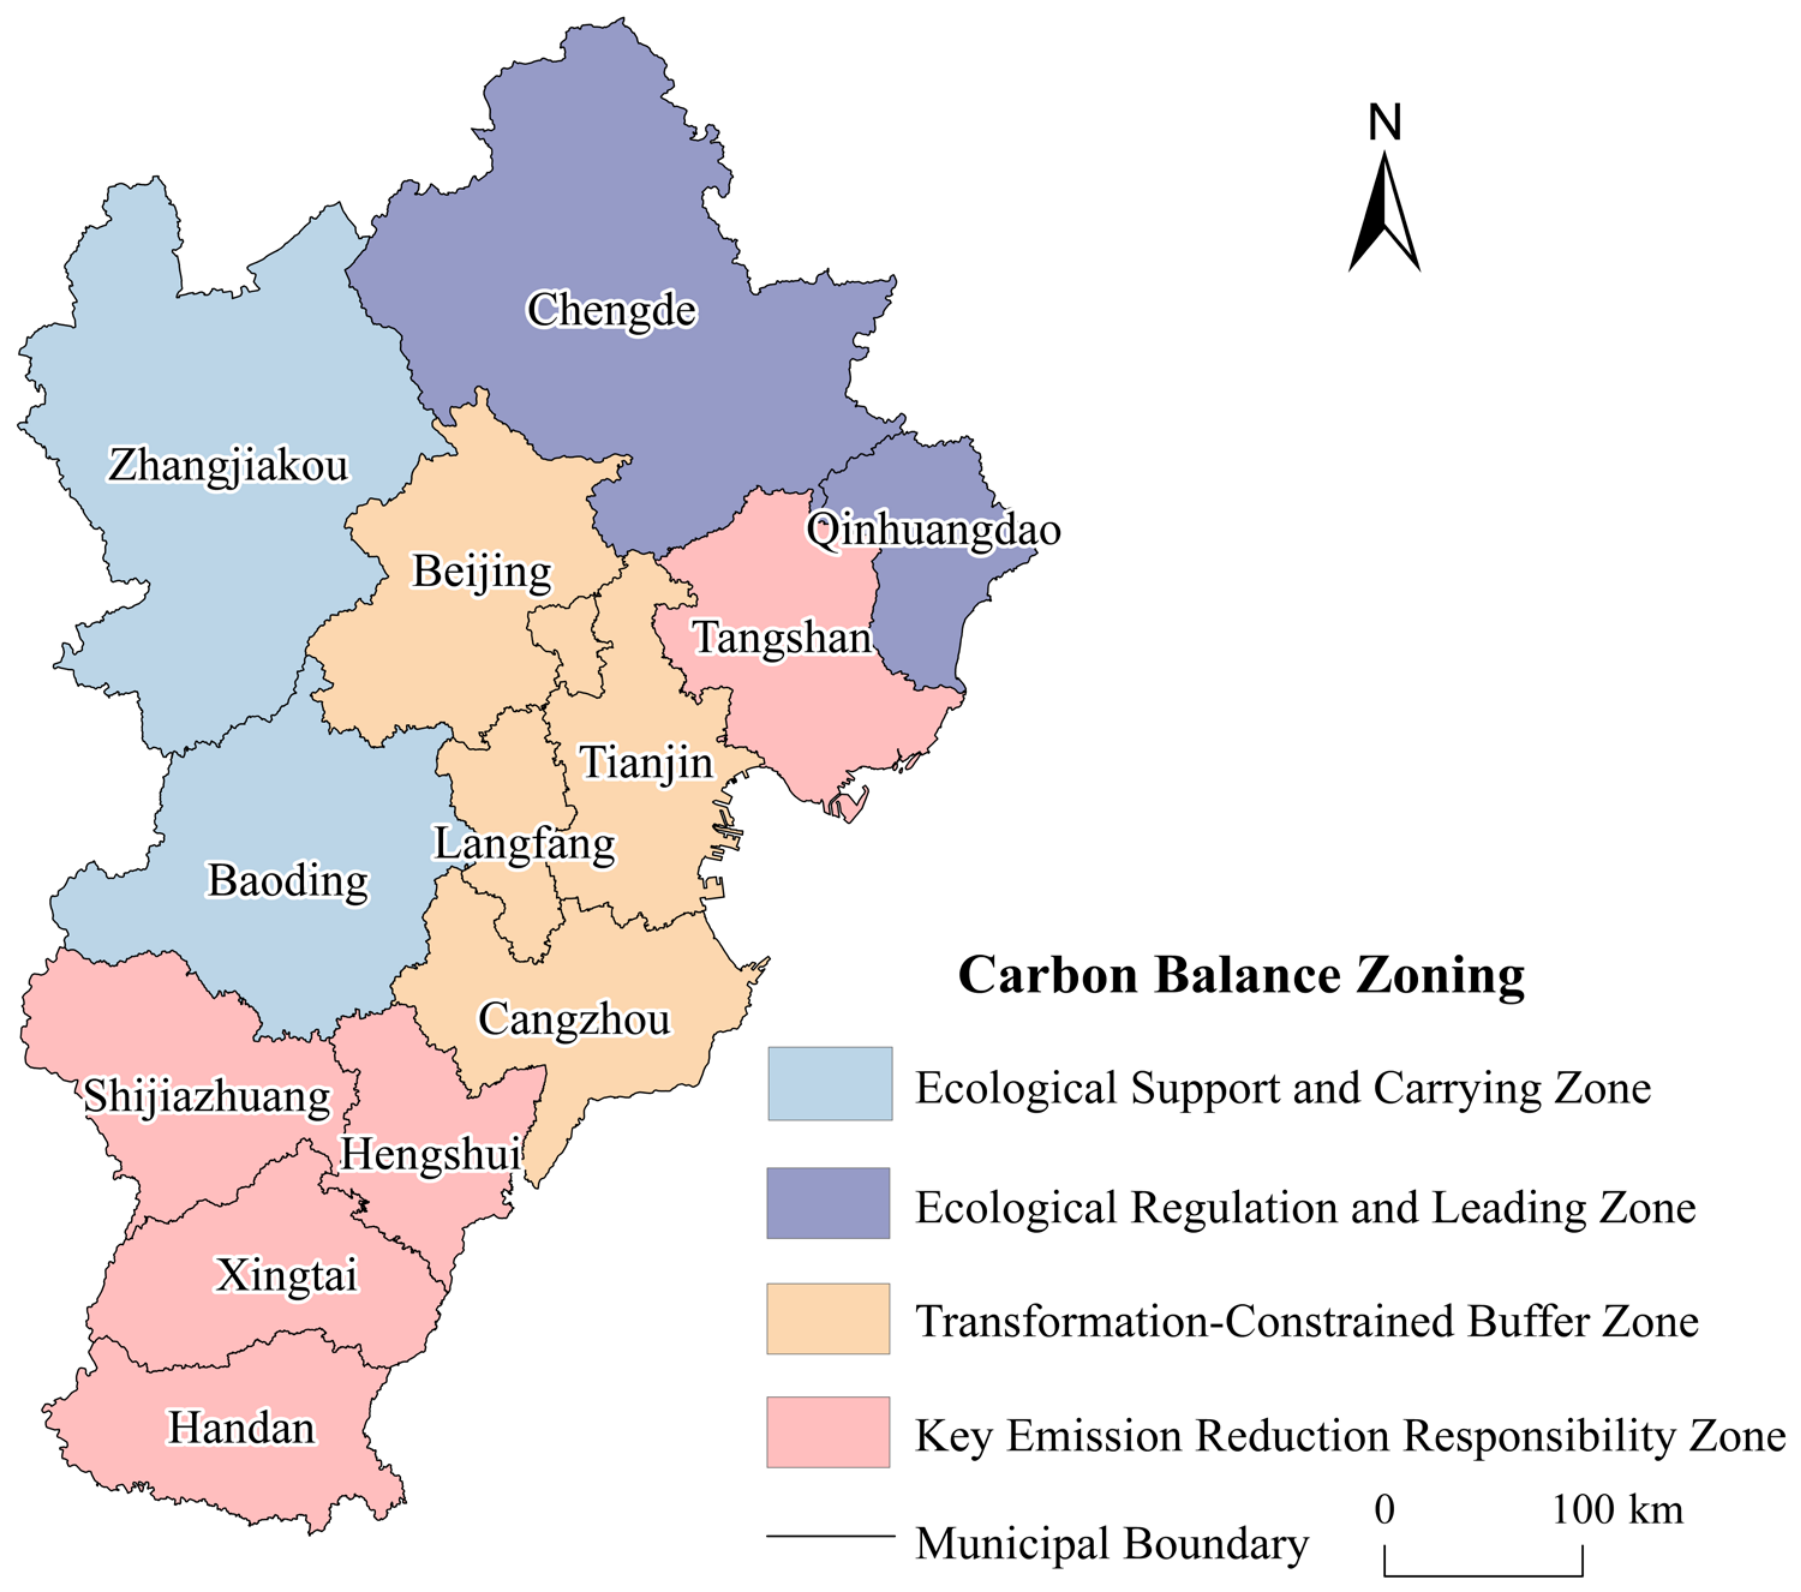
Using 2020, the final year of the study period, as the reference year for zoning, the 13 cities in the Beijing–Tianjin–Hebei region were divided into four carbon-balance functional zones by cross-classifying ESC and network-block roles (Figure 7 and Table 5). This framework considers both relative ecological support capacity and structural positions within the regional potential association network. It avoids the limitations of classifications based solely on emission scale or a single ecological indicator.
Figure 7.
Land-use carbon balance zoning in the Beijing-Tianjin-Hebei urban agglomeration, 2020.
Table 5.
Classification criteria and functional characteristics of land-use carbon balance zoning in the Beijing-Tianjin-Hebei urban agglomeration, 2020.
- (1)
- Ecological support and carrying zones (ESC > 1, primary beneficiary blocks)
This category includes Zhangjiakou and Baoding. Both cities have relatively high ecological support capacity and belong to primary beneficiary blocks. Their ecological carbon sequestration capacity provides strong support, but they receive more inter-block associations than they send outward. These cities perform important ecological barrier and carbon-sink maintenance functions. They should strictly control high-intensity built-up land expansion, prevent the unregulated entry of energy-intensive industries, and prioritize forest and grassland conservation, ecological restoration, and the realization of ecological product values.
- (2)
- Ecological regulation and leading zones (ESC > 1, net spillover blocks)
This category includes Chengde and Qinhuangdao. Both cities have strong ecological support capacity and belong to net spillover blocks, meaning that they send relatively more potential associations to other blocks. This result indicates that high ecological support capacity does not necessarily correspond to a primary beneficiary role. Chengde’s high ESC is mainly associated with a large share of ecological land, including forestland and grassland, and relatively low development intensity. Its outward association role may be related to its ecological-function positioning, regional resource linkages, and industrial specialization. These cities should be prioritized for regional ecological compensation and green development support. Ecological space should be protected, while high-carbon industrial transfers that could erode ecological carbon sequestration capacity should be prevented.
- (3)
- Transition-constrained buffer zone (ESC < 1, primary beneficiary blocks)
This category includes Beijing, Tianjin, Langfang, and Cangzhou. These cities have relatively low ecological support capacity and exhibit strong association-absorption characteristics. The low ESC values in Beijing and Tianjin are mainly associated with the high concentration of population, economic activities, and built-up land, as well as limited ecological land. Their primary beneficiary roles do not imply lower emission-reduction responsibilities. Instead, they indicate closer potential associations with other cities. These cities should strengthen low-carbon energy transition, promote intensive and efficient use of built-up land, and facilitate the diffusion of green technologies. They should also provide sustained support to ecological-service supplying areas through green investment, technical cooperation, and horizontal ecological compensation.
- (4)
- Key emission-reduction responsibility zones (ESC < 1, net spillover blocks)
This category includes Tangshan, Shijiazhuang, Hengshui, Xingtai, and Handan. These cities exhibit relatively low ecological support capacity and strong outward association characteristics. They should therefore be priority areas for allocating regional emission-reduction targets and promoting industrial green transition. Cities such as Tangshan should prioritize energy conservation and carbon reduction in energy-intensive industries, clean-energy substitution, and the renewal of existing industrial land. Shijiazhuang, Hengshui, Xingtai, and Handan should implement differentiated emission-reduction and land-use control measures according to their industrial structures, energy-use patterns, and built-up land expansion characteristics.
4. Discussion
4.1. Spatial Differentiation of LUCE and Comparison with Previous Studies
LUCE in the Beijing-Tianjin-Hebei urban agglomeration increased overall during 2005–2020 while maintaining a broadly stable south-high, north-low pattern. Beijing, Tianjin, and Tangshan formed a high-emission cluster, whereas northern Hebei generally recorded lower emissions. This pattern is consistent with previous regional studies linking high emissions to intensive economic activity, built-up land expansion, and industrial development, while associating lower emissions with greater ecological-land endowment and lower development intensity [24,34]. The observed spatial differences may therefore reflect contrasts in population and economic concentration, industrial structure, and land-use patterns. Beijing and Tianjin concentrate production and residential activities; Tangshan is dominated by energy-intensive industries; and Chengde and Zhangjiakou perform major ecological conservation functions. These persistent functional and land-use differences may contribute to path dependence in the spatial distribution of LUCE.
Unlike studies focusing primarily on emission levels, spatial autocorrelation, or adjacency-based spillovers, this study examines how cities are positioned within a gravity-model-derived potential association network. It therefore complements conventional approaches by revealing structured associations among both adjacent and non-adjacent cities [18,25].
4.2. Transition from Network Expansion to Core Concentration
The network expanded between 2005 and 2010 but became more selective and hierarchical thereafter. Although density declined after 2010, connectedness remained unchanged, while hierarchy and efficiency increased. The later-stage network therefore did not fragment; instead, it maintained reachability through fewer, less redundant, and more structurally differentiated ties. This evolution is broadly consistent with the strengthening core-periphery patterns reported for other urban carbon-emission association networks [30,35,36]. Regional integration may enhance the influence of economically dominant cities through industrial collaboration, transport connectivity, and factor mobility, while peripheral cities retain fewer direct ties and weaker bridging positions. In this study, Beijing consistently occupied the most central position, Tianjin formed a secondary core, and most cities in Hebei remained relatively peripheral.
The centrality of Beijing and Tianjin presents both opportunities and risks. Their broad network reach may facilitate green-technology diffusion, resource coordination, clean-energy cooperation, and regional policy alignment [37]. However, excessive dependence on a few core nodes may reduce structural resilience because changes in their industrial or land-use policies may affect multiple potential association pathways [38]. Strengthening secondary nodes such as Tangshan and Shijiazhuang could therefore support a more polycentric governance structure. The timing of this network transition coincides with infrastructure development associated with the 2008 Beijing Olympic Games and the Beijing–Tianjin–Hebei coordinated development strategy launched in 2014. Transport integration, industrial restructuring, joint environmental governance, and the relocation of non-capital functions may have contributed to changes in regional associations [39]. However, because no causal identification strategy was applied, these developments should be regarded as contextual influences rather than causally identified drivers of network change.
4.3. Mismatch Between Relative Ecological Support and Network Roles
Relative ecological support did not correspond directly to network roles because the two indicators capture different dimensions [10,19]. ESC compares a city’s share of regional carbon sequestration with its share of regional emissions, whereas network roles describe its structural position and tie direction within the potential association network. The former is shaped mainly by ecological endowment, land-use intensity, and emissions; the latter is also influenced by economic agglomeration, industrial specialization, location, and intercity connectivity. Chengde and Qinhuangdao combined high relative ecological support with net spillover roles. Chengde’s high ESC reflects its extensive forestland, grassland, and relatively low built-up land intensity, while its outward-oriented associations may be related to ecological functions, resource linkages, and regional specialization. Qinhuangdao’s role may additionally reflect its coastal location, port economy, tourism, and industrial connections. These net spillover roles do not indicate the physical export of carbon emissions, energy, or carbon sequestration [40,41].
Conversely, Beijing and Tianjin combined low relative ecological support with primary beneficiary roles. Their low ESC values reflect high shares of regional emissions relative to sequestration, associated with intensive development, concentrated population and economic activity, and limited ecological land. Their inward-oriented network roles may arise from their agglomeration functions in industrial chains, capital, technology, population, and public services. Such roles do not reduce their emission-reduction responsibilities; rather, their central positions strengthen their capacity and responsibility to coordinate regional low-carbon development.
Integrating ESC and network roles therefore reveals the coexistence of ecological heterogeneity and structural asymmetry. Compared with zoning based solely on emissions or ecological indicators, this framework distinguishes relative ecological support from regional network function and provides a more comprehensive basis for differentiated carbon balance zoning and regional governance.
4.4. Implications for Regional Collaborative Governance
Based on the four functional zones identified above, the zoning framework provides complementary evidence for emission-reduction strategy formulation, ecological compensation, and cross-jurisdictional coordination. It does not replace administrative responsibility with network position; instead, it combines relative ecological support, emission pressure, and structural roles to differentiate governance priorities.
For the ecological support and carrying zones–Zhangjiakou and Baoding–priority should be given to conserving and enhancing carbon-sequestration capacity. Policies should restrict built-up land expansion and energy-intensive projects in ecologically sensitive areas, restore forests, grasslands, and wetlands, and support ecological compensation and ecological-product value realization [40,42].
For the ecological regulation and leading zones–Chengde and Qinhuangdao–policies should protect ecological space while supporting green development. Their ecological service contributions warrant stable horizontal compensation, green investment, and carbon-sequestration project cooperation. High-carbon industrial entry should be strictly controlled to prevent regional industrial collaboration from weakening their ecological advantages.
For the transition-constrained buffer zones–Beijing, Tianjin, Langfang, and Cangzhou–emission constraints should be combined with green-technology diffusion and ecological compensation responsibilities. Beijing and Tianjin can use their central positions to promote clean-energy coordination, low-carbon supply chains, green finance, and technical cooperation [37]. Langfang and Cangzhou should strengthen environmental entry standards for relocated industries to prevent new high-carbon lock-in [43].
For the key emission-reduction responsibility zones–Tangshan, Shijiazhuang, Hengshui, Xingtai, and Handan–priority should be given to industrial decarbonization, clean-energy substitution, and land-use optimization. Tangshan should focus on energy-intensive sectors such as steel and building materials, while the other cities should tailor land-use and emission controls to their industrial and energy structures [44]. Their outward-oriented associations also require coordinated measures that consider potential regional spillover effects.
Overall, high relative emission pressure combined with strong outward associations indicate a need for stricter transition measures, whereas strong ecological functions warrant stable conservation and compensation support. Core cities should assume coordinating roles in finance, technology, standards, and regional governance.
4.5. Contributions
This study makes three contributions. First, it extends LUCE research from analyses of individual city-level emission patterns and geographical adjacency-based relationships to a potential intercity association network, providing a network perspective for understanding the structural linkages of carbon emissions within urban agglomerations. Second, it develops an integrated framework that combines relative ecological support capacity with network structural roles, revealing mismatches between ecological contributions and intercity functions that cannot be captured by emission intensity or ecological indicators alone. Third, it translates the ecological–network perspective into a differentiated carbon-balance zoning framework, providing governance implications for emission reduction, ecological conservation, and low-carbon land-use management in urban agglomerations.
5. Conclusions
5.1. Main Conclusions
This study investigated the spatiotemporal evolution of LUCE, intercity association network characteristics, and carbon balance zoning in the Beijing–Tianjin–Hebei urban agglomeration. First, LUCE showed an overall increasing trend during 2005–2020 while maintaining a stable spatial pattern characterized by higher emissions in the south and lower emissions in the north. In contrast, ESC exhibited an opposite spatial gradient, indicating a spatial differentiation between carbon-emission pressure and ecological support capacity. Second, social network analysis revealed that the potential association network remained connected and exhibited a persistent core–periphery structure, with Beijing maintaining the dominant position and Tianjin acting as a secondary core. After 2010, the network shifted from early expansion toward greater selectivity and concentration, while cities occupied distinct network roles. Third, integrating ESC with network structural roles identified four carbon balance functional zones and revealed a mismatch between ecological support capacity and intercity network functions. This finding demonstrates that ecological contributions and network positions are not necessarily consistent, highlighting the need for differentiated carbon governance based on both ecological capacity and regional connectivity.
5.2. Limitations and Future Research
Several limitations should be acknowledged. First, the carbon emission coefficient method relies on relatively fixed coefficients and may not fully capture dynamic changes in ecological processes and technological progress. Future studies could incorporate dynamic accounting approaches to improve carbon estimation. Second, the gravity-model-derived network represents potential associations rather than actual carbon, energy, or embodied-carbon flows. Its structure is also sensitive to model specifications and threshold settings, which should be further examined using observed flow data and alternative approaches. Third, city-level analysis cannot reveal finer-scale heterogeneity, and the study period ending in 2020 limits the assessment of recent policy impacts. Future research should incorporate finer spatial scales, extend the time series, and further evaluate policy effects.
Author Contributions
Conceptualization, H.W. and A.L.; methodology, H.W. and A.L.; software, A.L. and L.K.; validation, A.L. and L.K.; formal analysis, L.K.; investigation, A.L.; resources, H.W. and X.Y.; data curation, A.L. and X.Y.; writing—original draft preparation, H.W. and A.L.; writing—review and editing, H.W. and X.Y.; visualization, L.K.; supervision, H.W. and X.Y.; project administration, H.W.; funding acquisition, H.W. and X.Y. All authors have read and agreed to the published version of the manuscript.
Funding
This research was financially supported by the Ministry of Education Humanities and Social Science Project (No. 24YJCZH329) and the National Natural Science Foundation of China (No. 42501226).
Data Availability Statement
The land-use data used in this study are publicly available from the Resource and Environmental Science and Data Center of the Chinese Academy of Sciences (https://www.resdc.cn/ (accessed on 15 September 2025)). The socioeconomic data were obtained from the official statistical yearbooks described in Section 2.2. The processed data and network analysis results are available from the corresponding author upon reasonable request.
Acknowledgments
We express our heartfelt thanks to all individuals and institutions that contributed to this work.
Conflicts of Interest
The authors declare no conflicts of interest.
Correction Statement
This article has been republished with a minor correction to the existing affiliation information. This change does not affect the scientific content of the article.
Abbreviations
The following abbreviations are used in this manuscript:
| ESC | Ecological Support Capacity |
| LUCE | Land-Use Carbon Emissions |
| SNA | Social Network Analysis |
| Mt C | megatons of carbon (106 tonnes of carbon) |
Appendix A
This appendix reports the results of robustness checks using alternative gravity model specifications. Table A1 compares the network indicators across three models: the original model, a pure geographic distance model, and an absolute economic distance model.
The robustness results show that network connectedness remains at 1 across all three specifications, and network density in 2020 is lower than that in 2005 across all models, indicating that overall connectivity and the increasing concentration of intercity associations in the later period are robust to model choice. However, some centrality rankings are sensitive to model specifications: both the original model and the absolute economic distance model identify Beijing as the city with the highest betweenness centrality, whereas the pure geographic distance model identifies Chengde (2005–2015) and Handan (2020) as the most central cities. This suggests that Beijing’s bridging position is not solely attributable to its geographic proximity but is also associated with socioeconomic disparities captured by the model. Accordingly, we interpret the overall network connectivity as a relatively robust finding, while acknowledging that the specific centrality rankings and structural roles are subject to model specification.
Table A1.
Comparison of network indicators across different model specifications.
Table A2.
Variables used in the social network analysis (SNA).
References
- Ou, Y.; Bao, Z.; Ng, S.T.; Song, W.; Chen, K. Land-Use Carbon Emissions and Built Environment Characteristics: A City-Level Quantitative Analysis in Emerging Economies. Land Use Policy 2024, 137, 107019. [Google Scholar] [CrossRef] [Scilit]
- Liu, H.; Yin, W.; Yan, F.; Cai, W.; Du, Y.; Wu, Y. A Coupled STIRPAT-SD Model Method for Land-Use Carbon Emission Prediction and Scenario Simulation at the County Level. Environ. Impact Assess. Rev. 2024, 108, 107595. [Google Scholar] [CrossRef] [Scilit]
- Liu, G.; Cui, F.; Wang, Y. Spatial Effects of Urbanization, Ecological Construction and Their Interaction on Land Use Carbon Emissions/Absorption: Evidence from China. Ecol. Indic. 2024, 160, 111817. [Google Scholar] [CrossRef] [Scilit]
- Wu, J.; Xu, Y.; Liu, Z. A Comprehensive Review on Agricultural Greenhouse Gas Emission Reductions in China: Opportunities and Challenges. Carbon Footpr. 2024, 3, 17. [Google Scholar] [CrossRef] [Scilit]
- Zhao, L.; Yang, C.; Zhao, Y.; Wang, Q.; Zhang, Q. Spatial Correlations of Land Use Carbon Emissions in Shandong Peninsula Urban Agglomeration: A Perspective from City Level Using Remote Sensing Data. Remote Sens. 2023, 15, 1488. [Google Scholar] [CrossRef] [Scilit]
- Rong, T.; Zhang, P.; Zhu, H.; Jiang, L.; Li, Y.; Liu, Z. Spatial Correlation Evolution and Prediction Scenario of Land Use Carbon Emissions in China. Ecol. Inform. 2022, 71, 101802. [Google Scholar] [CrossRef] [Scilit]
- Liu, C.; Hu, S.; Wu, S.; Song, J.; Li, H. County-Level Land Use Carbon Emissions in China: Spatiotemporal Patterns and Impact Factors. Sustain. Cities Soc. 2024, 105, 105304. [Google Scholar] [CrossRef] [Scilit]
- Yang, G.; Cheng, S.; Huang, X.; Liu, Y. What Were the Spatiotemporal Evolution Characteristics and Influencing Factors of Global Land Use Carbon Emission Efficiency? A Case Study of the 136 Countries. Ecol. Indic. 2024, 166, 112233. [Google Scholar] [CrossRef] [Scilit]
- Luo, H.; Liu, Z.; Li, Y.; Meng, X.; Yang, X. Characterizing and Predicting Carbon Emissions from an Emerging Land Use Perspective: A Comprehensive Review. Urban Clim. 2024, 58, 102141. [Google Scholar] [CrossRef] [Scilit]
- Huang, H.; Jia, J.; Chen, D.; Liu, S. Evolution of Spatial Network Structure for Land-Use Carbon Emissions and Carbon Balance Zoning in Jiangxi Province: A Social Network Analysis Perspective. Ecol. Indic. 2024, 158, 111508. [Google Scholar] [CrossRef] [Scilit]
- Xiong, S.; Yang, F.; Li, J.; Xu, Z.; Ou, J. Temporal-Spatial Variation and Regulatory Mechanism of Carbon Budgets in Territorial Space through the Lens of Carbon Balance: A Case of the Middle Reaches of the Yangtze River Urban Agglomerations, China. Ecol. Indic. 2023, 154, 110885. [Google Scholar] [CrossRef] [Scilit]
- He, Z.; Fu, P.; Meng, Y. Analysis of Spatial Disequilibrium and Convergence in China’s Agricultural Green and Low-Carbon Transformation. Carbon Balance Manag. 2025, 20, 62. [Google Scholar] [CrossRef] [Scilit] [PubMed]
- Liu, X.; Xu, H.; Zhang, M. The Effects of Urban Expansion on Carbon Emissions: Based on the Spatial Interaction and Transmission Mechanism. J. Clean. Prod. 2024, 434, 140019. [Google Scholar] [CrossRef] [Scilit]
- Zhou, K.; Yang, J.; Yang, T.; Ding, T. Spatial and Temporal Evolution Characteristics and Spillover Effects of China’s Regional Carbon Emissions. J. Environ. Manag. 2023, 325, 116423. [Google Scholar] [CrossRef] [Scilit] [PubMed]
- Feng, Y.; Peng, D.; Li, Y.; Liu, S. Can Regional Integration Reduce Carbon Intensity? Evidence from City Cluster in China. Environ. Dev. Sustain. 2024, 26, 5249–5274. [Google Scholar] [CrossRef] [Scilit]
- Zhao, Y.-N.; Lee, C.-C. How Does Industrial Relocation Affect Carbon Emissions? Evidence from Chinese Cities. Econ. Change Restruct. 2024, 57, 182. [Google Scholar] [CrossRef] [Scilit]
- Cai, X.; Ye, C.; Xiao, W.; Peng, J. Spatial Correlation and Carbon Compensation Zoning of Land Use Carbon Budget in the Middle Reaches of Yangtze River. Resour. Environ. Yangtze Basin 2024, 33, 1474–1488. (In Chinese) [Google Scholar]
- Yu, Z.; Chen, L.; Tong, H.; Chen, L.; Zhang, T.; Li, L.; Yuan, L.; Xiao, J.; Wu, R.; Bai, L.; et al. Spatial Correlations of Land-Use Carbon Emissions in the Yangtze River Delta Region: A Perspective from Social Network Analysis. Ecol. Indic. 2022, 142, 109147. [Google Scholar] [CrossRef] [Scilit]
- Huang, Y.; Wang, Z.; Zhao, H.; You, D.; Wang, W.; Peng, Y. Spatial Association Network of Land-Use Carbon Emissions in Hubei Province: Network Characteristics, Carbon Balance Zoning, and Influencing Factors. Land 2025, 14, 1329. [Google Scholar] [CrossRef] [Scilit]
- Lin, X.; Liu, C.; Zhang, L.; Kuang, B.; He, Q. Spatiotemporal Dual-Network Assessment of Land-Use Carbon Metabolism in Hubei Province: An Integrated ENA-SNA Framework. Appl. Geogr. 2026, 193, 104062. [Google Scholar] [CrossRef] [Scilit]
- Liang, X.; Liu, Z.; Zhai, L.; Ji, L.; Feng, Y.; Sang, H. Spatial Terrestrial Carbon Emissions/Sequestrations Evolution Based on Ecological Network Analysis in Beijing-Tianjin-Hebei Urban Agglomeration. Ecol. Eng. 2023, 189, 106914. [Google Scholar] [CrossRef] [Scilit]
- Li, A.; Yin, X.; Wei, H. Spatiotemporal Evolution and Driving Factors of the Relationship Between Land Use Carbon Emissions and Ecosystem Service Value in Beijing-Tianjin-Hebei. Land 2025, 14, 1698. [Google Scholar] [CrossRef] [Scilit]
- Lv, W.; Xie, Y.; Zeng, P. Assessing and Predicting Spatiotemporal Alterations in Land-Use Carbon Emission and Its Implications to Carbon-Neutrality Target: A Case Study of Beijing-Tianjin-Hebei Region. Land 2024, 13, 2066. [Google Scholar] [CrossRef] [Scilit]
- Wang, C.; Zhan, J.; Zhang, F.; Liu, W.; Twumasi-Ankrah, M.J. Analysis of Urban Carbon Balance Based on Land Use Dynamics in the Beijing-Tianjin-Hebei Region, China. J. Clean. Prod. 2021, 281, 125138. [Google Scholar] [CrossRef] [Scilit]
- Chen, J.; Li, J.; Li, G.; Zhang, J. How to Recognize and Characterize Land Use-Based Carbon Emissions within City Networks in the Beijing-Tianjin-Hebei Region of China. Urban Clim. 2024, 53, 101789. [Google Scholar] [CrossRef] [Scilit]
- Chen, J.; Zhang, J.; Li, J.; Li, S. Spatio-temporal Pattern of Carbon Emissions and Its Driving Factors in the Beijing-Tianjin-Hebei Region. Acta Ecol. Sin. 2024, 44, 2270–2283. (In Chinese) [Google Scholar] [CrossRef]
- Ye, C.; Ming, T. Land Use Carbon Emissions Estimation and Carbon Emissions Control Strategy Effect Scenario Simulation in Zhejiang Province. Heliyon 2023, 9, e20783. [Google Scholar] [CrossRef] [Scilit] [PubMed]
- Li, A.; Yin, X.; Wei, H. Spatiotemporal Evolution of Carbon Emission from Land Use and Its Driving Factors at the County in Beijing-Tianjin-Hebei. Huan Jing Ke Xue 2025, 46, 5391–5402. (In Chinese) [Google Scholar] [CrossRef] [Scilit] [PubMed]
- Zhou, R.; Hong, W. Spatial Correlation and Optimization Zoning of Carbon Emission from Land Use in Guangdong Province from the Perspective of Social Network Analysis. Huan Jing Ke Xue 2025, 46, 5403–5414. (In Chinese) [Google Scholar] [CrossRef] [Scilit] [PubMed]
- Zhang, Z.; Zhu, J.; Yang, L.; Lu, N. Toward Dual Carbon Targets: Spatial Correlation on Comprehensive Carbon Emission Index in Urban Agglomerations Based on a New Evaluation Model. J. Clean. Prod. 2024, 458, 142507. [Google Scholar] [CrossRef] [Scilit]
- Yang, X.; Zhu, L. Spatial Correlation Network of China’s Carbon Emissions and Its Influencing Factors: Perspective from Social Network Analysis. J. Clean. Prod. 2025, 516, 145671. [Google Scholar] [CrossRef] [Scilit]
- Carley, K.M.; Prietula, M.J. Computational Organization Theory; Psychology Press: England, UK, 2014; ISBN 978-1-317-78115-8. [Google Scholar]
- Yang, X.; Zhu, L.; Yu, Z. Spatial Correlation Network of Carbon Emissions in City Clusters from the Perspective of Social Network Analysis: Empirical Data from China’s Jing-Jin-Ji Region. Energy Rep. 2026, 15, 109123. [Google Scholar] [CrossRef] [Scilit]
- Yang, Y.; Yang, M.; Zhao, B.; Lu, Z.; Sun, X.; Zhang, Z. Spatially Explicit Carbon Emissions from Land Use Change: Dynamics and Scenario Simulation in the Beijing-Tianjin-Hebei Urban Agglomeration. Land Use Policy 2025, 150, 107473. [Google Scholar] [CrossRef] [Scilit]
- Sun, X.; Li, M.; Hou, S.; Zhang, C. Research on the Spatial Network Characteristics, Synergistic Emission Reduction Effects and Mechanisms of Carbon Emission in Beijing-Tianjin-Hebei Urban Agglomeration. Sustainability 2023, 15, 8176. [Google Scholar] [CrossRef] [Scilit]
- Wang, L.; Zhang, M.; Song, Y. Research on the Spatiotemporal Evolution Characteristics and Driving Factors of the Spatial Connection Network of Carbon Emissions in China: New Evidence from 260 Cities. Energy 2024, 291, 130448. [Google Scholar] [CrossRef] [Scilit]
- Zhao, H.; Cheng, Y.; Wang, D.; Zheng, R. Spatial Evolution of Green Technology Cooperation among Three Major Urban Agglomerations in China and Its Carbon Emission Reduction Effect. J. Nat. Resour. 2024, 39, 1341–1357. (In Chinese) [Google Scholar] [CrossRef] [Scilit]
- Artime, O.; Grassia, M.; De Domenico, M.; Gleeson, J.P.; Makse, H.A.; Mangioni, G.; Perc, M.; Radicchi, F. Robustness and Resilience of Complex Networks. Nat. Rev. Phys. 2024, 6, 114–131. [Google Scholar] [CrossRef] [Scilit]
- Wang, Y.; Li, W.; Li, G.; Tan, S. Assessing the Impact of Regional Coordinated Development on a Low-Carbon Future: Evidence from the Beijing-Tianjin-Hebei Coordinated Development Strategy. J. Clean. Prod. 2024, 481, 144140. [Google Scholar] [CrossRef] [Scilit]
- Du, H.; Zhao, L.; Zhang, P.; Li, J.; Yu, S. Ecological Compensation in the Beijing-Tianjin-Hebei Region Based on Ecosystem Services Flow. J. Environ. Manag. 2023, 331, 117230. [Google Scholar] [CrossRef] [Scilit] [PubMed]
- Meng, F.; Zhou, Z.; Zhang, G.; Jiao, C.; Kan, Y.; Zhao, L. Land Space Ecological Restoration Zoning Based on Ecosystem Service Supply and Demand and Ecological Resilience: A Case Study in the Beijing-Tianjin-Hebei Region. Chin. J. Eco-Agric. 2023, 31, 1496–1510. (In Chinese) [Google Scholar] [CrossRef]
- Xia, S.; Yang, Y. Spatio-Temporal Differentiation of Carbon Budget and Carbon Compensation Zoning in Beijing-Tianjin-Hebei Urban Agglomeration Based on the Plan for Major Function-Oriented Zones. Acta Geogr. Sin. 2022, 77, 679–696. (In Chinese) [Google Scholar] [CrossRef]
- Zhang, G.; Liu, W.; Duan, H. Environmental Regulation Policies, Local Government Enforcement and Pollution-Intensive Industry Transfer in China. Comput. Ind. Eng. 2020, 148, 106748. [Google Scholar] [CrossRef] [Scilit]
- Wen, W.; Deng, Z.; Ma, X.; Xing, Y.; Pan, C.; Liu, Y.; Zhang, H.; Tharaka, W.A.N.D.; Hua, T.; Shen, L. Analysis of the Synergistic Benefits of Typical Technologies for Pollution Reduction and Carbon Reduction in the Iron and Steel Industry in the Beijing-Tianjin-Hebei Region. Sci. Rep. 2024, 14, 12413. [Google Scholar] [CrossRef] [Scilit] [PubMed]

Disclaimer/Publisher’s Note: The statements, opinions and data contained in all publications are solely those of the individual author(s) and contributor(s) and not of MDPI and/or the editor(s). MDPI and/or the editor(s) disclaim responsibility for any injury to people or property resulting from any ideas, methods, instructions or products referred to in the content. |
© 2026 by the authors. Licensee MDPI, Basel, Switzerland. This article is an open access article distributed under the terms and conditions of the Creative Commons Attribution (CC BY) license.