


Abstract
The spatial mismatch between tourism resources and tourism vitality represents one of the key constraints on the high-quality development of regional tourism. Taking 77 county-level administrative units in Heilongjiang Province as the study area, this research utilizes panel data from 2019 to 2024 to evaluate tourism resource endowment and tourism vitality through the entropy-weighted TOPSIS method. A coupling coordination degree model, quadrant classification approach, and spatial autocorrelation analysis are employed to identify spatial mismatch patterns. Furthermore, a progressive analytical framework integrating XGBoost-based nonlinear modeling, SHAP interpretability analysis, and Geodetector-based spatial validation is constructed to identify the main explanatory factors and nonlinear associations related to these mismatch patterns. The results reveal that: (1) significant spatial mismatches exist between tourism resources and tourism vitality across counties in Heilongjiang Province. The overall coupling coordination degree remains at a low coordination level and exhibits a distinct core–periphery spatial structure; (2) four categories of mismatch units are identified, including high high matching, resource-leading mismatch, vitality-leading mismatch, and low low matching types. These categories display pronounced spatial clustering characteristics, with a sharp contrast between the high-value clusters in the Harbin metropolitan area and border regions and the low-value clusters in western Suihua; (3) the number of hotels shows the highest explanatory contribution in the model, showing a clear threshold-like pattern, while border ports demonstrate a sparse but important association pattern; (4) strong interaction relationships exist among explanatory variables, with nearly 30% of the model’s explanatory power originating from synergistic multi-factor interactions; and (5) Geodetector analysis further confirms the spatial explanatory power of the major explanatory factors and the significance of multivariate interaction effects. This study provides policy references for optimizing the allocation of tourism resources and enhancing tourism vitality in underdeveloped border regions.
1. Introduction
Tourism has increasingly become an important pathway for promoting regional transformation, economic diversification, and local development. Particularly in regions facing industrial restructuring and developmental constraints, tourism is often regarded as a strategic instrument for regional revitalization and the enhancement of local resilience. However, the abundance of tourism resources does not necessarily translate into corresponding tourism vitality or development performance. International tourism studies have demonstrated that resource abundance alone does not guarantee tourism development performance, because destination competitiveness also depends on accessibility, service capacity, and market connectivity [1,2,3]. In many regions, areas endowed with rich natural and cultural resources have failed to generate tourism activities and economic dynamism commensurate with their resource advantages, whereas some areas with relatively limited resource endowments have achieved higher levels of tourism development through improvements in infrastructure, stronger market connectivity, and more effective spatial governance [4,5,6,7]. This phenomenon suggests the existence of a spatial mismatch between tourism resources and tourism vitality, whereby resource advantages are not effectively transformed into development advantages.
The mismatch between resource endowments and development vitality has become an important issue for understanding regional development disparities. Tourism resources can be viewed as a form of spatial capital embedded within specific geographical contexts; however, their contribution to regional vitality depends on a variety of conditions, including transportation accessibility, economic foundations, service capacity, and institutional support. Consequently, identifying the spatial patterns of tourism resource–tourism vitality mismatch and uncovering the mechanisms underlying their formation are essential not only for understanding the efficiency of resource transformation but also for providing a theoretical basis for differentiated regional development strategies.
The county scale offers a particularly valuable perspective for examining this issue. Compared with large metropolitan areas, which generally benefit from diversified economic functions, stronger market attractiveness, and more comprehensive public services, counties—especially peripheral and border areas—tend to rely more heavily on local resource endowments while simultaneously facing multiple constraints, such as inadequate infrastructure, population outmigration, and industrial transition pressures [8]. Therefore, explaining why similar tourism resource conditions lead to divergent tourism development outcomes is of considerable significance for enhancing regional tourism competitiveness and promoting spatially coordinated development.
Existing studies have generated substantial insights into tourism resource assessment and tourism development evaluation. Comprehensive evaluation methods, coupling coordination models, and spatial statistical approaches have been widely employed to investigate the relationship between tourism resources and tourism economic development. Nevertheless, several limitations remain.
First, previous studies have focused primarily on either tourism resource endowments or tourism development outcomes, while paying insufficient attention to the process through which resource advantages are transformed into tourism vitality and to the spatial mismatch that arises when such transformation fails. Second, most existing studies are based on linear analytical frameworks and tend to overlook threshold effects and nonlinear associations in tourism development processes. For example, improvements in infrastructure and market expansion may only exert substantial effects on tourism vitality after reaching certain critical thresholds. Third, although tourism development exhibits strong spatial characteristics, the spatial heterogeneity of influencing factors across different regions has not been adequately explored, thereby limiting the development of targeted and region-specific policy interventions.
Heilongjiang Province provides a representative case for examining the mismatch between tourism resources and tourism vitality. As China’s northernmost province, Heilongjiang possesses abundant tourism resources, including ice-and-snow landscapes, forests, wetlands, and border-related attractions [9,10]. Relevant cultural and tourism plans have also identified ice-and-snow tourism, eco-tourism, and border tourism as important directions for promoting regional transformation and development. At the same time, the province has long faced challenges such as population decline, economic restructuring, and uneven regional development, resulting in pronounced disparities in tourism development among counties. Against this background, this study seeks to address three key questions: (1) What spatial patterns characterize the mismatch between tourism resources and tourism vitality at the county level? (2) Which factors influence the transformation of tourism resources into tourism vitality? (3) Do nonlinear threshold effects and interaction relationships exist among these influencing factors?
To address the aforementioned research gaps, this study examines 77 county-level administrative units in Heilongjiang Province using multi-source data covering the period from 2019 to 2024. It systematically investigates the spatial mismatch patterns between tourism resources and tourism vitality and their nonlinear association characteristics. First, an entropy-weighted TOPSIS approach is employed to construct composite indices of tourism resources and tourism vitality. These indices are subsequently integrated with a coupling coordination degree model and a four-quadrant classification method to identify different types of resource–vitality mismatch regions. Second, considering the complexity and nonlinear characteristics of tourism development, an integrated analytical framework combining the XGBoost algorithm, SHAP interpretability analysis, and Geodetector is developed to identify the nonlinear associations, threshold characteristics, and interaction relationships of key influencing factors. Finally, differentiated optimization strategies are proposed for various mismatch types to facilitate more balanced and sustainable tourism development.
This study contributes to the existing literature in three major ways. First, it moves beyond conventional evaluations of tourism resources or tourism development performance by focusing on the spatial mismatch arising during the transformation of tourism resource advantages into tourism vitality, thereby providing new empirical evidence for understanding uneven tourism development in peripheral regions. Second, by integrating machine-learning-based nonlinear modeling, interpretable analytical techniques, and spatial factor detection methods, the study identifies the complex association patterns through which multiple factors are related to tourism vitality. Third, by identifying threshold effects and spatially heterogeneous impacts of key determinants, the study offers practical policy implications for improving tourism resource utilization efficiency and promoting coordinated regional development.
2. Literature Review
2.1. Measurement of Tourism Resources and Tourism Vitality
The quantitative assessment of tourism resource endowment constitutes a fundamental topic in tourism geography. Its methodological framework has evolved from single-indicator evaluations to multidimensional comprehensive assessment approaches. Early studies commonly measured regional tourism resource abundance using indicators such as the number and grade of tourist attractions, including A-level scenic spots and World Heritage sites. Although straightforward, such approaches were limited in their ability to capture the overall quality and development potential of tourism resources. With methodological advancements, multi-criteria decision-making techniques—including the Analytic Hierarchy Process (AHP), entropy-weighted TOPSIS, and factor analysis—have been increasingly adopted to evaluate tourism resource endowment from multiple dimensions, such as resource quantity, quality, structural composition, and development conditions [11,12].
Compared with tourism resource endowment, tourism vitality emphasizes the actual occurrence and dynamic performance of tourism activities. Existing studies have mainly examined tourist volume, activity intensity, spatial agglomeration, and tourist-source attraction [13,14]. Accordingly, this study defines tourism vitality as the comprehensive manifestation of tourism activities within a given region in terms of flow scale, sustained activity level, spatial agglomeration, and external attraction range. The measurement of tourism vitality has similarly undergone a transition from traditional statistical indicators to data-driven approaches. Earlier studies primarily relied on official statistics, such as tourism revenue and tourist arrivals, to evaluate tourism development performance. While these indicators reflect the overall scale of the tourism economy, they are often constrained by inconsistencies in statistical standards, reporting delays, and limited spatial granularity [15]. In recent years, the emergence of multi-source big data—including search engine indices (e.g., Baidu Index), social media check-in records, and online booking data—has provided new opportunities for measuring tourism vitality. These datasets enable a more refined understanding of market dynamics and spatial differentiation in tourism activities [15,16,17,18]. Nevertheless, concerns regarding data representativeness and potential biases remain, making multi-source data integration and cross-validation increasingly important for improving measurement reliability.
2.2. Spatial Mismatch Between Tourism Resources and Tourism Vitality
The relationship between tourism resources and tourism vitality is far from a simple linear correspondence. The spatial mismatch between the two has become a central concern in tourism geography [19,20]. Early studies mainly focused on the spatial distribution of either tourism resources or tourism activity, with relatively limited attention paid to their interactive relationship. As spatial analytical methods have advanced, increasing attention has been directed toward the matching and coordination of tourism system elements. For example, Jiang et al. identified a positive synergistic relationship between cultural tourism resources and regional economic development in the Wuling Mountain Area [21], while Tian et al. examined the mismatch between destination image and tourism resources in China [22]. Previous international studies have also emphasized that tourism development exhibits strong spatial heterogeneity, with peripheral and less-developed regions often facing constraints in transforming tourism resources into economic benefits [19,20].
Spatial mismatch theory provides an important analytical framework for understanding such spatial inconsistencies. Originally proposed by Kain [23] to explain the spatial separation between residential locations and employment opportunities in urban areas, the theory has subsequently been extended to tourism studies. It has been applied to investigate mismatches between tourism resources and tourism economic performance, as well as between tourism resource endowment and online attention, among other tourism-related phenomena [22,24,25].
Methodologically, two major approaches have been employed to quantify spatial mismatch. The first is the Spatial Mismatch Index (SMI), which directly measures the direction and magnitude of mismatch through relative deviations [26]. The second is the Coupling Coordination Degree (CCD) model, which indirectly reflects the matching relationship by evaluating the coordination level between two systems [27,28]. Although both approaches provide useful insights, neither explicitly captures the spatial dependence and clustering characteristics associated with mismatch patterns.
In reality, tourism activities exhibit strong spatial spillover effects. Cross-regional tourist flows, destination alliances, and shared infrastructure networks generate interdependencies among neighboring regions, resulting in spatially correlated tourism development outcomes [29]. Ignoring such spatial dependence may not only lead to biased statistical estimates but also hinder a comprehensive understanding of mismatch formation mechanisms. Spatial autocorrelation analysis offers an effective means of identifying these spatial relationships. Through the combined use of Global Moran’s I and Local Indicators of Spatial Association (LISA) proposed by Anselin, a complete analytical framework of “global testing–local identification” has been established [30,31,32]. In particular, bivariate spatial autocorrelation can reveal spatial association patterns between two variables and has been widely applied in studies examining relationships between urbanization and ecological environments, as well as ecosystem services and human well-being [33,34]. However, its application to tourism resource–tourism vitality mismatch remains relatively limited.
2.3. Influencing Factors and Analytical Paradigm of Coupling Coordination
Understanding the influencing relationships underlying the coupling coordination between tourism resources and tourism vitality is crucial for explaining spatial mismatches and formulating effective policy interventions. Existing studies have developed relatively mature indicator systems encompassing multiple dimensions, including economic development, transportation accessibility, policy support, and resource endowment [29,35]. From a methodological perspective, research in this field has evolved from linear analytical frameworks toward nonlinear modeling approaches and from global-average analyses toward investigations of spatial heterogeneity.
Early studies primarily relied on linear econometric models, such as Ordinary Least Squares (OLS), panel regression models, and Spatial Durbin Models (SDM), to examine the significance and direction of influencing factors on coupling coordination [36,37,38,39]. These methods provide strong interpretability and operational simplicity, contributing substantially to the understanding of tourism development mechanisms. However, linear models assume constant marginal effects among variables and therefore struggle to capture threshold effects, diminishing marginal returns, and abrupt changes that are frequently observed in real-world tourism systems.
With advances in computational capacity, machine-learning algorithms such as Random Forest and Extreme Gradient Boosting (XGBoost) have increasingly been introduced into tourism research [40,41,42]. These approaches offer powerful tools for modeling complex nonlinear relationships. Nevertheless, machine-learning models are often criticized for their “black-box” nature. Although they generally achieve superior predictive performance, their lack of interpretability limits theoretical insights and policy applicability.
The development of explainable artificial intelligence (XAI) has provided new opportunities to address the trade-off between predictive accuracy and interpretability. Among various methods, SHapley Additive exPlanations (SHAP), grounded in cooperative game theory, enables additive interpretation of model outputs by quantifying the marginal contribution of each feature and illustrating how these contributions vary across different value ranges. Consequently, SHAP facilitates a more transparent understanding of complex nonlinear relationships. Recent studies have begun applying the XGBoost–SHAP framework to tourism demand forecasting and tourist satisfaction analysis [43,44]. However, its application to tourism spatial mismatch research remains largely unexplored.
Meanwhile, increasing attention has been devoted to the role of spatial heterogeneity in shaping tourism development processes. As an effective tool for identifying drivers of spatial differentiation, the Geodetector method quantifies the explanatory power of individual factors and detects interaction effects among variables. It has been widely applied in studies of rural tourism, eco-tourism, and related fields [45,46,47]. Nevertheless, Geodetector also has inherent limitations. Factor detection evaluates only the explanatory power of variables without explicitly quantifying the direction, magnitude, or threshold characteristics of their effects. Similarly, interaction detection identifies enhancement or weakening effects between pairs of factors but cannot fully capture the dynamic nonlinear mechanisms associated with multi-factor synergies.
Based on the above studies, this paper argues that the spatial mismatch between tourism resources and tourism vitality reflects the uneven process through which resource endowments are transformed into tourism development vitality. Although tourism resources constitute the foundation of regional tourism development, their effects depend not only on the quantity or grade of resources, but also on the combined influence of transportation accessibility, service reception capacity, market foundations, population support, and local governance. At the county level, especially in cold-region border counties experiencing population shrinkage, spatial differences in resource bases, market connections, and service support conditions often make it difficult for tourism resource advantages to be evenly transformed into tourism vitality across different areas. Therefore, it is necessary not only to identify the matching status between resources and vitality, but also to further reveal the spatial dependence characteristics of mismatch patterns and the relationships among their influencing factors. Although existing studies have accumulated rich experience in analyzing the influencing factors of coupling coordination, a single method often struggles to simultaneously achieve high nonlinear fitting accuracy, transparent interpretation of factor relationships, and effective identification of spatial heterogeneity. Accordingly, this study develops a progressive analytical framework integrating XGBoost-based nonlinear modeling, SHAP-based explainable analysis, and Geodetector-based spatial validation. By combining the strengths of these three methods, this framework explains the spatially uneven relationship between tourism resources and tourism vitality in cold-region border counties.
3. Materials and Methods
All figures and tables in this study were prepared based on the study scope, data sources, and model outputs described in this section.
3.1. Analytical Framework
This study follows a logical sequence of “spatial mismatch identification–nonlinear mechanism exploration–spatial heterogeneity validation–policy implications” to construct an integrated analytical framework for examining the mismatch between tourism resources and tourism vitality at the county level (Figure 1). Firstly, the entropy-weighted TOPSIS method is employed to calculate composite indices of tourism resources and tourism vitality. The Coupling Coordination Degree (CCD) model, combined with quadrant classification and spatial autocorrelation analysis, is then used to identify mismatch types and characterize their spatial patterns. Second, after evaluating the limitations of conventional linear approaches using an OLS benchmark model, XGBoost regression, SHAP interpretation analysis, and Friedman’s H-statistic are introduced to identify nonlinear relationships, interaction effects, and threshold characteristics of key influencing factors. Third, the Geodetector method is applied to validate the explanatory power of dominant factors, assess interaction enhancement effects, and examine their temporal evolution from the perspective of spatial heterogeneity. Finally, based on the identified mismatch types and nonlinear interaction patterns, differentiated optimization pathways are proposed, thereby establishing a complete analytical loop from phenomenon diagnosis to policy implementation. This framework enables a more comprehensive understanding of how tourism resources are transformed into tourism vitality and provides a methodological foundation for evidence-based regional tourism development strategies.
Figure 1.
Research framework.
3.2. Study Area
Heilongjiang Province is located in the northern part of Northeast China (121°11′–135°05′ E, 43°26′–53°33′ N). It is the northernmost and coldest province in China. The region is characterized by prominent ice-and-snow tourism resources and serves as a core destination for winter tourism in China. In addition, Heilongjiang borders Russia, with a 2981 km international boundary and 12 Class-A national ports, indicating substantial potential for border tourism development. However, as a typical old industrial base, Heilongjiang Province has faced severe population shrinkage in recent years. Between 2010 and 2020, the permanent resident population decreased by 16.9%, and most county-level administrative units have experienced continuous population outflows. This persistent outmigration has imposed significant constraints on local tourism service supply capacity, tourism market demand, and fiscal revenue. Against this background, this study takes 77 county-level administrative units in Heilongjiang Province (including counties, county-level cities, and municipal districts) as the research units (Figure 2) to examine the spatial mismatch between tourism resources and tourism vitality, as well as its nonlinear influencing relationships. The findings are expected to provide empirical evidence and policy implications for tourism spatial optimization in similar cold-region border areas.
Figure 2.
Study area map.
3.3. Construction of Evaluation System and Data Sources
To characterize the coordination relationship between tourism resources and tourism vitality as well as the influencing relationships of coordination degree, this study constructs an evaluation system consisting of dependent variables (Table 1) and independent variables. The dependent variable is the coupling coordination degree between tourism resources and tourism vitality.
Table 1.
Construction of the Dependent Variable Evaluation System.
3.3.1. Tourism Resource Evaluation System
To comprehensively represent the quantity, grade, and characteristics of county-level tourism resources, five indicators are selected from two dimensions: resource endowment and development potential. These include: (1) A-level scenic spots (scored by grade and aggregated); (2) ice-and-snow tourism resources (scored by grade and aggregated); (3) number of intangible cultural heritage items; (4) number of key villages and towns for rural tourism; and (5) cultural relic protection units (weighted scores for national and provincial-level sites are aggregated). The raw data were obtained from the official website of the Heilongjiang Provincial Department of Culture and Tourism.
3.3.2. Tourism Vitality Evaluation System
Tourism vitality is used to measure actual tourist visitation behavior and its spatial characteristics. Four indicators are selected: annual Weibo check-in volume, number of check-in days per year, spatial concentration of check-ins, and number of origin cities of tourists. These indicators respectively reflect the scale of tourist flow, temporal activity intensity, spatial balance of check-in locations, and the breadth of the tourist catchment area. The data were obtained from the Sina Weibo Open Platform API, based on location-based service (LBS) check-in records from 2019 to 2024. The dataset was processed through deduplication, removal of local users, spatial filtering, and temporal standardization before analysis [48]. First, duplicate records were identified and removed based on user ID, check-in time, and check-in location. Second, daily activity records of local residents were identified and excluded according to the spatial relationship between users’ registered locations and the study area, thereby reducing the interference of local user check-ins in identifying tourism activities. Finally, the check-in records were aggregated and standardized by year to ensure the comparability of indicators across different years and counties.
3.3.3. Explanatory Variables
This study selects 10 explanatory variables from six dimensions: economic level, demographic characteristics, transportation accessibility, reception capacity, border attributes, and government behavior (Table 2).
Table 2.
Construction of the Explanatory Variable Evaluation System.
Among them, per capita GDP and GDP growth rate are used to reflect the level of county-level economic development. Population density and the average annual population change rate represent market potential and population shrinkage trends. The number of external transportation stations and the road distance to the nearest civil airport are used to characterize transportation accessibility. The number of hotels and travel service enterprises is used to measure tourism reception capacity. The number of border ports reflects the potential for cross-border tourism. Government attention reflects the degree of emphasis placed by local governments on tourism development. It was measured by the frequency of the term “tourism” in the municipal-level 13th and 14th Five-Year Plans for National Economic and Social Development. Specifically, the 13th Five-Year Plan was used for 2019–2020, and the 14th Five-Year Plan was used for 2021–2024. The municipal-level word-frequency results were then matched to the corresponding counties to characterize local governments’ policy attention to tourism development. The data for each variable were obtained from the Heilongjiang Statistical Yearbook, statistical bulletins of each county, POI datasets, transportation authorities, the Border Port Office of the Heilongjiang Provincial Department of Commerce, and municipal-level Five-Year Plans for National Economic and Social Development [49,50,51,52,53,54,55,56,57].
3.4. Study Method
3.4.1. Entropy-Weighted TOPSIS
In this study, the entropy-weighted TOPSIS method is employed to calculate the comprehensive scores of tourism resources (RE) and tourism vitality (TV) for each county on an annual basis. First, all indicators are normalized to eliminate dimensional differences. Then, the entropy value and entropy weight of the -th indicator are calculated as follows:
where is the proportion of the standardized value. The weighted normalized matrix is obtained by multiplying standardized data by entropy weights. The positive ideal solution and negative ideal solution are then determined. Distances from each unit to the positive and negative ideal solutions are calculated as and . The comprehensive score is obtained based on the relative closeness:
3.4.2. Coupling Coordination Degree Model
To quantify the coordination between tourism resources and tourism vitality, the coupling coordination degree model is introduced. First, RE and TV of each county in each year are standardized to obtain and , both ranging from [0, 1]. The coupling degree and coordination index are then calculated:
The coupling coordination degree is calculated as:
ranges from [0, 1]. A higher value indicates a higher coordination level between tourism resources and tourism vitality, while a lower value indicates a more severe spatial mismatch.
3.4.3. Four-Quadrant Classification Method
To further distinguish mismatch types, a four-quadrant classification method based on the medians of RE and TV is applied. For each year, the median values of RE () and TV () are calculated across all counties. Counties with RE or TV equal to the median are classified into the high-value group. According to the following rules, all counties are classified into four types:
- High resource–high vitality (high–high matching): RE ≥ and TV ≥ ;
- High resource–low vitality (resource-leading matching): RE ≥ and TV < ;
- Low resource–high vitality (vitality-leading matching): RE < and TV ≥ ;
- Low resource–low vitality (low–low matching): RE < and TV < .
The four-quadrant classification reflects the nature of spatial mismatch, while the coupling coordination degree (D) measures its intensity. The two methods are complementary.
3.4.4. Spatial Autocorrelation Analysis
To examine whether spatial dependence exists in the mismatch intensity across counties, Global Moran’s I and Local Indicators of Spatial Association (LISA) are applied. A spatial weight matrix is constructed based on the Queen contiguity criterion. The Global Moran’s I is calculated as:
where is the coupling coordination degree (D) of county , and is the element of the spatial weight matrix. A significance level is assessed using 999 Monte Carlo permutation tests. If and , significant positive spatial autocorrelation of D is indicated. LISA is used to identify local spatial clustering patterns for each county. The significance is also tested using 999 permutations.
3.4.5. Linear Benchmark Model and Multicollinearity Diagnosis
To evaluate the performance improvement of subsequent nonlinear models and test the validity of linear relationships, a linear regression model is first constructed as a benchmark. To avoid bias in coefficient estimation caused by multicollinearity, the variance inflation factor (VIF) is used to diagnose explanatory variables. The VIF for variable is calculated as:
where is the coefficient of determination obtained by regressing variable on all other explanatory variables. VIF < 10 indicates no severe multicollinearity.
On this basis, three OLS models are estimated: pooled OLS, year fixed-effects OLS, and two-way fixed-effects OLS. The pooled OLS model is specified as:
where is the coupling coordination degree, is the vector of explanatory variables, and is the coefficient vector to be estimated. The year fixed-effects model introduces year dummy variables , while the two-way fixed-effects model further includes county fixed effects to control for time-invariant county heterogeneity and time-specific shocks:
By comparing the goodness-of-fit between OLS and XGBoost models, the necessity of nonlinear modeling is validated.
3.4.6. XGBoost Regression Model
XGBoost iteratively adds regression trees to fit the residuals from the previous iteration. For a dataset with samples and features, the model output is an ensemble of trees [58]:
where denotes the space of regression trees and is the feature vector of sample . The objective function consists of a loss function and a regularization term:
where is the squared loss function, is the number of leaf nodes, is the leaf weight, and and are regularization parameters used to control model complexity and prevent overfitting.
The model is optimized using a gradient boosting framework, with column subsampling and shrinkage applied to improve generalization ability.
After grid search tuning, the final parameter settings are: max depth = 4, learning rate = 0.1, number of estimator = 120, subsample ratio = 0.8, colsample bytree = 0.8, minimum child weight = 3, and minimum loss reduction = 0.1. Five-fold cross-validation is used to evaluate model performance, with R2, root mean square error (RMSE), and mean absolute error (MAE) as evaluation metrics.
To interpret the “black-box” output of XGBoost, SHapley Additive exPlanations (SHAP) [59] are introduced. Based on cooperative game theory, SHAP decomposes the contribution of each feature to the prediction into an additive form, with properties of consistency and local accuracy. For a single observation, the SHAP value of feature satisfies:
where is the average model output over all samples. In this study, the mean absolute SHAP value is used to measure global feature importance, and SHAP dependence plots are employed to identify threshold effects. Furthermore, SHAP interaction value matrices are used to quantify pairwise interaction strength among variables. The mean absolute interaction values are computed, and the proportion of interaction effects in total explanatory power is calculated.
3.4.7. Friedman’s H Statistic
To avoid dependence on a specific explainer, Friedman’s H statistic is used to independently validate interaction effects from the perspective of model structure. This statistic measures the extent to which the joint effect of two features on the model output cannot be explained by the sum of their individual effects. The calculation is given as:
where denotes the partial dependence function of feature after fixing all other features. The value of ranges from [0, 1], with higher values indicating stronger interaction effects. The cross-validation between SHAP and Friedman’s H statistic enhances the robustness of the conclusions regarding nonlinear mechanisms.
3.4.8. Geodetector Analysis
To reveal the explanatory power of each factor on the spatial heterogeneity of D and its interaction effects, the Geodetector method is applied. This method is a tool for spatial variance analysis, does not rely on linear assumptions, and is suitable for detecting the contribution of categorical variables or discretized continuous variables to spatial stratification.
Factor detector: The q-statistic is used to measure the explanatory power of each variable on the spatial distribution of D, calculated as:
where is the number of strata of variable , and are the sample size and variance of stratum , and and are the total sample size and variance. The q-value ranges from [0, 1], with higher values indicating stronger explanatory power. Continuous variables are discretized using quantile-based binning. Variables with low cardinality, such as the number of border ports, are retained in their original form. Significance is tested using 999 Monte Carlo permutations.
Yearly detector: q-values are calculated for each year to examine the temporal evolution of explanatory power from 2019 to 2024.
Interaction detector: This part evaluates whether the combined effect of two factors enhances the explanatory power for D. The joint q-value is compared with and to determine the type of interaction.
4. Results
4.1. Spatial Mismatch Pattern Between Tourism Resources and Tourism Vitality
4.1.1. Spatial Distribution Characteristics
From 2019 to 2024, the spatial patterns of tourism resources and tourism vitality at the county level in Heilongjiang Province remained relatively stable. The distribution of high-value and low-value clusters showed no structural change, with only local fluctuations in intensity. The year 2024 is used as a representative case for detailed analysis (Figure 3).
Figure 3.
(a) Spatial distribution of RE values in 2024. (b) Spatial distribution of TV values in 2024.
The comprehensive tourism resource index calculated using the entropy-weighted TOPSIS model shows pronounced spatial heterogeneity. In 2024, counties with high tourism resource endowment include Shangzhi City, Wudalianchi City, Ning’an City, Acheng District, Hailin City, Mohe City, and Suifenhe City. These areas are concentrated in three major clusters: The first cluster is the peri-Harbin region, centered on Shangzhi City, Acheng District, and Wuchang City, where high-grade scenic resources and ice-and-snow tourism resources are aggregated around the provincial capital. The second is the southeastern border region, represented by Ning’an City, Hailin City, and Suifenhe City, characterized by forest ecosystems, border tourism resources, and core attractions such as Jingpo Lake and Snow Town. The third is the northern border region, represented by Mohe City and Tahe County, relying on Arctic tourism resources, boreal forest ecosystems, and iconic landscapes such as Beiji Village and the First Bend of the Longjiang River.
The spatial distribution of tourism vitality is partially similar to that of tourism resources but also shows clear differences. In 2024, counties with high tourism vitality include Mohe City, Hulan District, Bin County, Fuyuan City, and Shangzhi City. High-value clusters of tourism vitality are mainly concentrated in two regions: The first is the Harbin metropolitan periphery (e.g., Hulan District, Bin County, Acheng District), driven by a large local consumption market and high transportation accessibility. The second is border tourism hotspots (e.g., Mohe City, Fuyuan City, Suifenhe City), supported by distinctive border culture and polar landscapes. In contrast, most counties in western and central Heilongjiang, particularly in Suihua and Qiqihar prefectures, exhibit persistently low tourism vitality.
Tourism resources and tourism vitality do not exhibit full spatial correspondence. High-value clusters overlap in both the Harbin metropolitan area and the northern border region, indicating the basic supporting role of resources in shaping vitality. However, spatial mismatch is widely observed in other regions.
From a temporal perspective, the spatial pattern of tourism resources remained largely stable during 2019–2024, reflecting the relative rigidity of natural and cultural heritage endowments. In contrast, tourism vitality exhibited noticeable dynamics. The clustering around the Harbin metropolitan area slightly strengthened, with peri-urban counties such as Hulan and Bin benefiting from the growth of short-distance and weekend tourism. Border regions experienced greater fluctuations due to the COVID-19 pandemic and port policy restrictions, with a general decline in 2020–2021 followed by recovery after 2023. Traditional agricultural counties in western Heilongjiang, such as Suihua, remained at consistently low levels without significant improvement.
4.1.2. Spatiotemporal Evolution and Spatial Clustering of Coupling Coordination Degree
To quantitatively characterize the matching level between tourism resources and tourism vitality, the coupling coordination degree model is used to measure the coordination level of the two systems. The results (Table 3) show that the mean value of coupling coordination degree (D) at the county level in Heilongjiang Province from 2019 to 2024 is 0.381, which falls within the low coordination range, indicating generally low efficiency in the transformation from resources to vitality. Spatially, a clear polarization pattern is observed (Figure 4). A small number of counties, such as Mohe City and Shangzhi City, maintain a relatively high coordination level with D values above 0.6 over time, while about 15% of counties, such as Nancha County and Baiquan County, have D values below 0.2, indicating severe imbalance. High-coordination counties are mainly located in resource-rich border areas with ice-and-snow, forest, wetland, or border tourism resources, or around the provincial capital, whereas low-coordination counties are concentrated in western Suihua, a traditional agricultural region with severe population loss. This spatial differentiation is highly consistent with the distribution patterns of regional economic base and transportation accessibility. Similar spatial heterogeneity has also been observed in international tourism development studies, where tourism benefits and competitiveness vary significantly among regions due to differences in accessibility, economic conditions, and development capacity [19,20].
Table 3.
Changes in coupling coordination degree (D) and ranking of bipolar counties (2019, 2021, 2024).
Figure 4.
(a) Spatial distribution of coupling coordination degree (D) in 2019. (b) Spatial distribution of coupling coordination degree (D) in 2021. (c) Spatial distribution of coupling coordination degree (D) in 2024.
To test whether the coupling coordination degree exhibits spatial dependence, Global Moran’s I is applied (Table 4). The results show that the mean Global Moran’s I of D from 2019 to 2024 is 0.174. All yearly values are positive and statistically significant at the 5% level (p < 0.05), confirming the temporal stability of spatial dependence. The coupling coordination degree of tourism resources and vitality exhibits significant positive spatial autocorrelation, indicating a clustered pattern of “high–high” and “low–low” values rather than random distribution.
Table 4.
Global Moran’s I and p-values for Different Years.
Local spatial autocorrelation (LISA) further reveals the clustering patterns of coupling coordination degree (Figure 5). First, high-coordination clusters are mainly concentrated in two regions: (1) the outer Harbin metropolitan area, including Acheng District, Shangzhi City, Wuchang City, and Shuangcheng District, forming a high-coordination cluster centered on the provincial capital; and (2) Mohe City in the Greater Khingan Range, which acts as an isolated high-value hotspot driven by its distinctive combination of Arctic tourism, boreal forest landscapes, and polar ice-and-snow resources. Second, low-coordination collapse clusters are highly concentrated in western Suihua, including Anda City, Baiquan County, Hailun City, Mingshui County, and Yi’an County, forming a contiguous low-coordination zone. This reflects a spatial spillover effect of dual shortages in both resources and vitality under a shrinkage context. Third, low–high transition areas are sporadically distributed in Yanshou County and Tahe County. These counties are surrounded by high-coordination units but maintain relatively low coordination levels, representing marginal “shadow zones” that fail to absorb spillover effects from neighboring regions. Fourth, the high–low spatial outlier is represented by Wudalianchi City. Wudalianchi has abundant tourism resources, particularly volcanic landforms and geological heritage resources, and relatively high tourism vitality, while several neighboring counties have only moderate tourism resource endowments and particularly low tourism vitality. As a result, its high coordination level is not connected to a broader high-value cluster but is surrounded by counties with relatively low coordination levels. This discontinuous spatial pattern creates an “island-like” development feature, in which a prominent tourism node remains spatially isolated from the weaker tourism development of its surrounding areas. This indicates that high-quality tourism resource nodes can generate relatively high tourism vitality locally. However, when surrounding counties face multiple restrictive conditions, such nodes may struggle to promote continuous regional coordinated development, eventually forming a spatially isolated pattern in which high-value nodes are embedded within low-coordination areas.
Figure 5.
LISA cluster map of coupling coordination degree (D) in 2024.
4.1.3. Types of Spatial Mismatch
Based on the coordination level measurement, the four-quadrant classification method is further used to identify specific types of spatial mismatch. Using the median values of RE and TV in each year as thresholds, 77 counties are classified into four types: high–high matching, resource-leading mismatch, vitality-leading mismatch, and low–low matching (Figure 6). Different mismatch types reflect differences between tourism resource endowment and the local conditions through which resource advantages are translated into tourism vitality. High high matching counties generally have a strong resource base, such as ice-and-snow resources, border ports, forest ecosystems, or distinctive cultural resources, together with relatively favorable transportation and reception conditions, making it easier to achieve resource-vitality coordination. Resource-leading mismatch counties may possess resources such as forests, wetlands, rural tourism assets, or cultural heritage, but their resource advantages have not yet been fully converted into tourist activities. These resource types do not directly determine tourism vitality; rather, they represent the resource foundation, while their contribution to tourism vitality is strongly influenced by accessibility, accommodation capacity, tourism services, and market connectivity. Therefore, similar tourism resource endowments may result in different levels of tourism vitality under different transformation conditions. Vitality-leading mismatch counties may achieve relatively high tourism vitality by relying on spillover tourist flows from central cities or locational advantages, despite relatively limited local tourism resource endowments, but they often lack high-grade local tourism resources and in-depth experiential products. Low low matching counties usually have both a weak resource base and limited conversion conditions, and therefore face stronger constraints in improving tourism vitality.
Figure 6.
(a) County-level coordination types in 2019. (b) County-level coordination types in 2021. (c) County-level coordination types in 2024.
The results (Table 5) show that the matching structure remains relatively stable during the study period. High–high matching accounts for approximately 32.0%, low–low matching for 30.7%, while resource-leading mismatch and vitality-leading mismatch each account for 18.6%. This indicates that about one-third of counties exhibit a favorable matching state between resources and vitality, another one-third remain at a low level for both dimensions, and the remaining one-third show different forms of mismatch. In terms of interannual variation, the number of high–high matching counties remains stable at 21–26, and low–low matching counties at 20–25. The two mismatch types fluctuate between 13 and 18 counties each, indicating a generally stable structure.
Table 5.
Changes in the number of each county type and the mean coupling coordination degree (D).
The spatial distribution of mismatch types shows clear regional differentiation. (1) High–high matching counties are concentrated in the outer Harbin metropolitan area, including Acheng District, Shangzhi City, Wuchang City, and Shuangcheng District, as well as border tourism destinations represented by Mohe City and Fuyuan City. This pattern may be associated with the large source market and high accessibility of the provincial capital, as well as the distinctive attractiveness of unique ice-and-snow and border cultural resources in border regions. For example, Mohe City is characterized by Arctic tourism, boreal forests, and ice-and-snow resources, whereas Fuyuan City combines border tourism, wetland ecosystems, and the easternmost sunrise landscape, jointly supporting relatively high tourism vitality. (2) Resource-leading mismatch counties are scattered in Daqingshan County, Lanxi County, Muling City, and Gannan County. These counties possess certain resource endowments, including forest landscapes, wetlands, rural tourism resources, and local folk culture, but are constrained by remote location, poor accessibility, weak infrastructure, or homogeneous tourism products, preventing effective transformation of resources into vitality. In these counties, relatively abundant natural or cultural resources provide a potential foundation for tourism development, but limited accessibility and service capacity restrict their conversion into sustained tourist flows and tourism consumption. This represents a typical resource under-conversion pattern. (3) Vitality-leading mismatch counties are represented by Zhaodong City, Beilin District, and Nenjiang City. These counties generally have moderate or weak tourism resource endowments but are located near major vitality centers such as Harbin and Qiqihar. They may benefit from spillover tourist flows from core cities, but lack distinctive local tourism resources, implying potential sustainability risks. Their local resources are mainly composed of suburban leisure spaces, agricultural landscapes, and small-scale cultural attractions, which can support short-distance tourism but provide relatively limited destination distinctiveness. Therefore, their tourism vitality may depend more strongly on locational and market advantages than on the attractiveness of local tourism resources. (4) Low–low matching counties are highly concentrated in western Suihua, including Baiquan County, Hailun City, Mingshui County, and Yi’an County. These areas are characterized by weak economic foundations, severe population outflow, and scarce tourism resources. Existing resources mainly consist of ordinary agricultural landscapes, dispersed rural cultural resources, and locally significant heritage sites, which have not yet formed distinctive tourism products or stable market attraction. The combination of limited resource distinctiveness and weak transformation conditions contributes to the persistence of low tourism vitality.
Overall, different mismatch types are associated with different combinations of tourism resource characteristics and development conditions. These results indicate that tourism resources provide the foundation for tourism development, whereas tourism vitality depends on the extent to which these resources can be effectively transformed under different accessibility, service, and market conditions. Resource-leading mismatch areas usually possess distinctive natural or cultural tourism resources but lack sufficient transformation capacity, whereas vitality-leading mismatch areas often benefit from stronger accessibility, service, or market connections despite relatively limited resource advantages.
4.2. Nonlinear Association Characteristics
The variable codes and their meanings used in this study are reported in Table 1 and Table 2. Specifically, the evaluation indicators of tourism resources and tourism vitality are listed in Table 1, while the codes and meanings of the explanatory variables are provided in Table 2.
4.2.1. Linear Benchmark Model and Its Limitations
Before exploring nonlinear associations, a linear regression model is constructed as a benchmark. Multicollinearity diagnostics show that the variance inflation factor (VIF) of all explanatory variables is below 10 (Table 6), indicating no severe multicollinearity. On this basis, pooled OLS, year fixed-effects, and two-way fixed-effects models are estimated sequentially. Results from the pooled OLS and year fixed-effects models indicate that variables such as the number of hotels, external transportation stations, border ports, and government attention are significantly positive, suggesting that infrastructure and policy support have positive effects on coupling coordination degree. However, in the two-way fixed-effects model controlling for both county and time effects, almost all variables become statistically insignificant, and the overall model fit is relatively low (R2 = 0.25). This may be due to threshold effects in the explanatory variables, where their promoting effects only emerge after supporting infrastructure reaches a certain level. Linear models assume constant marginal effects and therefore fail to capture such nonlinear dependencies. Overall, the linear model is insufficient to explain the complex association pattern of coupling coordination degree, indicating the need for methods capable of capturing nonlinearities and interaction effects.
Table 6.
VIF of explanatory variables.
4.2.2. XGBoost Model and Feature Importance
To overcome the limitations of linear models, an XGBoost regression model is employed. Five-fold cross-validation results show that the model achieves a mean R2 of 0.801 (SD = 0.018), mean RMSE of 0.077 (SD = 0.005), and mean MAE of 0.057 (SD = 0.003). The variation across folds is minimal, indicating strong stability and generalization ability. The performance is significantly better than the two-way fixed-effects OLS model, confirming that the relationship between explanatory variables and coupling coordination degree (D) is predominantly nonlinear.
Based on Gain-based feature importance (Table 7), C7 ranks first with a value of 0.238 and is identified as the most influential factor affecting D. The SHAP mean absolute value ranking (Figure 7) also places C7 first. However, C9 shows a notable discrepancy: it ranks second in Gain but drops to the bottom in SHAP importance. This discrepancy is driven by the extreme sparsity of C9 data: only 15.6% of counties have border ports. In tree-based splitting, a small number of border counties can substantially reduce impurity, resulting in high Gain values, while their contribution to the overall prediction across all samples remains limited, leading to low SHAP values. This reflects the “sparse but decisive” nature of C9: it has almost no effect on non-border counties, but plays a critical role in interaction with C7 within the 12 border counties. Other variables, such as C6, C5, and C10, show consistent rankings between Gain and SHAP, indicating relatively stable and globally pervasive effects.
Table 7.
Gain importance of explanatory variables and mean absolute SHAP values with rankings.
Figure 7.
SHAP feature importance summary plot.
4.2.3. SHAP Threshold Effects and Interaction Effects
To further identify nonlinear effect boundaries of explanatory variables on D, SHAP dependence plots are used to analyze changes in marginal effects (Figure 8). In the dependence plots, the critical point where SHAP values shift from negative to positive (or vice versa) is defined as the threshold at which a variable begins to contribute positively to D. Results show that for C7, SHAP values are mostly negative or near zero when below 672.5 units. After exceeding this threshold, contributions become consistently positive, indicating a scale threshold for accommodation capacity. For C6, SHAP values decrease with increasing distance, with a main turning point at 49.3 km. When the distance exceeds 150 km, SHAP values are generally negative, indicating a decay effect of accessibility. For C5, the main threshold is 10 stations. Below this value, negative contributions dominate; above it, positive effects emerge. For C9, the main threshold is 0. Positive contributions appear only when the number of ports is ≥1, while 76.4% of SHAP values are negative, confirming its “sparse but decisive” characteristic. Other variables such as C8, C10, and C1 show relatively small mean absolute SHAP values or unclear thresholds, indicating limited direct explanatory power for D. These threshold effects suggest that in cold-region shrinking counties, improving accessibility and accommodation capacity requires not only increasing low-level infrastructure but also strengthening their coordinated development.
Figure 8.
(a) SHAP dependence plot of C7. (b) SHAP dependence plot of C6. (c) SHAP dependence plot of C9. (d) SHAP dependence plot of C5.
SHAP interaction analysis is used to compute the mean absolute interaction values between all variable pairs. The strongest interaction is C6C7 (0.01013), accounting for approximately 13% of the main effect of C7 (0.0763). Other strong interactions include C7C10, C5C7, C7C8 and C6C7. The total contribution of interaction effects accounts for 28.1% of the overall explanatory power of the model, indicating that nearly one-third of predictive performance comes from synergistic effects among variables. Ignoring interaction effects would substantially underestimate the underlying mechanism.
4.2.4. Validation Using Friedman’s H Statistic
To avoid dependence on a specific interpreter for SHAP interaction results, Friedman’s H statistic is further applied to independently quantify interaction strength from the perspective of the XGBoost model structure. The highest interaction value is observed for C5C7 (0.129), followed by C7C9 (0.112), C7C10 (0.112), C6C7 (0.106), and C7C8 (0.104). Among the top five interaction pairs, C7 is involved in all cases, confirming its role as a central “interaction hub”. Table 8 reports the top 15 interaction pairs identified by both methods. The results show strong consistency in identifying key interaction structures, while discrepancies exist for some pairs. This reflects the different emphases of the two measures: SHAP captures average contribution and is influenced by feature distribution, whereas Friedman’s H measures structural interaction strength and is more sensitive to sparse features. The cross-validation between SHAP and Friedman’s H provides multiple lines of evidence, improving the robustness of the findings.
Table 8.
Top 15 interaction pairs based on SHAP analysis and Friedman’s H statistic.
4.3. Spatial Heterogeneity and Interaction Relationships
The previous sections identify the nonlinear influencing factors of coupling coordination degree (D) and their interaction effects using XGBoost and SHAP. However, these analyses are mainly based on global average effects and do not reveal spatial heterogeneity in explanatory power or spatial interaction enhancement mechanisms among factors. Therefore, this section further validates and complements the above findings using the Geodetector method from a spatial heterogeneity perspective. The meanings of the variable codes below are consistent with those provided in Table 2.
4.3.1. Factor Detector: Spatial Differentiation of Core Influencing Factors
The results of the factor detector (Figure 9) show a clear gradient in the explanatory power of each variable on the spatial heterogeneity of D. C7, C5, and C8 rank as the top three dominant factors, followed by C6, C9, C1, and C10, while C3, C2, and C4 fail to pass the significance test. This ranking is highly consistent with the XGBoost feature importance results, confirming the robustness of the core influencing factors. C7 ranks first with a q-value of 0.344, far exceeding other variables, indicating that accommodation capacity is the key factor determining the spatial differentiation of resource-to-vitality transformation in cold-region shrinking counties. This is consistent with the SHAP results, where C7 is identified as an “interaction hub.” It also explains why the Harbin metropolitan area forms a high-coordination core, while western Suihua remains a low-coordination collapse zone: the former generally exceeds 600 hotels, whereas the latter is mostly below 200. C5 and C8 follow, indicating that transportation connectivity and tourism service supply are also important contributors to spatial differences in D. C9 shows a significant but relatively low q-value. Combined with its low SHAP importance, this further confirms its “sparse but decisive” nature: it has almost no effect in non-border counties, but plays a key role in a small number of border counties. C1 and C10 show moderate but significant q-values, suggesting that economic base and policy support contribute to spatial differentiation but are not dominant drivers. C3, C2, and C4 are not significant, indicating that population-related shrinkage variables do not directly manifest as spatial differentiation in D. Their effects may be indirectly transmitted through intermediate channels such as hotel investment or transport demand.
Figure 9.
Results of the factor detector.
The yearly factor detector further reveals the temporal evolution of explanatory power. The q-value of C7 remains stable between 0.33 and 0.36 over six years, with minimal fluctuation, indicating a stable and fundamental role in shaping spatial differentiation of coupling coordination degree. The q-value of C5 increases from 0.168 in 2019 to 0.305 in 2024, reflecting the post-pandemic rise in self-driving tourism and increased investment in county-level transportation, indicating that accessibility is becoming increasingly important. The q-value of C8 peaks at 0.335 in 2020, as COVID-19 intensifies spatial disparities in enterprise survival. It then declines and stabilizes at 0.21–0.23, suggesting a short-term shock effect. The q-value of C9 increases from 0.023 in 2019 to 0.099 in 2024, associated with gradual relaxation of port policies, but remains limited due to overall low openness. The q-value of C10 is relatively higher in 2020 and 2023–2024, reflecting the supportive role of policy intervention during critical periods. Overall, transportation infrastructure and border openness are expected to play an increasingly important role in future tourism coordination development, while accommodation capacity remains an indispensable foundational factor.
4.3.2. Interaction Detector: Nonlinear Enhancement Effects
The interaction detector results show that all 45 interaction pairs exhibit nonlinear enhancement or bi-factor enhancement effects, with no independent or weakening relationships observed. Table 9 reports the top 25 interaction pairs ranked by strength. This indicates that the spatial differentiation of coupling coordination degree (D) is not driven by any single factor, but is instead the result of widespread multi-factor synergy. The strongest interaction pairs are highly consistent with SHAP interaction analysis and Friedman’s H statistics, providing cross-validation and improving robustness. Among all interactions, combinations involving accessibility and accommodation capacity consistently show strong effects. In addition, economic and demographic variables also exhibit indirect roles. Although variables such as C1, C2, and C4 are not significant in the single-factor q-statistics, their interactions with C7 and C6 show clear nonlinear enhancement effects, indicating that population concentration not only reflects market demand but also amplifies the marginal contributions of accessibility and accommodation capacity. Overall, any improvement in a single factor may be constrained by weaknesses in other factors, whereas multi-factor synergy can generate a multiplicative effect. Combined with the four-quadrant classification and LISA results, the interaction detector further explains the formation mechanisms of different spatial patterns.
Table 9.
Interaction q-values and interaction types of explanatory variable pairs.
In high–high matching counties such as the Harbin metropolitan area, both tourism accommodation capacity and transportation accessibility are within advantageous ranges. Strong interactions such as C6C7 and C5C7 indicate that the combined effect of accessibility and accommodation capacity far exceeds their individual contributions. In addition, interactions such as C7C10 and C1C7 show nonlinear enhancement, suggesting that economic level and policy support significantly amplify positive effects once accommodation capacity reaches a threshold. The C3C7 interaction indicates that higher population density increases the marginal returns of hotel investment. The accumulation of these synergistic effects contributes to the formation of high-coordination cores.
In low–low matching counties in western Suihua, hotel capacity is generally insufficient, distances to airports are large, external transport stations are scarce, and population density is low with continuous outflow. The C6C7 interaction also applies in low-value regions: when both variables are at low levels, D is further suppressed. Interactions such as C3C6 and C3C7 also show nonlinear enhancement, but weak population density, long distances, and insufficient hotel supply amplify negative effects. The C4C7 interaction indicates that population outflow not only reduces market demand but also creates a vicious cycle by lowering hotel investment returns. The accumulation of multiple weaknesses and reinforcing interactions jointly locks these counties into low-coordination traps.
Resource-leading mismatch counties such as Yanshou County, Tahe County, and Gannan County typically suffer from bottlenecks in key variables. For example, Fangzheng County is relatively close to airports but has not reached the threshold for C7, and external transport stations are of low grade. Tahe County, although adjacent to Mohe City and theoretically able to benefit from spillover demand, has extremely low C7 and scarce C5, limiting effective transformation. These bottlenecks prevent strong synergistic interactions such as C6C7 and C5C7 from being fully activated, resulting in lower D compared with surrounding high–high matching counties. Although interactions such as C4C6 and C1C3 also show nonlinear enhancement, weak economic bases and unstable population changes further weaken synergy effects.
Vitality-leading mismatch counties such as Zhaodong City, Beilin District, and Nenjiang City benefit from spillover tourist flows from surrounding cities, resulting in relatively high vitality. However, the lack of high-quality local tourism resources leads to low tourism experience quality. Although proximity to transport hubs is advantageous, the C7C8 interaction is insufficient, and homogeneity is high. Low-end economy hotels and low-price one-day tour operators fail to transform flows into stays, reinforcing a “transit corridor” rather than a “destination” function. In addition, although C7C10 and C6C10 show nonlinear enhancement effects, policy attention in these counties is limited and tends to focus on “attracting visitors” rather than “retaining visitors,” further weakening the upgrading effect of accommodation and accessibility. Thus, although multiple nonlinear interactions exist, they fail to form a positive feedback loop due to weak resource quality and short-term policy orientation, resulting in lower D than high–high matching counties.
Border counties also show differentiated patterns. C9 exhibits a “sparse but decisive” characteristic, the C7C9 interaction shows strong nonlinear enhancement, indicating that the promoting effect of ports depends heavily on supporting accommodation capacity. Mohe City and Suifenhe City, with relatively high hotel capacity, exhibit strong synergy between ports and accommodation. In contrast, Raohe County and Jiayin County fall below the threshold of C7, resulting in weak synergy. The C5C9 interaction is also nonlinear and enhancing, suggesting that supporting services such as travel agencies are important. However, these counties generally have a limited number of tourism service enterprises, further constraining the transformation efficiency of border advantages.
5. Robustness Checks
Due to substantial missing data on domestic and inbound tourist arrivals at the county level, it is difficult to construct a continuous and complete county-level sample. Therefore, this study uses prefecture-level city data in Heilongjiang Province, for which data are relatively more available, as an external reference to conduct a supplementary reliability test of the Weibo check-in data. Considering that some city-year observations are still missing, Pearson correlation analysis and Spearman rank correlation analysis were conducted based on 59 valid city-year samples, using domestic and inbound tourist arrivals and contemporaneous Weibo check-ins from 2019 to 2024. The Pearson correlation coefficient was used to examine the degree of linear association between the two variables, while the Spearman rank correlation coefficient was used to assess the consistency of their ranking relationship. The results show that the Pearson correlation coefficient between domestic and inbound tourist arrivals and Weibo check-ins is 0.8596, while the Spearman rank correlation coefficient is 0.7563, both significant at the 0.001 level. This indicates a strong consistency between Weibo check-in data and traditional tourism scale indicators, thereby providing partial support for the rationality of using Weibo check-ins as a proxy variable for tourism vitality.
To reduce the potential simultaneity between explanatory variables and tourism vitality, this study further conducted lagged-variable tests and variable-exclusion tests (Table 10). First, the explanatory variables were lagged by one period, using the previous year’s explanatory variables to explain the current year’s resource-vitality coupling coordination degree. Second, based on the original same-year dataset, supply-side variables, including the number of hotels, the number of tourism service enterprises, government attention, the number of external transport stations, and distance to the nearest airport, were excluded under several alternative combinations. The results show that the cross-validated R-squared of the full same-year model is 0.628, while that of the one-period lagged model is 0.584. Although the explanatory power declines within a reasonable range, the overall model fit remains stable, suggesting that the main results are not entirely driven by same-year simultaneity. The variable-exclusion tests further show that the model results remain generally stable, although different variables have varying effects on model explanatory power. When the number of tourism service enterprises, government attention, and the number of external transport stations are excluded separately, the change in model explanatory power is relatively limited. When the number of hotels and distance to the nearest airport are excluded separately, the explanatory power declines but remains at an acceptable level, indicating that these two variables make relatively high explanatory contributions. The combined exclusion results further show that removing both the number of hotels and distance to the nearest airport leads to a relatively larger decline in explanatory power, but the model does not lose its explanatory capacity. Changes under the remaining exclusion combinations are relatively limited. Overall, the variable-exclusion tests support the stability of the main explanatory structure of the model. The above results are mainly used to indicate the explanatory contributions and statistical associations of different factors with differences in resource-vitality coupling coordination, rather than to directly identify strict unidirectional causal effects.
Table 10.
Results of the Variable-Exclusion Test.
In the OLS regression, year fixed effects were included to control for common annual shocks. To further examine the influence of the COVID-19 pandemic and border control shocks on the main explanatory model results, this study retrained the XGBoost model after excluding the samples from 2020, 2021, and 2020–2021, respectively. The results show that the cross-validated R-squared of the full-sample model is 0.628, while the corresponding values after excluding 2020, 2021, and 2020–2021 are 0.657, 0.609, and 0.635, respectively. The model explanatory power remains broadly consistent with the full-sample results, indicating that the shock years did not dominate the model results and that the main explanatory structure of this study is relatively stable under different sample settings.
6. Discussion
Consistent with previous studies highlighting the important roles of transportation accessibility [60,61], reception capacity, and economic foundations in tourism development, the results of this study also indicate that transport stations, the number of hotels, and the level of economic development are important factors associated with the resource-vitality coupling coordination relationship. This result is consistent with international studies emphasizing the importance of tourism infrastructure and accessibility for destination competitiveness, while this study further reveals their nonlinear threshold effects in shrinking border counties [6,7]. Further analysis shows that these factors do not operate in a simple linear manner, but instead exhibit certain threshold characteristics and spatial differentiation effects. This suggests that, in borderland shrinking counties, the conversion of tourism resources into tourism vitality is jointly constrained by the resource base, market conditions, service supply, and locational environment. Therefore, when proposing policy recommendations for different mismatch types, it is necessary to consider the combined differences in resource endowment, transportation accessibility, reception capacity, and market conversion conditions, and to develop differentiated pathways according to the dominant resource types, such as ice-and-snow resources, forests, wetlands, border ports, rural tourism, and intangible cultural heritage. Although the policy framework in this study is organized according to mismatch types, the specific intervention priorities should be adjusted according to the dominant tourism resource types within each county, because similar mismatch patterns may arise from different resource endowments and therefore require different development pathways.
For high–high matching counties, the policy focus should shift from “quantitative expansion” to “quality improvement.” Most high–high matching counties are characterized by nationally recognized tourism resources, including high-quality ice-and-snow resources (e.g., Mohe), border tourism resources (e.g., Suifenhe), and high-value ecological landscapes. These resource types already possess relatively strong market attractiveness and are supported by mature tourism service systems. Government attention and tourism service enterprises have also formed a combined policy-market effect, while some border counties further benefit from port advantages. Further expansion of hotel quantity may face diminishing marginal returns and even weaken destination attractiveness due to over-commercialization. Therefore, the priority should be upgrading hotels toward high-quality and differentiated development, introducing high-end tourism service enterprises, and developing four-season tourism products to reduce dependence on winter ice-and-snow tourism. For border high–high counties such as Mohe City and Suifenhe City, cross-border functions such as medical tourism and commodity exhibitions should be expanded to avoid homogenized competition among similar border ports.
For resource-leading mismatch counties, the core strategy is to “first fix the weakest constraint.” These counties are generally dominated by high-quality ecological, forest, wetland, mountainous, or border tourism resources, but these resource advantages have not yet been effectively transformed into tourism vitality. Different resource types may face different transformation constraints. Forest, wetland, and mountainous resources are often located far from major tourism markets and transport hubs, making external accessibility and last-mile connections particularly important. Border tourism resources depend more heavily on port connectivity and cross-border mobility, whereas ice-and-snow resources are strongly affected by seasonality and require product diversification to sustain demand beyond the winter season. More broadly, insufficient hotel capacity and weak external accessibility prevent effective transformation of resources into accessible tourism products. Low policy attention further limits marketing capacity, while seasonality amplifies off-season supply gaps. The accumulation of multiple constraints leads to long-term resource underutilization, and improvements in a single factor are often ineffective due to mismatches in other dimensions. Policy interventions should focus on targeted investment and threshold breaking. Hotel capacity should be expanded through investment attraction or fiscal subsidies, prioritizing counties closer to airports to reduce accessibility disadvantages. External transportation links and “last-mile” connectivity to scenic sites should be strengthened. Tourism should be clearly defined as a priority industry, and seasonal imbalance should be addressed through off-season product development. A reward-based subsidy mechanism can be used to support local entrepreneurship or cooperation with regional leading firms. When accommodation reception capacity reaches a certain scale, its synergistic relationship with accessibility and policy support may become more evident. Specific intervention priorities should reflect the dominant resource types. Ecological, forest, wetland, and mountainous destinations should coordinate conservation requirements with improvements in accessibility, accommodation, and low-impact tourism services. Border tourism destinations should place greater emphasis on port connectivity and cross-border tourism cooperation. Ice-and-snow destinations should diversify four-season products to reduce dependence on a short winter tourism cycle. When accommodation capacity, accessibility, and policy support reach a relatively coordinated level, the conversion of tourism resource advantages into tourism vitality may become more effective.
For vitality-leading mismatch counties, the key is to shift from “expansion” to “quality upgrading.” Tourism resources in these counties mainly consist of suburban recreational resources, agricultural landscapes, local cultural attractions, and leisure tourism resources, which are generally less distinctive than those in resource-rich counties. These counties are mainly located in the outer Harbin metropolitan area and benefit from spillover tourist flows, resulting in relatively high tourism vitality. However, low resource quality and homogeneous product structures lead to short stays and low per capita consumption, while also creating localized environmental pressure. Although hotel capacity is relatively sufficient, it is highly homogeneous, and tourism service enterprises are mainly concentrated in low-price one-day tours, failing to extend consumption chains. Policy emphasis should not be placed on further increasing hotel supply but on improving resource quality. Efforts should accelerate the upgrading or creation of A-level scenic spots, deepen intangible cultural heritage and folk culture resources, and develop immersive tourism experiences to extend length of stay. Digital tools should be used to optimize visitor flows and guide tourism service enterprises toward mid- and high-end transformation, designing multi-day itineraries that distribute tourists across secondary attractions. Public tourism funds can be allocated to supporting complementary industries such as specialty catering and night-time economy, promoting the transformation of transit flows into overnight stays. Policies should therefore focus on enhancing the uniqueness of existing resource types through cultural interpretation, experiential tourism, and creative product development rather than simply expanding tourism facilities.
For low–low matching counties, breaking the lock-in requires a dual strategy of “external support” and “internal breakthrough.” Tourism resources in these counties are generally limited and fragmented, consisting mainly of ordinary agricultural landscapes, small-scale rural cultural resources, and locally important heritage sites. These counties are mainly concentrated in western Suihua and represent a typical combination of population decline, weak economic base, and scarce tourism resources. Hotel capacity is generally below 200, tourism service enterprises are nearly absent, accessibility is weak, and government investment is limited, resulting in a low-level equilibrium characterized by “low resources–low investment–low vitality.” In such contexts, any single intervention is ineffective due to lack of supporting conditions, while dispersed investment yields limited returns. Policy design should abandon the idea of uniform development and instead concentrate resources on building one or two benchmark hotels, around which basic supporting services such as catering and retail can be developed, forming a “point-to-area” initiation effect. Given population shrinkage, large-scale investment is not advisable; instead, a small-and-specialized development path is more suitable, such as developing dispersed homestays using idle rural housing. Governments should clarify tourism development goals, actively seek provincial-level policy and promotional support, and gradually break the low-level equilibrium trap. Instead of pursuing large-scale tourism development, these resource types are more suitable for community-based tourism, rural homestays, and small-scale experiential tourism that match local demographic and market conditions.
Tourism development in border counties should place particular emphasis on the coordination mechanism between border ports and supporting facilities. The results indicate that the interaction effect between border ports and hotel capacity is significant, and the facilitating role of ports is highly dependent on accommodation provision. For border counties in resource-leading or vitality-leading mismatch states, such as Raohe County and Jiayin County, targeted enhancement programs should be implemented. These include tax incentives or interest subsidies for newly built hotels near ports, as well as the joint development of cross-border tourism routes with corresponding Russian border cities (e.g., Suifenhe–Vladivostok, Mohe–Russia border tourism), so as to transform locational advantages into sustainable cross-border tourist inflows. For high–high matching border counties, efforts should focus on consolidating existing advantages while expanding differentiated functions to avoid homogenized competition. It is noteworthy that although government attention in border counties is generally high, policy implementation often remains at a symbolic or “labeling” level. More concrete supporting measures, such as targeted hotel investment attraction and cross-border transport coordination, are therefore needed to better translate policy attention into actual development conditions.
7. Conclusions
This study takes 77 county-level administrative units in Heilongjiang Province as the case area and, based on panel data from 2019 to 2024, systematically investigates the spatial mismatch pattern and nonlinear influencing relationships of tourism resources and tourism vitality in cold-region shrinking border counties. By integrating the coupling coordination degree model, spatial autocorrelation analysis, XGBoost machine learning, SHAP interpretability analysis, and the Geodetector method, this study reveals the spatial mismatch patterns between tourism resources and tourism vitality in cold-region borderland shrinking counties, as well as their nonlinear association characteristics, from the perspective of converting different types of tourism resources into tourism vitality. The results show that the overall coupling coordination degree of tourism in Heilongjiang Province remains at a low coordination level, exhibiting a clear “core–periphery” spatial structure. The model results show that the influencing factors of coupling coordination are dominated by nonlinear relationships. Hotel capacity emerges as the most important “interaction hub,” while border ports play a “scarce but critical” role. Interaction effects among variables contribute nearly 30% of the model’s explanatory power. These findings indicate that spatial mismatch in tourism development in cold-region shrinking counties is not driven by a single factor, but is instead the result of a complex system shaped by resource endowment, transformation capacity, and spatial constraints.
This study has several limitations. First, the measurement of tourism vitality relies on multi-source big data integration. Although it effectively captures relative spatial differentiation, it cannot fully substitute for traditional statistics such as tourist arrivals and tourism revenue, and measurement accuracy still needs improvement. Second, although the combination of XGBoost and SHAP can identify nonlinear relationships and threshold effects, it remains essentially a correlation-based approach rather than a strict causal inference framework. Future research may be extended in the following directions. First, quasi-natural experiments such as high-speed rail openings and port upgrades can be used to more precisely identify the causal effects of accessibility and border openness on tourism coordination. Second, a multi-scale nested framework (province–city–county–scenic site) can be constructed to examine scale-dependent mechanisms of spatial mismatch. Third, system dynamics or agent-based modeling can be introduced to simulate the evolutionary pathways of the tourism resource–vitality system under different policy scenarios, providing more forward-looking decision support for regional tourism development. In addition, this study uses the counties of Heilongjiang Province as the case area. These findings also contribute to broader international discussions on tourism development in peripheral and resource-rich regions, but comparative studies in different national and regional contexts are still needed to further examine the applicability of the resource-vitality spatial mismatch framework.
Author Contributions
Conceptualization, W.L., S.G. and Y.G.; methodology, W.L., S.G. and Y.G.; software, Y.G.; formal analysis, W.L., S.G. and Y.G.; investigation, W.L., S.G. and Y.G.; resources, W.L. and Y.G.; data curation, Y.G.; writing—original draft preparation, Y.G.; writing—review and editing, W.L., Z.M., S.G. and Y.G.; supervision, W.L., Z.M., S.G. and Y.G. All authors have read and agreed to the published version of the manuscript.
Funding
This research was funded by the Heilongjiang Provincial Philosophy and Social Science Research Planning Project (grant numbers 24JYC010 and 24JYC013) and Funded by Key Laboratory of Territorial Spatial Planning and Development-Protection of the Ministry of Natural Resources of PRC and CAUPD Beijing Planning & Design Consultants LTD (grant number TSPDP25/05).
Data Availability Statement
The original contributions presented in the study are included in the article, further inquiries can be directed to the corresponding author.
Acknowledgments
We thank the editor and anonymous referees whose remarks have been very constructive and inspiring in preparing the final version of the paper. We are solely responsible for the opinions expressed in this paper.
Conflicts of Interest
The authors declare no conflicts of interest.
References
- Butler, R.W. The Concept of a Tourist Area Cycle of Evolution: Implications for Management of Resources. Can. Geogr./Géographies Can. 1980, 24, 5–12. [Google Scholar] [CrossRef] [Scilit]
- Cronjé, D.F.; Du Plessis, E. A Review on Tourism Destination Competitiveness. J. Hosp. Tour. Manag. 2020, 45, 256–265. [Google Scholar] [CrossRef] [Scilit]
- Kim, Y.R.; Liu, A.; Williams, A.M. Competitiveness in the Visitor Economy: A Systematic Literature Review. Tour. Econ. 2022, 28, 817–842. [Google Scholar] [CrossRef] [Scilit]
- Pan, Z.; Luo, Y.; Wang, Y.; Ji, J.; Lai, B. Coupling Coordination and Driving Mechanism between Tourism Development, Ecological Conservation and Digital Economy: Insights from Chinese 278 Cities. Sci. Rep. 2025, 15, 37445. [Google Scholar] [CrossRef] [Scilit] [PubMed]
- Zhang, S.; Zhang, G.; Ju, H. The Spatial Pattern and Influencing Factors of Tourism Development in the Yellow River Basin of China. PLoS ONE 2020, 15, e0242029. [Google Scholar] [CrossRef] [Scilit] [PubMed]
- Chan, W.C.; Lo, M.C.; Wan Ibrahim, W.H.; Mohamad, A.A.; Suaidi, M.K.B. The Effect of Hard Infrastructure on Perceived Destination Competitiveness: The Moderating Impact of Mobile Technology. Tour. Manag. Perspect. 2022, 43, 100998. [Google Scholar] [CrossRef] [Scilit]
- Chin, C.; Wong, W.; Wahap, D. Effects of Destination Appeal and Tourism Infrastructure on Rural Tourism Destination Competitiveness and Revisit Intention: A Study in Bario Kelabit Highland. Pak. J. Commer. Soc. Sci. 2022, 16, 366. [Google Scholar] [CrossRef] [Scilit]
- Ma, Z.; Zhou, G.; Zhang, J.; Liu, Y.; Zhang, P. Demographic Trends in China’s Northeast Borderlands: Shocks from Core-Periphery Relations and Border Effects. Cities 2025, 166, 106235. [Google Scholar] [CrossRef] [Scilit]
- Sun, X. The Development Strategy of Ice and Snow Tourism in Heilongjiang. Cross-Cult. Commun. 2015, 11, 53. [Google Scholar] [CrossRef] [PubMed]
- Wu, W.; Zhu, Y.; Zhang, C. The Assessment of Ice-Snow Tourism Resources Value and Its Realization Degree. I-Business 2013, 05, 30–35. [Google Scholar] [CrossRef]
- Hong, Y.; Tu, L.; Wan, M. Evaluation and Optimization Strategies for Provincial Culture and Tourism Integration from the Perspective of Landscape Narrative: A Case Study of Anhui Province, China. Land 2025, 14, 1398. [Google Scholar] [CrossRef] [Scilit]
- Peng, Y.; Luo, M.; Lin, J. Spatial Distribution Characteristics and Value Evaluation of Winter Tourism Resources in Yunnan Province. J. Yunnan Univ. (Nat. Sci. Ed.) 2025, 47, 856–866. (In Chinese) [Google Scholar]
- Zhou, M.; Yang, J. Geospatial Spatiotemporal Analysis of Tourism Facility Attractiveness and Tourism Vitality in Historic Districts: A Case Study of Suzhou Old City. Land 2025, 14, 922. [Google Scholar] [CrossRef] [Scilit]
- Hu, C.; Xu, L.; Cai, X.; Tian, D.; Zhuang, S. Research on the Spatiotemporal Pattern and Influencing Mechanism of Coastal Urban Vitality: A Case Study of Bayuquan. Buildings 2024, 14, 2173. [Google Scholar] [CrossRef] [Scilit]
- Adamiak, C.; Szyda, B. Combining Conventional Statistics and Big Data to Map Global Tourism Destinations Before COVID-19. J. Travel Res. 2022, 61, 1848–1871. [Google Scholar] [CrossRef] [Scilit]
- Jiang, H.; Wei, Y.; Mei, L.; Wang, Z. Multiscale Characteristics and Connection Mechanisms of Attraction Networks: A Trajectory Data Mining Approach Leveraging Geotagged Data. Chin. Geogr. Sci. 2024, 34, 533–547. [Google Scholar] [CrossRef] [Scilit]
- Yao, C.; Yang, G.; Lu, J. Online Attention Competition and Polarization Among Beijing’s 5A–Level Tourist Attractions: A Baidu Index—BCG Matrix Analysis for Sustainable Destination Management. Sustainability 2026, 18, 4178. [Google Scholar] [CrossRef] [Scilit]
- Teles Da Mota, V.; Pickering, C. Using Social Media to Assess Nature-Based Tourism: Current Research and Future Trends. J. Outdoor Recreat. Tour. 2020, 30, 100295. [Google Scholar] [CrossRef] [Scilit]
- Llorca-Rodríguez, C.M.; Chica-Olmo, J.; Casas-Jurado, A.C. The Effects of Tourism on EU Regional Cohesion: A Comparative Spatial Cross-Regressive Assessment of Economic Growth and Convergence by Level of Development. J. Sustain. Tour. 2021, 29, 1319–1343. [Google Scholar] [CrossRef] [Scilit]
- Almeida, A.; Golpe, A.; Justo, R. Regional Tourist Heterogeneity in Spain: A Dynamic Spatial Analysis. J. Destin. Mark. Manag. 2021, 21, 100643. [Google Scholar] [CrossRef] [Scilit]
- Jiang, J.; Chen, J.; Cai, X. Research on Spatial-Temporal Characteristics of Cultural Tourism Resource Supply-Demand Adaptation: A Case Study of Wuling Mountain Area. Hum. Geogr. 2025, 40, 161–171+184. (In Chinese) [Google Scholar] [CrossRef]
- Tian, L.; Wu, Z.; Wang, J.; Lu, J.; Yan, Z. The Spatial Mismatch and Influencing Factors Between Ecological Resilience and Tourism Economy in China’s Land Border Areas. Sustainability 2026, 18, 895. [Google Scholar] [CrossRef] [Scilit]
- Kain, J.F. Housing Segregation, Negro Employment, and Metropolitan Decentralization. Q. J. Econ. 1968, 82, 175. [Google Scholar] [CrossRef] [Scilit]
- Xiao, L.; Li, Q.; Dai, G.; Tang, M.; Zhang, Q. Research on the Evolution and Influencing Factors of “Resource-Sentiment-Preference” Spatial Mismatch of High A-Level Tourist Attractions in Guizhou: DeepLearning Based on Large Language Model. Tour. Sci. 2026, 1–20. (In Chinese) (Online First) [Google Scholar] [CrossRef]
- Fu, Z.; Jiang, H.; Qiao, J.; Jiang, X.; He, W. Gender Differences in Migrant Workers’ Wages and Their Influencing Factors in the Central Hilly Regions of China. Land 2023, 12, 1384. [Google Scholar] [CrossRef] [Scilit]
- Zuo, J.; Lan, L.; Luo, P. Evolution of Spatial Mismatch Between the Abundance and Online Attention of A-Level Tourist Attractions in Fujian Province: Evidence from Baidu Index (2011–2023). J. Fujian Norm. Univ. (Nat. Sci. Ed.) 2026, 42, 131–139. (In Chinese) [Google Scholar]
- Qin, Q.; Tang, X.; Wen, B. Empirical Study on the Coupling Mechanism of Tourism Development Level and Rural Revitalization in Yili Region. Arid. Land Geogr. 2026, 49, 1277–1287. (In Chinese) [Google Scholar]
- Yang, Y.; Xie, A.; Zhou, X.; Cheng, K. Research on the Evolution and influencing factors of the Coupling Relationship among Tourism Industry, Urbanization and Human Settlements of the Urban Agglomeration in the Middle Reaches of the Yangtze River. PLoS ONE 2024, 19, e0311384. [Google Scholar] [CrossRef] [Scilit] [PubMed]
- Zhang, X.; Zhang, J.; Wang, X.; Pan, J.; Zhang, M. The Spatiotemporal Pattern and influencing factors of Coupling Coordination between Ecological Civilization and Cultural Tourism Integration in the Yellow River Basin. J. Nat. Conserv. 2026, 91, 127210. [Google Scholar] [CrossRef] [Scilit]
- Anselin, L. Local Indicators of Spatial Association—LISA. Geogr. Anal. 1995, 27, 93–115. [Google Scholar] [CrossRef] [Scilit]
- Moran, P.A. Notes on Continuous Stochastic Phenomena. Biometrika 1950, 37, 17–23. [Google Scholar] [CrossRef] [Scilit]
- Tobler, W.R. A Computer Movie Simulating Urban Growth in the Detroit Region. Econ. Geogr. 1970, 46, 234. [Google Scholar] [CrossRef] [Scilit] [PubMed]
- Bi, Y.; Wang, Y.; Liu, X.; Liu, C.; Zheng, L. Anthropogenic and Natural Drivers of Ecosystem Services and Their Coupling Relationship with County-Scale Urbanization: Insights from the Yellow River Basin, China. Chin. Geogr. Sci. 2026, 36, 911–926. [Google Scholar] [CrossRef] [Scilit]
- Wang, K.; Zhao, Y.; Tan, J.; Guan, R.; Gan, C. Spatial Effect and Influence Mechanism of New Urbanization on Urban-Rural Income Gap in the Wuling Mountain Area. Trop. Geogr. 2025, 45, 386–398. (In Chinese) [Google Scholar] [CrossRef]
- Li, Z.; Qiuyi, B.; Ao, Z. Evaluation of Cultural and Tourism Industry Integration and Its Driving Mechanism in the Northeast Border Regions of China. J. Resour. Ecol. 2025, 16, 1116–1130. [Google Scholar] [CrossRef] [Scilit]
- Wang, Y.; Bai, H. The Impact and Regional Heterogeneity Analysis of Tourism Development on Urban-Rural Income Gap. Econ. Anal. Policy 2023, 80, 1539–1548. [Google Scholar] [CrossRef] [Scilit]
- Zhu, F.; Cao, X.; Zhuang, D.; Jin, S.; Gao, L.; Yang, X. Effects of Tourism on Local Green Environment in China: Economy for Environment? Environ. Dev. Sustain. 2024, 28, 14167–14192. [Google Scholar] [CrossRef] [Scilit]
- Tang, R. Digital Economy and Total Factor Productivity of Tourism Enterprises in China: The Perspective of Market Competition Theory. Curr. Issues Tour. 2024, 27, 76–91. [Google Scholar] [CrossRef] [Scilit]
- Wu, X.; Liang, X. Tourism Development Level and Tourism Eco-efficiency: Exploring the Role of Environmental Regulations in Sustainable Development. Sustain. Dev. 2023, 31, 2863–2873. [Google Scholar] [CrossRef] [Scilit]
- Alsulami, A.G.; Alharbi, A.; Khan, U.A.; Al-Hejri, A.M.; Alshamrani, S.S.; Almotiri, J. Predicting Tourism Growth in Saudi Arabia with Machine Learning Models for Vision 2030 Perspective. Sci. Rep. 2026, 16, 2556. [Google Scholar] [CrossRef] [Scilit] [PubMed]
- Fan, Y.; He, C.; Li, W.; Zhao, X. Coupling Coordinated Development between Inbound Tourism and Regional Economy: A Case Study of Yunnan Province. Acta Sci. Nat. Univ. Pekin. 2026, 62, 132–146. (In Chinese) [Google Scholar] [CrossRef]
- Jiang, H.; Mei, L.; Wei, Y.; Zheng, R.; Guo, Y. The Influence of the Neighbourhood Environment on Peer-to-Peer Accommodations: A Random Forest Regression Analysis. J. Hosp. Tour. Manag. 2022, 51, 105–118. [Google Scholar] [CrossRef] [Scilit]
- Kang, J.; Guo, X.; Fang, L.; Wang, X.; Fan, Z. Integration of Internet Search Data to Predict Tourism Trends Using Spatial-Temporal XGBoost Composite Model. Int. J. Geogr. Inf. Sci. 2022, 36, 236–252. [Google Scholar] [CrossRef] [Scilit]
- Antolini, F.; Cesarini, S.; Terraglia, I. Explaining Tourism Expenditure Patterns in Italy: A Comparative Study of Domestic and Incoming Tourists Using XGBoost and SHAP. Soc. Indic. Res. 2025, 180, 369–382. [Google Scholar] [CrossRef] [Scilit]
- Shen, W.; Chen, Y.; Rong, P.; Cao, W.; Yu, R.; Wang, P.; Cheng, J. Ecotourism Suitability at County Scale in China: Spatial Pattern, Obstacle Factors, and influencing factors. Ecol. Indic. 2025, 178, 113911. [Google Scholar] [CrossRef] [Scilit]
- Li, X. Seasonality of Rural Tourism: A Comparative Analysis of 33 Cities in China. Tour. Geogr. 2023, 25, 1359–1383. [Google Scholar] [CrossRef] [Scilit]
- Yang, Y.; Xie, A.; Cheng, K. Research on Spatio-Temporal Evolution Characteristics and influencing factors of Tourism Destination Environmental System Resilience in Yangtze River Economic Belt. Pol. J. Environ. Stud. 2024, 33, 5429–5441. [Google Scholar] [CrossRef] [Scilit]
- Gao, J.; Duan, X.; Wang, Q.; Yang, Z.; Zhong, R.; Yuan, X.; He, X. Spatial Mismatch Between Transportation Development and Tourism Spatial Vitality in Yunnan Province in the Context of Urban–Rural Integration. Land 2025, 14, 1017. [Google Scholar] [CrossRef] [Scilit]
- Heilongjiang Provincial Bureau of Statistics. Heilongjiang Statistical Yearbook; China Statistics Press: Beijing, China, 2020. (In Chinese)
- Heilongjiang Provincial Bureau of Statistics. Heilongjiang Statistical Yearbook; China Statistics Press: Beijing, China, 2021. (In Chinese)
- Heilongjiang Provincial Bureau of Statistics. Heilongjiang Statistical Yearbook; China Statistics Press: Beijing, China, 2022. (In Chinese)
- Heilongjiang Provincial Bureau of Statistics. Heilongjiang Statistical Yearbook; China Statistics Press: Beijing, China, 2023. (In Chinese)
- Heilongjiang Provincial Bureau of Statistics. Heilongjiang Statistical Yearbook; China Statistics Press: Beijing, China, 2024. (In Chinese)
- Heilongjiang Provincial Bureau of Statistics. Heilongjiang Statistical Yearbook; China Statistics Press: Beijing, China, 2025. (In Chinese)
- Statistical Bureaus of Heilongjiang Province. Statistical Bulletins on National Economic and Social Development of Counties, County-Level Cities, and Districts in Heilongjiang Province, 2019–2024; Statistical Bureaus of Heilongjiang Province: Harbin, China, 2024. (In Chinese)
- People’s Governments of Heilongjiang Province. The 13th Five-Year Plans for National Economic and Social Development of Prefecture-Level Cities in Heilongjiang Province; People’s Governments of Heilongjiang Province: Harbin, China, 2020. (In Chinese)
- People’s Governments of Heilongjiang Province. The 14th Five-Year Plans for National Economic and Social Development and Long-Range Objectives Through 2035 of Prefecture-Level Cities in Heilongjiang Province; People’s Governments of Heilongjiang Province: Harbin, China, 2025. (In Chinese)
- Chen, T.; Guestrin, C. XGBoost: A Scalable Tree Boosting System. In Proceedings of the ACM SIGKDD International Conference on Knowledge Discovery and Data Mining, 13–17 August 2016; Association for Computing Machinery: New York, NY, USA, 2016; pp. 785–794. [Google Scholar]
- Lundberg, S.M.; Lee, S.-I. A Unified Approach to Interpreting Model Predictions. Adv. Neural Inf. Process. Syst. 2017, 30, 4766–4775. [Google Scholar]
- Coppola, P.; Carbone, A.; Aveta, C.; Stangherlin, P. Assessing Transport Policies for Tourist Mobility Based on Accessibility Indicators. Eur. Transp. Res. Rev. 2020, 12, 56. [Google Scholar] [CrossRef] [Scilit]
- Erjavec, N.; Devčić, K. Accommodation Capacity, Trade Openness and International Tourism Demand in Croatia: Evidence from a Dynamic Panel Model. Tourism 2021, 70, 43–52. [Google Scholar] [CrossRef] [Scilit]
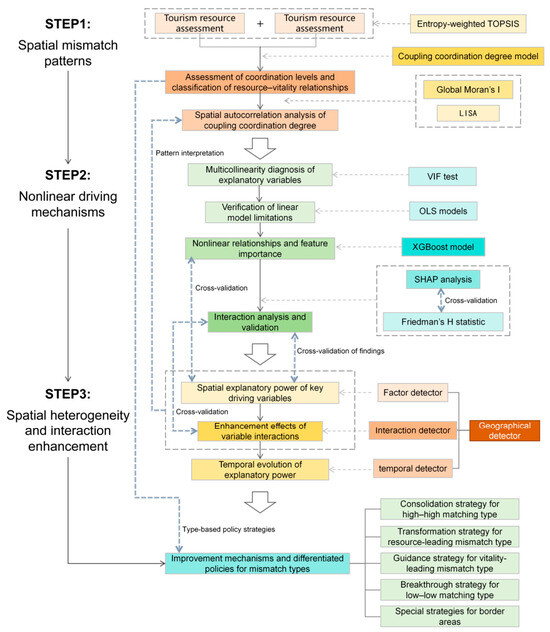
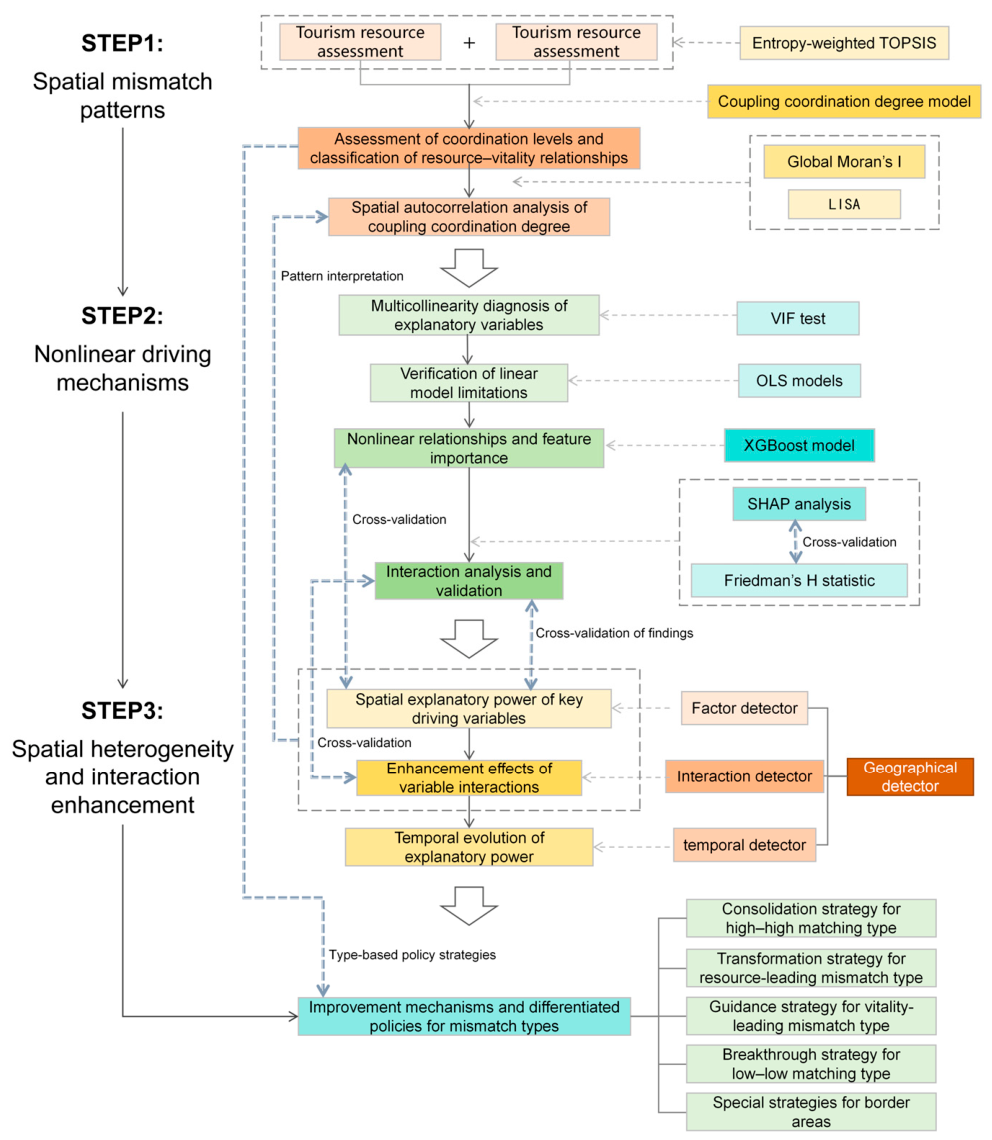
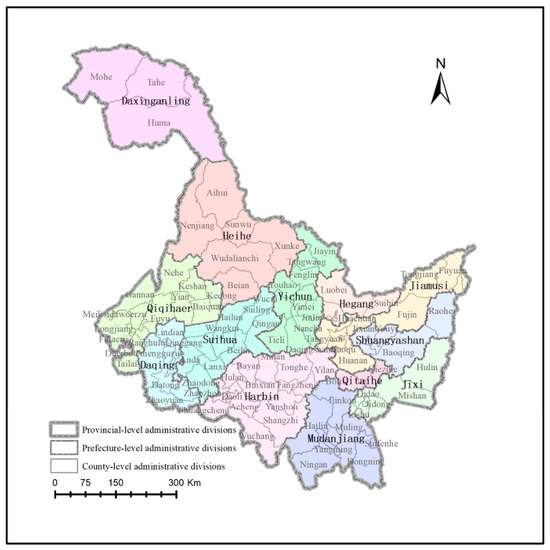
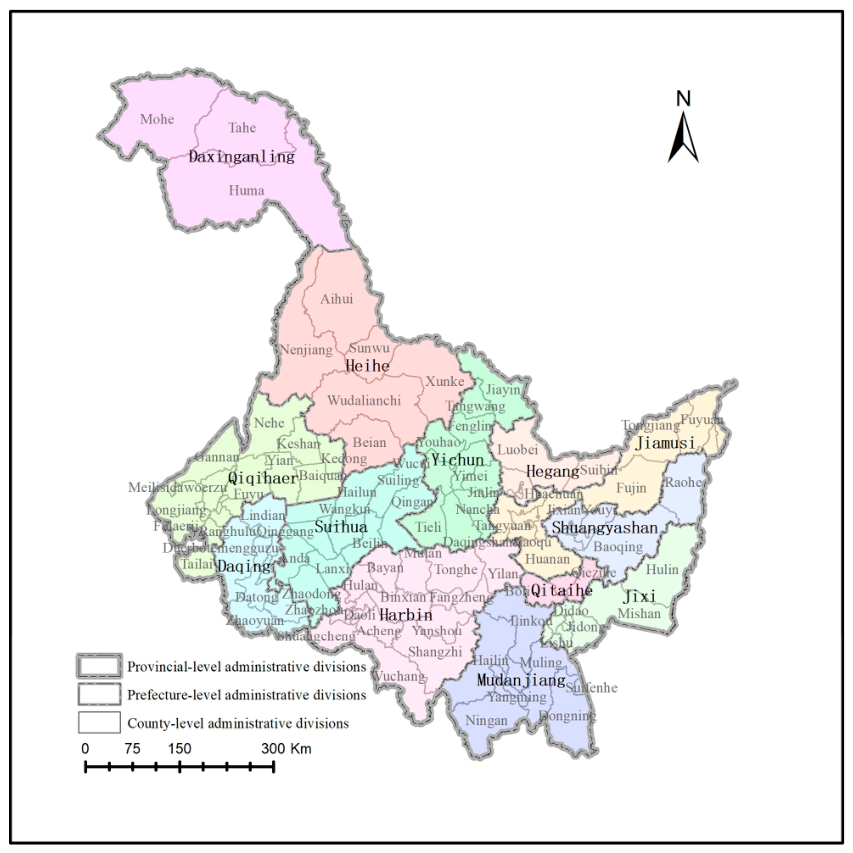
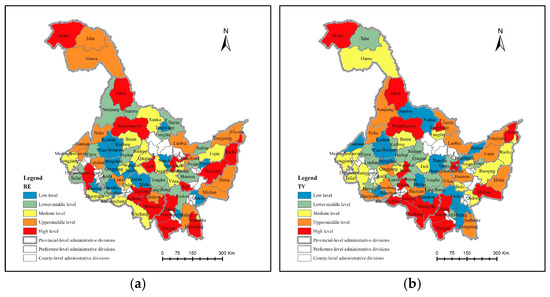
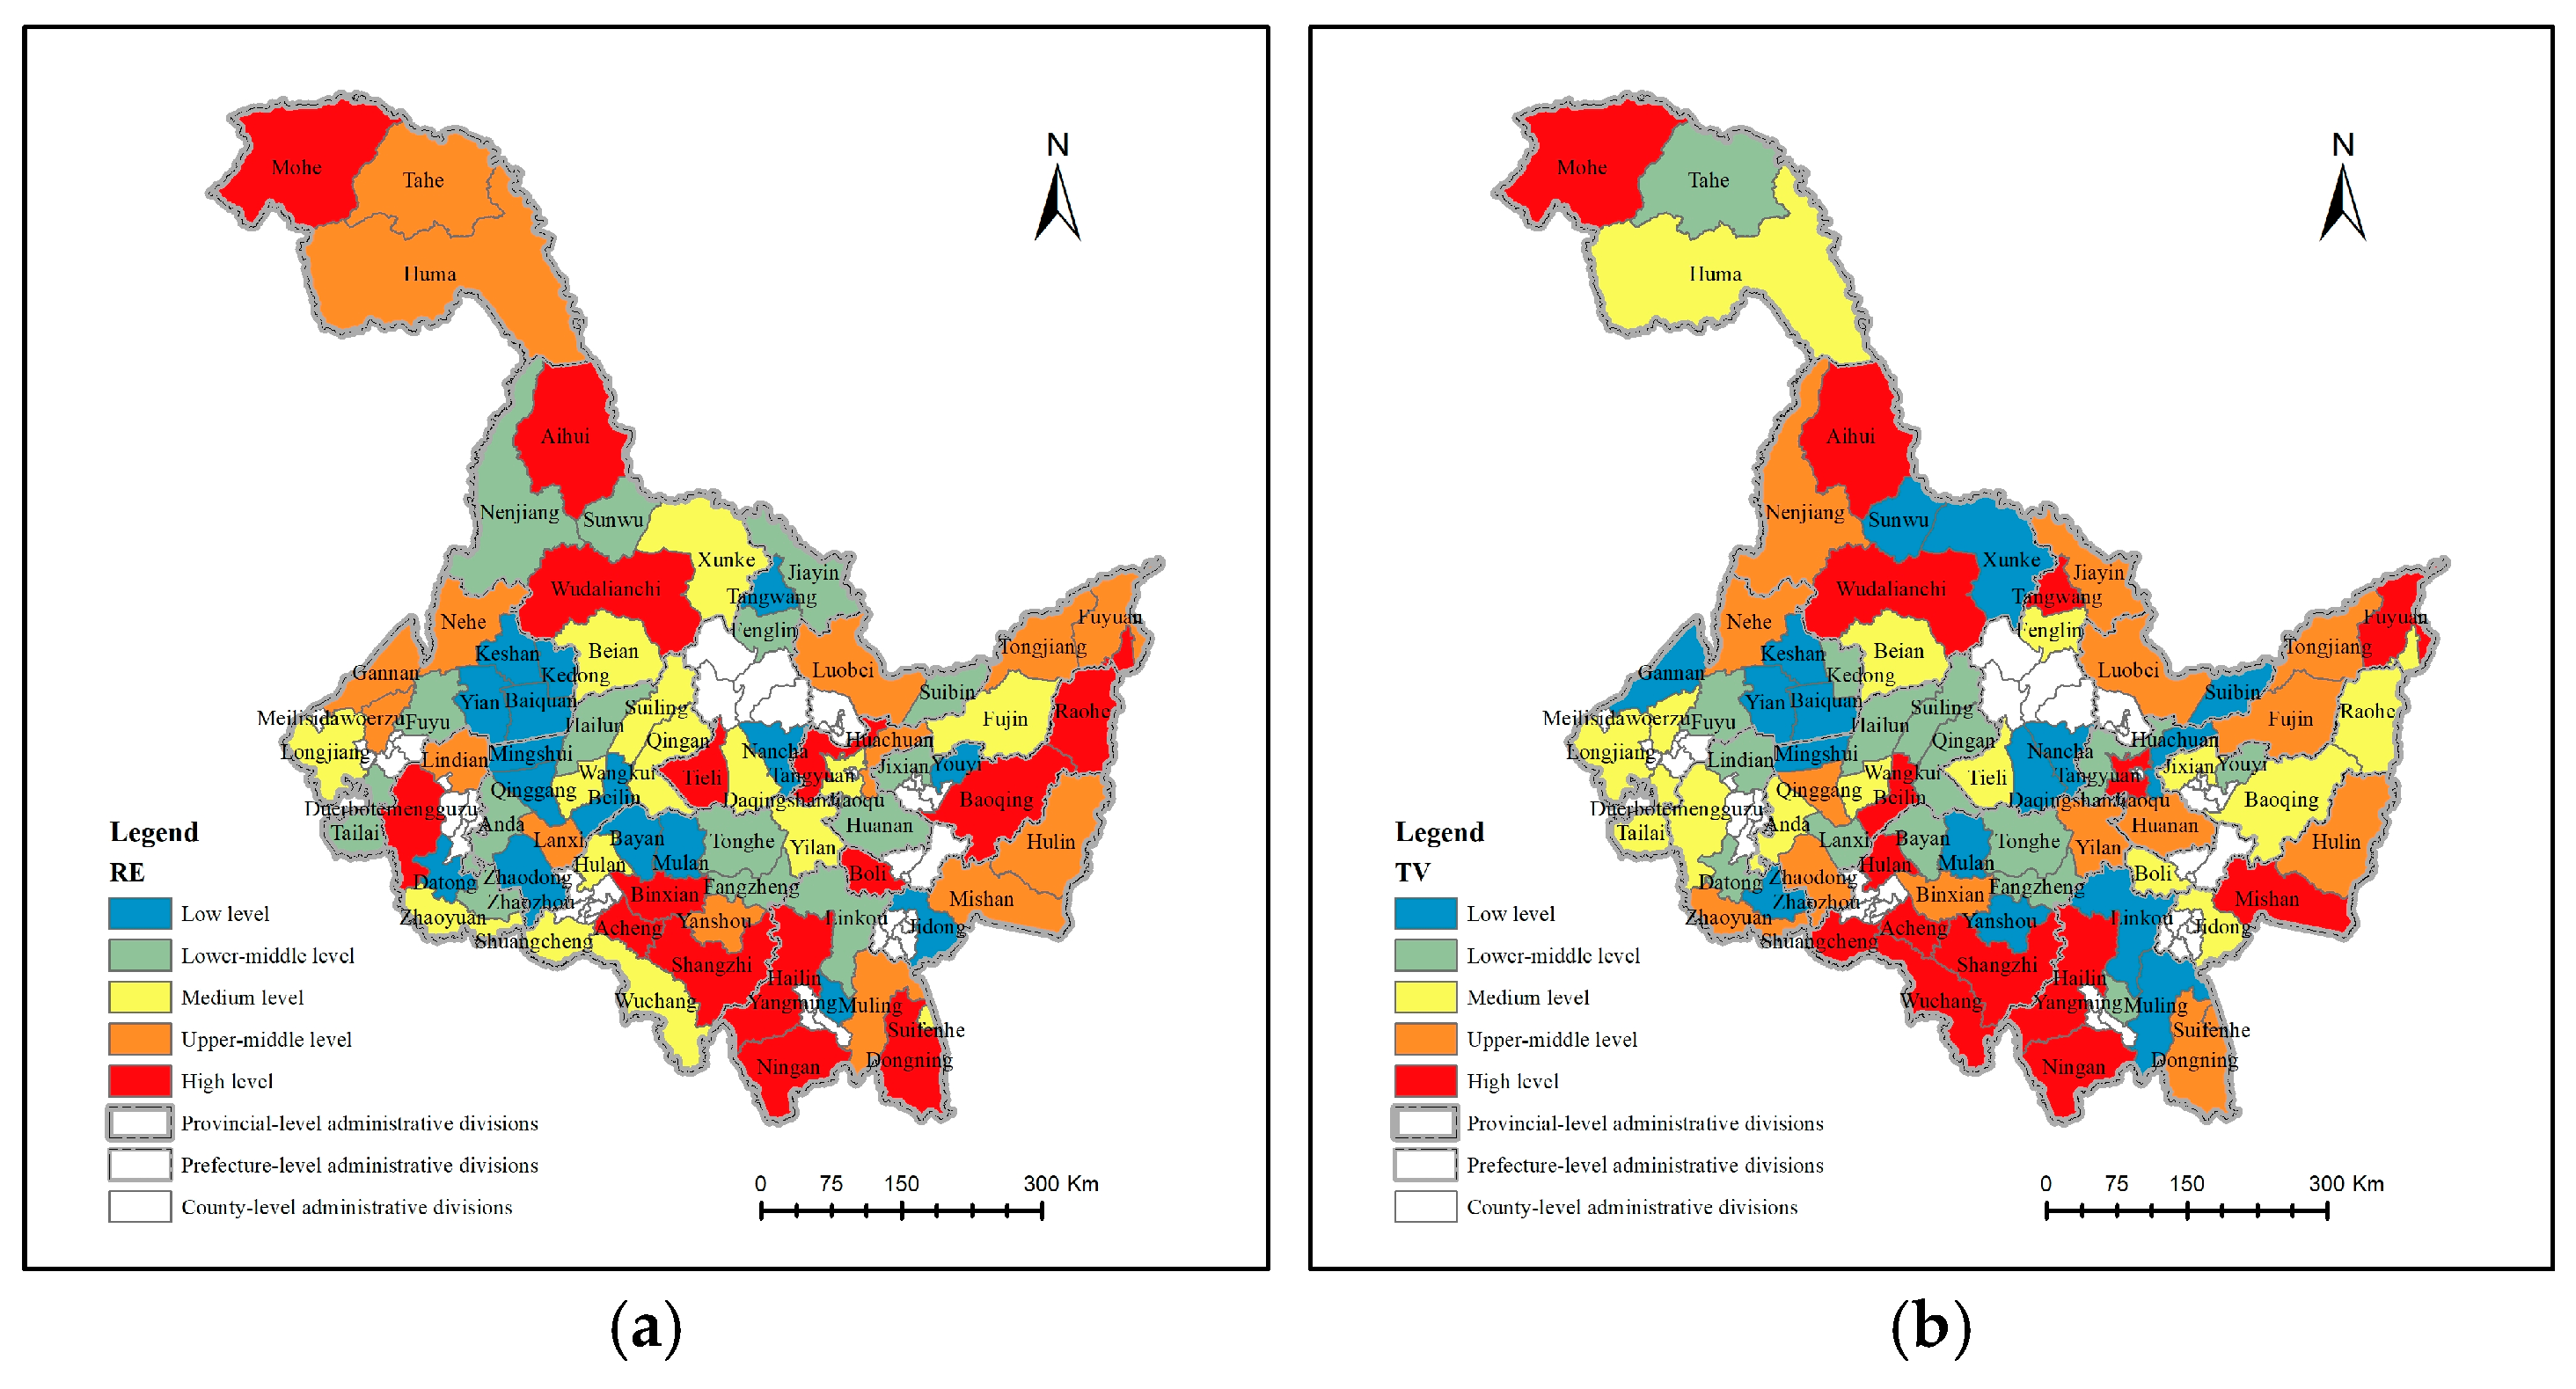
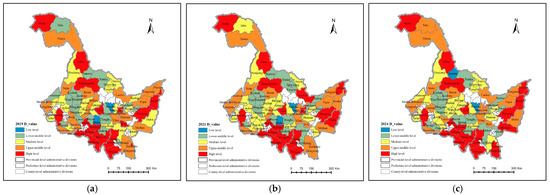
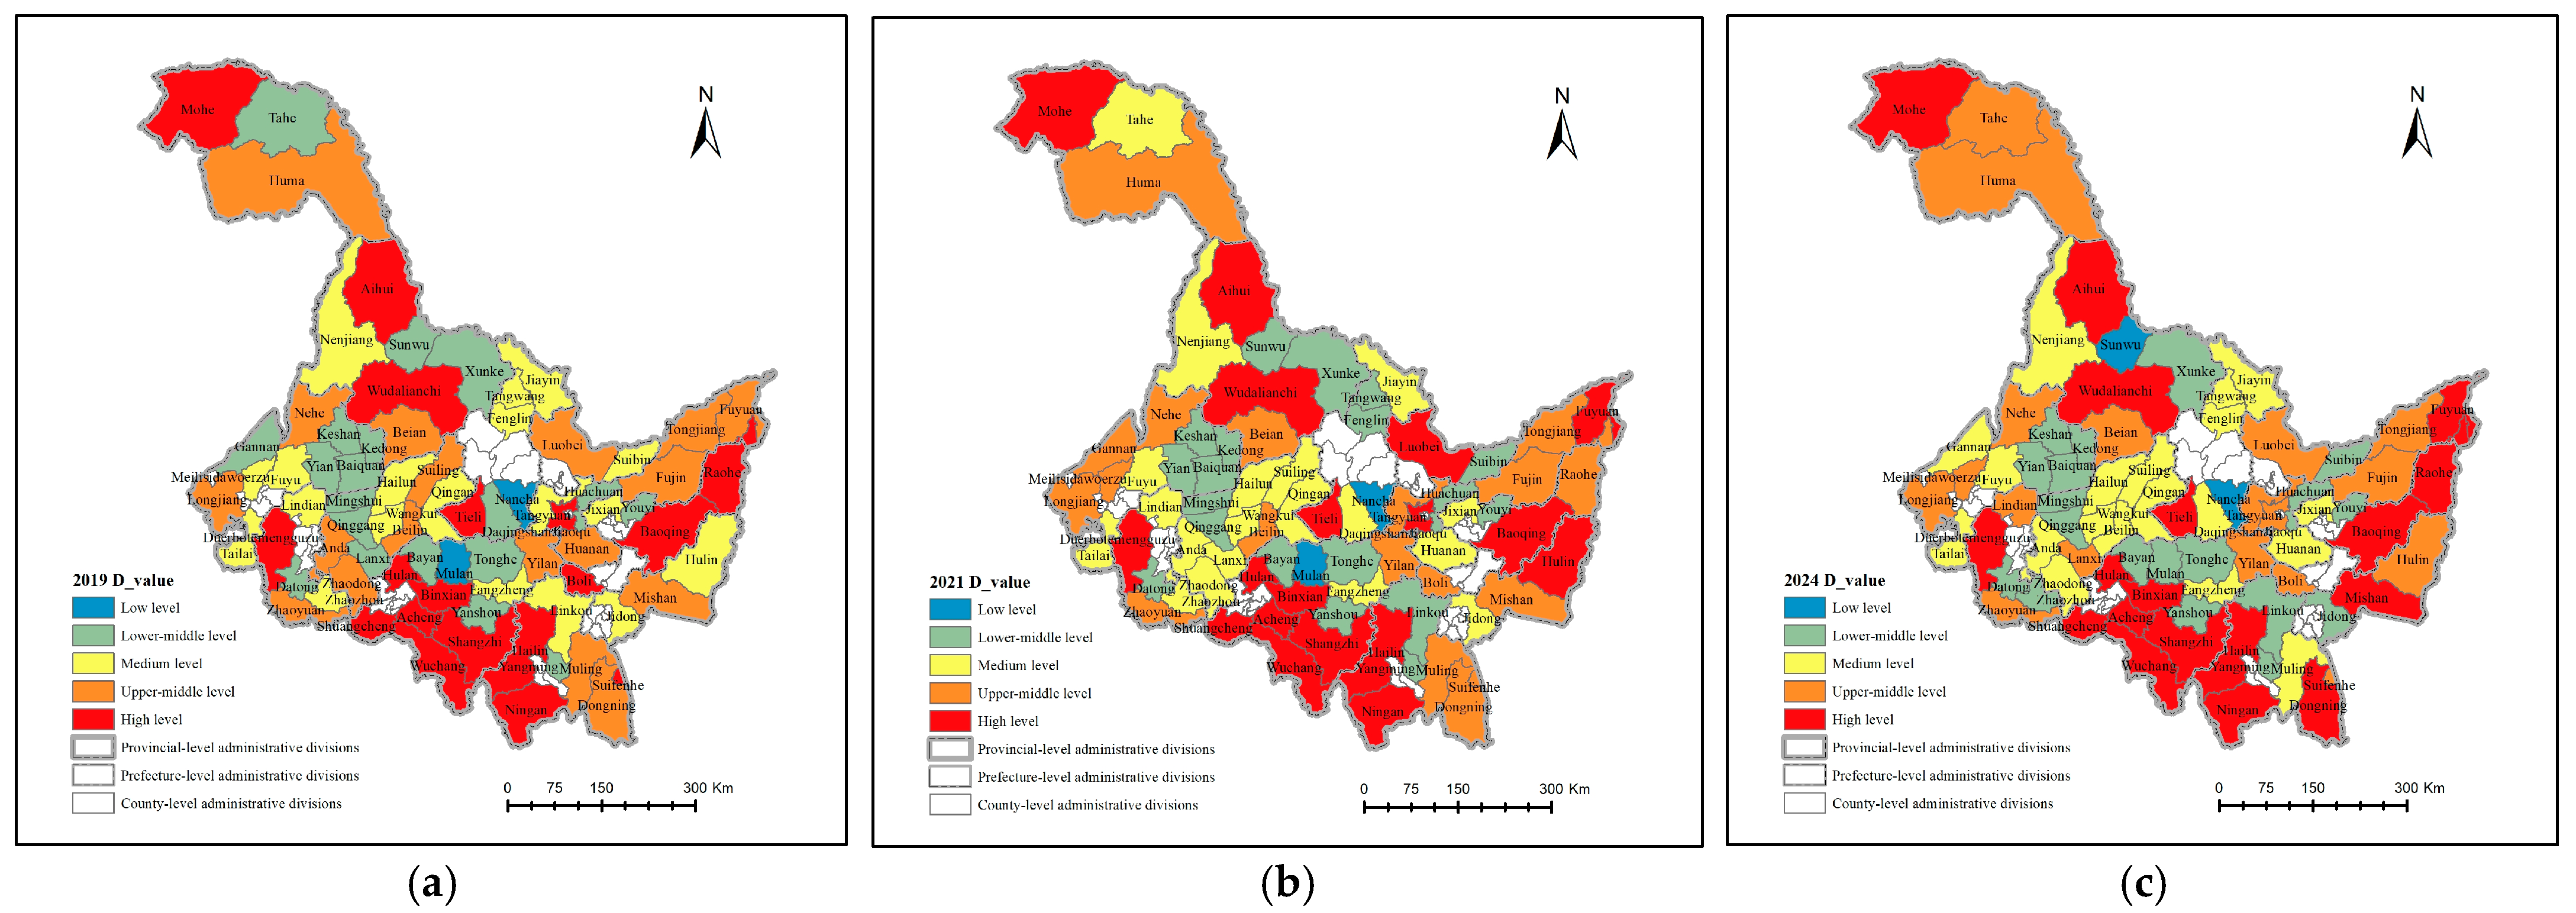
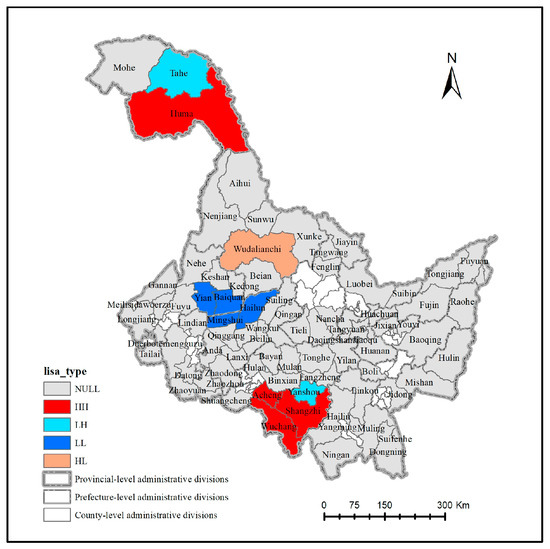
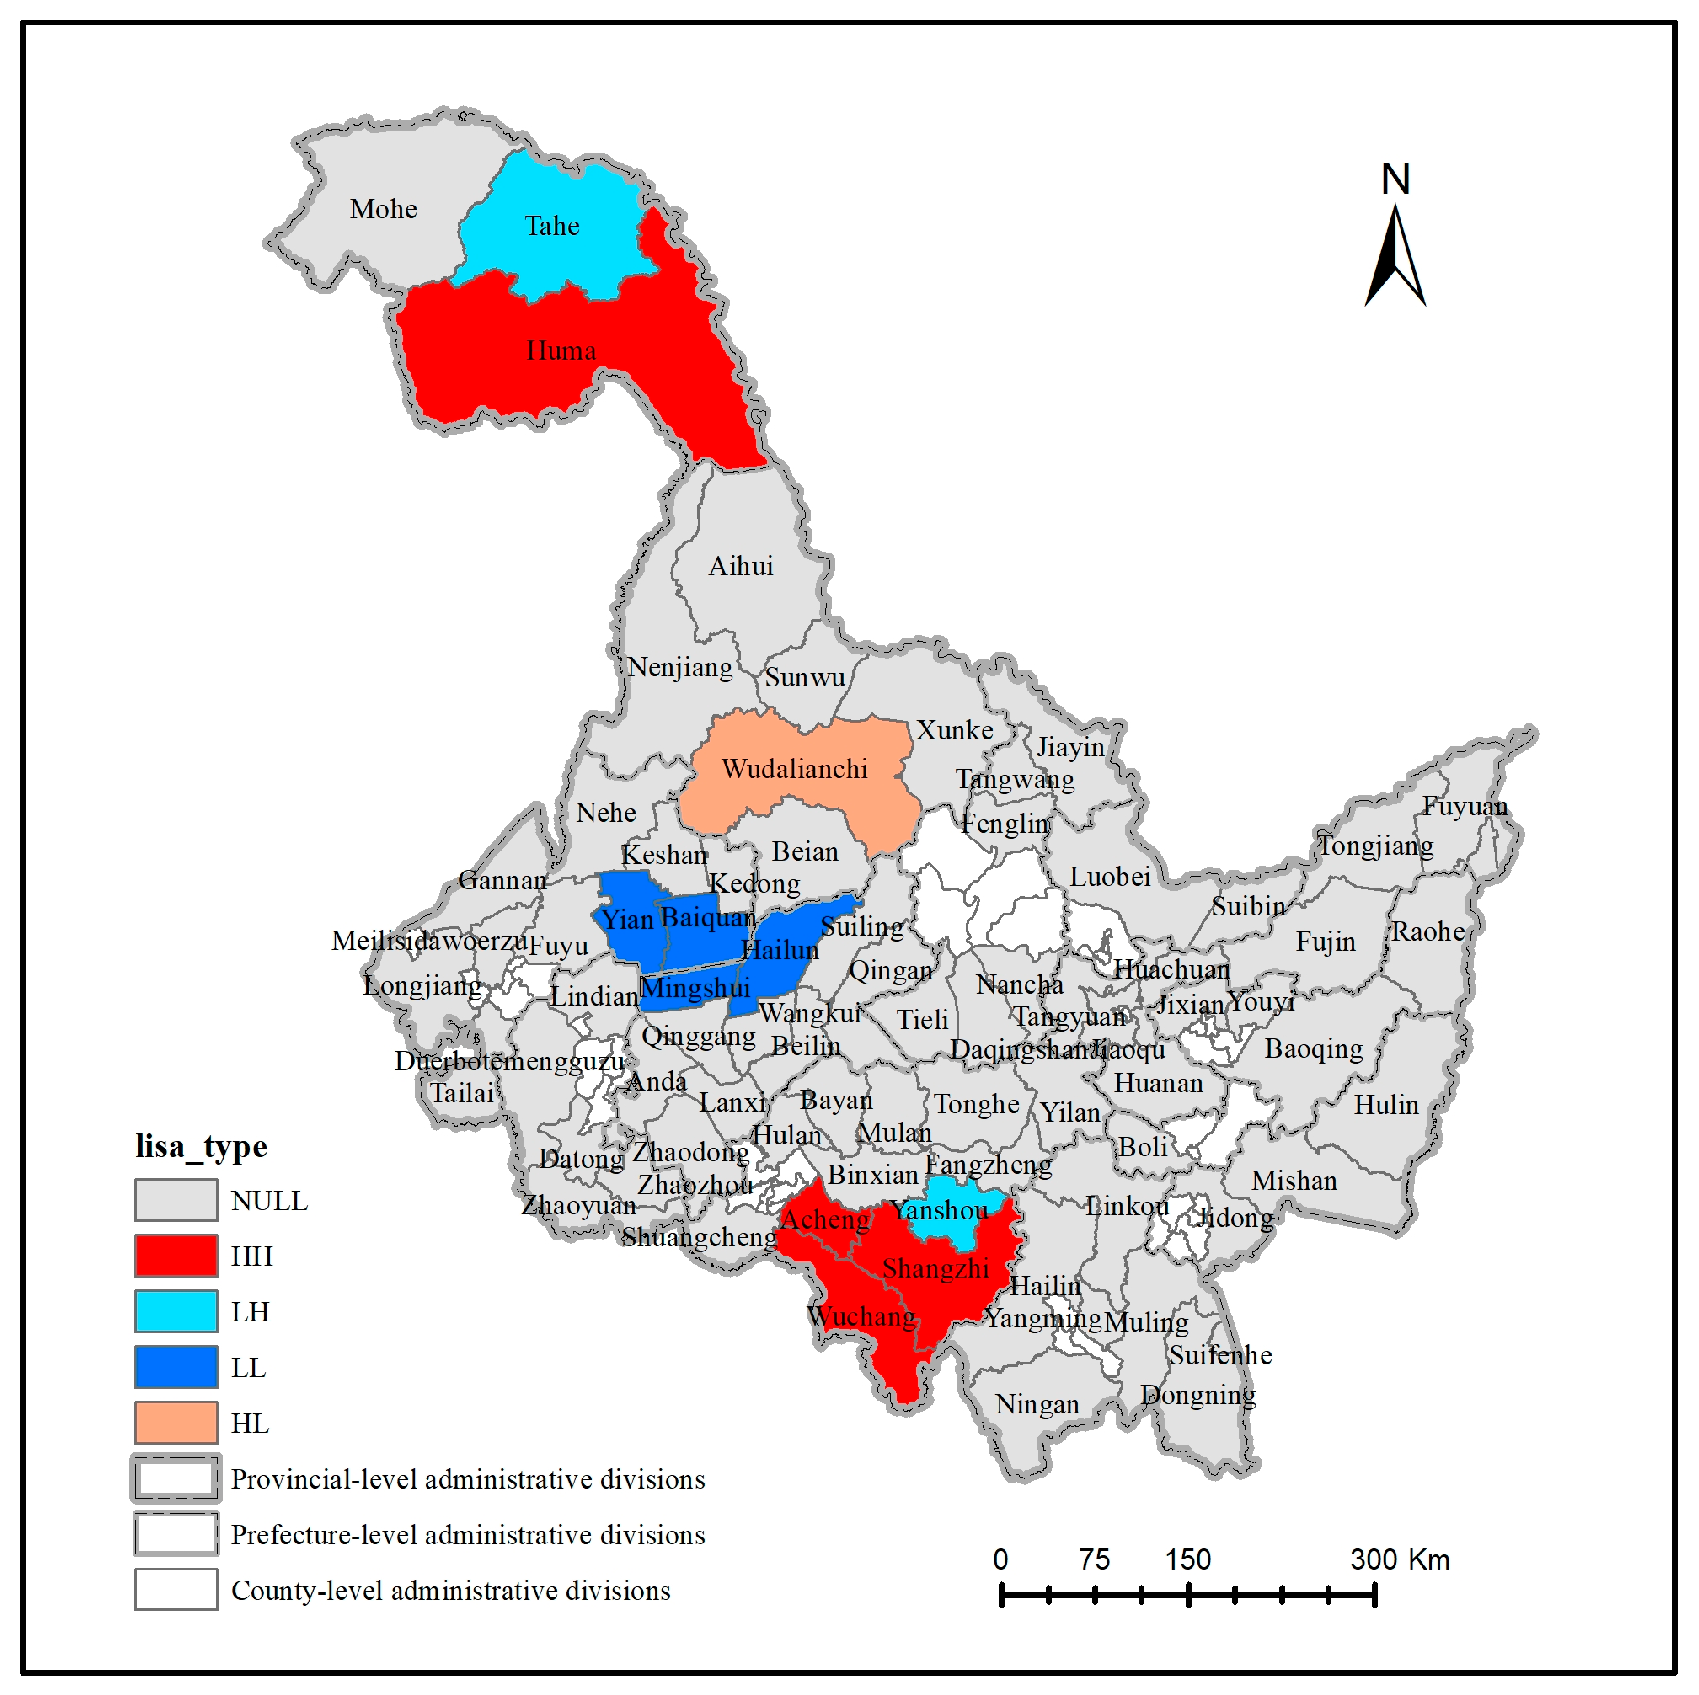
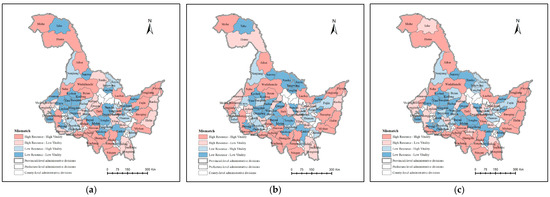
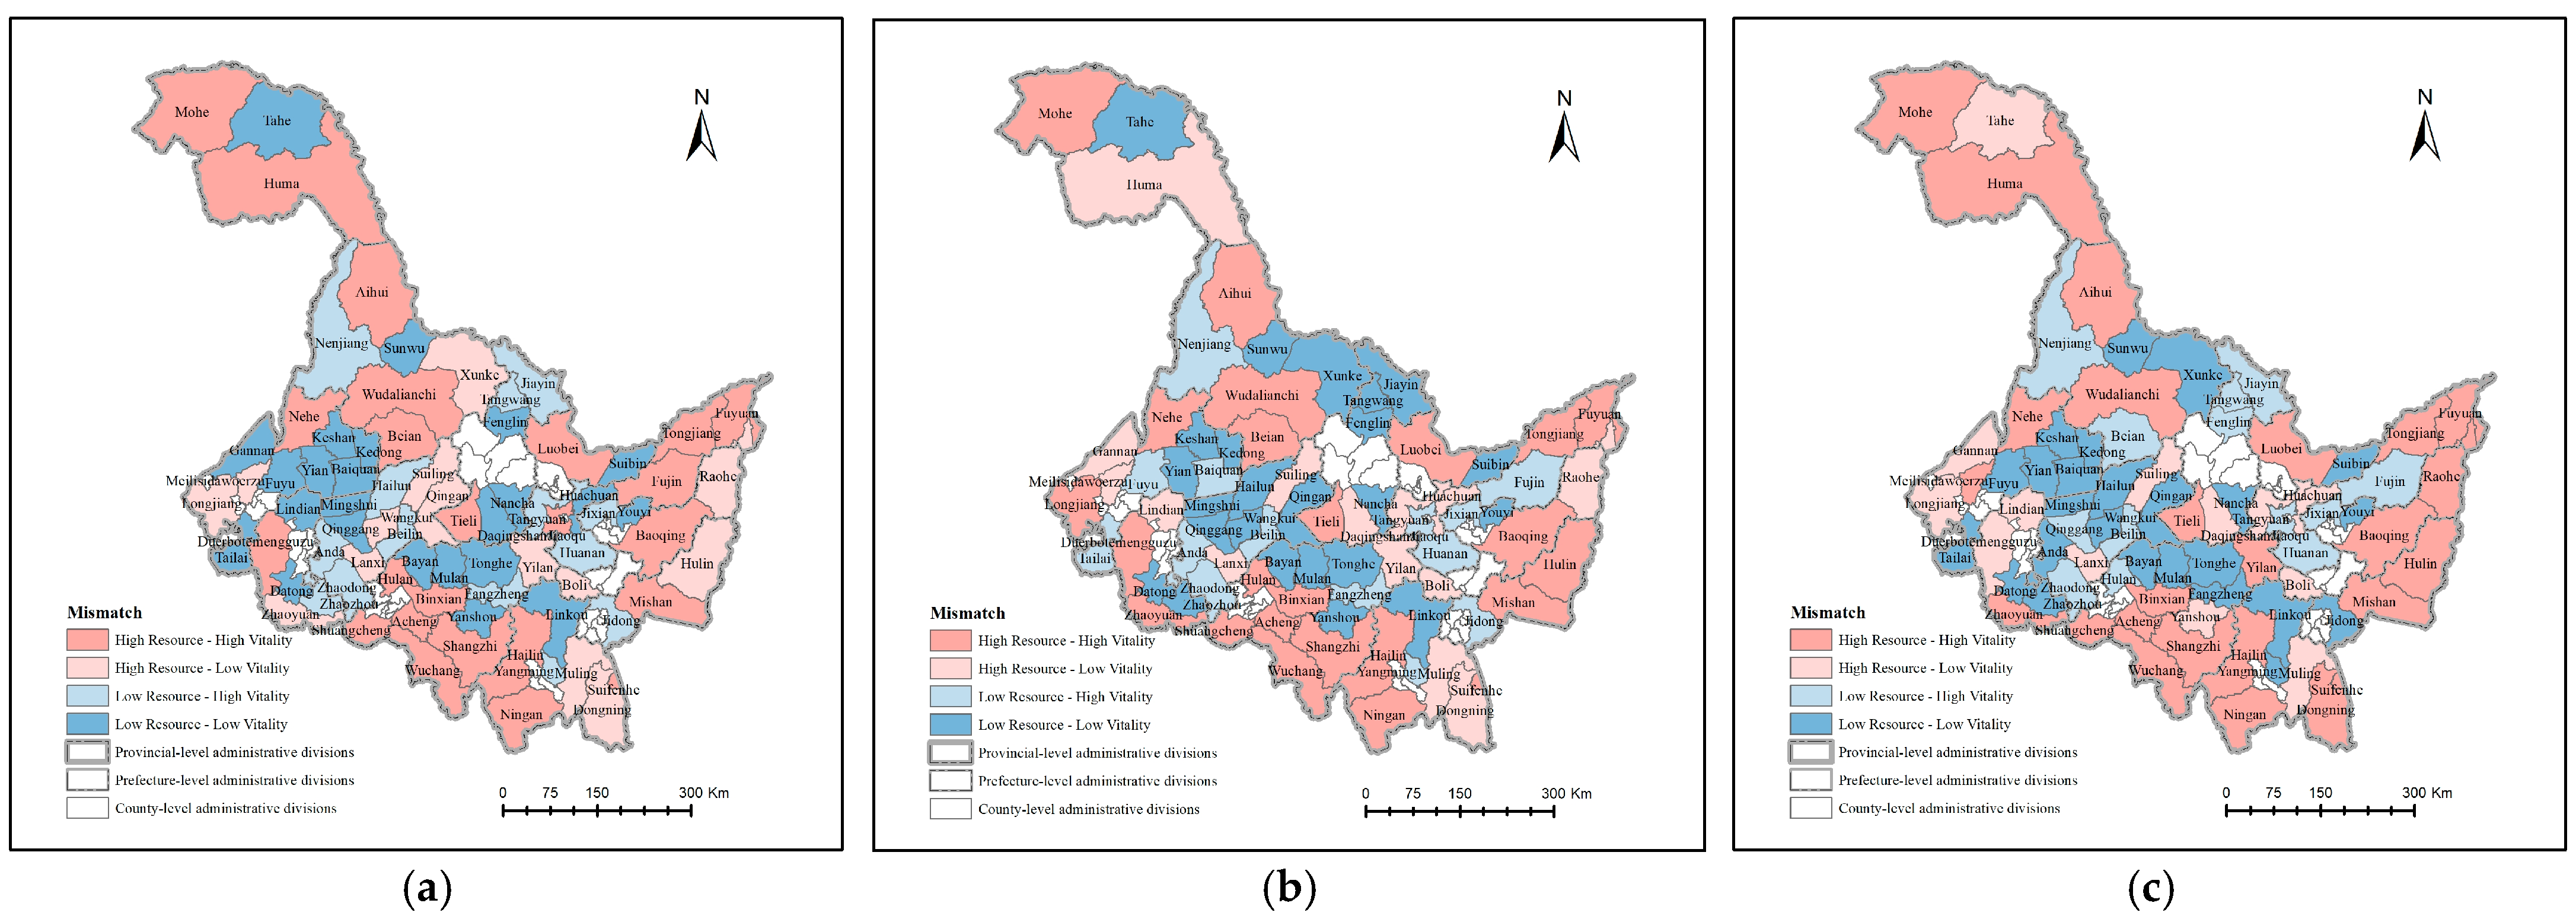
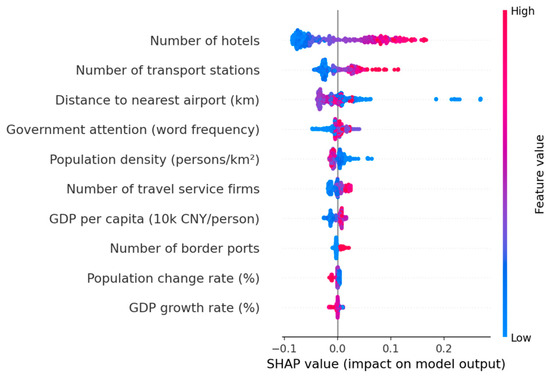
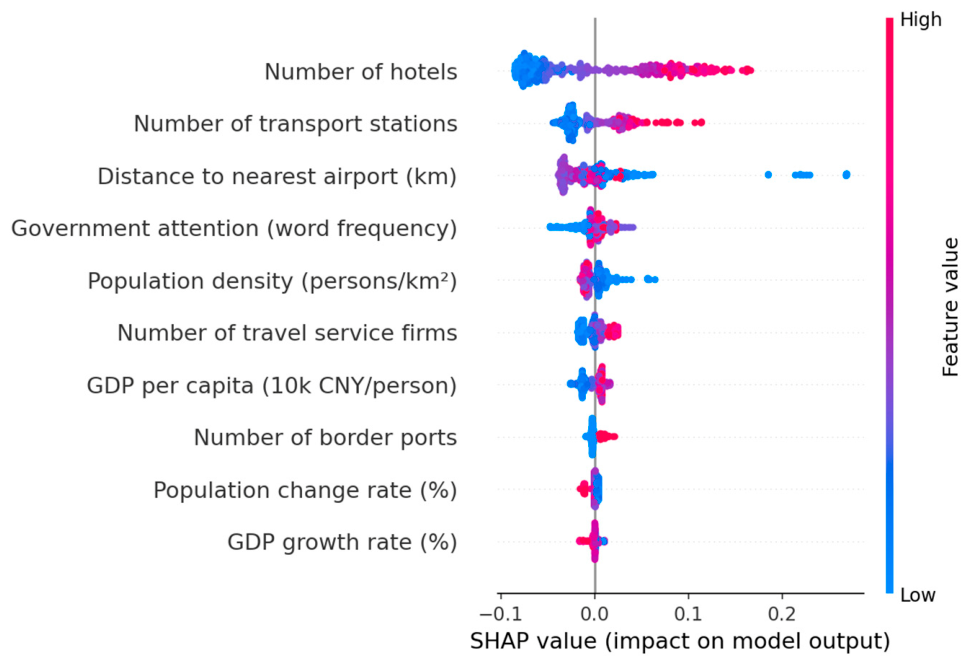
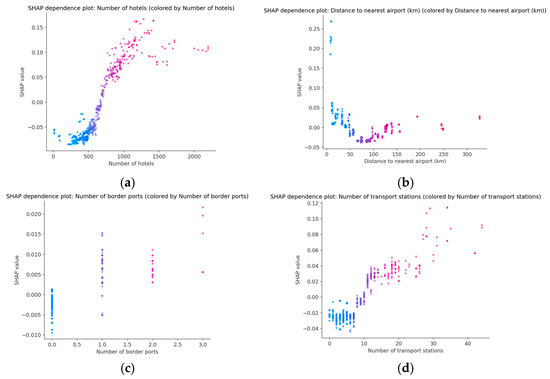
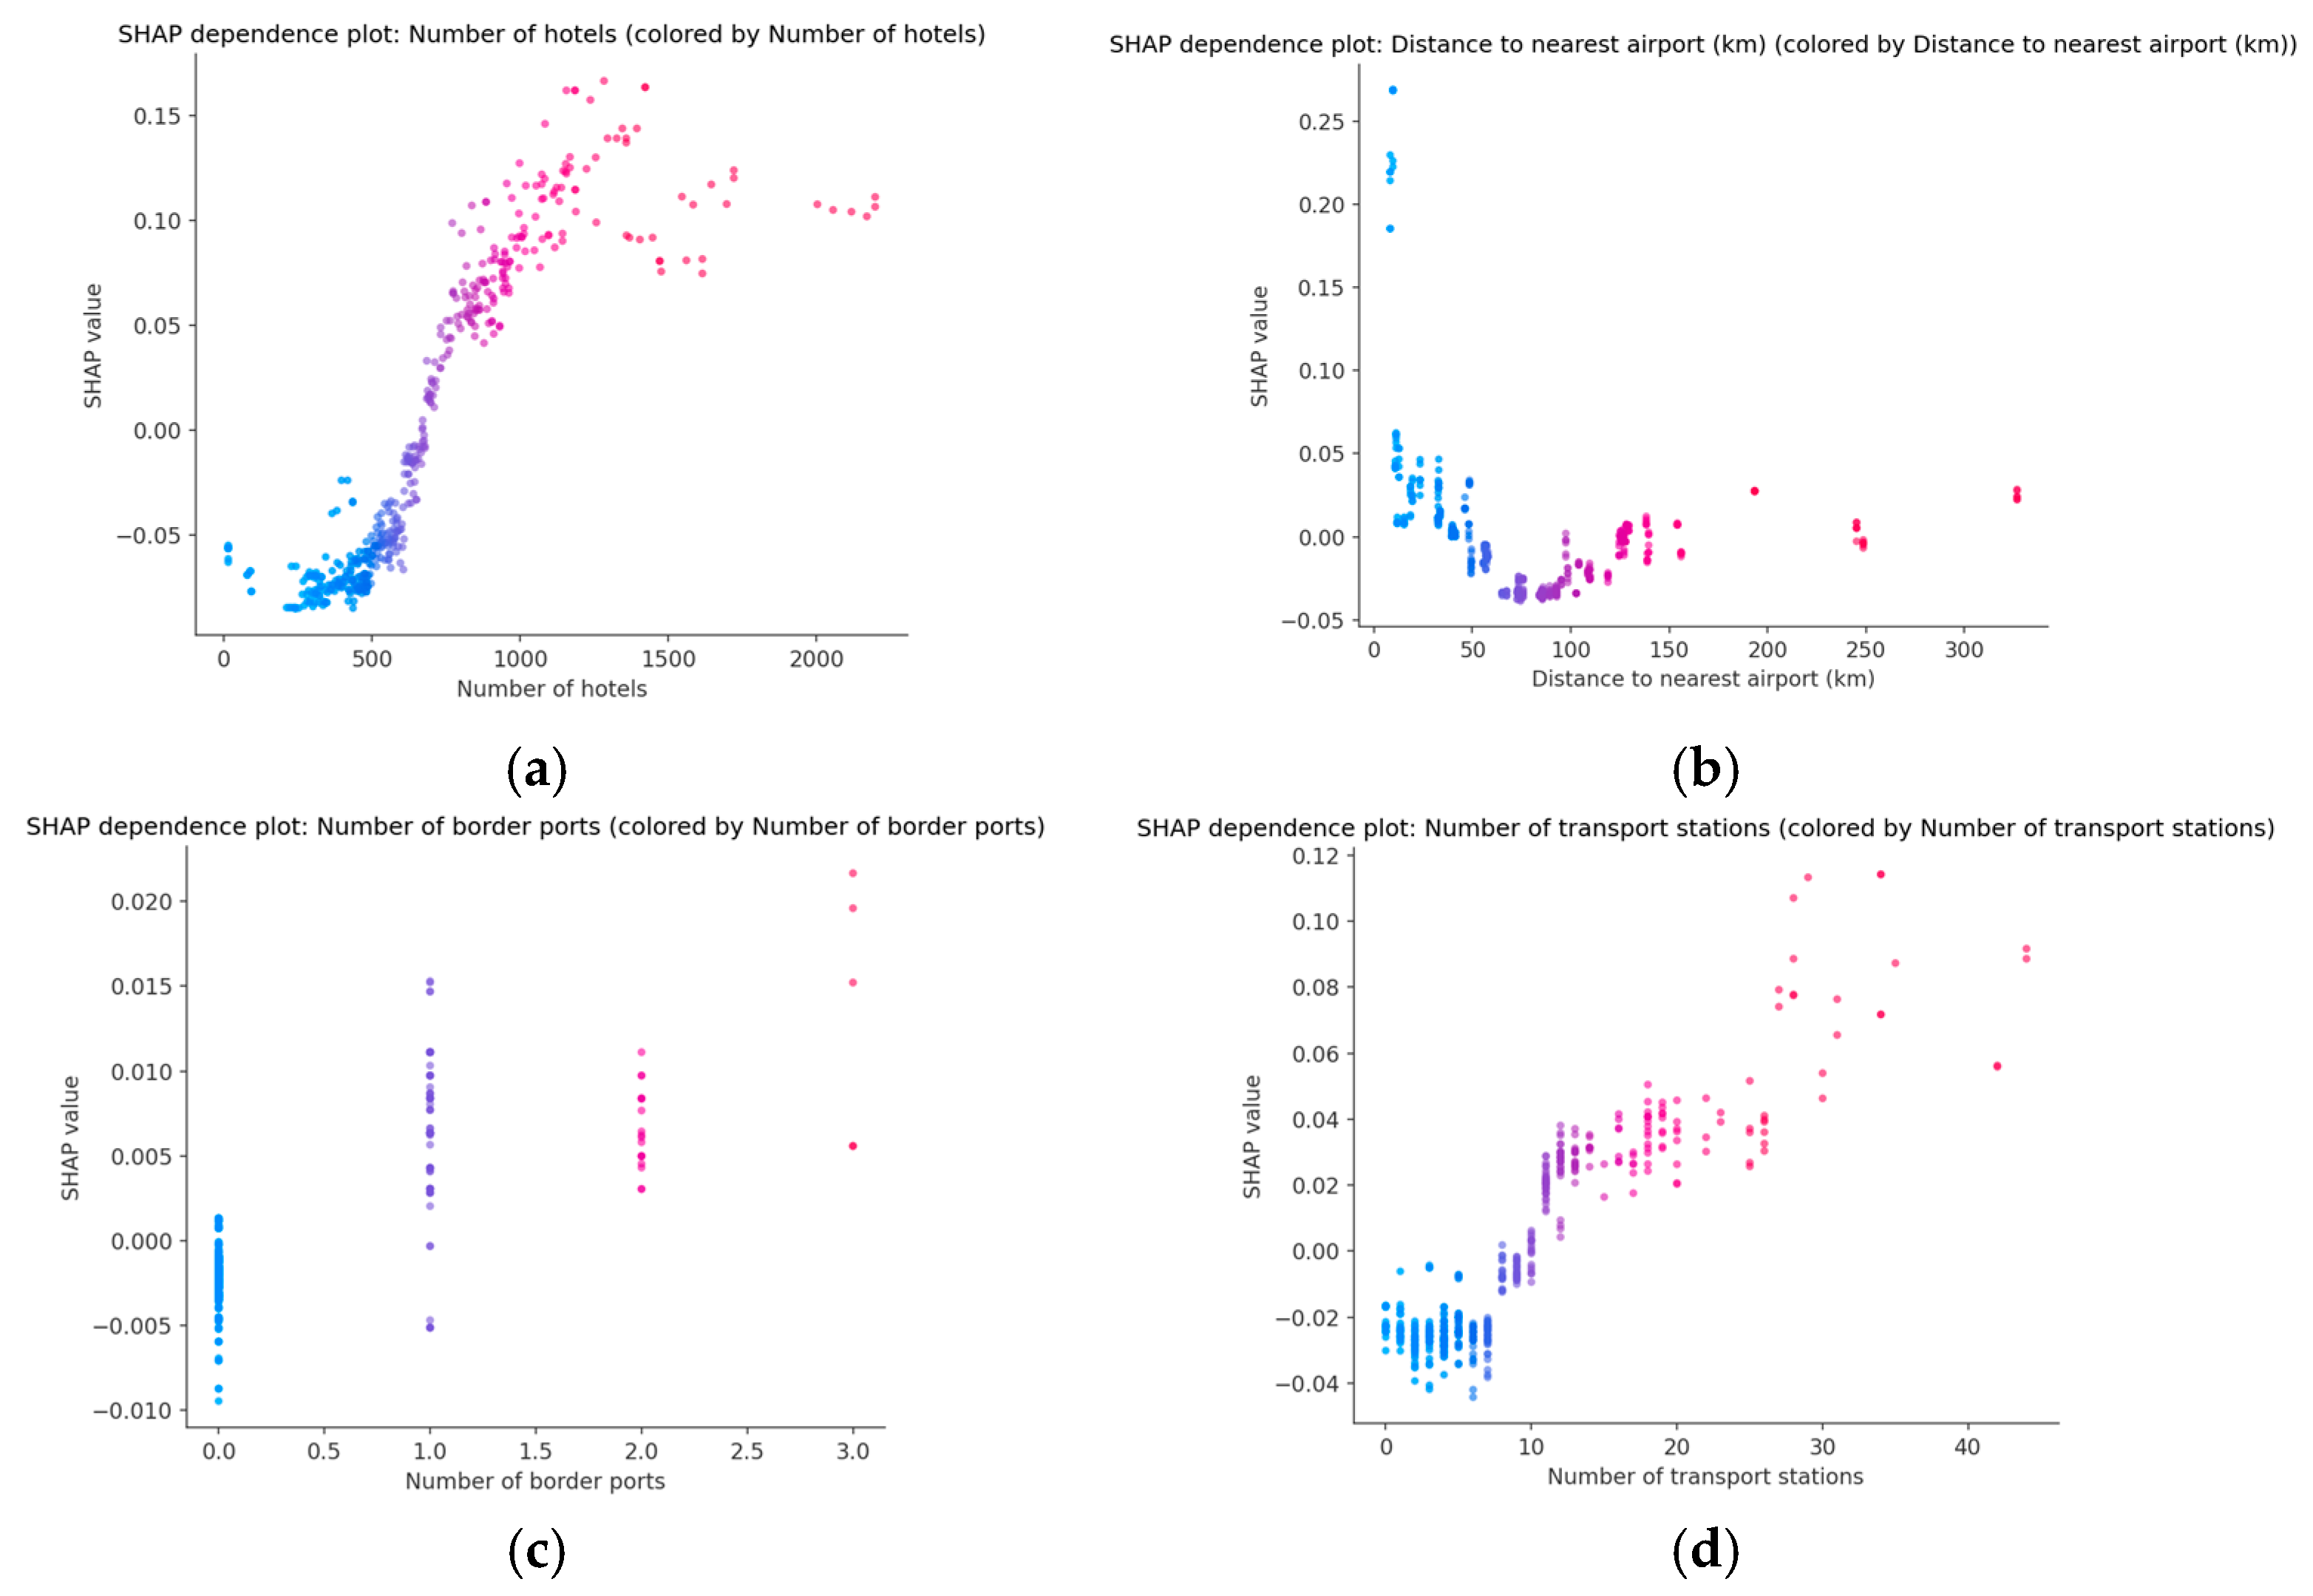
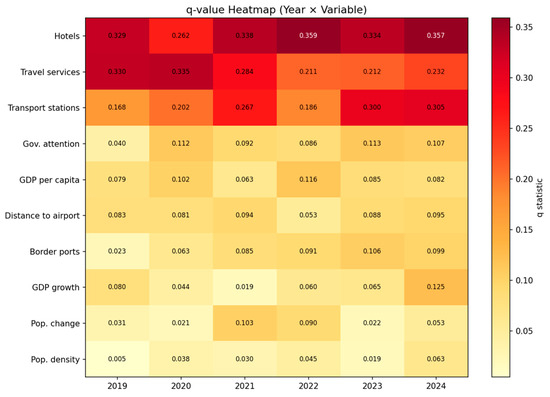

Disclaimer/Publisher’s Note: The statements, opinions and data contained in all publications are solely those of the individual author(s) and contributor(s) and not of MDPI and/or the editor(s). MDPI and/or the editor(s) disclaim responsibility for any injury to people or property resulting from any ideas, methods, instructions or products referred to in the content. |
© 2026 by the authors. Licensee MDPI, Basel, Switzerland. This article is an open access article distributed under the terms and conditions of the Creative Commons Attribution (CC BY) license.