


Abstract
National parks in densely populated regions face growing pressure to shift from boundary-based protection toward cross-boundary landscape governance, yet connectivity between wildlands within and outside the national park remains understudied. China’s large population and marked spatial variation in anthropogenic pressure make it a particularly informative setting for investigating this issue. We developed a rewilding-oriented framework for wildland network modeling, applied to Baishanzu National Park and its surrounding counties in China. By integrating Boolean overlay, wilderness continuum analysis, and circuit theory, we systematically delineated wilderness patches, corridors, and pinch points. We identified 143 wilderness patches covering 1102.79 km2 (14.06% of the study area), dominated by small fragments indicative of severe landscape fragmentation. High current-density zones are concentrated along continuous montane forest belts, valley-ridge transition zones, and narrow inter-patch passages. Twenty-six pinch points were identified, primarily within Baishanzu National Park, southeastern Jingning County, and the northern Yunhe–Longquan interface, alongside 15 internal corridors within the park. Rewilding strategies for montane national parks in human-dominated landscapes may benefit from extending beyond boundaries. Cross-boundary wildland network modeling offers a methodological reference for corridor planning and rewilding practice globally.
1. Introduction
Protected areas have served as a central instrument of global biodiversity conservation for several decades, a role reinforced by the adoption of the Convention on Biological Diversity in 1992 following several years of international negotiations [1]. Subsequent conservation policy has increasingly emphasized integrating protected areas into wider landscapes through ecological networks, corridors, and buffer zones [2]. However, human activities, including road construction, built-up area expansion, tourism development, and agricultural production, continue to compress natural habitats and weaken ecological connections within protected areas and across surrounding landscapes [3,4]. These processes affect species dispersal, gene flow, and long-term population persistence. To support the Kunming–Montreal Global Biodiversity Framework [5] and the Sustainable Development Goals [6], protected-area planning must protect core areas while also maintaining and restoring ecological connections that extend beyond administrative and management boundaries [7,8].
Wilderness areas generally refer to natural areas with high naturalness, low human disturbance, and relatively intact ecological processes [9,10,11,12,13]. They provide an important spatial foundation for maintaining ecological integrity in national parks [14]. In recent years, wilderness research has moved beyond the identification and evaluation of individual patches toward a stronger focus on connectivity among wilderness areas [15,16]. Rewilding provides an important theoretical perspective for this shift. Unlike conventional ecological restoration, which often emphasizes local habitat improvement, rewilding focuses on the recovery of natural processes, the enhancement of ecosystem self-sustaining capacity, and the reconnection of fragmented natural patches [11]. In this sense, wilderness areas are not only conservation targets, but can also serve as source areas within rewilding networks, while wilderness corridors and pinch points become important tools for restoring ecological connections among them [17].
Studies on wilderness conservation and landscape connectivity have gradually developed a technical pathway from spatial identification to network modeling [18]. Early wilderness research mainly focused on defining and evaluating areas with high naturalness, often using indicators such as land use, human disturbance intensity, distance to roads, distance to settlements, and topographic conditions to identify low-disturbance wilderness patches [13]. With the development of landscape ecology and conservation biology, research attention has shifted toward the connectivity among wilderness patches, especially how wilderness corridors can maintain species dispersal, gene flow, and the continuity of ecological processes [19,20]. Methodologically, connectivity models such as the minimum cumulative resistance model, Linkage Mapper, Circuitscape, and Omniscape.jl have been widely used to identify wilderness corridors and key connectivity areas [21,22,23,24]. Among them, Circuitscape can simulate multiple dispersal pathways across landscapes and is therefore more suitable than single-path methods for identifying potential corridors, movement bottlenecks, and pinch points in fragmented mountain landscapes [25].
The Baishanzu National Park is located in the Donggong Mountains, a branch of the Wuyi Mountains in southwestern Zhejiang Province, and is a component of the Qianjiangyuan-Baishanzu National Park Candidate Area in China [26]. This area preserves a typical evergreen broad-leaved forest ecosystem of mountain regions and supports rare or representative species such as Abies beshanzuensis, Muntiacus crinifrons, Manis pentadactyla, Prionailurus bengalensis, Viverricula indica, and Megophrys baishanzuensis [27]. It therefore has high biodiversity conservation value. However, Baishanzu is not an isolated natural area. Numerous wilderness patches occur in its surrounding landscape, but their connectivity has been weakened by long-term impacts from roads, villages and towns, tourism development, and agricultural and forestry activities [28,29,30]. Conservation measures confined to the park area alone are therefore insufficient to fully cover animal habitats and the spatial extent of ecological processes.
Although existing studies provide an important methodological basis for wilderness corridor planning in national parks, they still tend to focus on habitat suitability assessment or potential corridor identification. Less attention has been paid to the role of wilderness patches as source areas in rewilding networks, the multi-path connectivity among patches, and the translation of pinch points into concrete restoration nodes [31]. This issue is particularly relevant in the mountain regions of eastern China, where ecological integrity inside national parks is relatively high, but development intensity in surrounding landscapes is also strong [28,32]. As a result, boundaries often fail to encompass the full range of animal movement and ecological processes.
To address these gaps, this study takes Baishanzu National Park and its surrounding counties as the study area. From a cross-boundary rewilding perspective, it integrates wilderness identification and connectivity modeling to identify wilderness patches, potential wilderness corridors, and pinch points at the regional scale. It further translates model outputs into corridor prioritization and node restoration strategies, providing a planning basis for enhancing ecological connectivity and advancing rewilding practices in eastern Chinese national parks under human disturbance. Specifically, this study aims to:
- Identify the spatial distribution of wilderness patches in the study area;
- Assess the wilderness quality of the landscape;
- Construct a wilderness corridor network;
- Identify vulnerable areas within the wildland network.
2. Methods
2.1. Study Areas
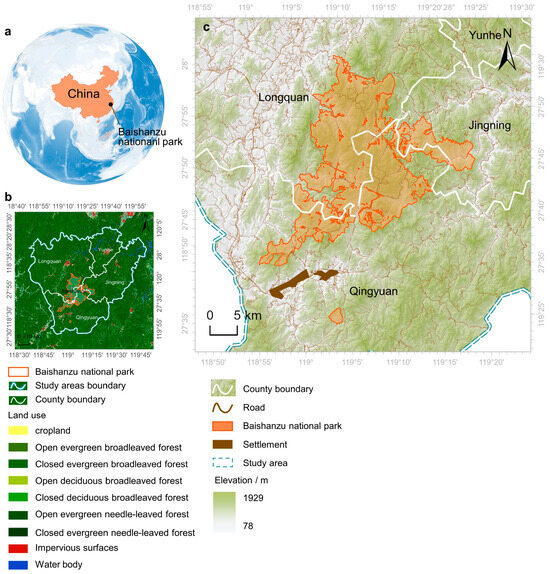
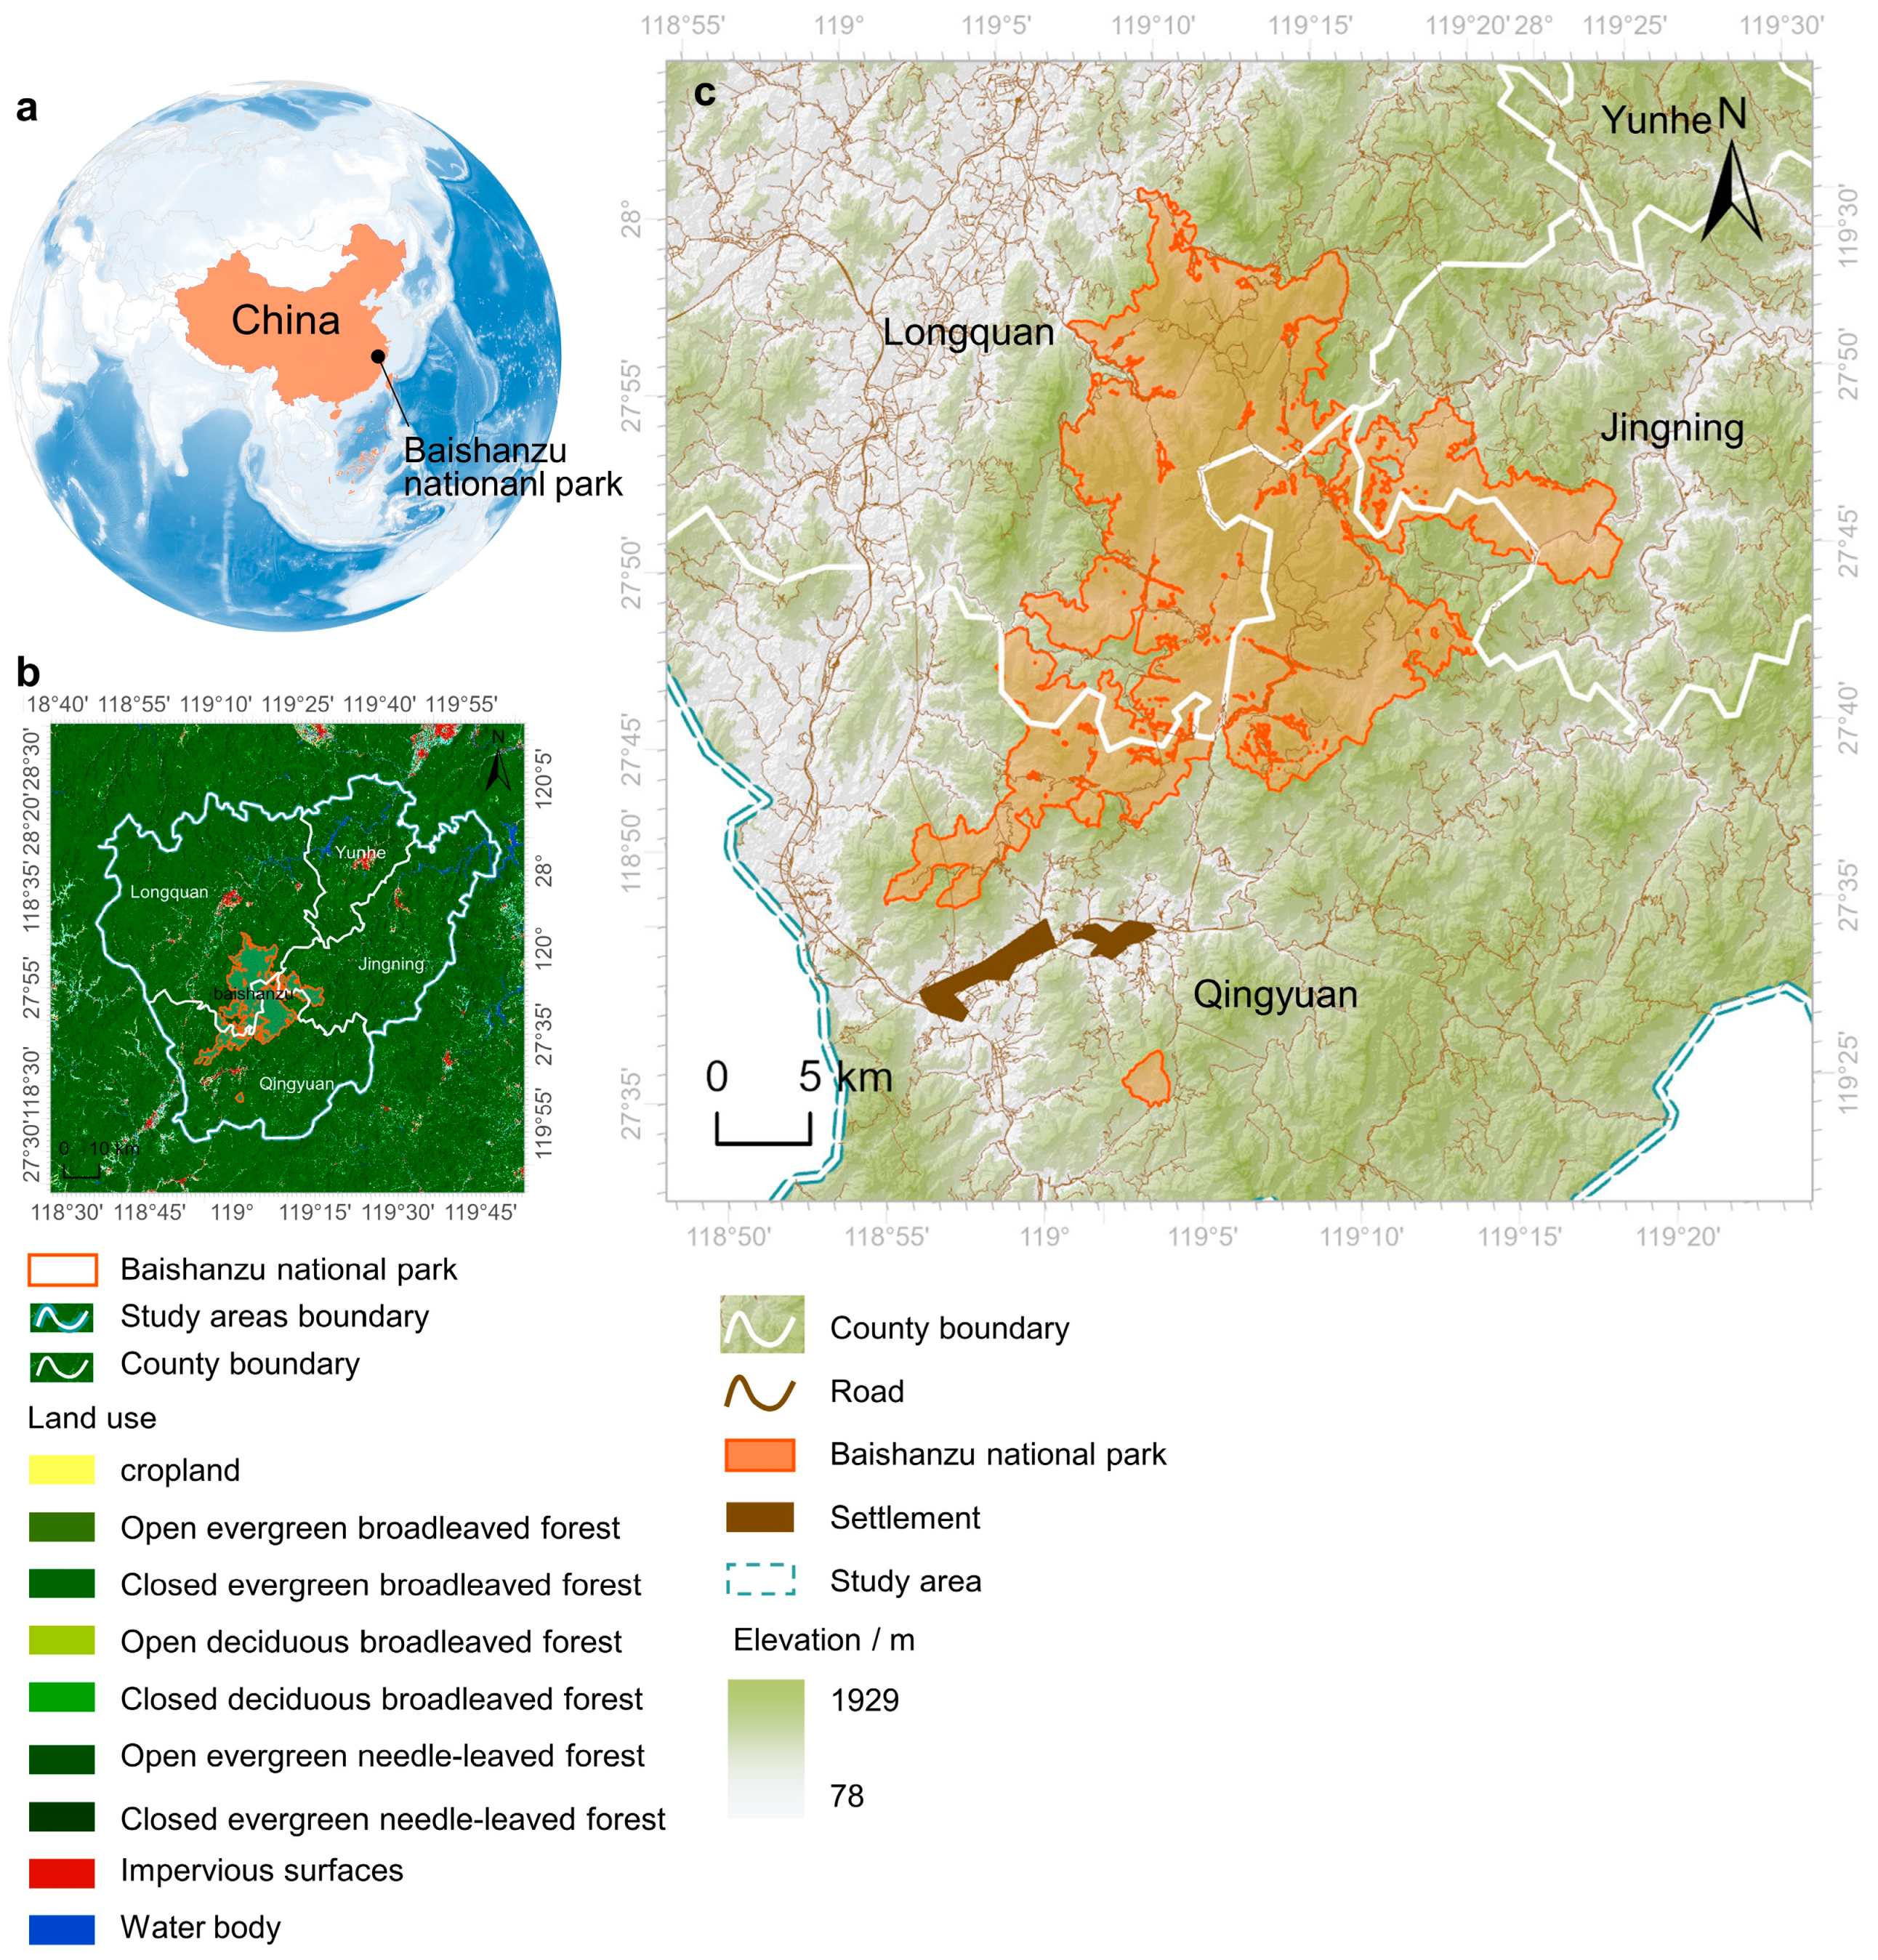
The study area covers Baishanzu National Park and the surrounding administrative areas of Longquan City, Qingyuan County, Jingning She Autonomous County, and Yunhe County, with a total area of approximately 7846.05 km2. Geographically, it extends from approximately 118°43′ E to 119°58′ E in longitude and from 27°25′ N to 28°20′ N in latitude (Figure 1c). Located at the junction of Longquan, Qingyuan, and Jingning in Lishui City, Baishanzu National Park covers approximately 504 km2, including 489 km2 of forest, and represents an important conservation unit for mountain forest ecosystems in East Asia (Figure 1a) [26]. The study area lies in the Donggong Mountains, which form part of the Wuyi Mountain system. The landscape is dominated by low and middle mountains, characterized by pronounced topographic variation, deeply incised valleys, and a complex ecological structure composed of ridges, slopes, river valleys, and intermontane basins. The region has a mid-subtropical monsoon climate, with marked vertical climatic differentiation along the elevation gradient [33]. Vegetation is dominated by evergreen broad-leaved forests in low- and middle-mountain zones, together with coniferous and broad-leaved mixed forests, shrublands, riparian hygrophilous vegetation, and localized plantations (Figure 1b) [27].
Figure 1.
Study area. (a) Global location of Baishanzu National Park; (b) the study area surrounding Baishanzu National Park, with different colors representing nine land-use types. The white lines indicate county boundaries, the white line with a blue outline delineates the study area, and the orange line indicates the boundary of Baishanzu National Park; (c) the geographical boundary of Baishanzu National Park within the topographic and spatial context of the study area. The orange line indicates the boundary of Baishanzu National Park, the blue dashed line delineates the study area, and the white lines represent county boundaries; roads and settlements are shown in brown.
This combination of complex terrain and diverse vegetation provides multiple habitat types for wildlife. Ridge lines, river valleys, and continuous forest patches therefore constitute key landscape elements for potential wilderness corridors. Human activities are also embedded within this mountainous landscape, including village and town development, road networks, recreational routes, and agricultural and forestry production areas [30]. As a result, the study area presents a distinct spatial interweaving of natural ecological processes and human land use.
2.2. Data Sources and Preprocessing
Multiple spatial datasets were used to support wilderness identification and connectivity modeling. Land-use data were obtained from the 30 m China Multi-period Land Use Land Cover Remote Sensing Monitoring Dataset and were used to distinguish natural habitats from human-modified land-use types [34]. Settlement data were obtained from the National Catalogue Service for Geographic Information Resources and were organized according to different settlement levels, including urban areas, county towns, and villages. Road data were integrated from the National Catalogue Service for Geographic Information Resources, OpenStreetMap, Amap, and 2Bulu hiking-route data to improve the completeness and temporal relevance of the road-network representation. Population density data with a spatial resolution of 1 km were used to support the assessment of human activity intensity. Digital elevationmodel (DEM) data were used to characterize mountain terrain, slope conditions, and the spatial position of wilderness corridors. The boundary of Baishanzu National Park was used to analyze spatial relationships inside and outside the park. The datasets are summarized in Table 1.
Table 1.
Main spatial datasets used for wilderness identification and connectivity modeling in Baishanzu National Park and its surrounding region.
All spatial data were preprocessed in QGIS 3.40. To ensure accuracy in spatial calculation and area estimation, the datasets were projected to the Asia North Albers Equal Area Conic coordinate system. The final maps were then displayed using the Asia Lambert Conformal Conic projection for cartographic visualization. Datasets were clipped to the study-area boundary. Raster datasets used for overlay analysis and corridor modeling were harmonized to a 30 m × 30 m grid, while vector datasets, such as roads and settlements, were converted into corresponding buffer or raster layers according to the analytical requirements.
2.3. Research Framework
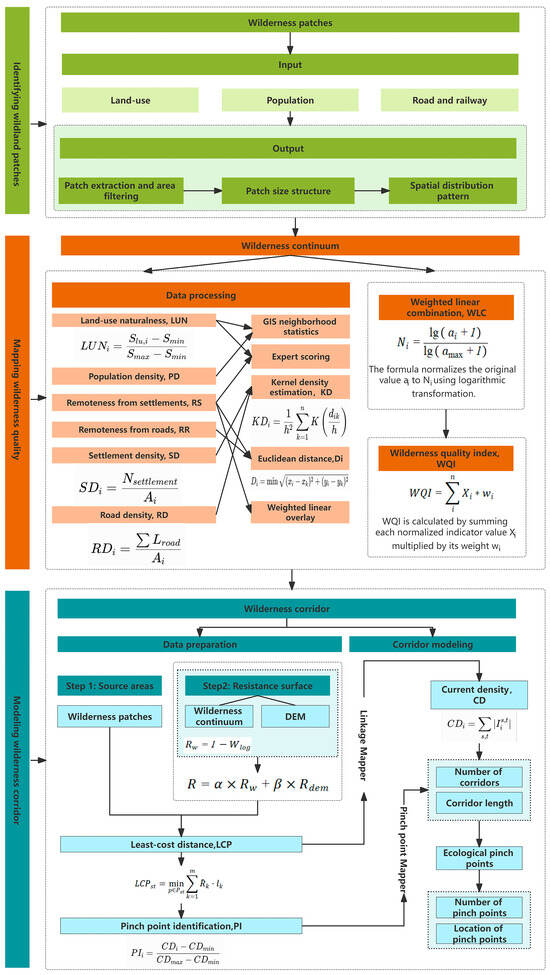
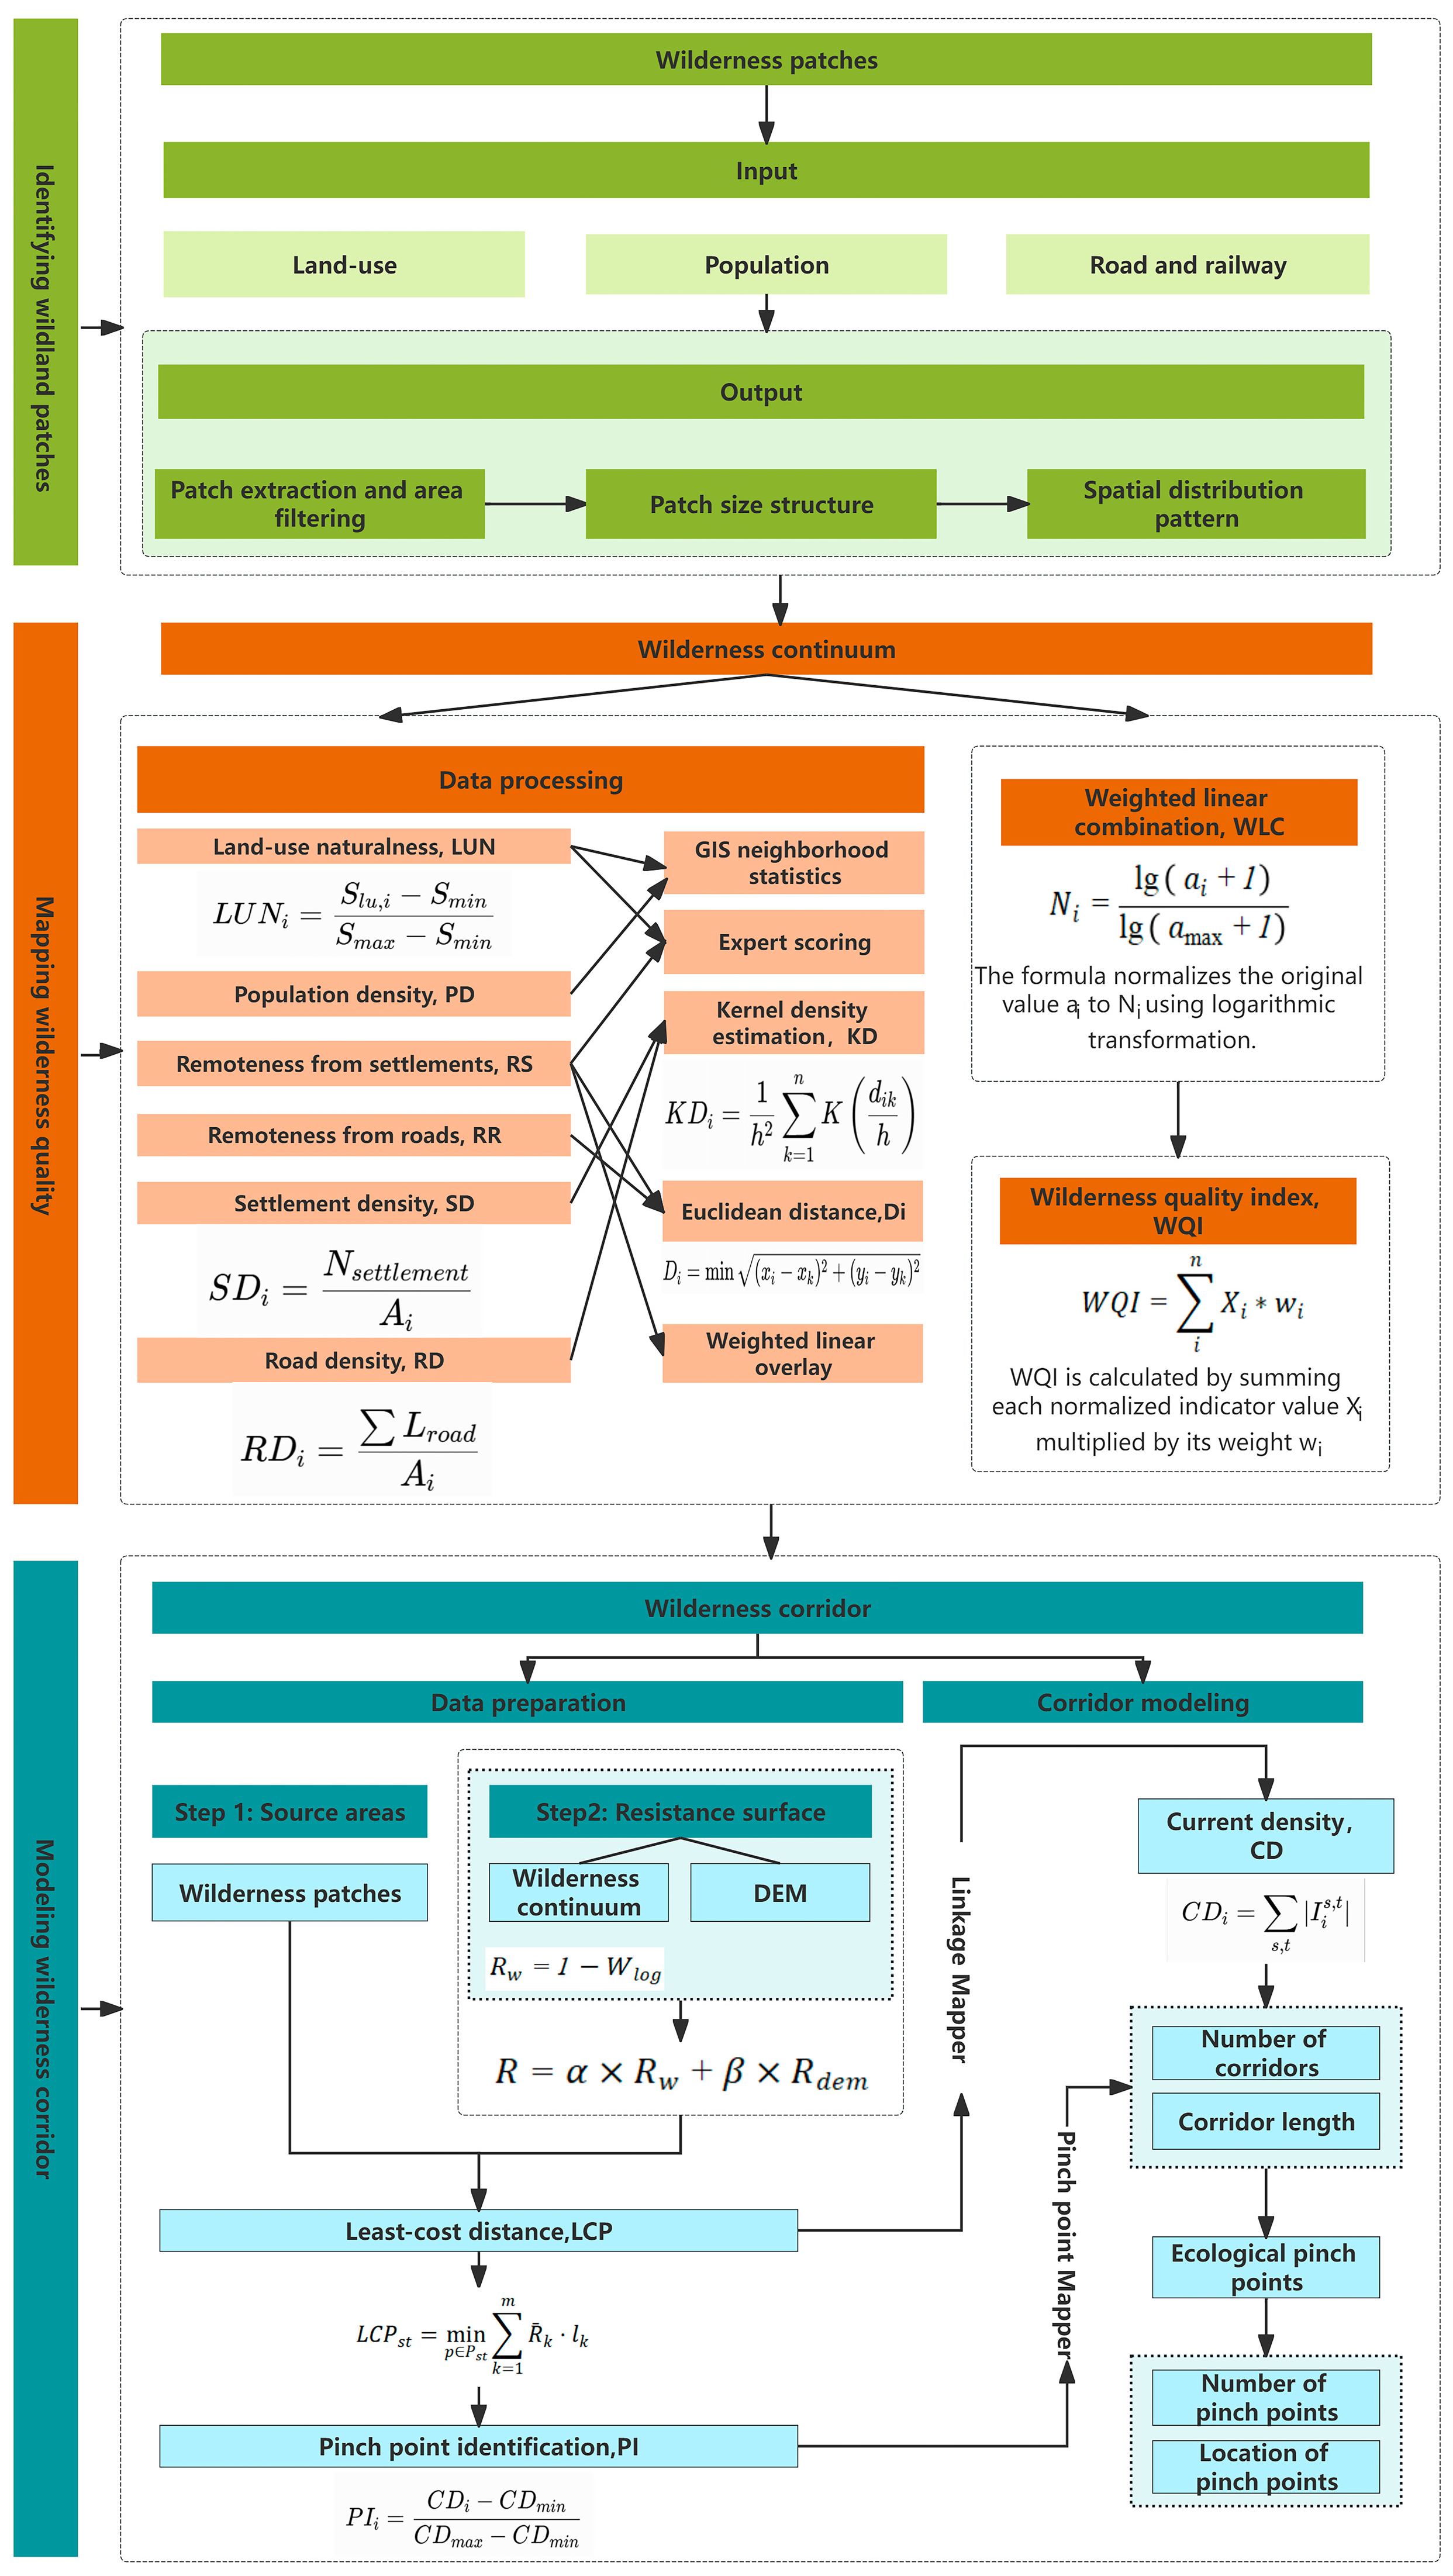
This study established a three-stage research framework (Figure 2). First, wilderness patches were identified, and their spatial characteristics were analyzed. Second, a wilderness quality index (WQI) was constructed to represent the spatial gradient of wilderness conditions across the study area. Third, wilderness corridors and pinch points were modeled based on wilderness patches and resistance surfaces. This framework provides a systematic basis for evaluating wilderness distribution, quality variation, and potential connectivity.
Figure 2.
Research framework. Wilderness patches were identified using a Boolean overlay method. Wilderness quality was evaluated using multiple indicators of naturalness and human influence. Ecological sources, wilderness corridors, and pinch points were identified to construct the wildland network.
2.4. Wilderness Patch Identification
Wilderness patches were identified using a Boolean overlay approach [13]. First, built-up land, intensively human-modified land-use types, and other areas inconsistent with wilderness attributes were excluded based on land-use data. Settlement and road buffer layers were then overlaid to exclude areas substantially affected by human settlements and transportation infrastructure. The remaining areas with relatively high naturalness and low human disturbance were identified as potential wilderness areas.
Spatially discrete wilderness patches were delineated from these candidate areas using connectivity-based segmentation. A minimum patch area of 1 km2 was applied to remove small residual fragments generated during raster overlay and to reduce the influence of edge effects at the 30 m spatial resolution [35]. This threshold was used as a regional mapping criterion rather than as a species-specific minimum habitat requirement. All patches meeting this criterion were retained for the subsequent analysis of wilderness distribution and patch characteristics.
2.5. Construction of the Wilderness Continuum
The wilderness continuum was constructed to represent the spatial gradient of wilderness quality across the study area. Unlike the Boolean identification approach, the continuum emphasizes gradual changes in naturalness and disturbance intensity, thereby providing a clearer representation of transitional spaces surrounding wilderness patches [13,18,36].
A wilderness quality index was developed based on six indicators, including land-use naturalness, distance to settlements, distance to roads, population density, settlement density and road density,. Land-use naturalness was used to reflect differences in the ecological attributes of different land-use types. Distances to settlements and roads represented the degree of remoteness, whereas population density, settlement density, and road density were used to characterize the intensity of human activities and transportation-related disturbance. Land-use naturalness, distance to settlements, and distance to roads were treated as positive indicators because their values increase with wilderness quality. Population density, settlement density, and road density were treated as negative indicators because higher values indicate stronger human disturbance. Before weighting, the directions of the six indicators were standardized so that higher normalized values consistently represented higher wilderness quality.
Because these indicators differed in units and value ranges, logarithmic normalization was applied to standardize them onto a comparable scale before overlay analysis. The normalized value of each indicator was calculated as follows:
where denotes the normalized value of indicator , is the original value of the indicator, and is the maximum value of the corresponding indicator.
After indicator normalization, differences in the relative importance of individual indicators for wilderness quality were further considered. A weighted linear combination method was used to integrate the normalized indicators into a Wilderness Quality Index (), which comprehensively represents the wilderness condition of each spatial unit. The was calculated as follows:
where six indicators were included in the calculation. represents the normalized value of each indicator, and denotes its corresponding weight. The indicator weights were adopted from the expert-weighting scheme used in previous research [13]. Land-use naturalness was assigned a weight of 0.192. Population density was assigned a weight of 0.170. Distance to settlements and distance to roads were each assigned a weight of 0.155. Settlement density and road density were each assigned a weight of 0.164. The six weights summed to 1. The weighted calculation was expressed as:
where represents land-use naturalness and represents population density. and represent distance to settlements and distance to roads. and represent settlement density and road density. Each indicator was multiplied by its corresponding weight. The six weighted values were then summed to obtain the for each raster cell. Higher values indicate higher naturalness, greater remoteness, and lower human disturbance.
2.6. Wildland Network Modeling
2.6.1. Resistance Surface
Wildland network modeling consisted of resistance surface construction, source-area definition, potential corridor identification, and pinch point detection. Among these steps, the resistance surface represents the relative cost of species movement or ecological flows across different landscape units and provides the basis for corridor network modeling.
In this study, an integrated resistance raster was constructed based on the wilderness continuum and further adjusted using elevation data to account for topographic constraints. Resistance values were assigned by considering land-use type, road disturbance, settlement influence, and the intensity of human activities. Natural and semi-natural land-use types, such as forests, shrublands, and grasslands, were assigned relatively low resistance values. In contrast, built-up land, roads, densely distributed settlements, and areas with intensive human activities were assigned higher resistance values.
where represents the preliminary resistance value derived from wilderness quality, and denotes the logarithmically normalized wilderness continuum value. Higher values indicate higher wilderness quality and therefore lower landscape resistance.
where represents the integrated resistance value, is the resistance surface derived from the wilderness continuum, and denotes the normalized DEM-based resistance term. The weighting coefficients were set to 0.7 and 0.3, respectively, indicating that wilderness naturalness was given greater importance than topographic constraints in shaping the overall resistance surface [37].
2.6.2. Source Areas
Ecological source areas are generally expected to have high ecological stability, spatial continuity, and the capacity to support species dispersal. The 10 km2 threshold was selected with reference to the area criteria applied to comparable ecological elements in regional-scale ecological network and wilderness studies [38,39,40,41]. Previous studies used 10 km2 to screen protected areas for connectivity assessment, ecological source patches capable of buffering external disturbance, and core wilderness patches; Chen et al. further found that the number and total area of candidate source patches began to stabilize at this threshold [38,39,40,41]. Considering the comparable patch types and regional-scale contexts of these studies, wilderness patches with an area equal to or greater than 10 km2 were incorporated into the ecological source-area system.
2.6.3. Wilderness Corridors
Potential wilderness corridors were identified using Linkage Mapper 3.1.0 [42]. Based on the integrated resistance surface, least-cost paths () between wilderness source patches were calculated to generate a preliminary corridor network. This method provides explicit corridor alignments and patch-to-patch connectivity relationships, making the results suitable for spatial planning, management interpretation, and conservation implementation. The calculation was expressed as follows:
where represents the minimum cumulative cost between source area and source area , and denotes all possible paths connecting the two source areas. and are the resistance values of two adjacent raster cells along a given path; their average value is used to represent the resistance of the corresponding path segment. is the length of that path segment, and m is the total number of path segments along the path.
2.6.4. Pinch Points
Pinch points within the corridor network were then detected using Pinchpoint Mapper to locate areas critical for maintaining landscape connectivity. Areas with high current density were interpreted as key bottlenecks where potential species movement or ecological flows are concentrated, indicating locations that are particularly important for maintaining wilderness connectivity. The calculation was expressed as follows:
where represents the normalized pinch-point index of the -th raster cell, denotes its original current density value, and and indicate the minimum and maximum current density values within the study area, respectively. Through this transformation, current density values were rescaled to a standardized range from 0 to 1.
3. Results
3.1. Spatial Pattern of Wildland Patches
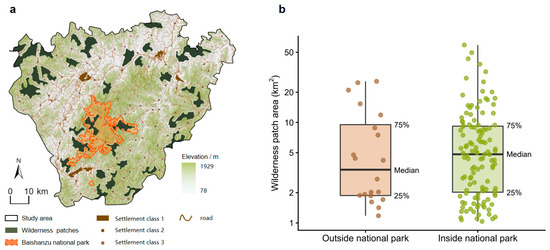
A total of 143 wildland patches were identified in the study area, covering 1102.79 km2 and accounting for 14.06% of the total study area. This proportion indicates that, although large areas of forest ecosystems are still preserved in the mountainous landscapes of southeastern China, wildlands that meet the criteria of high naturalness, low disturbance, and an area threshold greater than 1 km2 remain limited. This suggests a clear scarcity of regional wildland resources.
Spatially, wildland patches are mainly distributed in areas where montane forests are relatively well preserved, road density is low, and settlements are sparse. These patches show a discontinuous distribution along mountain ranges, forested areas, and high-elevation zones (Figure 3a). Several wildland patches remain within and around the national park. However, roads, villages, towns, and low-intensity anthropogenic land uses form barriers between the park and surrounding wildlands. Some large wildland patches are located near the edge of the study area and are spatially separated from the national park. Therefore, cross-boundary wilderness corridor connections are critical for enhancing the functional performance of the regional wildland network.
Figure 3.
Distribution of wildland patches. (a) Spatial distribution of wildland patches in the study area. The black outline delineates the study area, dark green areas indicate the identified wildland patches, and the orange line indicates the boundary of Baishanzu National Park. Brown lines represent roads, while the three brown symbols denote settlement classes 1–3. Background shading represents elevation, ranging from 78 to 1929 m; the north arrow and scale bar indicate orientation and distance, respectively. (b) Boxplot of wildland patch areas outside and inside the national park. Patch area is displayed on a logarithmic scale. Points represent individual wildland patches; boxes indicate the interquartile range (25th–75th percentiles); horizontal lines within the boxes indicate the median; and whiskers extend to the most extreme values within 1.5 times the interquartile range.
Figure 3b shows differences in the area distribution of wildland patches within and outside the national park. In the surrounding counties, wildland patches have a lower median area and a relatively narrow interquartile range, although a small number of large patches are present, indicating a certain degree of dispersion. Within the national park, wildland patches are more numerous and exhibit a wider area distribution. Their median area is slightly higher than that of the surrounding counties, and the upper quartile includes more medium-sized patches. At the same time, a large number of small-scale patches are also distributed within the park, indicating that the area structure of wildland patches remains dominated by small and small-to-medium patches.
According to Table 2, small wildland patches (1–10 km2) are the most numerous, with 114 patches covering a total area of 468.68 km2 and accounting for 42.50% of the total wildland area. Small-to-medium wildland patches (11–20 km2) include 17 patches, covering 247.12 km2, and accounting for 22.41%. Medium wildland patches (21–30 km2) include 7 patches, covering 165.17 km2, and accounting for 14.98%. Large wildland patches (31–40 km2) include 2 patches, covering 70.10 km2 and accounting for 6.36%. Extra-large wildland patches (>40 km2) include only 3 patches, covering 151.73 km2 and accounting for 13.76%. The numerical dominance of small patches indicates that wildland space in the study area is highly fragmented. Although large patches are limited in number, they are crucial for maintaining regional wildness and ecosystem integrity.
Table 2.
Area classes and size structure of wilderness patches in the study area.
3.2. Spatial Pattern of Wilderness Quality Index
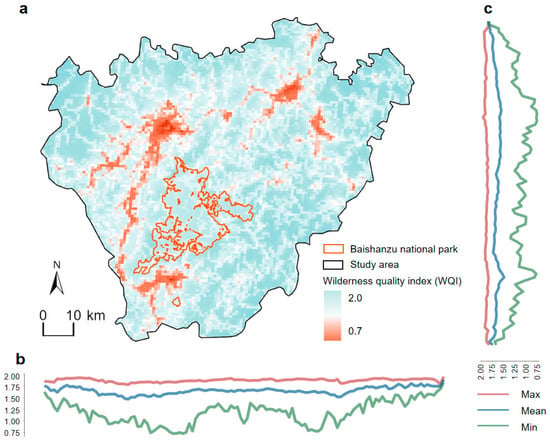
The wilderness continuum provides a direct representation of the spatial distribution of the wilderness quality index (WQI) across the study area. As shown in Figure 4a, WQI exhibits a clear spatial gradient, with higher values in the central mountainous areas and lower values in the peripheral low-elevation areas where human activities are concentrated. High-value areas are mainly distributed in the central and southern parts of the national park and in high-elevation montane forest areas, where WQI generally exceeds 1.2. Low-value areas are primarily located in peripheral low-elevation zones, especially along major transport corridors, around township construction land, and near settlements, where the WQI is generally below 0.8. These areas show strong signs of human disturbance and landscape fragmentation. Medium-value areas are mostly located between high- and low-value zones, forming belt-like or patch-like transition areas among different WQI spaces. Combined with elevation data, the high-value areas show a strong spatial overlap with high-elevation montane forests, whereas the low-value areas are highly consistent with low-elevation forests, settlement clusters, and road infrastructure corridors.
Figure 4.
Spatial distribution of the wilderness quality index (WQI) and its longitudinal and latitudinal variation. (a) Spatial distribution of WQI in the study area. The black dashed line indicates the boundary of the study area, the orange boundary indicates the extent of Baishanzu National Park, and raster colors represent WQI values. Light blue areas indicate higher WQI values, while orange-red areas indicate lower WQI values; (b) longitudinal variation curves of WQI in the study area, showing changes in the maximum, mean, and minimum WQI values across different longitude bands; (c) latitudinal variation curves of WQI in the study area, showing changes in the maximum, mean, and minimum WQI values across different latitude bands. The red curve represents the maximum value, the blue curve represents the mean value, and the green curve represents the minimum value.
In terms of the overall spatial distribution, Figure 4b shows that, along the longitudinal direction, the maximum WQI values vary only slightly across the study area, and the mean curve remains relatively stable. By contrast, the minimum-value curve fluctuates markedly, indicating substantial variation in the distribution of low-wilderness-quality areas among different longitudinal zones. Figure 4c shows that, along the latitudinal direction, the maximum and mean WQI values also remain relatively stable, whereas the minimum values vary more noticeably among different latitudinal zones. This suggests that low-value areas exhibit strong spatial heterogeneity in the north–south direction. Overall, the maximum and mean WQI values change relatively smoothly, while the minimum values show greater fluctuations, indicating that the spatial variation in wilderness quality across the study area is mainly influenced by local low-value patches.
3.3. Wildland Network and Pinch Points
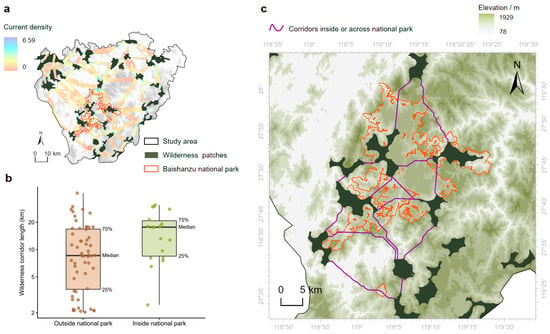
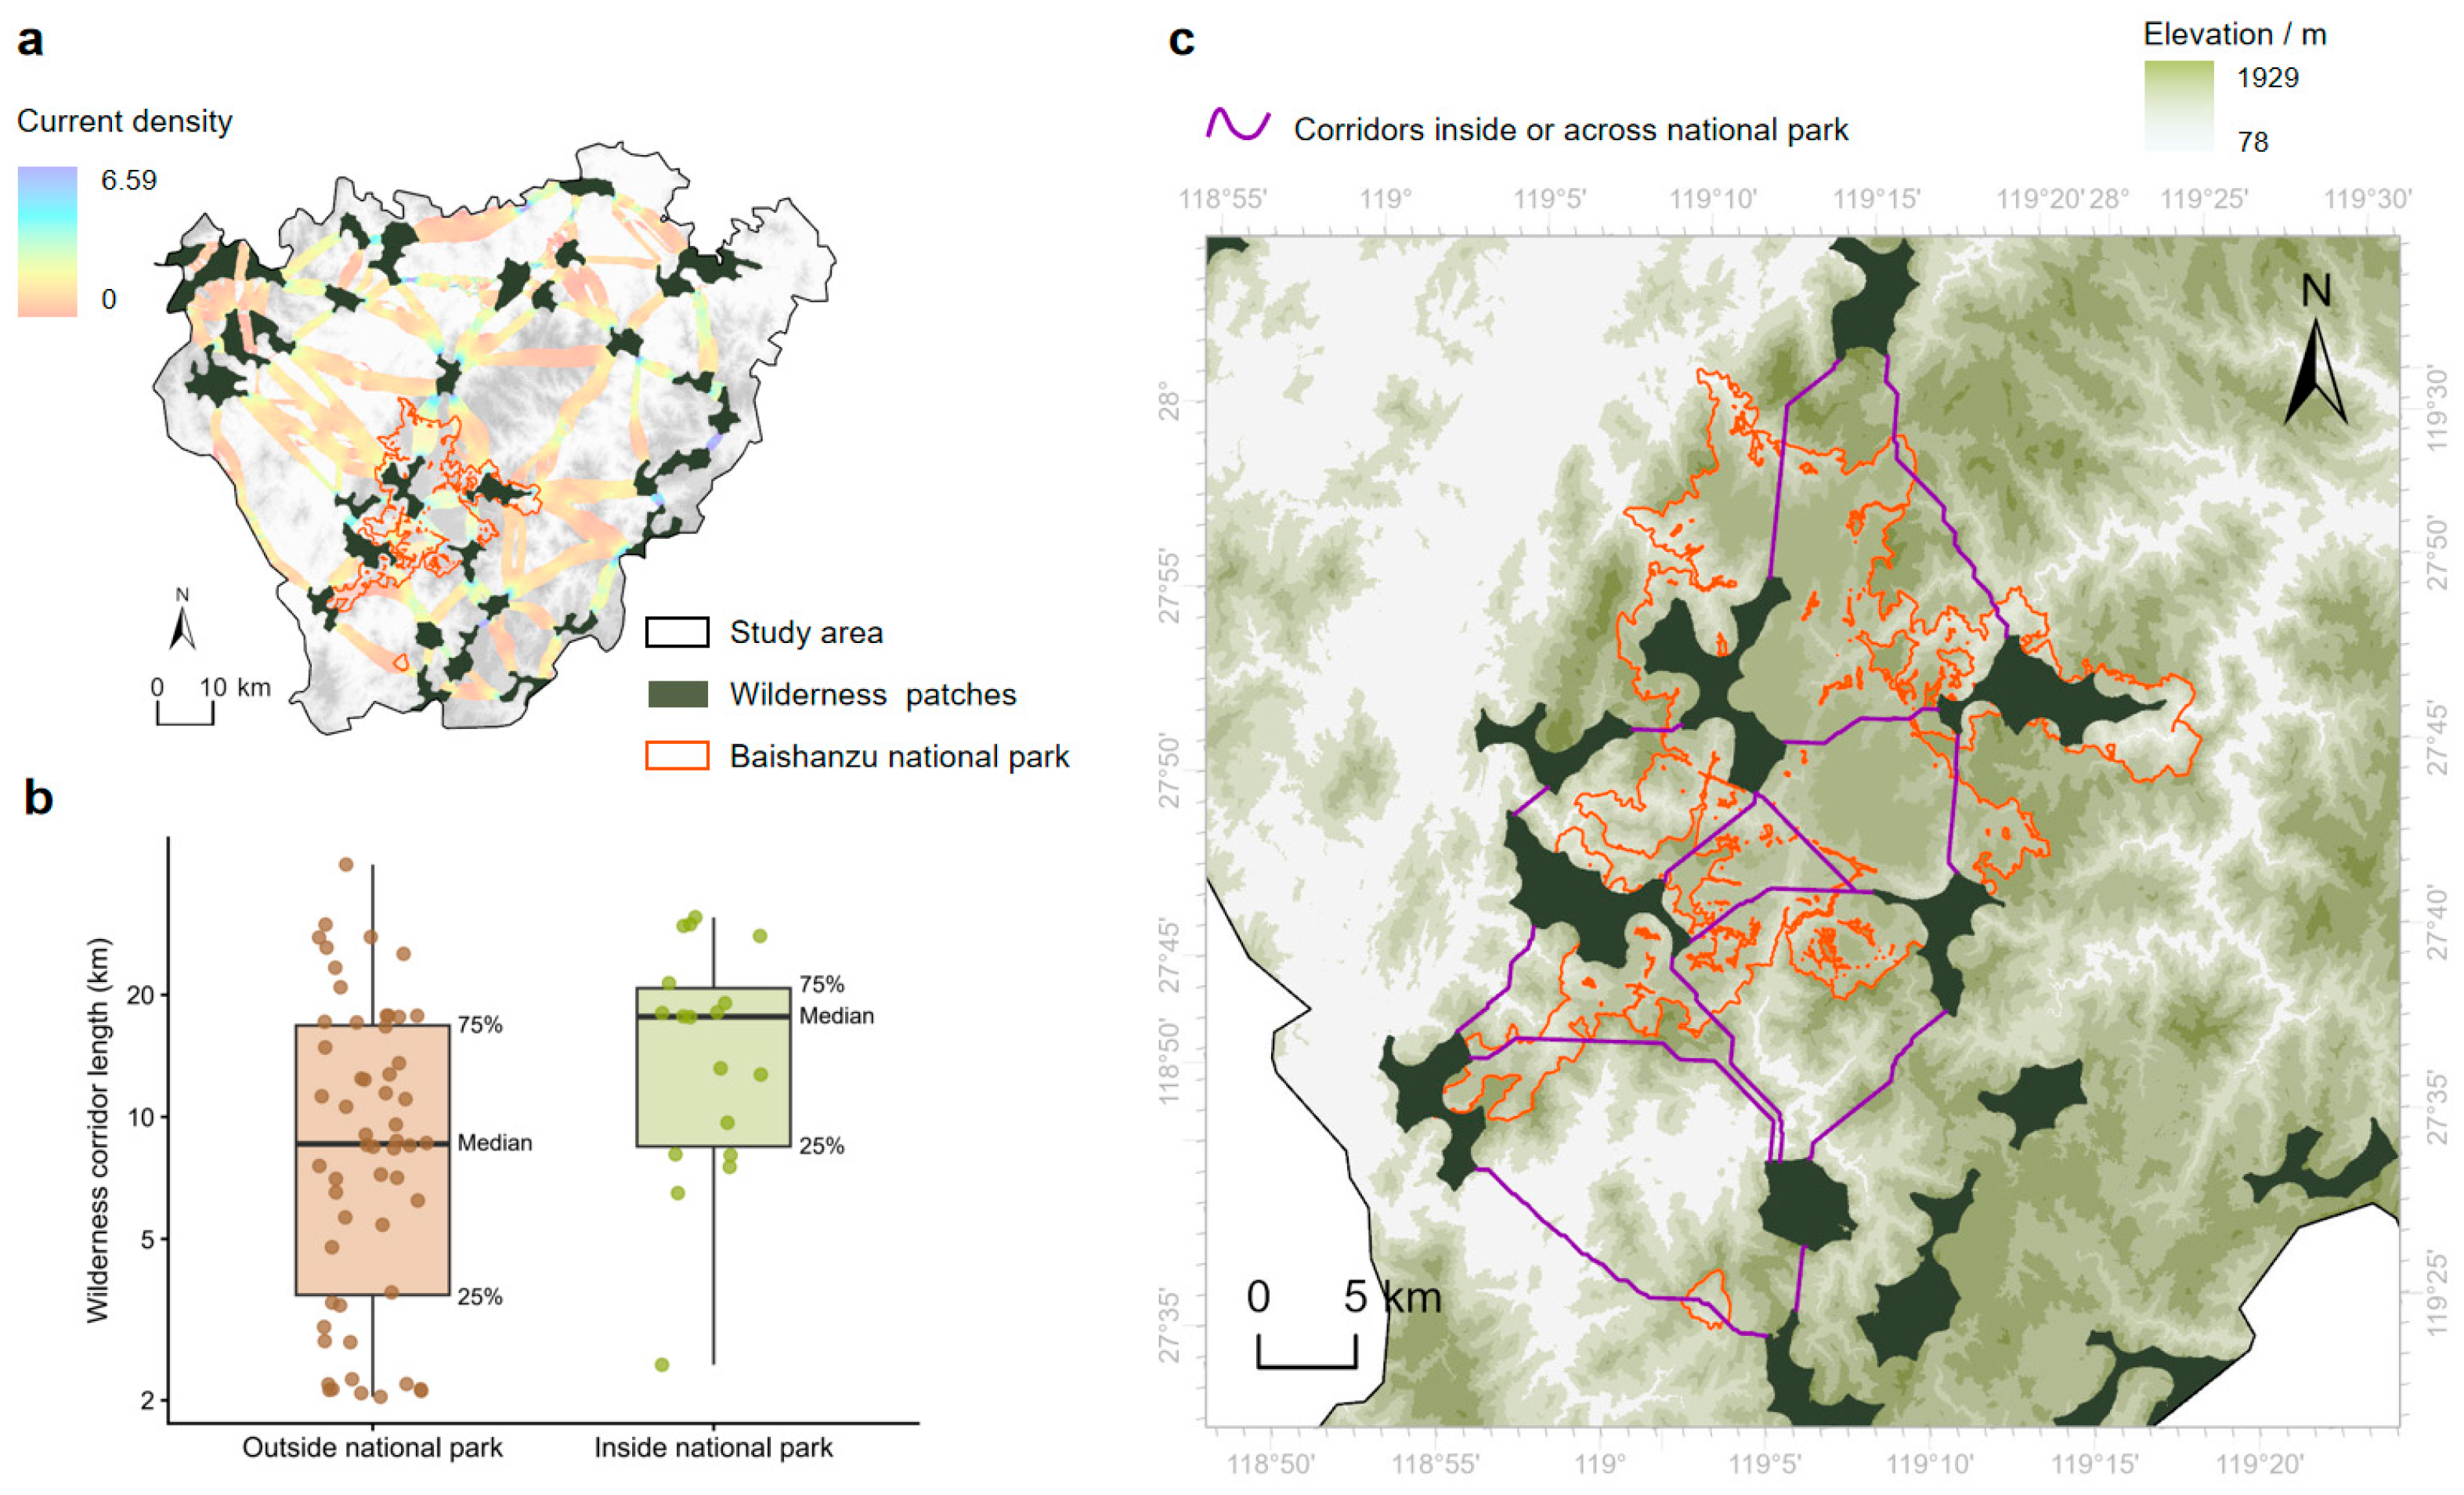
The wilderness corridor identified generally extends along continuous montane forest belts, connecting multiple wildland patches and forming a spatial wildland network. As shown in Figure 5a, the simulation identified 67 potential wilderness corridor segments, with a total length of approximately 919.15 km. Individual corridor lengths ranged from 2.04 to 41.92 km, with a mean length of 13.72 km and a median length of 9.62 km. The mean value was higher than the median, indicating a skewed distribution of corridor lengths, in which a small number of longer corridors contributed substantially to the total network length.
Figure 5.
Spatial distribution, length characteristics, and national park-scale identification of potential wilderness corridors: (a) Spatial distribution of the potential wilderness corridor network in the study area. Dark green patches indicate the identified wildland patches, the orange boundary indicates the extent of Baishanzu National Park, and the black boundary indicates the study area. The corridor color gradient represents variation in current density, with colors ranging from orange to blue–purple indicating current density from low to high; (b) boxplot of the lengths of potential wilderness corridors inside and outside the national park. The y-axis was log-transformed. The x-axis distinguishes corridors outside and inside the national park, while the y-axis represents corridor length. Points indicate individual corridors; boxes represent the 25th–75th percentile range; horizontal lines within the boxes indicate the median, and whiskers show the distribution range of corridor lengths; (c) distribution of potential wilderness corridors located within Baishanzu National Park and crossing the park boundary. Purple lines indicate corridors located within the national park or crossing its boundary; the orange boundary indicates the extent of Baishanzu National Park; dark green patches indicate wildland patches; and the base map colors represent elevation variation.
In terms of length structure, short-distance corridors shorter than 4 km accounted for 23.88% of the corridor network and constituted an important component for connecting nearby wildland patches. Although medium- to long-distance corridors were fewer in number, they had greater structural significance in linking relatively dispersed patch clusters and maintaining cross-regional ecological connectivity. This indicates that potential ecological connectivity in the study area includes both local-scale connections and inter-patch-scale connections.
Figure 5b compares the distribution characteristics of potential corridor lengths inside and outside the national park. In the surrounding counties, corridors were more numerous and showed a wider length distribution, including many short-distance corridors as well as some medium- to long-distance corridors, resulting in a higher overall degree of dispersion. Within the national park, the number of corridors was relatively smaller, but the median corridor length was higher, and the box range was mainly concentrated within longer-distance intervals. This suggests that the internal corridors of the park were generally larger in spatial scale.
Overall, corridor lengths outside the national park exhibited more pronounced variation, whereas corridor lengths within the park were relatively concentrated. Together, these corridors constitute the spatial connectivity basis of the potential wilderness corridor network in the study area. At the national park scale, Figure 5c further shows the potential wilderness corridors located within Baishanzu National Park and those crossing the park boundary. Compared with the overall corridor network of the study area, park-scale corridors were more concentrated in the central, southern, and eastern mountainous areas, where wildland patches are densely distributed, and were connected to surrounding wildland patches through several cross-boundary corridors. In general, corridors inside and outside the park jointly formed a connectivity pattern centered on wildland patches within the national park and extending outward to surrounding montane forest patches.
Table 3 summarizes the length classification of the potential wilderness corridor. Among the 67 potential wilderness corridor segments, short-distance corridors shorter than 4 km were the most numerous, with 16 segments, accounting for 23.88% of the total number of corridors. Medium-distance corridors (9–12 km) ranked second, with 15 segments, accounting for 22.39%. Long-distance corridors greater than or equal to 20 km included 13 segments, accounting for 19.40%. Medium-to-long-distance corridors (13–19 km) included 12 segments, accounting for 17.91%, while short-to-medium-distance corridors (4–8 km) were the least numerous, with 11 segments, accounting for 16.42%.
Table 3.
Length classes of potential wilderness corridors.
Overall, the length structure of the potential wilderness corridor in the study area was relatively dispersed. Short-distance corridors accounted for the highest proportion, while medium- and long-distance corridors also represented a substantial share. This indicates that the corridor network contains two scale-related connectivity characteristics: local patch connections and cross-regional patch connections.
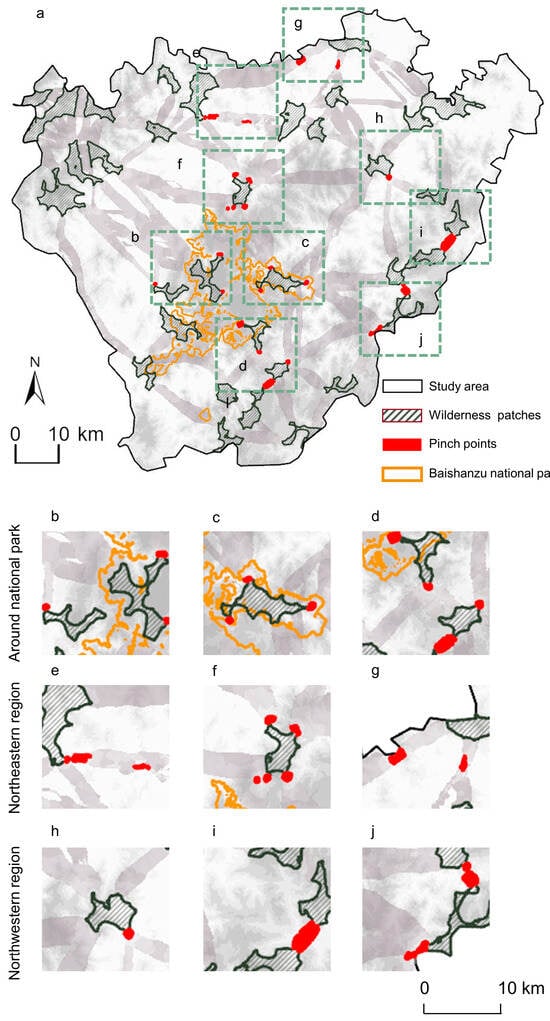
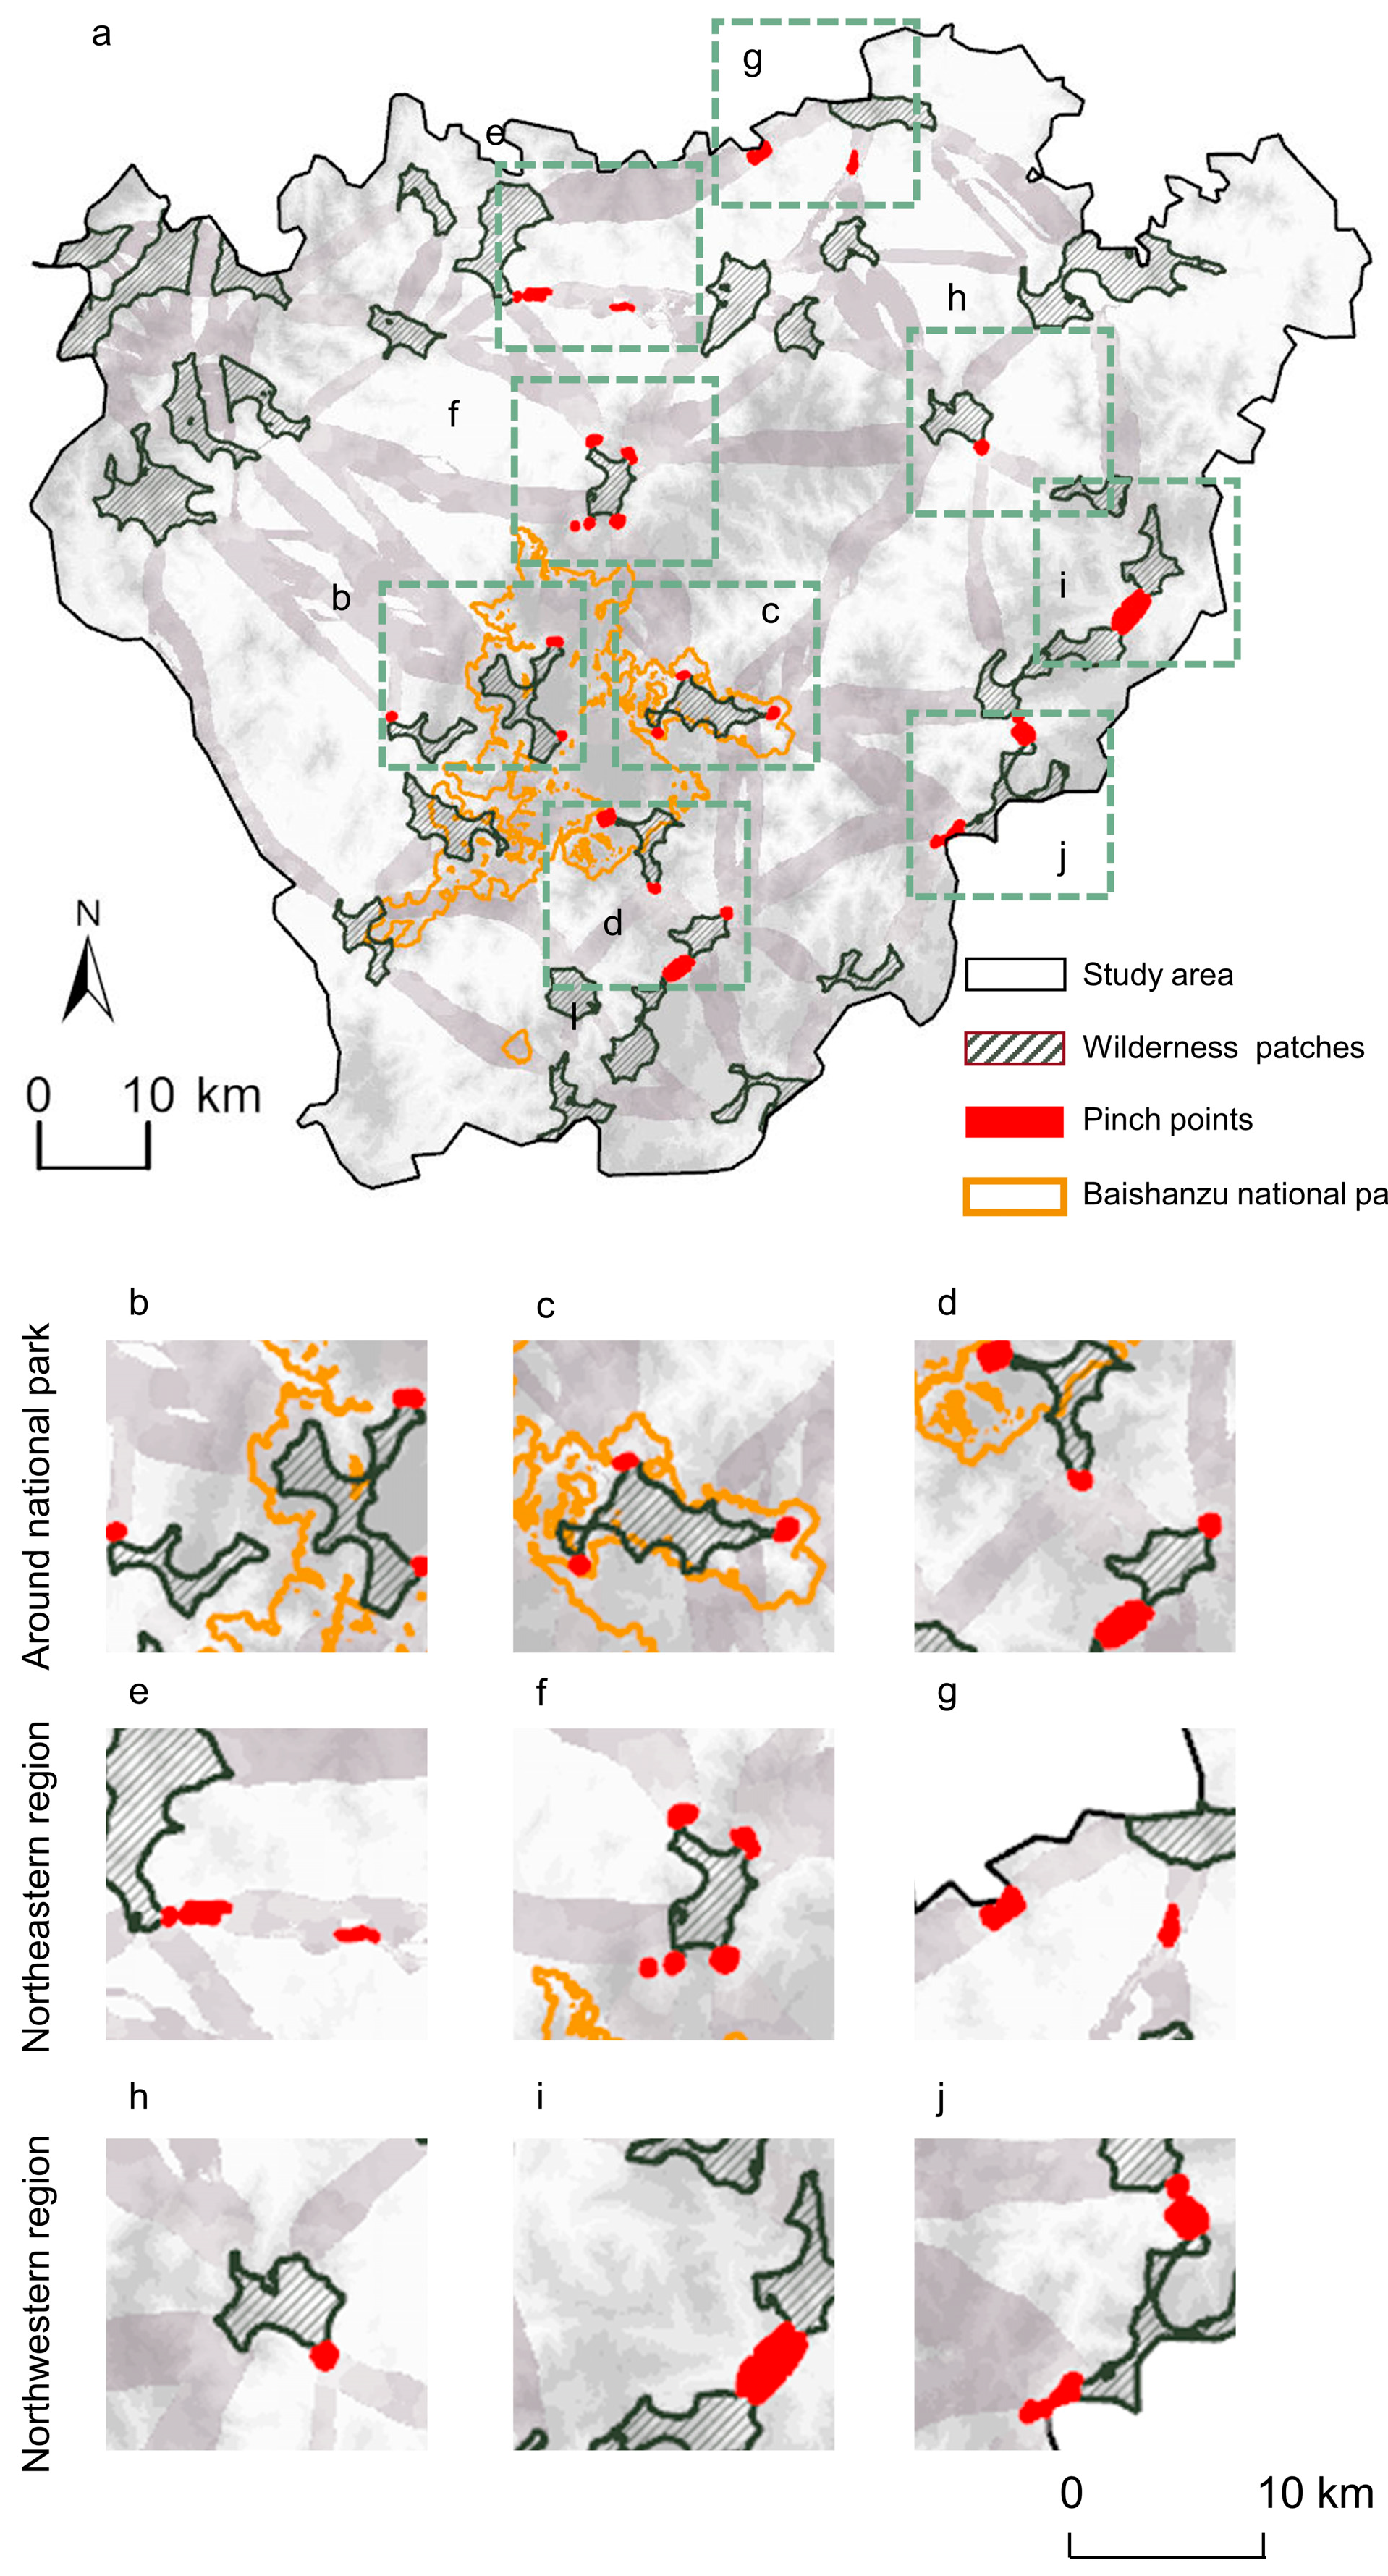
The pinch point identification results showed that a total of 26 pinch points were identified in the study area, generally exhibiting clustered distributions in point-like or short belt-like forms (Figure 6). Spatially, these pinch points were mainly concentrated in three types of areas: the national park, the northeastern part of the study area, and the northwestern part of the study area. Most pinch points occurred where potential wilderness corridors became constricted, where topographic transitions were pronounced, and where natural spaces intersected with areas of human land use. This indicates that ecological connectivity in the study area is jointly shaped by topographic constraints and human activities. Detailed information on the identified pinch points is provided in Supplementary Table S1.
Figure 6.
Spatial distribution of pinch points and enlarged views of typical areas. (a) Overall spatial distribution of ecological pinch points in the study area. The black boundary indicates the extent of the study area; the green hatched areas represent wildland patches; the red areas indicate the identified ecological pinch points; the orange dashed boundary indicates the extent of Baishanzu National Park; and the green dashed boxes mark the enlarged areas of typical pinch points. (b–j) Enlarged views of typical ecological pinch points. Panels (b–d) show the distribution of pinch points in the areas surrounding the national park; (e–g) show the distribution of pinch points in the northeastern part of the study area; and (h–j) show the distribution of pinch points in the northwestern part of the study area.
In terms of regional differences, pinch points around the national park were mainly distributed in Longquan City, generally clustering around the periphery of core wildland areas. In the northeastern part of the study area, pinch points were mainly concentrated around Dongkeng Town, Yanxi Township, and Dajun Township, and were mostly located near farmland, village and township activity spaces, and ridgelines. In the northwestern part of the study area, pinch points were mainly distributed around Chishi Township, Shitang Town, and Daotai Township, where the surrounding land-use pattern was more fragmented and the influence of construction land and village–town activity spaces on corridor continuity was more pronounced.
Overall, pinch points highlight the key constrained locations within the potential wilderness corridor network that are most vulnerable to topographic narrowing, road fragmentation, and human land-use disturbance.
4. Discussion
4.1. Cross-Boundary Rewilding
This study shows that rewilding in national parks should not be limited to habitat restoration within park boundaries but should be extended to the reconstruction of wilderness connectivity across administrative and management boundaries. Early rewilding studies proposed the conservation logic of the Cores–Corridors–Carnivores (3Cs) framework, emphasizing the combined role of large natural patches, ecological connectivity, and key trophic processes in maintaining ecosystem integrity [43]. Recent studies further suggest that the core objective of rewilding is not simply to expand protected areas but to restore natural processes, enhance ecosystem self-sustaining capacity, and rebuild ecological connections in fragmented landscapes [10,11,16,44]. This view is consistent with the policy direction of the Kunming–Montreal Global Biodiversity Framework [5] and the IUCN guidelines for conserving connectivity [45], which emphasize that protected area systems should not only be representative and effectively managed but also be integrated into wider landscapes through wilderness corridors.
The empirical results from Baishanzu National Park support this argument. Although the study area still retains a certain extent of high-naturalness wilderness, the overall pattern of wilderness patches is fragmented. Small patches are dominant, while some large patches are located outside the national park or near the boundaries of the national park. Higher levels of connectivity are therefore needed to form a larger wildland network. This suggests that the conservation effectiveness of national parks may depend not only on the ecological quality of ecosystems within boundaries but also on whether these habitats remain effectively connected with surrounding wilderness patches [46,47]. For mountain landscapes in the economically developed eastern region of China, national park boundaries are necessary for management, but they are insufficient to fully provide the spatial extent required for species dispersal, gene flow, and ecological processes [28].
Therefore, the focus of cross-boundary rewilding should shift from protecting individual wilderness patches to maintaining a highly connected wildland network. In this framework, wilderness patches can be regarded as source areas for the recovery of natural processes, corridors form the spatial network for dispersal and exchange among wilderness patches, and pinch points represent key weak links that affect network efficiency. The pinch points identified in this study are mainly located along roads, village edges, and transitional zones between forests and human areas, reflecting concentrated spatial conflicts between natural processes and human activities. Compared with ecological restoration, prioritizing interventions at these pinch points, such as wildlife passages, vegetation planting, forest-edge restoration, and passive rewilding, is more likely to improve the connectivity efficiency of the whole wildland network with limited intervention [48,49,50,51].
4.2. The Connectivity Dimension of Rewilding
Connectivity is increasingly recognized as a cornerstone of contemporary conservation and rewilding strategies. Despite its central role in global conservation policy, connectivity remains difficult to define and quantify operationally, creating challenges for translating international targets into site-level management actions [52,53,54]. This challenge is particularly relevant for national parks, where maintaining ecological processes requires not only protecting habitat patches but also sustaining movement pathways that facilitate dispersal, migration, gene flow, and species interactions [55,56].
Within rewilding theory, connectivity forms one of the three foundational components of the classic 3Cs framework, alongside large core areas and keystone species [43]. The wilderness-corridor approach adopted in this study operationalizes this principle using resistance surfaces derived from land-cover data combined with least-cost path and circuit-theory analyses. Similar approaches have been widely applied in conservation planning and have proven effective for identifying movement pathways, ecological bottlenecks, and restoration priorities across fragmented landscapes [45]. By integrating least-cost path modeling and pinch-point analysis, the framework identifies not only potential corridors linking wilderness cores but also critical bottleneck locations where connectivity is most vulnerable to disruption. These areas represent strategic targets for rewilding interventions, including habitat restoration and the establishment of ecological stepping stones.
A fundamental distinction in connectivity science is that between structural and functional connectivity. Structural connectivity refers to the physical arrangement and spatial configuration of habitat patches, whereas functional connectivity describes the extent to which landscapes facilitate or impede organism movement and gene flow [57]. Because functional connectivity is influenced by species-specific ecological traits and behavioral responses, structurally connected habitats do not necessarily represent effective movement pathways for all species [58]. Nevertheless, structural approaches remain valuable where biological monitoring data are limited, as they provide a spatially explicit framework for identifying potential movement corridors and restoration priorities [13].
The corridor network developed in this study therefore represents a structural connectivity assessment derived from remotely sensed land-cover data and resistance-surface modeling, providing a baseline for future species-specific validation. A major advantage of structural connectivity modeling is its ability to generate actionable conservation priorities using freely available spatial datasets [59]. Such approaches are particularly valuable in data-limited contexts where telemetry, occupancy, or genetic information may be unavailable. However, validation through field-based monitoring remains necessary to determine the extent to which these structural corridors support actual ecological connectivity [60].
4.3. Comparison with Wildland Network Studies in Mountainous Protected Areas
Resistance-surface construction and ecological-source selection are fundamental to wilderness connectivity analysis, and their configuration reflects both the study objectives and regional landscape characteristics. Previous studies have demonstrated that source selection and resistance assignment can substantially influence network patterns and have established wildland patches as suitable ecological sources for regional connectivity assessments [18,28]. On this basis, the present study combined the wilderness continuum with mountainous terrain characteristics to represent naturalness, human disturbance, and topographic constraints, and selected spatially continuous wildland patches as ecological sources. This integrated framework enabled wildland patches inside and outside Baishanzu National Park to be assessed consistently and supported the identification of potential cross-boundary ecological connections.
Critical-node identification provides a means of locating areas where ecological flows are constrained and landscape connectivity is relatively weak. Previous research has shown that ecological flows tend to concentrate in continuous mountainous landscapes and narrow connections constrained by urban development [61]. The results for Baishanzu National Park and its surrounding areas show a comparable pattern, with important connections concentrated in continuous mountain forests and narrow landscape passages. However, rather than evaluating generalized ecological flows alone, the present study linked critical nodes to explicitly defined ecological sources and wilderness corridors. This approach relates each node to a specific landscape connection and extends the connectivity assessment to nodes located outside or crossing the national park boundary.
4.4. Policy Implications
The protection of ecosystem authenticity and integrity in China’s national parks may need to extend beyond the static conservation of core habitats to encompass the spatial connectivity among wilderness patches and the continuity of the ecological processes that these connections support [62]. Under the influence of roads, settlements, and low-elevation development activities, wilderness patches in this region show a certain degree of fragmentation, and some potential corridors are locally obstructed. The results suggest that, in areas with high levels of human activity, national park construction should incorporate wildland networks into territorial spatial regulation and national park management systems [63]. By identifying wilderness patches, potential wilderness corridors, and pinch points, it is possible to clarify the spatial boundaries, key nodes, and governance priorities for ecological connectivity conservation, thereby providing spatial evidence for shifting national park conservation from isolated patch protection toward network-based protection.
Wilderness corridor governance should also move from general spatial protection toward problem-oriented and refined management [64]. In Baishanzu National Park and its surrounding area, pinch points are mainly distributed in areas affected by road fragmentation, valley constriction, and the interface between forestland and agricultural or built-up land. This indicates that weak points in corridor connectivity are not always caused by large-scale habitat loss, but often by local barriers that compress species movement pathways [65]. Therefore, pinch points should be treated as priority areas for corridor restoration and engineering intervention, with differentiated measures adopted according to barrier type. In road-disturbed areas, culvert-type wildlife passages, guiding fences, speed limits, and warning systems can be combined to reduce wildlife crossing risks. Along ridge and valley corridors, vegetation continuity and human activity control should be strengthened. In areas where villages, recreational routes, and corridors overlap, ecological buffers, community collaboration, and low-disturbance use should be introduced to coordinate conservation objectives with local use demands [66]. In this way, wilderness corridors can be transformed from mapped connectivity features into manageable, restorable, constructible, and maintainable conservation units within the national park system.
4.5. Research Limitations and Future Research
This study has several limitations in representing the dynamic processes that shape wilderness connectivity. The identification of wilderness areas, resistance surfaces, corridors, and pinch points was mainly based on static spatial variables, including land use, roads, settlements, elevation, and human activity intensity. Although these variables can capture the basic spatial structure of the wildland network, they cannot fully reflect temporal variations in disturbance, such as traffic flow, seasonal tourism, village activities, land-use change, and differences in management intensity. In particular, the use of single-period land-use data cannot capture multi-temporal land-use transitions and the associated changes in ecological functions and landscape permeability. Future studies should incorporate multi-temporal remote sensing, nighttime light data, road traffic records, recreational trajectories, patrol records, and community-based observations to develop a temporally explicit disturbance assessment framework. This would allow resistance surfaces to better reflect seasonal changes, use intensity, and alternative management scenarios, thereby improving the dynamic interpretation of wilderness connectivity.
Further research is also needed to strengthen the ecological validation and planning application of wildland network models. The corridors and pinch points identified in this study remain subject to uncertainties related to resistance assignment, corridor width, bottleneck intensity, and species-specific movement suitability. Because fine-scale, species-specific movement data were unavailable, the identified corridors primarily represent general landscape connectivity rather than movement pathways validated for individual species. Differences in dispersal distance, habitat preference, and sensitivity to human disturbance may therefore affect their suitability for different taxa. Future studies could integrate camera-trap data, footprint surveys, roadkill records, environmental DNA, acoustic monitoring, and population genetic data to validate model outputs across multiple taxa and habitat conditions. Field inspections of corridor construction conditions within Baishanzu National Park, together with cross-checking using Google Earth imagery, provided preliminary verification of corridor locations and surrounding landscape features. However, this validation was mainly concentrated within the national park and did not directly confirm wildlife use or the long-term functional connectivity of external and cross-boundary corridors.
At the same time, greater attention should be paid to translating ecological connectivity results into spatial governance evidence. Wilderness patches, corridor structures, and pinch-point locations should be linked more explicitly with corridor boundary delineation, restoration prioritization, cross-administrative coordination, development control, and ecological restoration programs. In this sense, wilderness connectivity research should move beyond landscape pattern interpretation and develop into a planning-oriented decision-support framework for national park management, land-use regulation, and biodiversity governance.
5. Conclusions
This study developed a rewilding-oriented framework integrating wilderness patch identification, wilderness quality assessment, resistance-surface construction, and connectivity modeling for Baishanzu National Park and its surrounding landscape and identified a fragmented network of 143 wilderness patches, 67 potential corridors, and 26 pinch points, demonstrating that conservation-relevant ecological connections extend beyond the park boundary. These findings support a shift from boundary-centered habitat protection toward cross-boundary wildland network governance, in which wilderness patches, corridors, and pinch points can serve as differentiated spatial units for conservation, restoration, and coordinated landscape management. Nevertheless, the identified network should be interpreted as a planning-oriented representation of potential connectivity rather than direct evidence of realized species movement. Its robustness is constrained by relatively static representations of human disturbance, uncertainties in resistance settings, and species-specific responses, as well as the remaining gap between model outputs and implementable spatial governance instruments. Future work should therefore integrate dynamic disturbance data and field-based ecological validation while translating identified network elements into operational tools for national park planning, cross-administrative coordination, restoration prioritization, and land-use regulation. In this way, wildland network modeling can better support adaptive rewilding and landscape-scale biodiversity conservation in human-dominated mountain regions.
Supplementary Materials
The following supporting information can be downloaded at: https://www.mdpi.com/article/10.3390/land15081439/s1, Table S1: Spatial location and area of pinch points.
Author Contributions
Conceptualization, Y.C. and Y.H.; methodology, Y.H., T.F. and Y.C.; validation, Y.H. and T.F.; formal analysis, Y.H.; investigation, Y.H., T.F., Z.Y., S.Z. and Y.C.; data curation, Y.H. and T.F.; writing—original draft preparation, Y.H., T.F., Z.Y. and S.Z.; writing—review and editing, Y.H., T.F., Z.Y., S.Z., C.W. (Chunwei Wu), W.Z., C.W. (Chunyu Wang) and Y.C.; visualization, Y.H., T.F. and Z.Y.; supervision, Y.C.; funding acquisition, Y.C., C.W. (Chunwei Wu) and W.Z.; project administration, Y.C. All authors have read and agreed to the published version of the manuscript.
Funding
This research was funded by the Key Laboratory of New Technology for Construction of Cities in Mountain Area, Ministry of Education, China (Grant No. LNTCCMA20250101), the Baishanzu Administration, Qianjiangyuan–Baishanzu National Park (project “Opportunity Mapping for Rewilding in the Baishanzu Area of the Qianjiangyuan–Baishanzu National Park Candidate Area from an Ecological Conservation Priority Perspective”), and the National Natural Science Foundation of China (Grant No. 52408075).
Data Availability Statement
The original contributions presented in the study are included in the article. Further inquiries can be directed to the corresponding author.
Conflicts of Interest
The authors declare no conflicts of interest.
Abbreviations
The following abbreviations are used in this manuscript:
| WQI | Wilderness quality index |
| LCD | Least-cost distance |
| LCP | Least-Cost Path |
References
- Morgera, E.; Tsioumani, E. Yesterday, today, and tomorrow: Looking afresh at the Convention on Biological Diversity. Yearb. Int. Environ. Law 2011, 21, 3–40. [Google Scholar]
- Bennett, G.; Mulongoy, K.J. Review of experience with ecological networks, corridors and buffer zones. In Secretariat of the Convention on Biological Diversity, Montreal, Technical Series, 2006; Secretariat of the Convention on Biological Diversity Montreal: Montreal, QC, Canada, 2006. [Google Scholar]
- Veldhuis, M.P.; Ritchie, M.E.; Ogutu, J.O.; Morrison, T.A.; Beale, C.M.; Estes, A.B.; Mwakilema, W.; Ojwang, G.O.; Parr, C.L.; Probert, J.; et al. Cross-boundary human impacts compromise the Serengeti-Mara ecosystem. Science 2019, 363, 1424–1428. [Google Scholar] [CrossRef] [Scilit] [PubMed]
- Mcdonald, R.I.; Kareiva, P.; Forman, R.T. The implications of current and future urbanization for global protected areas and biodiversity conservation. Biol. Conserv. 2008, 141, 1695–1703. [Google Scholar] [CrossRef] [Scilit]
- Convention on Biological Diversity. Kunming–Montreal Global Biodiversity Framework; Decision CBD/COP/DEC/15/4; Secretariat of the Convention on Biological Diversity: Montreal, QC, Canada, 2022. [Google Scholar]
- United Nations General Assembly. Transforming Our World: The 2030 Agenda for Sustainable Development; Resolution A/RES/70/1; United Nations: New York, NY, USA, 2015. [Google Scholar]
- Brennan, A.; Naidoo, R.; Greenstreet, L.; Mehrabi, Z.; Ramankutty, N.; Kremen, C. Functional connectivity of the world’s protected areas. Science 2022, 376, 1101–1104. [Google Scholar] [CrossRef] [Scilit] [PubMed]
- Cumming, G.S. Protected area management has significant spillover effects on vegetation. Nature 2026, 650, 642–651. [Google Scholar] [PubMed]
- Carver, S. Rewilding through land abandonment. Rewilding 2019, 1, 99–122. [Google Scholar] [CrossRef] [Scilit]
- Araujo, M.B.; Alagador, D. Expanding European protected areas through rewilding. Curr. Biol. 2024, 34, 3931–3940.e5. [Google Scholar] [CrossRef] [Scilit] [PubMed]
- Carver, S.; Convery, I.; Hawkins, S.; Beyers, R.; Eagle, A.; Kun, Z.; Van Maanen, E.; Cao, Y.; Fisher, M.; Edwards, S.R. Guiding principles for rewilding. Conserv. Biol. 2021, 35, 1882–1893. [Google Scholar] [CrossRef] [Scilit] [PubMed]
- Feng, Y.; Cao, Y.; Chan, M.Y.; Ye, Z.; Zhao, Z.; Yu, L.; Liang, Y.; Carver, S.; Yang, R. Assessing ecosystem integrity in protected areas: A systematic review of methods and applications. Biol. Conserv. 2025, 305, 111057. [Google Scholar] [CrossRef] [Scilit]
- Cao, Y.; Carver, S.; Yang, R. Mapping wilderness in China: Comparing and integrating Boolean and WLC approaches. Landsc. Urban Plan. 2019, 192, 103636. [Google Scholar] [CrossRef] [Scilit]
- Zhao, Z.; Yang, R. The concept of national park authenticity and integrity in China and its evaluation framework. Biodivers. Sci. 2021, 29, 1271–1278. [Google Scholar] [CrossRef] [Scilit]
- Berti, E.; Svenning, J.C. Megafauna extinctions have reduced biotic connectivity worldwide. Glob. Ecol. Biogeogr. 2020, 29, 2131–2142. [Google Scholar] [CrossRef] [Scilit]
- Perino, A.; Pereira, H.M.; Navarro, L.M.; Fernández, N.; Bullock, J.M.; Ceaușu, S.; Cortés-Avizanda, A.; van Klink, R.; Kuemmerle, T.; Lomba, A.; et al. Rewilding complex ecosystems. Science 2019, 364, eaav5570. [Google Scholar] [CrossRef] [Scilit] [PubMed]
- Pelletier, D.; Clark, M.; Anderson, M.G.; Rayfield, B.; Wulder, M.A.; Cardille, J.A. Applying circuit theory for corridor expansion and management at regional scales: Tiling, pinch points, and omnidirectional connectivity. PLoS ONE 2014, 9, e84135. [Google Scholar] [CrossRef] [Scilit] [PubMed]
- Cao, Y.; Yang, R.; Carver, S. Linking wilderness mapping and connectivity modelling: A methodological framework for wildland network planning. Biol. Conserv. 2020, 251, 108679. [Google Scholar] [CrossRef] [Scilit]
- Xu, B.; Zhang, Y.; Lin, W. A connectivity modeling and evaluating methodological framework in biodiversity hotspots based on naturalness and linking wilderness. Conserv. Sci. Pract. 2022, 4, e12750. [Google Scholar] [CrossRef] [Scilit]
- Ye, J.; Xiao, C.; Feng, Z.; Qiao, T. A review of global wilderness area identification since the 21st century. J. Environ. Manag. 2024, 358, 120946. [Google Scholar] [CrossRef] [Scilit] [PubMed]
- Chen, Y.; Cao, Y.; Ye, Z.; Liu, T.; Wang, P.; Feng, Y.; Liao, L.; Lv, M.; Zhao, Z.; Watson, A.E.; et al. A new method for planning long-distance trails using wilderness quality mapping and trajectory data: A case study of the Taihang Mountain National Forest Trail in China. J. Environ. Manag. 2026, 402, 129019. [Google Scholar] [CrossRef] [Scilit] [PubMed]
- Li, F.; Ye, Y.; Song, B.; Wang, R. Evaluation of urban suitable ecological land based on the minimum cumulative resistance model: A case study from Changzhou, China. Ecol. Model. 2015, 318, 194–203. [Google Scholar]
- Gallo, J.A.; Butts, E.C.; Miewald, T.A.; Foster, K.A. Comparing and Combining Omniscape and Linkage Mapper Connectivity Analyses in Western Washington; Conservation Biology Institute: Corvallis, OR, USA, 2019. [Google Scholar]
- Landau, V.A.; Shah, V.B.; Anantharaman, R.; Hall, K.R. Omniscape.jl: Software to compute omnidirectional landscape connectivity. J. Open Source Softw. 2021, 6, 2829. [Google Scholar] [CrossRef] [Scilit]
- Dickson, B.G.; Albano, C.M.; Anantharaman, R.; Beier, P.; Fargione, J.; Graves, T.A.; Gray, M.E.; Hall, K.R.; Lawler, J.J.; Leonard, P.B.; et al. Circuit-theory applications to connectivity science and conservation. Conserv. Biol. 2019, 33, 239–249. [Google Scholar] [PubMed]
- Cai, Y.; Zhang, Y.; Wu, Y. Theoretical framework and differentiated policies for national park zoning management: A Baishanzu case study in China. Iscience 2024, 27, 111377. [Google Scholar] [CrossRef] [Scilit] [PubMed]
- Zhong, J.; Yao, H.; Liu, W.; Zhang, Y.; Lin, J.; Jiang, J.; Wang, C. Impact of climate and vegetation dynamics on the ecosystem services of subtropical forests—A case study of Baishanzu National Park Area, China. Forests 2024, 15, 1850. [Google Scholar] [CrossRef] [Scilit]
- Wang, X.; Huang, X.; Guan, J.; Yang, G.; Xu, B. Construction and optimization of wilderness network connectivity to address landscape fragmentation in Zhejiang Province, China. J. Nat. Conserv. 2024, 81, 126703. [Google Scholar] [CrossRef] [Scilit]
- Ye, Z.; Cao, Y.; Feng, Y.; Chan, M.Y.; Liu, H.; Xu, X.; Wu, C.; Chen, B.; Yu, L.; Zhao, Z. Towards spatial equality in China’s protected area system: An assessment framework integrating accessibility and availability. Landsc. Urban Plan. 2026, 268, 105575. [Google Scholar] [CrossRef] [Scilit]
- Luo, H.; Sun, G.; Zhou, W.; Lian, J.; Sun, Y.; Hu, Y. Promoting Rural Revitalization via Natural Resource Value Realization in National Parks: A Case Study of Baishanzu National Park. Land 2025, 14, 298. [Google Scholar] [CrossRef] [Scilit]
- Davids, L.; Pryke, J.S.; Samways, M.J. Do pinch points in conservation corridors matter? A test case using localized butterflies and grasshoppers. Biol. Conserv. 2025, 305, 111073. [Google Scholar] [CrossRef] [Scilit]
- Sun, W.; Zhao, Y.; Chen, W.; Bai, Y. Current national nature reserves are insufficient to safeguard the long-term survival of birds and mammals in China. Commun. Earth Environ. 2024, 5, 304. [Google Scholar] [CrossRef] [Scilit]
- Yao, J.; Zhang, C.; Li, S.; Lin, Y.; Wang, Z.; Zhang, Y.; Zhou, W.; Pan, X.; Zhu, S.; Wu, Y.; et al. Characteristics of plant communities in the Baishanzu continuous elevational transect. Biodivers. Sci. 2024, 32, 24052. [Google Scholar] [CrossRef] [Scilit]
- Xu, X.; Liu, J.; Zhang, S.; Li, R.; Yan, C.; Wu, S. China’s Multi-Period Land Use Land Cover Remote Sensing Monitoring Data Set (CNLUCC); Resource and Environment Data Cloud Platform: Beijing, China, 2018. [Google Scholar]
- Su, J.; Wu, M.; Liu, Z. Spatial–Temporal Evolution of Ecological Network Structure During 1967–2021 in Yongding River Floodplain. Land 2025, 14, 930. [Google Scholar] [CrossRef] [Scilit]
- Carruthers-Jones, J.; Guetté, A.; Carver, S.; Lefebvre, T.; Vallauri, D.; Debeir, L.; Aykroyd, T.; Barthod, C.; Cavallin, P.; Vallée, S. High-resolution naturalness mapping can support conservation policy objectives and identify locations for strongly protected areas in France. Commun. Earth Environ. 2025, 6, 279. [Google Scholar] [CrossRef] [Scilit]
- Puyravaud, J.-P.; Cushman, S.A.; Davidar, P.; Madappa, D. Predicting landscape connectivity for the Asian elephant in its largest remaining subpopulation. Anim. Conserv. 2017, 20, 225–234. [Google Scholar] [CrossRef] [Scilit]
- Ward, M.; Saura, S.; Williams, B.; Ramírez-Delgado, J.P.; Arafeh-Dalmau, N.; Allan, J.R.; Venter, O.; Dubois, G.; Watson, J.E. Just ten percent of the global terrestrial protected area network is structurally connected via intact land. Nat. Commun. 2020, 11, 4563. [Google Scholar] [CrossRef] [Scilit] [PubMed]
- Chen, H.; Wang, Y.; Cheng, Z.; Ma, L. Construction of ecological security networks and the identification of priority areas for ecological restoration in Fujiang River Basin. Front. Environ. Sci. 2025, 13, 1673214. [Google Scholar] [CrossRef] [Scilit]
- Jin, X.; Wei, L.; Wang, Y.; Lu, Y. Construction of ecological security pattern based on the importance of ecosystem service functions and ecological sensitivity assessment: A case study in Fengxian County of Jiangsu Province, China. Environ. Dev. Sustain. 2021, 23, 563–590. [Google Scholar] [CrossRef] [Scilit]
- Ren, Y.; Wang, S.; Cui, B.; Ding, Y.; Cao, R. Research on wilderness area identification and distribution of spatial characteristics based on Boolean-multi-indicator evaluation approach—A case study of wilderness areas in Henan Province, China. Front. Environ. Sci. 2025, 13, 1650454. [Google Scholar] [CrossRef] [Scilit]
- Dutta, T.; Sharma, S.; Meyer, N.F.V.; Larroque, J.; Balkenhol, N. An overview of computational tools for preparing, constructing and using resistance surfaces in connectivity research. Landsc. Ecol. 2022, 37, 2195–2224. [Google Scholar] [CrossRef] [Scilit]
- Soulé, M.E.; Noss, R.F. Rewilding and biodiversity: Complementary goals for continental conservation. Wild Earth 1998, 8, 18–28. [Google Scholar]
- Cheng, Z.; Zhang, Y.; Liu, W.; Zhong, Z.; Bai, J.; Cheng, K.; Feng, C.; Wang, L.; Zhang, Y.; Yi, H.; et al. Population dynamics and the role of protected areas in China’s milu deer (Elaphurus davidianus) rewilding. Sci. Rep. 2025, 15, 188. [Google Scholar] [CrossRef] [Scilit] [PubMed]
- Hilty, J.; Worboys, G.L.; Keeley, A.; Woodley, S.; Lausche, B.J.; Locke, H.; Carr, M.; Pulsford, I.; Pittock, J.; White, J.W.; et al. Guidelines for Conserving Connectivity Through Ecological Networks and Corridors; International Union for Conservation of Nature: Gland, Switzerland, 2020. [Google Scholar]
- Newmark, W.D.; Halley, J.M.; Beier, P.; Cushman, S.A.; McNeally, P.B.; Soulé, M.E. Enhanced regional connectivity between western North American national parks will increase persistence of mammal species diversity. Sci. Rep. 2023, 13, 474. [Google Scholar] [CrossRef] [Scilit] [PubMed]
- Mu, H.; Guo, S.; Li, X.; Zhou, Y.; Lü, Y.; Du, X.; Huang, J.; Ma, C.; Zhang, X.; Xia, Z. Quantifying landscape connectivity gaps between protected area and natural habitat. J. Clean. Prod. 2024, 437, 140729. [Google Scholar] [CrossRef] [Scilit]
- Mata, C.; Hervás, I.; Herranz, J.; Suárez, F.; Malo, J. Are motorway wildlife passages worth building? Vertebrate use of road-crossing structures on a Spanish motorway. J. Environ. Manag. 2008, 88, 407–415. [Google Scholar] [CrossRef] [Scilit] [PubMed]
- Fu, M.; Wang, J.; Li, S.; Qin, L.; Li, J.; Jin, S. Utilization patterns and optimization suggestions for wildlife passages in Xinjiang nature reserves. Ecol. Evol. 2025, 15, e70969. [Google Scholar] [CrossRef] [Scilit] [PubMed]
- Rey Benayas, J.M.; Bullock, J.M. Vegetation restoration and other actions to enhance wildlife in European agricultural landscapes. In Rewilding European Landscapes; Pereira, H.M., Navarro, L.M., Eds.; Springer: Cham, Switzerland, 2015; pp. 127–142. [Google Scholar] [CrossRef] [Scilit]
- Bricca, A.; Zerbe, S.; Fellin, H.; Alessi, N.; Maccherini, S.; Bonari, G. Passive Rewilding of Old-Established Plantations Into Native Forests. J. Veg. Sci. 2025, 36, e70085. [Google Scholar] [CrossRef] [Scilit]
- Brodie, J.F.; Gonzalez, A.; Mohd-Azlan, J.; Nelson, C.R.; Tabor, G.; Vasudev, D.; Zeller, K.A.; Fletcher, R.J., Jr. A well-connected Earth: The science and conservation of organismal movement. Science 2025, 388, eadn2225. [Google Scholar] [CrossRef] [Scilit] [PubMed]
- Beger, M.; Metaxas, A.; Balbar, A.C.; McGowan, J.A.; Daigle, R.; Kuempel, C.D.; Treml, E.A.; Possingham, H.P. Demystifying ecological connectivity for actionable spatial conservation planning. Trends Ecol. Evol. 2022, 37, 1079–1091. [Google Scholar] [CrossRef] [Scilit] [PubMed]
- Huang, R.M.; Maré, C.; Guldemond, R.A.; Pimm, S.L.; Van Aarde, R.J. Protecting and connecting landscapes stabilizes populations of the Endangered savannah elephant. Sci. Adv. 2024, 10, eadk2896. [Google Scholar] [CrossRef] [Scilit] [PubMed]
- Haddad, N.M.; Brudvig, L.A.; Clobert, J.; Davies, K.F.; Gonzalez, A.; Holt, R.D.; Lovejoy, T.E.; Sexton, J.O.; Austin, M.P.; Collins, C.D. Habitat fragmentation and its lasting impact on Earth’s ecosystems. Sci. Adv. 2015, 1, e1500052. [Google Scholar] [CrossRef] [Scilit] [PubMed]
- Pacifici, M.; Di Marco, M.; Watson, J.E. Protected areas are now the last strongholds for many imperiled mammal species. Conserv. Lett. 2020, 13, e12748. [Google Scholar] [CrossRef] [Scilit]
- Keeley, A.T.; Beier, P.; Jenness, J.S. Connectivity metrics for conservation planning and monitoring. Biol. Conserv. 2021, 255, 109008. [Google Scholar] [CrossRef] [Scilit]
- Iverson, A.R.; Waetjen, D.; Shilling, F. Functional landscape connectivity for a select few: Linkages do not consistently predict wildlife movement or occupancy. Landsc. Urban Plan. 2024, 243, 104953. [Google Scholar] [CrossRef] [Scilit]
- Unnithan Kumar, S.; Cushman, S.A. Connectivity modelling in conservation science: A comparative evaluation. Sci. Rep. 2022, 12, 16680. [Google Scholar] [CrossRef] [Scilit] [PubMed]
- Handel, M.; Spiegel, O.; Shwartz, A. Field margins as ecological corridors: Uncovering connectivity in agricultural landscapes using high-resolution tracking data and translocation experiments. J. Appl. Ecol. 2025, 62, 2213–2225. [Google Scholar] [CrossRef] [Scilit]
- Kim, J.; Song, Y. Integrating ecosystem services and ecological connectivity to prioritize spatial conservation on Jeju Island, South Korea. Landsc. Urban Plan. 2023, 239, 104865. [Google Scholar] [CrossRef] [Scilit]
- Fu, T.; Cao, Y.; Lan, S.; Yu, L.; Liao, L. Can protected area networks effectively conserve ecosystem services at the landscape scale? Evidence from Wuyishan Biodiversity Priority Conservation Area, China. Ecosyst. Serv. 2026, 78, 101816. [Google Scholar] [CrossRef] [Scilit]
- Graber, D.M. Ecological restoration in wilderness: Natural versus wild in National Park Service wilderness. In The George Wright Forum, 2003; JSTOR: New York, NY, USA, 2003; Volume 20, pp. 34–41. [Google Scholar]
- Opdam, P.; Foppen, R.; Vos, C. Bridging the gap between ecology and spatial planning in landscape ecology. Landscape Ecol. 2001, 16, 767–779. [Google Scholar] [CrossRef] [Scilit]
- Cosgrove, A.J.; McWhorter, T.J.; Maron, M. Consequences of impediments to animal movements at different scales: A conceptual framework and review. Divers. Distrib. 2018, 24, 448–459. [Google Scholar] [CrossRef] [Scilit]
- Gan, Q.; Liao, L.; Kang, X.; Xu, Z.; Fu, T.; Cao, Y.; Feng, Y.; Dong, J.; Lan, S. Cultural ecosystem services and disservices in protected areas: Hotspots and influencing factors based on tourists’ digital footprints. Ecosyst. Serv. 2024, 70, 101680. [Google Scholar] [CrossRef] [Scilit]

Disclaimer/Publisher’s Note: The statements, opinions and data contained in all publications are solely those of the individual author(s) and contributor(s) and not of MDPI and/or the editor(s). MDPI and/or the editor(s) disclaim responsibility for any injury to people or property resulting from any ideas, methods, instructions or products referred to in the content. |
© 2026 by the authors. Licensee MDPI, Basel, Switzerland. This article is an open access article distributed under the terms and conditions of the Creative Commons Attribution (CC BY) license.