


Abstract
Wetland area and quality have continued to decline worldwide due to the combined impacts of global climate change and human activities, so there is a need for a scientific and standardized framework to assess wetland degradation risk and support conservation and restoration efforts. In this study, a wetland degradation risk assessment framework integrating pressure level and degradation level was developed and applied to the western Songnen Plain, one of China’s major marsh wetland regions, using data from 2000, 2010, and 2020. The results showed that: (1) anthropogenic activity intensity and wetland area change were the most influential indicators. The degradation risk index ranged from 0.20 to 0.68, with mean values of 0.52, 0.46, and 0.46 in 2000, 2010, and 2020, respectively, indicating a slight overall decline. (2) The pressure level increased from 0.56 to 0.59 from 2000 to 2020, suggesting a growing influence of external pressures. In the same period, the degradation level decreased from 0.34 to 0.30, reflecting a reduced effect of internal environmental conditions. (3) Spatially, medium-risk areas have expanded from 47.5% to 64.1% and became the dominant area, while high-risk areas remained relatively stable at 14–16%, whereas relatively high-risk areas decreased sharply from 33.87% to 6.29%. These results provide useful guidance for regional land management for sustaining ecological systems, and the proposed framework provides a transferable assessment logic for wetland degradation risk, but its application to other regions require local calibration of indicators, weights, thresholds, and validation datasets.
1. Introduction
Wetlands are a vital part of global terrestrial ecosystems and among the most important environments for human survival and development. Although they cover only about 9% of the world’s land area, wetlands provide irreplaceable ecological functions, including climate regulation, water purification, biodiversity maintenance, and support for global carbon and methane cycles [1,2,3]. Against the backdrop of intensifying climate change and rapid urbanization, land-use change, habitat fragmentation, and species migration have greatly accelerated wetland degradation. Since 1990, about half of the world’s wetlands have been degraded [4]. Studies have also shown that, since 1990, wetland loss has increased at an average annual rate of 0.78%, driven by human activities such as rapid land conversion, pollution, and fragmentation, together with the growing impacts of climate change [5]. Given the diversity of wetland types and the multiple threats posed by natural habitat changes and human activities, accurate assessment of wetland ecological conditions is urgently needed. Wetland inventory, assessment, and monitoring have been widely recognized in previous studies as essential approaches for detecting ecological changes, evaluating wetland condition, and supporting evidence-based conservation and restoration [6,7]. From a global policy and management perspective, this rationale is also consistent with the Ramsar Convention’s technical guidance, which emphasizes the integration of wetland inventory, assessment, and monitoring to support the wise use, management, and conservation of wetlands [8]. Such assessment can support the delineation of ecological conservation areas and improve the planning, management, and monitoring of wetland restoration efforts [9].
In recent years, as wetland degradation has intensified, research on wetland degradation assessment and ecological risk evaluation has advanced rapidly. The research paradigm is shifting from traditional indicator aggregation and qualitative analysis to model coupling and intelligent methods. The integration of ecological risk assessment with spatial modeling and machine learning has greatly improved the ability to characterize wetland degradation processes and their driving factors. This trend provides new approaches for systematically understanding the mechanisms and evolution of wetland degradation [10,11]. In studies of natural wetland vulnerability, Aslam et al. used machine learning to quantitatively classify the vulnerability of Khinjhir Lake wetland in Pakistan. By combining multi-temporal Landsat data with spectral indices, topographic moisture, and human disturbance factors, they revealed spatiotemporal patterns of wetland change driven by human activities [12]. Jiang et al. developed a three-level hazard–vulnerability–risk model based on the Ecological Risk Assessment (ERA) framework. This model systematically assessed the degradation risk of the Zoige Plateau wetland by incorporating natural disturbances, human activity exposure, and wetland structure and function [13]. For coastal wetlands, Hidalgo-Corrotea et al. developed a multi-scale remote sensing indicator system based on climate change and land cover change to comprehensively assess coastal wetland vulnerability [14]. In urban wetlands, Yang et al. evaluated the ecological vulnerability of urban wetland parks in Jinan by constructing a comprehensive indicator system that included ecological, environmental, and geological factors. Their results identified human activity intensity and water and soil quality as the main controlling factors [15]. In addition, Islam et al. used remote sensing and machine learning to conduct ecological risk zoning for the riparian wetlands in the Padma River basin of Northwest Bangladesh. Their results showed that more than half of the wetlands in the region were in a high-risk state [16].
Although research on wetland vulnerability and ecological risk has continued to expand in both methodological frameworks and technical approaches, several challenges remain. Most studies use administrative units, watershed boundaries, or wetland patches as evaluation units [17,18], which makes statistical analysis and data collection more convenient. However, the use of administrative units or entire watershed boundaries can create boundary truncation effects within the river–wetland continuum. As a result, it becomes difficult to capture hydrological processes and material transport patterns in river–wetland transition zones, which weakens the ecological interpretation of processes such as runoff convergence, nutrient transport, and human disturbance transmission. There are also large differences in the selection of human pressure factors, and indicator systems still lack unified standards. Even when the same models are used, inconsistent disturbance settings reduce the comparability of results. In addition, some methods rely heavily on high-resolution or region-specific data, making them difficult to apply in data-limited areas and reducing their transferability. For example, Zhang et al. evaluated the vulnerability of estuarine wetlands in the Yellow River Estuary to oil-spill stress using the Pressure–Situation–Sensitivity–Recovery (PSSR) framework, but also noted that data availability and analysis scale may affect the accuracy of assessment results [19]. This concern was also highlighted by Pricope and Shivers, who noted that vulnerability assessment in fragmented coastal wetlands may be constrained by the lack of high-resolution site-specific data and the complexity of localized geospatial analysis. To address this limitation, they developed a rapid assessment framework based on freely and publicly available geospatial datasets, providing useful methodological support for transferable wetland vulnerability assessment [20]. Landscape-scale assessments generally require fewer demanding data and provide intuitive spatial results, making them useful for identifying wetland degradation risk. However, landscape-scale indicators alone are insufficient to fully explain the coupling mechanisms among hydrological processes, human disturbance, landscape structure, and ecological function. Wetland degradation is a complex process involving natural stress, anthropogenic disturbance, landscape fragmentation, hydrological alteration, and ecosystem function decline. Therefore, a single indicator or purely qualitative assessment cannot adequately represent wetland degradation risk. The Analytic Hierarchy Process (AHP) is suitable for this type of multi-criteria assessment because it can organize different indicators into a hierarchical structure and determine their relative importance through expert judgment and consistency testing, thereby improving the systematic nature and interpretability of comprehensive evaluation results [21,22]. Geographic Information System (GIS) and remote sensing (RS) provide essential support for spatial data processing, indicator extraction, normalization, overlay analysis, and visualization at the evaluation-unit scale. In addition, ecological analysis tools and models, such as landscape pattern metrics, habitat suitability assessment, and water yield modeling, can quantify changes in wetland structure and ecological function.
The combined use of AHP, GIS, RS, and ecological models therefore enable wetland degradation risk to be assessed not only as a composite index, but also as a spatially explicit pattern reflecting the interaction between external pressures and internal ecological degradation. Considering these issues, this study builds on the sub-basin-scale ecological risk assessment concept proposed by Jiang et al. [13] and uses sub-basin as the evaluation units for wetland degradation risk assessment. Because sub-basin boundaries are defined by topography and hydrological processes, they can better represent the spatial transmission of runoff convergence, material movement, and human disturbance within a watershed. This helps reduce the fragmentation of natural processes caused by artificial boundaries and improves the rationality and ecological interpretability of wetland degradation risk assessment at the hydrological response scale. This study does not assume that the proposed framework can be directly applied to all wetlands without adjustment; rather, it provides a transferable assessment logic in which the evaluation unit, indicator selection, and indicator weights should be adjusted according to local wetland types, data availability, and dominant degradation pressures.
Based on sub-basins as the basic evaluation units, this study used GIS to process multi-source spatial data related to land use, landscape pattern, hydrological conditions, ecological function, and human disturbance. Human disturbance intensity and grassland use intensity were selected to represent anthropogenic pressure on wetlands. The Landscape Pattern Comprehensive Index (LPCI) is used to characterize changes in landscape patterns. Habitat suitability index (HSI) and other ecological indicators were used to reflect wetland functional status. The AHP method was then applied to determine the relative weights of different indicators, and a dual-dimensional framework of “stress degree–degradation degree” was constructed to integrate external pressure and internal ecological change into a wetland degradation risk index. This framework was applied to the wetlands of the western Songnen Plain in Northeast China. As a typical inland wetland region affected by climate change, land-cover transformation, and ecosystem degradation, the western Songnen Plain provides a suitable case for demonstrating the operational feasibility of the proposed assessment framework.
This study addresses the following research questions: (1) Does wetland degradation risk in the western Songnen Plain exhibit distinct spatiotemporal heterogeneity at the sub-basin scale from 2000 to 2020? (2) How are external pressure and internal degradation integrated into the risk assessment framework, and which indicators contribute most strongly to the final assessment results? The results can provide scientific support for wetland conservation, restoration prioritization, and zoned ecological management in the western Songnen Plain.
2. Materials and Methods
2.1. Study Area
The western Songnen Plain is located in the semi-arid to semi-humid agropastoral transition zone of central Northeast China, extending from 121°36′ E to 126°36′ E and 44°00′ N to 48°35′ N, with a total area of 10.1 × 10⁴ km2 [23]. The region covers northwestern Jilin Province and southwestern Heilongjiang Province (Figure 1b). It is characterized by a temperate semi-humid monsoon climate [24,25]. Previous studies reported that the mean annual temperature in the western Songnen Plain ranges from approximately 2–7 °C, and annual precipitation ranges from about 350 to 650 mm [26]. Most precipitation occurs between May and September [27]. Under the combined influence of regional climate, hydrology, and topography, the western Songnen Plain contains extensive inland wetlands dominated by marshes, and is recognized as one of the major concentration areas of cold-temperate to mid-temperate marsh wetlands in China. The terrain is primarily composed of foothill slopes and low-lying plains, with elevations ranging from 113 to 578 m (Figure 1c). Such geomorphological conditions favor the formation and persistence of marsh wetlands through shallow water accumulation and seasonal flooding. The region includes several important wetland reserves, such as Zhalong, Xianghai, Momoge [28,29], Chagan Lake, and Dabusu Langyaba. These wetlands are mainly composed of reed marshes, meadow marshes, and shallow marshes, and provide important stopover sites and breeding habitats for migratory waterbirds [30]. In addition, the western Songnen Plain is an important water conservation area within the Heilongjiang River Basin. Major rivers in the region, including the Songhua and the Nenjiang Rivers, exhibit pronounced seasonal fluctuations in runoff and experience distinct ice-covered periods during winter. The interaction between hydrological processes and climatic conditions further enhances the hydrological connectivity and dynamic evolution of marsh wetlands in this area. Therefore, the western Songnen Plain is both a typical and representative region for investigating marsh wetland degradation.
Figure 1.
Location of the study area: (a) China. (b) Heilongjiang and Jilin Provinces. (c) Study area.
2.2. Data Sources
Landsat images were preprocessed in ENVI 5.3, including band composition, mosaicking, geometric correction, radiometric calibration, atmospheric correction, projection transformation, and clipping by the study-area boundary. All spatial datasets were resampled to a unified spatial resolution of 200 m × 200 m using the nearest-neighbor resampling method before indicator calculation. Data sources are listed in Table 1.
Table 1.
Data sources and preprocessing methods used in this study.
2.3. Methodology
Wetland degradation is driven by both natural succession and external disturbances across wetland ecosystems [33,34]. It is typically manifested as wetland area loss, changes in soil cover, deterioration of water quality, and biodiversity decline [35], all of which pose serious threats to regional ecological security and sustainable development. Therefore, the scientific selection of evaluation units and indicators for constructing a wetland degradation risk assessment system, together with the systematic evaluation of degradation risk, has become a critical task in wetland research.
The wetland degradation risk assessment framework proposed in this study includes four components: evaluation unit delineation, indicator system construction, weight determination, and comprehensive assessment, thus forming a transferable and locally adjustable evaluation procedure (Figure 2). The western Songnen Plain was selected as the study area primarily to illustrate the implementation pathway and calculation process of the framework.
Figure 2.
Methodological framework of the present study.
The fixed components and specific contextual components of this framework, as well as the data requirements for applying this framework to other wetland areas, are summarized in Supplementary Table S1.
2.3.1. Selection of Evaluation Units
Sub-basins were used as the assessment units in this study because they effectively reflect regional ecosystem conditions, clearly delineate landscape units, and better capture spatiotemporal dynamics. Compared with administrative or other human-defined units, sub-basins better preserve ecosystem integrity [36]. Based on the DEM of the western Songnen Plain wetlands, sub-basin delineation was conducted in ArcGIS 10.8 using the Hydrology toolbox. The DEM was first preprocessed using the Fill tool, followed by Flow Direction and Flow Accumulation calculations. The stream network was then extracted from the flow accumulation raster using the conditional function Con(“FlowAccumulation” > N, 1). Different flow accumulation thresholds were tested and compared with the actual drainage system, and a threshold of 1200 was finally selected. Based on the extracted stream network, the Stream Link and Watershed tools were used to delineate sub-basin boundaries, and the resulting raster sub-basins were converted into vector polygons. Finally, the study area was divided into 77 sub-basins, which were used as the basic spatial units for wetland degradation risk assessment and spatial analysis. The areas of the sub-basins ranged from 0.76 to 7089.50 km2, and the summary statistics are provided in Supplementary Table S2.
2.3.2. Establishment of the Indicator System
Based on literature retrieved from Google Scholar and Web of Science, as well as previous domestic and international studies on wetland degradation risk assessment [13,37], an initial pool of candidate indicators was established. Considering the natural and socioeconomic characteristics of the western Songnen Plain, the indicators were further screened through expert consultation according to their ecological relevance, data availability, applicability at the sub-basin scale, clear directional relationship with degradation risk, and potential redundancy. Finally, 8 indicators closely related to wetland degradation risk were selected for the assessment. The initial candidate indicators, screening criteria, and final inclusion or exclusion decisions are summarized in Supplementary Table S3. An indicator system applicable to wetland degradation risk assessment in this region was then established (Table 2). To examine potential redundancy among the selected indicators, Pearson correlation analysis and variance inflation factor (VIF) tests were conducted for the ten assessment indicators. Pearson correlation analysis was used to identify pairwise relationships among indicators, whereas VIF was used to assess multicollinearity among multiple indicators. Following commonly used criteria, |r| ≥ 0.80 was considered to indicate strong correlation, VIF ≥ 10 was considered severe multicollinearity, and 5 ≤ VIF < 10 indicated moderate multicollinearity. For highly correlated indicators, their ecological meanings were further considered to determine whether they represented substantial redundancy. Detailed VIF results are provided in Supplementary Table S4.
Table 2.
Weightings for indicators at each level.
To ensure a scientific and reliable wetland degradation risk assessment system, all indicators were normalized during data processing (Equations (1) and (2)). A judgment matrix was then constructed through expert scoring. All decision matrices passed the consistency test (CR < 0.10). Details of the AHP hierarchy, global weight derivation, and consistency tests are provided in Supplementary Tables S5 and S6. The wetland degradation risk index was then calculated accordingly based on the weights of each indicator level. To maintain comparability among different years and to clearly identify spatial gradients, an equal-interval classification method was applied. The index was divided into five risk levels: low [0.20, 0.30), relatively low [0.30, 0.40), medium [0.40, 0.50), relatively high [0.50, 0.60), and high [0.60, 0.70] [12]. To examine whether the risk classification was sensitive to the classification method, Jenks natural breaks were additionally applied, and class agreement between the two classification methods was evaluated. The results are reported in Supplementary Tables S7–S9.
In the equations, denotes the value of the i-th indicator, denotes the minimum value of the i-th indicator, and denotes the maximum value of the i-th indicator. Positive Indicators include: TVDI, anthropogenic disturbance index, grassland utilization intensity, LPCI. Negative Indicators include: wetland area change, water yield, HSI, NPP.
In addition, the sensitivity of the degradation risk index to alternative first-level Pressure/Degradation weighting scenarios was evaluated, and the results are reported in Supplementary Table S10.
2.3.3. Indicator Calculation
TVDI was calculated from the temperature–vegetation index feature space. The theoretical basis of this method is the empirical relationship between land surface temperature and vegetation indices [38]. The dry and wet edges represent different surface moisture conditions [39,40]. This study references the previous application of EVI-Ts/LST to TVDI and the MODIS EVI formula and uses EVI and LST to calculate TVDI to characterize the aridity of the western Songnen Plain [41,42,43]. Its calculation formula is shown in Equations (3)–(5).
In the equations, : surface temperature at any pixel location; : lowest surface temperature corresponding to a given EVI value; : highest surface temperature corresponding to a given EVI value. The TVDI value ranges from 0 to 1. A TVDI value of 0 at a wet edge indicates that the soil moisture content is close to field capacity; a TVDI value of 1 at a dry edge indicates that the soil moisture content is close to the wilting point. and denote the coefficient and constant of the wet-edge fitting equation, respectively, while and represent the coefficient and constant of the dry-edge fitting equation.
Based on the dominant land-use patterns in the study area, anthropogenic disturbance to wetlands was quantified using the areas of farmland and construction land. The calculation formula is presented in Equation (6).
Appropriate grassland use helps regulate the local climate, whereas improper use accelerates grassland degradation and weakens ecosystem stability and resilience. Grassland use intensity quantitatively reflects human pressure on grassland ecosystems and serves as an indicator of grassland health and degradation. After data preprocessing, this indicator was used to evaluate wetland degradation.
This study uses 1990 as the baseline year for measuring subsequent wetland area changes, comparing the wetland areas of each sub-basin in 2000, 2010, and 2020, because it is currently the earliest year with complete historical wetland maps available. Since data for several stress and function indicators, including grassland use intensity, TVDI based on EVI/LST, NPP, and water yield model inputs, are incomplete in 1990, the comprehensive degradation risk assessment is conducted for 2000, 2010, and 2020 respectively. This study uses Equation (7) to calculate the changes in wetland area during these periods to analyze the spatiotemporal patterns of wetland degradation.
In the equation, denotes the wetland area change value for each sub-basin across different years, represents the wetland area for each study year, and denotes the wetland area in 1990.
In this study, LPCI was constructed by integrating patch density (PD), aggregation index (AI), and Shannon’s diversity index (SHDI) to characterize structural degradation. Specifically, PD represents landscape fragmentation, AI reflects the aggregation and connectivity of patches, and SHDI describes landscape-type diversity [44,45]. After directional adjustment and normalization, the three indicators were weighted using AHP, and their weighted mean was calculated to obtain the LPCI. The corresponding formulas are shown in Equations (8)–(11):
In the equations, represents the number of patches of landscape type , and denotes the total area of landscape type . A higher PD value indicates greater landscape fragmentation; denotes the number of adjacent edges between patches of the same type within the landscape (i.e., the total length of shared boundaries between patches of the same kind), and represents the maximum possible number of adjacent edges for patches of the same type under optimal aggregation conditions; AI ranges from 0 to 100; is the total number of landscape types in the study area, and is the proportion of the total landscape area occupied by type .
In this study, PD and SHDI were treated as positive indicators, whereas AI was treated as a negative indicator and underwent negative normalization before being integrated into the LPCI. It is worth noting that the ecological significance of SHDI depends on the scale and specific context. Although a higher SHDI may imply increase landscape heterogeneity and habitat diversity in some instances [46], within the context of wetland degradation risk assessment, it is typically associated with a reduction in dominant wetland patches, heightened fragmentation, and the expansion of non-wetland land-cover types. Consequently, this study interprets an increase in SHDI as a manifestation of the degradation of wetland landscape structure and an intensification of the interspersion between wetland and non-wetland areas [47].
Water conservation is an important wetland function and strongly influences the hydrological conditions of the study area. Based on the water balance principle, this study applied the InVEST Annual Water Yield model, together with annual precipitation, reference evapotranspiration, land-use data, PAWC, root depth, soil depth, and biophysical parameters, to estimate water yield in the study area. In this study, water yield was used as a relative hydrological function indicator within the multi-criteria wetland degradation risk assessment framework, rather than as an independent simulation of absolute river discharge. Therefore, the model setting focused on maintaining spatial and temporal comparability among the three study years. PAWC mainly represents relatively stable soil hydraulic properties, such as soil texture and soil water-holding capacity. Since ISRIC SoilGrids does not provide annual PAWC products, the same PAWC raster was used for the 2000, 2010, and 2020 simulations. This treatment is consistent with the relatively time-invariant nature of soil hydraulic properties and helps ensure comparability among different years [48,49]. The calculation method for water yield is shown in Equations (12)–(15).
In the equations, denotes the annual water yield of land cover/land use type in grid cell . represents annual precipitation in grid cell . is the annual actual evapotranspiration of land cover/land use type in grid cell , calculated using Equation (12). is the dimensionless Budyko dryness index for land cover/land use type in grid cell . is a dimensionless non-physical parameter under natural climatic conditions that characterizes soil properties and defines the shape of the curve relating to potential evapotranspiration; it is calculated using Equation (13). denotes the reference evapotranspiration in grid cell . represents the evapotranspiration coefficient for land cover/land use type in grid cell . In the Annual Water Yield module of InVEST, the parameter was set to 20. is an empirical seasonality factor reflecting regional precipitation distribution and hydrogeological characteristics, with a typical range of 1–30 [50]. This value is also close to the calibrated value reported in a previous study conducted in western Jilin, where Zhu et al. found that produced good agreement between simulated and actual water production, with an error of 0.6% [51]. Therefore, was selected as a reasonable regional parameter value for representing the hydroclimatic conditions of the western Songnen Plain. denotes plant available water content in grid cell , which is determined by PAWC, root-restricting layer depth, and vegetation rooting depth.
HSI models are widely used to assess habitat conditions for plants and animals and to reflect their capacity to support biodiversity [52,53]. Taking the western Songnen Plain as a case study, this research evaluated habitat suitability using six factors: land-use type, elevation, slope, and distances to protected areas, roads, and water sources. The selection of these factors also considered the region’s natural characteristics and species’ adaptation needs. Distance-related factors, including distance from roads, distance from water sources, and distance from protected areas, were calculated in ArcGIS 10.8 using the Euclidean Distance tool. These indicators represent the Euclidean distance from each raster cell to the nearest corresponding spatial feature, rather than a fixed empirical threshold. All factors were preprocessed before analysis. Based on previous studies and the actual conditions of the study area, each factor was classified into five suitability levels, with values from 1 to 5 representing low to high suitability, respectively, as shown in Table 3. The suitability grades were determined based on previous studies, the ecological characteristics of the western Songnen Plain, and the habitat requirements of wetland-dependent species [54]. The classification criteria and relative weights of the selected ecological factors are presented in Table 4. The relative weights were calculated using SPSS Pro online statistical analysis platform (Version 1.0.11, SPSSPRO, Shanghai, China). Distance from protected areas was retained as an HSI factor because it reflects the potential influence of conservation management and habitat protection on wetland habitat suitability. To test whether this factor disproportionately affected the final risk assessment, a sensitivity analysis was conducted by excluding this factor and recalculating the degradation risk index. Because distance from the protected area reflects the conservation context and ecological proximity effects, rather than directly defining habitat quality by the protected area itself, it was retained as a factor in the HSI. To examine whether this factor had an excessive impact on the final HSI, we conducted a sensitivity analysis, removed the distance from the protected area factor, and recalculated the degradation risk index. The results are shown in Supplementary Table S11.
Table 3.
Classification of Habitat Suitability Grades in the Western Songnen Plain.
Table 4.
Single-factor suitability grading criteria.
Using the AHP method, this study constructed a judgment matrix of habitat factors for wetlands in the western Songnen Plain (Table 5).
Table 5.
Habitat factor judgement matrix.
These weights were then integrated to calculate the habitat suitability index. The calculation formula is presented in Equation (16).
In the equation, represents the land use type coefficient; denotes the elevation coefficient; denotes the distance coefficient to roads; denotes the distance coefficient to water sources; denotes the distance to protected areas; denotes the slope coefficient. A higher HSI value indicates greater habitat suitability.
NPP is an important indicator of ecosystem productivity and a key regulator of ecological processes [55]. Therefore, this study uses NPP to evaluate wetland productivity in the study area.
Additional methodological details, including indicator selection and redundancy checks, AHP weight derivation, sensitivity analysis of the protected-area distance factor in HSI, and first-level Pressure/Degradation weighting sensitivity analysis, are provided in Supplementary Materials S2 and S3.
3. Results
3.1. Spatiotemporal Variation Characteristics of the Pressure Index in Wetlands in the Western Songnen Plain
To address the ecological security issues affecting wetlands in the western Songnen Plain, driven by drought, unregulated farmland use, urban expansion, and irrational grazing, this paper employs a pressure index to characterize the risks faced by wetlands in the study area. The index is constructed from two components: TVDI and the anthropogenic pressure index, which comprises the anthropogenic disturbance index and grassland utilization intensity.
3.1.1. Characteristics of Natural Pressure Variation
Using EVI and LST data from the three study years, the EVI–LST feature space of the study area was constructed. Figure 3 shows the piecewise fitting results for the dry and wet edges. Figure 3a–c present the dry edge fitting results for 2000, 2010, and 2020, respectively, while Figure 3d–f show the corresponding wet edge fitting results. Considering that the EVI–LST boundaries in wetland areas are affected by vegetation coverage, surface water conditions, mixed dry–wet pixels, and spatial heterogeneity, they may not be fully represented by a single linear equation. Therefore, piecewise linear regression was used to identify the breakpoint and fit the dry and wet edges for each study year. The goodness of fit was evaluated using the coefficient of determination (R2) and the root mean square error (RMSE). For the wet edge, the R2 values were 0.7911, 0.7811, and 0.6975 in 2000, 2010, and 2020, respectively, with RMSE values of 4.4595, 3.7296, and 4.4001 °C. For the dry edge, the R2 values were 0.7661, 0.7076, and 0.6311, respectively, with RMSE values of 1.7485, 2.0119, and 2.1965 °C. These results indicate that the fitted dry and wet edges generally captured the main boundary trends of the EVI–LST feature space and provided a quantitative basis for TVDI calculation. It should be noted that the dry edge fitting in 2020 had a relatively lower R2 value of 0.6311, suggesting greater dispersion of the extracted dry-edge samples and stronger spatial heterogeneity in surface thermal conditions. This may introduce some uncertainty into the TVDI estimation for 2020, although the overall boundary trend was still represented by the piecewise fitting. Based on the derived dry and wet edge equations, the spatiotemporal distribution of TVDI from 2000 to 2020 was retrieved (Figure 4a). The results showed that relatively severe drought conditions were mainly distributed in the southwestern part of the study area, with drought severity first increasing and then decreasing over time. In contrast, the northeastern region remained relatively humid, which may be associated with higher vegetation coverage and better wetland hydrological conditions in this area.
Figure 3.
feature space plot. Panels (a–f) illustrate the fitting results of the dry and wet edges within the feature space for the years 2000, 2010, and 2020, respectively.
Figure 4.
Spatiotemporal variation in the pressure index in the western Songnen wetlands. The figure shows the variation characteristics of different indicators during the years 2000, 2010, and 2020: (a) TVDI; (b) Anthropogenic Disturbance Index (ADI); (c) Grassland use intensity (GUI); (d) Pressure index (Pressure).
3.1.2. Characteristics of Anthropogenic Pressure
The mean anthropogenic disturbance index increased from 0.582 in 2000 to 0.654 in 2020, indicating an overall intensification of human disturbance to wetland ecosystems (Figure 4b). Spatially, grassland use intensity showed a clear pattern, with lower values in the central region and higher values in the eastern and western regions (Figure 4c). Overall, use intensity remained high, with the mean value decreasing slightly from 0.671 in 2000 to 0.666 in 2020. High-intensity areas were mainly concentrated in the northeastern region, with sporadic distribution in other areas.
Under the combined influence of natural and anthropogenic factors, the overall pressure index of wetland degradation in the western Songnen Plain remained relatively high, with most values ranging from 0.5 to 0.7 (Figure 4d). Higher pressure levels were observed in the eastern and western regions, whereas the central region experienced relatively lower pressure. The continuous intensification of anthropogenic disturbance, particularly in the eastern and western regions, together with intensive grassland utilisation, imposed substantial pressure on the wetland ecosystem.
3.2. Spatiotemporal Characteristics of Degradation in Western Songnen Plain Wetlands
This study assessed wetland degradation in the western Songnen Plain from three dimensions: area, structure, and function. The selected indicators were wetland area change, LPCI, water yield, HSI, and NPP.
3.2.1. Changes in Wetland Area
From 1990 to 2020, wetland area increased from 7615.1 km2 to 8877.6 km2, with an overall increase of 16.58% (Figure 5a). Spatially, wetland area generally decreased in the southern region, while reductions were also observed in the central region. In contrast, local increases occurred along the northern and eastern margins.
Figure 5.
Spatiotemporal changes in wetland degradation in western Songnen Plain. The figure displays the variation characteristics of different indicators during the years 2000, 2010, and 2020: (a) Wetland Area Change; (b) LPCI; (c) Water yield; (d) HSI; (e) NPP; (f) Degradation.
3.2.2. Structural Degradation
The LPCI values ranged from 0.03 to 0.15 during 2000–2020, with most sub-basins falling within the low-to-moderate classes (Figure 5b). Spatially, relatively high LPCI values were mainly distributed in the southern, southwestern, and central parts of the study area, indicating stronger comprehensive landscape pattern signals in these regions based on the integrated effects of PD, AI, and SHDI. Temporally, the LPCI was relatively high in 2000, decreased markedly in 2010, and showed a partial rebound in 2020, particularly in the southern and southwestern sub-basins. These results suggest that the landscape pattern-related component of wetland degradation risk weakened from 2000 to 2010 but increased again in some local areas by 2020.
3.2.3. Functional Degradation
Water yield exhibited an overall increasing trend during the study period, with a spatial pattern characterized by higher values in the eastern region and lower values in the western region. However, in 2020, the center of water yield shifted to the northern region (Figure 5c). Habitat suitability showed pronounced spatial heterogeneity across the study area, and the low-suitability zone in the southern region expanded over time, indicating sustained ecological stress in this area (Figure 5d). NPP also displayed marked spatial heterogeneity in the western Songnen Plain, with relatively high values in the northern and eastern regions, particularly in the northeast, and relatively low values in the southern region, especially in the southwest. The mean NPP values increased from 183.95 gC·m−2·a−1 in 2000 to 271.53 gC·m−2·a−1 in 2010 and 315.52 gC·m−2·a−1 in 2020, suggesting an overall increase in vegetation productivity and a partial recovery of ecological functions in some areas (Figure 5e). Based on the spatiotemporal characteristics of the above indicators, the wetland degradation index of the study area was calculated. The mean wetland degradation index decreased from 0.335 in 2000 to 0.298 in 2020, indicating that the overall degree of wetland degradation was alleviated during the study period, although pronounced regional differences remained (Figure 5f).
3.3. Spatiotemporal Patterns and Changing Characteristics of Wetland Degradation Risks
This study assesses wetland degradation risk using sub-basins as landscape units. By weighting wetland stress and degradation, a wetland degradation risk index ranging from 0.20 to 0.68 was obtained. The risk values were then divided into five risk levels using an equal-interval method: low-risk, relatively low-risk, medium-risk, relatively high-risk, and high-risk areas. The spatial distribution and area proportion of the five degradation risk levels are shown in Figure 6. The overall degradation risk in the western Songnen Plain shows a decreasing trend. The average degradation risk was relatively high in 2000, at 0.516; by 2010 and 2020, the degradation risk had significantly decreased and stabilized, both around 0.457. Spatially, the high-risk area gradually shifted southward from the northwest and northeast in 2000, with a significant increase in the area of high-risk areas in the south. Combined with topographical distribution characteristics, the overall degradation risk exhibits a spatial pattern of “high in the south and low in the north.” As shown in Figure 6a, in 2000, the study area was mainly composed of medium-risk and relatively high-risk areas, accounting for 47.47% and 33.87% of the total area, respectively. In 2010, the risk level structure changed little, with medium-risk and relatively high-risk areas accounting for 46.29% and 33.73% of the total area, respectively. By 2020, the proportion of medium-risk areas had increased to 64.12%, while the proportion of relatively high-risk areas had decreased to 6.29%, indicating that the wetland degradation risk level structure in the study area gradually shifted from a pattern where relatively high-risk areas accounted for a larger proportion to one dominated by medium-risk areas. As shown in Figure 6b, from 2000 to 2010, the changes in degradation risk in each sub-basin were mainly concentrated around 0, indicating that the magnitude of degradation risk changes was relatively small during this period. The median values in the box plots from 2010 to 2020 and from 2000 to 2020 were both below 0, indicating that the degradation risk in most sub-basins showed a downward trend. However, positive outliers still existed in some periods, indicating that the degradation risk in a few sub-basins increased. Overall, the risk of wetland degradation in the western Songnen Plain decreased from 2000 to 2020, but degradation in some areas still intensified, showing a pattern of “overall improvement and local deterioration”.
Figure 6.
Spatiotemporal patterns of wetland degradation risk in the western Songnen Plain. (a) Spatial distribution and area proportions of the five degradation risk levels in 2000, 2010, and 2020; (b) changes in degradation risk at the sub-basin scale during 2000–2010, 2010–2020, and 2000–2020. The box colors represent different comparison periods: blue for 2000–2010, orange for 2010–2020, and green for 2000–2020.
4. Discussion
4.1. A Method for Evaluating Wetland Stress-Degradation Risk by Integrating AHP, GIS, and Ecological Models
Landscape indicators are widely used to examine environmental vulnerability changes and quantify ecological effects. Pirali Zefrehei et al. employed multiple landscape indicators, including edge density, total edges, largest patch index, number of patches, percentage of landscape, and PD, to assess environmental vulnerability in the Choghakhor International Wetland from 1985 to 2018 [56]. Although combining multiple indicators can provide a more comprehensive representation of landscape pattern dynamics, an excessive number of indicators may introduce redundant information and weaken model robustness and interpretability. Therefore, to characterize wetland degradation more comprehensively, this study builds on previous research by selecting representative landscape indicators to capture structural changes from three dimensions: fragmentation, connectivity, and diversity.
The Government of Queensland, Australia, developed the Wetland Tracker to monitor freshwater wetland conditions in the Great Barrier Reef catchment. The tool integrates multiple indicators, including biological invasions, habitat alteration, hydrological change, pollution inputs, biological integrity, physical structural integrity, hydrological integrity, and landscape connectivity [57]. This approach offers clear advantages for the rapid assessment of wetland condition and its driving mechanisms. However, wetland spatial structure is typically complex, with large continuous wetlands coexisting alongside numerous small surrounding patches. When assessments involve a large number of wetland units, the demand for high-resolution, multi-source data increases substantially, resulting in higher costs and greater operational difficulty in data acquisition and implementation. To address these challenges, this study integrates multiple dimensions of influence, including natural factors, human activities, external pressures, and internal changes, and selects ten representative indicators for evaluation. Their rationality was confirmed through consistency testing (CR < 0.1), ensuring assessment reliability while improving the feasibility and applicability of wetland degradation assessment. In addition, although commonly used frameworks such as PSR and DPSIR have been widely applied in wetland ecosystem research, they remain limited in their ability to integrate ecosystem quality and health status, and may therefore fail to fully capture the subtle internal heterogeneity of wetland ecosystems [58].
Malekmohammadi and Rahimi Blouchi classified environmental risk in wetland ecosystems (SIWs) using the output node results of a Bayesian belief network (BBN) model, dividing overall risk into three categories: low, medium, and high risk [59]. However, the number of risk classes directly influences the accuracy of spatial risk pattern identification, and a three-level classification may not adequately capture the continuous variation in wetland degradation risk. To better represent the spatial gradient of degradation risk, this study applies the equal-interval method to classify the assessment results into five levels: low, relatively low, medium, relatively high, and high risk. This classification facilitates the identification of potential high-risk transition zones and provides more targeted spatial support for subsequent wetland remediation and ecological restoration. This paper distinguishes between the fixed components of the framework, the content that can be adjusted according to regional conditions, and the minimum data requirements for application to other wetlands. The framework’s stress degradation logic, hierarchical evaluation method, and multi-level risk interpretation have a certain degree of portability. However, the specific indicators, spatial units, weight settings, and classification thresholds all need to be localized and calibrated in conjunction with the ecological processes, data conditions, and major anthropogenic disturbances of the target wetland.
4.2. Spatiotemporal Evolution Analysis of Wetland Degradation Risk Evaluation Indicators in the Western Songnen Plain
Previous studies have primarily focused on examining the impact of single factors (such as land-use change or climatic drought) on wetland degradation. For instance, Zhang et al. assessed changes in wetland ecosystem services in the Tumen River Basin from a land-use change perspective, while Sandi et al. investigated the effects of drought processes on wetland degradation in arid regions under climate change. However, holistic analyses of wetland degradation often neglect ecological and socioeconomic indicators, failing to fully incorporate the combined effects of natural factors and human activities on wetland degradation [60,61]. Based on this, this study constructs an evaluation index system for wetland degradation risk from the perspectives of stress level and degradation level.
The TVDI results for the three study periods indicate that the western part of the study area experienced the most severe aridity, which is consistent with the drought distribution pattern in Northeast China reported by Li et al. using the kNDVI [62]. In future integrated wetland restoration, greater attention should be given to the potential effects of soil physicochemical properties on changes in the wetness index. The mean anthropogenic disturbance intensity increased continuously across the three periods (0.582, 0.616, and 0.654), whereas the standard deviation gradually decreased (0.257, 0.250, and 0.242). This suggests that human disturbance intensified over time, while its spatial variability declined. The spatial distribution of high-value disturbance areas was closely related to regional industrial structure, which is consistent with the results of Hong et al. for Fujian’s coastal wetlands, where increasing human disturbance was mainly associated with the conversion of natural or agricultural wetlands into construction land [63]. Similarly, Lu et al. showed that the expansion of agricultural and construction land in the Songnen Plain from 1980 to 2020 was a key driver of changes in actual evapotranspiration. This supports the conclusion of the present study that land-use change effectively reflects the degree of human disturbance and further confirms that land expansion is a primary driver of increasing wetland disturbance [64]. From 2000 to 2020, precipitation in the western Songnen Plain showed an overall increasing trend, indicating a climatic shift from semi-arid to semi-humid conditions. This change likely provided additional water input to wetlands and supported the maintenance and expansion of wetland areas. Similar conclusions have been reported in other regions, where increasing moisture and precipitation promoted the expansion of wetlands along grassland margins and in plateau areas [65]. Landscape pattern indices provided an effective means to characterize the structural dimension of wetland degradation. In this study, wetland structural degradation showed a weakening trend from 2000 to 2010, followed by a localized intensification by 2020. Similar non-linear changes have been reported in previous studies, where wetland fragmentation or structural degradation initially declined and subsequently increased. These findings suggest that wetland landscape degradation may exhibit phased responses to the combined effects of hydrological variation, land-use change, and human disturbance [66,67]. Water yield in the study area generally exhibited an increasing trend over the study period, with evident spatial heterogeneity. Previous studies likewise found that water yield in western Jilin and the Songnen Plain increased overall from 2000 to 2020, accompanied by marked spatial variation. Some areas experienced shifts in high-value zones and increased water yield in the northern part, which is broadly consistent with the results of this study [51,68]. In addition, the high-value HSI areas identified in this study were consistent with the “high in the east, low in the center, and high in the west” pattern of habitat quality (HQ) reported by Sun et al. for the Songnen Plain, suggesting that the regional ecological environment improved during 2000–2020 [69]. The increasing trend in NPP was highly consistent with the long-term monitoring results of Lin et al. across different land-cover types, and was also in agreement with the findings of Wang et al., who reported a significant increase in marsh NPP under diurnal temperature variation [70,71].
4.3. Relationship Between Spatial Patterns of Degradation Risk and Land Use, Hydrological Conditions and Conservation Policies
From 2000 to 2020, wetland degradation risk in the western Songnen Plain showed an overall declining trend, with the mean degradation risk index decreasing from 0.516 to 0.457. This suggests a general improvement in wetland ecological conditions during the study period. This trend is broadly consistent with previous remote-sensing-based assessments in the western and northeastern Songnen Plain, which reported recent ecological restoration but also noted localized marsh shrinkage, fragmentation, and wetland-to-farmland conversion [23,24,26]. However, the spatial pattern of degradation risk remained heterogeneous, with higher risk mainly concentrated in the southern part of the study area. This indicates that regional improvement did not occur uniformly across all sub-basins.
The persistence of high-risk areas in the south may be closely related to overlapping land-use and hydrological pressures. In this study, the human disturbance index, constructed from farmland and construction land, increased continuously from 2000 to 2020, suggesting that agricultural development and built-up expansion remained important sources of pressure in some sub-basins. In addition, relatively dry conditions and spatially uneven water yield may have further constrained wetland recovery in the southern part of the study area. The expansion of low-suitability habitat areas in the south and the relatively lower NPP in the southwest also indicate that ecological recovery capacity may remain limited in some sub-basins. Although the overall decline in degradation risk is broadly consistent with the regional background of wetland conservation and restoration, this study did not directly quantify policy effects. Therefore, the role of conservation policies should be interpreted cautiously. The continued concentration of high-risk areas in southern Baicheng and Songyuan suggests that land-use and hydrological pressures have not been fully offset in some sub-basins.
Therefore, future wetland management should give priority to the southern high-risk areas by strengthening farmland management around wetlands, improving ecological water supplementation, restoring fragmented wetland patches, and better coordinating agricultural production with wetland conservation.
4.4. Limitations and Future Prospects
Although this study developed an integrated framework for assessing wetland degradation risk in the western Songnen Plain, several limitations should be acknowledged. First, the indicator system was constructed based on 10 representative indicators derived from available geographic, landscape, ecological, and human disturbance data. These indicators can reflect the major characteristics of wetland degradation risk at the regional scale, but they may not fully capture all natural and anthropogenic processes involved in wetland degradation. In particular, spatially explicit data on crop type, irrigation intensity, fertilizer application, grazing pressure, land management practices, and conservation policy implementation were not available at the sub-basin scale. Therefore, farmland was treated as a general disturbance category, and some socioeconomic information had to be represented by spatial proxy indicators. Future studies should incorporate more refined human-activity and management datasets to better distinguish the intensity and mechanisms of wetland disturbance among different sub-basins.
This study used sub-basins as the basic assessment units because they can better represent hydrological continuity than administrative units. However, the choice of spatial unit may influence the calculation of landscape pattern indicators, ecosystem function indicators, and final risk values. In addition, the spatial resolution of the input datasets may also introduce uncertainty into the assessment results. Although all spatial datasets were resampled and harmonized before analysis, differences in the original resolution of land-use, remote sensing, terrain, climate, and socioeconomic proxy data may affect the representation of fine-scale wetland features and local disturbance gradients. Future research should compare sub-basin, grid-based, and wetland-patch-based assessment units, and further evaluate the effects of input data resolution on the scale sensitivity and spatial robustness of the proposed framework. Moreover, although the land-use classification accuracy met the requirements of this study, classification uncertainty may still affect wetland area change and landscape pattern indicators. More detailed validation samples and class-specific accuracy assessment would help reduce this uncertainty.
The indicator weights were determined using AHP based on expert judgment. Although all judgment matrices passed the consistency test and additional sensitivity analyses were conducted, some subjectivity remains unavoidable. The sensitivity results showed that the risk classification was affected by changes in both HSI weights and first-level weights. In 2020, up to 18 sub-basins, accounting for 23.4% of all sub-basins, changed their risk class under the alternative HSI weighting scenario. Moreover, under the 0.6P + 0.4D first-level weighting scenario, the spatial agreement in 2020 decreased to 64.94%, indicating that the 2020 risk classification was the least robust among the three study years. Therefore, the 2020 risk pattern should be interpreted with caution, especially when used for management prioritization or policy-related conclusions. Future studies could combine AHP with objective weighting methods, uncertainty analysis, or independent validation data to improve the robustness of the assessment framework. Overall, the framework provides a useful basis for regional wetland degradation risk assessment, but its application in other regions should be adjusted according to local environmental conditions, data availability, and management needs.
5. Conclusions
This study developed a sub-basin-based framework for assessing wetland degradation risk by integrating wetland stress and degradation conditions. Compared with regular grids or administrative units, sub-basins provide a more ecologically meaningful evaluation unit because they better reflect hydrological connectivity and landscape integrity. The framework applied in the western Songnen Plain effectively identified the spatial and temporal variation in wetland degradation risk and provides a useful reference for regional wetland risk assessment, although its application to other regions should require local indicator adjustment and further validation.
The results showed that human disturbance intensity and wetland area change were the dominant indicators associated with wetland degradation risk, indicating that land-use expansion and wetland loss were the main pressures affecting regional wetland stability. From 2000 to 2020, the mean degradation risk index decreased from 0.52 to 0.46, suggesting an overall improvement in wetland ecological conditions. However, this improvement was spatially uneven. Higher-risk areas remained concentrated mainly in the southern part of the study area, where agricultural expansion, human disturbance, and relatively dry environmental conditions continued to place pressure on wetland ecosystems.
Overall, the proposed framework provides scientific support for wetland conservation planning, ecological restoration zoning, reserve delimitation, and priority intervention in areas with persistent degradation risk. Future studies should incorporate more climatic, hydrological, and socio-economic drivers, improve the objectivity of indicator weighting, and strengthen long-term monitoring and independent validation to enhance the robustness of wetland degradation risk assessment.
Supplementary Materials
The following supporting information can be downloaded at: https://www.mdpi.com/article/10.3390/land15071250/s1, Table S1. Fixed and context-specific elements of the wetland degradation risk assessment framework and minimum data requirements. Table S2. Summary statistics of sub-basin areas. Table S3. Screening of candidate variables and construction of evaluation metrics. Table S4. VIF values of the final eight assessment indicators. Table S5. AHP hierarchy and global weights of indicators. Table S6. Summary of AHP consistency test results. Table S7. Sensitivity analysis of wetland degradation risk classification using equal-interval and Jenks natural breaks methods. Table S8. Class agreement between equal-interval and Jenks natural breaks methods (%). Table S9. Pooled classification thresholds. Table S10. Spatial and area-weighted agreement of wetland degradation risk classes under different first-level weighting scenarios. Table S11. Sensitivity of wetland degradation risk to the protected-area distance factor in HSI.
Author Contributions
All authors contributed to the study conception and design. Conceptualization, G.F., C.M. and J.L. (Jiping Liu); methodology, G.F., C.M. and J.L. (Jiping Liu); software, J.L. (Jiaqi Li), P.Y. and C.W.; validation, J.L. (Jiaqi Li) and C.W.; formal analysis, J.L. (Jiaqi Li) and P.Y.; investigation, J.L. (Jiaqi Li), P.Y., C.W., G.F., C.M. and J.L. (Jiping Liu); resources, G.F., C.M. and J.L. (Jiping Liu); data curation, J.L. (Jiaqi Li), P.Y. and C.W.; writing—original draft preparation, J.L. (Jiaqi Li), P.Y., C.W., G.F., C.M. and J.L. (Jiping Liu); writing—review and editing, J.L. (Jiaqi Li), P.Y., C.W., G.F., C.M. and J.L. (Jiping Liu); visualization, J.L. (Jiaqi Li), P.Y., C.W., G.F., C.M. and J.L. (Jiping Liu); supervision, G.F., C.M. and J.L. (Jiping Liu); project administration, G.F., C.M. and J.L. (Jiping Liu); funding acquisition, J.L. (Jiping Liu). All authors commented on previous versions of the manuscript. All authors have read and agreed to the published version of the manuscript.
Funding
This work was supported by the project from the Department of Science and Technology of Jilin Province (grant number: YDZJ202401363ZYTS); the project from the National Key R&D Program of China (grant number: 2022YFF1300900).
Data Availability Statement
The datasets generated or analyzed during the current study are available from the corresponding authors on reasonable request. The data are not publicly available due to privacy restrictions.
Conflicts of Interest
The authors declare no conflicts of interest.
Abbreviations
The following abbreviations are used in this manuscript:
| ERA | Ecological Risk Assessment |
| AHP | Analytic Hierarchy Process |
| GIS | Geographic Information System |
| RS | Remote sensing |
| TVDI | Temperature vegetation drought index |
| LPCI | Landscape Pattern Comprehensive Index |
| AI | Aggregation index |
| PD | Patch density |
| SHDI | Shannon’s diversity index |
| HSI | Habitat suitability index |
| NPP | Net primary productivity |
References
- Russi, D.; ten Brink, P.; Farmer, A.; Badura, T.; Coates, D.; Förster, J.; Kumar, R.; Davidson, N. The Economics of Ecosystems and Biodiversity for Water and Wetlands; Institute for European Environmental Policy (IEEP): London, UK; Brussels, Belgium; Ramsar Secretariat: Gland, Switzerland, 2013. [Google Scholar]
- Tozer, D.C.; Steele, O.; Gloutney, M. Multispecies benefits of wetland conservation for marsh birds, frogs, and species at risk. J. Environ. Manag. 2018, 212, 160–168. [Google Scholar] [CrossRef] [Scilit]
- Shen, G.; Yang, X.; Jin, Y.; Xu, B.; Zhou, Q. Remote sensing and evaluation of the wetland ecological degradation process of the Zoige Plateau Wetland in China. Ecol. Indic. 2019, 104, 48–58. [Google Scholar] [CrossRef] [Scilit]
- Davidson, N.C. How much wetland has the world lost? Long-term and recent trends in global wetland area. Mar. Freshw. Res. 2014, 65, 934–941. [Google Scholar] [CrossRef] [Scilit]
- Dixon, M.J.R.; Loh, J.; Davidson, N.C.; Beltrame, C.; Freeman, R.; Walpole, M. Tracking global change in ecosystem area: The Wetland Extent Trends index. Biol. Conserv. 2016, 193, 27–35. [Google Scholar] [CrossRef] [Scilit]
- Zedler, J.B.; Kercher, S. Wetland resources: Status, trends, ecosystem services, and restorability. Annu. Rev. Environ. Resour. 2005, 30, 39–74. [Google Scholar] [CrossRef] [Scilit]
- Davidson, N.C.; Finlayson, C.M. Earth Observation for wetland inventory, assessment and monitoring. Aquat. Conserv. Mar. Freshw. Ecosyst. 2007, 17, 219–228. [Google Scholar] [CrossRef] [Scilit]
- Ramsar Convention Secretariat. Inventory, Assessment, and Monitoring: An Integrated Framework for Wetland Inventory, Assessment, and Monitoring, 4th ed.; Ramsar Convention Secretariat: Gland, Switzerland, 2010; Volume 13. [Google Scholar]
- Kotze, D.C.; Ellery, W.N.; Macfarlane, D.M.; Jewitt, G.P.W. A rapid assessment method for coupling anthropogenic stressors and wetland ecological condition. Ecol. Indic. 2012, 13, 284–293. [Google Scholar] [CrossRef] [Scilit]
- Sun, Y.; Wu, G.; Mao, M.; Duan, X.; Hu, J.; Zhang, Y.; Xie, Y.; Qiu, X.; Gong, W.; Liu, T.; et al. Remote sensing and environmental assessment of wetland ecological degradation in the Small Sanjiang Plain, Northeast China. Front. Ecol. Evol. 2023, 11, 1125775. [Google Scholar] [CrossRef] [Scilit]
- Hou, M.; Li, L.; Yu, H.; Jin, R.; Zhu, W. Ecological security evaluation of wetlands in Changbai Mountain area based on DPSIRM model. Ecol. Indic. 2024, 160, 111773. [Google Scholar] [CrossRef] [Scilit]
- Aslam, R.W.; Shu, H.; Naz, I.; Quddoos, A.; Yaseen, A.; Gulshad, K.; Alarifi, S.S. Machine learning-based wetland vulnerability assessment in the Sindh Province Ramsar Site using remote sensing data. Remote Sens. 2024, 16, 928. [Google Scholar] [CrossRef] [Scilit]
- Jiang, W.; Lv, J.; Wang, C.; Chen, Z.; Liu, Y. Marsh wetland degradation risk assessment and change analysis: A case study in the Zoige Plateau, China. Ecol. Indic. 2017, 82, 316–326. [Google Scholar] [CrossRef] [Scilit]
- Hidalgo-Corrotea, C.; Alaniz, A.J.; Vergara, P.M.; Moreira-Arce, D.; Carvajal, M.A.; Pacheco-Cancino, P.; Espinosa, A. High vulnerability of coastal wetlands in Chile at multiple scales derived from climate change, urbanization, and exotic forest plantations. Sci. Total Environ. 2023, 903, 166130. [Google Scholar] [CrossRef] [Scilit] [PubMed]
- Yang, X.; Liu, S.; Jia, C.; Liu, Y.; Yu, C. Vulnerability assessment and management planning for the ecological environment in urban wetlands. J. Environ. Manag. 2021, 298, 113540. [Google Scholar] [CrossRef] [Scilit] [PubMed]
- Islam, A.R.M.T.; Talukdar, S.; Mahato, S.; Ziaul, S.; Eibek, K.U.; Akhter, S.; Pham, Q.B.; Mohammadi, B.; Karimi, F.; Linh, N.T.T. Machine learning algorithm-based risk assessment of riparian wetlands in Padma River Basin of Northwest Bangladesh. Environ. Sci. Pollut. Res. 2021, 28, 34450–34471. [Google Scholar] [CrossRef] [Scilit] [PubMed]
- Vázquez-González, C.; Fermán-Almada, J.L.; Moreno-Casasola, P.; Espejel, I. Scenarios of vulnerability in coastal municipalities of tropical Mexico: An analysis of wetland land use. Ocean Coast. Manag. 2014, 89, 11–19. [Google Scholar] [CrossRef] [Scilit]
- Mondal, B.K.; Kumari, S.; Ghosh, A.; Mishra, P.K. Transformation and risk assessment of the East Kolkata Wetlands (India) using fuzzy MCDM method and geospatial technology. Geogr. Sustain. 2022, 3, 191–203. [Google Scholar] [CrossRef] [Scilit]
- Zhang, X.; Zhang, C.; Chen, X.; Su, P. Evaluation of the vulnerability of Huanghe estuary coastal wetlands to marine oil spill stress. Front. Mar. Sci. 2024, 11, 1481868. [Google Scholar] [CrossRef] [Scilit]
- Pricope, N.G.; Shivers, G. Wetland Vulnerability Metrics as a Rapid Indicator in Identifying Nature-Based Solutions to Mitigate Coastal Flooding. Hydrology 2022, 9, 218. [Google Scholar] [CrossRef] [Scilit]
- Sabljić, L.; Lukić, T.; Bajić, D.; Marković, R.; Spalević, V.; Delić, D.; Radivojević, A.R. Optimizing agricultural land use: A GIS-based assessment of suitability in the Sana River Basin, Bosnia and Herzegovina. Open Geosci. 2024, 16, 20220683. [Google Scholar] [CrossRef] [Scilit]
- Saaty, T.L. A scaling method for priorities in hierarchical structures. J. Math. Psychol. 1977, 15, 234–281. [Google Scholar] [CrossRef] [Scilit]
- Luo, L.; Wang, X.; Wang, Z. Identifying variations in ecosystem health of wetlands in the Western Songnen Plain (2000–2020). Water 2025, 17, 3175. [Google Scholar] [CrossRef] [Scilit]
- Chen, H.; Zhang, W.; Gao, H.; Nie, N. Climate Change and Anthropogenic Impacts on Wetland and Agriculture in the Songnen and Sanjiang Plain, Northeast China. Remote Sens. 2018, 10, 356. [Google Scholar] [CrossRef] [Scilit]
- Ren, Y.; Li, X.; Mao, D.; Wang, Z.; Jia, M.; Chen, L. Investigating Spatial and Vertical Patterns of Wetland Soil Organic Carbon Concentrations in China’s Western Songnen Plain by Comparing Different Algorithms. Sustainability 2020, 12, 932. [Google Scholar] [CrossRef] [Scilit]
- Wang, Y.; Shen, X.; Tong, S.; Zhang, M.; Jiang, M.; Lu, X. Aboveground Biomass of Wetland Vegetation Under Climate Change in the Western Songnen Plain. Front. Plant Sci. 2022, 13, 941689. [Google Scholar] [CrossRef] [Scilit] [PubMed]
- Tian, Y.; Wang, Z.; Mao, D.; Li, L.; Liu, M.; Jia, M.; Man, W.; Lu, C. Remote observation in habitat suitability changes for waterbirds in the West Songnen Plain, China. Sustainability 2019, 11, 1552. [Google Scholar] [CrossRef] [Scilit]
- Feng, K.; Mao, D.; Zhen, J.; Pu, H.; Yan, H.; Wang, M.; Wang, D.; Xiang, H.; Ren, Y.; Luo, L.; et al. Potential of sample migration and explainable machine learning model for monitoring spatiotemporal changes of wetland plant communities. IEEE J. Sel. Top. Appl. Earth Obs. Remote Sens. 2024, 17, 9894–9906. [Google Scholar] [CrossRef] [Scilit]
- Ramsar Convention Secretariat. The List of Wetlands of International Importance. Available online: https://www.ramsar.org/our-work/wetlands-international-importance/ramsar-list (accessed on 4 May 2026).
- Dong, Z.; Wang, Z.; Liu, D.; Li, L.; Ren, C.; Tang, X.; Jia, M.; Liu, C. Assessment of habitat suitability for waterbirds in the West Songnen Plain, China, using remote sensing and GIS. Ecol. Eng. 2013, 55, 94–100. [Google Scholar] [CrossRef] [Scilit]
- Yang, K.; Zeng, Y.; Li, H. Research on land use/cover remote sensing classification using surface biophysical parameters: A case study of Changsha city. Sci. Surv. Mapp. 2008, 33, 54–57+60. [Google Scholar] [CrossRef]
- Allen, R.G.; Pereira, L.S.; Raes, D.; Smith, M. Crop Evapotranspiration: Guidelines for Computing Crop Water Requirements; FAO: Rome, Italy, 1998. [Google Scholar]
- Zhang, X.; Wang, G.; Xue, B.; Zhang, M.; Tan, Z. Dynamic landscapes and the driving forces in the Yellow River Delta wetland region in the past four decades. Sci. Total Environ. 2021, 787, 147644. [Google Scholar] [CrossRef] [Scilit] [PubMed]
- Murray, N.J.; Worthington, T.A.; Bunting, P.; Duce, S.; Hagger, V.; Lovelock, C.E.; Lucas, R.; Saunders, M.I.; Sheaves, M.; Spalding, M.; et al. High-resolution mapping of losses and gains of Earth’s tidal wetlands. Science 2022, 376, 744–749. [Google Scholar] [CrossRef] [Scilit] [PubMed]
- Soboka, D.M.; Gemechu, L.H. Identifying couse and drivers of wetland degradation in Ethiopia: A review. J. Environ. Earth Sci. 2021, 11, 2224–3216. [Google Scholar] [CrossRef] [Scilit]
- Wagner, P.D.; Bieger, K.; Arnold, J.G.; Fohrer, N. Representation of hydrological processes in a rural lowland catchment in Northern Germany using SWAT and SWAT+. Hydrol. Processes 2022, 36, e14589. [Google Scholar] [CrossRef] [Scilit]
- Li, Z.; Jiang, W.; Wang, W.; Lu, J.; Chen, Z. Wetland degradation risk assessment method and its application: A case study of Tianjin City. J. Environ. Eng. Technol. 2020, 10, 17–24. [Google Scholar]
- Sandholt, I.; Rasmussen, K.; Andersen, J. A simple interpretation of the surface temperature/vegetation index space for assessment of surface moisture status. Remote Sens. Environ. 2002, 79, 213–224. [Google Scholar] [CrossRef] [Scilit]
- Carlson, T.N.; Gillies, R.R.; Perry, E.M. A method to make use of thermal infrared temperature and NDVI measurements to infer surface soil water content and fractional vegetation cover. Remote Sens. Rev. 1994, 9, 161–173. [Google Scholar] [CrossRef] [Scilit]
- Carlson, T. An Overview of the “Triangle Method” for Estimating Surface Evapotranspiration and Soil Moisture from Satellite Imagery. Sensors 2007, 7, 1612–1629. [Google Scholar] [CrossRef] [Scilit]
- Yang, X.; Wu, J.J.; Shi, P.J.; Yan, F. Modified triangle method to estimate soil moisture status with Moderate Resolution Imaging Spectroradiometer (MODIS) products. In Proceedings of the International Archives of the Photogrammetry, Remote Sensing and Spatial Information Sciences, Beijing, China, 11 July 2008. [Google Scholar]
- Huete, A.; Didan, K.; Miura, T.; Rodriguez, E.P.; Gao, X.; Ferreira, L.G. Overview of the radiometric and biophysical performance of the MODIS vegetation indices. Remote Sens. Environ. 2002, 83, 195–213. [Google Scholar] [CrossRef] [Scilit]
- Zhang, F.; Zhang, L.; Shi, J.; Huang, J. Soil moisture monitoring based on land surface temperature-vegetation index space derived from MODIS data. Pedosphere 2014, 24, 450–460. [Google Scholar] [CrossRef] [Scilit]
- Fahrig, L. Ecological Responses to Habitat Fragmentation Per Se. Annu. Rev. Ecol. Evol. Syst. 2017, 48, 1–23. [Google Scholar] [CrossRef] [Scilit]
- Zhao, L.; Fan, X.; Lin, H.; Hong, T.; Hong, W. Impact of expressways on land use changes, landscape patterns, and ecosystem services value in Nanping City, China. Pol. J. Environ. Stud. 2021, 30, 2935–2946. [Google Scholar] [CrossRef] [Scilit] [PubMed]
- Stein, A.; Gerstner, K.; Kreft, H. Environmental heterogeneity as a universal driver of species richness across taxa, biomes and spatial scales. Ecol. Lett. 2014, 17, 866–880. [Google Scholar] [CrossRef] [Scilit] [PubMed]
- Xing, X.; Liu, Y.; Jin, R.; Zhang, P.; Tong, S.; Zhu, W. Major Role of Natural Wetland Loss in the Decline of Wetland Habitat Quality—Spatio-Temporal Monitoring and Predictive Analysis. Sustainability 2023, 15, 12415. [Google Scholar] [CrossRef] [Scilit]
- Pan, T.; Wu, S.; Liu, Y. Relative contributions of land use and climate change to water supply variations over Yellow River source area in Tibetan Plateau during the past three decades. PLoS ONE 2015, 10, e0123793. [Google Scholar] [CrossRef] [Scilit] [PubMed]
- Hamel, P.; Guswa, A.J. Uncertainty analysis of a spatially explicit annual water-balance model: Case study of the Cape Fear basin, North Carolina. Hydrol. Earth Syst. Sci. 2015, 19, 839–853. [Google Scholar] [CrossRef] [Scilit]
- Natural Capital Alliance. Annual Water Yield—InVEST User Guide. Available online: https://storage.googleapis.com/releases.naturalcapitalproject.org/invest-userguide/latest/en/annual_water_yield.html (accessed on 3 July 2026).
- Zhu, M.; Yu, H.; Yang, L.; Wang, X.; Zou, Y. Effects of land consolidation and precipitation changes on the balance of water supply and demand in western Jilin. Water 2022, 14, 3206. [Google Scholar] [CrossRef] [Scilit]
- Berta Aneseyee, A.; Noszczyk, T.; Soromessa, T.; Elias, E. The InVEST Habitat Quality Model Associated with Land Use/Cover Changes: A Qualitative Case Study of the Winike Watershed in the Omo-Gibe Basin, Southwest Ethiopia. Remote Sens. 2020, 12, 1103. [Google Scholar] [CrossRef] [Scilit]
- Hirzel, A.H.; Le Lay, G. Habitat suitability modelling and niche theory. J. Appl. Ecol. 2008, 45, 1372–1381. [Google Scholar] [CrossRef] [Scilit]
- Du, H. Study on landscape ecological risk assessment and landscape pattern optimization of West Qinling area. Resour. Environ. Eng. 2021, 35, 347–354. [Google Scholar] [CrossRef]
- Xi, Z.; Chen, G.; Xing, Y.; Xu, H.; Tian, Z.; Ma, Y.; Cui, J.; Li, D. Spatial and temporal variation of vegetation NPP and analysis of influencing factors in Heilongjiang Province, China. Ecol. Indic. 2023, 154, 110798. [Google Scholar] [CrossRef] [Scilit]
- Pirali Zefrehei, A.R.; Hedayati, A.; Pourmanafi, S.; Beyraghdar Kashkooli, O.; Ghorbani, R. Environmental vulnerability assessment of Choghakhor International Wetland during 1985 to 2018. Lakes Reserv. Sci. Policy Manag. Sustain. Use 2019, 25, 49–60. [Google Scholar] [CrossRef] [Scilit]
- Tilden, J.D.; Vandergragt, M.L. Great Barrier Reef Catchment Condition Monitoring Program: Tracking the Condition of Freshwater Wetlands; Department of Environment and Science: Brisbane, Australia, 2022. [Google Scholar]
- Das, S.; Pradhan, B.; Shit, P.K.; Alamri, A.M. Assessment of wetland ecosystem health using the pressure–state–response (PSR) model: A case study of Mursidabad district of West Bengal (India). Sustainability 2020, 12, 5932. [Google Scholar] [CrossRef] [Scilit]
- Malekmohammadi, B.; Rahimi Blouchi, L. Ecological risk assessment of wetland ecosystems using multi criteria decision making and geographic information system. Ecol. Indic. 2014, 41, 133–144. [Google Scholar] [CrossRef] [Scilit]
- Sandi, S.G.; Rodriguez, J.F.; Saintilan, N.; Wen, L.; Kuczera, G.; Riccardi, G.; Saco, P.M. Resilience to drought of dryland wetlands threatened by climate change. Sci. Rep. 2020, 10, 13232. [Google Scholar] [CrossRef] [Scilit] [PubMed]
- Zhang, Y.; Jin, R.; Zhu, W.; Zhang, D.; Zhang, X. Impacts of land use changes on wetland ecosystem services in the Tumen River Basin. Sustainability 2020, 12, 9821. [Google Scholar] [CrossRef] [Scilit]
- Li, G.; Zhang, C.; Zhang, X.; Yang, Z.; Wen, P.; Yang, Q. Response of kernel temperature vegetation drought index to urbanization in Northeast China. Chin. J. Appl. Ecol. 2025, 36, 208–218. [Google Scholar] [CrossRef] [Scilit] [PubMed]
- Hong, B.; Lin, Q.; Yu, S.; Zhang, D.; Yang, L. Spatiotemporal variations of human impact intensity on coastal wetlands and its economic driving mechanism in Fujian. J. Guilin Univ. Technol. 2019, 39, 678–684. [Google Scholar]
- Lu, Z.; Li, C.; Zhang, J.; Lei, G.; Yu, Z.; Dong, Z. Impact of land use change on actual evapotranspiration in the Songnen Plain, China. J. Hydrol. Reg. Stud. 2024, 54, 101854. [Google Scholar] [CrossRef] [Scilit]
- Wang, X.; Li, X.; Fei, L.; Liu, X.; Zhang, M. Climate-driven vegetation distribution and wetland expansion at the edge of Jiangjiadian Grassland, Northeastern China. Plants 2025, 14, 2785. [Google Scholar] [CrossRef] [Scilit] [PubMed]
- Song, J.; Zhang, R.; Wang, Y.; Huang, J. Evolution Characteristics of Wetland Landscape Pattern and Its Impact on Carbon Sequestration in Wuhan from 2000 to 2020. Land 2023, 12, 582. [Google Scholar] [CrossRef] [Scilit]
- Zhou, K. Study on wetland landscape pattern evolution in the Dongping Lake. Appl. Water Sci. 2022, 12, 200. [Google Scholar] [CrossRef] [Scilit]
- Li, Y.; Cong, Y.; Zhang, J.; Wang, L.; Fei, L. Ecosystem service trade-offs and synergies in a temperate agricultural region in Northeast China. Remote Sens. 2025, 17, 852. [Google Scholar] [CrossRef] [Scilit]
- Sun, X.; Li, Y.; Hu, Y.; Li, Y. Human and natural factors affect habitat quality in ecologically fragile areas: Evidence from Songnen Plain, China. Front. Plant Sci. 2024, 15, 1444163. [Google Scholar] [CrossRef] [Scilit] [PubMed]
- Wang, Y.; Shen, X.; Jiang, M.; Tong, S.; Lu, X. Daytime and nighttime temperatures exert different effects on vegetation net primary productivity of marshes in the western Songnen Plain. Ecol. Indic. 2022, 137, 108789. [Google Scholar] [CrossRef] [Scilit]
- Lin, N.; Li, J.; Jiang, R.; Li, X.; Liu, S. Quantifying the spatiotemporal variation of NPP of different land cover types and the contribution of its associated factors in the Songnen Plain. Forests 2023, 14, 1841. [Google Scholar] [CrossRef] [Scilit]
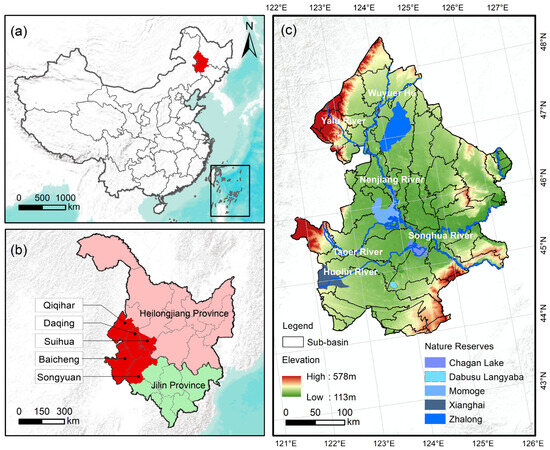
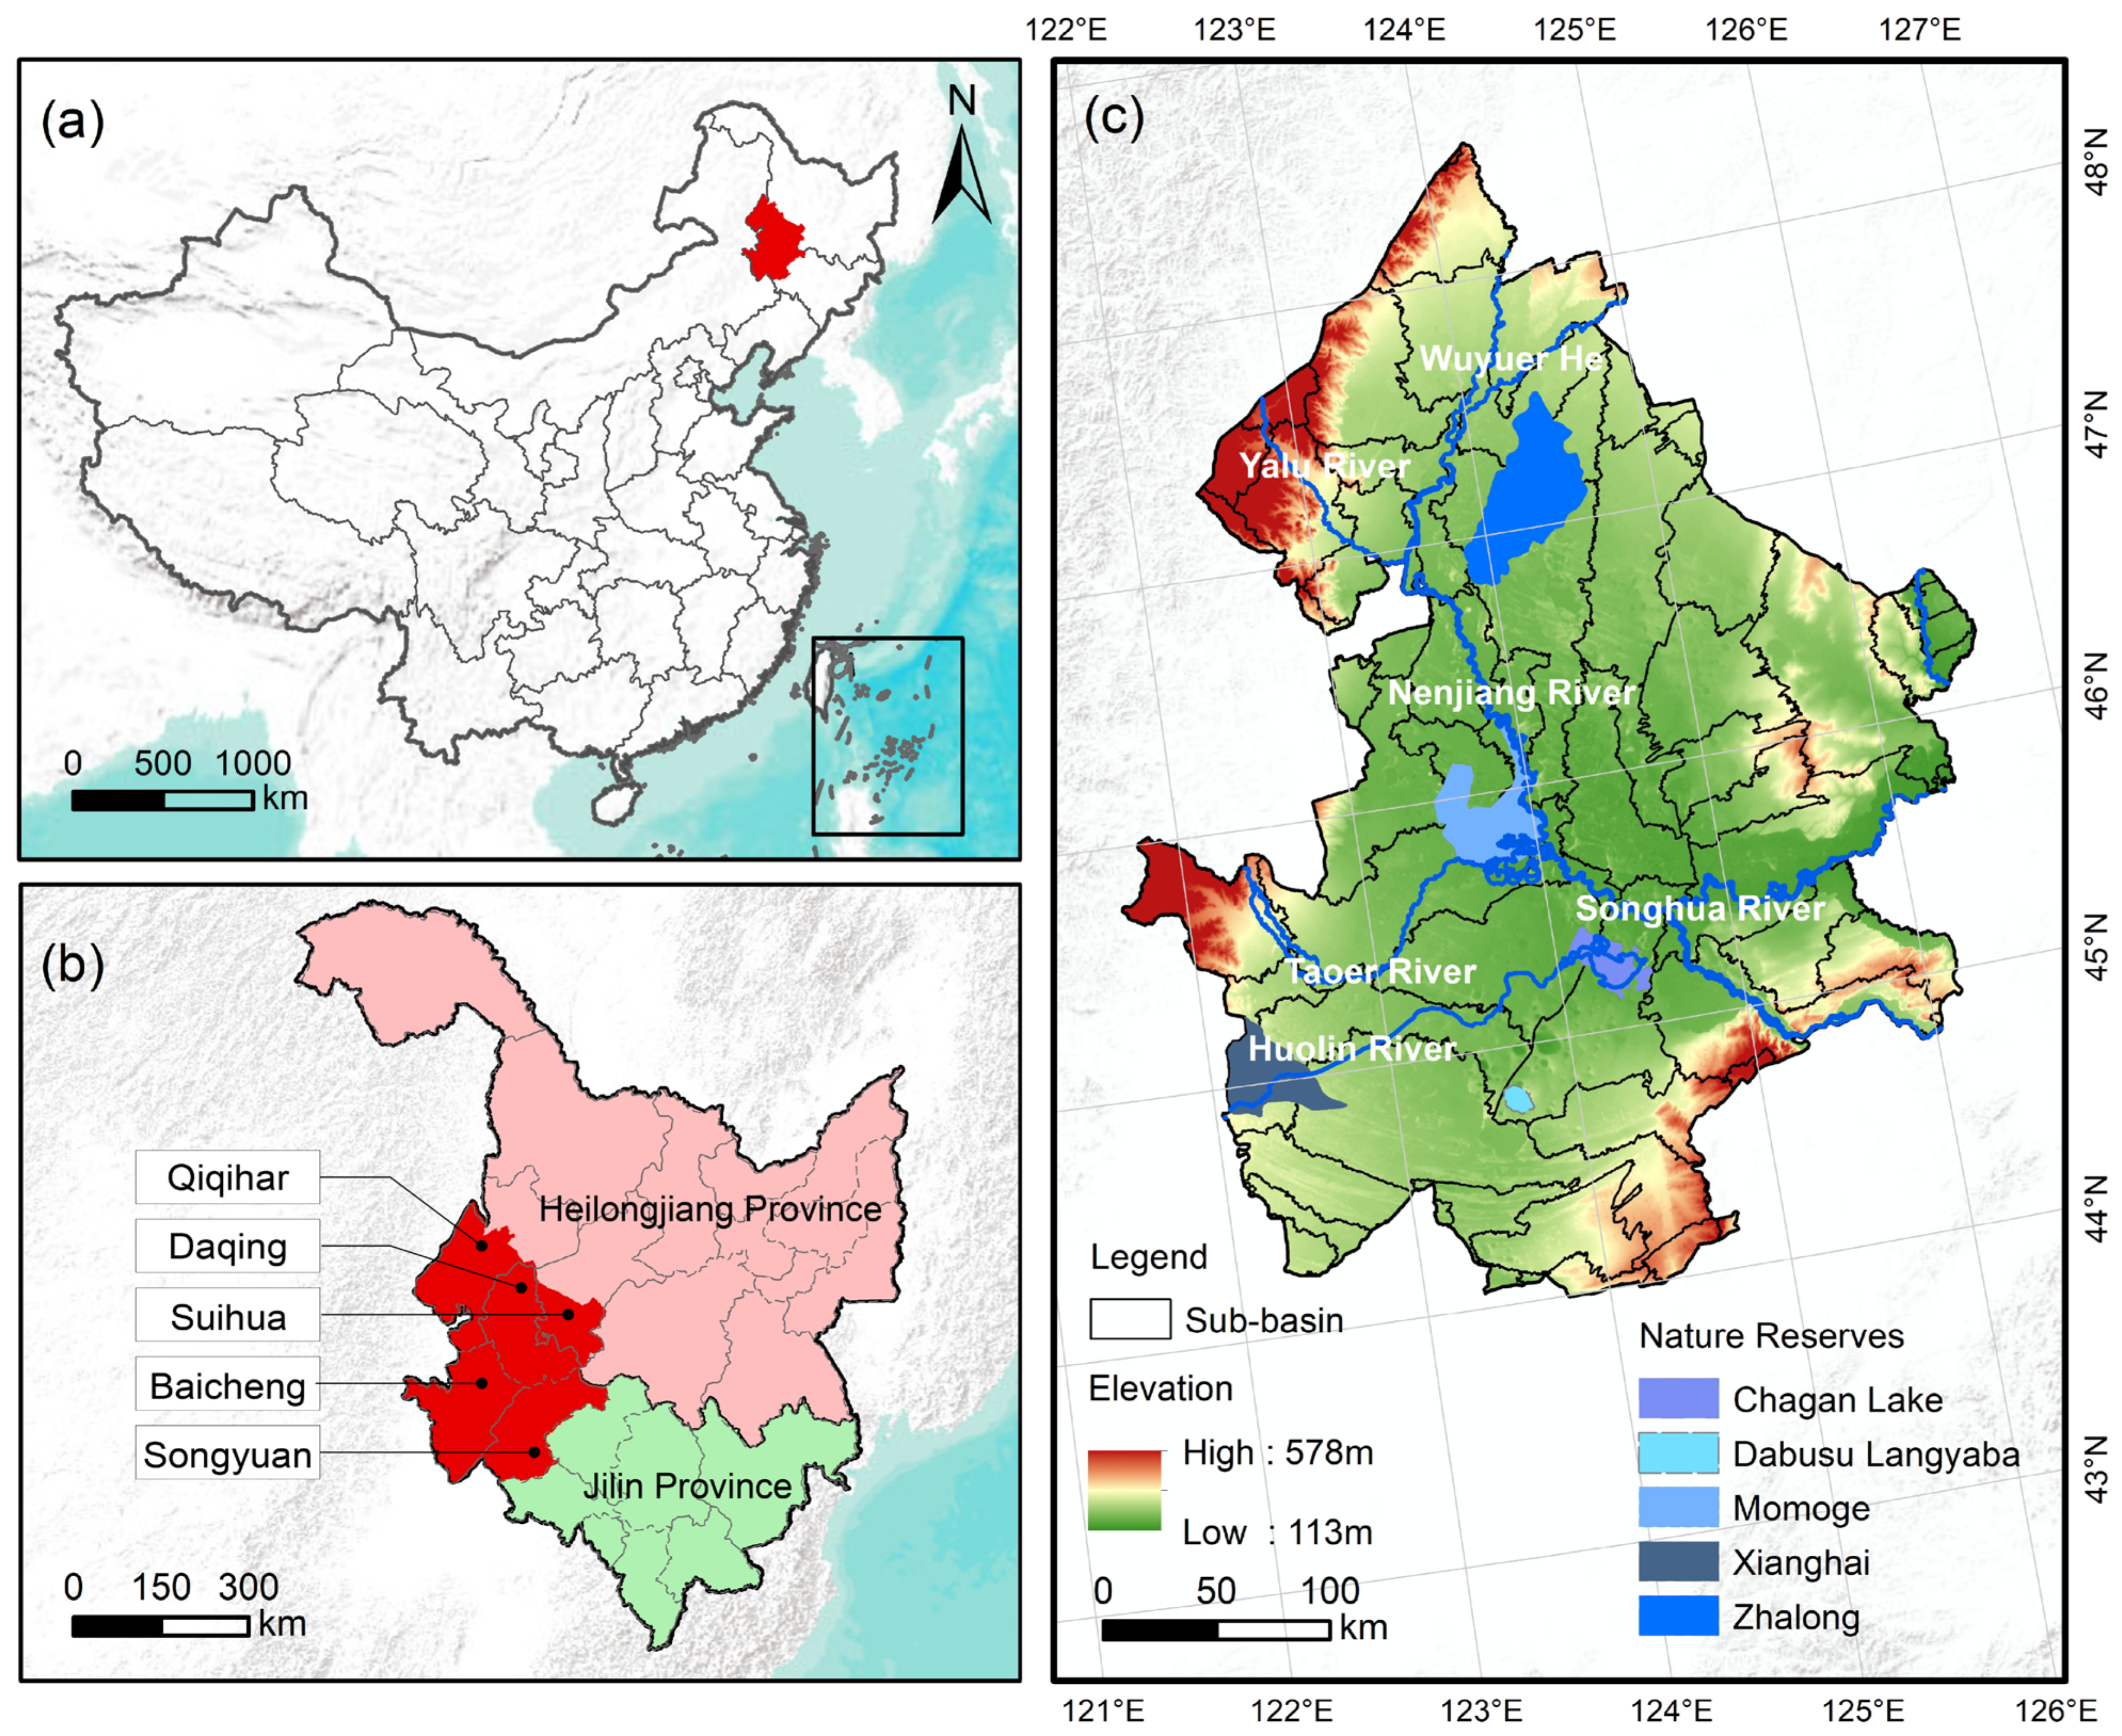
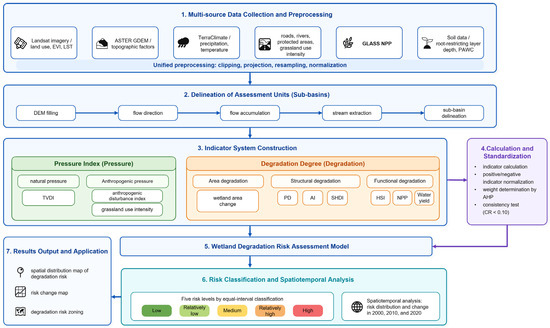
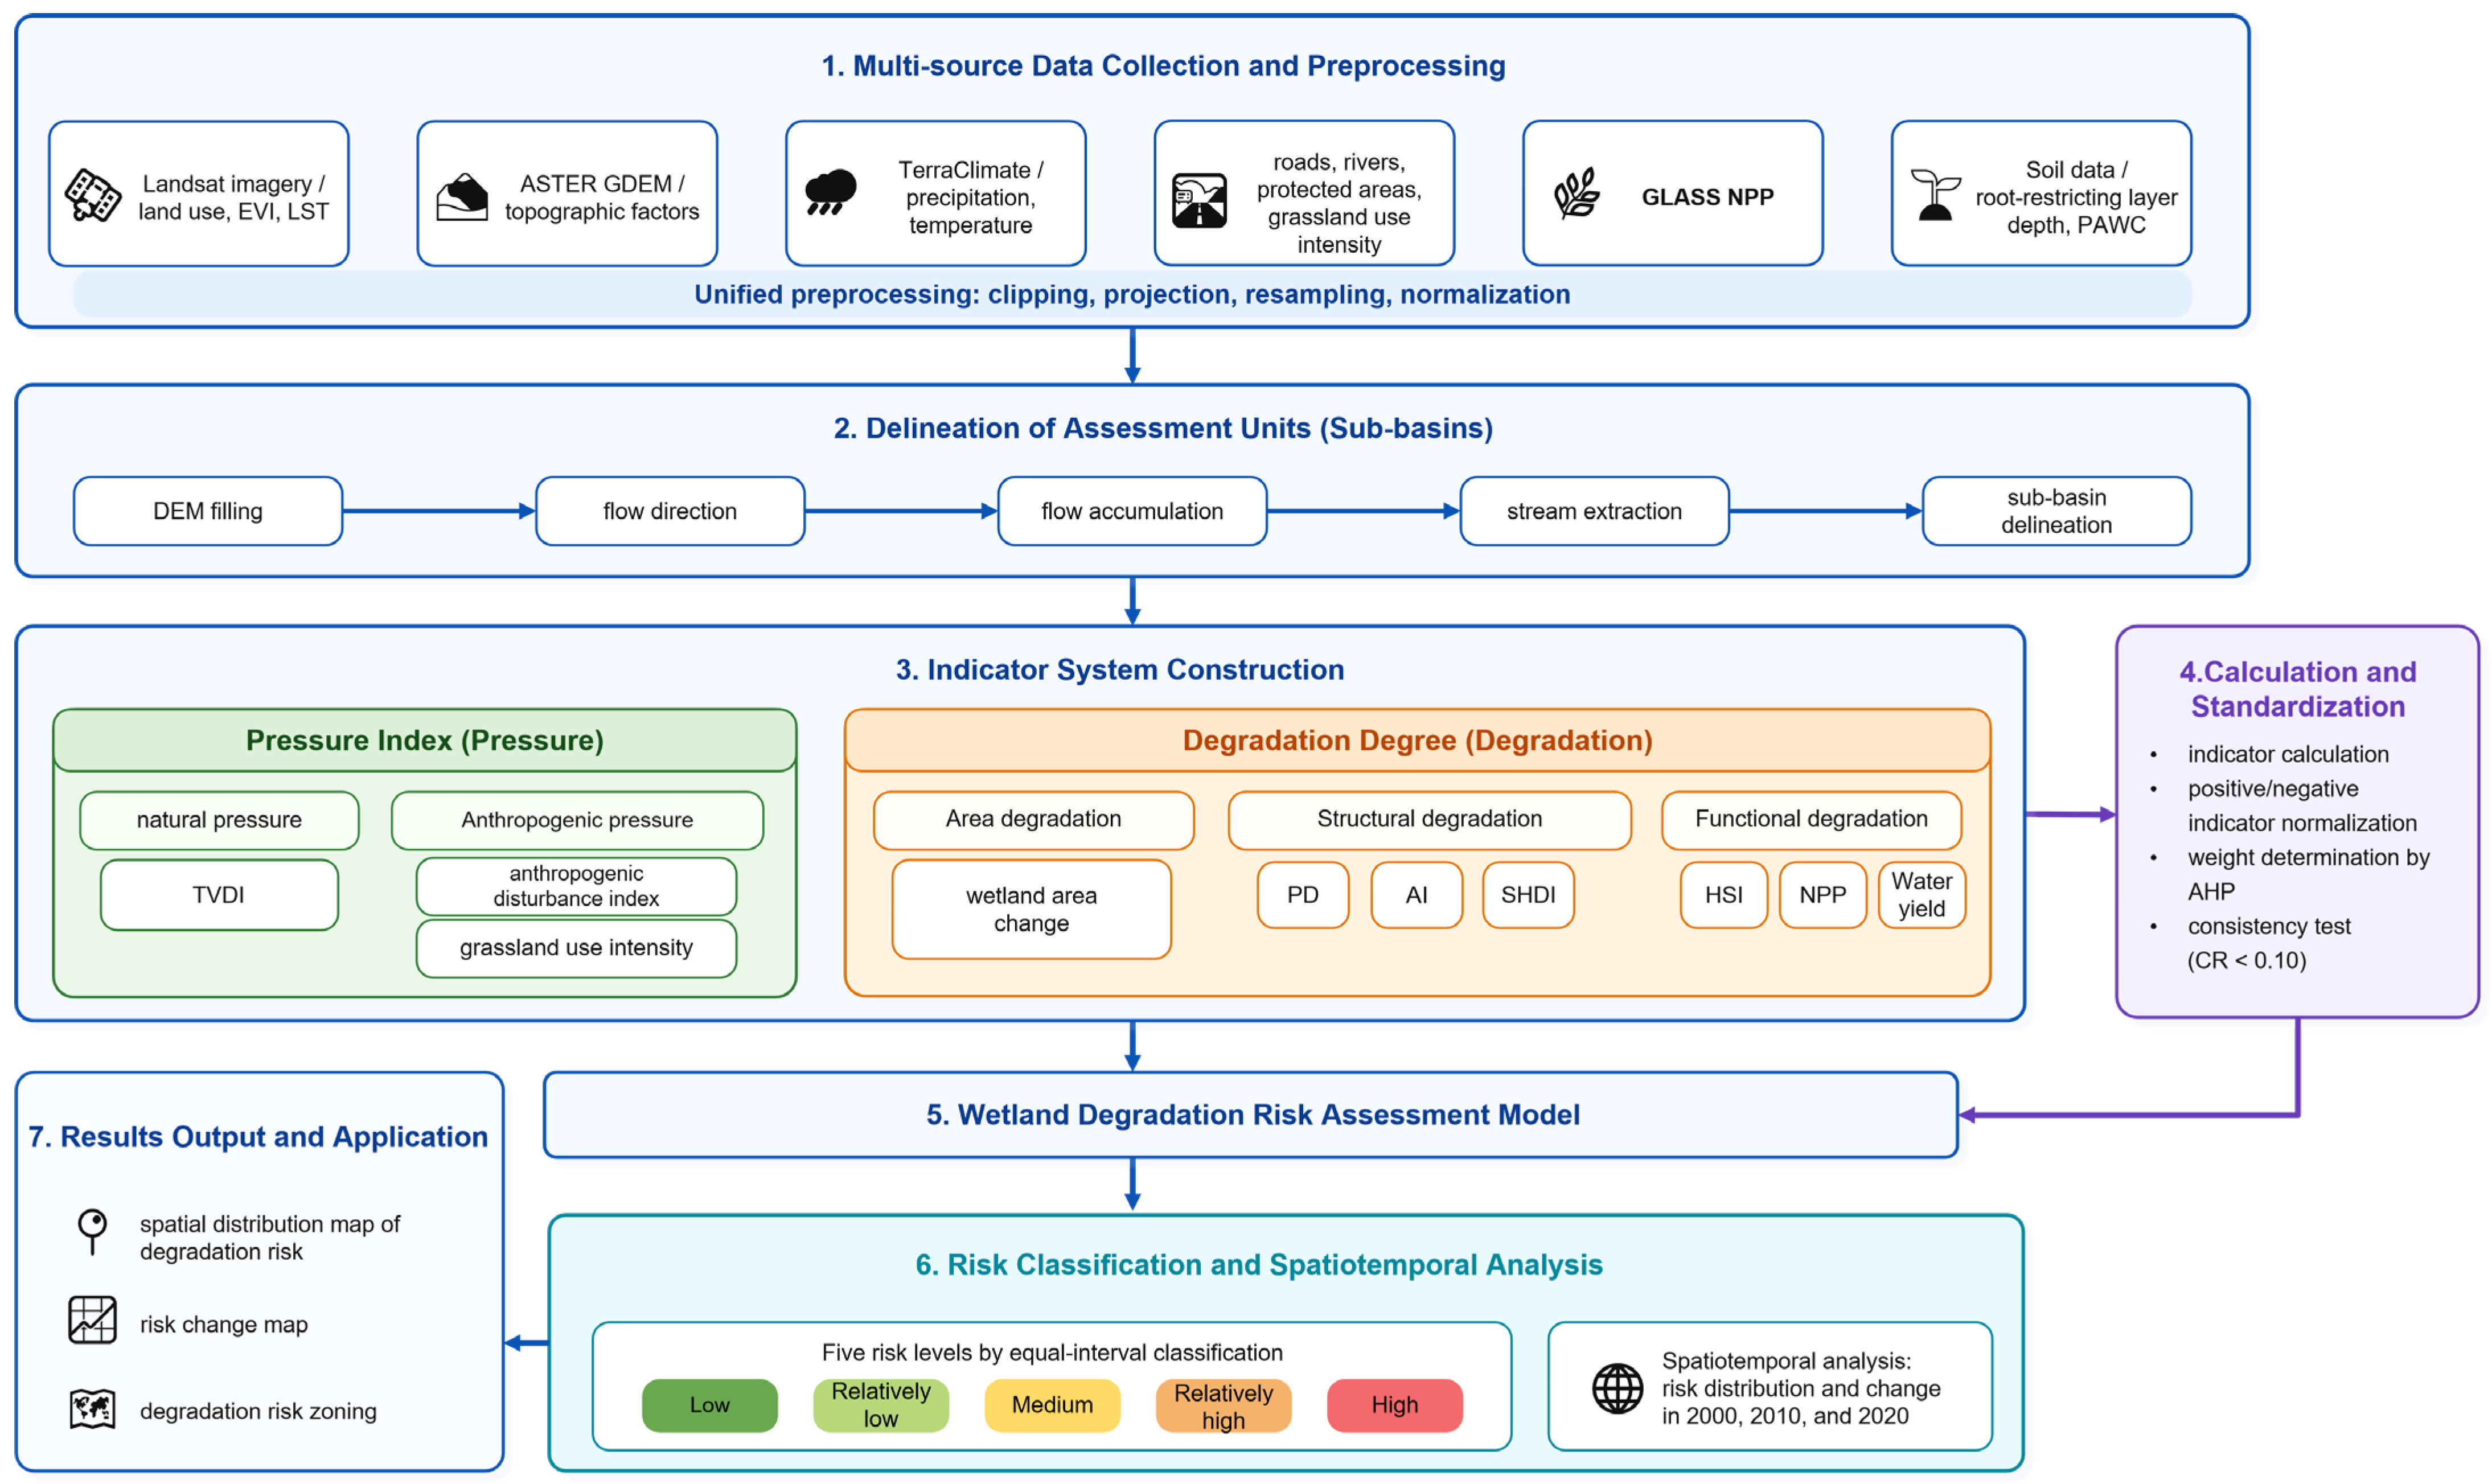
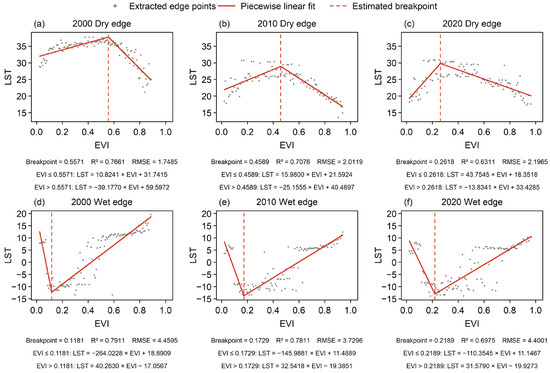
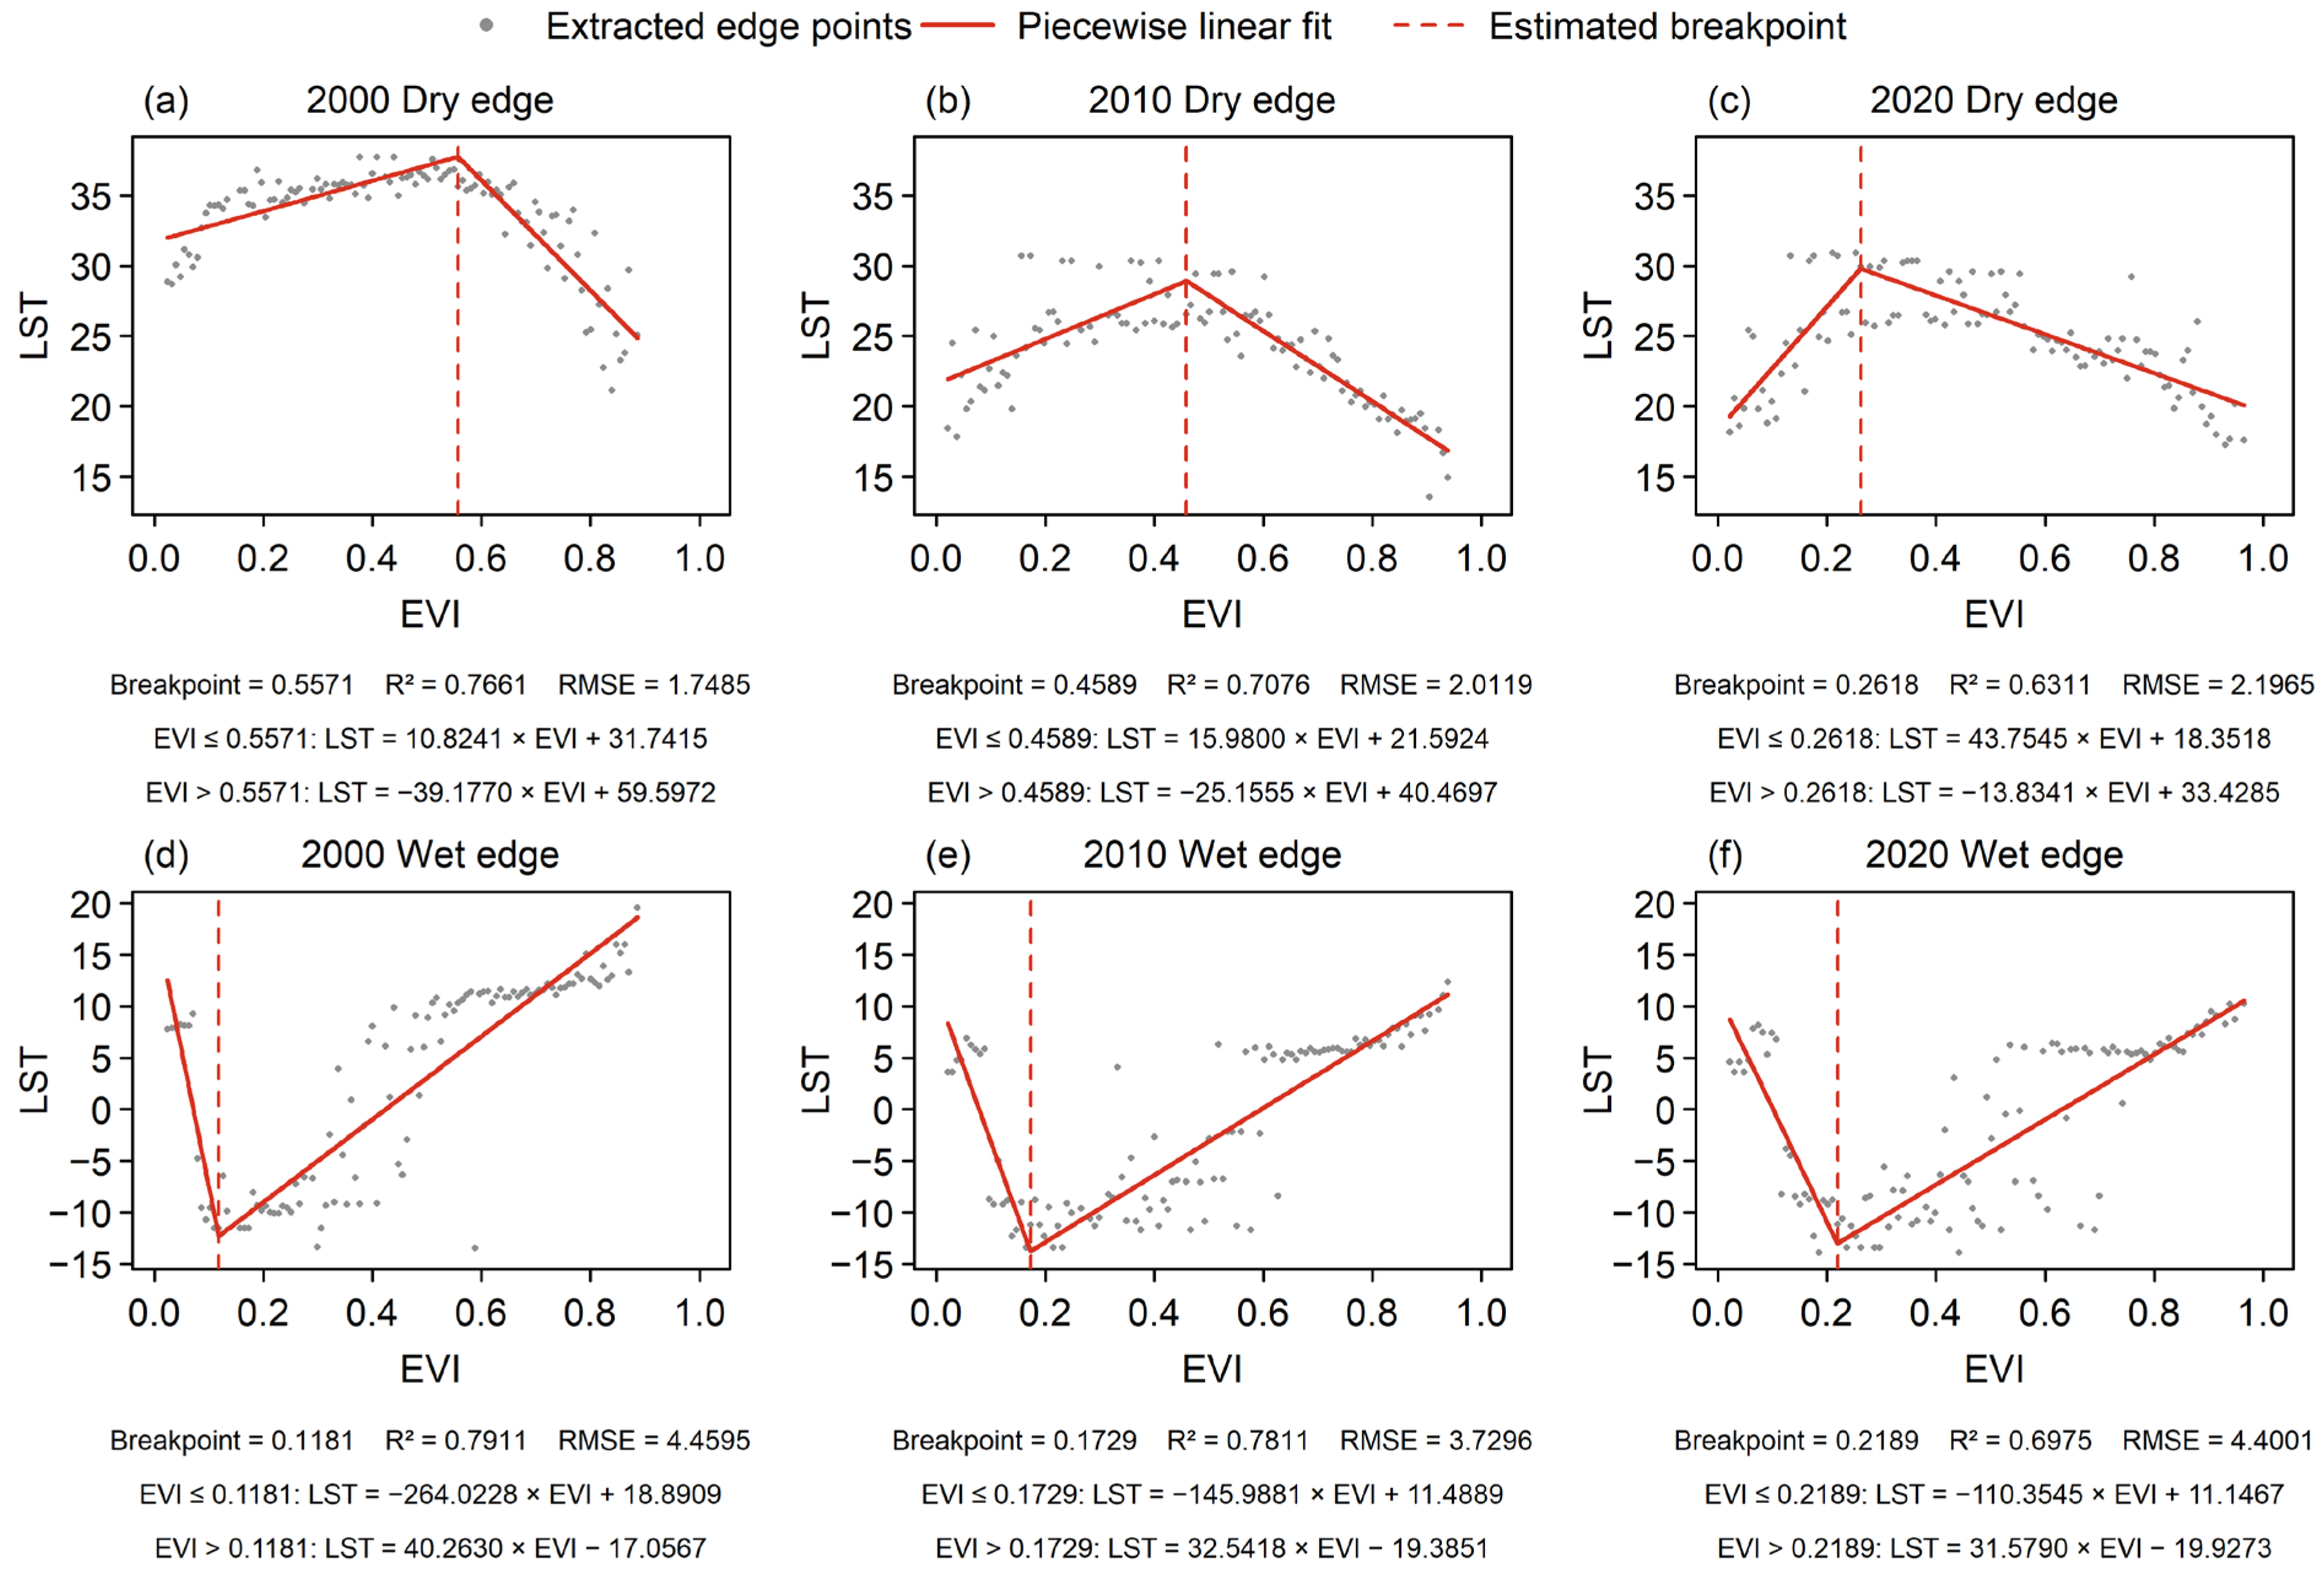
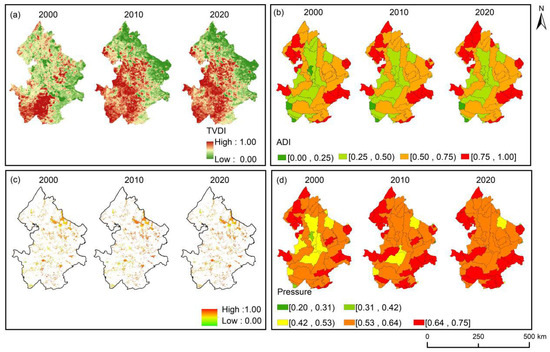
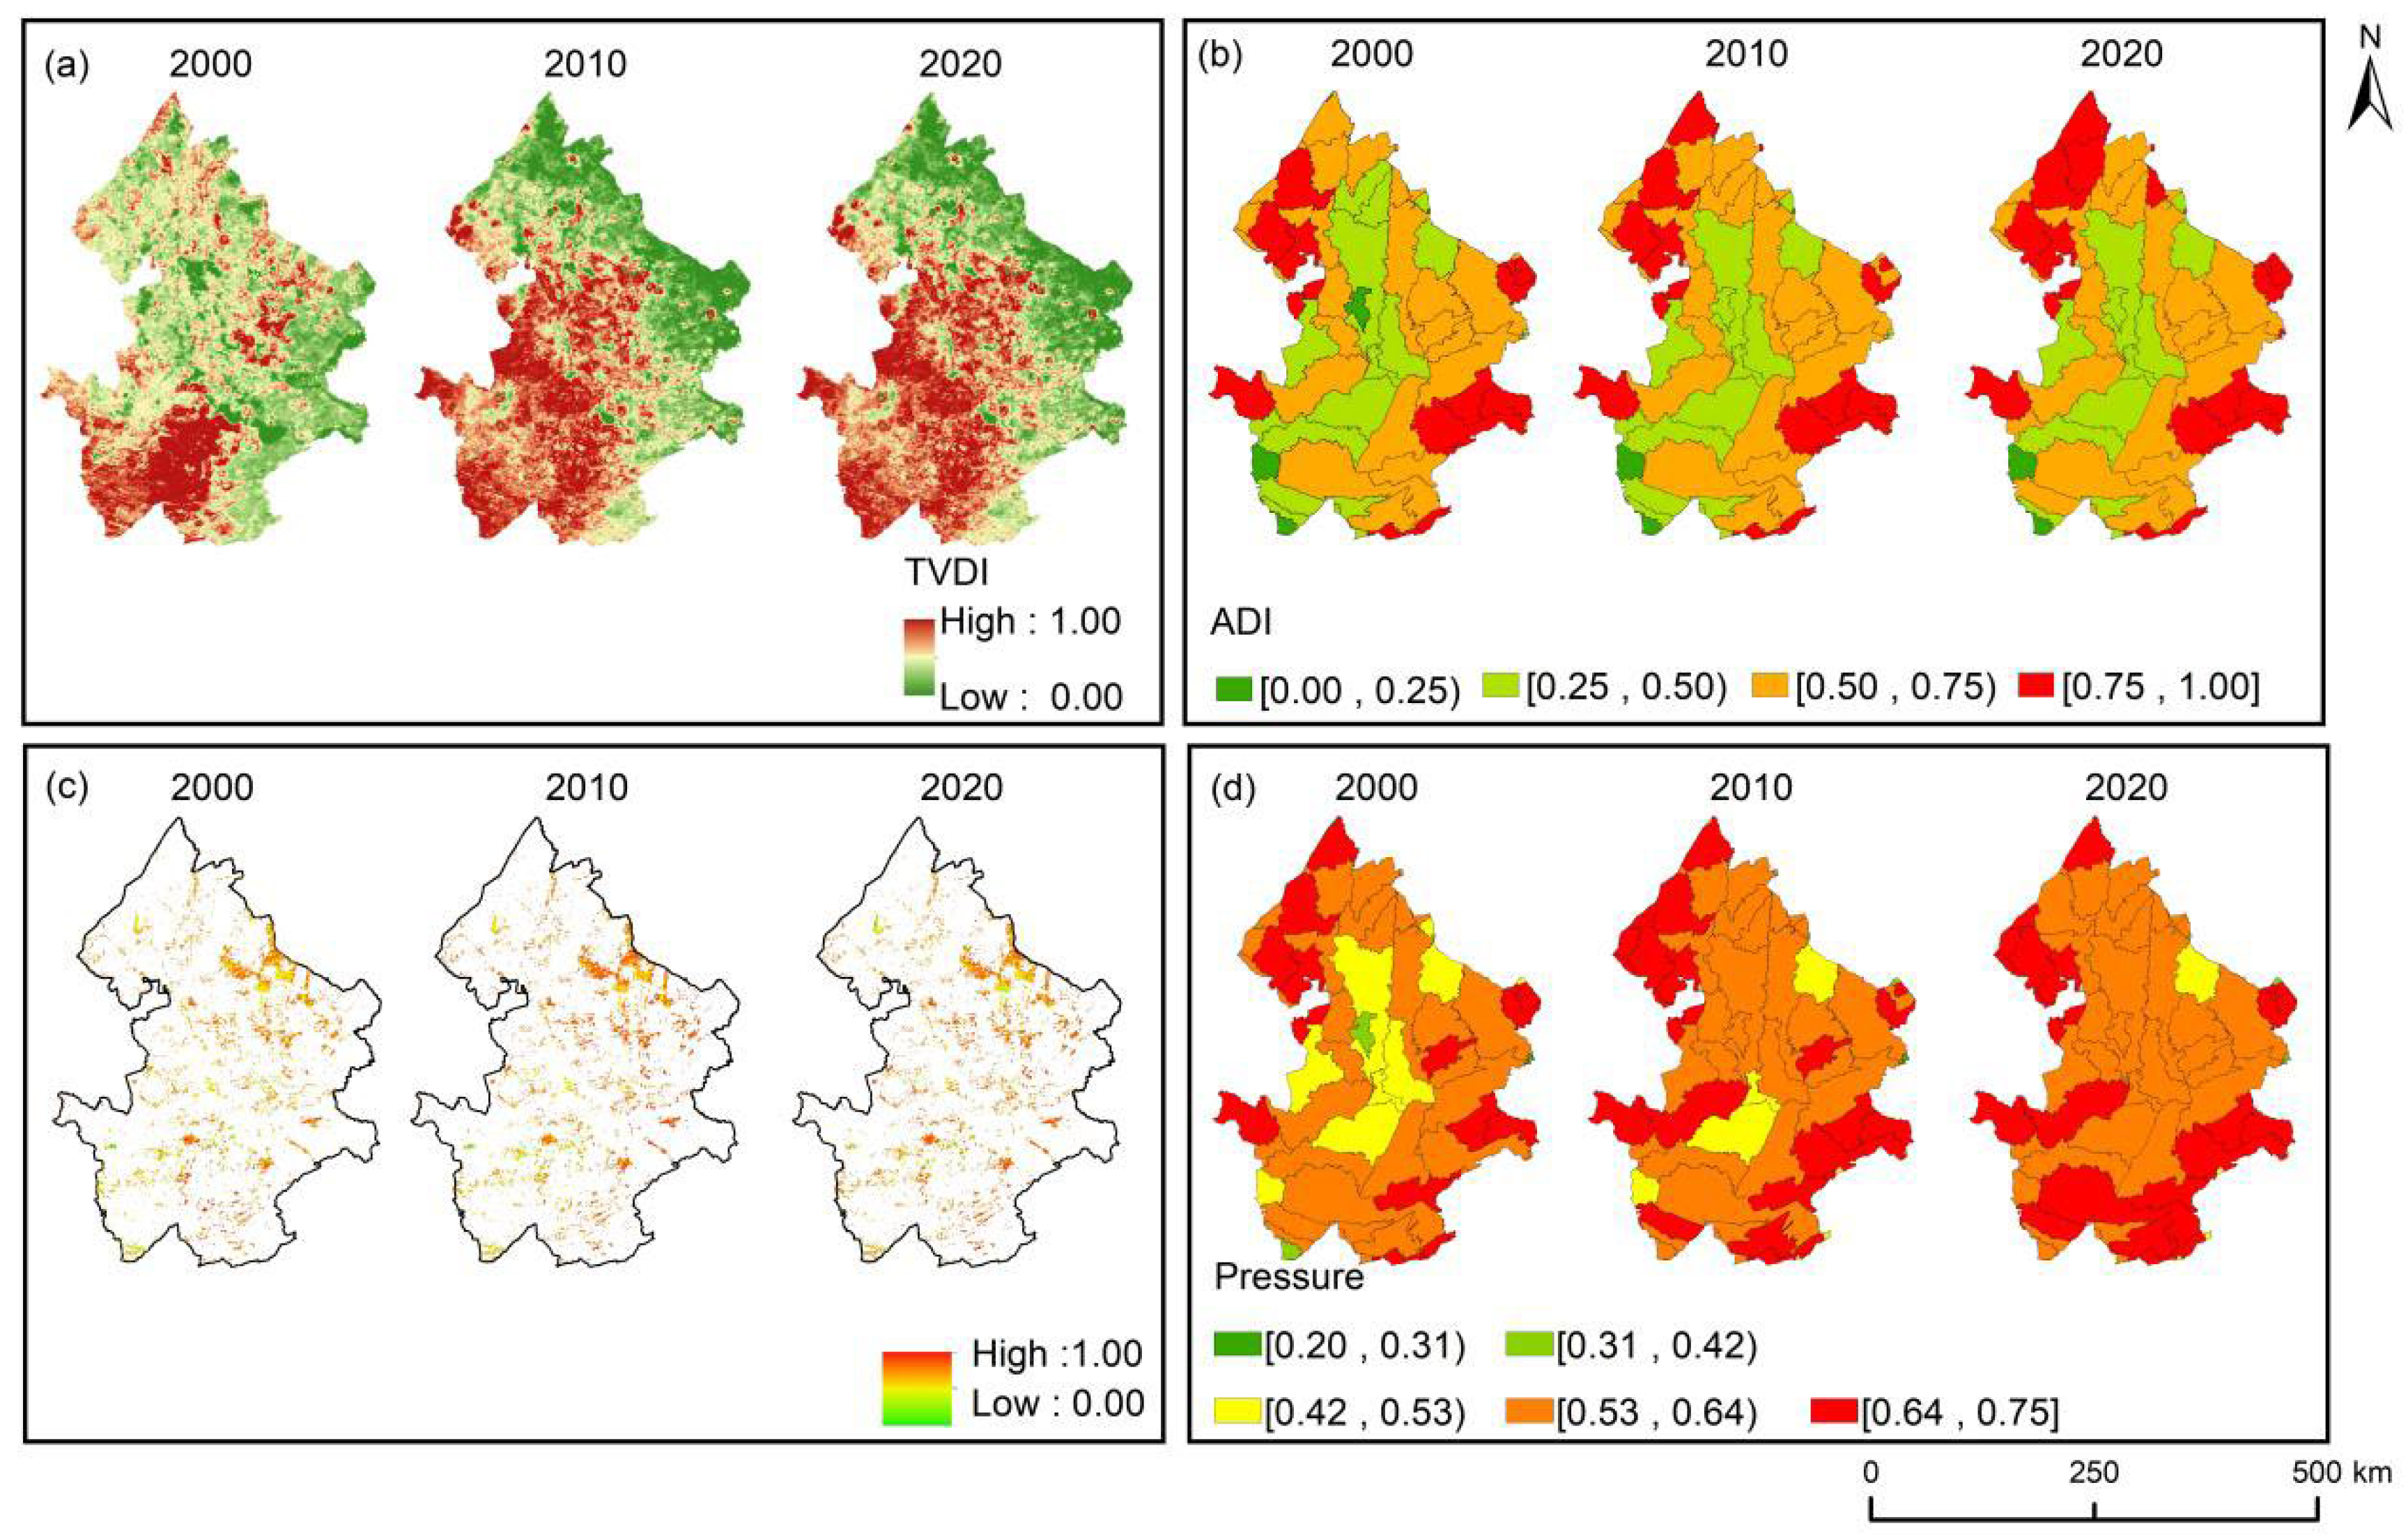
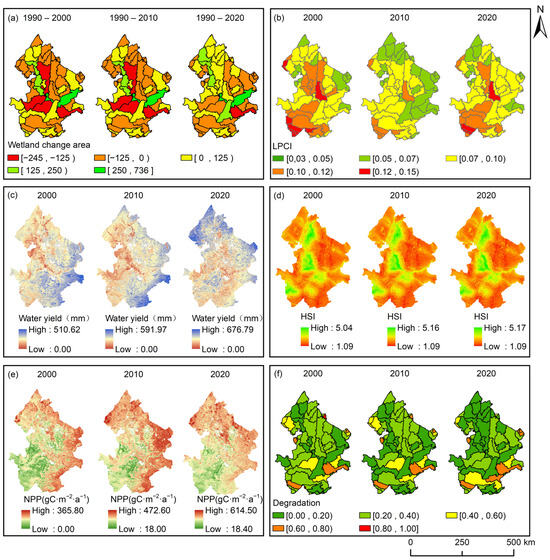
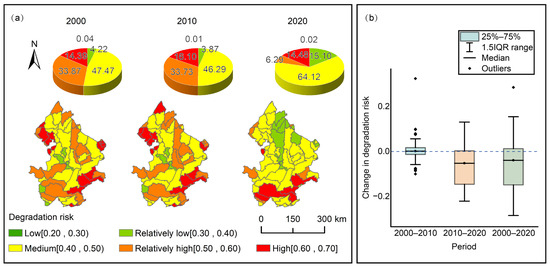
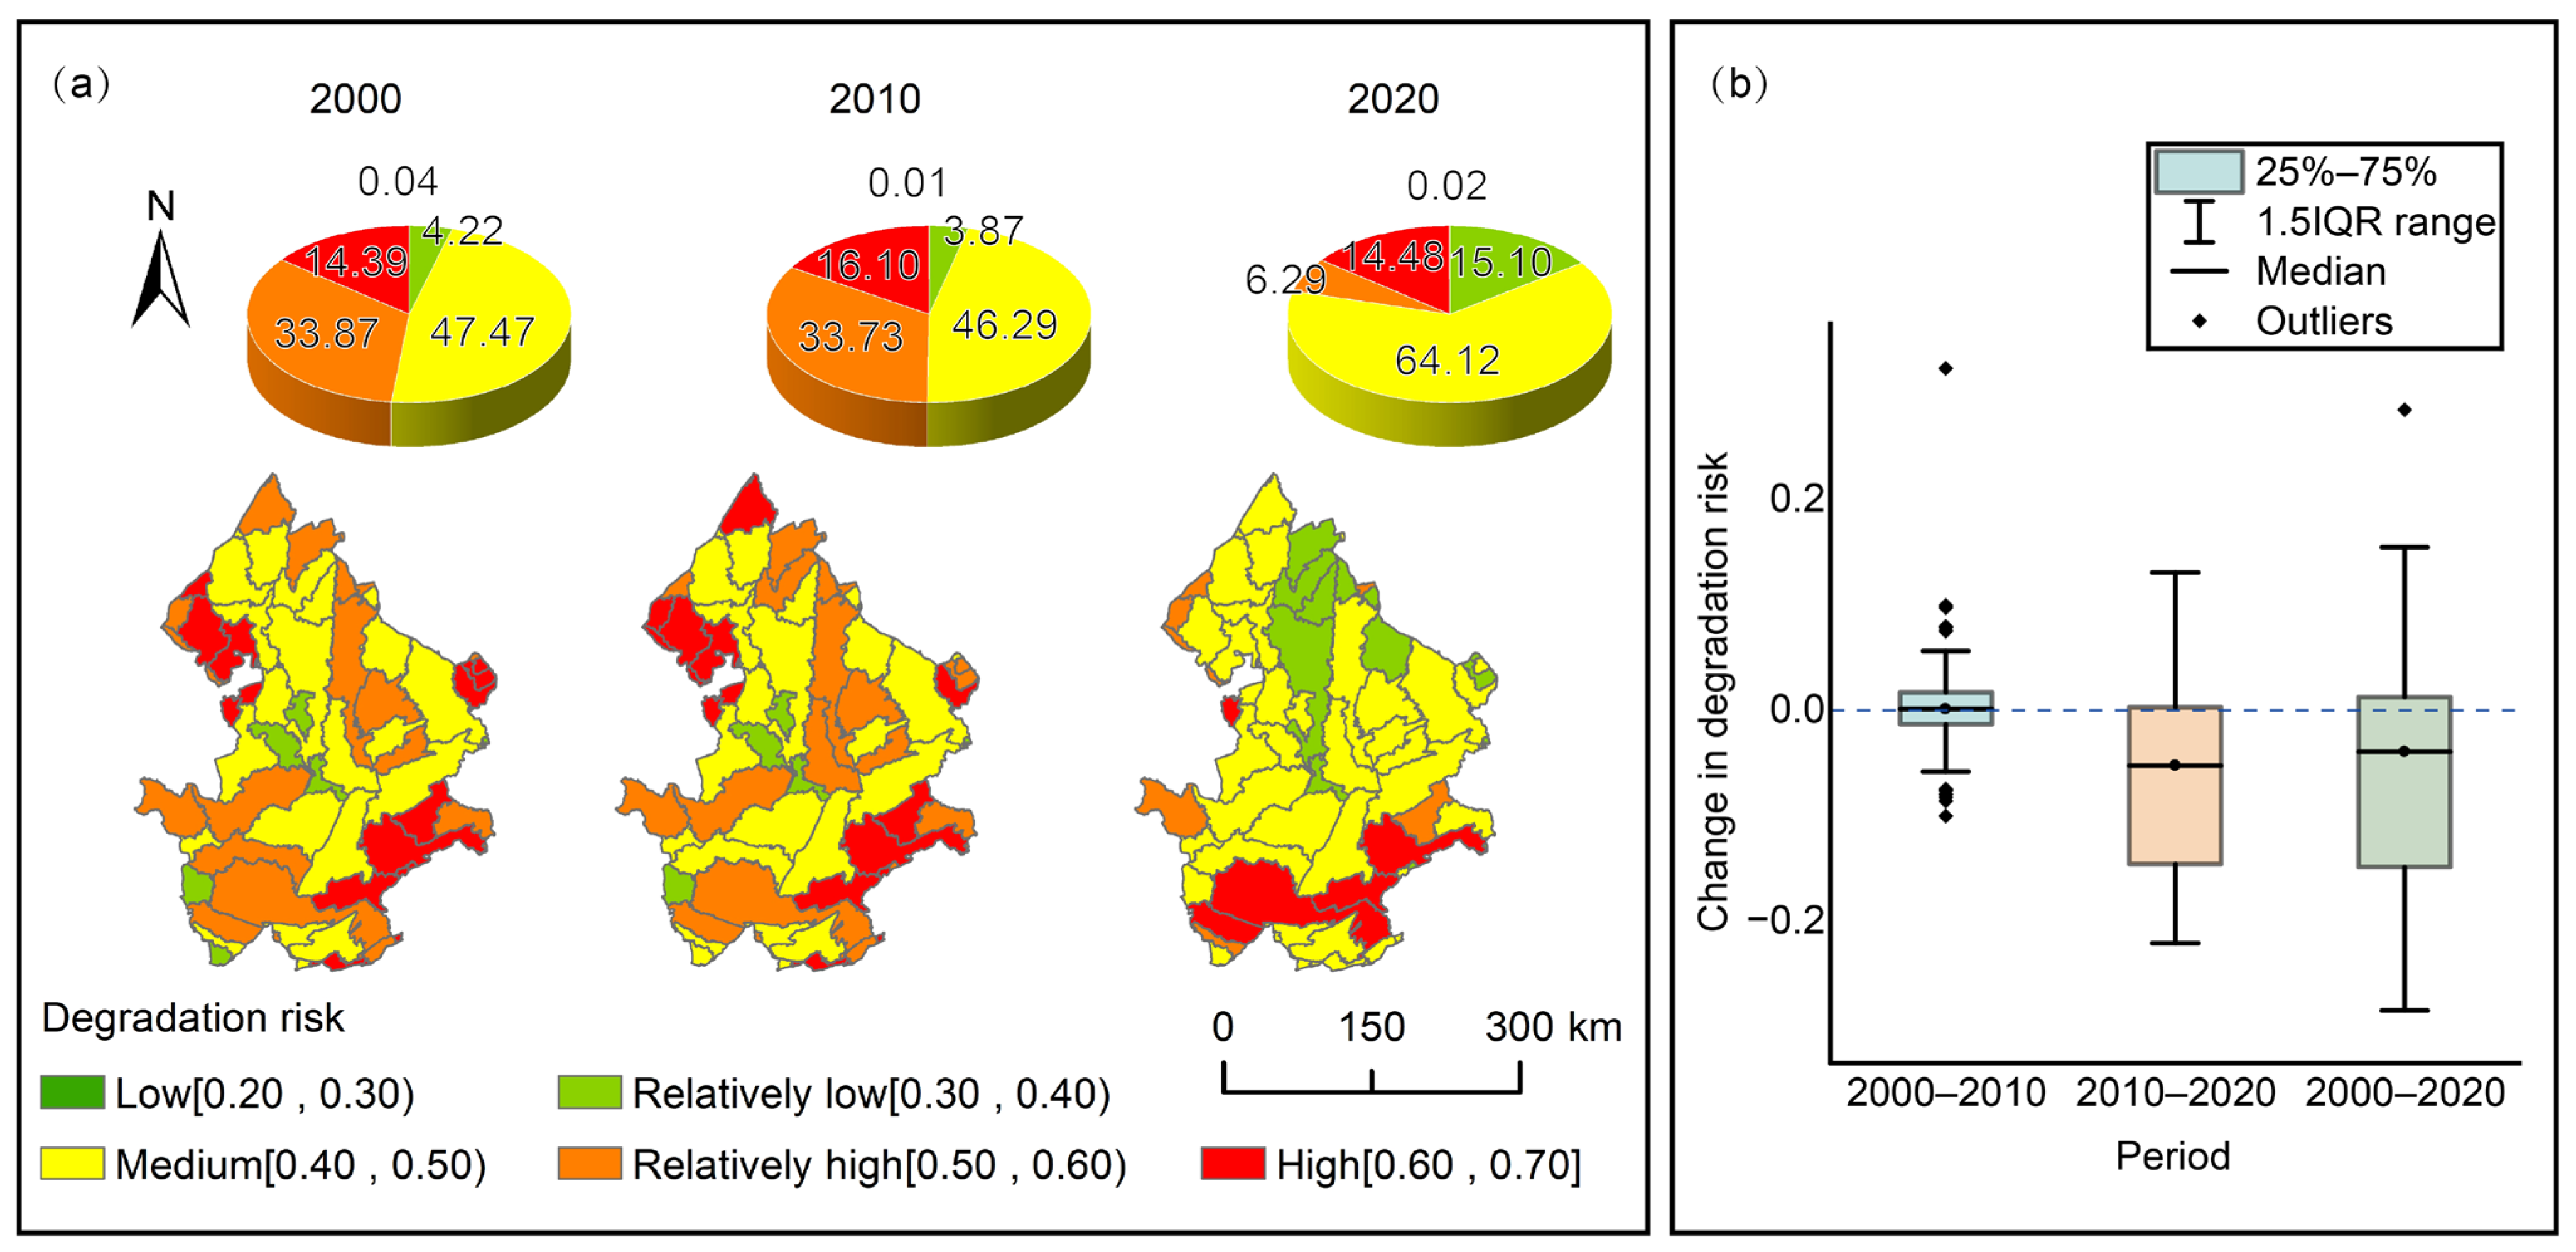

Disclaimer/Publisher’s Note: The statements, opinions and data contained in all publications are solely those of the individual author(s) and contributor(s) and not of MDPI and/or the editor(s). MDPI and/or the editor(s) disclaim responsibility for any injury to people or property resulting from any ideas, methods, instructions or products referred to in the content. |
© 2026 by the authors. Licensee MDPI, Basel, Switzerland. This article is an open access article distributed under the terms and conditions of the Creative Commons Attribution (CC BY) license.