Article

Visual Attention and Perception of Early Forest Regeneration After Clear-Cutting: An Eye-Tracking Pilot Study of Young Adults


1
Department of Agroecology and Forest Utilization, University of Rzeszów, Ćwiklinskiej 1a, 35-601 Rzeszow, Poland
2
Department of Forest Utilization, Institute of Forest Sciences, Warsaw University of Life Sciences SGGW, Nowoursynowska 159, 02-776 Warsaw, Poland
3
Department of Forest Utilization and Forest Technology, University of Agriculture in Kraków, Al 29 Listopada 46, 31-425 Krakow, Poland
4
Department of Applied Mathematics, University of Agriculture in Kraków, Al. Mickiewicza 24/28, 30-059 Krakow, Poland
5
Department of Power Electronics and Automation of Energy Conversion Systems, AGH University, al. Mickiewicza 30, 30-059 Krakow, Poland
6
Department of Geodesy, University of Agriculture in Kraków, Al. Mickiewicza 24/28, 30-059 Krakow, Poland
*
Author to whom correspondence should be addressed.
Land 2026, 15(7), 1251; https://doi.org/10.3390/land15071251
Submission received: 18 May 2026 / Revised: 8 July 2026 / Accepted: 11 July 2026 / Published: 12 July 2026

Abstract

Clear-cutting often causes negative public reactions due to its visual impact, especially in recreational forests. Understanding how people perceive early regeneration stages may support more socially acceptable management practices. This pilot study investigated how young adults visually perceive early forest regeneration after clear-cutting, with a particular focus on gender differences and attention-attracting elements. Field research was conducted in October in central Poland on a 0.97 ha site with Scots pine regeneration. Participants were studied using Tobii Pro Glasses 2. Over 950,000 visual events were recorded, including approx. 9000 fixations and 900 saccades. Analyses included Areas of Interest, heat maps, and fixation and saccade metrics. Women tended to show longer fixation durations than men in this pilot study (602 ms vs. 458 ms; p < 0.001), particularly in clear-cut regeneration areas, where median values were more than 35% higher. They also had shorter and more variable saccades. Visual attention was concentrated on the boundaries between mature forest and regeneration areas, and on elements that reduced the perceived “nakedness” of clear cuts, such as undergrowth and young trees. These patterns suggest that structural and compositional characteristics of regenerating forest landscapes affect visual attention. The results highlight the potential of eye-tracking methods for studying responses to forest management and landscape perception.

1. Introduction

In recent years, numerous conflicts have arisen in Europe between foresters and certain groups of society [1,2]. This may have contributed to a visible decline in the level of public acceptance of forest management in European Union countries [3,4]. At the same time, there is little social consensus on paying for forest ecosystem services [5,6,7], which could at least partially compensate for revenue lost from timber production. Conflicts related to forest management are common and inevitable due to the multifunctional role of forests and the long-term consequences of management decisions [8]. This situation is further complicated by the high demand for forest recreation in many European countries [9,10,11], which may further hinder the achievement of one of the key objectives of forest management, i.e., ensuring forest sustainability while maintaining a continuous supply of timber. It is therefore important to identify solutions that can alleviate tensions resulting from the different interests of various social groups. Clear-cut areas are among the most controversial forms of forest management [10,12,13]. Consequently, where site conditions and the ecological requirements of the tree species permit, clear-cutting should be replaced by alternative regeneration methods, including selective cutting systems. Foresters worldwide recognize this need and have been replacing clear-cutting with other silvicultural approaches for many years [14,15]. However, for light-demanding species, such as Scots pine (Pinus sylvestris L.), which dominates large parts of the European temperate zone, clear-cutting remains one of the most suitable methods for generational replacement [16,17]. Hence, solutions have long been sought to mitigate the negative visual perception of clear-cutting areas. These include retaining individual trees or groups of old trees in the harvested area, using irregular cutting boundaries, and promoting natural regeneration [18]. The analysis of visual scenes is a major application of eye-tracking research. In recent years, eye-tracking has been increasingly used to investigate the perception of environmental information and decision-making processes [19,20,21], enabling the identification of visual attention patterns. This tool may help objectively determine the landscape elements that reduce the negative perception of clear-cutting and thus improve public acceptance of forest management.
The aim of this pilot study was to assess visual attention patterns in young adults viewing early forest regeneration following clear-cutting using eye tracking. The study is a continuation of previous psychological analyses related to the emotions evoked by clear-cutting in comparison to mature forest stands [22]. Combining these two approaches makes it possible to integrate consciously reported psychological responses with objective measures of visual attention, providing complementary information on how people perceive forest landscapes and respond to forest management practices. The identification of elements such as understory vegetation, clearings, and proximity to the forest edge, which reduce the negative visual perception of clear-cut areas, may support public communication and the planning of forest management measures that are more acceptable to the public. As a pilot study, the findings should be regarded as exploratory and as a basis for further, more extensive research.
The research was based on the following questions: (1) Which elements of an early forest regeneration area following clear-cutting attract the greatest visual attention? (2) Are there differences between women and men in visual attention patterns, as reflected by fixation and saccade characteristics? (3) Which landscape components may reduce the visual impact of clear-cut areas and therefore contribute to more socially acceptable forest management practices? To address these questions, eye-tracking metrics, including fixation duration, saccade duration, Areas of Interest (AOI) analysis, and heat maps, were used to identify patterns of visual attention during observation of an early regeneration site.

2. Materials and Methods

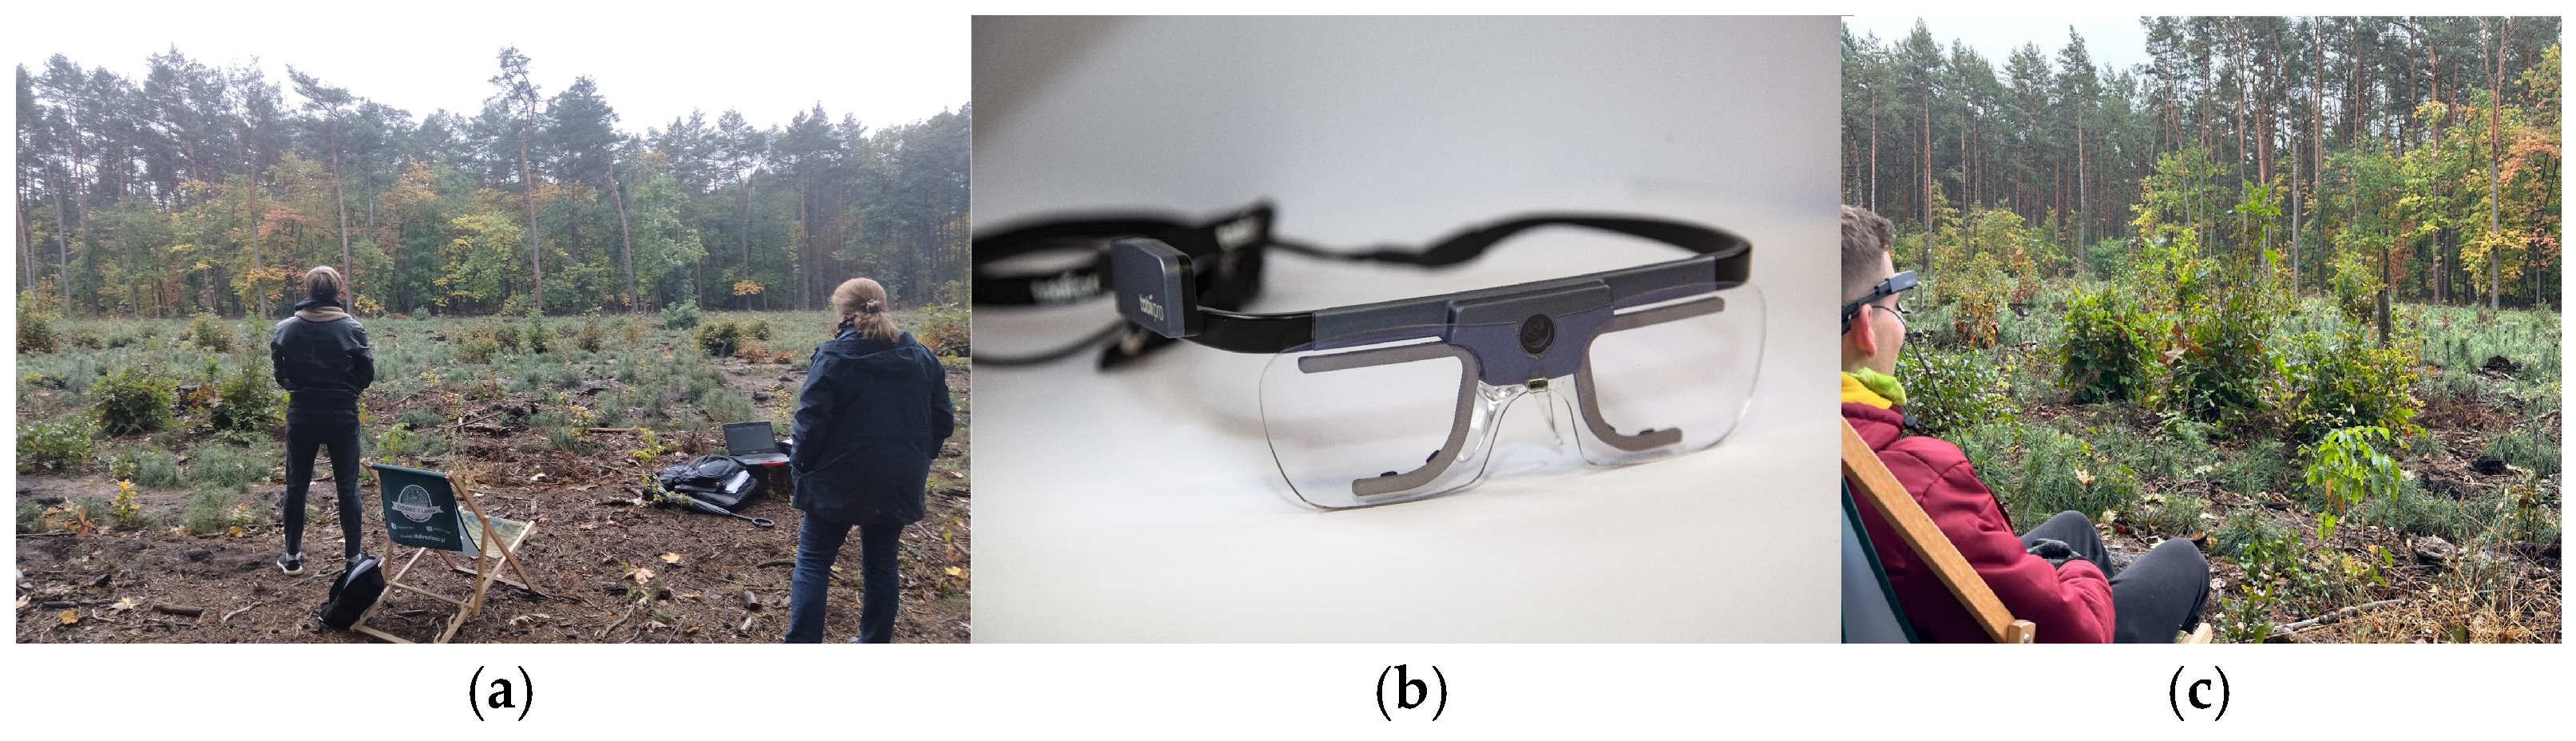
The study was conducted in October 2023 in the Celestynów Forest District, located near Otwock (population 40,000), 32 km from the large urban agglomeration of Warszawa (nearly 2 million inhabitants). The study site covered 0.97 ha and was in the early stages of regeneration after clear-cutting in a pine stand on a fresh mixed coniferous forest habitat. The area contained visible regeneration of Scots pine (Pinus sylvestris L.) and, to a lesser extent, European beech (Fagus silvatica L.). The study site was surrounded by mature pine stands, aged 80–130 years (Figure 1). According to data from the meteorological station in Otwock, the average daily temperature on the day of the study was 6.3 °C (maximum 7.9 °C, minimum 5.3 °C), relative humidity was 95%, average cloud cover was 5.3 octas, atmospheric pressure was 1008 hPa, and wind speed was up to 4.5 m/s [22].
In the present research, Tobii Pro Glasses 2 eye trackers (Tobii AB, Karlsrovägen 2D Box 743 S-182 17, Danderyd, Stockholm, Sweden) were used (Table 1, Figure 1). The participants (Figure 1), aged 21–25 years, had no diagnosed vision impairments. Before the study, all volunteers were informed about the measurement procedure, the purpose of the study, and its duration. They knew that participation was voluntary and anonymous and that they could withdraw from the study at any time. The authors ensured the protection of personal data in accordance with the General Data Protection Regulation (GDPR) [23]. The authors confirm that all procedures used in the study complied with the ethical standards of the Polish Committee on Ethics in Science and the 1964 Declaration of Helsinki, as amended [24]. According to the Code of Ethics for Research Workers of the Polish Academy of Sciences [25], ethical approval was not required for this study.
Before the experiment began, participants received detailed information about its purpose and procedures. The researchers explained the successive stages of the experiment, including eye-tracker calibration, observation of the visual scenes, and data recording. Participants were instructed to observe the presented scenes freely and naturally. To minimize potential order effects, the sequence of visual scenes was randomized for each participant.
Individual recordings lasted approximately 8 min. After each session, data collection was completed and, following recalibration of the equipment, a new recording session was started. The videos were copied from the eye trackers’ memory storage to a computer hard drive and subsequently processed and analyzed using TIMER PRO PROFESSIONAL software (version 22.11.2015. Applied Computer Online Services ACOS, 2901 Moorpark Ave, Suite 100, San Jose, CA, USA).
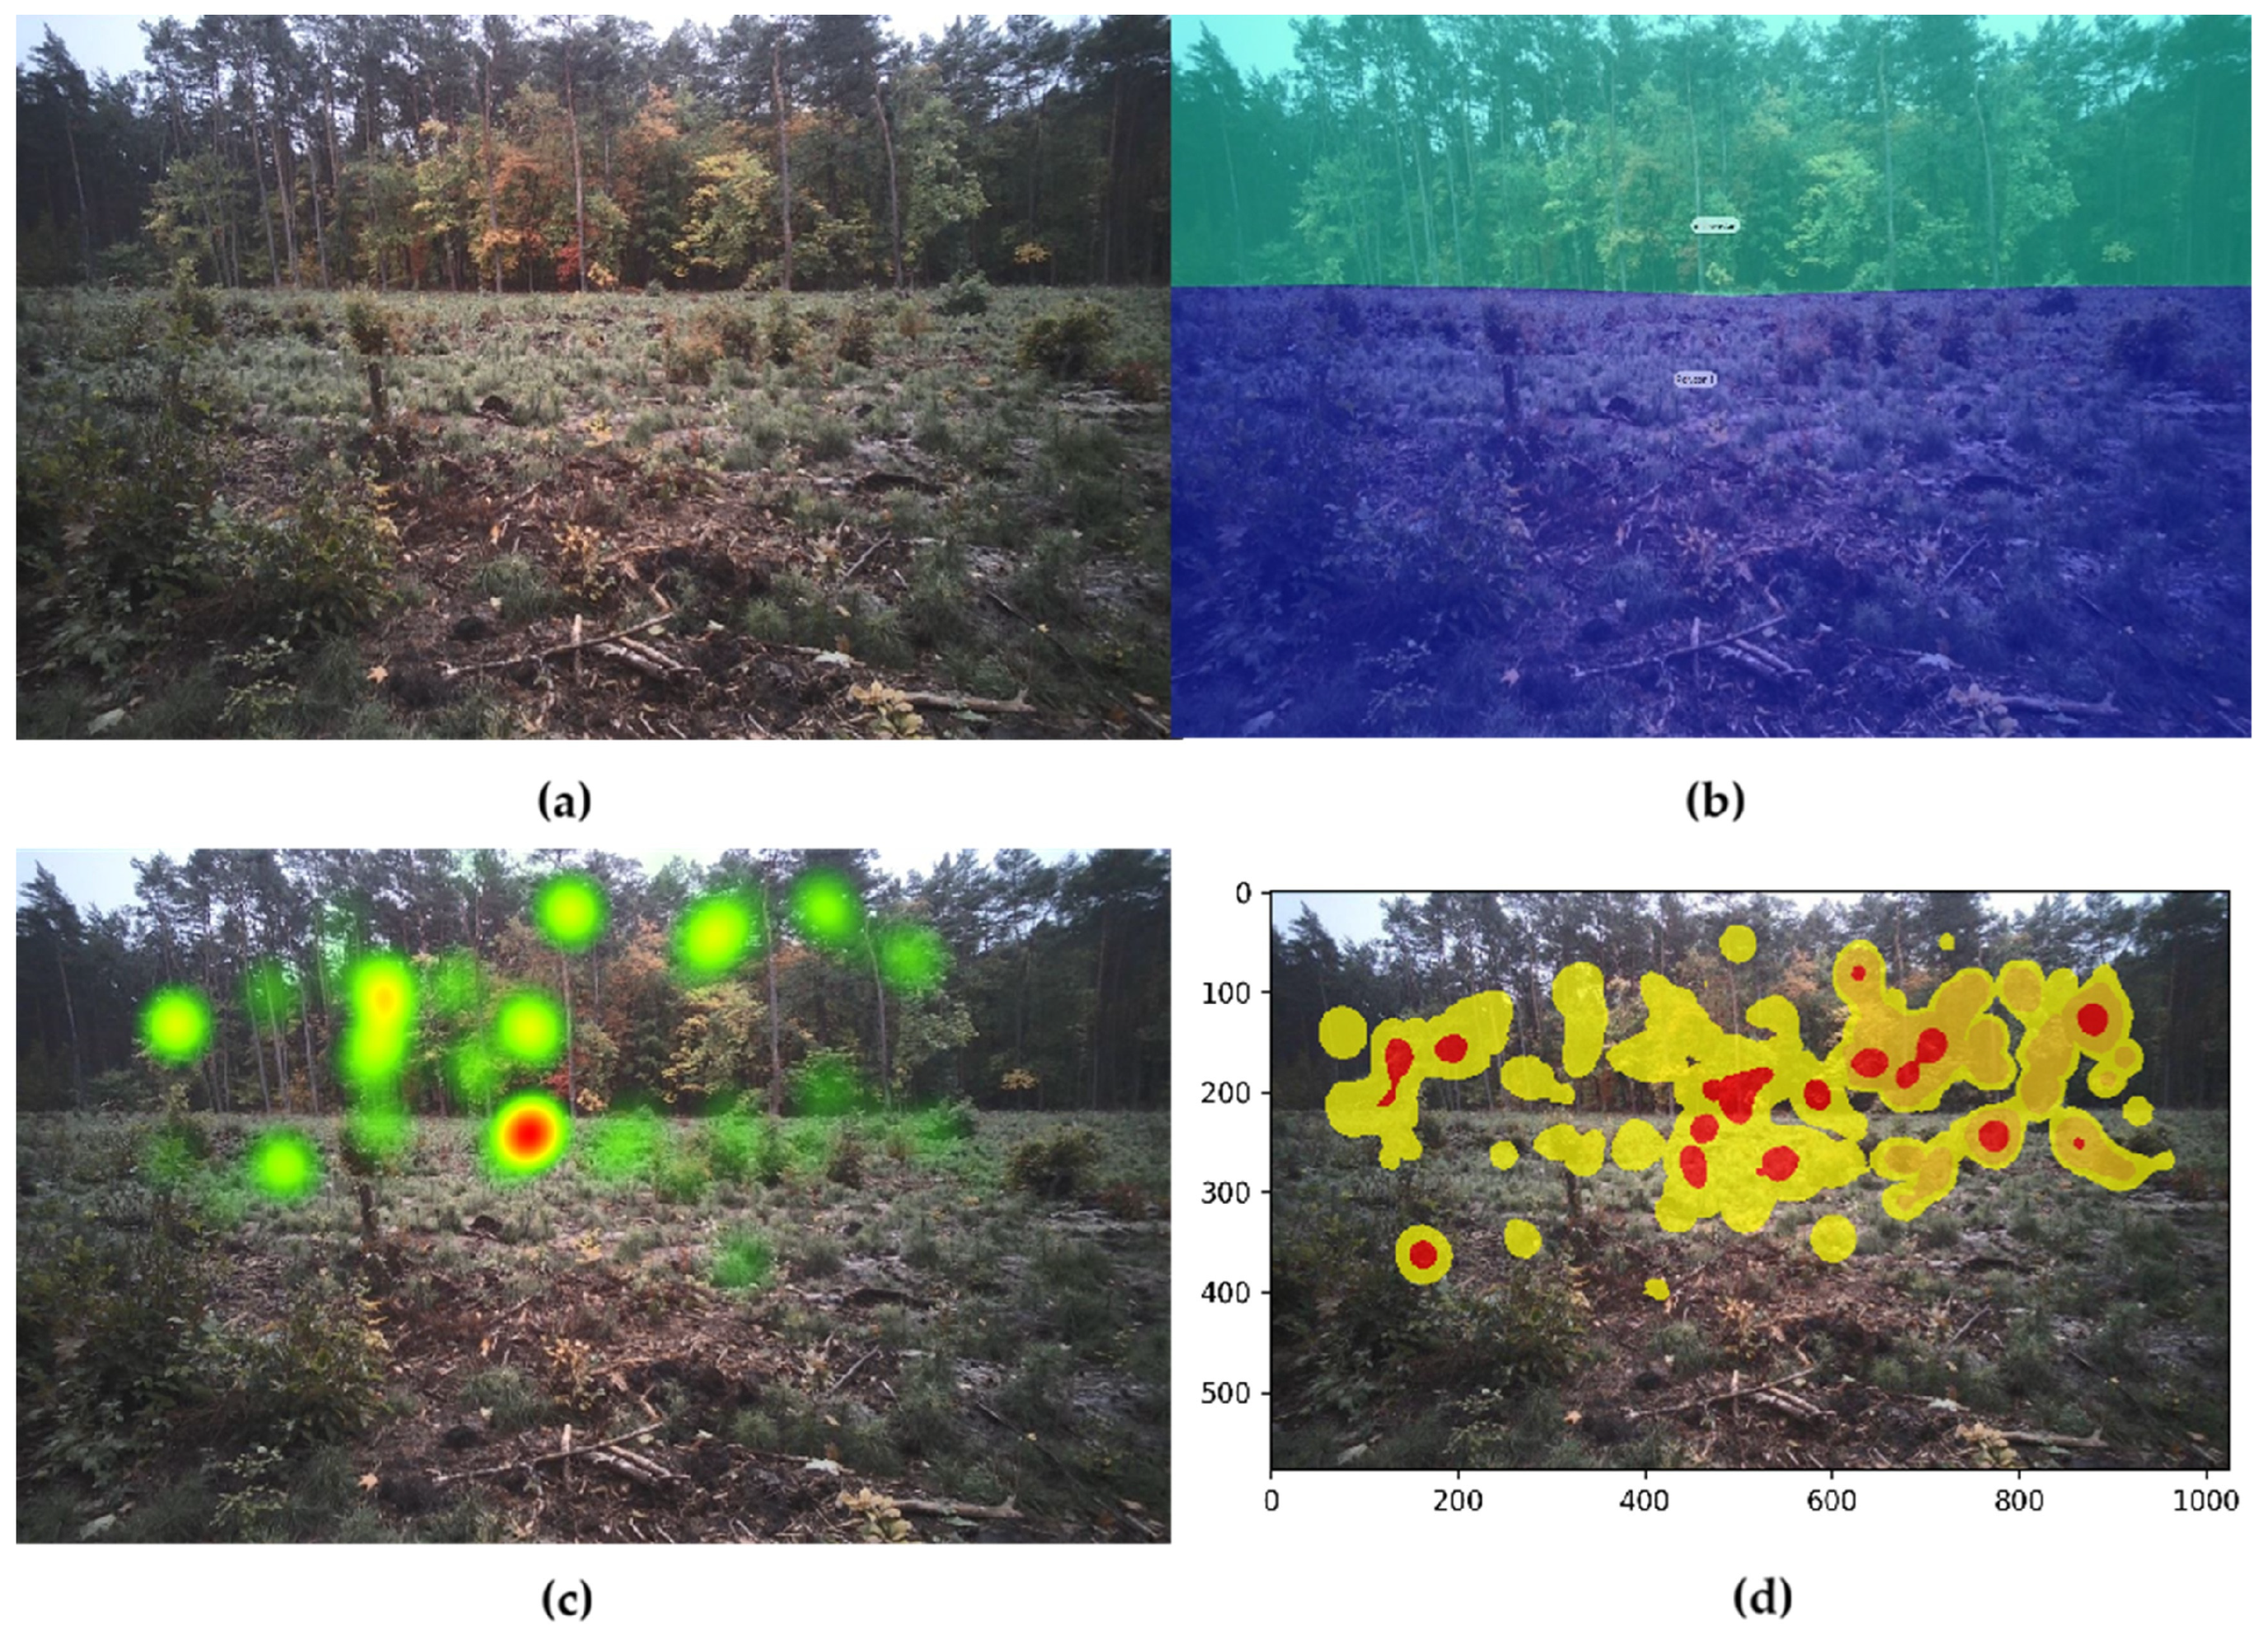
Nine recordings were included in the analyses, 4 for women and 5 for men. Randomly selected fragments of the recordings were analyzed using Tobii Pro Glasses Controller software with an I-VT Attention filter (version 1.83.11324-RC1, Tobii AB Karlsrovägen 2D Box 743 S-182 17, Danderyd, Stockholm, Sweden). Visual activity of the subjects was assessed in relation to two selected areas of the visual scene (Figure 2).
Spatial resolution, defined as the respondents’ ability to distinguish between areas of the visual scene, was determined. Based on the collected video material, heat maps (Figure 2) and gaze plots were generated. On a snapshot representing the entire visual scene (a selected frame from the recording), the locations of individual fixations were marked, and their frequency and duration were presented on a color scale ranging from green (low focus) through yellow to red (highest focus). Averaged heat maps (Figure 2) were generated using TIMER PRO PROFESSIONAL.
The analysis of heat map data was fully automated and implemented in the Python 3.12.3 environment, using the Matplotlib 3.6.3, Pandas 2.1.4 and OpenCV 4.11.0 libraries. The Pandas library was used to handle data saved in “.xlsx” and “.csv” formats, enabling them to be loaded, filtered, processed and saved in the selected format for further analysis. Data visualization was performed using the Matplotlib library, which allows the generation of graphical charts, including image representations. The OpenCV library, which provides a set of algorithms for image analysis and processing, was used to analyze and process images.
The identification of points within a specific color range and intensity was carried out according to the following procedure: first, the image was loaded and converted to the HSV color space, in which color information was separated from brightness information, facilitating color-based image analysis. Next, the target color range was defined, and a binary mask was created to identify pixels within that range. The correctness of the resulting mask was verified visually, after which the coordinates of the identified points were saved to a data file. After cluster analysis using the k-means method [26], averaged heat maps corresponding to the identified groups of subjects, comprising three clusters, were overlaid on the reference image. The number of clusters (k = 3) was determined based on the characteristics of the analyzed visual scene. Three zones were distinguished: the terrain after tree exclusion; the forest edge with relatively limited structural variation; and the forest edge defined by trees with colorful elements and crown structures typical of coniferous species. Increasing the number of clusters reduced the functionality of generalized visual characteristics. This process was carried out using a similar set of programming tools. The resulting image, containing superimposed areas of a specified color (yellow or red), was saved using the Matplotlib library. All calculations and visualizations were performed in the Jupiter Notebook environment, which allows the creation of computational documents in various programming languages, including Python.
We also determined temporal resolution, defined the duration of fixations and saccades. The AOI analysis was performed based on a graphical overlay applied to the snapshot (Figure 3), which served as a reference point for marking two predefined areas: early regeneration of a clear-cut forest and a mature forest stand. Each successive scanned point was assigned to one of these areas and automatically linked to the corresponding data files (Metrics.xlsx and Metrics.tsv) generated by the software, which contained the basic measures of fixation duration variability.
The fixation and saccade data were pre-processed and analyzed. To eliminate outliers and incorrect measurements, observations outside the specified time intervals were removed from the datasets. Specifically, fixations shorter than 100 ms or longer than 2000 ms [27,28], and saccades shorter than 20 ms and longer than 100 ms were excluded [29]. The data were then organized separately for fixations and saccades.
To ensure sample representativeness, the minimum sample size for each recording was determined. These calculations were performed based on the formula presented by Bobrowski [30], which assumes a normal distribution of the random variable. Based on the calculations, the minimum number of observations for fixations was approximately 600–700. However, to increase the power of the statistical tests and ensure consistency across analyses, a random sample of 1000 observations was selected for each recording. In the case of saccades, owing to the lower variability of the data, smaller samples were sufficient, with a minimum sample size of 100 observations determined using the same statistical approach. Random sampling was performed using the RAND() function in Microsoft Excel. This function generates a random real number in the range from 0 (inclusive) to 1 (exclusive), producing a random decimal value greater than or equal to 0 and less than 1.
Descriptive statistics were calculated for the resulting datasets, including means, medians, standard deviations, and coefficients of variation. Due to the skewed distributions of fixation and saccade durations, the data were log-transformed before comparing women and men. This transformation improved the normality of the distributions and allowed the application of the parametric Student’s t-test.

3. Results

The analyzed research material included 9 recordings, which were used to generate heat maps and gaze plots and to analyze visual activity of respondents within the Areas of Interest (AOI). The database contained more than 950,000 changes in the eye activity of the subjects. Differences in the duration of fixations and saccades were examined using a random sample of 9000 fixations and 900 saccades.
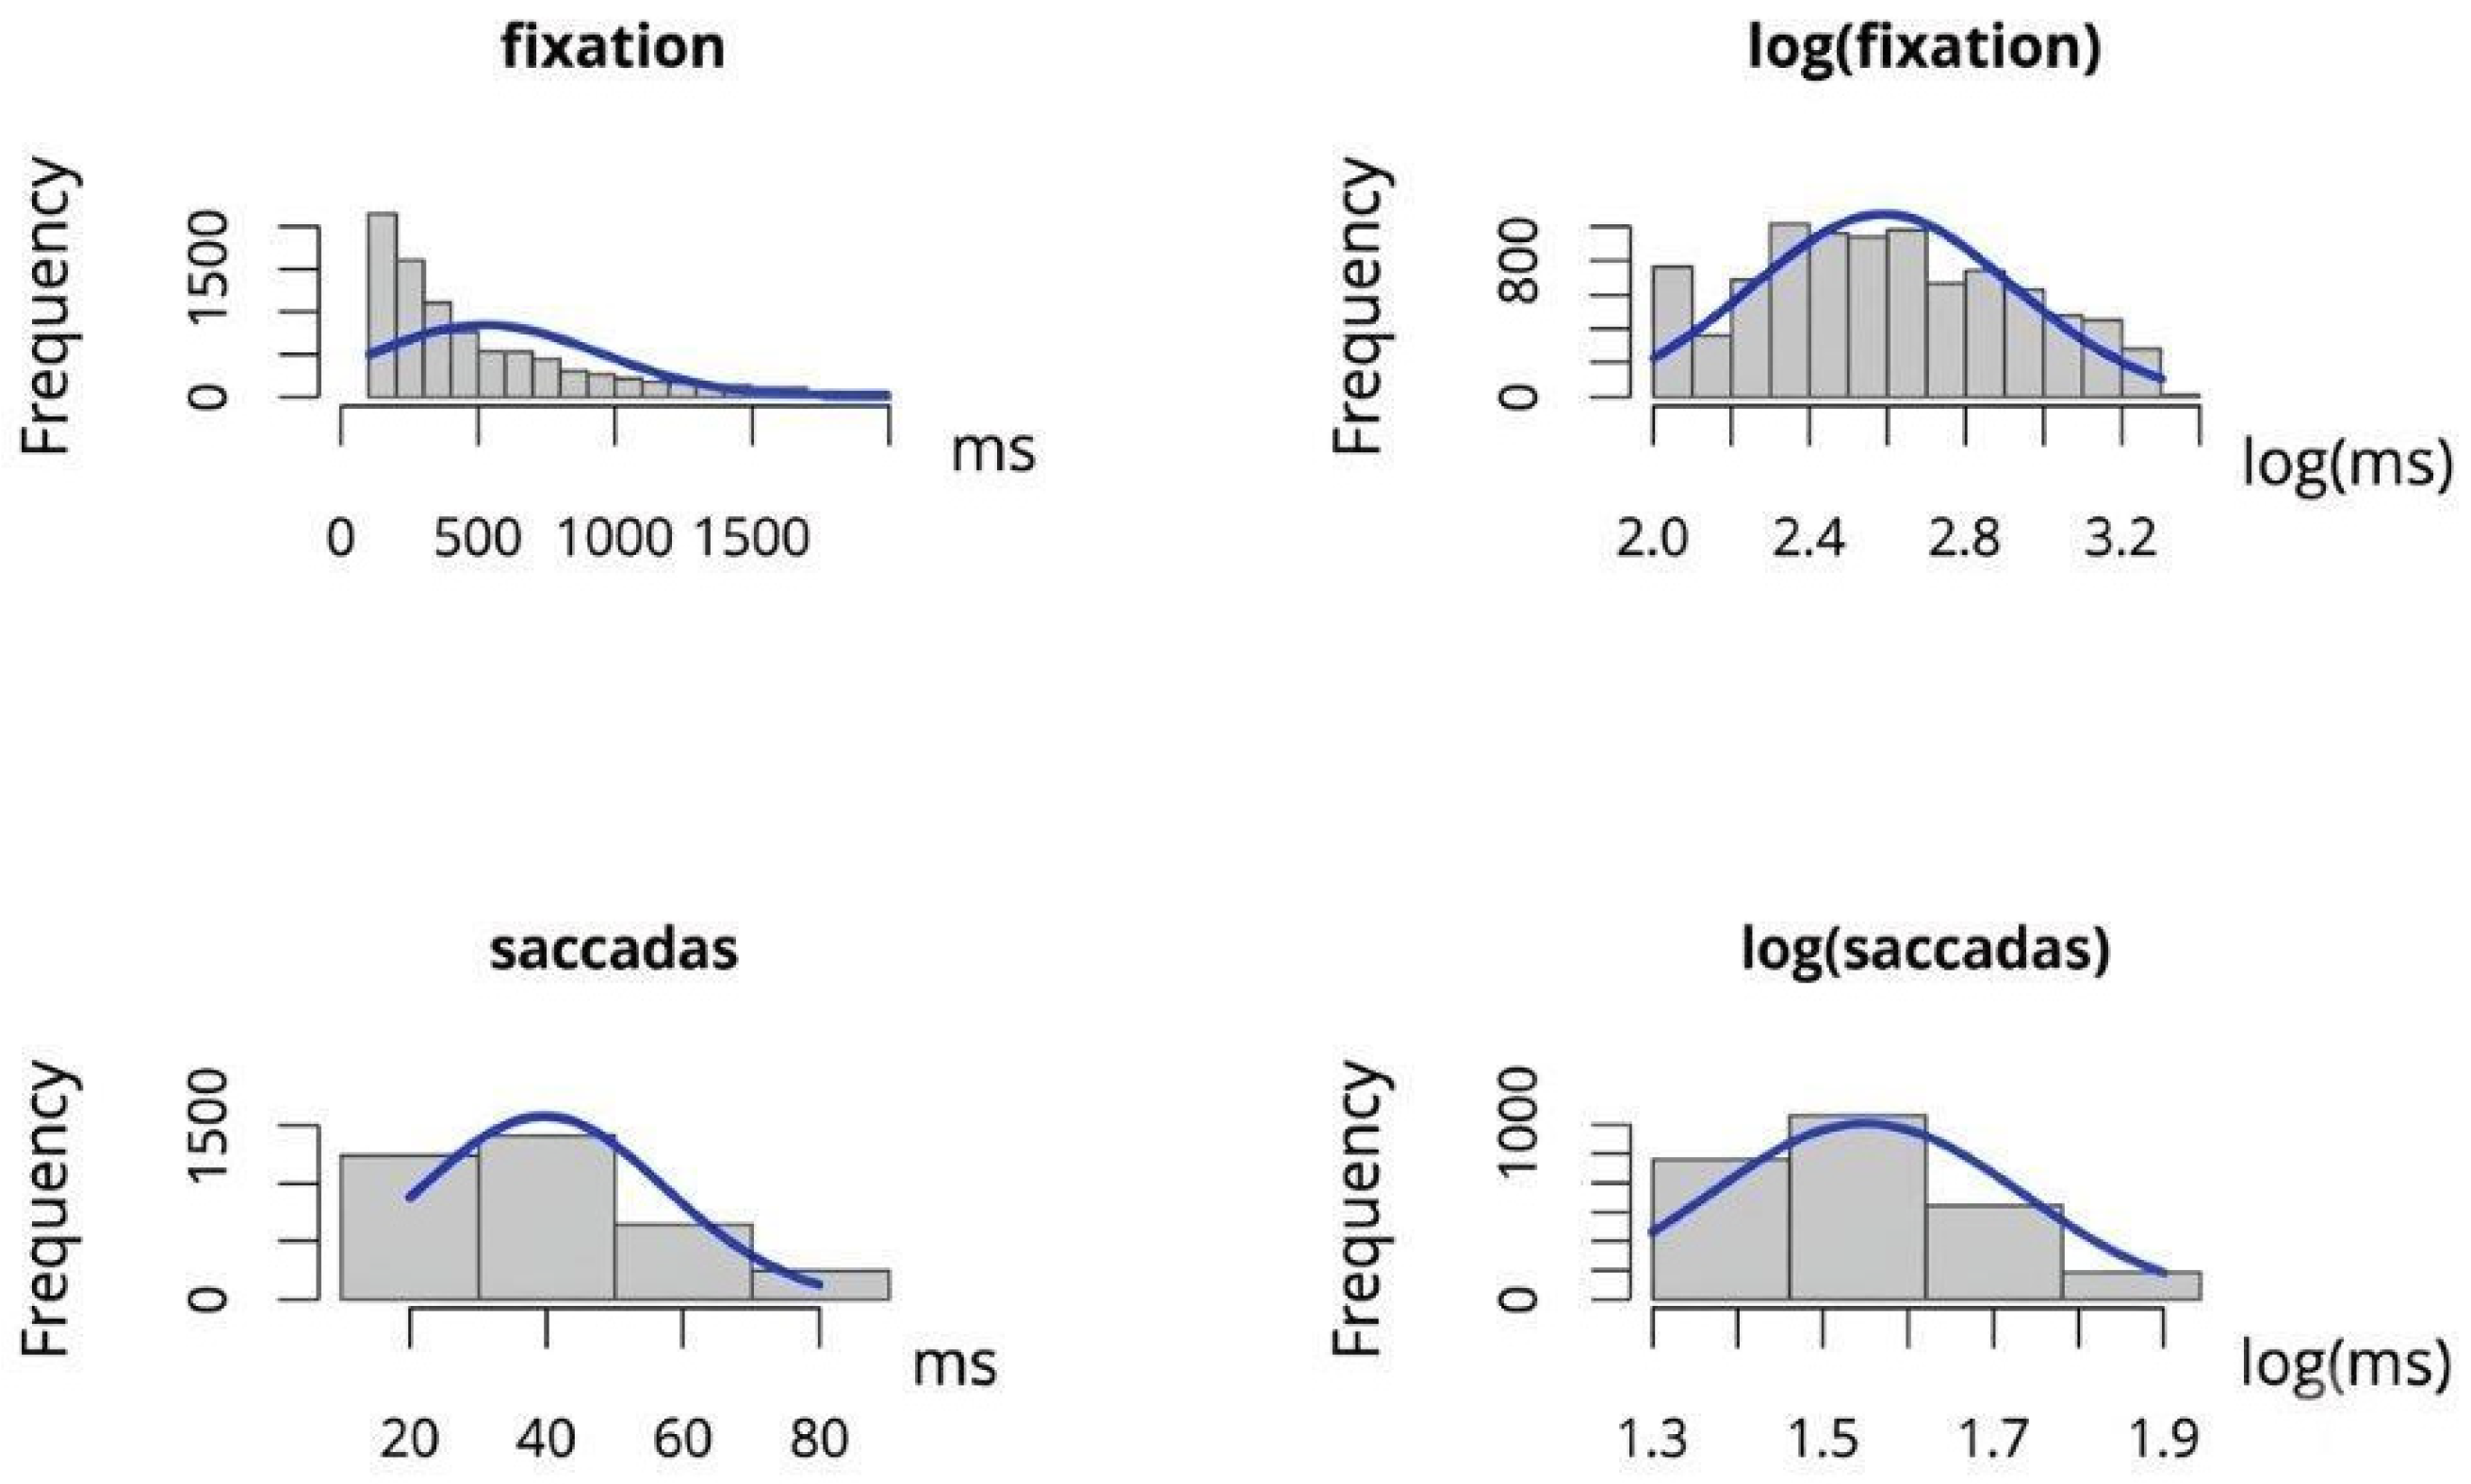
As the samples were very large, the assessment of normality was based on graphical analysis (Figure 3) and the analysis of shape parameters—skewness and kurtosis (Table 2). The original data were compared with log-transformed values. The results presented below clearly indicate that the log-transformed data of fixation are significantly closer to a normal distribution. Regarding saccades, the dataset contains only four values: 20, 40, 60, and 80. Consequently, the log-transformed dataset also contains four values with corresponding frequencies, resulting in very similar histograms in both cases. However, as the data reflect quantitative variables, logarithmic transformation affects the scaling of differences between values and, consequently, the normality of the distribution. As shown in Table 2, logarithmic transformation significantly improved skewness, bringing it close to 0, while moving the kurtosis value further away from zero. However, since symmetry is generally considered a more important characteristic of a normal distribution, the log-transformed data were also used in subsequent analyses of saccades.
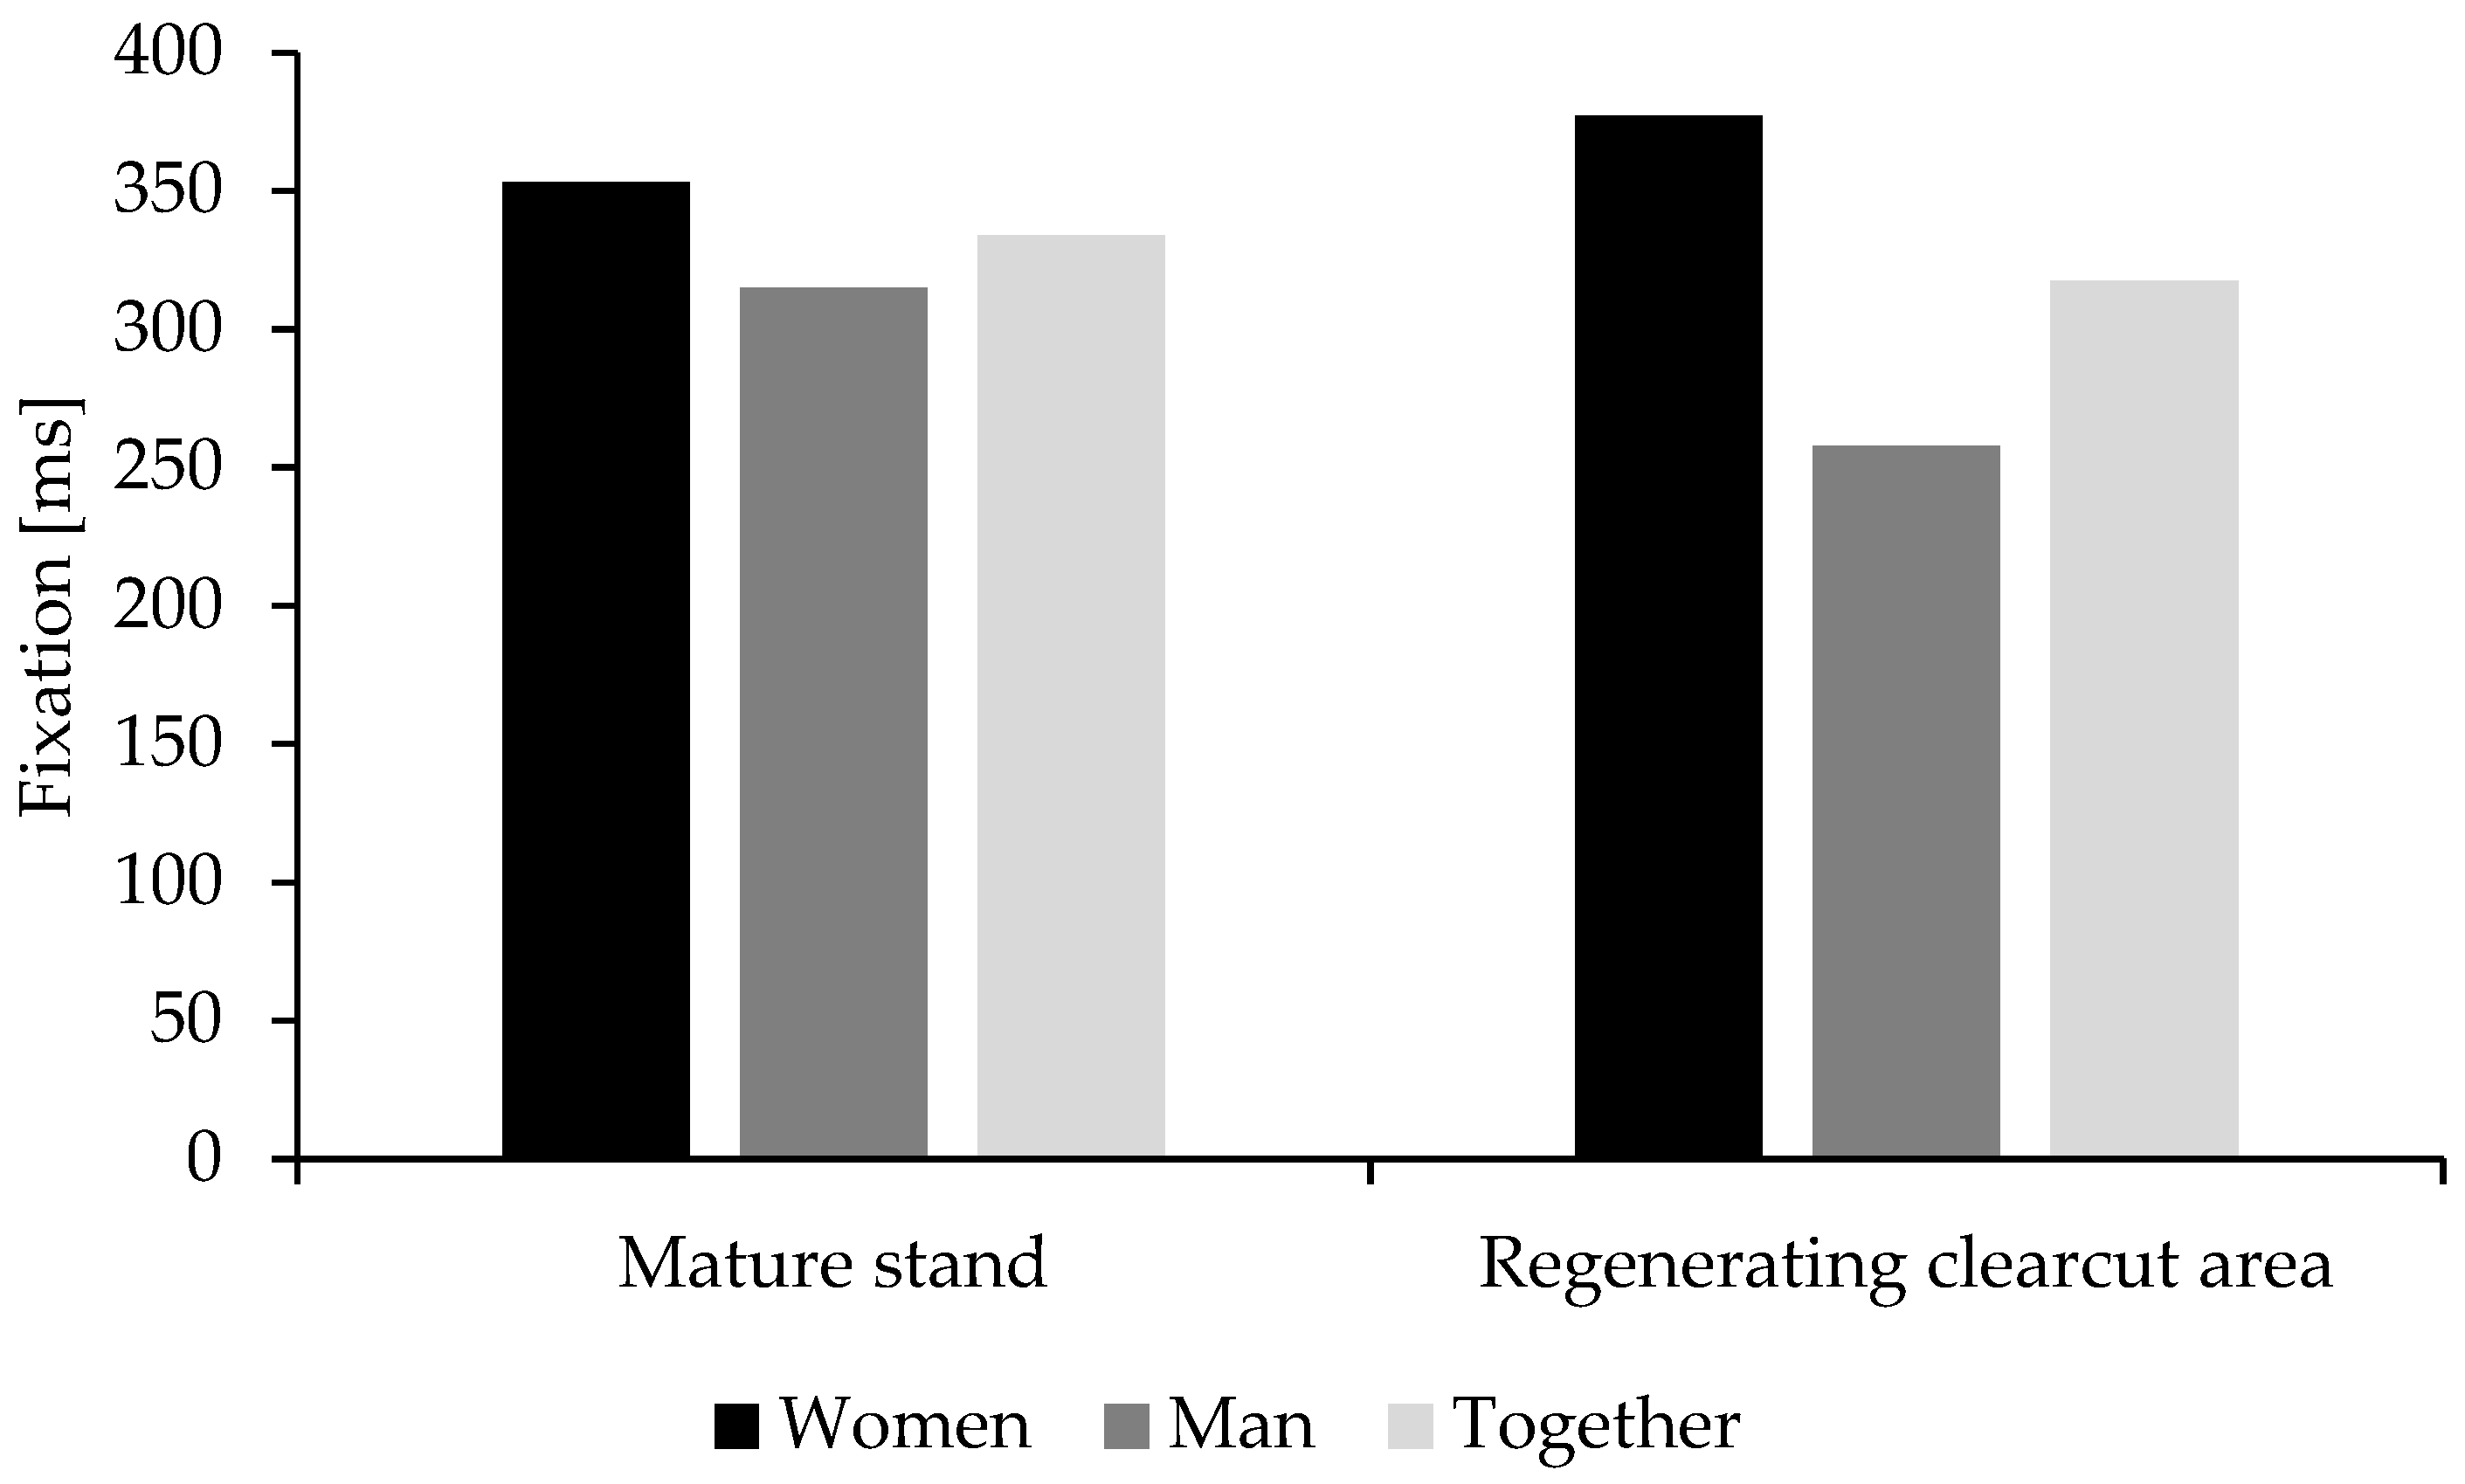
Clear differences were observed in the median fixation durations between the selected AOIs (Figure 2b). In both areas of the visual scene, fixation durations were longer in women than in men (Figure 4). These differences were particularly significant during observation of early forest regeneration following clear-cutting, where the median fixation duration in women was more than 35% longer than in men (Table 3).
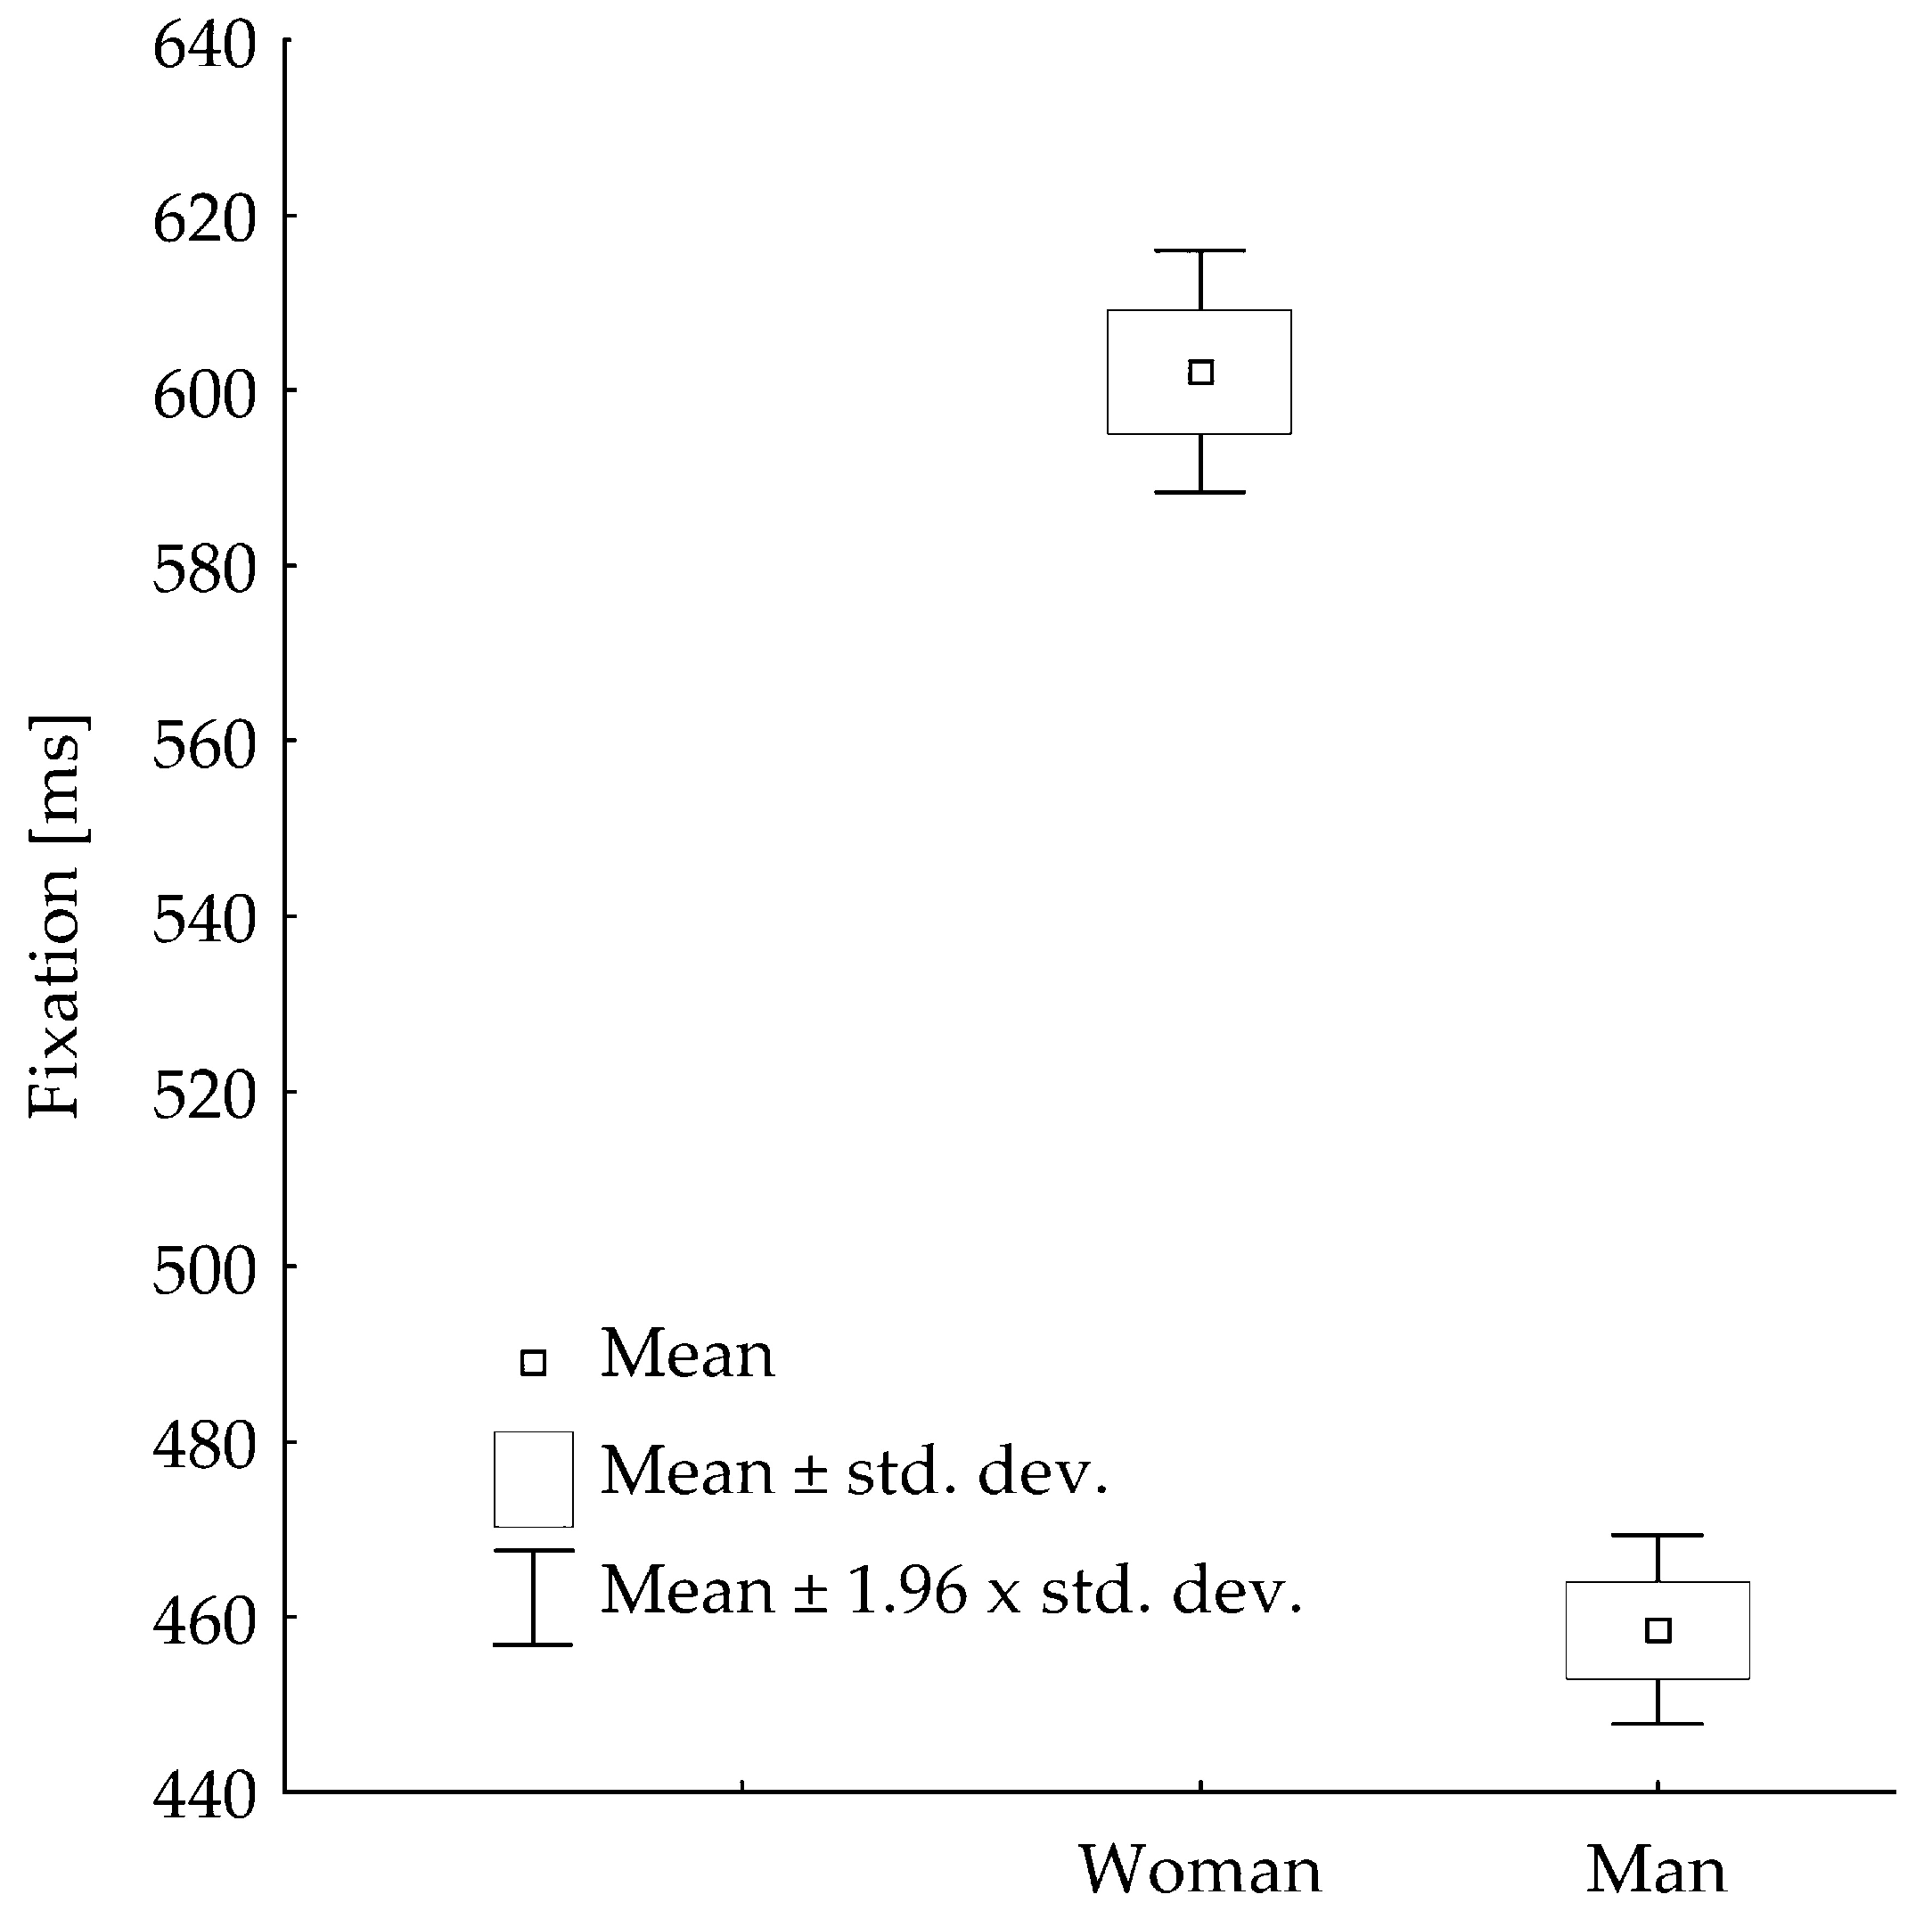
The average fixation duration for all observations was 522 ms (Table 3). The average fixation duration in women (602 ms) was nearly 25% higher than in men (458 ms). These differences were statistically significant (t = 16.29; p = 0.00) (Figure 5). Variability in fixation duration was greater among men, with the coefficient of variation being 9% higher than that observed in women. However, the Mann–Whitney rank-sum test performed on individual means did not reveal a significant difference between groups (W = 13, p-value = 0.56). The discrepancy between the results of the two tests may be explained by their different sensitivities. The Mann–Whitney test is based solely on the ranking of observations and is less sensitive to the magnitude of differences than the Student’s t-test. In the present sample, two individual mean values were substantially lower than the others, and both belonged to male participants. Therefore, it is difficult to determine whether these lower values reflect individual variation or a gender-related effect. A larger sample size is required to clarify the influence of gender.
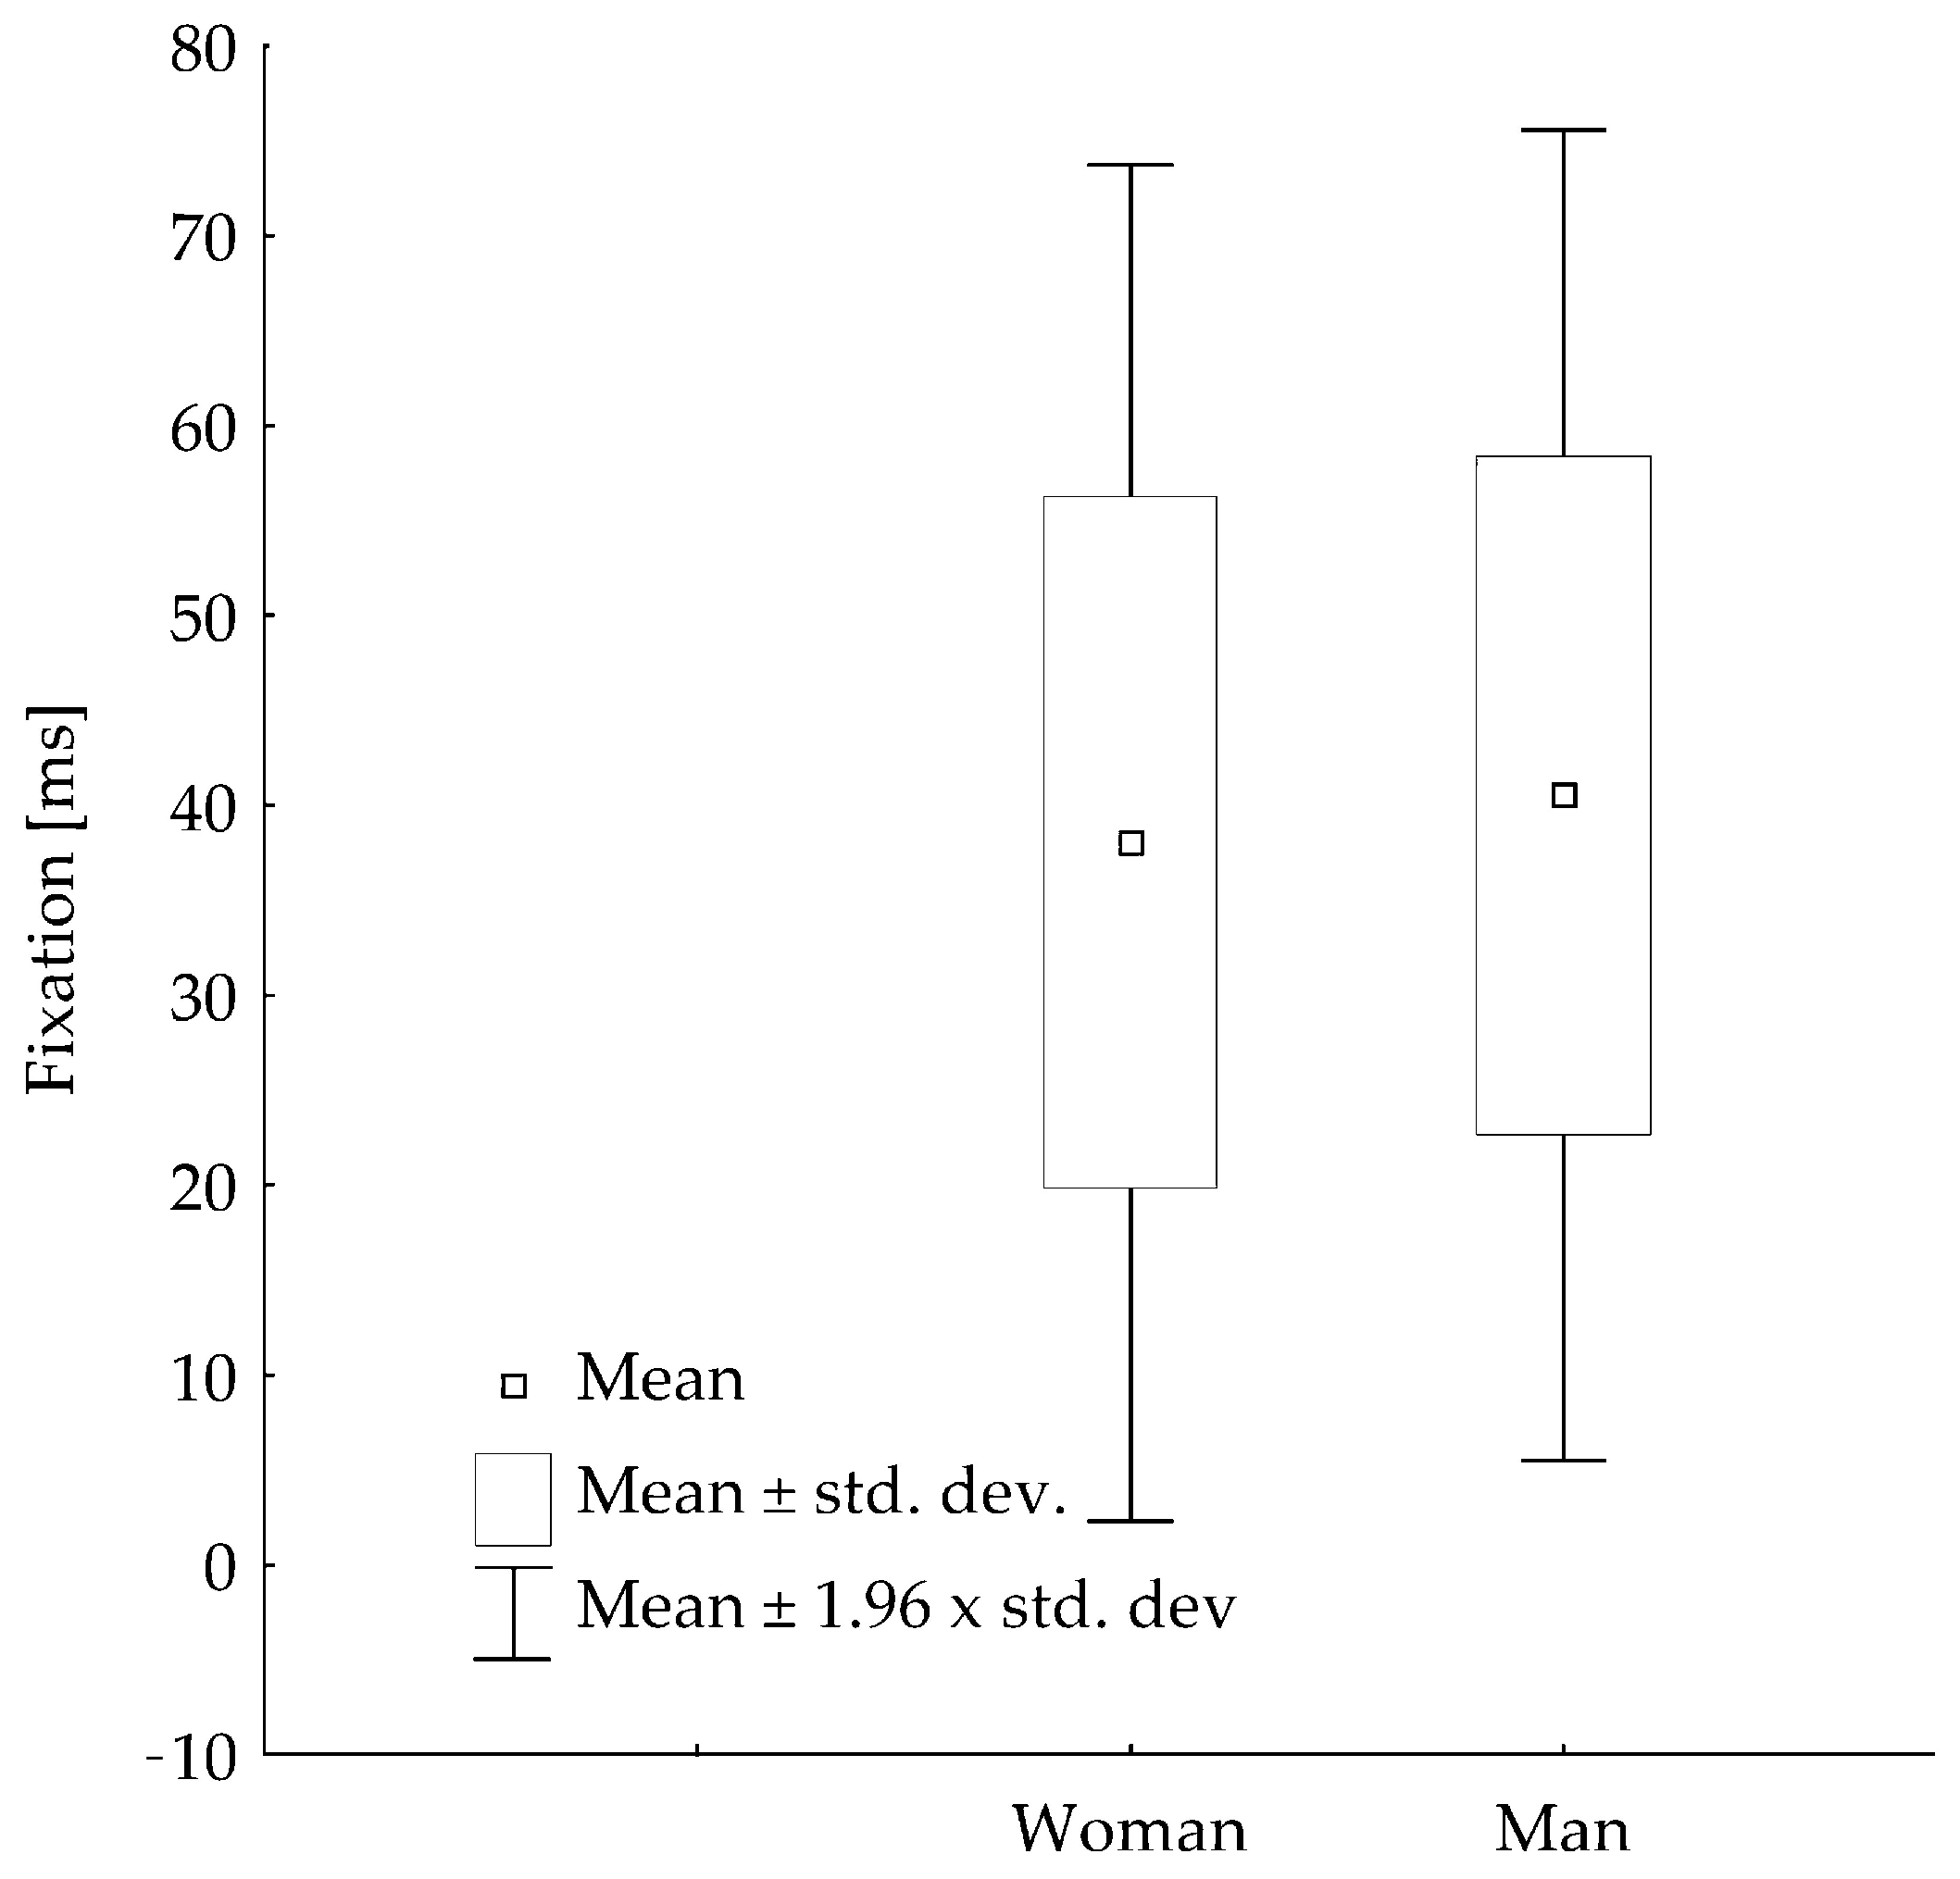
The average duration of saccades for all observations was 39 ms (Table 4). The average saccade duration in women (38 ms) was approximately 5% lower than in men (40 ms). These differences were statistically significant (Z = −4.42; p = 0.00) (Figure 6). Variability in saccade duration was greater in women, approximately 4% higher than in men. As these differences were recorded in the pilot sample, they should be interpreted with caution. Similarly to fixation duration, the Mann–Whitney rank-sum test performed on individual means did not show a significant difference between groups (W = 4, p-value = 0.19).
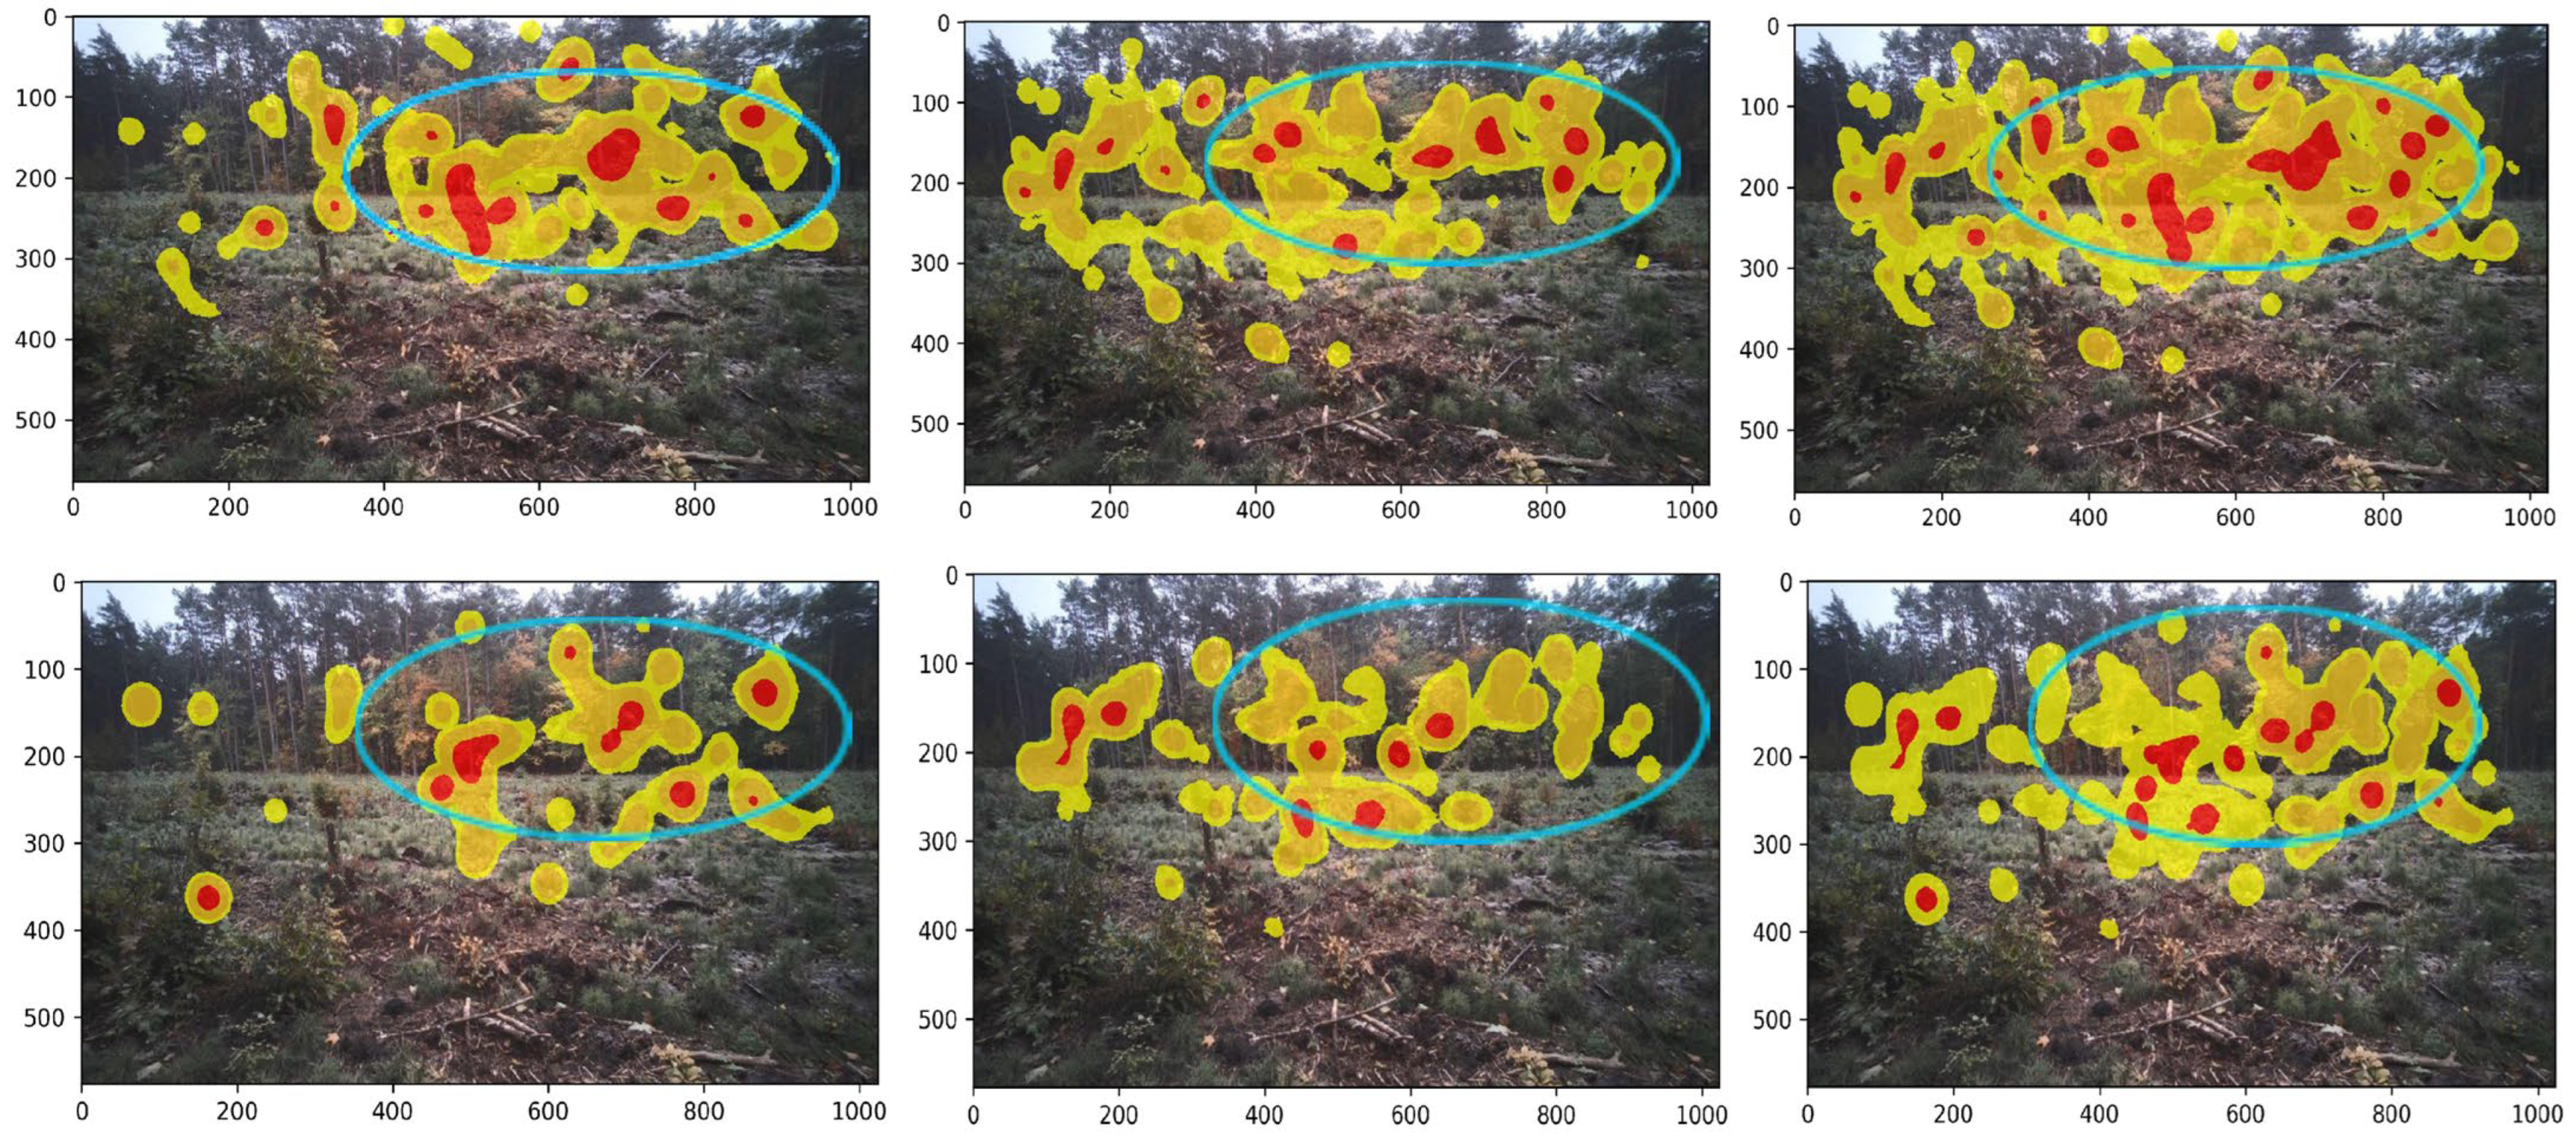
Figure 7 presents averaged heat maps of fixation frequency and fixation duration for women, men, and the entire study group. The visual scene is characterized by a broad horizontal extent. A clear concentration of visual attention was observed along the boundary between the early forest regeneration area following clear-cutting and the mature forest stand, as well as in the immediately adjacent area. In contrast, the nearest part of the scene, including the harvested area with logging residues and exposed soil, received relatively little visual attention. More frequent and longer observations were concentrated in the central part of the scene, where the respondents focused on several understory trees and a colorful group of deciduous trees marked with blue circles. Greater dispersion was observed in fixation frequency, although a noticeable tendency was evident for more frequent observation of the group of colorful trees. Heat maps based on fixation duration showed substantially less dispersion. Clear clusters of longer fixation durations were recorded in women, particularly in relation to the colorful group of trees located on the boundary between the clear-cut area and the mature forest stand.

4. Discussion

Zhang et al. [31] and Li et al. [32] demonstrated consistency between subjective landscape assessment and eye-tracking indicators. We observed a similar relationship with respect to earlier psychological studies conducted on the same group of respondents and in the same forest environment [22]. Early forest regeneration following clear-cutting, which was associated with increased tension and lower mood in the questionnaire survey, generated significantly longer fixation times in the eye-tracking analysis than the adjacent mature forest stand, although this effect was observed only in women. The longer fixation durations in women within the investigated sample may reflect greater sensitivity to anthropogenic disturbance caused by clear-cutting or a higher level of involvement in the affective assessment of altered landscapes. The clear-cut area (Clear-Cutting Area and Second Growth Forest), which was associated with increased tension and reduced positive mood indicators [22], was also linked to significantly longer fixation times among women in the present study. Longer fixations are commonly interpreted as indicators of increased attentional engagement, more intensive cognitive processing, or greater emotional salience of a stimulus [33,34]. In this context, the clear-cut area appears to function as a visually salient element requiring additional perceptual processing. Importantly, longer fixation duration should not be interpreted solely as evidence of negative evaluation. However, the convergence of results—a stronger negative emotional response in the psychological study, and longer visual processing time in the eye-tracking analysis—suggests that the clear-cut landscape requires intensified perceptual and cognitive processing. The degraded spatial structure, exposed soil, logging residues, and sudden break in stand continuity are likely to disrupt perceptual fluency and landscape coherence, thereby increasing attentional load. In contrast, men tended to focus more frequently on distant parts of the forest stand, which was consistent with the findings of Jiang et al. [35].
Heat map analyses showed that visual attention was strongly concentrated along the boundary between the mature forest and the area of early-stage forest regeneration following logging. This transition zone appears to be a key element of the landscape in terms of perception. Environmental psychology studies have shown that sharp spatial contrasts and disruptions in continuity attract attention and may signal ecological disturbance [36,37]. The boundary may therefore serve as a visual marker of landscape change, activating evaluative and potentially affective processes. Interestingly, the most degraded elements in the foreground (logging residues and exposed soil) were scanned relatively less intensively, while the mid-range zone and natural regeneration attracted longer and more frequent fixations. This pattern may indicate selective attention directed toward elements that mitigate the visual harshness of clear-cutting, such as undergrowth, regenerating young forest, or remaining isolated old-growth trees. This finding is supported by earlier studies indicating that structural complexity and signs of regeneration can partially mitigate the negative impact of clear-cutting on landscape perception [38,39,40]. Furthermore, studies on the natural regeneration of pine trees in logged areas have shown that regeneration density decreases with increasing distance from the forest edge [41]. Therefore, the most beneficial approach, both in terms of supporting natural pine regeneration and forest landscape perception, would be to use narrow strip clear-cuts, up to 30–40 m wide, leaving single trees or groups of old trees. These observations are consistent with the findings of Silvennoinen et al. [42], who showed that clear-cuts were the least preferred forest landscape among the management regimes examined in mature pine stands. These authors also found that retaining as little as 5% of old trees and creating small openings (gap-cuts) had a positive effect on landscape perception.
One of the notable observations in this pilot study was the tendency toward longer fixation durations among women. Average fixation duration was approximately 25% longer overall and more than 35% longer within the AOI representing early regeneration following clear-cutting. However, participant-level analyses did not confirm statistically significant gender differences, and therefore these patterns should be interpreted as exploratory and requiring confirmation in larger samples. Similar observations were reported by Dobson [43], who interpreted longer fixation durations in women as reflecting a more analytical viewing strategy and deeper processing of visual information. However, previous studies have indicated that gender-related differences in eye movements may depend on the type of stimulus and the observation context. For example, Dudek et al. [19] reported longer fixations among boys observing educational boards in forest environments, while Dong et al. [44] found longer fixation times in men when viewing selected infrastructure-related objects. Therefore, the differences observed in the present study should be interpreted within the specific context of forest landscape perception. The patterns observed in this pilot sample are consistent with previous publications indicating that sociodemographic variables, including gender, influence visual responses to forest landscapes [35,45,46].
Women showed slightly shorter and more varied saccade durations. The present results are consistent with those reported by Dobson [43] and Coutrot et al. [47]. These authors have suggested that women use a more analytical and exploratory scanning strategy, characterized by a greater number of small eye movements and more frequent transitions between local elements of a scene, resulting in shorter, more dynamic saccades. However, given the limited number of participants in the current study, these observations should be regarded as preliminary. The differences in saccade dynamics observed between women and men, particularly in the context of the landscape of early post-clear-cut regeneration, are consistent with the psychological responses previously reported for the same group of participants in this environment [22]. These results may indicate a more detailed visual exploration of the regenerating clear-cut landscape among women. However, given the pilot nature of the study and the limited sample size, this interpretation should be considered preliminary and verified in future research. Consequently, the findings are relevant both to the interpretation of perceptual behavior in forest areas after management interventions and to landscape planning in the context of user well-being.
The visual characteristics of the regeneration area likely influenced participants’ patterns of visual attention. In particular, the presence of colorful deciduous shrubs during the autumn season may have increased visual contrast and contributed to the concentration of fixations within the regeneration area. Future studies should compare different regeneration structures, including uniform young plantations, regeneration areas with shrub vegetation, and sites with retained individual trees or groups of trees, to determine how specific structural elements influence visual attention and landscape perception.

Study Limitations

This study has several limitations that should be considered when interpreting the results. First, it was designed as a preliminary research and involved a relatively small number of participants (n = 9). Although eye-tracking studies often generate large numbers of observations, the limited sample size restricts the broader applicability of the findings.
Second, all participants were young adults aged 21–25 years. Previous studies have shown that the perception of forest landscapes may vary according to age, education, cultural background, and previous experience with natural environments. Therefore, the observed visual attention patterns may not be representative of other age groups or social categories.
Third, the research was conducted at a single forest site representing one specific example of early regeneration after clear-cutting. Landscape structure, stand composition, regeneration density, topography, and local management practices may influence visual perception. Therefore, the findings should be interpreted with caution and verified under a wider range of forest conditions.
Another limitation is the seasonal context of the study. Data were collected in October, when deciduous vegetation displayed autumn colors and seasonal visual contrasts were particularly pronounced. Different results could potentially be obtained during other seasons.
The study also did not collect detailed information regarding participants’ previous experience with forests, forestry practices, environmental attitudes, or professional background. Such factors may influence both emotional responses and visual attention patterns and should therefore be considered in future investigations.
Finally, although more than 950,000 visual events were recorded and subsamples of fixations and saccades were analyzed statistically, many observations originated from the same participants. As a result, individual observations cannot be considered fully independent. The statistical results should therefore be regarded as preliminary and viewed primarily as evidence of patterns observed within this pilot sample rather than as population-level estimates. Future studies should include larger participant groups and analytical approaches that explicitly account for repeated measurements within individuals.

5. Conclusions

This pilot eye-tracking investigation examined visual attention patterns associated with the observation of early forest regeneration following clear-cutting. The results showed that visual attention was concentrated primarily on the transition zone between the regenerating area and the adjacent mature forest stand, as well as on visually distinctive elements such as young trees and groups of deciduous vegetation. These findings suggest that structural and compositional features of regenerating forest landscapes influence the distribution of visual attention.
The study also revealed patterns suggesting possible differences in visual behavior between women and men. In this pilot sample, women tended to exhibit longer fixation durations and slightly shorter, more variable saccades than men. However, participant-level analyses did not confirm statistically significant gender differences, and these observations should be regarded as exploratory and verified in future studies involving larger and more diverse samples.
The combination of eye-tracking methods with studies of forest landscape perception may provide a useful approach for investigating how people visually respond to the effects of forest management. Future research should include larger and more diverse participant groups, multiple study sites, and repeated observations in different seasons to verify the patterns identified in this study.

Author Contributions

T.D.: conceptualization, data curation, formal analysis, investigation, methodology, validation, supervision, writing—original draft, writing—review & editing. G.S.: methodology, software, visualization, writing original draft, writing review & editing. E.J.: data curation, writing review & editing. Z.B.: methodology, software. M.R.: visualization, software. Z.S.: methodology, software. M.S.: visualization, software. All authors have read and agreed to the published version of the manuscript.

Funding

This research was supported by the Ministry of Education and Science for the University of Rzeszów (SUB/500-311-03-01) and University of Agriculture in Krakow in 2025 (SUB/040017/D019).

Data Availability Statement

The datasets generated during and/or analyzed during the current study are available from the corresponding author on reasonable request.

Conflicts of Interest

The authors declare no conflicts of interest.

References

  1. Kaufer, R. Forest politics from below in Europe. In Forest Politics from Below: Social Movements, Indigenous Communities, Forest Occupations and Eco-Solidarism; Contributions to Political Science; Springer International Publishing: Cham, Switzerland, 2023; pp. 79–110. [Google Scholar]
  2. Nousiainen, D.; Mola-Yudego, B. Characteristics and emerging patterns of forest conflicts in Europe—What can they tell us? For. Policy Econ. 2022, 136, 102671. [Google Scholar] [CrossRef] [Scilit]
  3. Kikulski, J. Social perception of the need for forest management in Poland—Assessment of the current status and occurring changes. Sylwan 2023, 167, 549–568. [Google Scholar] [CrossRef]
  4. Ranacher, L.; Sedmik, A.; Schwarzbauer, P. Public Perceptions of Forestry and the Forest-Based Bioeconomy in the European Union; Knowledge to Action 03; European Forest Institute: Joensuu, Finland, 2020; Available online: https://efi.int/publication/public-perceptions-forestry-and-forest-based-bioeconomy-european-union (accessed on 12 December 2025). [CrossRef]
  5. Müller, A.; Olschewski, R.; Unterberger, C.; Knoke, T. The valuation of forest ecosystem services as a tool for management planning. A choice experiment. J. Environ. Manag. 2020, 271, 111008. [Google Scholar] [CrossRef] [Scilit] [PubMed]
  6. Szast, M.; Gielec, R.; Likus-Cieślik, J.; Pietrzykowski, M. Pilot study assessing public perception of forest ecosystem services in a large urban agglomeration. For. Res. Pap. 2025, 85, 57–66. [Google Scholar] [CrossRef] [Scilit]
  7. Thorsen, B.J.; Mavsar, R.; Tyrväinen, L.; Prokofieva, I.; Stenger, A. The Provision of Forest Ecosystem Services Volume II: Assessing Cost of Provision and Designing Economic Instruments for Ecosystem Services. In What Science Can Tell Us 5; European Forest Institute: Joensuu, Finland, 2014; Volume 2. [Google Scholar]
  8. Fernández-Manjarrés, J.F.; MacHunter, J.; Zavala, M.A. Forest Management, Conflict and Social–Ecological Systems in a Changing World. Forests 2021, 12, 1459. [Google Scholar] [CrossRef] [Scilit]
  9. Dudek, T. Recreation in suburban forests—Monitoring the distribution of visits using the example of Rzeszów. Ann. For. Res. 2024, 67, 131–141. [Google Scholar] [CrossRef] [Scilit]
  10. Gustienė, D.; Doftartė, A.; Lenkuvienė, J.K. Society’s Relationship with the Forest and Forest Recreation and Tourism Trends. In Tourism and Heritage: Shaping Sustainable and Innovative Futures; Leal Filho, W., Safaa, L., Perkumienė, D., Dinis, M.A.P., Eds.; World Sustainability Series; Springer: Cham, Switzerland, 2025. [Google Scholar] [CrossRef] [Scilit]
  11. Purwestri, R.C.; Hájek, M.; Palátová, P.; Tahri, M.; Huertas-Bernal, D.C.; Awuni, S.; Letsoin, S.M.A.; Rahmawan, F.; Hochmalová, M.; Jarský, V.; et al. Investigating Czech society’s expectations for forest recreation. Front. For. Glob. Change 2025, 8, 1486532. [Google Scholar] [CrossRef] [Scilit]
  12. Deuffic, P.; Marage, D.; Richou, E. Conflicts and Social Mobilization against Clearcutting. An Opportunity to Question the Forest Social Order? In 16th ESA Conference. Tension, Trust and Transformation; European Sociological Association: Porto, Portugal, 2024. [Google Scholar]
  13. Nesbakken, S.; Rønningen, G.E.; Torp, S. How loss of nature through clear-cutting forestry affects well-being. Health Promot. Int. 2024, 39, daae110. [Google Scholar] [CrossRef] [Scilit] [PubMed]
  14. Girona, M.M.; Moussaoui, L.; Morin, H.; Thiffault, N.; Leduc, A.; Raymond, P.; Bosé, A.; Bergeron, Y.; Lussier, J.-M. Innovative Silviculture to Achieve Sustainable Forest Management in Boreal Forests: Lessons from Two Large-Scale Experiments. In Boreal Forests in the Face of Climate Change; Advances in Global Change Research; Girona, M.M., Morin, H., Gauthier, S., Bergeron, Y., Eds.; Springer: Cham, Switzerland, 2023; Volume 74. [Google Scholar] [CrossRef] [Scilit]
  15. Wurtz, T.L.; Zasada, J.C. An alternative to clear-cutting in the boreal forest of Alaska: A 27-year study of regeneration after shelterwood harvesting. Can. J. For. Res. 2001, 31, 999–1011. [Google Scholar] [CrossRef]
  16. Häggström, B.; Gundale, M.J.; Nordin, A. Environmental controls on seedling establishment in a boreal forest: Implications for Scots pine regeneration in continuous cover forestry. Eur. J. For. Res. 2024, 143, 95–106. [Google Scholar] [CrossRef] [Scilit]
  17. Sikström, U.; Hjelm, K.; Hanssen, K.H.; Saksa, T.; Wallertz, K. Influence of mechanical site preparation on regeneration success of planted conifers in clearcuts in Fennoscandia—A review. Silva Fenn. 2020, 54, 10172. [Google Scholar] [CrossRef] [Scilit]
  18. Czacharowski, M.; Drozdowski, S. Management of Scots pine (Pinus sylvestris L.) stands under changing environmental and social conditions. Sylwan 2021, 165, 355–370. [Google Scholar] [CrossRef] [Scilit]
  19. Dudek, T.; Szewczyk, G.; Korcz, N.; Burdak, Z.; Rad, M.; Siejka, Z.; Franków, R.; Jaromi, A. Evaluation forest educational boards based on eye tracking analysis in a pilot study. Sci. Rep. 2025, 15, 25225. [Google Scholar] [CrossRef] [Scilit] [PubMed]
  20. Schirpke, U.; Tasser, E.; Lavdas, A.A. Potential of eye-tracking simulation software for analyzing landscape preferences. PLoS ONE 2022, 17, e0273519. [Google Scholar] [CrossRef] [Scilit] [PubMed]
  21. Wang, M.; Tong, H.; Chen, J.; Liu, F.; Li, M.; Yu, X.; Lin, S.; Dong, J. How landscape element characterization affects aesthetic preferences and visual attention in urban wetland park recreation spaces. Sci. Rep. 2026, 16, 838. [Google Scholar] [CrossRef] [Scilit] [PubMed]
  22. Janeczko, E.; Czyżyk, K.; Woźnicka, M.; Dudek, T.; Fialova, J.; Korcz, N. The Importance of Forest Management in Psychological Restoration: Exploring the Effects of Landscape Change in a Suburban Forest. Land 2024, 13, 1439. [Google Scholar] [CrossRef] [Scilit]
  23. Act of 10 May 2018 on the Protection of Personal Data. Available online: https://isap.sejm.gov.pl/isap.nsf/DocDetails.xsp?id=WDU20180001000 (accessed on 12 December 2025).
  24. Declaration of Helsinki. WMA Declaration of Helsinki—Ethical Principles for Medical Research Involving Human Subjects. 1964. Available online: https://nil.org.pl/uploaded_files/art_1585807090_wma-declaration-of-helsinki-ethical-principles-for-medical-research-involving-human-subjects.pdf (accessed on 12 December 2025).
  25. Polish Academy of Sciences. Code of Ethics for Researchers. Available online: https://pan.pl/etyka-w-nauce/ (accessed on 12 December 2025).
  26. Stanisz, A. An Accessible Course in Statistics Using STATISTICA PL. Volume 3. Multivariate Analyses; DataSoft: Warszawa, Poland, 2007; p. 500. [Google Scholar]
  27. Greene, H.H.; Brown, J.M. Where Did I Come From? Where Am I Going? Functional Differences in Visual Search Fixation Duration. J. Eye Mov. Res. 2017, 10, 1–13. [Google Scholar] [CrossRef] [Scilit]
  28. Greene, H.H. The control of fixation duration in visual search. Perception 2006, 35, 303–315. [Google Scholar] [CrossRef] [Scilit] [PubMed]
  29. Leigh, R.J.; Zee, D.S. The Neurology of Eye Movements, 5th ed.; Contemporary Neurology Series; online edn; Oxford Academic: New York, NY, USA, 2015. [Google Scholar] [CrossRef] [Scilit]
  30. Bobrowski, D. Probabilistics in Technical Applications; Wydawnictwo Naukowo-Techniczne: Warszawa, Poland, 1986; p. 527. [Google Scholar]
  31. Zhang, X.; Xiong, X.; Chi, M.; Yang, S.; Liu, L. Research on visual quality assessment and landscape elements influence mechanism of rural greenways. Ecol. Indic. 2024, 160, 111844. [Google Scholar] [CrossRef] [Scilit]
  32. Li, Y.; Luo, H.; Sun, S.; Wang, K.; Zhao, Q. Visual Quality Assessment of Rural Landscapes Based on Eye-Tracking Analysis and Subjective Perception. Sustainability 2026, 18, 161. [Google Scholar] [CrossRef] [Scilit]
  33. Huang, G.; Li, Y.; Zhu, H.; Feng, H.; Shen, X.; Chen, Z. Emotional stimulation processing characteristics in depression: Meta-analysis of eye tracking findings. Front. Psychol. 2023, 13, 1089654. [Google Scholar] [CrossRef] [Scilit] [PubMed]
  34. Negi, S.; Mitra, R. Fixation duration and the learning process: An eye tracking study with subtitled videos. J. Eye Mov. Res. 2020, 13, 1–15. [Google Scholar] [CrossRef] [Scilit] [PubMed]
  35. Jiang, G.; Cao, S.; Chen, S.; Tian, X.; Cao, M. Gender Differences in Visual Perception of Park Landscapes Based on Eye-Tracking Technology: A Case Study of Beihai Park in Beijing. Buildings 2025, 15, 2858. [Google Scholar] [CrossRef] [Scilit]
  36. Dupont, L.; Ooms, K.; Antrop, M.; Van Etvelde, V. Testing the validity of a saliency-based method for visual assessment of constructions in the landscape. Landsc. Urban Plan. 2017, 167, 325–338. [Google Scholar] [CrossRef] [Scilit]
  37. Kaplan, R.; Kaplan, S. The Experience of Nature: A Psychological Perspective; Cambridge University Press: Cambridge, UK, 1989; p. 360. [Google Scholar]
  38. Gustafsson, L.; Kouki, J.; Sverdrup-Thygeson, A. Tree retention as a conservation measure in clear-cut forests of northern Europe: A review of ecological consequences. Scand. J. For. Res. 2010, 25, 295–308. [Google Scholar] [CrossRef] [Scilit]
  39. Ribe, R.G. Aesthetic perceptions of green-tree retention harvests in vista views: The interaction of cut level, retention pattern and harvest shape. Landsc. Urban Plan. 2005, 73, 277–293. [Google Scholar] [CrossRef] [Scilit]
  40. Ribe, R.G. In-Stand Scenic Beauty of Variable Retention Harvests and Mature Forests in the U.S. Pacific Northwest: The Effects of Basal Area, Density, Retention Pattern and Down wood. J. Environ. Manag. 2009, 91, 245–260. [Google Scholar] [CrossRef] [Scilit] [PubMed]
  41. Bílek, L.; Vacek, Z.; Vacek, S.; Bulušek, D.; Linda, R.; Král, J. Are clearcut borders an effective tool for Scots pine (Pinus sylvestris L.) natural regeneration? For. Syst. 2018, 27, e010. [Google Scholar] [CrossRef] [Scilit]
  42. Silvennoinen, H.; Pikkarainen, L.; Nakola, H.; Koivula, M.; Tyrväinen, L.; Tikkanen, J.; Chambers, P.; Peltola, H. Consistency of video and photo surveys in measuring attractiveness of forest stands managed with varying intensities. Silva Fenn. 2024, 58, 23030. [Google Scholar] [CrossRef] [Scilit]
  43. Dobson, R. Gender Differences in Gaze Behavior: An Eye-Tracking Study of Fixation Duration in Social Decision-Making. Master’s Thesis, St. John’s University, New York, NY, USA, 2025. Available online: https://scholar.stjohns.edu/theses_dissertations/972 (accessed on 12 December 2025).
  44. Dong, W.; Zhan, Z.; Liao, H.; Meng, L.; Liu, J. Assessing Similarities and Differences between Males and Females in Visual Behaviors in Spatial Orientation Tasks. ISPRS Int. J. Geo-Inf. 2020, 9, 115. [Google Scholar] [CrossRef] [Scilit]
  45. Zhang, Z.; Chen, Y.; Qiao, X.; Zhang, W.; Meng, H.; Gao, Y.; Zhang, T. The Influence of Forest Landscape Spaces on Physical and Mental Restoration and Preferences of Young Adults of Different Genders. Forests 2023, 14, 37. [Google Scholar] [CrossRef] [Scilit]
  46. Zheng, C.; Fang, M.; Zhang, Y.; Liu, X.; Huang, Z. The effects of landscape on visual preference and fatigue recovery among university students: Differences in gender, grade level and major. PLoS ONE 2025, 20, e0330694. [Google Scholar] [CrossRef] [Scilit] [PubMed]
  47. Coutrot, A.; Binetti, N.; Harrison, C.; Mareschal, I.; Johnston, A. Face exploration dynamics differentiate men and women. J. Vis. 2016, 16, 16. [Google Scholar] [CrossRef] [Scilit] [PubMed]
Figure 1. Study area showing early forest regeneration following clear-cutting (a); Tobii Pro Glasses 2 eye tracker (b); a participant observing a video scene (c).
Land 15 01251 g001
Figure 2. Visual scene—snapshot (a). Areas of Interest marked on the snapshot (b). Heat map for an individual participant (c), and the corresponding heat map based on data averaged across all participants (d). Heat map colors indicate the relative intensity of visual attention, with warmer colors (yellow to red) representing areas with a higher concentration of fixations and cooler colors (green to blue) indicating areas receiving less visual attention.
Land 15 01251 g002
Figure 3. Frequency distributions of fixation and saccade durations before and after logarithmic transformation.
Land 15 01251 g003
Figure 4. Average fixation duration in selected Areas of Interest.
Land 15 01251 g004
Figure 5. Average fixation duration in the female and male groups.
Land 15 01251 g005
Figure 6. Average duration of saccades in women and men.
Land 15 01251 g006
Figure 7. Averaged heat maps of fixation frequency (top row) and fixation duration (bottom row) for women, men, and the entire study sample. The area containing the colorful group of deciduous trees is outlined in blue.
Land 15 01251 g007
Table 1. Technical specifications of the Tobii Pro Glasses 2 eye tracker.
Sampling frequency50–100 Hz (for eye-trackers, sampling frequency refers to the number of identified locations of fixation points per second. It determines data quality and measurement accuracy)
Eye tracker
Cameras4
Scene camera FOV820 horizontally, 520 vertically
Scene camera parametersh.264; 1920 × 1080 pixels; @25 fps
Field of view160
Diagonal of scene camera FOV90°; 16:9
Sound recordingYes
Weight45 g
Battery120 min
Recording Station
ConnectionHDMI, Micro USB, 3.5 mm jack
Frequency2.4 GHz & 5 GHz band
Dimensions130 × 85 × 27 mm
Weight312 g
Table 2. Descriptive statistics of the distributions of fixation and saccade durations before and after logarithmic transformation.
StatisticsFixationLog (Fixation)SaccadesLog (Saccades)
Skewness1.4120.1460.639−0.001
Kurtosis1.413−0.872−0.410−1.256
Table 3. Descriptive statistics and variability measures for fixation duration.
Number of
Observations
MeanMedianMinimumMaximumStandard
Deviation
Coefficient
of Variation
All90005223601001999421.5980
Women40006024601001999444.8174
Men50004583101001999390.5385
Table 4. Descriptive statistics and variability measures for saccade duration.
MeanMedianMinimumMaximumStd. Dev.Coefficient of Variation
All3940208018.0745.8
Women3840208018.2147.90
Men4040208017.8844.11
Disclaimer/Publisher’s Note: The statements, opinions and data contained in all publications are solely those of the individual author(s) and contributor(s) and not of MDPI and/or the editor(s). MDPI and/or the editor(s) disclaim responsibility for any injury to people or property resulting from any ideas, methods, instructions or products referred to in the content.