


Abstract
This paper investigates the evolution and driving mechanisms of the Coupling Coordination Degree (CCD) between urban development (UD) and ecological efficiency (EE) in the Yangtze River Delta (YRD) urban agglomeration. Using panel data for 27 cities from 2013 to 2023, a comprehensive evaluation model and the CCD model are used to measure the level of coordination across cities. A fixed-effects panel regression model is constructed to systematically examine the effects of economic development and education expenditure on CCD, focusing on the moderating role of education expenditure. The empirical results indicate that: (1) CCD in the YRD shows a clear upward trend, gradually shifting from disorder to coordinated development; (2) inter-city disparities remain evident, reflecting differences in development foundations, industrial structures, and governance capacities; (3) economic development significantly promotes CCD by providing material and institutional support for urban–ecological coordination; and (4) education expenditure strengthens this positive relationship by enhancing human capital accumulation and knowledge spillovers. The findings highlight the importance of integrating economic growth with human capital investment to promote green and high-quality urban development.
1. Introduction
Against the backdrop of accelerating climate change and intensified human activities, urban systems are increasingly exposed to ecological pressure, resource constraints, and environmental risks. The United Nations Sustainable Development Goals (SDGs) highlight the need to integrate economic, social, and environmental dimensions into urban development [1]. Since the reform and opening-up period, China has experienced rapid urbanisation, with the national urbanisation rate increasing from 17.92% in 1978 to approximately 67% by 2024 [2]. This process has strongly promoted economic growth, industrial upgrading, and social transformation, but it has also intensified resource consumption, land expansion, pollution emissions, and ecological degradation [3]. Existing studies show that urbanisation reshapes landuse patterns, fragments ecological space, and increases environmental pressure through rising transportation demand, energy consumption, and carbon emissions [4,5].
In response, China has promoted ecological civilisation and new-type urbanisation as national strategies [6]. Since the 18th National Congress of the Communist Party of China, the focus of urbanisation has shifted from speed-oriented expansion to people-centred and quality-oriented development. China’s 14th Five-Year Plan further highlights the development of liveable, resilient, and smart cities, while also emphasising the coordination between urban development and ecological protection [7]. In this context, ecological efficiency is a useful indicator because it captures the extent to which economic output is generated with reduced resource consumption and environmental pressure, thereby providing a measure of sustainable urban development quality [8].
The YRD is one of China’s most urbanised and economically dynamic regions. Since YRD regional integration was elevated to a national strategy, coordinated resource allocation, environmental governance, and ecological protection have become increasingly important [9]. The region’s urbanisation rate reached approximately 73.8% by 2024, significantly higher than the national average [2]. However, rapid population and industrial concentration have also created ecological pressure, including high land development intensity, periodic deterioration in water ecological quality in some cities, and insufficient urban resilience under extreme weather conditions [10,11]. Therefore, examining the coordination between UD and EE in the YRD is important for understanding sustainable development in highly urbanised regions.
Recent studies have examined the relationship between UD and EE from several perspectives. Some have focused on the environmental effects of urban expansion [12,13], while others have analysed ecological efficiency, green development, or environmental performance [14]. A growing number of studies have also used the CCD model to evaluate the interaction between UD and EE [15,16]. These studies have shown that that urban development and ecological systems are closely connected and co-evolve over time.
However, several research gaps remain. Existing studies have offered valuable insights into the temporal and spatial evolution of CCD, but the mechanisms underlying changes in coordination require further examination. In addition, economic development has often been discussed separately in relation to urban development or environmental performance. This issue is important because economic growth may enhance fiscal capacity and environmental governance, but it may also increase resource demand and ecological pressure. Moreover, although education expenditure may improve human capital, innovation capacity, environmental awareness, and governance efficiency, its potential moderating role in the economic development–CCD relationship remains insufficiently understood.
To address these gaps, this paper investigates the coupling coordination between UD and EE in the YRD. Specifically, it examines the impact of economic development on CCD and further evaluates whether education expenditure moderates this relationship.
The contribution of this paper is threefold. First, it clarifies the theoretical meaning of CCD as a system-level indicator that captures the interaction, balance, and co-evolution between UD and EE. Second, it shifts the focus from the separate effects of urban development or ecological efficiency to the mechanisms shaping coordination between the two systems, thereby examining economic development as a factor shaping urban–ecological coordination quality. Third, by introducing education expenditure as a moderating variable, this paper highlights the role of human capital investment in transforming economic growth into coordinated and sustainable development outcomes.
Based on the above discussion, this paper proposes the following hypotheses:
H1.
Economic development has a positive effect on CCD.
H2.
Education expenditure positively moderates the relationship between economic development and CCD.
2. Materials and Methods
2.1. Data Sources
The YRD urban agglomeration is positioned at the strategic intersection of the ‘Belt and Road Initiative’ and the Yangtze River Economic Belt. The Development Plan for the Yangtze River Delta Urban Agglomeration identifies the YRD as one of China’s earliest urbanised regions. It also highlights the region’s strong comprehensive development capacity [17].
Within this policy context, this paper selects panel data for 27 cities in the YRD from 2013 to 2023. This dataset provides a practical basis for observing the phased dynamics of the urban-ecological interactions. The data are mainly obtained from the National Bureau of Statistics of China, along with relevant provincial and municipal statistical yearbooks and official statistical bulletins, and supplemented by authoritative databases where necessary. Indicator construction and the calculation of CCD are performed using SPSSAU 25.0. Regression analysis is undertaken using Stata MP 19.
2.2. Indicator Selection
Urban development is a multidimensional process encompassing population, economic, spatial, and social dimensions [18]. To evaluate urban quality and ecological efficiency systematically, this paper constructs a comprehensive indicator system grounded in a multidimensional framework. Indicator selection is informed by the relevant literature and the development characteristics of the YRD urban agglomeration. The urban development subsystem is developed based on the theory of new-type urbanisation, which emphasises multidimensional development across population, economic, spatial and social dimensions [19,20]. The ecological subsystem draws on the PSR (Pressure–State–Response) framework, which is widely used to characterise the interactions between human activities and environmental systems [21,22]. Building on these theoretical foundations, the indicator system is designed to capture both the structural characteristics of urban development and the efficiency of environmental performance, thereby reflecting the multidimensional nature of UD and the systemic characteristics of EE.
Following the principles of scientific validity, applicability, operability, and data continuity, this paper establishes two evaluation systems: (1) an urban development system comprising four dimensions and ten indicators and (2) an ecological efficiency system comprising three dimensions and nine indicators. The latter isdesigned to capture the efficiency with which economic activities are transformed into environmental outcomes (Table 1).
Table 1.
Summary of selected indicators.
To test the hypotheses proposed in this paper, regression analysis is conducted. The variables were selected according to theoretical relevance, empirical applicability, and data availability. CCD is used as the dependent variable because it captures the coordinated development between urban development and ecological efficiency [16,23]. Economic development is selected as the core explanatory variable because it may improve infrastructure, public services, and environmental governance, while also increasing resource consumption and ecological pressure [24,25]. Education expenditure is introduced as a moderating variable because public investment in human capital can enhance innovation capacity, environmental awareness, and governance efficiency, thereby affecting the extent to which economic growth contributes to coordinated development [26]. The control variables reflect key structural conditions related to industrial structure, government investment, and urban–rural development.
Table 2 summarises the definitions, symbols, expected signs, and measurement methods of the dependent variable, the key explanatory variables, the control variables, and the interaction term employed in the empirical analysis.
Table 2.
Summary of variables and expected signs.
To improve transparency and comparability, the raw data are first checked by city and year. Missing values are interpolated only when they occurred between two available observations for the same city. After data processing, a balanced panel dataset covering 27 cities from 2013 to 2023 was obtained. For index construction, urban development and ecological efficiency indicators are standardised using the min-max method, with positive and negative indicators treated separately. Entropy weighting is then applied to calculate the composite indices of UD and EE, which are subsequently used to calculate CCD. Finally, non-ratio variables, such as per capita GDP and education expenditure, were log-transformed to reduce scale differences and potential heteroscedasticity.
2.3. Data Analysis
Grounded in information theory, the entropy method is an objective weighting technique that assigns indicator weights according to their degree of dispersion across samples. Indicators with greater variability contain more information and are assigned higher weights; those with limited variation receive lower weights [27]. This approach reduces subjectivity in weight determination and is widely applied in comprehensive evaluations. The calculation procedure comprises four main steps: (1) to eliminate the influence of different units and directions, all indicators are normalised using the min-max method; (2) the proportion of each standardised indicator is calculated; (3) information entropy and redundancy are computed to derive the weight of each indicator; (4) weighted indicators are aggregated to obtain the composite index for each city and year. A comprehensive evaluation model is adopted in this paper to calculate the overall development level of the urban development and ecological efficiency systems [28]. The calculation formula is as follows:
where represents the comprehensive index of urban development or the ecological efficiency subsystem for city in year ; represents the weight of indicator ; denotes the standardised value of indicator for city in year .
In physics, coupling refers to the interaction between two or more systems through internal and external mechanisms and coordination refers to the coordinated development of these systems [29]. Drawing on this concept, this paper applies the CCD framework to examine the relationship between urban development and ecological efficiency. The calculation involves three steps: (1) coupling degree is estimated to capture the intensity of interaction between the two subsystems; (2) a comprehensive development index is constructed to reflect their overall development level; (3) the CCD is derived by integrating interaction strength with development performance, assessing the extent to which urban development and ecological efficiency evolve in a balanced and coordinated manner. The specific formulas are as follows [30]:
The value of the coupling degree falls within the interval [0, 1]. A value closer to 1 indicates a stronger interaction and a tighter linkage between the two subsystems. Next, represents the comprehensive coordination index; reflects the degree of coupling coordination between UD and EE. A higher value of indicates a higher level of coordinated development between the two subsystems. The coefficients α and β represent the relative importance of each subsystem. Since urban development and ecological efficiency are considered equally significant in this paper, both are set to 0.5 [31].
However, CCD has certain limitations as a composite index. Its value may be affected by indicator selection, normalisation, and weighting methods. Although the entropy weight method is used to reduce subjectivity, the results remain dependent on the constructed indicator system. To address this limitation, this paper combines CCD measurement with econometric analysis.
Following previous studies and commonly used CCD classification criteria, CCD is classified across 10 categories [24], as shown in Table 3.
Table 3.
Classification criteria for CCD levels.
Urban development and ecological efficiency comprise two interdependent systems that influence each other in a dynamic and mutually constrained manner, while a range of socioeconomic and environmental factors shape their coordinated development [16,32]. Considering data availability and research objectives, this paper adopts the CCD between UD and EE as the dependent variable to evaluate their integrated development level. The explanatory variables are established are selected to reflect economic development, industrial structure, government investment, and urban–rural coordination [33,34,35,36].
To examine the determinants of the CCD of urban–ecological coordination, this paper employs balanced panel data from 27 cities in the main YRD area. Based on model specification and a series of diagnostic tests, the individual fixed-effects (FE) model is selected for the empirical estimation. This model controls for unobservable but time-invariant characteristics across cities, thereby reducing reduces estimation bias arising from regional heterogeneity and allows for a more accurate identification of the effects of economic and structural factors on coupling coordination [37]. The individual FE regression model is specified as follows:
where denotes the dependent variable, representing the coupling coordination degree for city in year . represent economic development, industrial structure, government investment, and urban–rural coordination, respectively. (ECON × GOV) denotes the interaction term used to examine the moderating effect of government investment; captures unobserved individual-specific effects; is the stochastic error term.
3. Results
3.1. Assessing Urban Development and Ecological Efficiency
In this paper, a comprehensive assessment of urban development and ecological efficiency in the YRD urban agglomeration from 2013 to 2023 is conducted. Both UD and EE exhibited varying degrees of upward trends during the study period.
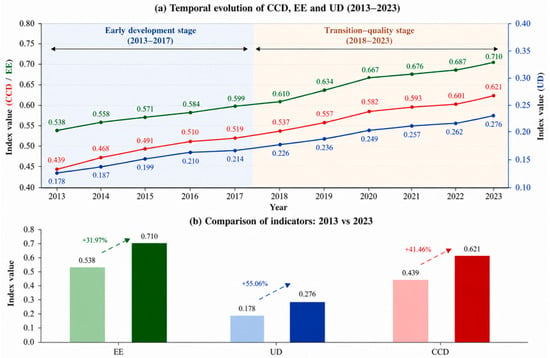
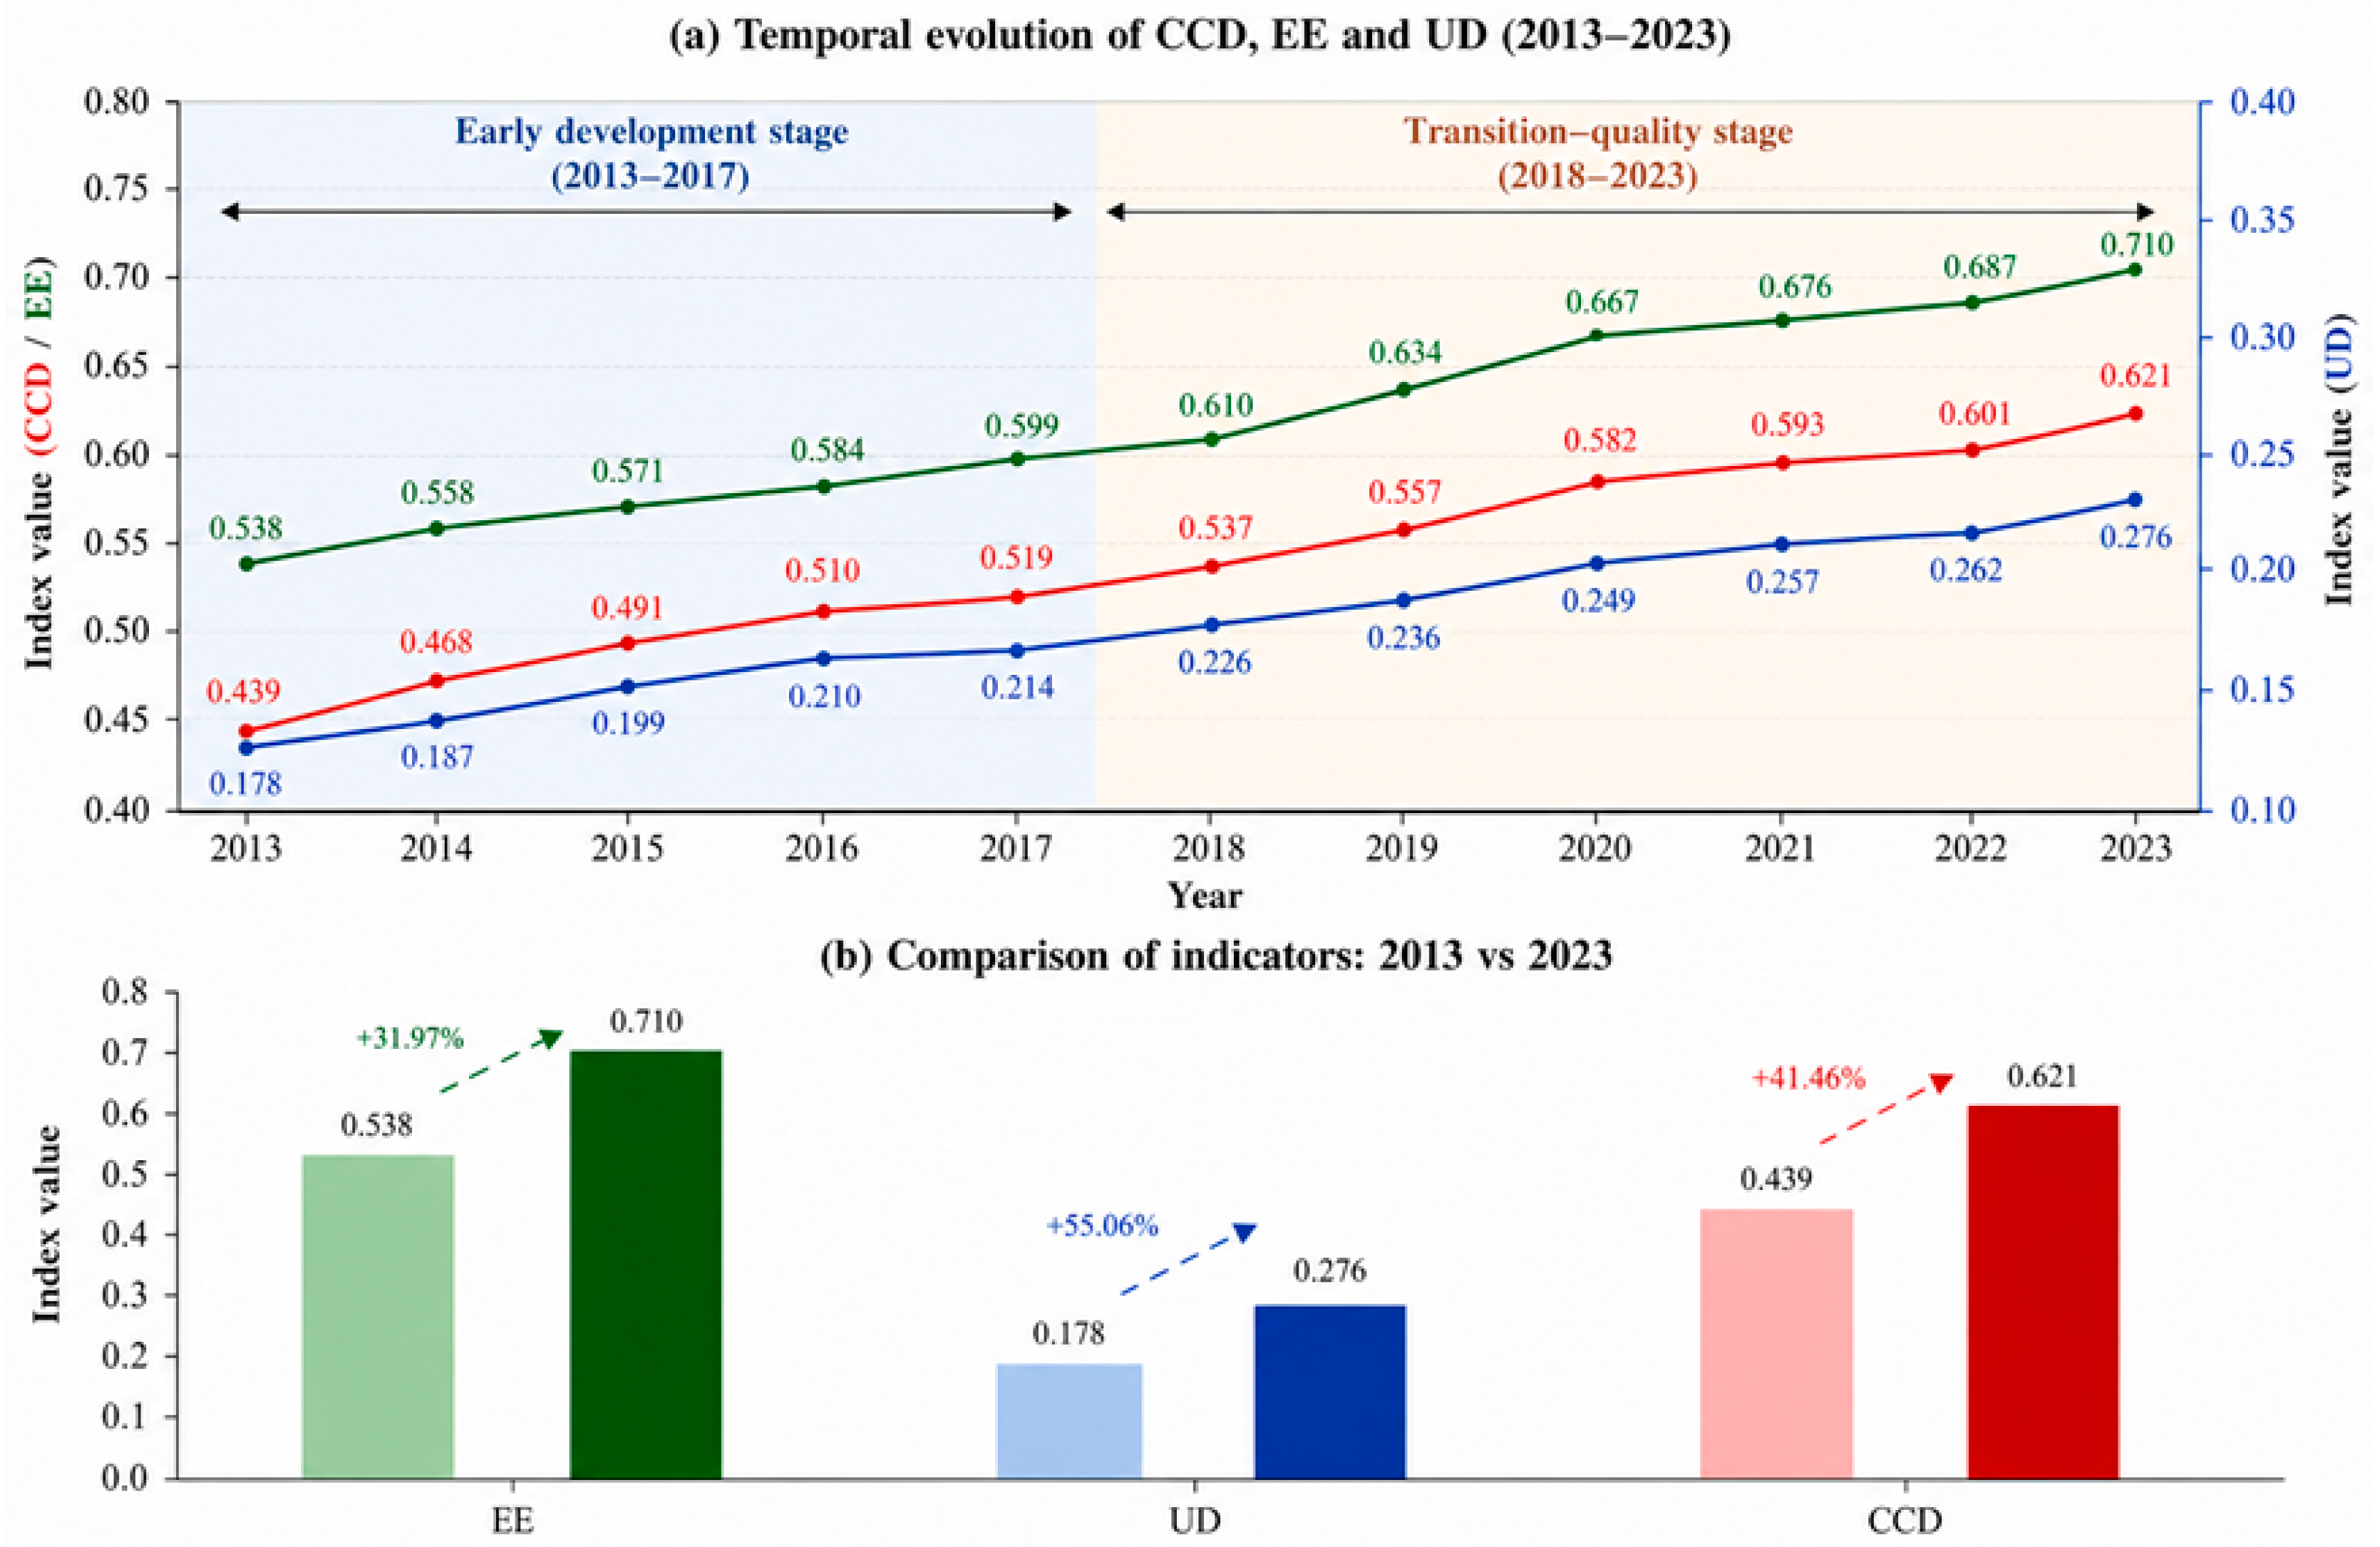
Figure 1 illustrates the temporal evolution and comparative dynamics of the CCD, EE, and UD over the period 2013–2023. Overall, CCD increased from 0.439 in 2013 to 0.621 in 2023, showing a steady upward trend and indicating a continuous improvement in the coordination between urban development and ecological efficiency.
Figure 1.
Temporal evolution and stage-based comparison of CCD, EE and UD in 2013–2023.
From a dynamic perspective, this evolution exhibits a clear stage-based pattern. During 2013–2017, CCD remained at a relatively low level and grew at a modest pace, suggesting that rapid urban expansion may have outpaced the ecological system’s carrying and adaptive capacity, resulting in limited coordination. After 2018, however, the increase in CCD became more pronounced and stable, accompanied by reduced fluctuations. This shift may be associated with strengthened environmental governance and the deepening of regional integration policies. At the subsystem level, both UD and EE show upward trends, albeit with different trajectories. UD increases steadily, reflecting continuous urbanisation, whereas EE improves more gradually. EE remains higher than CCD throughout most of the study period, suggesting that improvements in ecological efficiency alone do not immediately translate into a high level of coupling coordination. Coordination improves more gradually because it depends on the balanced development of both UD and EE.
Although both subsystems have improved, the enhancement of coordination does not occur simultaneously but instead follows a gradual accumulation process. This makes it necessary to further examine inter-city differences in coupling coordination.
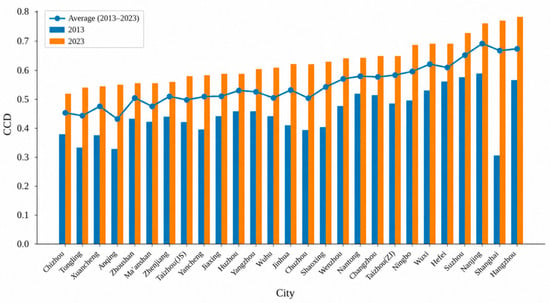
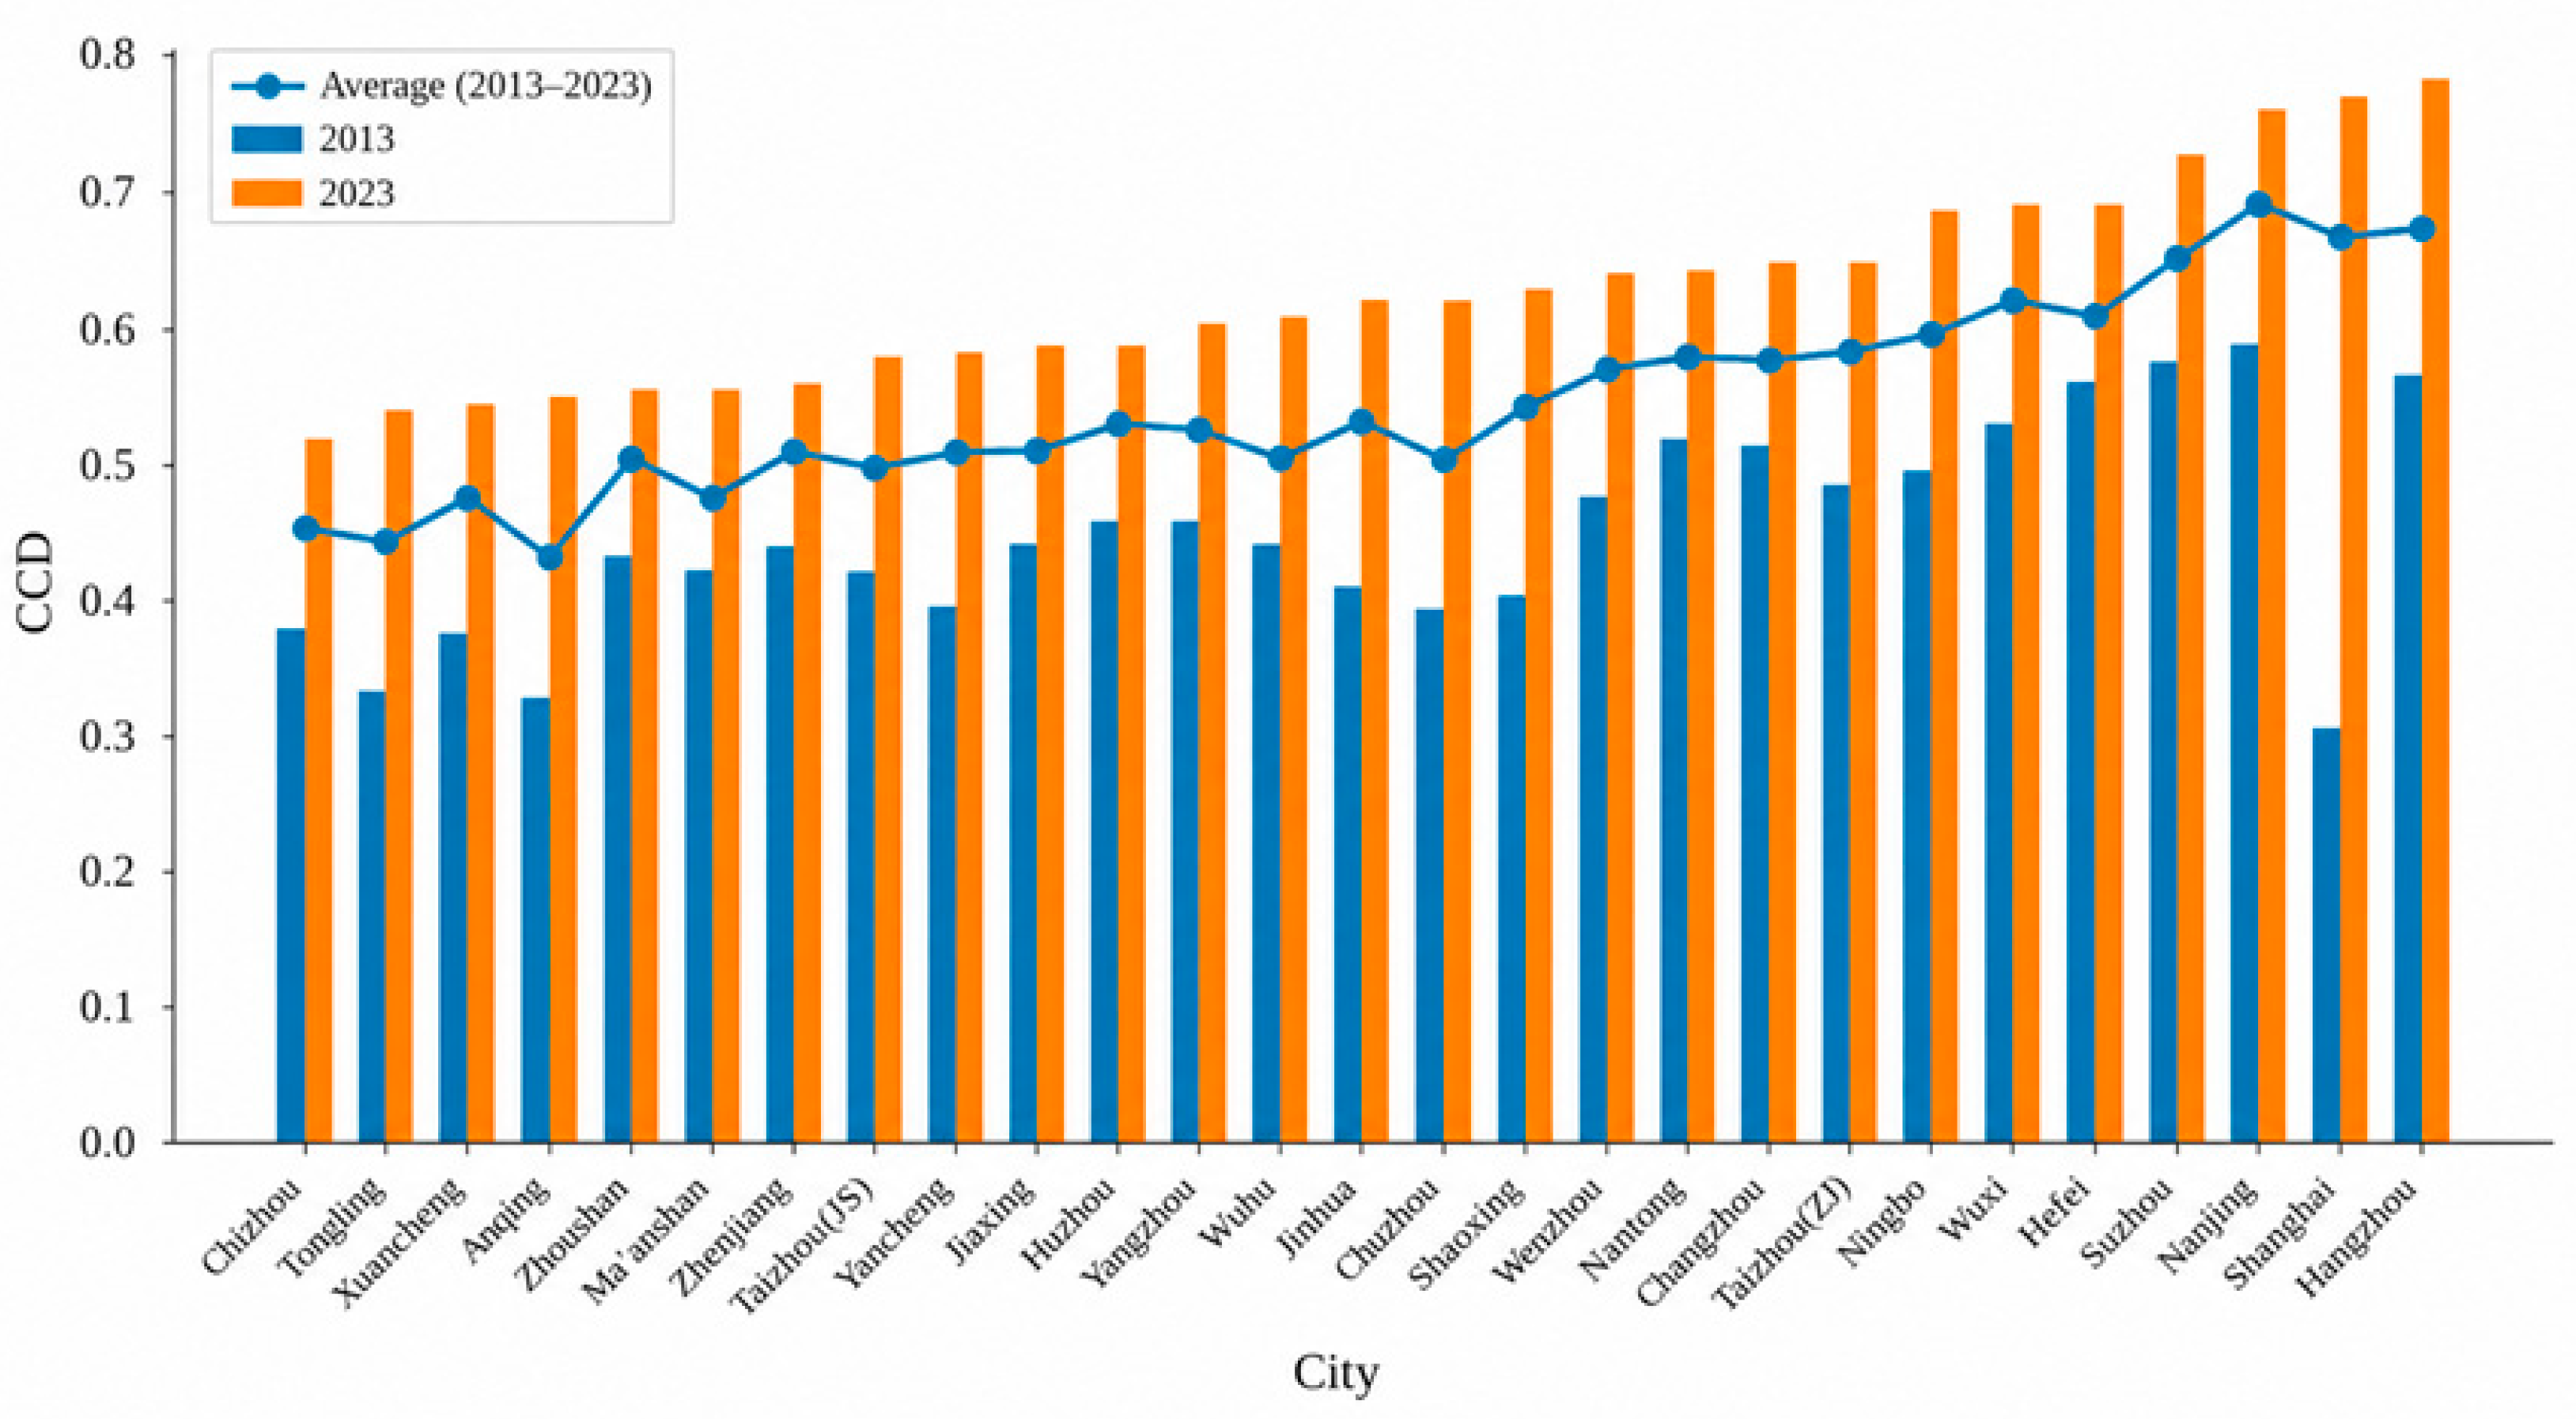
Figure 2 compares CCD across major cities in the YRD for 2013, 2023, and the 11-year average. Overall, the coupling coordination level exhibits a clear upward trend. This result indicates that the interaction between urban development and ecological efficiency has been gradually strengthened, while the regional system has become more synergistic. Spatially, the coupling coordination level has a distinctive ‘core–periphery’ gradient. Hangzhou, Shanghai, Nanjing, and Suzhou have maintained consistently high coordination, forming the leading growth poles of the region. These cities demonstrate a relatively mature stage of development; economic expansion, technological innovation, and environmental management have achieved a stable and mutually reinforcing balance [38]. Cities such as Hefei, Wuxi, and Ningbo occupy the second tier, with steadily improving coordination levels and increasing regional supporting capacity. Some peripheral cities, such as Chizhou, Tongling, Xuancheng, and Anqing, are characterised by lower coordination performance. Although improvements have been observed; a clear gap remains between them and the core cities.
Figure 2.
Comparison of CCD across 27 cities in the YRD.
From a temporal perspective, inter-city disparities in coupling coordination remain evident, but the overall distribution has gradually shifted upward. This indicates that most YRD cities have experienced improvements in coordination, although spatial differences have not been fully resolved. This trend may be partly associated with the implementation of the YRD integration strategy since 2015, the transition toward greener industrial structures, and the strengthening of ecological civilisation policies, which have jointly supported more balanced and higher-quality regional development [39].
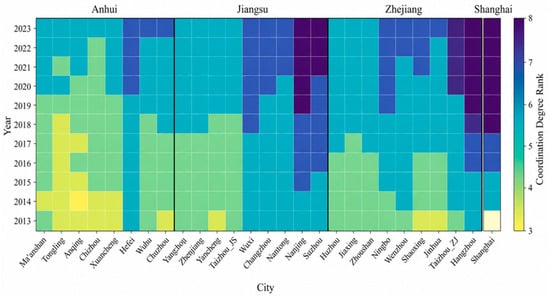
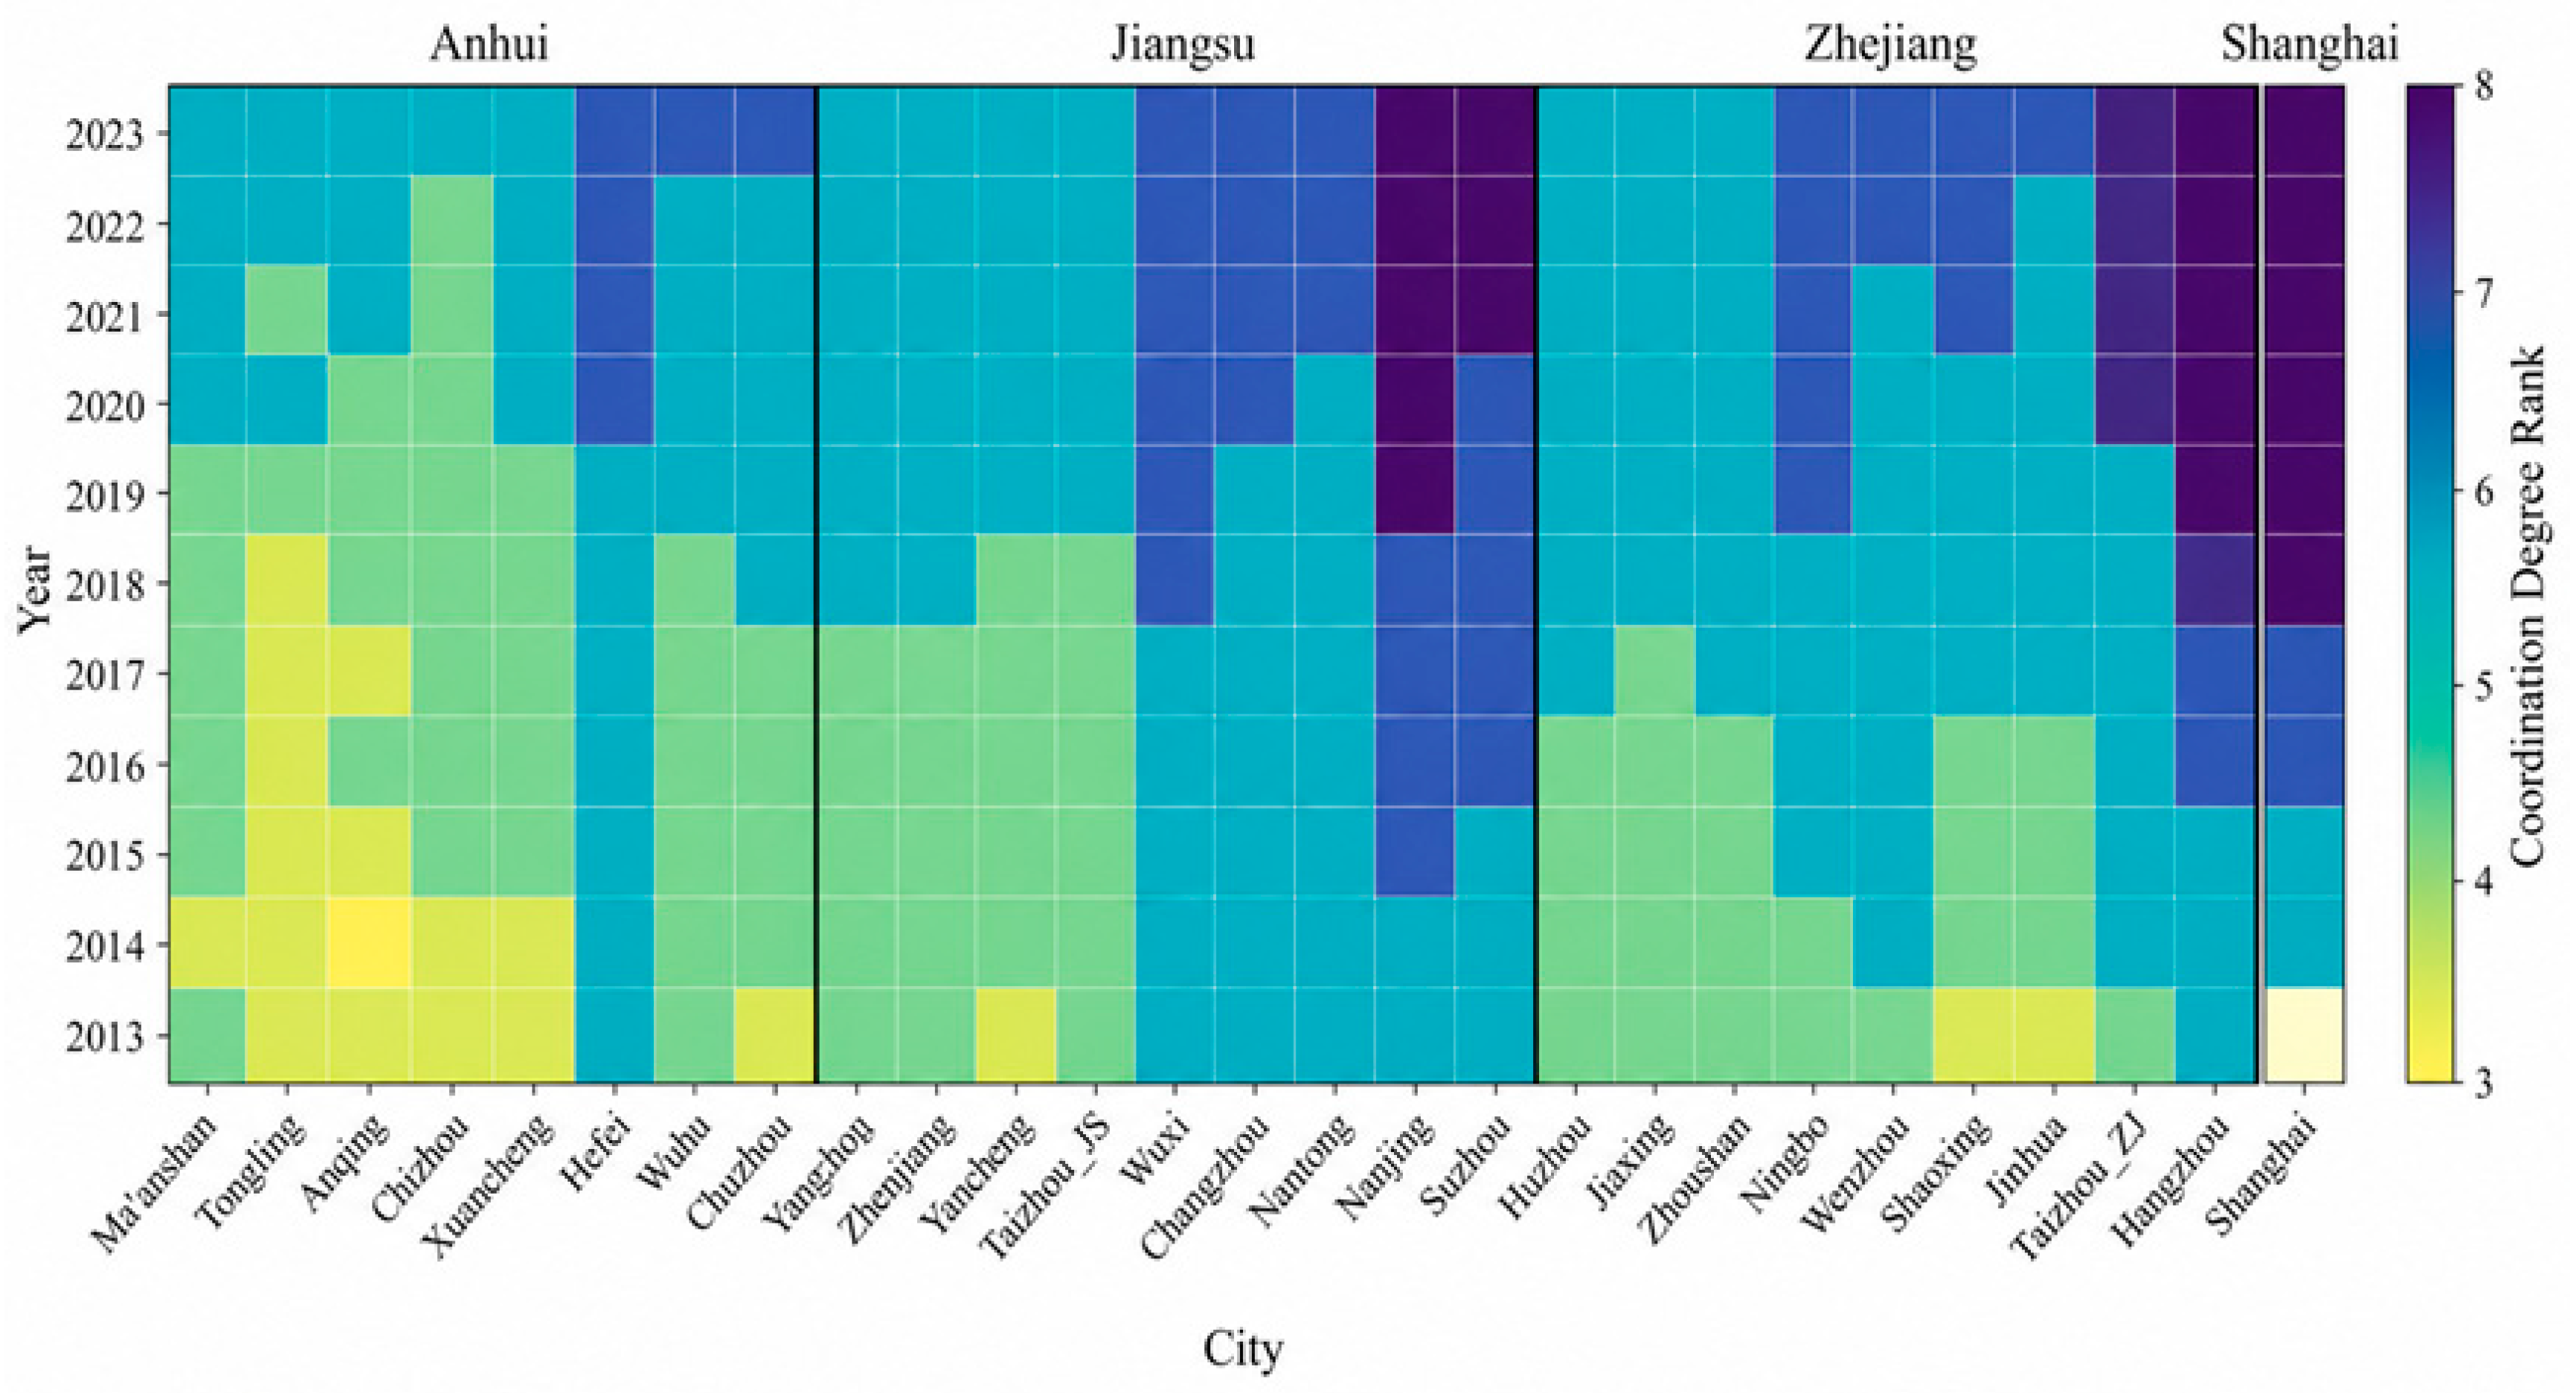
Figure 3 presents the temporal evolution of the coordination levels between urban development and ecological efficiency across 27 cities in the YRD from 2013 to 2023. The average CCD of the 27 cities increased from 0.44 in 2013 to 0.62 in 2023, representing an improvement of 0.18, which corresponds to approximately two coordination categories. This reflects a clear upgrading in the coordination status rather than a marginal change within the same level. More than 15 cities exhibited an increase of more than two categories, indicating a substantial structural shift. In 2013, approximately 74.07% of the cities were still in a state of imbalance. By 2023, however, all cities had entered the coordinated stage, with 55.56% reaching the ‘primary coordination’ level and 14.81% attaining ‘intermediate coordination’. This transition indicates a systemic shift in the YRD from an imbalance-dominated pattern to one characterised by coordinated development.
Figure 3.
Trends in CCD classification levels across 27 YRD cities, 2013–2023.
The evolution process can be divided into two distinct phases. The period from 2013 to 2017 served as a ‘transition stage’, during which most cities remained at levels below 6 in the CCD classification system. At this stage, rapid urban expansion outpaced ecological carrying capacity, revealing noticeable tensions between economic growth and environmental conditions. The period from 2018 to 2023 represents a phase of ‘accelerated coordination’. This improvement may be associated with the elevation of YRD integration to a national strategy and the intensified implementation of ecological redlines, energy consumption targets, and green governance frameworks. During this period, most cities advanced from ‘barely coordinated’ to ‘primary coordination’. Core cities, such as Shanghai, Nanjing, Hangzhou, and Suzhou, further progressed into the ‘intermediate coordination’ category, reflecting a shift from passive adaptation to proactive and systemic collaboration.
Spatially, the coordination pattern exhibits a distinct structure of an east-high spatial pattern. Specifically, high coordination areas are concentrated in the core urban belt of Shanghai, Suzhou, Hangzhou, and Nanjing, where the ‘coordination poles’ drive high-quality regional development. Several cities, such as Hefei, Wuhu, Wuxi, and Wenzhou, remain at the primary coordination stage but demonstrate relatively stable development trajectories. In contrast, several cities in southern Anhui, such as Ma’anshan, Tongling, Chizhou, Xuancheng, and Xuancheng, had relatively low coordination levels in the early stage due to a heavy industrial structure and limited environmental governance capacity. However, these cities have shown clear catch-up momentum in recent years under regional coordination mechanisms and green transition policies.
The trend of narrowing spatial disparities in coordination across the YRD provides evidence of the effectiveness of regional integration strategies and green governance policies. Nevertheless, the temporal and spatial evolution of the CCD alone cannot fully reveal the underlying drivers or mechanisms. To identify the key forces that promote or hinder coordinated development, it is necessary to build a multivariate panel regression model based on the preceding CCD measurement results. This approach helps examine how economic development, government investment, industrial structure, and urban–rural coordination affect CCD. The empirical analysis in the following section helps to uncover the driving factors and constraints of coordination among YRD cities, providing a factual basis for formulating more targeted policy recommendations.
3.2. Descriptive Statistics
Table 4 presents the descriptive statistics of the key variables. The mean CCD is 0.538, with relatively limited dispersion. This finding indicates a moderate overall level of coordination alongside evident inter-city differences. Per capita GDP shows substantial variation, reflecting pronounced economic heterogeneity across cities. The industrial structure exhibits moderate dispersion, and education expenditure varies widely, indicating uneven investment across the region. The urban–rural disposable income ratio remains relatively stable, which suggests a persistent, broadly consistent urban–rural gap.
Table 4.
Descriptive statistics of the YRD variables.
3.3. Correlation Statistics
Table 5 presents the Pearson correlation matrix for the main variables. CCD is strongly and positively correlated with per capita GDP and education expenditure. This finding indicates that a higher level of economic development and greater investment in education are associated with stronger urban–ecological coupling coordination. However, CCD shows significant negative correlations with the ratio of secondary to tertiary industry value added and the urban–rural disposable income ratio. The interaction term is weakly correlated with CCD, which suggests that its moderating effect should be assessed through regression analysis rather than bivariate correlations.
Table 5.
Correlation matrix for YRD variables.
3.4. Panel Data Regression Analysis
Table 6 presents the estimation results from the pooled ordinary least squares (POLS), random effects (RE), and FE panel models used to examine the determinants of the CCD. A series of standard statistical tests was used to guide the choice of model specification [40]. The Breusch–Pagan LM test rejects the null hypothesis of no unobserved individual effects at the 1% significance level. This finding indicates pronounced panel characteristics in the data, rendering the POLS estimator unsuitable. The Hausman test is also statistically significant, which suggests systematic differences between the RE and FE estimators and supports the use of the FE model. In addition, the F-test results confirm the joint significance of city-specific FE. Accordingly, the FE model is adopted as the baseline specification.
Table 6.
Results of the static panel data model in YRD.
Before estimation, multicollinearity is examined. The results indicate that the variance inflation factor is approximately 1.76, suggesting no serious multicollinearity concerns. Since the tests for heteroskedasticity and serial correlation both reject the null hypotheses, robust standard errors are applied within the FE framework to ensure estimation reliability.
The estimation results show that economic development has a positive and statistically significant effect on CCD. Economic development, measured by per capita GDP, yields an estimated coefficient of 0.119, which is significant at the 1% level. This finding suggests that higher levels of economic development contribute to improved CCD between urban development and ecological efficiency. The coefficient of education expenditure is also positive and statistically significant, suggesting that education expenditure is positively associated with CCD when the interaction term is included. More importantly, the positive and significant interaction term indicates that education expenditure strengthens the relationship between economic development and CCD. This finding provides direct empirical evidence of its moderating role in the relationship between economic growth and urban–ecological coordination.
3.5. Robustness Tests
As a robustness check, the core explanatory variable is lagged by one period to partially alleviate potential endogeneity concerns, although this approach cannot fully eliminate them. This specification is used as a sensitivity check to examine whether the main findings remain broadly consistent when temporal lag effects are considered. The interaction term is constructed using lagged economic development and contemporaneous education expenditure. The results in Table 7 show that lagged per capita GDP remains significantly and positively associated with CCD, with a coefficient of 0.115. This finding indicates that economic development has a persistent positive effect on urban–ecological coordination. Moreover, the interaction term between lagged economic development and education expenditure is positive and significant. This finding suggests that education expenditure amplifies the positive impact of prior economic growth on CCD. This result provides further evidence supporting the moderating role of education expenditure. The control variables exhibit stable, theoretically consistent signs. The overall results remain highly consistent with the baseline estimates, reinforcing the robustness of the main conclusions.
Table 7.
Robustness test using lagged economic development.
Since CCD is a continuous variable bounded between 0 and 1, a Tobit model is employed to examine the robustness of the baseline results by explicitly accounting for potential boundary effects [41]. The estimation results are presented in Table 8. The Tobit estimates indicate that economic development, as measured by per capita GDP, continues to have a positive and statistically effect on CCD. The PGDP coefficient is 0.132 and is statistically significant at 1%. This result indicates that higher levels of economic development are associated with improved coordination between UD and EE. The finding aligns with the FE estimates. Notably, the interaction term between economic development and education expenditure is positive and statistically significant at 1%. This finding suggests that education expenditure enhances the positive impact of economic development on CCD.
Table 8.
Robustness test using the Tobit model.
The robustness tests are interpreted as supplementary sensitivity analyses rather than as complete solutions to endogeneity. The one-period lag specification may partly reduce concerns about contemporaneous reverse causality, but it cannot fully address endogeneity arising from omitted variables, measurement error, or longer-term feedback effects. Similarly, the Tobit model is included only as an additional check, given that CCD is theoretically bounded between 0 and 1. However, because most CCD observations are not close to the boundary values, the Tobit model is not treated as the preferred specification. Therefore, the fixed-effects model remains the main model, while the robustness checks are used to assess whether the main findings remain broadly consistent under alternative specifications.
4. Discussion
4.1. Dynamic Evolution of Coupling Coordination
The results indicate a clear upward trajectory in the CCD, suggesting a marked improvement in the relationship between UD and EE over the study period. This finding is broadly consistent with existing studies, which report that the coordination between urban development and environmental systems in China has improved under the transition towards high-quality growth [42,43]. However, this trend should not be interpreted as a purely endogenous or self-sustaining process.
The observed phased pattern, characterised by initial fluctuations followed by a period of accelerated improvement, further refines the existing literature. While previous studies tend to emphasise a gradual improvement process, the results here highlight a more pronounced stage-based transition [44]. This suggests that the urban-ecological nexus is highly sensitive to institutional and policy conditions. In particular, the acceleration after 2018 coincides with strengthened environmental governance and the implementation of regional integration strategies, supporting the argument that government investments play an important role in shaping coordination outcomes rather than emerging automatically from urban expansion [12,16].
Moreover, the gradual convergence in coordination levels across cities aligns with findings in the literature that regional disparities tend to narrow under coordinated policy frameworks [45]. However, unlike studies that attribute convergence primarily to market-driven mechanisms, the present results suggest that institutional arrangements and governance capacity are central to this process. From this perspective, coupling coordination reflects not only the outcomes of economic and environmental change but also the effectiveness of governance mechanisms [46].
4.2. Economic Development as the Material Foundation of CCD
The regression results consistently indicate that economic development is an important factor associated with higher CCD. Across different model specifications, the positive and statistically significant coefficient of per capita GDP suggests that cities with higher economic development levels tend to possess a stronger capacity to coordinate urban development and ecological protection. This finding is broadly consistent with previous studies showing that economic development can improve urban–environmental coordination by expanding fiscal capacity, strengthening infrastructure provision, and supporting environmental governance [47]. Similar conclusions have also been reported in studies on urban agglomerations and regional green development, where higher income levels are associated with stronger investment capacity and more advanced environmental management systems [48].
However, this result also differs from studies that emphasise the environmental costs of rapid economic expansion. Some research suggests that, especially at earlier stages of development, economic growth may intensify land consumption, energy demand, pollution emissions, and ecological pressure, thereby weakening coordination between UD and EE [49]. The positive coefficient identified in this paper therefore does not imply that economic growth automatically improves CCD. Rather, it suggests that in the YRD context, economic development may have increasingly shifted from extensive expansion towards a more quality-oriented pathway, in which fiscal resources, technological upgrading, and industrial restructuring help offset environmental pressures.
The persistence of this effect in the lagged specification further suggests that the role of economic development is not merely contemporaneous. Instead, it may reflect a cumulative process in which sustained growth gradually improves the material and governance conditions required for coordinated urban–environmental development. This interpretation is in line with studies arguing that the benefits of economic development often emerge through long-term institutional learning, environmental investment, and industrial transformation rather than through short-term output growth alone [50].
Economic development can provide the necessary resource base for improving coordination, but its effect depends on how fiscal resources are allocated, how industrial transformation is guided, and whether technological opportunities are translated into lower environmental pressure. Thus, the significant positive effect of per capita GDP should be understood not as a mechanical association but as an outcome of broader development processes through which higher-quality growth makes coordination between UD and EE more achievable [51].
4.3. The Role of Education Expenditure in Enhancing Coordination Quality
Education expenditure plays a significant moderating role in shaping the relationship between economic development and CCD. Its positive direct coefficient suggests that education expenditure is associated with improved coordination, while the significant interaction term further indicates that the contribution of economic development to CCD depends partly on the level of educational investment. The consistently positive and statistically significant coefficient of the interaction between economic development and education expenditure suggests that economic growth is more likely to promote CCD in regions with stronger educational support. This finding is consistent with the studies of Su et al. and Yang & Fang [52,53].
This moderating effect can be explained through the role of education expenditure in improving the quality of economic growth. First, higher education investment contributes to human capital accumulation, which enables cities to adopt cleaner technologies, improve resource use efficiency, and support industrial upgrading. Second, education can improve environmental awareness among residents, enterprises, and local decision-makers, thereby increasing the social and institutional acceptance of green development policies. Third, education expenditure may enhance local governance capacity by improving the availability of skilled personnel and technical knowledge required for environmental management, public service provision, and urban planning. Through these channels, education expenditure helps transform economic growth from a purely scale-expansion process into a more knowledge-based and environmentally adaptive development process.
Therefore, in contrast to studies that emphasise the direct effect of education expenditure on environmental or urban outcomes [54], the results indicate that its role is more conditional. Education expenditure does not function in isolation; rather, it strengthens the positive effect of economic development on urban-ecological coordination by improving human capital, governance capacity, and the diffusion of cleaner technologies [55].
From a policy perspective, this finding underscores the importance of prioritising human capital accumulation. As Zou and Xu [56] and Yang and Yu [57] argue, education expenditure should not be viewed merely as a complementary input but as a strategic lever for improving the quality and sustainability of coordinated development.
While the overall results suggest that economic development and education expenditure are generally associated with improvements in CCD, this relationship may not be uniformly positive across all contexts. In certain cases, rapid economic expansion or inefficient allocation of resources could weaken the expected coordination effects, leading to deviations from the general trend [58]. These potential exceptions highlight the importance of considering heterogeneity across cities and development stages. Future research could further explore such cases by identifying conditions under which the linkage between economic growth, education investment, and coordination outcomes becomes less effective or even counterproductive.
5. Conclusions
This paper investigates the coupling coordination between UD and EE in the YRD using panel data for 27 cities from 2013 to 2023. The results show a steady improvement in CCD over the study period, with the overall level moving from a relatively low coordination stage towards primary coordination. Nevertheless, clear inter-city disparities remain, suggesting that coordinated development is still uneven across the YRD urban agglomeration.
The regression results further reveal the mechanisms behind this change. Economic development is found to be positively associated with CCD, while education expenditure strengthens this relationship through its moderating effect. This indicates that human capital investment helps cities transform economic growth into more coordinated and sustainable urban-ecological outcomes. Theoretically, this paper enriches the literature by linking CCD with economic development and human capital investment, thereby providing a clearer understanding of the conditions under which growth contributes to urban-ecological coordination.
These findings suggest that policy efforts should focus not only on maintaining economic growth but also on improving the structure and effectiveness of public spending. In particular, education expenditure should be directed towards vocational education, green skills training, environmental management, and university-industry cooperation. Such targeted investment can improve human capital quality, support cleaner production and green innovation, and strengthen local governance capacity.
Cities in the YRD should therefore allocate education resources according to their development conditions. More developed cities may prioritise advanced human capital, green innovation, and knowledge-intensive industries, whereas less-developed cities may focus on vocational training, technical skills, and basic environmental governance. In this way, education expenditure can provide practical support for the coordinated development of UD and EE.
Author Contributions
Conceptualization, Z.H. and C.-H.P.; Methodology, Z.H. and C.-H.P.; Software, Z.H.; Validation, Z.H. and C.-H.P.; Formal analysis, Z.H.; Investigation, Z.H.; Resources, Z.H.; Data curation, Z.H.; Writing—original draft, Z.H.; Writing—review & editing, Z.H. and C.-H.P.; Visualization, Z.H.; Supervision, C.-H.P.; Funding acquisition, Z.H. and C.-H.P. All authors have read and agreed to the published version of the manuscript.
Funding
This research received no external funding.
Data Availability Statement
The datasets used and analyzed during the current study are available from the corresponding author upon reasonable request.
Conflicts of Interest
The authors declare no conflicts of interest.
References
- Medeiros, E. The territorial dimension of the United Nations sustainable development goals. Area 2021, 53, 292–302. [Google Scholar] [CrossRef] [Scilit]
- National Bureau of Statistics of China. China Statistical Yearbook 2025. Available online: http://www.stats.gov.cn (accessed on 24 March 2026).
- Jie, H.; Khan, I.; Alharthi, M.; Zafar, M.W.; Saeed, A. Sustainable energy policy, socio-economic development, and ecological footprint: The economic significance of natural resources, population growth, and industrial development. Util. Policy 2023, 81, 101490. [Google Scholar] [CrossRef] [Scilit]
- Zhu, E.; Qi, Q.; Chen, L.; Wu, X. The spatial-temporal patterns and multiple driving mechanisms of carbon emissions in the process of urbanization: A case study in Zhejiang, China. J. Clean. Prod. 2022, 358, 131954. [Google Scholar] [CrossRef] [Scilit]
- Xiao, R.; Yin, H.; Liu, R.; Zhang, Z.; Chinzorig, S.; Qin, K.; Tan, W.; Wan, Y.; Gao, Z.; Xu, C.; et al. Exploring the relationship between land use change patterns and variation in environmental factors within urban agglomeration. Sustain. Cities Soc. 2024, 108, 105447. [Google Scholar] [CrossRef] [Scilit]
- Chen, M.; Zhou, Y.; Huang, X.; Ye, C. The integration of new-type urbanization and rural revitalization strategies in China: Origin, reality and future trends. Land 2021, 10, 207. [Google Scholar] [CrossRef] [Scilit]
- Ye, Q.; Qijiao, S.; Xiaofan, Z.; Shiyong, Q.; Lindsay, T.; Qin, C.; Jian, L. China’s New Urbanisation Opportunity: A Vision for the 14th Five-Year Plan; Coalition for Urban Transitions: London, UK, 2020. [Google Scholar]
- Su, X.; Fan, Y.; Wen, C. Systematic coupling and multistage interactive response of urban land use efficiency and ecological environment quality. J. Environ. Manag. 2024, 365, 121584. [Google Scholar] [CrossRef] [Scilit]
- Wu, J.; Sun, W. Regional integration and sustainable development in the Yangtze River Delta, China: Towards a conceptual framework and research agenda. Land 2023, 12, 470. [Google Scholar] [CrossRef] [Scilit]
- Zhang, Y.; Zhao, F.; Zhang, J.; Wang, Z. Fluctuation in the transformation of economic development and the coupling mechanism with the environmental quality of resource-based cities: A case study of Northeast China. Resour. Policy 2021, 72, 102128. [Google Scholar] [CrossRef] [Scilit]
- Liang, W.; Yang, M. Urbanization, economic growth and environmental pollution: Evidence from China. Sustain. Comput. Inform. Syst. 2019, 21, 1–9. [Google Scholar] [CrossRef] [Scilit]
- Yao, X.; Chen, Y.; Zhang, Q.; Mou, Z.; Yao, X.; Ou, C. Assessment of the urban expansion and its impact on the eco-environment—A case study of Hefei municipal area. Sustainability 2022, 14, 10613. [Google Scholar] [CrossRef] [Scilit]
- Liu, X.; Xu, H.; Zhang, M. The effects of urban expansion on carbon emissions: Based on the spatial interaction and transmission mechanism. J. Clean. Prod. 2024, 434, 140019. [Google Scholar] [CrossRef] [Scilit]
- Fan, X.; Zhou, Y.; Xie, Q. Performance evaluation, environmental regulation, and urban land green use efficiency: Evidence from China. Environ. Prog. Sustain. Energy 2023, 42, e14120. [Google Scholar] [CrossRef] [Scilit]
- Aghajani, H.; Sarkari, F.; Borhani, M. Coupling coordination analysis between urbanization and ecology in Iran. Front. Urban Rural Plan. 2024, 2, 5. [Google Scholar] [CrossRef] [Scilit]
- Chen, R.; Chen, Y.; Lyulyov, O.; Pimonenko, T. Interplay of urbanization and ecological environment: Coordinated development and drivers. Land 2023, 12, 1459. [Google Scholar] [CrossRef] [Scilit]
- Li, X.; Fang, B.; Yin, M.; Jin, T.; Xu, X. Multi-dimensional urbanization coordinated evolution process and ecological risk response in the Yangtze River Delta. Land 2022, 11, 723. [Google Scholar] [CrossRef] [Scilit]
- Shan, L.; Jiang, Y.; Liu, C.; Wang, Y.; Zhang, G.; Cui, X.; Li, F. Exploring the multi-dimensional coordination relationship between population urbanization and land urbanization based on the MDCE model: A case study of the Yangtze River Economic Belt, China. PLoS ONE 2021, 16, e0253898. [Google Scholar] [CrossRef] [Scilit]
- National Development and Reform Commission of China. National New-Type Urbanization Plan (2014–2020). Available online: https://www.ndrc.gov.cn/fggz/fzzlgh/gjfzgh/201404/t20140411_1190354.html (accessed on 6 April 2026).
- Chen, H.; Liu, L.; Wang, L.; Zhang, X.; Du, Y.; Liu, J. Key indicators of high-quality urbanization affecting eco-environmental quality in emerging urban agglomerations: Accounting for the importance variation and spatiotemporal heterogeneity. J. Clean. Prod. 2022, 376, 134087. [Google Scholar] [CrossRef] [Scilit]
- European Environment Agency. Urban Sustainability in Europe—Avenues for Change; EEA Report No. 06/2021; European Environment Agency: Copenhagen, Denmark, 2021; Available online: https://www.eea.europa.eu/en/analysis/publications/urban-sustainability-in-europe-avenues (accessed on 24 March 2026).
- Lei, Y.; Xiao, Y.; Wang, F.; Wang, R.; Huang, H. Investigation on the complex relationship between urbanization and eco-efficiency in urban agglomeration of China: The case study of Chengdu-Chongqing urban agglomeration. Ecol. Indic. 2024, 159, 111704. [Google Scholar] [CrossRef] [Scilit]
- Liu, S.; Wu, P. Coupling coordination analysis of urbanization and energy eco-efficiency: A case study on the Yangtze River Delta Urban Agglomeration. Environ. Sci. Pollut. Res. 2023, 30, 63975–63990. [Google Scholar] [CrossRef] [Scilit]
- Dong, Q.; Zhong, K.; Liao, Y.; Xiong, R.; Wang, F.; Pang, M. Coupling coordination degree of environment, energy, and economic growth in resource-based provinces of China. Resour. Policy 2023, 81, 103308. [Google Scholar] [CrossRef] [Scilit]
- Zhang, Y.; Khan, S.U.; Swallow, B.; Liu, W.; Zhao, M. Coupling coordination analysis of China’s water resources utilization efficiency and economic development level. J. Clean. Prod. 2022, 373, 133874. [Google Scholar] [CrossRef] [Scilit]
- Chen, J.; Pan, L. Impact of the coupling coordination degree of human capital and infrastructure on high-quality economic development: Empirical evidence from Chinese cities. Sustainability 2024, 16, 8905. [Google Scholar] [CrossRef] [Scilit]
- Zhang, B.; Hu, X.; Li, B.; Wu, P.; Cai, X.; Luo, Y.; Deng, X.; Jiang, M. A groundwater quality assessment model for water quality index: Combining principal component analysis, entropy weight method, and coefficient of variation method for dimensionality reduction and weight optimization, and its application. Water Environ. Res. 2024, 96, e11155. [Google Scholar] [CrossRef] [Scilit]
- Wu, R.M.; Zhang, Z.; Yan, W.; Fan, J.; Gou, J.; Liu, B.; Gide, E.; Soar, J.; Shen, B.; Fazal-E-Hasan, S.; et al. A comparative analysis of the principal component analysis and entropy weight methods to establish the indexing measurement. PLoS ONE 2022, 17, e0262261. [Google Scholar] [CrossRef] [Scilit]
- Wang, S.; Cui, Z.; Lin, J.; Xie, J.; Su, K. The coupling relationship between urbanization and ecological resilience in the Pearl River Delta. J. Geogr. Sci. 2022, 32, 44–64. [Google Scholar] [CrossRef] [Scilit]
- Fu, L.; Liu, B.; Zhu, Z.; Cao, J.; Sun, C.; Yu, Z. Analysis of the coupling coordinated development and evolutionary trend of digital economy and ecological environment. Front. Environ. Sci. 2022, 10, 1006354. [Google Scholar] [CrossRef] [Scilit]
- Cao, Y.; Wei, J. Coupling coordination and interactive effects of new urbanization efficiency and eco-efficiency—A case study of Fujian Province. PLoS ONE 2024, 19, e0292921. [Google Scholar] [CrossRef] [Scilit] [PubMed]
- Patel, J.B.; Raval, Z. The impacts of urbanization on ecological systems: A comprehensive study of the complex challenges arising from rapid urban growth. Res. Rev. J. Indian Knowl. Syst. 2024, 1, 1–10. [Google Scholar] [CrossRef] [Scilit]
- Liu, X.; Xin, Y. Exploring the characteristics and driving factors of coupling coordination of regional sustainable development: Evidence from China’s 31 provinces. Environ. Sci. Pollut. Res. 2022, 29, 71075–71099. [Google Scholar] [CrossRef] [Scilit]
- Su, J.; Shen, T.; Jin, S. Ecological efficiency evaluation and driving factor analysis of the coupling coordination of the logistics industry and manufacturing industry. Environ. Sci. Pollut. Res. 2022, 29, 62458–62474. [Google Scholar] [CrossRef] [Scilit]
- Bao, W.; Chen, B.; Yan, M. Analysis of multi-factor dynamic coupling and government intervention level for urbanization in China: Evidence from the Yangtze River Economic Belt. Economics 2024, 18, 20220065. [Google Scholar] [CrossRef] [Scilit]
- Hou, X.; Zhang, D.; Fu, L.; Zeng, F.; Wang, Q. Spatio-temporal evolution and influencing factors of coupling coordination degree between urban-rural integration and digital economy. Sustainability 2023, 15, 9718. [Google Scholar] [CrossRef] [Scilit]
- Zhai, D.; Zhang, X.; Zhuo, J.; Mao, Y. Driving the evolution of land use patterns: The impact of urban agglomeration construction land in the Yangtze River Delta, China. Land 2024, 13, 1514. [Google Scholar] [CrossRef] [Scilit]
- Liu, H.; Li, X.; Zheng, S. Balancing economic growth and environmental conservation: Assessing supportive policies in resources-based cities in China. Systems 2024, 12, 521. [Google Scholar] [CrossRef] [Scilit]
- Wang, H.; Sun, X.; Lu, X. Regional integration, technological innovation, and digital economy: Evolution and evidence of the decarbonization driving forces in the Yangtze River Delta. Sustainability 2025, 17, 5463. [Google Scholar] [CrossRef] [Scilit]
- Ru, J.; Li, J.; Gan, L.; Sun, J.; Wang, S. Urbanization, digital-intelligent integration, and carbon productivity: Spatiotemporal dynamics in the middle reaches urban agglomeration of the Yellow River. Land 2025, 14, 2087. [Google Scholar] [CrossRef] [Scilit]
- Chang, Q.; Sha, Y.; Chen, Y. The coupling coordination and influencing factors of urbanization and ecological resilience in the Yangtze River Delta urban agglomeration, China. Land 2024, 13, 111. [Google Scholar] [CrossRef] [Scilit]
- Zhang, Y.; Fang, Z.; Xie, Z. Study on the coupling coordination between ecological environment and high-quality economic development in urban agglomerations in the middle reaches of the Yangtze River. Int. J. Environ. Res. Public Health 2023, 20, 3612. [Google Scholar] [CrossRef] [Scilit]
- Zhang, Q.; Qu, Y.; Zhan, L. Great transition and new pattern: Agriculture and rural area green development and its coordinated relationship with economic growth in China. J. Environ. Manag. 2023, 344, 118563. [Google Scholar] [CrossRef] [Scilit]
- Chen, P.; Shi, X. Dynamic evaluation of China’s ecological civilization construction based on target correlation degree and coupling coordination degree. Environ. Impact Assess. Rev. 2022, 93, 106734. [Google Scholar] [CrossRef] [Scilit]
- Nikolai, R.; Kriesi, I.; Leemann, R.J. Regional disparities in national education: Origins, governance, and consequences. Educ. Sci. 2022, 12, 319. [Google Scholar] [CrossRef] [Scilit]
- Geng, Y.; Huang, F. Coupling coordination between higher education and environmental governance: Evidence of western China. PLoS ONE 2022, 17, e0271994. [Google Scholar] [CrossRef] [Scilit]
- Joseph, E.; Shyamala, M.; Nadig, R. Understanding public-private partnerships in the modern era. In Public Private Partnership Dynamics for Economic Development; IGI Global Scientific Publishing: Hershey, PA, USA, 2025; pp. 1–26. [Google Scholar] [CrossRef] [Scilit]
- Xu, X.; Wang, M.; Wang, M.; Yang, Y.; Wang, Y. The coupling coordination degree of economic, social and ecological resilience of urban agglomerations in China. Int. J. Environ. Res. Public Health 2022, 20, 413. [Google Scholar] [CrossRef] [Scilit]
- Xie, Y.; Liu, H. Coupling coordinated analysis of digital village construction, economic growth and environmental protection in rural China. Pol. J. Environ. Stud. 2024, 33, 5925–5941. [Google Scholar] [CrossRef] [Scilit] [PubMed]
- Qi, W.; Razak, M.F.A.; Jusoh, S.; Wang, H. Coupling coordination and influencing factors between environmental regulation and high-quality economic development in China. Discov. Sustain. 2025, 7, 104. [Google Scholar] [CrossRef] [Scilit]
- An, S.; Zhang, S.; Hou, H.; Zhang, Y.; Xu, H.; Liang, J. Coupling coordination analysis of the ecology and economy in the Yellow River Basin under the background of high-quality development. Land 2022, 11, 1235. [Google Scholar] [CrossRef] [Scilit]
- Su, Y.; Jiang, Q.; Khattak, S.I.; Ahmad, M.; Li, H. Do higher education R&D expenditures affect environmental sustainability? New evidence from Chinese provinces. Environ. Sci. Pollut. Res. 2021, 28, 66656–66676. [Google Scholar] [CrossRef] [Scilit]
- Yang, C.; Fang, Z. The impact of education expenditure on environmental innovation. Heliyon 2024, 10, e32446. [Google Scholar] [CrossRef] [Scilit] [PubMed]
- Latief, R.; Sattar, U.; Javeed, S.A.; Gull, A.A.; Pei, Y. The environmental effects of urbanization, education, and green innovation in the union for mediterranean countries: Evidence from quantile regression model. Energies 2022, 15, 5456. [Google Scholar] [CrossRef] [Scilit]
- Fang, J.; Gozgor, G.; Mahalik, M.K.; Mallick, H.; Padhan, H. Does urbanisation induce renewable energy consumption in emerging economies? The role of education in energy switching policies. Energy Econ. 2022, 111, 106081. [Google Scholar] [CrossRef] [Scilit]
- Zou, W.; Xu, L. Dynamic development characteristics and driving factors of high quality development level in China’s five major urban agglomerations. Chin. Geogr. Sci. 2024, 34, 777–790. [Google Scholar] [CrossRef] [Scilit]
- Yang, Z.; Yu, H. Unleashing the power of energy saving and emission reduction fiscal policy: Balancing urban ecological resilience and efficiency. Energy 2025, 327, 136478. [Google Scholar] [CrossRef] [Scilit]
- Huang, X.; Shi, X. Functional division of urban agglomerations and regional coordinated development: An empirical study based on panel data of urban agglomerations in China. Ann. Reg. Sci. 2025, 74, 70. [Google Scholar] [CrossRef] [Scilit]

Disclaimer/Publisher’s Note: The statements, opinions and data contained in all publications are solely those of the individual author(s) and contributor(s) and not of MDPI and/or the editor(s). MDPI and/or the editor(s) disclaim responsibility for any injury to people or property resulting from any ideas, methods, instructions or products referred to in the content. |
© 2026 by the authors. Licensee MDPI, Basel, Switzerland. This article is an open access article distributed under the terms and conditions of the Creative Commons Attribution (CC BY) license.