


Abstract
In biodiversity-rich borderlands, some humanitarian settlements are rapidly expanding. This creates a profound conflict: refugees need a place to live, and ecosystems need protection. However, how settlement growth spatially affects the ecology surrounding protected areas remains understudied. This study takes as an example the city of Teknaf in Bangladesh, one of the world’s largest refugee gathering areas, to explore how settlement expansion changes the ecological structure and function of protected area boundaries, with a focus on two questions: Are there critical spatial thresholds? What is the role of climate feedback mechanisms? We build an analysis framework that integrates several types of data: multitemporal remote sensing images, land-use changes, ecological indicators (NDVI, LST, HQ), landscape pattern indices, gradient analysis, and 2036 simulations based on the business-as-usual scenario. Through this framework, we identify the ecological threshold at the junction of settlements and forests within the Teknaf Wildlife Sanctuary. The expansion of settlements has turned the landscape, which was originally dominated by vegetation, into fragmented hard patches. At the same time, the habitat is severely degraded, and heat stress intensifies. Notably, a critical transition zone emerges at approximately 300–500 m from the protected area boundary, where landscape fragmentation intensifies, habitat quality declines, and heat stress reaches its peak, highlighting a spatial hotspot of ecological vulnerability. If there are no intervention measures, future scenario simulations show that the continued expansion of settlements will only isolate protected areas and accelerate ecological degradation. On the basis of gradient analysis for spatial diagnosis, we propose a zoning management framework and regeneration landscape strategy with the direct goal of coordinating ecological protection and humanitarian needs in crisis-prone border areas.
1. Introduction
Given the escalating global refugee crisis and the ongoing impacts of climate change, land-use conflicts at the boundaries of nature reserves have become increasingly prominent [1]. According to the United Nations High Commissioner for Refugees (UNHCR), 117.3 million people worldwide are still in a state of forced displacement as of 2025 [2]. Many of these refugee settlements are located on the edge of protected areas, leading to the degradation of the surrounding ecological environment. The 1994 influx of Rwandan refugees led to Virunga National Park in the Democratic Republic of the Congo being placed on the list of world heritage sites in Danger in the same year, mainly because of large-scale deforestation [3]. In Tanzania, the construction of Mtendeli refugee camps initially cleared nearly half of the surrounding forest vegetation, exacerbating soil erosion and reducing soil fertility [4]. Subsequently, local farmers began clearing new farmland near the Moyowosi Game Reserve, where shifting cultivation practices drove the rapid expansion of agricultural activities until the camp was closed in 2021 [4]. Additionally, refugees’ dependence on firewood intensified. It evolved from collecting deadwood within a 4 km radius of the camp to illegal harvesting 10 to 12 km away, killing trees by ring-barking [4]. In the Bidibidi settlement in Uganda, most refugee families still use traditional stoves that require firewood, consuming approximately 20.5 kg of firewood per day and a total of 347,000 tons per year [5]. It is estimated that at this consumption rate, the forest resources in the 5 km buffer zone around the settlement zone will be depleted within three years [5]. Such humanitarian settlements have had a profound impact on the natural environment and surrounding communities, not only exacerbating deforestation and habitat fragmentation but also leading to shortages of food and drinking water resources. Therefore, they exacerbate tensions between refugee groups and local communities in terms of resource competition. In the current context of global warming and frequent extreme weather events, such ecological pressures may further intensify, posing even more severe governance challenges to fragile border-protected areas.
In 2017, nearly 700,000 Rohingya refugees entered Cox’s Bazar, Bangladesh, causing a sudden increase in humanitarian and ecological pressures [6]. Unlike conventional urban growth, which is usually gradual and guided by planning and infrastructure provision, refugee settlement expansion is often sudden, spatially concentrated, and weakly regulated. In Teknaf, most expansion occurred within a few years after 2017 and was driven by immediate shelter and resource needs, causing rapid encroachment along the boundary between the municipality and the Teknaf Wildlife Sanctuary (TWS). Teknaf Municipality partly overlaps and directly borders the TWS [7], which has been designated an ecological critical area (ECA) and serves as an important migration corridor for endangered species such as the Asian elephant (Elephas maximus) [8,9]. The high population density and excessive dependence on forest resources have exceeded the local ecological carrying capacity. The continuous exploitation of resources, including firewood collection, illegal logging [10], land encroachment [11], and the overexploitation of groundwater [12], is accelerating habitat degradation and fragmentation [13], putting enormous ecological pressure on protected areas and surrounding communities.
Teknaf is an extreme case of the expansion of humanitarian settlements and the governance of protected area boundaries [14], with significant analytical value. The Kutupalong Balukhali settlement quickly became the world’s largest refugee camp in the months following the 2017 influx of refugees, with over 1 million displaced persons concentrated in 33 camps covering an area of approximately 24 km2. This density is extremely rare in the global refugee reception landscape [2,15]. Previous studies have shown that the accelerated growth of the population at the edge of protected areas is a global trend [16]. Teknaf represents the most extreme manifestation of this trend: the speed of expansion and spatial concentration lead to the breaching of ecological thresholds, that is, the critical distance at which disturbance effects are rapidly intensified, much faster than in conventional urbanization scenarios [17]. More importantly, the administrative boundary of Teknaf Municipality is directly adjacent to TWS, forming a spatially clear transition zone for the forest–settlement interface and providing an irreplaceable research interface across the interference gradient. The significance of Teknaf transcended local emergencies: the coupling dynamics between rapid settlement encroachment, enhanced edge effects, and ecological isolation revealed in this study exhibit highly consistent structural features with existing records in Uganda [5], Tanzania [4], and Borneo [18]. This indicates that the forest–settlement interface zones in globally displaced areas face similar governance challenges and lack spatial diagnosis.
Despite growing academic attention given to the ecological changes caused by refugees, existing research in Teknaf and similar regions still has limitations in terms of analysis. Related research has evolved from early records of LULC changes [19,20,21] to the quantification of ecological consequences: Hasan et al. [22] evaluated the spatiotemporal patterns of forest degradation and ecosystem function loss in Cox’s Bazar Teknaf Peninsula; Sarkar et al. [23] estimated that the value of forest ecosystem services decreased by 21.97% between 2017 and 2021; and Karmakar et al. [24] and Ahmed et al. [25] revealed the significant driving effect of LULC changes caused by refugee camp expansion on surface temperature. At the landscape scale, Mitra et al. [15] reported that between 2016 and 2024, forest cover within refugee camp boundaries decreased by 54.6%, settlements expanded by 598.5%, and the patch density and fragmentation index increased. In addition, qualitative research has also begun to highlight the institutional weakness of the lack of spatial planning tools [26]. However, the above research has three limitations in common. First, existing studies have analyzed ecological changes at the camp or district scale, treating the settlement protected area interface as a homogeneous boundary rather than a transitional zone of spatial heterogeneity. There is no research investigating how interference effects vary with distance from the TWS boundary, nor has a spatial threshold for enhancing the emergency response been identified. Second, both landscape fragmentation indicators and ecosystem function indicators are independently evaluated rather than jointly analyzed within a unified distance-gradient framework. Therefore, the coupling mechanism between structural fragmentation and functional degradation at the Teknaf interface has not yet been characterized. Third, evidence of ecological destruction has not yet been connected to differentiated spatial planning interventions, and prospective studies that effectively integrate spatial diagnosis with actionable regenerative landscape strategies are still lacking [27].
Accordingly, this study addresses three related questions:
- (1)
- How does the expansion of refugee settlements reshape the landscape structure and ecological functions at the forest–settlement interface zone?
- (2)
- Is there a critical spatial threshold beyond which fragmentation, heat stress, and habitat degradation significantly intensify?
- (3)
- Under the business-as-usual (BAU) scenario, how will future settlement expansion further expose these threshold areas to ecological risks? What regeneration planning strategies can alleviate these impacts?
To answer these questions, this study focuses on the forest–settlement interface zone between the city of Teknaf and the Teknaf Wildlife Sanctuary (TWS). By integrating multitemporal LULC analysis, ecological indicators, landscape indicators, gradient analysis, and future scenario simulations, (1) the spatiotemporal impacts of settlement expansion on habitat quality, surface temperature, and vegetation status from 2016 to 2024 can be quantified; (2) the ecological threshold and structural functional coupling response at the forest–settlement interface zone can be identified; and (3) ecological restoration planning strategies under the BAU scenario in 2036 can be developed.
2. Materials and Methods
2.1. Study Area
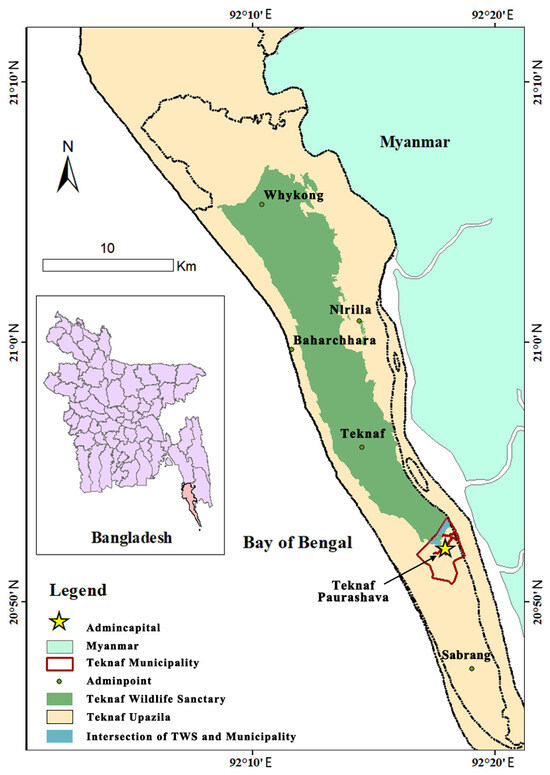
Teknaf Municipality (20°52′ N, 92°17′ E) is located at the southeastern tip of Bangladesh and is the administrative center of Teknaf Upazila. It covers an area of 8.45 km2 and borders the Naf River to the east (next to Myanmar) and the Teknaf Wildlife Sanctuary (TWS) to the west (Figure 1). As a special zone at the junction of city and nature, our research focuses on this municipality.
Figure 1.
Location map of the research area, showing the spatial position between Teknaf Municipality and the TWS in Bangladesh.
The Teknaf Wildlife Sanctuary (TWS) covers 11,615 hm of the Teknaf Peninsula, which was originally designated a game reserve in 1983 under the Bangladesh Wildlife (Preservation) (Amendment) Act of 1974 and was upgraded to Wildlife Sanctuary status in December 2009. The Peninsula was declared an ecologically critical area (ECA) in 1999 under the Bangladesh Environment Conservation Act (BECA, 1995), reflecting its status as a biodiversity hotspot and its exposure to serious human threats.
The terrain here is steep and runs north–south, with an altitude of up to 700 m. It borders the Bay of Bengal to the west and a narrow, low strip along the Naf River to the east [28]. The climate is a humid tropical monsoon climate, with temperatures ranging from 15 °C to 32 °C and an annual rainfall of 4000 mm. The region is susceptible to hurricanes, flash floods, and seasonal landslides. Tropical mixed evergreen forests grow within protected areas and are historically dominated by plants of the family Dipterocarpus, including Dipterocarpus turbinatus, D. alatus, Hopea odorata, and Anisoptera scaphula [28]. In addition, mangrove formations and dune ecosystems are also distributed within the protected area, with 535 species of angiosperms belonging to 103 families recorded. The protected area is home to 27 species of amphibians, 54 species of reptiles, 243 species of birds, and 43 species of mammals, and is an important ecological corridor for Asian elephants (Elephas maximus) [9,13].
After the influx of Rohingya refugees in 2017, settlements rapidly expanded, resulting in an increase of nearly 600% in the built-up area within the camps [15], causing a series of ecological impacts: habitat fragmentation, obstruction of Asian elephant migration corridors, depletion of groundwater, and seawater intrusion [29]. A field survey conducted in May 2025 confirmed severe freshwater shortages, with residents relying solely on polluted ponds and only 15 min of daily pipeline water supply—a situation exacerbated by the increasingly severe heat island effect and the risk of sudden monsoon floods [24,30].
2.2. Data Sources and Processing
To capture the landscape dynamics surrounding the 2017 Rohingya influx, we define three temporal phases: a preinflux phase (2016), a postinflux phase (2018, 2020, 2024), and a future scenario (2036). Multitemporal satellite imagery and field research data (Table 1) were integrated to support the analysis of LULC dynamics and the derivation of key environmental indicators, including habitat quality (HQ), the normalized difference vegetation index (NDVI), and land surface temperature (LST).
Table 1.
Data types used in the study.
All the remote sensing data were processed via the Google Earth Engine (GEE) platform (https://code.earthengine.google.com/, accessed on 1 March 2026). For the postinflux phase (2018, 2020, 2024), Sentinel-2 MSI Level-2A imagery [31] was used for LULC classification and NDVI calculation. For LST retrieval, Landsat 8 OLI/TIRS Collection 2 Level 2 products (30 m) were employed, with thermal bands converted from Kelvin to Celsius [24,32,33]. To ensure temporal consistency and minimize cloud interference, we used a median composite approach for all images acquired during the dry season (December to March) [34]. Preprocessing included automated cloud masking based on the scene classification layer (SCL) for Sentinel-2 and the QA_PIXEL band for Landsat. To supplement satellite observations, we conducted field investigations and recorded key landscape features, such as the forest–settlement interface zone and forest erosion frontiers, from 2024 to 2025.
2.3. Methods
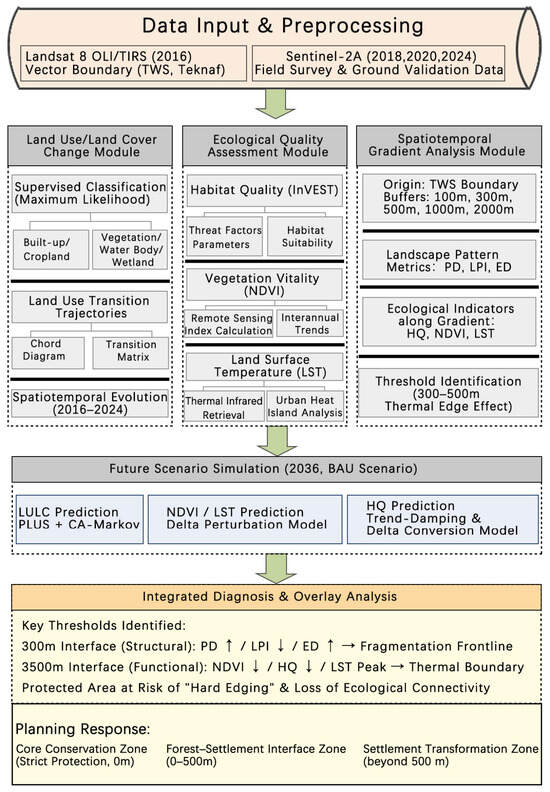
The rapid expansion of settlements affects protected areas through processes such as land conversion, landscape fragmentation, and the degradation of ecological function. These processes are not evenly distributed but present a clear spatial gradient along the forest–settlement interface zone and are concentrated within a specific distance range. To identify the most significant spatial interface of ecological degradation, we integrate land-use classification, landscape indices, ecological indicators, gradient analysis, and future scenario simulation into a unified analysis framework (Figure 2). Among them, the landscape index is used to quantify fragmentation and connectivity at the structural level, whereas the NDVI, LST, and HQ characterize vegetation status, the thermal environment, and ecosystem function, respectively. The combination of structural and functional indicators aims to test whether landscape fragmentation is coupled with ecological function degradation within the same spatial interval. Gradient analysis transforms traditional landscape statistics into continuous profiles that vary along distance, thereby identifying spatial thresholds where significant changes in ecological response occur.
Figure 2.
Research technology roadmap. Arrows (→) indicate direction of process flow or causal relationships; upward (↑) and downward (↓) arrows indicate increase or decrease of an indicator.
In addition, the 2036 land-use simulation assesses whether the identified key threshold areas will continue to face pressure from new construction, thereby further exacerbating ecological degradation. The methodological framework serves a single goal: to identify the key interface where ecological degradation and humanitarian intervention require the most synergistic action.
2.3.1. LULC Classification and Transition Analysis
Our research utilized multitemporal remote sensing data to characterize dynamic changes and transformations of LULC in complex and transitional ecosystems [35]. A random forest (RF) classifier was implemented in GEE to classify landscapes into five categories: built-up, cropland, vegetated area, water body, and wetland. A total of 445 training samples were manually collected through visual interpretation of high-resolution Google Earth images and historical Landsat/Sentinel-2 composite images. The classifier is trained on Sentinel-2 composite images from 2024 and remains consistent at all time stages to ensure the comparability of the classification results.
The accuracy of the classifier is evaluated by dividing the training set/validation set into 70/30 layers. The overall accuracy of the classifier is 80.2%, with a kappa coefficient of 0.73. The classification accuracies of vegetated areas (90.0%) and built-up areas (89.7%) are the highest. The lower accuracy values for water bodies (55.0%) and wetlands (64.7%) may reflect spectral confusion between turbid shallow water, moist soil, and exposed surfaces in coastal environments, which is a common limitation in medium-resolution optical remote sensing [36]. Because vegetated areas and built-up areas are the main variables driving ecological gradient analysis, classification accuracy is considered sufficient to meet the requirements of subsequent analysis.
2.3.2. Multidimensional Ecological Quality Assessment
Ecological quality is evaluated through three indicators: HQ, LST, and NDVI.
- (1)
- Habitat quality: Habitat quality was analyzed via the InVEST module (version 3.18.0) [37] by integrating multitemporal LULC maps (2016–2024) and threat factors, with built-up areas (0.9), roads (0.6), and croplands (0.5), to quantify habitat suitability and degradation levels.
- (2)
- LST and NDVI: These indices are calculated via the GEE platform to capture vegetation vigor and thermal environment variations.
2.3.3. Future Scenario Simulation (2036)
A business-as-usual (BAU) scenario was developed to simulate land-use change in 2036, with the assumption that the historical urbanization trend continues without major intervention.
- (1)
- LULC prediction: On the basis of the CA Markov model [38], we used the PLUS model (version 1.4.2) to simulate future LULC patterns, with transition probabilities and driving factors derived from historical land-use change data from 2016 to 2024.
- (2)
- Ecological indicator prediction (LST and NDVI): Under land-use constraints, we used the delta perturbation model to estimate the future LST and NDVI. First, we applied linear regression to estimate temporal trends for different land-cover types from 2016 to 2024. For pixels that remained unchanged, we extrapolated their future values on the basis of historical trends; for pixels that had changed, we adjusted them on the basis of the average difference caused by land-use transformation. In addition, we applied historical range-based spatial filtering and threshold constraints to reduce outliers and maintain spatial continuity.
- (3)
- Habitat quality prediction: The prediction of future habitat quality is based on simulated LULC patterns in 2036 and habitat conditions in 2024. This prediction takes into account the impact of land-use changes and time-trend adjustments while limiting the values within the historical ecological range to ensure ecological rationality, especially for high-quality habitats.
2.3.4. Spatiotemporal Gradient Analysis of Interface
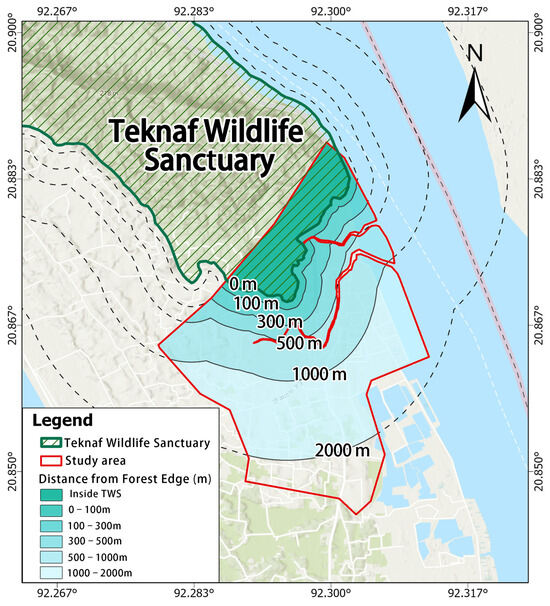
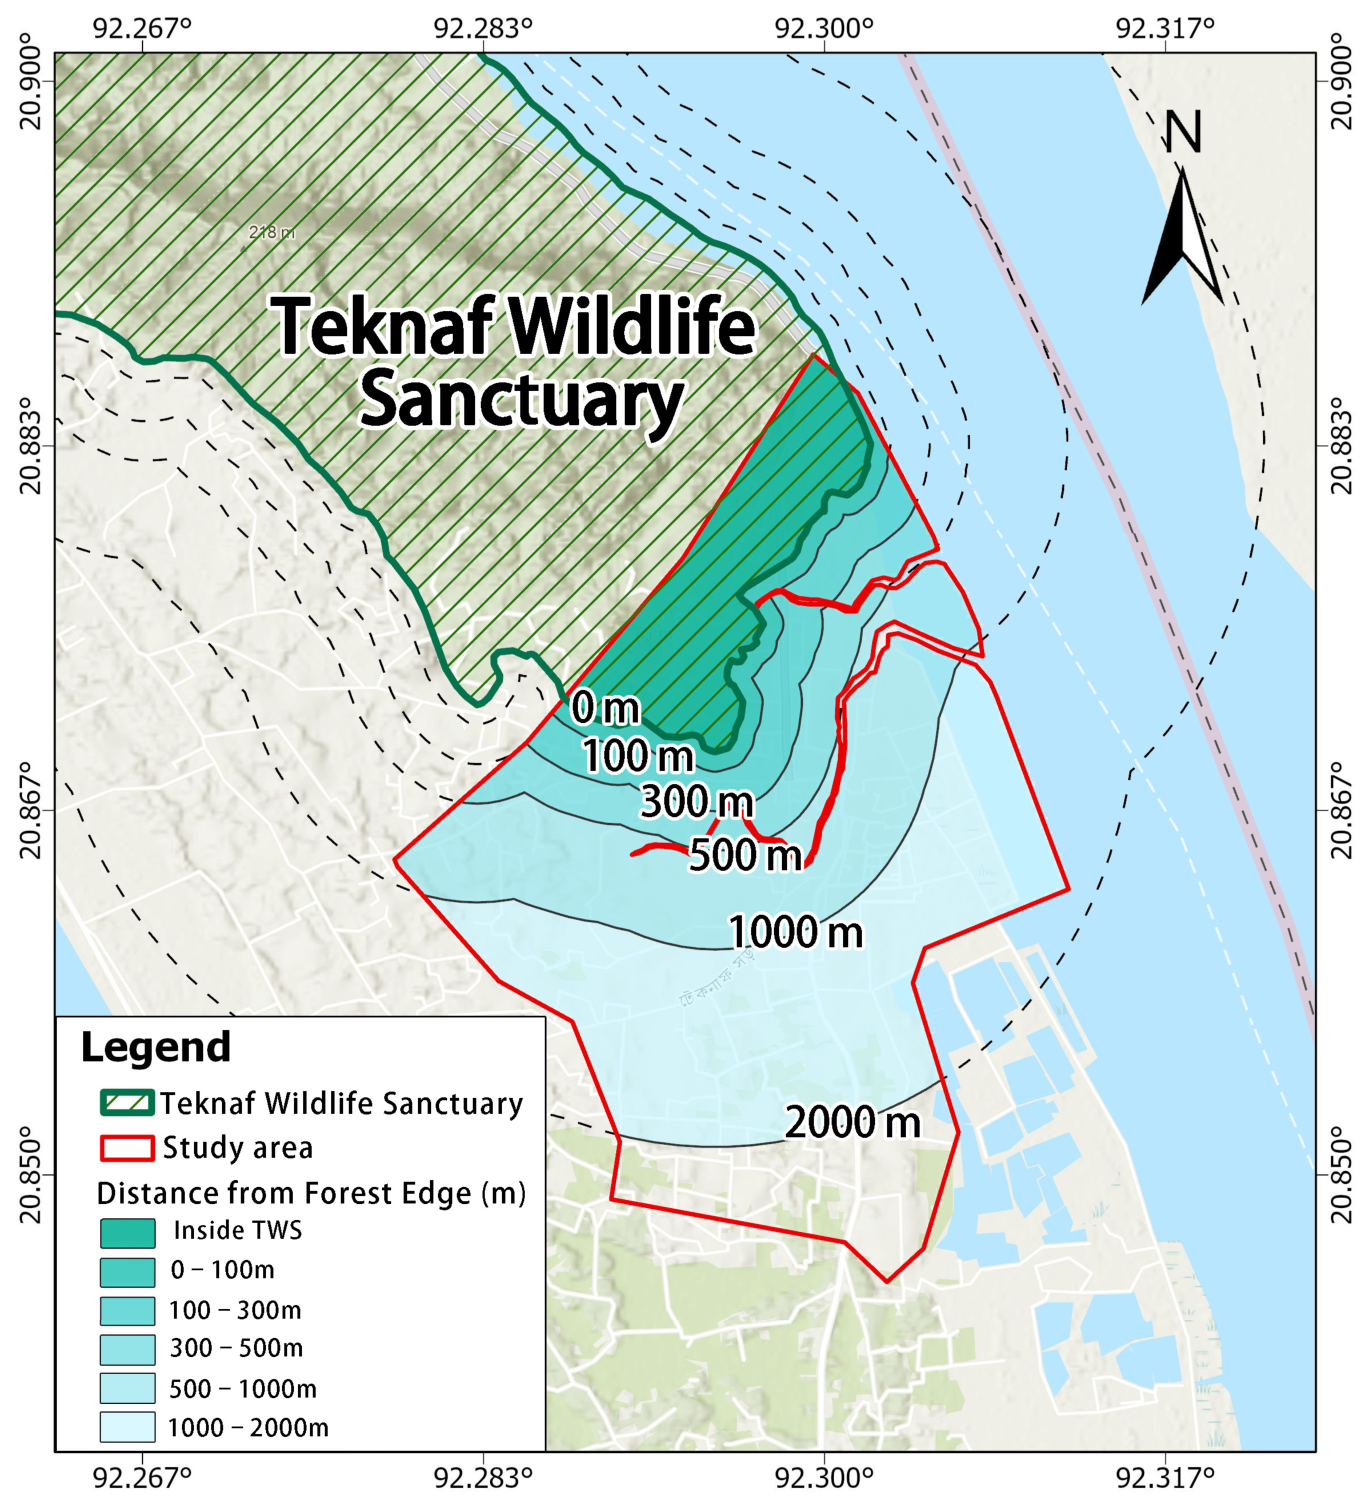
To quantify the spatial decay of anthropogenic disturbances across the forest–settlement interface zone, a gradient analysis was performed using the boundary of the TWS as the reference origin for buffer generation. Multiple concentric buffers were established and extended into Teknaf Municipality at intervals of 100 m, 300 m, 500 m, 1000 m, and 2000 m (Figure 3). This multi-scale design follows the gradient approach documented in a Southeast Asian tropical protected area, where disturbance effects from village boundaries were measured along transects of 200–2000 m [39]; here, we extend the gradient closer to the boundary (100 m) to capture more immediate anthropogenic pressures. The inner intervals (0–300 m) target the near-boundary zone of concentrated anthropogenic pressure, whereas the outer intervals (500–2000 m) extend the analysis to landscape scales relevant for connectivity and spillover assessment [40,41].
Figure 3.
The study area and five buffers from the TWS boundary.
Two categories of indicators were extracted for each buffer zone via zonal statistics. First, three landscape structural indices were computed from the classified LULC maps: patch density (PD), largest patch index (LPI), and edge density (ED), which collectively characterize the degree of fragmentation, connectivity, and boundary complexity within each distance band [42,43]. Second, three ecological condition indicators, HQ, NDVI, and LST, were derived to capture the functional responses of the landscape to anthropogenic pressure [44]. Jointly analyzing structural and functional indicators along distance gradients can identify the spatial range of ecological thresholds and settlement-driven impacts.
3. Results
3.1. Spatiotemporal Dynamics of Land-Use Transitions (2016–2024)
3.1.1. Land-Use Type Change Analysis
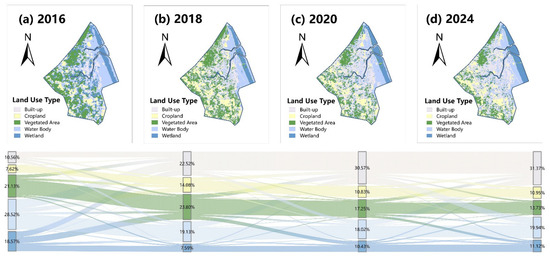
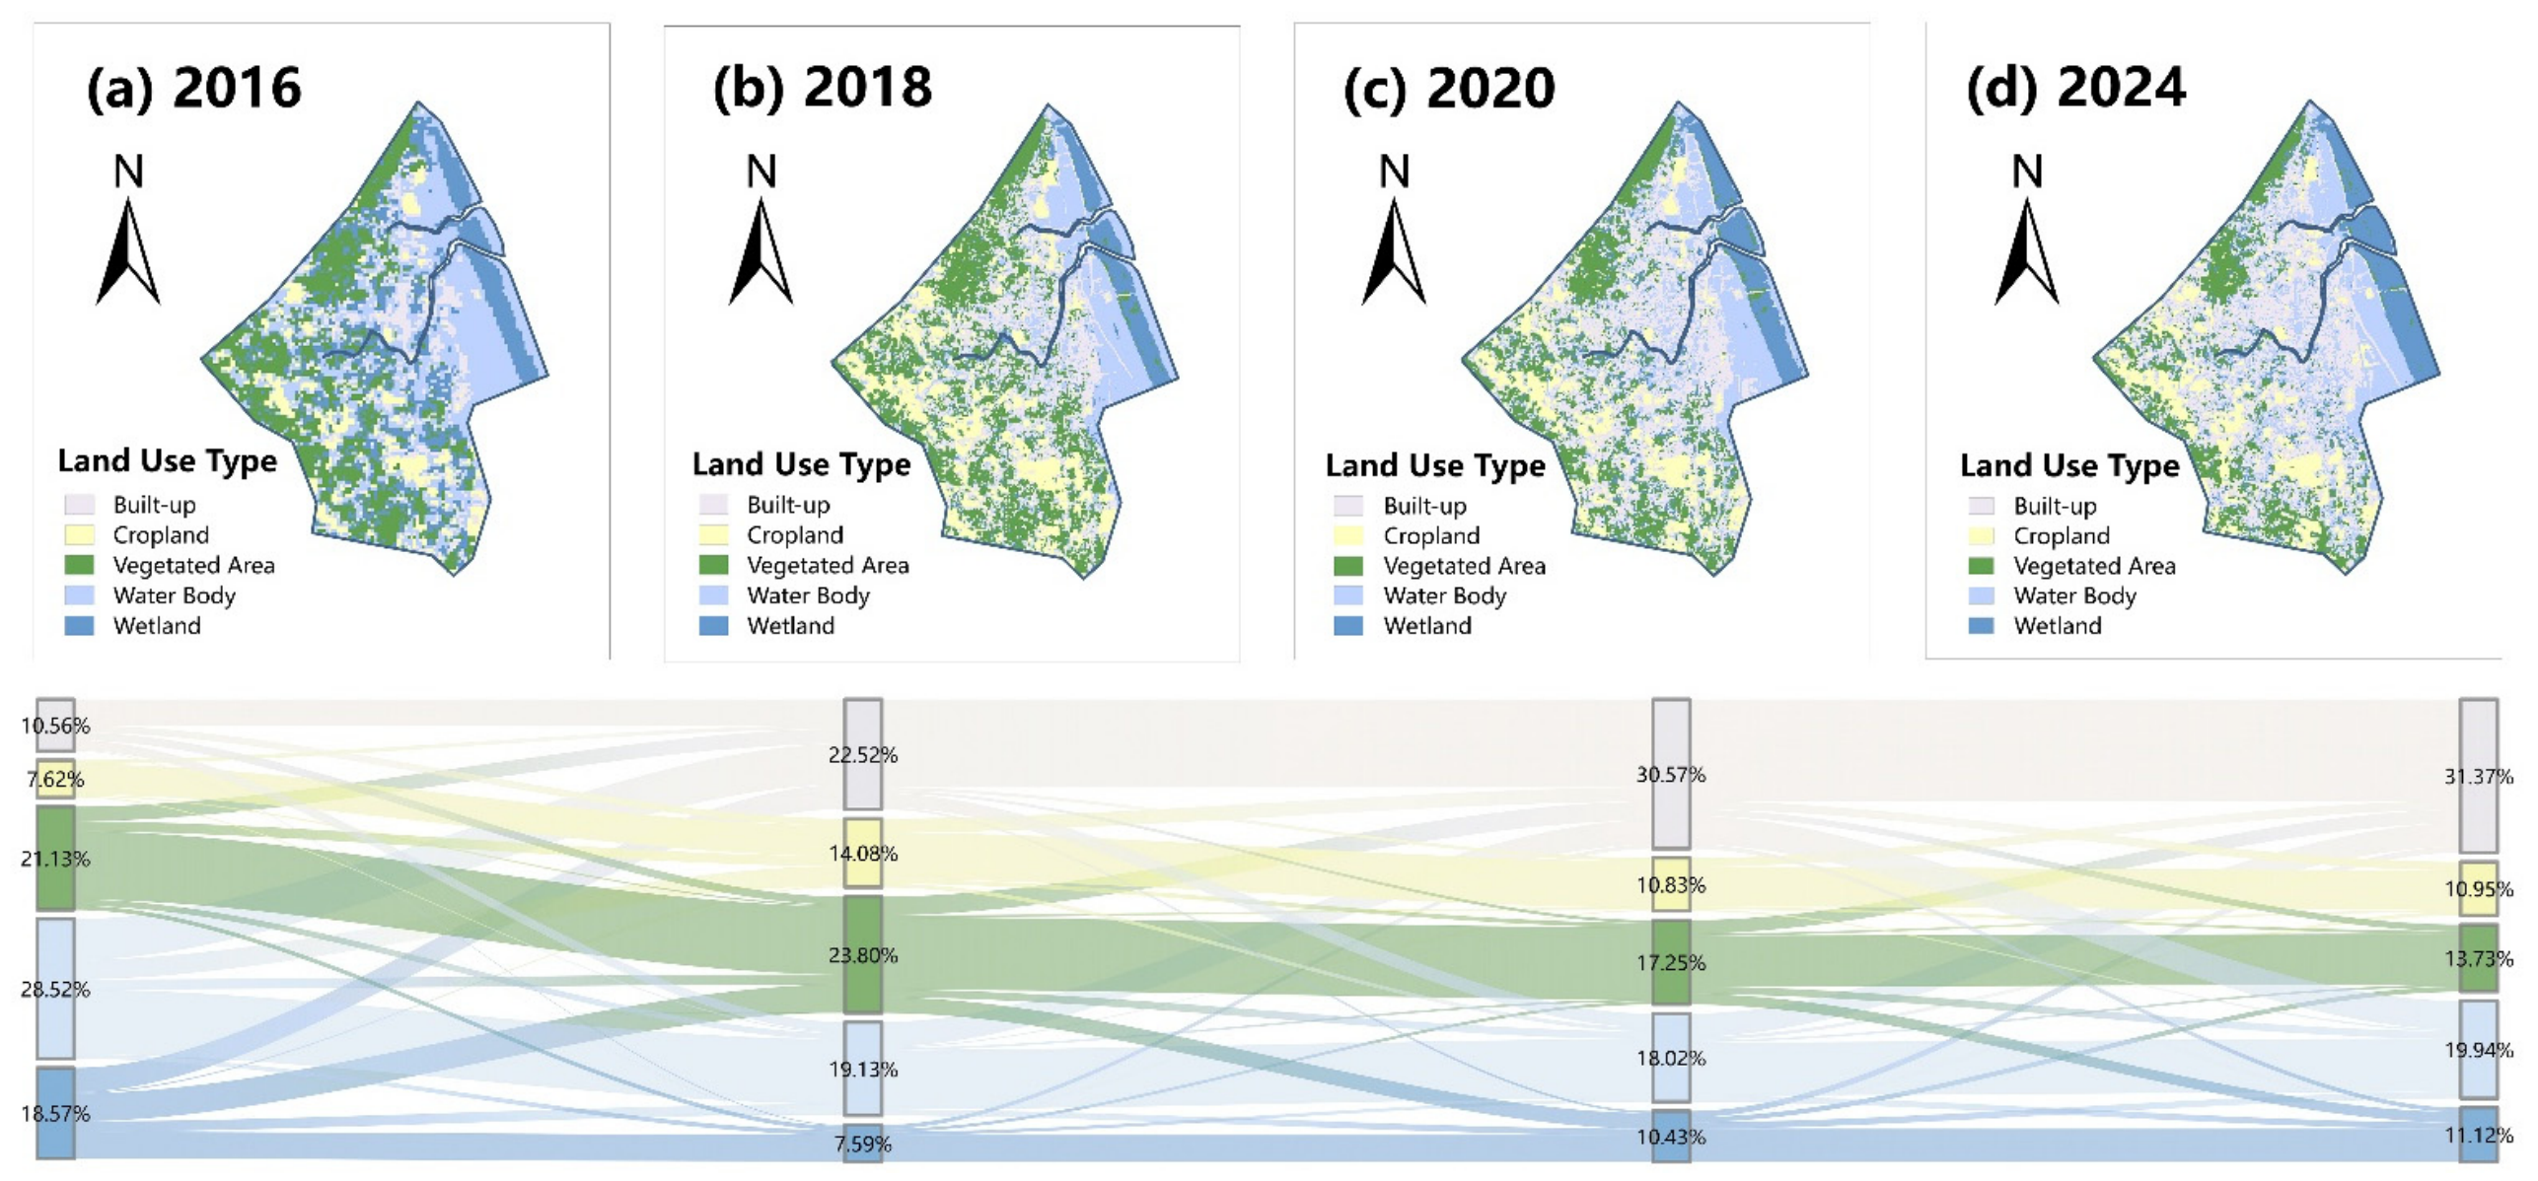
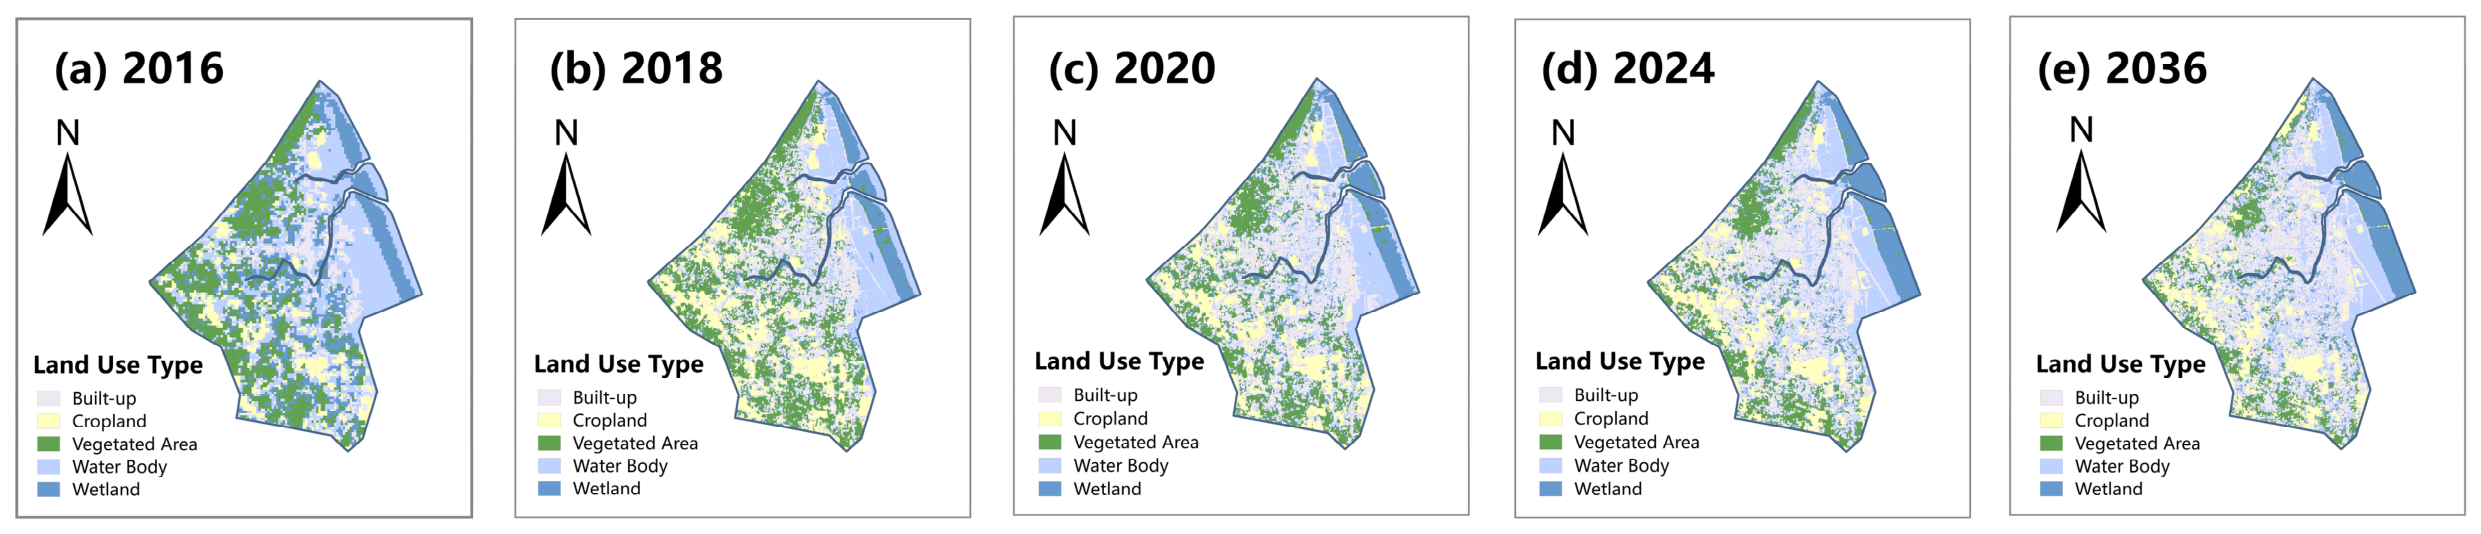
From 2016 to 2024, driven by the influx of events in 2017, the landscape pattern of the study area underwent drastic evolution, characterized by the explosive and sustained expansion of built-up areas at the expense of natural land (Figure 4).
Figure 4.
Spatiotemporal evolution of LULC in Teknaf from 2016 to 2024.
Before the influx in 2016, the area was composed mainly of natural and seminatural landscapes. Water bodies (28.52%), vegetated areas (21.13%), and wetlands (18.57%) dominate the region. At this time, the built-up area accounts for only 10.56%, showing a limited and concentrated spatial distribution, while the proportion of arable land is 7.62%.
By 2018, the landscape pattern had undergone significant reconstruction. The proportion of built-up areas has increased to 22.52%, more than doubling in just two years. The Sankey diagram shows that the rapid urban expansion during this initial period mainly encroached on wetlands (which sharply decreased to 7.59%) and water bodies (which decreased to 19.13%). At the same time, there was a brief increase in croplands (to 14.08%), and the vegetated areas slightly increased to 23.80%.
The period between 2018 and 2024 witnessed sustained urban expansion and ecological degradation. The built-up areas continue to spread rapidly, reaching 30.57% in 2020 and peaking at 31.37% in 2024. During this stage, the vegetated areas experienced sustained and severe degradation, dropping to 17.25% in 2020 and only 13.73% by 2024. The clear transfer of land types indicates that later urban expansion mainly consumed vegetated areas and cultivated land (stable at approximately 10.95%), highlighting the serious and persistent loss of ecological land.
3.1.2. Land-Use Transition Pattern Analysis
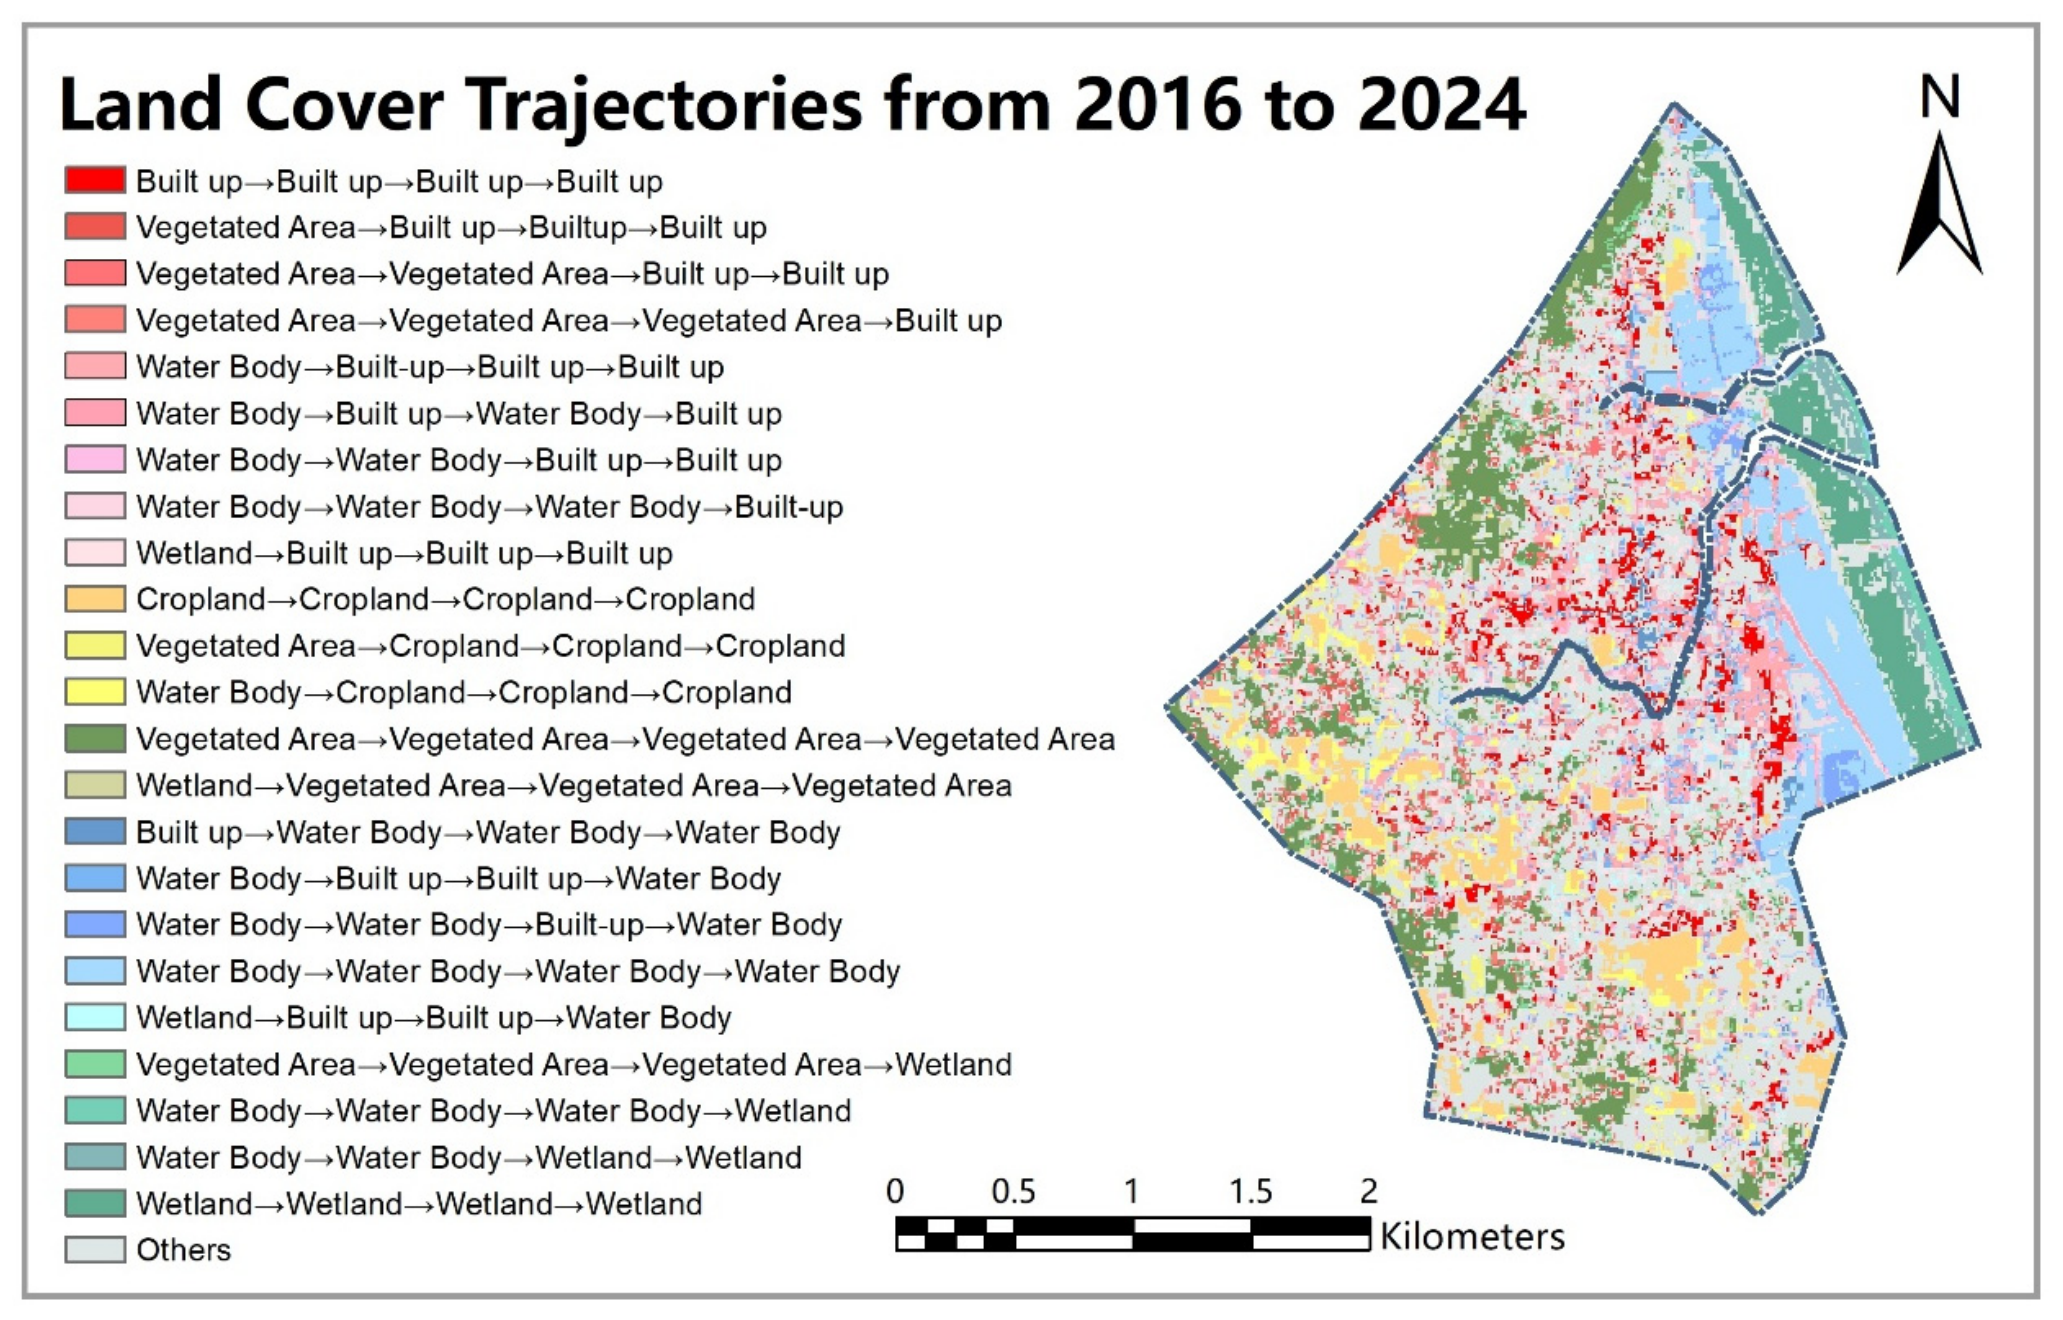
The land cover trajectory map (Figure 5) reveals the complex spatiotemporal pathways of landscape transformation between 2016 and 2024.
Figure 5.
Spatial patterns of land cover transition trajectories (2016–2024) highlighting dominant change pathways.
The most dominant trend of change is the large formation of a hardened zone. The urbanization process expands outwards contiguously from stable, existing settlements (built-up → built-up → built-up → built-up, red), aggressively encroaching on surrounding natural lands. Unlike typical urban growth, the trajectory map reveals that vegetated areas, rather than croplands, became the primary source of urbanization. Trajectories such as Vegetated Area → Built-up → Built-up → Built-up (salmon red) and its delayed variants indicate the continuous clearing of terrestrial vegetation for infrastructure from 2018 onwards.
The eastern and northeastern regions of the research area near rivers have experienced severe degradation of aquatic ecosystems due to landfilling and reclamation. The trajectory of wetland → built-up → built-up → built-up (light pink) indicates that natural wetlands on the outskirts of the city were directly flattened for housing construction after 2016. In addition, agricultural encroachment also confirms the loss of aquatic systems, as shown in the trajectory of water body → cropland → cropland → cropland (yellow). The trajectory of wetland → vegetated area → vegetated area (olive green) further reflects the territorialization and aridification of wetland ecosystems.
The water body dynamics exhibit fluctuations. Trajectories such as Water Body → Built-up → Water Body → Built-up (pink color scheme) or Water Body → Water Body → Built-up → Water Body (blue color scheme) reveal the unstable and repetitive tug of the war process between human reclamation and water recovery.
Overall, the observed growth pattern is characterized by contiguous outward expansion from existing settlements rather than isolated infilling, which mainly encroaches on vegetation, wetlands, and water bodies at the edge of the city. In addition to urbanization, natural space is undergoing restructuring, which is manifested primarily through the transformation of aquatic systems and territorialization. These trajectories highlight a systemic shift from a natural ecological mosaic to a human-dominated environment.
3.1.3. Land-Use Projection for 2036 Under the Business-as-Usual Scenario
Under the BAU scenario, the PLUS model projected the spatial LULC pattern for 2036, revealing an increasingly fragmented landscape (Figure 6). Compared with those in 2024, built-up areas will continue to consolidate and expand outward from existing peripheries, forming a denser urbanization network. However, the cropland area increased significantly in the northern and southern regions. This dual urban-agricultural expansion severely erodes the remaining vegetation, causing patches (particularly in the northwest) to shrink and fragment. Additionally, peripheral wetlands continue to degrade. Although water bodies remain stable in spatial form, they appear to have lost their original continuity and integrity.
Figure 6.
Spatiotemporal evolution of land-use type (2016–2036): historical patterns and future projection under the business-as-usual (BAU) scenario.
3.2. Spatiotemporal Evolution of Ecological Quality and Thermal Environment (2016–2036)
3.2.1. Habitat Quality Transitions and Projection
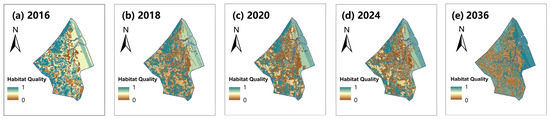
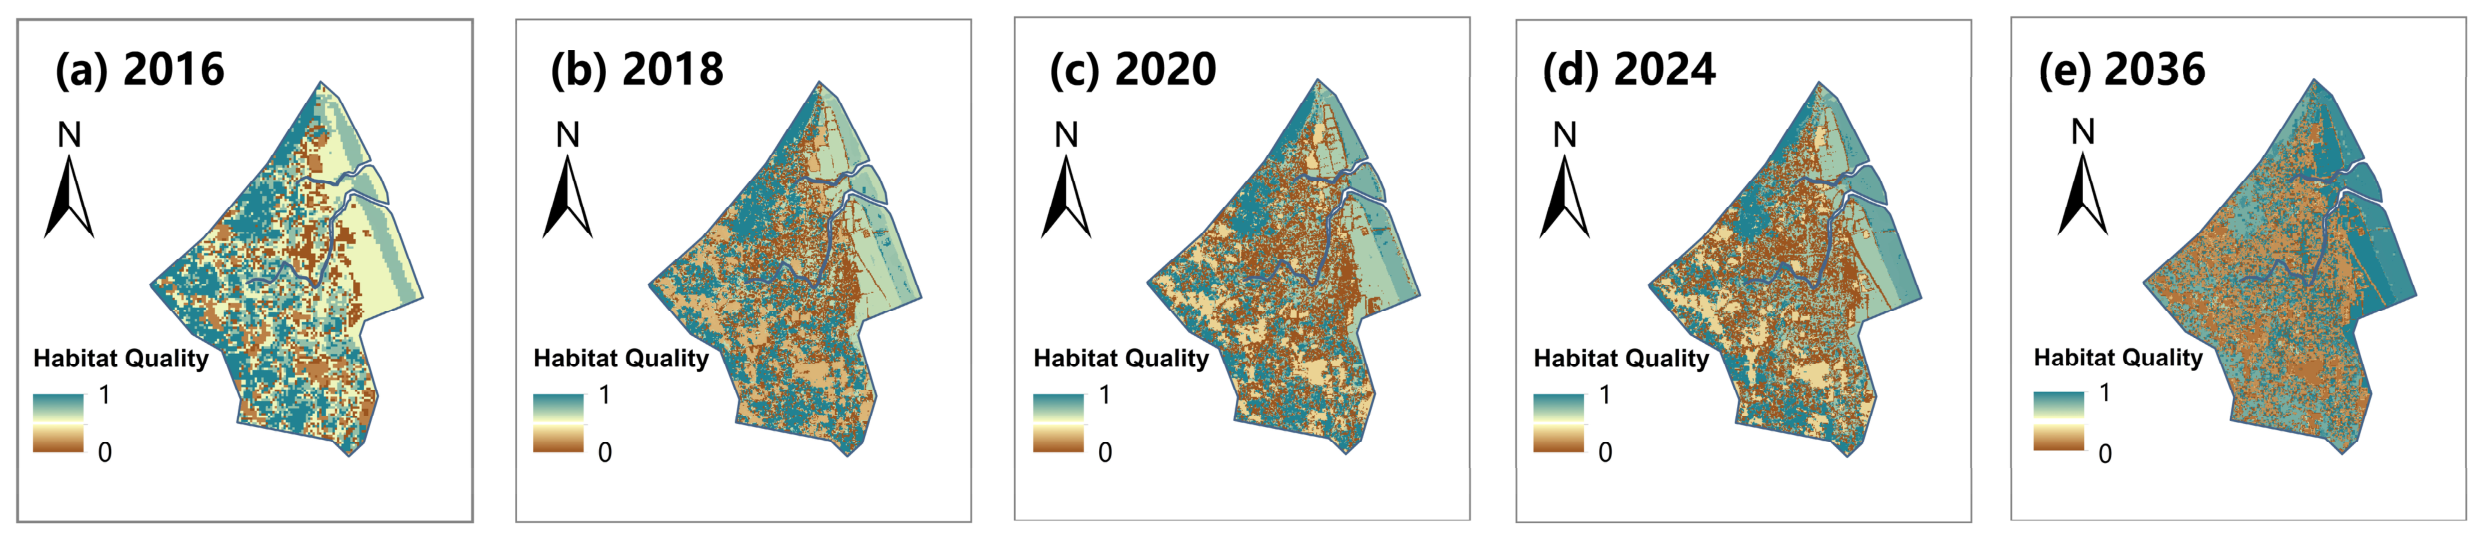
The spatiotemporal evolution of habitat quality shows a clear degradation trajectory, transitioning from a coherent ecological matrix to fragmentation (Figure 7).
Figure 7.
Spatiotemporal evolution of habitat quality (2016–2036): historical patterns derived from the InVEST model and future projection under the business-as-usual (BAU) scenario.
In 2016, areas with high habitat quality dominated the study area. High-quality habitats were widely distributed in the western vegetated areas and the northeastern wetlands, which exhibited high habitat connectivity, whereas low-quality areas were limited to small patches of built-up land and some agricultural land. From 2016 to 2018, the expansion of built-up land and agricultural land led to particularly severe habitat degradation. Low-quality areas expanded radially and rapidly, encroaching upon large portions of the previously high-quality spaces in the western vegetated areas and the northeastern wetlands. The once continuous high-quality habitats were severely fragmented, leaving only isolated patches at the edges, greatly weakening the support capacity of regional biodiversity. After 2018, the degradation trend continued to spread, and by 2020, high-quality habitat areas had further contracted. By 2024, the polarization of habitat quality distribution had become distinct, with high-quality and low-quality areas coexisting, whereas medium-quality areas had almost disappeared. Low-quality patches continued to merge and expand, severing the remaining ecological connectivity. Although small amounts of high-quality habitat persist in some corridor areas, they are far from sufficient to reverse the dominant trend of fragmentation.
In the BAU scenario, the distribution of habitat quality tends to polarize. The transition zone of medium quality has been severely encroached upon, and the landscape matrix has shifted to be dominated by contiguous low-quality patches (brown). Low-quality habitats continue to spread and interweave in the central, southern, and western regions, completely blocking the original ecological corridors. This not only led to the continuous degradation of high-quality habitats in the northwest TWS but also disconnected it from the northeast region. This indicates that under the continuous pressure of urbanization, regional habitats are facing systematic disintegration.
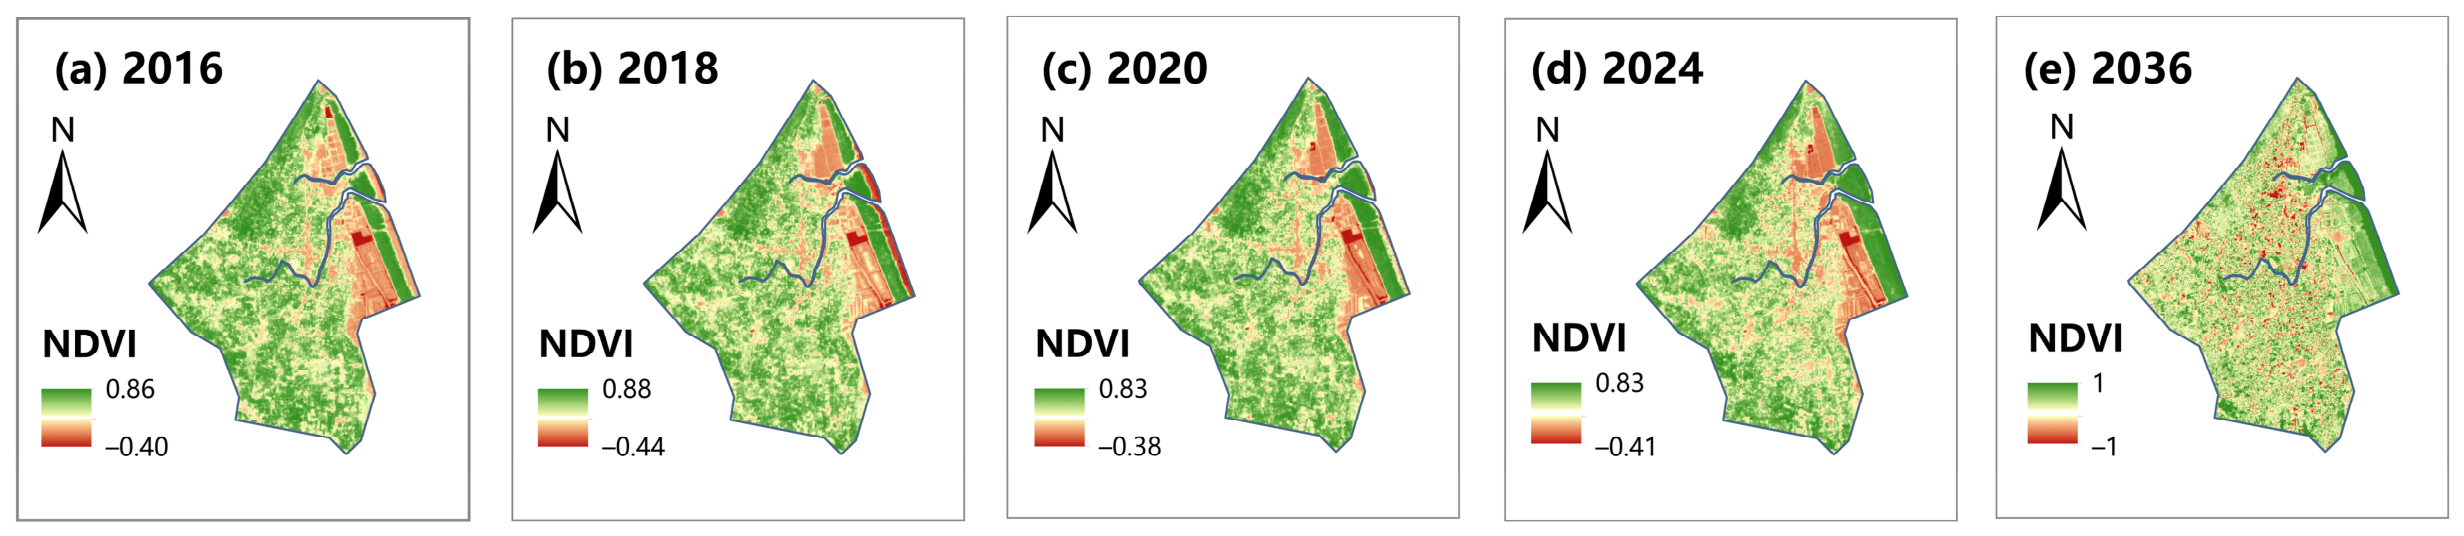
3.2.2. Vegetation Vitality Transitions and Projections
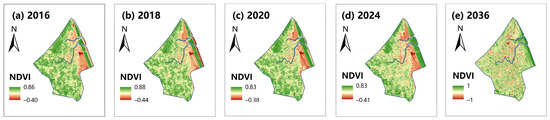
In 2016, this area was dominated by high NDVI values (green), while low values (red) were mainly located in eastern water bodies (Figure 8). From 2016 to 2020, the total vegetation coverage remained relatively stable, with a slight expansion in the low-value area on the east side. By 2024, a distinct turning point occurred: the NDVI in the central regions decreased, and the previously continuous high-value zones began to show fragmentation due to urban expansion.
Figure 8.
Spatiotemporal evolution of the NDVI (2016–2036): historical patterns based on the InVEST model and future projections under the business-as-usual (BAU) scenario.
The forecast for 2036 shows that the landscape will shift towards a highly fragmented and moderately vibrant state. Unlike the more concentrated red patches in 2024, the low-value areas become extremely fragmented and pixelated across the entire region. Moreover, the range of moderate values (yellow) significantly expands, replacing the original high vitality forest base. This trend indicates that without intervention, continuous green infrastructure will be substantially shattered by 2036.
3.2.3. Thermal Environment Transitions and Projection
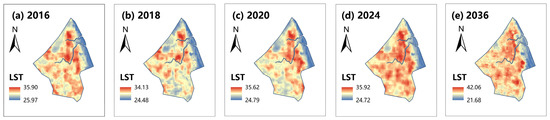
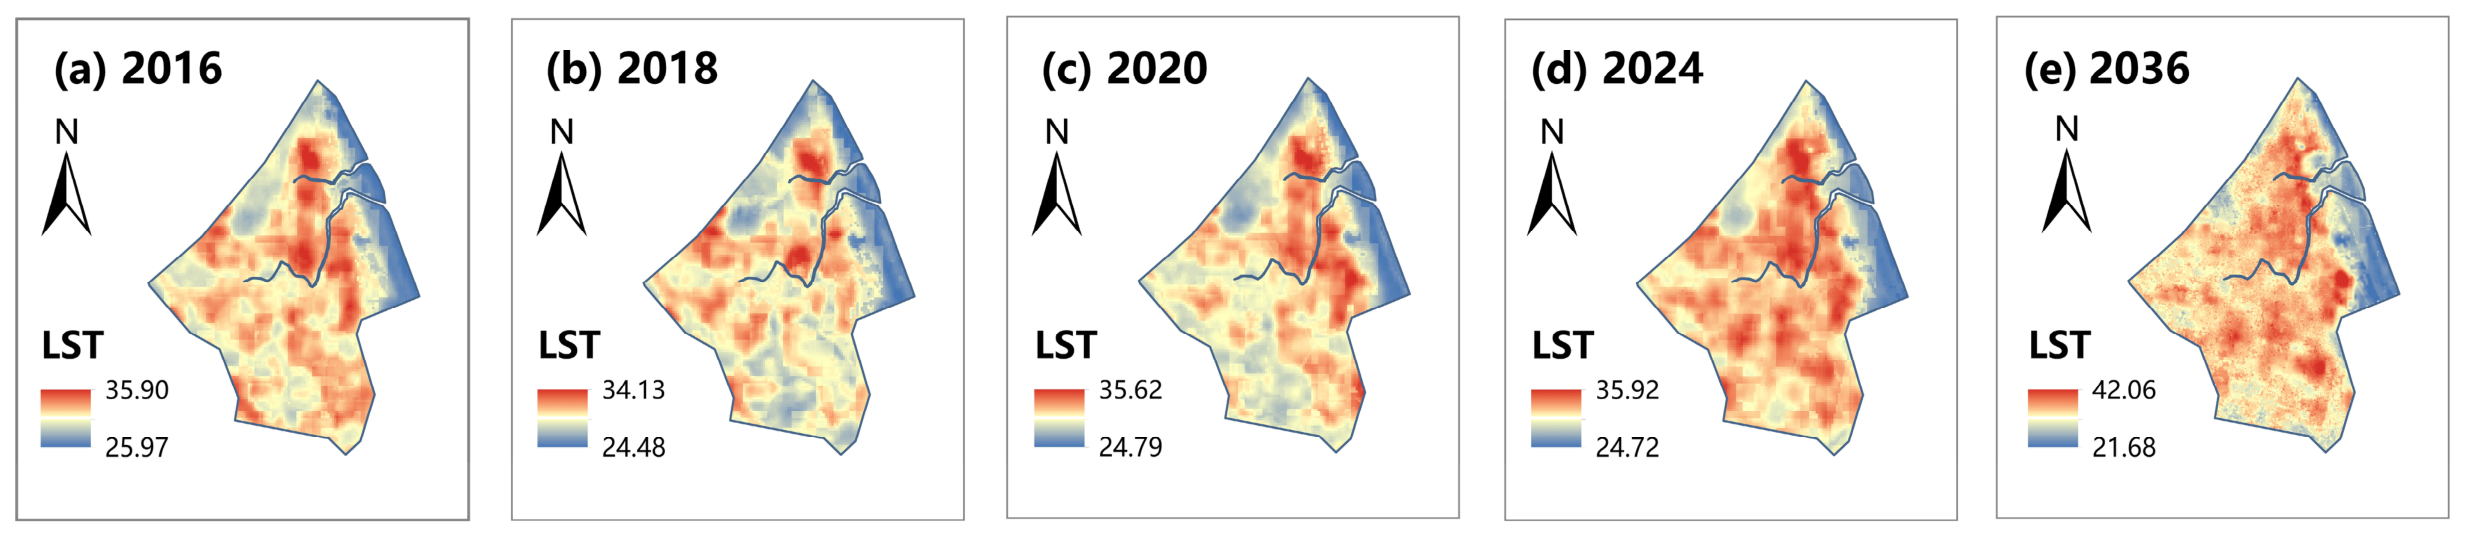
From 2016 to 2024, heat distribution evolved from isolated patches into concentrated and connected urban heat island (UHI) networks (Figure 9).
Figure 9.
Spatiotemporal evolution of LST (2016–2036): historical patterns derived from Landsat thermal imagery and future projections under the business-as-usual (BAU) scenario.
In 2016, the high-temperature zone (red) was concentrated in the central and northern regions, with a maximum temperature of 35.90 °C. After experiencing slight fluctuations in 2018 (34.13 °C) and 2020 (35.62 °C), the highest surface temperature reached 35.92 °C in 2024. During this period, the high-temperature zone spread outwards from the center, forming a continuous heat island network that corresponds to the urban expansion footprint. This phenomenon is consistent with recent research showing that extensive expansion of impermeable surfaces can severely degrade local thermal environments and weaken the buffering capacity of landscapes [45]. In contrast, wetlands and water bodies in the northeast maintained a significant cooling effect during this period (blue).
The forecast for 2036 indicates that the thermal environment will further deteriorate. The highest surface temperature is expected to increase to 42.06 °C, whereas the lowest temperature decreases to 21.68 °C, resulting in an increase in regional temperature differences. In terms of spatial distribution, the high-temperature zone (red) is no longer limited to the central and northern core areas but spreads widely to the central and southern regions. This trend shows that under the BAU scenario, the spatial heterogeneity of extreme heat phenomena and the thermal environment in the region will intensify.
3.3. Spatiotemporal Gradient Analysis of Ecological Structure and Function
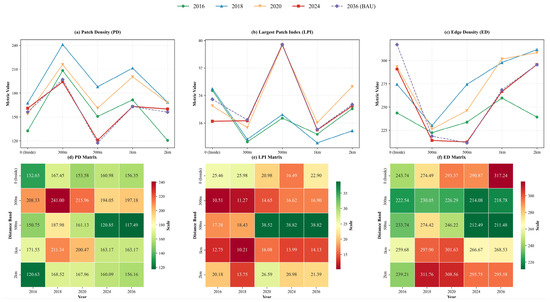
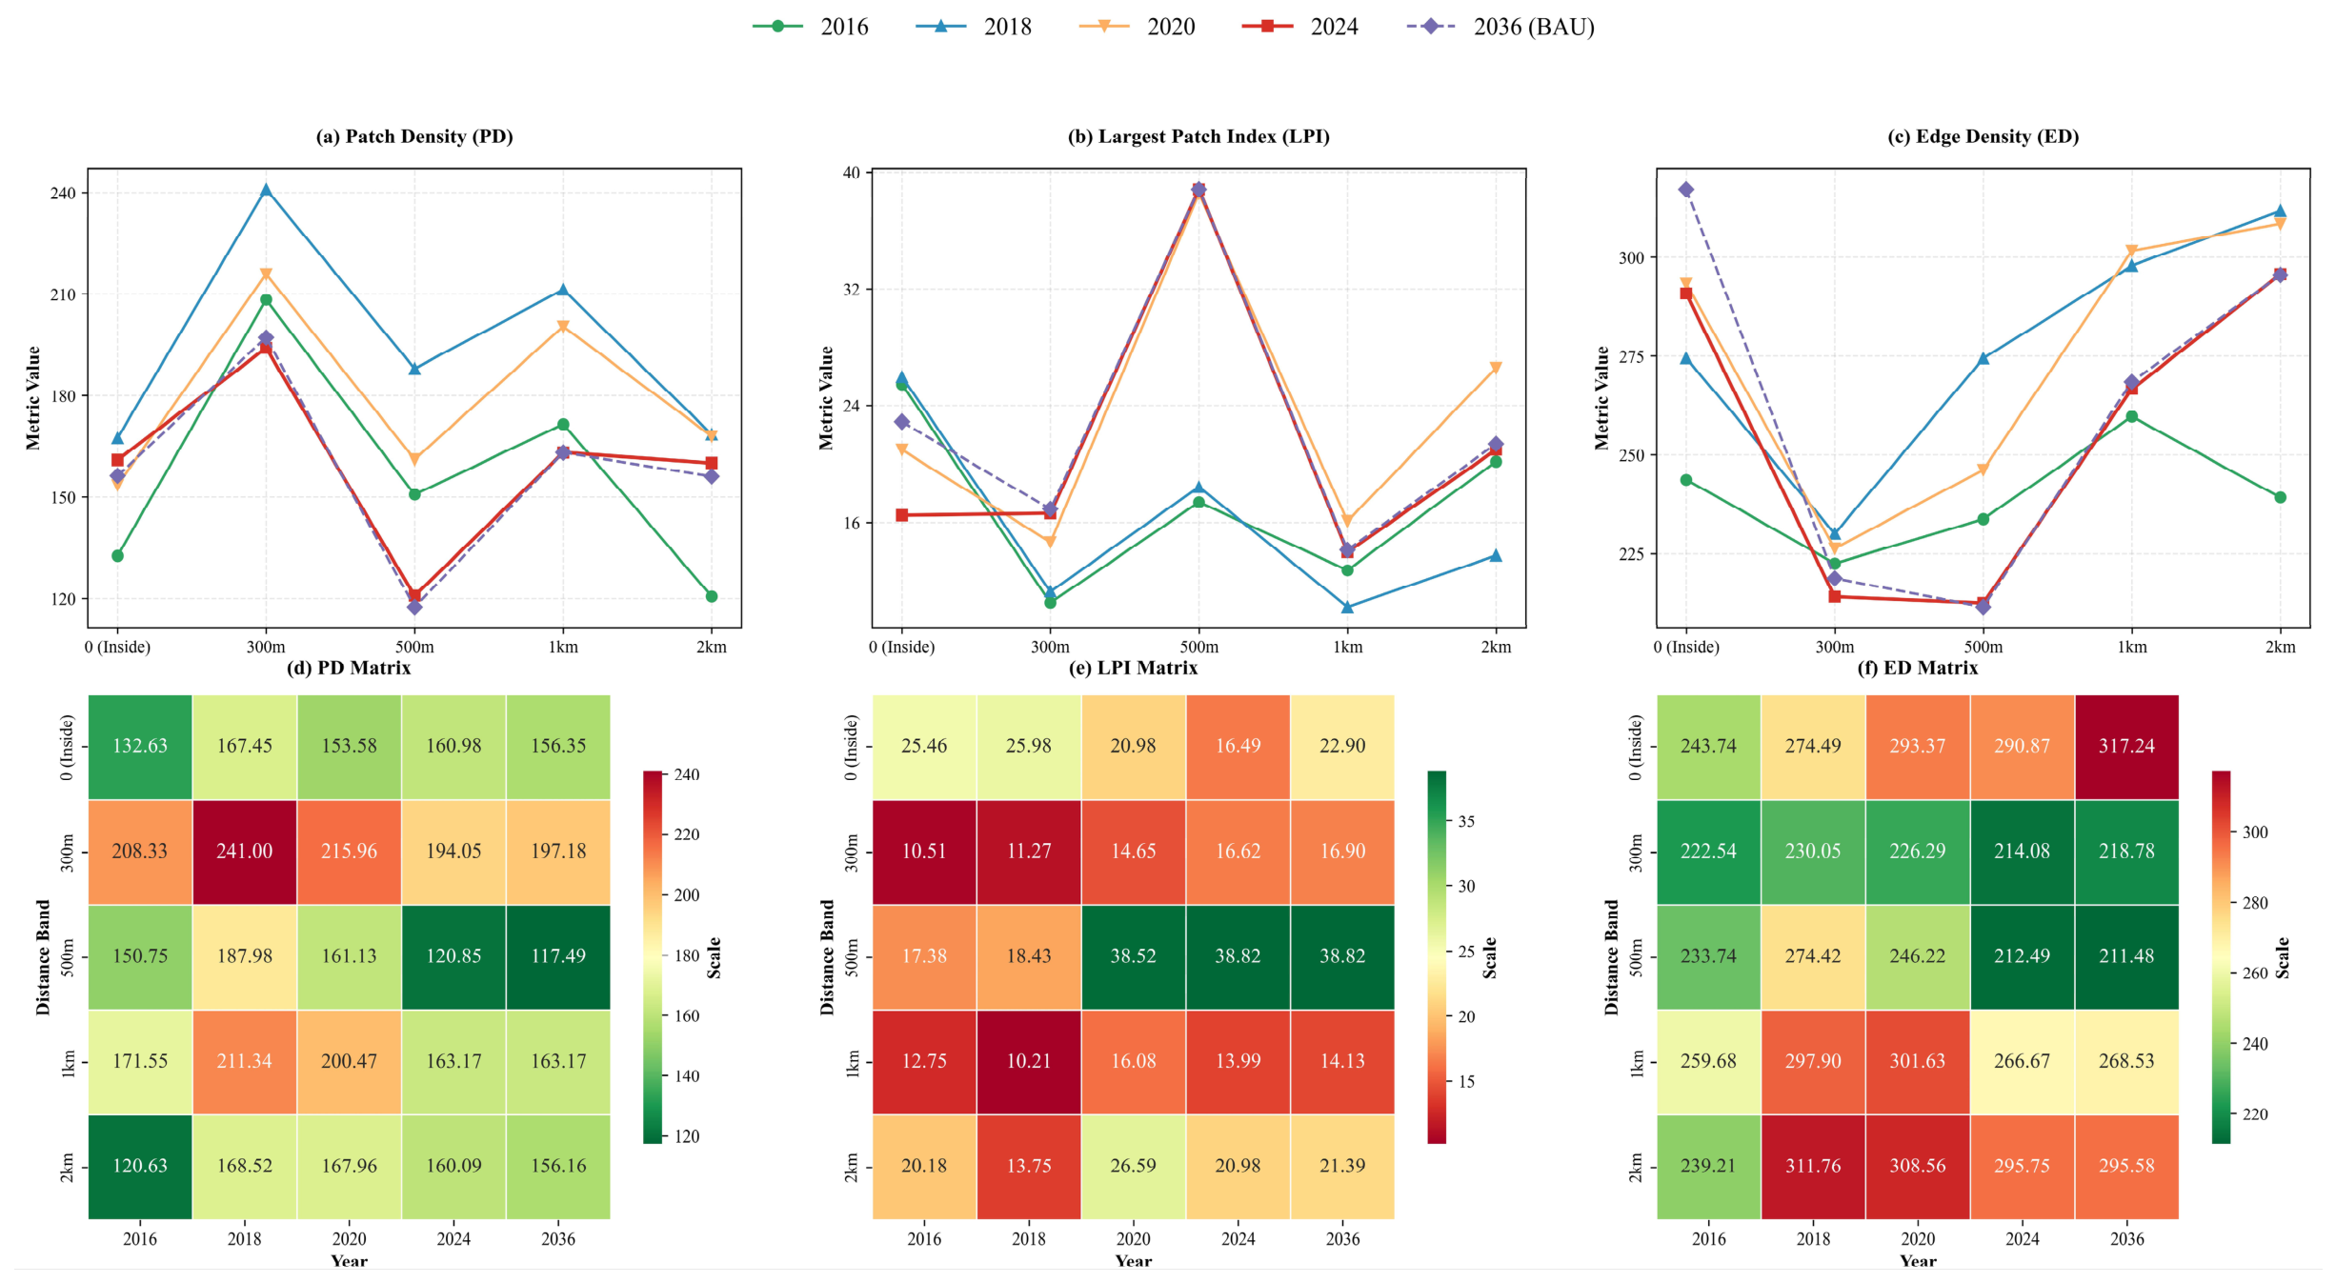
The landscape structural index shows a significant spatiotemporal decay gradient centered around the TWS, with strongly concentrated reorganization in the 300–500 m transition zone (Figure 10).
Figure 10.
Spatiotemporal gradient analysis of landscape fragmentation and structural integrity along the forest–settlement interface zone (2016–2036). The top row (a–c) shows the distance–decay trends of the patch density (PD), largest patch index (LPI), and edge density (ED); the bottom row (d–f) shows the corresponding spatiotemporal intensity matrices.
The PD reaches its peak at 300 m (241.00), indicating high fragmentation at the residential forest boundary, then decreases at 500 m (117.49), and then increases outwards again. In contrast, the maximum plaque index (LPI) shows the opposite pattern, reaching its peak at 500 m (38.82) and maintaining a lower level at 300 m and 1 km. The edge density (ED) is lower between 300 and 500 m but higher in the inner area (0 m: 317.24) and outer area (2 km: 311.76). Temporally, structural changes intensified after 2020.
Overall, the results highlighted significant structural differences at critical distances: fragmentation reached its peak at 300 m (PD high, LPI low), whereas PD decreased and LPI significantly increased at 500 m, indicating partial integration of larger plaques.
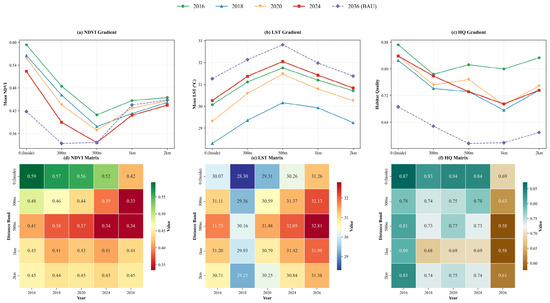
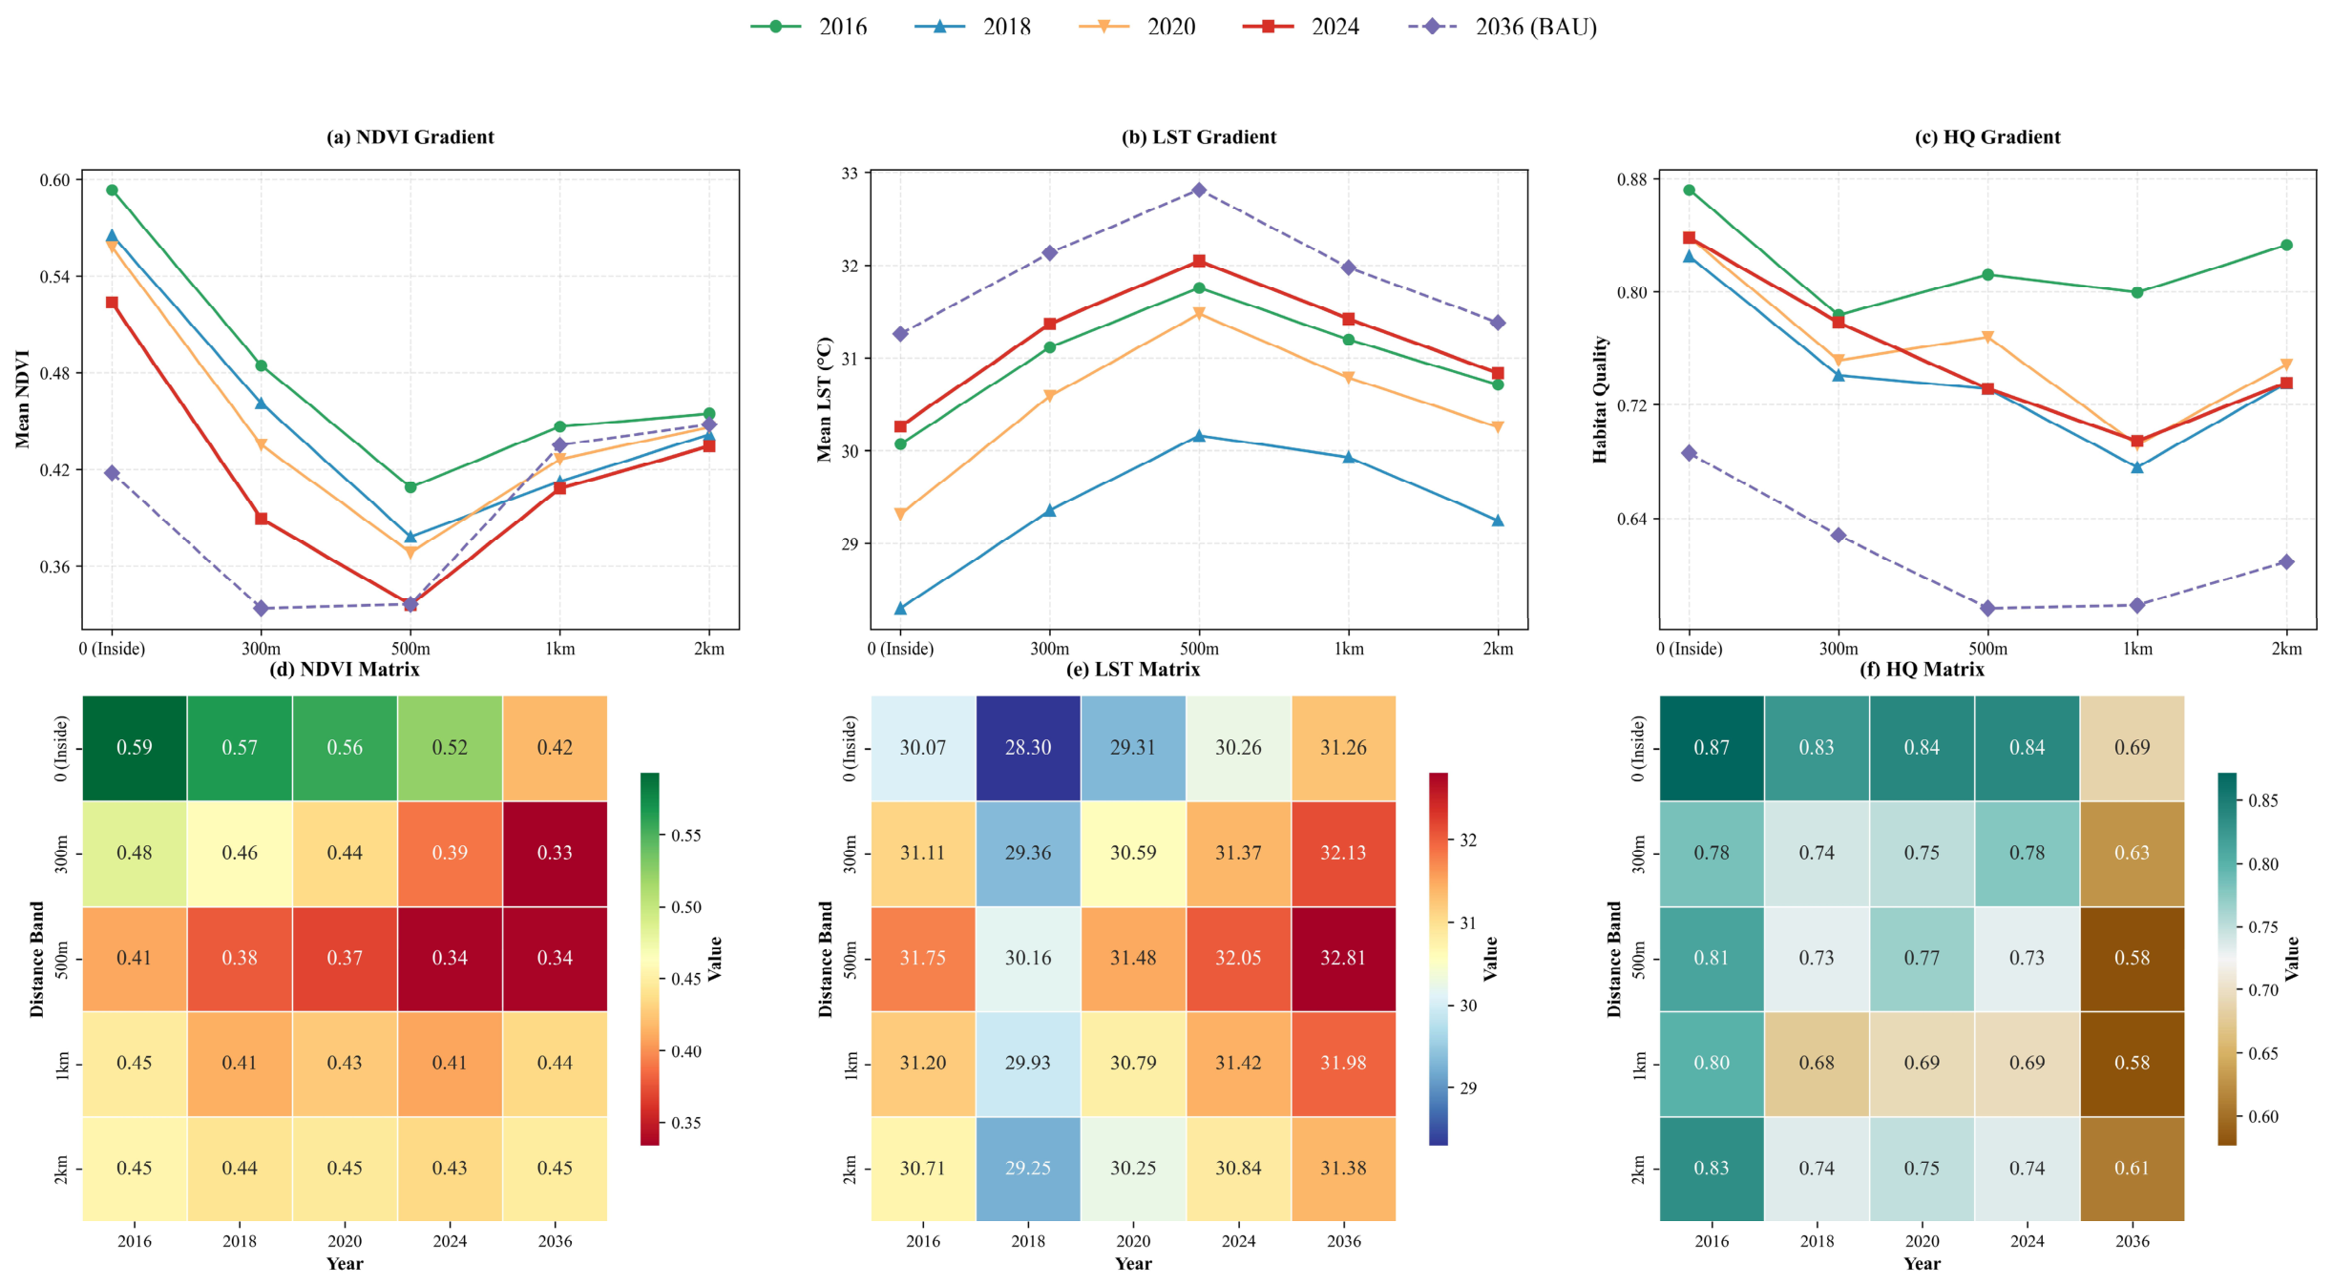
The structural fragmentation of the landscape is closely associated with functional degradation (Figure 11). Fragmented patches lose their ability to regulate the microclimate, resulting in a “thermal boundary effect” of the LST and ultimately leading to a decline in habitat quality and the NDVI.
Figure 11.
Spatiotemporal gradient analysis of the mean NDVI, LST, and habitat quality along the distance along the forest–settlement interface zone (2016–2036). Panels (a–c) represent gradient profiles, while (d–f) display the corresponding heatmaps.
The NDVI decreases sharply at 300 m and reaches its lowest value at 500 m, indicating that vegetation degradation is most severe in the transition zone. The HQ also shows a similar pattern, forming a clear trough at 500 m. After exceeding 1 km, both the NDVI and HQ showed partial recovery. In contrast, the LST shows the opposite trend, reaching its peak at approximately 500 m (32.81), indicating strong heat stress in the region.
Overall, the results show significant spatial coupling, with the minimum values of the NDVI and HQ corresponding to the maximum value of the LST, highlighting that this transition zone is the area with the most severe ecological functional degradation.
4. Discussion
4.1. Humanitarian Settlement Expansion and Protected Area Isolation: Coupled Gradients and Thresholds
Gradient analysis revealed strong spatial coupling between settlement expansion and ecological isolation, with a pronounced transition occurring within the 300–500 m range from the TWS boundary. In this zone, the patch density increases sharply, whereas the largest patch index decreases, indicating that the continuous forest matrix has fragmented into a pattern of small patches interwoven with human land use. Moreover, the NDVI decreases, habitat quality deteriorates, and surface temperature reaches local peaks, suggesting that structural fragmentation and functional degradation occur simultaneously rather than sequentially. The forest–settlement interface zone has therefore shifted from an ecological spillover zone to a marginal landscape dominated by human activities.
This discovery is directly related to the spillover effect theory of the effectiveness of protected areas. Xia et al. [41] and Ament and Cumming [40] demonstrated that when the surrounding landscape remains relatively transparent, the protected area can generate positive spillover beyond its boundaries. Nevertheless, once landscape connectivity weakens below the critical threshold, this ability decreases, and the protected area falls into ecological isolation. Our results show that within the 300–500 m area from TWS, the threshold has been exceeded: as the surrounding substrate transitions from a vegetation mosaic to a hardened residential area surface, the protected area shifts from producing spillover effects to isolation effects [46]; that is, the connectivity between the protected area and the surrounding natural landscape decreases, leading to the interruption of ecological flows.
Previous studies conducted in Teknaf have documented forest loss, habitat degradation, and increased heat stress at the landscape scale [19,21,22,47], confirming the occurrence of ecological changes. However, because these studies analyzed overall landscape conditions rather than distance gradients, they failed to identify where degradation is most spatially concentrated and at which interface distance structural and functional degradation converge. Therefore, we used gradient analysis to identify the 300–500 m interface as the main area where fragmentation, habitat degradation, and heat stress occur simultaneously, thereby clarifying the spatial scope of targeted interventions.
Similar boundary dynamics have been recorded in Bidibidi, Uganda, and Mtendeli, Tanzania, but at different spatial scales. In Mtendeli, the range of firewood collection extends from a radius of 4 km around the campsite to 10–12 km, and agricultural cultivation activities can be detected within a research radius of 25 km [4]. In Bidibidi, fuelwood demand exceeds forest regeneration capacity within the 5 km buffer zone [5]. The compressed 300–500 m threshold in Teknaf reflects the combination of extreme settlement density and direct spatial adjacency between Teknaf Municipality and the TWS, which together accelerate the hardening of the forest-settlement matrix and threshold crossing relative to lower-density or more buffered refugee-hosting landscapes. The comparison indicates that the key to determining the ecological threshold across scales is not the refugee settlement itself but the settlement density and matrix configuration [16].
The dependence of refugee families on surrounding forests exacerbates this degradation, forming a social-ecological feedback loop: vegetation loss intensifies heat stress, weakens hydrological regulation capacity, and further exacerbates pressure on neighboring ecosystems [48]. This chain reaction resulted in severe infrastructure failure. The spring water collection system and reservoir within the TWS boundary of Naitong Para, built during the colonial period, ceased operation because of the occupation of upstream land and the loss of vegetation, leading to severe water shortages in downstream communities. This indicates that ecological restoration and humanitarian assistance cannot be seen as independent planning paths. More importantly, this issue is not unique to unregulated refugee settlements. Evidence from Borneo suggests that even formally planned settlement expansion without well-designed buffer zones and ecological corridors can aggravate forest fragmentation and biomass loss [18]. Therefore, the key factor determining the ecological consequences of the interface is not whether the expansion itself is “planned” but whether effective strategies that can maintain ecological connectivity and protect the transition interface are implemented during the expansion process.
The Teknaf case demonstrates that in extremely high-density humanitarian settlement environments, ecological thresholds may be breached at smaller spatial and temporal scales than in typical urbanization scenarios. The degradation height is concentrated at the transition interface between settlements and protected areas (identified in this case as the threshold zone 300–500 m from the TWS), rather than at the boundary of the protected area itself. This discovery has different implications for three types of actors. For urban planners, this gradient analysis method provides a replicable process for identifying ecological thresholds, which does not rely on administrative boundaries but is based on collaborative responses to structural and functional decline. It can be applied to similar high-density settlement-protected area adjacency scenarios. For the government, relying solely on traditional protection within protected areas is no longer sufficient to maintain their integrity. The land-use control and buffer zone design need to be recalibrated on the basis of this 300–500 m interface. For humanitarian organizations and NGOs, this threshold directly defines the priority spatial range for ecological intervention: within this threshold zone, proactive restoration and livelihood replacement projects can achieve maximum returns.
4.2. From “Do No Harm” to Regenerative, Landscape-Based Humanitarian Planning
On the basis of the above evidence, our research shifts its focus from impact description to spatial diagnosis and differentiated planning, which also requires corresponding adjustments to the framework for humanitarian landscape governance.
Environmental management in humanitarian planning has long followed the “no harm” principle of the Sphere Handbook, emphasizing minimizing environmental damage in emergency response [49]. When refugee settlements are seen as temporary facilities, this framework is appropriate, but in long-term environments such as Teknaf, its structural flaws are evident: “do no harm” is passive, defect-oriented, and aimed at preventing the worst outcomes rather than pursuing a positive ecological development trajectory. Once the structural and functional thresholds are exceeded, as shown in our results within the 300–500 m range, minimizing damage cannot reverse fragmentation, restore habitat connectivity, or rebuild degraded water infrastructure.
Recent academic research advocates regenerative [49] and landscape-based methods, which combine ecological restoration with livelihood support [40,50]. Alves et al. [51] analyzed 24 assisted natural renewal (ANR) cases worldwide and reported that the success of this method heavily relies on spatial analysis of the natural regeneration potential in the landscape. They explicitly stated that identifying where ANR is most effective in the landscape is a key prerequisite for its success. Similarly, Nishi and Subramanian [52] comprehensively analyzed multiple cases of social-ecological production landscapes and proposed that effective ecosystem restoration should start at the landscape or seascape scale, as this approach can help practitioners identify key issues, stakeholder relationships, and potential threats at specific locations, thereby ensuring the feasibility and pertinence of intervention measures. The commonality between these two studies is that, as reflected in our research, the effectiveness of any restoration intervention depends not only on the content of the intervention but also on the application location and scale within the landscape. In Teknaf, the 300–500 m boundary zone, identified through gradient analysis, is the most critical area for restoration investment. Within this area, fragmentation can still occur, and functional connectivity can be partially restored, thereby preventing further deterioration of the landscape to a low-resilience state.
4.3. Spatial Zoning and Regenerative Design Pathways Toward 2036
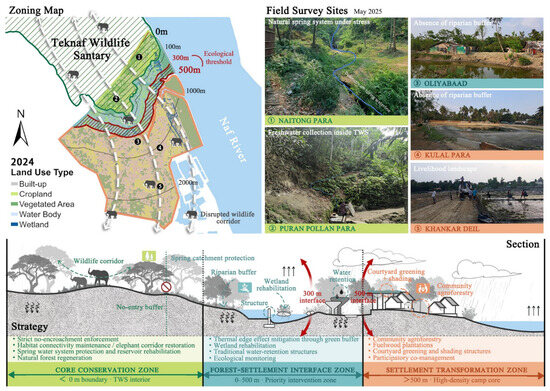
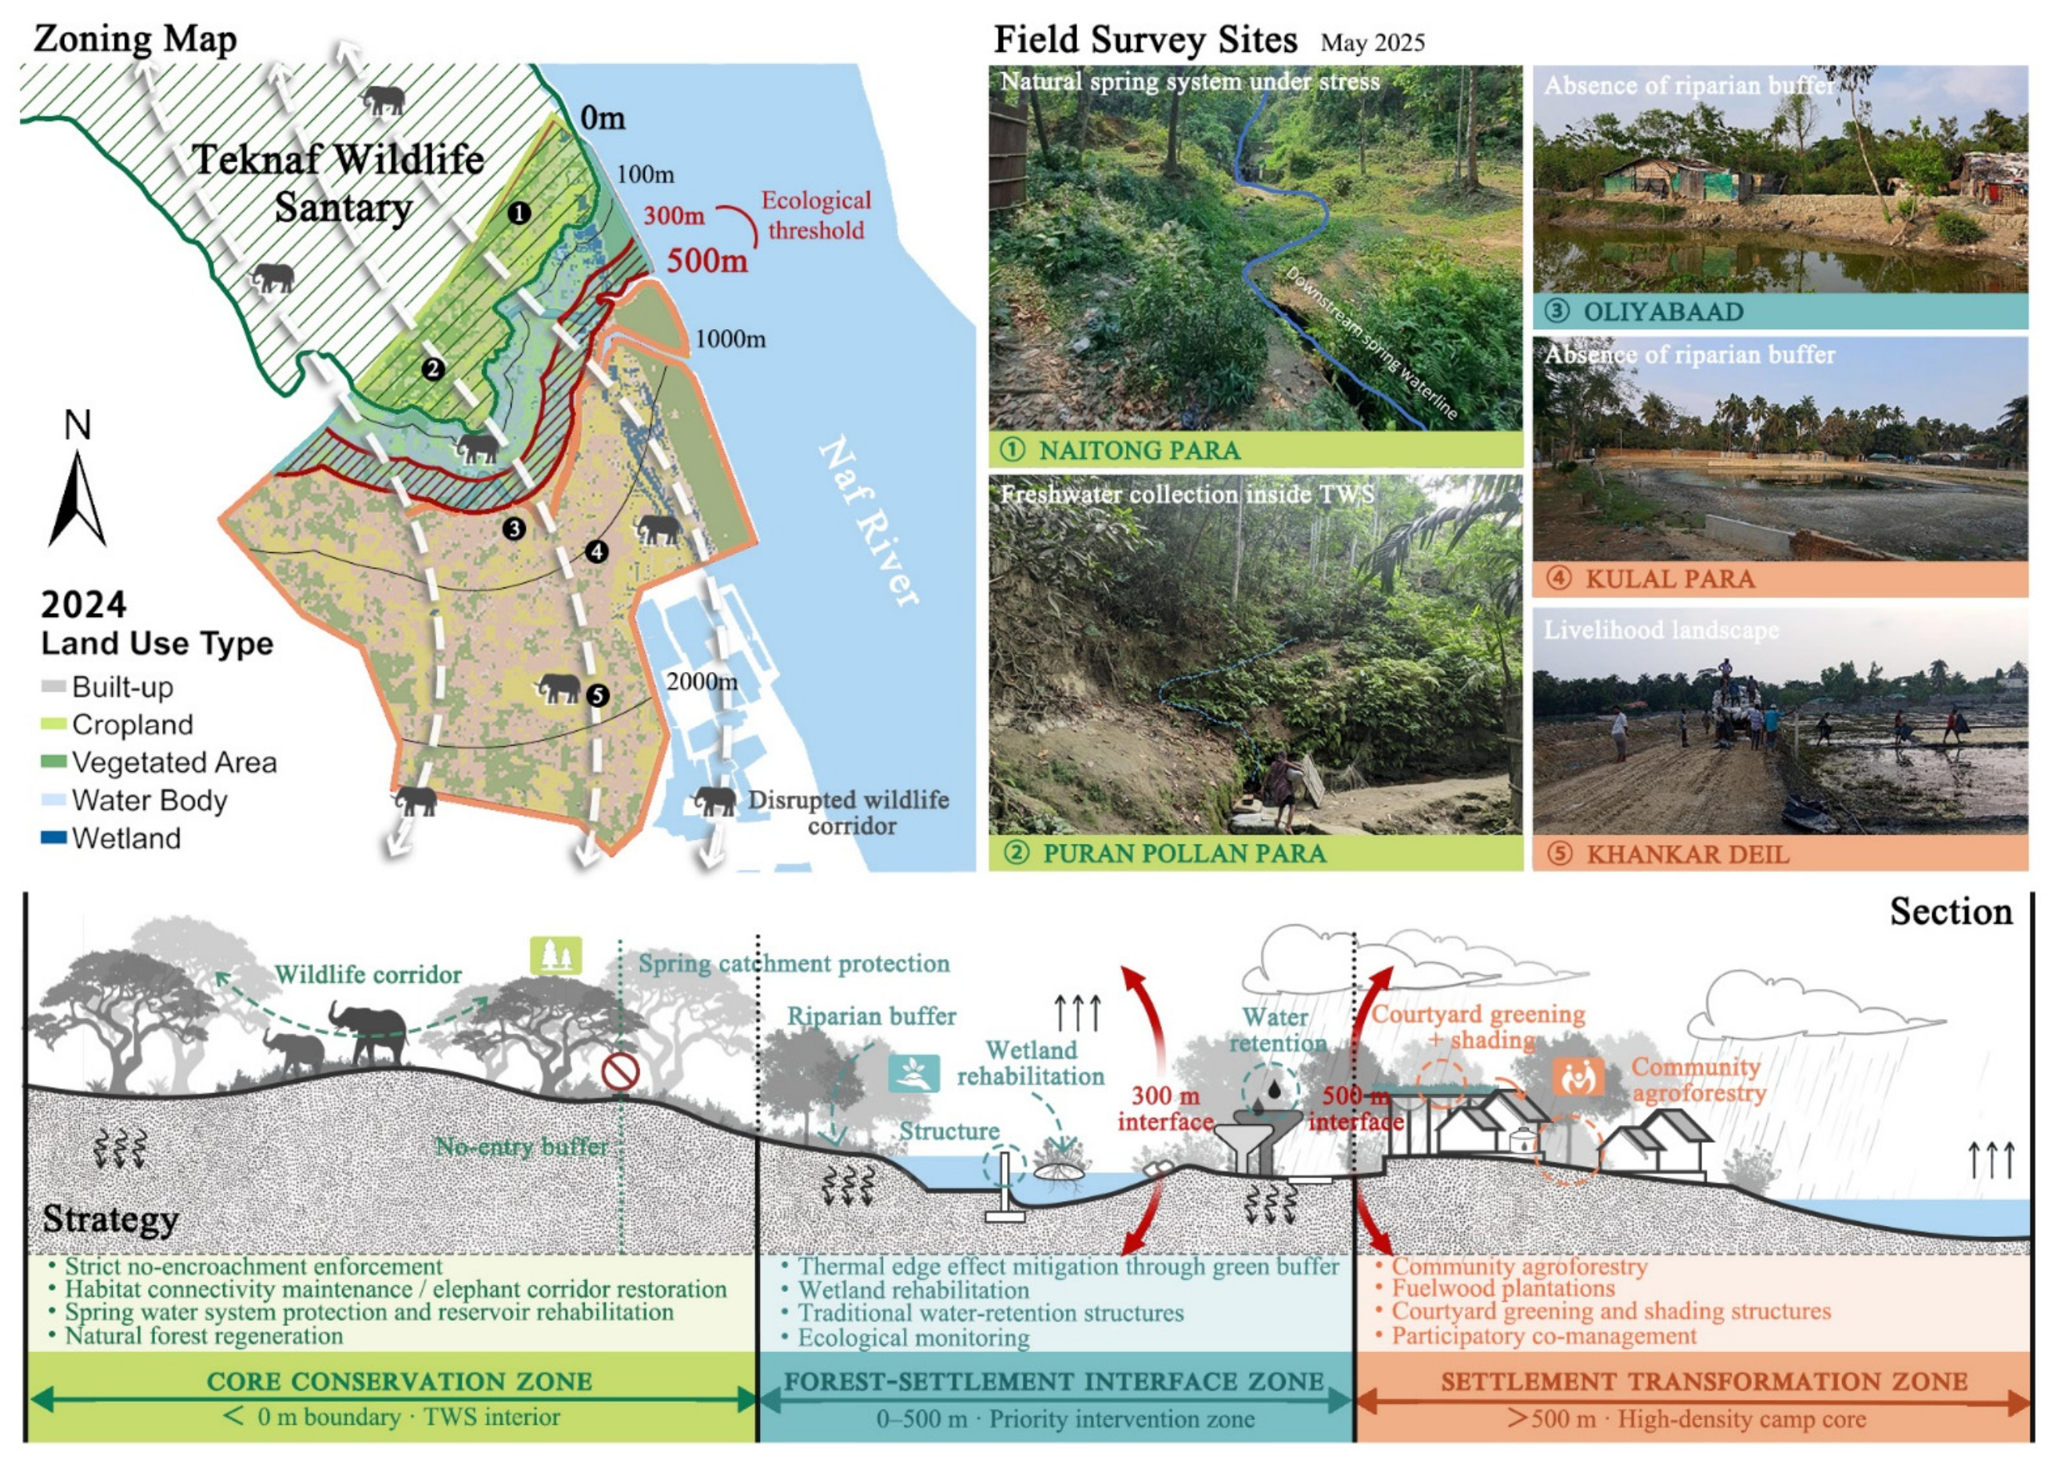
The 2036 BAU projection suggests that ecological threats will continue to intensify, which is consistent with studies showing that rapid settlement growth leads to fragmented peri-urban landscapes and declining ecosystem services [53,54,55]. Notably, the increase in LST under the BAU scenario in 2036 is attributed mainly to local vegetation loss and the thermal response caused by impermeable surface expansion rather than to regional climate warming effects not explicitly included in this study. Referring to the threshold determined by gradient analysis (Section 3.3), differentiated three-zone planning (Figure 12) links ecological restoration with humanitarian landscape management.
Figure 12.
Spatial zoning and regenerative design strategies for the TWS interface landscape (Note: Squiggly downward arrows: infiltration or recharge; straight upward arrows: evaporation; red prohibition symbol: no-entry core zone boundary).
The difference between this framework and traditional buffer zone planning is that its boundaries are not based on administrative conventions or arbitrary boundaries but rather on scientifically identified ecological threshold responses: the 300–500 m transition zone is regarded as the main fragmentation-degradation convergence zone, which determines the boundaries of Zone 2.
The first zone (core protected area, HQ > 0.65) covers the interior of the TWS and adjacent forest boundaries. The key strategies here are to prevent encroachment and logging, protect wildlife corridors, restore natural water sources and reservoirs, promote natural forest regeneration, and maintain the ecological source functions that Zone 2 and Zone 3 rely on.
The second zone (forest–settlement interface zone) is a buffer zone within 500 m of TWS, which is the main focus area for ecological restoration interventions and the area with the most severe ecological degradation. Targeted measures include building green buffer zones to alleviate thermal edge effects, restoring wetlands, repairing traditional water storage facilities, and conducting ecological monitoring.
The third zone is a settlement transformation zone beyond 500 m, encompassing the high-density refugee settlement core, where built-up land reached 31.37% in 2024 and continues to expand. Rather than restricting land use, strategies here aim to reduce pressure on the inner zones through landscape-integrated approaches: community agriculture and forestry, combined with firewood plantations, and existing firewood substitution schemes (such as liquefied petroleum gas distribution) to meet onsite fuel demand [56]; garden greening and shading facilities to alleviate the expected increase in heat stress; and blue-green infrastructure to replace polluted or seasonally dried water bodies at field investigation points KULAL PARA and KHANKAR DEIL (Figure 12).
The framework’s effectiveness depends on its institutional embeddedness. Community-based co-management has demonstrated the capacity to improve ecological outcomes and livelihood resilience in resource-dependent landscapes [40,50]. Bangladesh’s Wetland Conservation Act (2000) and the Forest Department’s jurisdiction over the TWS provide the legal basis for Zone 1 protection. In practice, the Inter Departmental Coordination Group (ISCG) of the Joint-Response Plan (JRP), which brings together the government of Bangladesh, the United Nations High Commissioner for Refugees, and over 117 humanitarian partners, follows a strategic framework that clearly includes climate and environmental goals [57], providing an existing interagency mechanism through which threshold-based zoning can be used as input for spatial planning. This institutional foundation distinguishes our proposed strategies from purely academic proposals and enables their practical implementation within existing governance structures.
5. Conclusions
5.1. Key Findings and Contributions
Our research examined the ecological consequences and mechanisms of refugee settlement expansion at the TWS interface via multitemporal remote sensing and gradient analysis. From 2016 to 2024, vegetation-dominated landscapes were replaced by fragmented settlement patches, with large-scale losses of vegetation, increased LST, and decreased habitat quality.
The results revealed a critical ecological transition zone within 300–500 m from the TWS boundary, where landscape fragmentation, habitat degradation, and heat stress were highly concentrated. This suggests that rapid settlement expansion can accelerate ecological isolation around protected areas, particularly in high-density humanitarian landscapes. Under the BAU scenario, the overall ecological conditions will continue to intensify by 2036 in the absence of targeted interventions.
5.2. Limitations and Future Research
The spatial resolution of existing satellite data limits the detection of fine-scale landscape features within dense refugee camps. The habitat quality model relies on predetermined threat factors and weight parameters, which may introduce uncertainty. In addition, the future land-use scenario assumes a simplified BAU path without considering policy intervention or socioeconomic changes.
Our analysis focused mainly on ecological and surface indicators. Subsequent research can integrate participatory mapping, field visits, and interviews to gain a deeper understanding of refugees’ and host communities’ perceptions, utilization, and value identification of the surrounding landscape. Moreover, conducting comparative research in other refugee-hosting areas can help test whether there are similar spatial thresholds and ecological restoration pathways across different ecological and institutional contexts.
5.3. Implications for Landscape Practice and Policy
Refugee hosting areas should be seen as long-term social ecosystems rather than short-term humanitarian emergency spaces. In rapidly changing borderland environments such as Teknaf, ecological degradation may occur in narrow transition zones.
For planning and policy-making, design interventions, ecological restoration, and livelihood support must be integrated into the management framework of humanitarian landscape management. More broadly, the analytical framework of this study can serve as a spatial decision-support tool for identifying ecological thresholds and priority intervention areas in other refugee-hosting landscapes, helping to shift from crisis response to resilient governance.
Author Contributions
Conceptualization, L.Q. and C.Z.; methodology, L.Q., C.Z. and J.L. (Junling Liu); software, J.L. (Junling Liu), Q.Q. and J.L. (Jingyi Lu); validation, C.Z., W.V. and S.W.C.; formal analysis, J.L. (Junling Liu) and J.L. (Jingyi Lu); investigation, C.Z.; resources, S.W.C.; data curation, J.L. (Junling Liu) and Q.Q.; writing—original draft preparation, J.L. (Junling Liu); writing—review and editing, L.Q., C.Z. and W.V.; visualization, J.L. (Junling Liu), J.L. (Jingyi Lu), and Q.Q.; supervision, L.Q.; project administration, L.Q.; funding acquisition, C.Z. All authors have read and agreed to the published version of the manuscript.
Funding
This research was funded by the Netherlands Enterprise Agency under the project cycle Urban Demonstrators (hereinafter: Urban Demonstrators Upscaling), reference No. PVW5I24007.
Data Availability Statement
The data that support the findings of this study are available from the corresponding authors upon reasonable request. The data are not publicly available due to privacy and ethical restrictions regarding the study area.
Acknowledgments
The authors extend their appreciation to the editors and anonymous reviewers for their invaluable constructive criticism, which substantially improved the manuscript. The authors have reviewed and edited the output and take full responsibility for the content of this publication.
Conflicts of Interest
Author Sami W. Chowdhury was employed by the company Altec Consultant Limited (ACL). The remaining authors declare that the research was conducted in the absence of any commercial or financial relationships that could be construed as a potential conflict of interest.
References
- Maystadt, J.-F.; Mueller, V.; Van Den Hoek, J.; van Weezel, S. Vegetation Changes Attributable to Refugees in Africa Coincide with Agricultural Deforestation. Environ. Res. Lett. 2020, 15, 044008. [Google Scholar] [CrossRef] [Scilit]
- UNHCR; Food and Agriculture Organization. Mid-Year Trends|UNHCR; UNHCR: Geneva, Switzerland, 2025. [Google Scholar]
- Biswas, A.; Tortajada, C. Environmental Impacts of Refugees: A Case Study. Impact Assess. 1996, 14, 21–39. [Google Scholar] [CrossRef] [Scilit]
- Gromny, E.; Jenerowicz-Sanikowska, M.; Haarpaintner, J.; Aleksandrowicz, S.; Woźniak, E.; Pesquer Mayos, L.; Chułek, M.; Sobczak-Szelc, K.; Wawrzaszek, A.; Sala, S.; et al. Remote Sensing Insights into Land Cover Dynamics and Socio-Economic Drivers: The Case of Mtendeli Refugee Camp, Tanzania (2016–2022). Remote Sens. Appl. Soc. Environ. 2024, 36, 101334. [Google Scholar] [CrossRef] [Scilit]
- FAO; UNHCR. Rapid Woodfuel Assessment 2017 Baseline for Bidibidi; UNHCR: Geneva, Switzerland, 2017. [Google Scholar]
- Mukul, S.A.; Huq, S.; Herbohn, J.; Nishat, A.; Rahman, A.A.; Amin, R.; Ahmed, F.U. Rohingya Refugees and the Environment. Science 2019, 364, 138. [Google Scholar] [CrossRef] [Scilit]
- Nath, S.K. Impact of Rohingya Influx on Wildlife and Society in Teknaf Peninsula in Cox’s Bazar of Bangladesh. Ph.D. Thesis, University of Dhaka, Dhaka, Bangladesh, 2024. [Google Scholar]
- Bangladesh Paribeśa Adhidaptara. Bangladesh Environment and Climate Change Outlook (ECCO) 2012; Department of Environment, Ministry of Environment and Forests, Government of the People’s Republic of Bangladesh: Dhaka, Bangladesh, 2013. [Google Scholar]
- Hossen, A.; Røskaft, E. A Case Study on Conflict Intensity between Humans and Elephants at Teknaf Wildlife Sanctuary, Cox’s Bazar, Bangladesh. Front. Conserv. Sci. 2023, 4, 1067045. [Google Scholar] [CrossRef] [Scilit]
- Ahmed, T.; Sabastini, P. Deforestation as a Site of Conflict and Differentiation: The Case of the Rohingya Refugee Influx in the Teknaf Wildlife Sanctuary. Hum. Ecol. 2024, 52, 115–127. [Google Scholar] [CrossRef] [Scilit]
- Alam, S.; Misbahuzzaman, K.; Rahman, M.A.; Kabir, M.H. Threats to the Teknaf Wildlife Sanctuary of Bangladesh. J. Environ. Sci. Nat. Resour. 2014, 7, 233–239. [Google Scholar] [CrossRef] [Scilit]
- Akhter, M.; Uddin, S.M.N.; Rafa, N.; Hridi, S.M.; Staddon, C.; Powell, W. Drinking Water Security Challenges in Rohingya Refugee Camps of Cox’s Bazar, Bangladesh. Sustainability 2020, 12, 7325. [Google Scholar] [CrossRef] [Scilit]
- Rahman, M.H. Rohingya Refugee Crisis and Human vs. Elephant (Elephas maximus) Conflicts in Cox’s Bazar District of Bangladesh. J. Wildl. Biodivers. 2019, 3, 10–21. [Google Scholar] [CrossRef] [Scilit]
- Seawright, J.; Gerring, J. Case Selection Techniques in Case Study Research: A Menu of Qualitative and Quantitative Options. Polit. Res. Q. 2008, 61, 294–308. [Google Scholar] [CrossRef] [Scilit]
- Mitra, J.R.; Ahmed, T.T.; Czajkowski, K. Landscape Fragmentation and Population Distribution in Refugee Camps: Evidence from the Rohingya Refugee Influx in Bangladesh. Popul. Environ. 2025, 47, 18. [Google Scholar] [CrossRef] [Scilit]
- Wittemyer, G.; Elsen, P.; Bean, W.T.; Burton, A.C.O.; Brashares, J.S. Accelerated Human Population Growth at Protected Area Edges. Science 2008, 321, 123–126. [Google Scholar] [CrossRef] [Scilit] [PubMed]
- Woodroffe, R.; Ginsberg, J.R. Edge Effects and the Extinction of Populations inside Protected Areas. Science 1998, 280, 2126–2128. [Google Scholar] [CrossRef] [Scilit] [PubMed]
- Liu, J.; Qian, L.; Du, X.; Chen, X. Ecological Risks to Protected Areas under Capital Relocation: A Case Study of Borneo. Guangdong Landsc. Archit. 2025, 47, 3–12. [Google Scholar] [CrossRef]
- Hasan, M.E.; Zhang, L.; Mahmood, R.; Guo, H.; Li, G. Modelling of Forest Ecosystem Degradation Due to Anthropogenic Stress: The Case of Rohingya Influx into the Cox’s Bazar–Teknaf Peninsula of Bangladesh. Environments 2021, 8, 121. [Google Scholar] [CrossRef] [Scilit]
- Siddeqa, M.; Islam, M.T.; Hasan, M.F.; Islam, R.; Rasheduzzaman, M. Land Use and Land Cover Change Detection of Teknaf Upazila Due to Rohingya Crisis by Using GIS, and RS Techniques. Asian J. Soc. Sci. Leg. Stud. 2023, 5, 246–252. [Google Scholar] [CrossRef] [Scilit]
- Hassan, M.M.; Smith, A.C.; Walker, K.; Rahman, M.K.; Southworth, J. Rohingya Refugee Crisis and Forest Cover Change in Teknaf, Bangladesh. Remote Sens. 2018, 10, 689. [Google Scholar] [CrossRef] [Scilit]
- Hasan, M.E.; Zhang, L.; Dewan, A.; Guo, H.; Mahmood, R. Spatiotemporal Pattern of Forest Degradation and Loss of Ecosystem Function Associated with Rohingya Influx: A Geospatial Approach. Land Degrad. Dev. 2021, 32, 3666–3683. [Google Scholar] [CrossRef] [Scilit]
- Sarkar, S.K.; Saroar, M.; Chakraborty, T. Navigating Nature’s Toll: Assessing the Ecological Impact of the Refugee Crisis in Cox’s Bazar, Bangladesh. Heliyon 2023, 9, e18255. [Google Scholar] [CrossRef] [Scilit]
- Karmakar, S.; Rahman, M.; Meng, L. Land Cover Changes and Land Surface Temperature Dynamics in the Rohingya Refugee Area, Cox Bazar, Bangladesh: An Analysis from 2013 to 2024. Atmosphere 2025, 16, 250. [Google Scholar] [CrossRef] [Scilit]
- Ahmed, F.; Alam, S.; Saha, O.R.; Rahman, A. The Rohingya Refugee Crisis in Bangladesh: Assessing the Impact on Land Use Patterns and Land Surface Temperature Using Machine Learning. Environ. Monit. Assess. 2024, 196, 555. [Google Scholar] [CrossRef] [Scilit]
- Bashar, S.; Bernell, D. Stranded Ecosystems: Mitigating Environmental Impacts of Rohingya Refugee Camps in Cox’s Bazar. J. Environ. Plan. Manag. 2025, 1–19. [Google Scholar] [CrossRef] [Scilit]
- Islam, N.; Hannan, A.B.; Onty, T.S.; Das, R.R.; Uddin, M.S.; Alam, F.B. A Spatiotemporal Analysis of Land-Use Changes in Rohingya Refugee Camps Using Multi-Temporal Satellite Image Analysis. AIP Conf. Proc. 2023, 2713, 060006. [Google Scholar] [CrossRef] [Scilit]
- Uddin, M.Z.; Alam, M.F.; Rhaman, M.A.; Hassan, M.A. Diversity in Angiosperm Flora of Teknaf Wildlife Sanctuary, Bangladesh. Bangladesh J. Plant Taxon. 2013, 20, 145–162. [Google Scholar] [CrossRef] [Scilit]
- Nowreen, S.; Qayum, K.A.; Zzaman, R.U.; Shamma, T.K.; Amin, R.; Hossain, K.; Mahmud, R.; Arif, M.T.A.; Ritu, S.; Agnew, P.; et al. Problem Causation and Solutions in Watershed Management from Stakeholder Perspectives: A Case Study in Bangladesh. Water Policy 2025, 28, 110–131. [Google Scholar] [CrossRef] [Scilit]
- Kamal, A.M.; Ahmed, B.; Tasnim, S.; Sammonds, P. Assessing Rainfall-Induced Landslide Risk in a Humanitarian Context: The Kutupalong Rohingya Camp in Cox’s Bazar, Bangladesh—ScienceDirect. Nat. Hazards Res. 2022, 2, 230–248. [Google Scholar] [CrossRef] [Scilit]
- Drusch, M.; Del Bello, U.; Carlier, S.; Colin, O.; Fernandez, V.; Gascon, F.; Hoersch, B.; Isola, C.; Laberinti, P.; Martimort, P.; et al. Sentinel-2: ESA’s Optical High-Resolution Mission for GMES Operational Services. Remote Sens. Environ. 2012, 120, 25–36. [Google Scholar] [CrossRef] [Scilit]
- Roy, D.P.; Wulder, M.A.; Loveland, T.R.; Woodcock, C.E.; Allen, R.G.; Anderson, M.C.; Helder, D.; Irons, J.R.; Johnson, D.M.; Kennedy, R.; et al. Landsat-8: Science and Product Vision for Terrestrial Global Change Research. Remote Sens. Environ. 2014, 145, 154–172. [Google Scholar] [CrossRef] [Scilit]
- Jiménez-Muñoz, J.C.; Sobrino, J.A.; Skoković, D.; Mattar, C.; Cristóbal, J. Land Surface Temperature Retrieval Methods from Landsat-8 Thermal Infrared Sensor Data. IEEE Geosci. Remote Sens. Lett. 2014, 11, 1840–1843. [Google Scholar] [CrossRef] [Scilit]
- Hassan, M.M.; Duveneck, M.; Southworth, J. The Role of the Refugee Crises in Driving Forest Cover Change and Fragmentation in Teknaf, Bangladesh. Ecol. Inf. 2023, 74, 101966. [Google Scholar] [CrossRef] [Scilit]
- Qian, L.; Durany, E.B.; Zhou, S. Research on Ecosystem of the Northwestern Mediterranean Coastline: Multidimensional Remote Sensing Inversion of Spatio-Temporal Land Use Evolution Patterns. Landsc. Archit. 2022, 29, 124–130. [Google Scholar] [CrossRef]
- Adam, E.; Mutanga, O.; Rugege, D. Multispectral and Hyperspectral Remote Sensing for Identification and Mapping of Wetland Vegetation: A Review. Wetl. Ecol. Manag. 2010, 18, 281–296. [Google Scholar] [CrossRef] [Scilit]
- Natural Capital Alliance InVEST 3.18.0. Available online: https://natcap.github.io/invest.release-metadata/3.18.0.html (accessed on 15 April 2026).
- Liang, X.; Guan, Q.; Clarke, K.C.; Liu, S.; Wang, B.; Yao, Y. Understanding the Drivers of Sustainable Land Expansion Using a Patch-Generating Land Use Simulation (PLUS) Model: A Case Study in Wuhan, China. Comput. Environ. Urban Syst. 2021, 85, 101569. [Google Scholar] [CrossRef] [Scilit]
- Popradit, A.; Srisatit, T.; Kiratiprayoon, S.; Yoshimura, J.; Ishida, A.; Shiyomi, M.; Murayama, T.; Chantaranothai, P.; Outtaranakorn, S.; Phromma, I. Anthropogenic Effects on a Tropical Forest According to the Distance from Human Settlements. Sci. Rep. 2015, 5, 14689. [Google Scholar] [CrossRef] [Scilit] [PubMed]
- Ament, J.M.; Cumming, G.S. Scale Dependency in Effectiveness, Isolation, and Social-Ecological Spillover of Protected Areas. Conserv. Biol. 2016, 30, 685–923. [Google Scholar] [CrossRef] [Scilit]
- Xia, H.; Li, H.; Prishchepov, A.V. Assessing Forest Conservation Outcomes of a Nature Reserve in a Subtropical Forest Ecosystem: Effectiveness, Spillover Effects, and Insights for Spatial Conservation Prioritization. Biol. Conserv. 2023, 285, 110254. [Google Scholar] [CrossRef] [Scilit]
- McGarigal, K.; Cushman, S.A.; Ene, E. FRAGSTATS v4: Spatial Pattern Analysis Program for Categorical and Continuous Maps 2012. Available online: https://www.fragstats.org (accessed on 15 April 2026).
- Turner, M.G.; Gardner, R.H. Landscape Metrics. In Landscape Ecology in Theory and Practice: Pattern and Process; Turner, M.G., Gardner, R.H., Eds.; Springer: New York, NY, USA, 2015; pp. 97–142. [Google Scholar]
- Lin, R.; Zevenbergen, C.; Wang, J.; Li, Y.; Qian, L. Integration of In-VEST Habitat Quality Model with Landscape Pattern Indices to Assess Habitat Fragmentation under the Dynamic Development of Park City: Southwest China Case. Land 2024, 13, 2073. [Google Scholar] [CrossRef] [Scilit]
- Zhang, Y.; Wang, Y.; Ding, N.; Yang, X. Spatial Pattern Impact of Impervious Surface Density on Urban Heat Island Effect: A Case Study in Xuzhou, China. Land 2022, 11, 2135. [Google Scholar] [CrossRef] [Scilit]
- Seiferling, I.; Proulx, R.; Peres-Neto, P.; Fahrig, L.; Messier, C. Measuring Protected-Area Isolation and Correlations of Isolation with Land-Use Intensity and Protection Status. Conserv. Biol. J. Soc. Conserv. Biol. 2011, 26, 610–618. [Google Scholar] [CrossRef] [Scilit]
- Rashid, K.J.; Hoque, M.A.; Esha, T.A.; Rahman, M.A.; Paul, A. Spatiotemporal Changes of Vegetation and Land Surface Temperature in the Refugee Camps and Its Surrounding Areas of Bangladesh after the Rohingya Influx from Myanmar. Environ. Dev. Sustain. 2021, 23, 3562–3577. [Google Scholar] [CrossRef] [Scilit]
- Jalal, R.; Mahamud, R.; Arif, M.T.A.; Ritu, S.; Kumar, M.F.; Ahmed, B.; Kabir, M.H.; Rana, M.S.; Huda, H.N.; DeGaetano, M.; et al. Restoring Degraded Landscapes through an Integrated Approach Using Geospatial Technologies in the Context of the Humanitarian Crisis in Cox’s Bazar, Bangladesh. Land 2023, 12, 352. [Google Scholar] [CrossRef] [Scilit]
- Mang, P.; Reed, B. Regenerative Development and Design. In Sustainable Built Environments; Springer Nature: Berlin/Heidelberg, Germany, 2020. [Google Scholar] [CrossRef] [Scilit]
- Ostrom, E. Governing the Commons: The Evolution of Institutions for Collective Action; Cambridge University Press: Cambridge, UK, 1990. [Google Scholar]
- Alves, J.; Oliveira, M.; Chazdon, R.; Calmon, M.; Pinto, A.; Darvin, E.; Pereira, B. The Role of Assisted Natural Regeneration in Accelerating Forest and Landscape Restoration: Practical Experiences from the Field; World Resources Institute: Washington, DC, USA, 2022. [Google Scholar]
- Nishi, M.; Subramanian, S.M. Landscape Approaches to Ecosystem Restoration: Lessons Learned from Managing Socio-Ecological Production Landscapes & Seascapes; United Nations University Institute for the Advanced Study of Sustainability (UNU-IAS): Tokyo, Japan, 2023. [Google Scholar] [CrossRef] [Scilit]
- Seto, K.C.; Güneralp, B.; Hutyra, L.R. Global Forecasts of Urban Expansion to 2030 and Direct Impacts on Biodiversity and Carbon Pools. Proc. Natl. Acad. Sci. USA 2012, 109, 16083–16088. [Google Scholar] [CrossRef] [Scilit] [PubMed]
- Güneralp, B.; Reba, M.; Hales, B.U.; Wentz, E.A.; Seto, K.C. Trends in Urban Land Expansion, Density, and Land Transitions from 1970 to 2010: A Global Synthesis. Environ. Res. Lett. 2020, 15, 044015. [Google Scholar] [CrossRef] [Scilit]
- Chakma, M.; Hayat, U.; Meng, J.; Hassan, M.A. An Assessment of Landscape and Land Use/Cover Change and Its Implications for Sustainable Landscape Management in the Chittagong Hill Tracts, Bangladesh. Land 2023, 12, 1610. [Google Scholar] [CrossRef] [Scilit]
- UNHCR. Bangladesh Policy Brief: The Impact of Livelihood Activities among Rohingya Refugees; UNHCR: Geneva, Switzerland, 2025. [Google Scholar]
- JRP. UNHCR Joint Response Plan for Rohingya Humanitarian Crisis in Bangladesh. Available online: https://data.unhcr.org/en/documents/details/115687 (accessed on 12 May 2026).

Disclaimer/Publisher’s Note: The statements, opinions and data contained in all publications are solely those of the individual author(s) and contributor(s) and not of MDPI and/or the editor(s). MDPI and/or the editor(s) disclaim responsibility for any injury to people or property resulting from any ideas, methods, instructions or products referred to in the content. |
© 2026 by the authors. Licensee MDPI, Basel, Switzerland. This article is an open access article distributed under the terms and conditions of the Creative Commons Attribution (CC BY) license.