


Abstract
Rapid urbanization has profoundly reshaped land use patterns and intensified pressures on ecosystem structures, thereby exacerbating trade-offs and synergies among ecosystem services (ESs). Understanding ecosystem service trade-offs, synergies, and their attribution mechanisms is critical for balancing ecological conservation and regional sustainable development in rapidly developing regions. This study quantified provisioning, regulating, supporting, and cultural ecosystem services in Shandong Province from 2000 to 2020 using the InVEST model and spatial analysis. An integrated framework combining Pearson correlation and bagplot analysis was developed to identify linear and nonlinear ES trade-offs and synergies, while the XGBoost–SHAP model was applied to quantify the relative contributions of natural and socioeconomic drivers. Ecosystem service bundles were further identified using a self-organizing map to delineate spatially functional zones. The results showed that: (1) Provisioning and cultural services increased markedly, whereas regulating and supporting services generally declined. Spatially, provisioning services were concentrated in the western plains, regulating and supporting services in the central mountains and eastern hills, and cultural services in urban areas. (2) Strong trade-offs emerged between provisioning services and most regulating/supporting services, while regulating and supporting services exhibited pronounced synergies. Cultural services reflected a generally compatible relationship with other ESs. (3) Regulating and supporting services were primarily shaped by natural conditions and land use patterns, whereas provisioning and cultural services were more strongly driven by socioeconomic factors. (4) SOM clustering identified four major functional zones, the ecological core zone, the ecological degraded zone, the food production zone, and the urban composite zone, each corresponding to differentiated ecosystem functions and development trajectories. The integrated framework provides a scientific basis for ecosystem-service-oriented spatial zoning and targeted management strategies to reconcile ecological protection and urbanization in rapidly developing regions.
1. Introduction
Ecosystem services (ESs) encompass the diverse benefits that humans derive, directly or indirectly, from natural ecosystems [1,2,3]. They constitute a vital bridge between ecological integrity and human societies, underpinning human well-being through multifaceted interactions [4]. However, ongoing urbanization and industrialization are degrading ecosystem structures across many regions. This degradation disrupts fundamental ecological processes, such as hydrologic cycles [5], which in turn compromises the provision and stability of benefits perceived and utilized by society. Consequently, a systematic understanding of ES dynamics, their interactions, and underlying mechanisms is imperative. This knowledge is foundational for enhancing socio-ecological resilience, informing spatial zoning, and facilitating integrated, cross-sectoral decision-making [6,7].
Growing evidence reveals that ESs do not function independently but are interconnected through trade-offs, whereby the enhancement of one service leads to the decline of another, and synergy, whereby multiple services improve simultaneously [8]. A systematic understanding of these interactions is thus essential for optimizing ecosystem management and enhancing the overall effectiveness of ES provision [9]. Statistical methods, like Pearson and Spearman correlation analyses, have been widely used to quantify the relationships among ESs [10,11]. However, these methods are predominantly confined to identifying linear or monotonic relationships, often overlooking the intricate and inherently spatial heterogeneous nature of ES interactions. Spatial mapping techniques (e.g., the root mean square error method) have subsequently been employed [12]. Nevertheless, these approaches typically operate under the a priori assumption that synergy requires equal benefit values, and unequal values automatically signify trade-offs. This criterion, however, fails to capture nuanced interactions and may introduce bias into the assessment [13]. To address these gaps, this study employs the bagplot method, which enables the characterization of multivariate distributions in a two-dimensional space and effectively captures both nonlinear relationships and spatial heterogeneity [14]. Building on this, we develop an integrated analytical framework that combines bagplot with correlation analysis. This framework not only quantifies the strength and direction of ES relationships but also provides intuitive visualization of their spatial interactions [15]. By doing so, it facilitates the identification of spatially differentiated trade-off and synergy zones, thereby offering new insights into the underlying mechanisms of ES interactions and advancing methodological approaches in ES research.
Identifying the drivers of ESs is essential for revealing the mechanisms linking natural and anthropogenic processes [16]. However, conventional driver-analysis methods, including geographical detectors [17], geographically weighted regression [18], and structural equation modeling [19], face notable constraints when handling high-dimensional, collinear, and nonlinear data. The emergence of advanced machine learning techniques, such as random forests and gradient boosting, presents a paradigm shift for analyzing complex ES drivers [20,21]. Specifically, the Extreme Gradient Boosting (XGBoost) algorithm excels with high-dimensional data and captures critical environmental nonlinearities [22]. When integrated with Shapley Additive Explanations (SHAP), it enables the quantification of each feature’s contribution to predictive outcomes while enhancing the interpretability of model mechanisms [23]. Consequently, this study adopts an integrated XGBoost-SHAP approach to quantify the relative importance of key ES drivers. This combined approach establishes a more robust and transparent methodological basis for disentangling dominant driving mechanisms, thereby furnishing critical scientific underpinnings for refined spatial governance and ecosystem conservation and management.
Ecosystem service bundles (ESBs) denote spatially coherent patterns of co-occurring and interacting ESs within specific regions [24]. Identifying ESBs is increasingly recognized as a critical approach for elucidating the spatial heterogeneity of ES interactions and underpins service zoning for targeted ecosystem management [25]. ESB-based approaches emphasize the interaction structures among multiple ESs, thereby capturing functional integration and spatial aggregation. This perspective provides a more process-oriented understanding of ecosystem dynamics and enhances the practical relevance of ES research for territorial spatial planning and ecosystem governance. Current methodologies for ESB identification, such as principal component analysis (PCA) [26] and K-means clustering [20], focus on statistical patterns but typically overlook inherent spatial dependencies [27]. The self-organizing map (SOM) algorithm addresses this limitation by combining dimensionality reduction with topology-preserving clustering [28]. As an unsupervised neural network, SOM enables nonlinear dimensionality reduction while preserving the topological relationships within high-dimensional data, thereby facilitating the effective visualization and interpretation of complex ES interactions [29]. Consequently, SOM has become a premier method for robust ESB identification [30,31]. This study employed SOM as the core analytical technique for delineating ESB, thereby characterizing nonlinear aggregation patterns and furnishing a robust spatial foundation for targeted ecosystem management and prospective land use governance.
Shandong Province occupies a pivotal position in China’s ecological security architecture, situated at the critical nexus of the north–south ecological transition, serving as the ecological core of the Yellow River national strategy, and acting as the frontline of the Bohai Rim ecological barrier [32]. However, intense development pressures have triggered notable ecosystem degradation and the fragmentation of their services. The province’s complex topography renders it an exemplary case for study. In response, this study therefore aims to construct a comprehensive framework to systematically clarify the spatiotemporal characteristics, interactions, and driving mechanisms of ESs. The specific objectives were to: (1) quantify six key ESs (water yield, carbon storage, soil retention, habitat quality, food supply, and leisure and recreation) and map their spatiotemporal dynamics; (2) evaluate ES trade-off/synergy by integrating linear (Pearson correlation) and nonlinear (bagplot) methods; (3) identify and interpret the drivers of ESs using an interpretable machine learning (XGBoost-SHAP) framework; and (4) classify ESB using SOM to inform tailored management strategies. This study aimed to provide a scientific foundation for adaptive management policies that balance ecosystem functions and promote coordinated socio-ecological development.
2. Materials and Methods
2.1. Study Area
Shandong Province (35°05′–37°50′ N, 119°16′–122°42′ E) is situated along China’s eastern coast, bordering both the Yellow Sea and the Bohai Sea. It functions as a pivotal hub within the Bohai Rim Economic Zone and the Northeast Asia Economic Corridor. Warm and temperate monsoon climate dominates Shandong with pronounced seasonal variations and precipitation concentrated in September to October. The annual mean temperature ranges from 11 °C to 14 °C, and annual precipitation varies between 650 mm and 900 mm. Covering a total land area of 157,965 km2, Shandong has agricultural land accounting for over 70%, of which approximately 65% is cultivated land. The topography of Shandong contains interwoven mountains, hills, and plains/basins with mountains and hills in the center, low-lying plains in the southwest and northwest, and gently undulating hills in the east (Figure 1). It encompasses a wide range of ecologically heterogeneous landscapes, from mountains and hills to intensively farmed plains, and is currently undergoing the dual processes of rapid urbanization and agricultural intensification. These overlapping pressures have triggered severe ecological problems, including soil degradation, water scarcity, coastal pollution, and wetland degradation, posing a threat to regional ecological security and sustainable development [33]. As a key node in China’s ecological security framework, Shandong Province is a region characterized by intense human–land interactions. Its high proportion of farmland and long-term development pressures have further intensified the conflicts and synergies among provisioning, regulating, and supporting ecosystem services. Therefore, analyzing the interactions among ecosystem services in Shandong Province not only helps reveal the region’s unique dynamics but also provides insights of universal reference value for other rapidly developing regions facing similar sustainable development challenges.
Figure 1.
Overview of Shandong Province. (a) Location; (b) elevation zoning. From west to east: (I) the western plain region (LX), (II) the central mountainous region (LZ), and (III) the eastern hilly region (JD); (c) land use and administrative divisions.
2.2. Data Sources
A multi-source dataset spanning five representative years (2000, 2005, 2010, 2015, and 2020) was employed to evaluate the ESs. These years, selected at five-year intervals, capture key stages of land use change and ecological evolution while minimizing the effects of short-term variability and data noise (Table 1). To eliminate discrepancies in spatial resolution and coordinate systems among datasets, all data were subjected to standardized preprocessing. Specifically, raster datasets were resampled to a uniform spatial resolution of 30 m × 30 m using nearest-neighbor or bilinear interpolation, consistent with the native resolution of the land use data. Subsequently, all datasets were projected into the WGS 1984 UTM Zone 50 N coordinate system. Based on this standardized framework, a unified 1 km × 1 km grid was constructed to support subsequent correlation analysis, driver modeling, and ecosystem service clustering. This approach balances the need to represent spatial heterogeneity with computational efficiency. All resampling and spatial analyses were conducted using ArcGIS 10.8 and the R programming environment.
Table 1.
Data sources and other information.
2.3. Ecosystem Service Quantification
To comprehensively assess the ESs in Shandong Province, six representative ESs were selected from four categories [34]: provisioning (food supply), supporting (habitat quality), regulating (water yield, soil retention, and carbon storage), and cultural services (leisure and recreational).
2.3.1. Food Supply
Food supply (FS) is a key ecosystem service provided by agricultural ecosystems. As one of China’s major grain-producing provinces, Shandong plays an essential role in safeguarding national food security. According to current land classification standards, vegetables, grains, and oil crops are all included within the farmland food supply category. Thus, FS was quantified by the grain production (i.e., vegetables, grains, and oil crops) per unit of the cultivated land, which was quantified by NDVI [35].
where represents the grain production allocated to the ith grid cell of the cultivated land; is the total grain production across all prefecture-level cities in the study area; is the NDVI value of the ith grid cell; and is the sum of NDVI values for all cultivated land in the study area.
2.3.2. Habitat Quality
Habitat quality (HQ) refers to the capacity of the ecosystem to provide living space for species and communities. HQ can be represented by the biodiversity of the study area; thus, it can be achieved by the habitat quality module of the InVEST model [36].
where denotes the habitat quality of land use type j at grid cell x; D represents the habitat stress level for type j at grid cell x; k is the semi-saturation constant; and z is the normalization constant. For specific parameter settings, please refer to Table A3 and Table A4 in Appendix A.
2.3.3. Water Yield
The provision of fresh water is a basic ecosystem service that contributes to social welfare in various ways. The water yield module of the InVEST model, which focuses on simulating hydrological processes, was used to assess water yield (WY) service in Shandong [37]. To enhance model applicability to regional hydrological conditions, the plant-available water content was calculated according to the empirical equation proposed by Zhou et al. [38]. The evapotranspiration coefficients and root-system parameters for each land use category were assigned according to Ren et al. [33]. The Z parameter was calibrated using statistics from the Shandong Water Resources Bulletin, resulting in an optimal value of 2.5 [37].
where Y(x) represents the annual water yield (mm) for grid cell x within the watershed; AET(x) denotes the annual actual evapotranspiration (mm) for grid cell x; P(x) indicates the annual precipitation (mm) for grid cell x. For specific parameter settings, please refer to Table A1 in Appendix A.
2.3.4. Soil Retention
Soil retention (SR) service, as an important regulating function of the ecosystem, is a crucial guarantee for preventing regional land degradation and reducing the risk of flood disasters. SR reflects the capacity of ecosystems to prevent soil erosion and retain sediment [39]. The quantification of SR was achieved by the sediment retention module of the InVEST model, which is operated based on the modified universal soil loss equation (USLE) (Equations (4)–(6)).
where SDR represents the annual soil retention (t/ha); RKLS represents the potential soil loss (t/ha); and USLE is the actual soil loss (t/ha). R (i.e., the rainfall erosion index, MJ/mm/(ha/h/a)) was calculated according to the yearly rainfall erosivity model [40]. K represents the soil erosion factor, and was calculated by the EPIC model [41]. The length-slope index of the slope (LS) was calculated from the normalized difference vegetation index using a two-dimensional pixel model. C represents the cover-management factor. The P value (the support practice factor) was determined by referencing previous relevant studies and considering local land use and agricultural activities [42]. For specific parameter settings, please refer to Table A5 in Appendix A.
2.3.5. Carbon Storage
Carbon storage (CS) refers to the capacity of terrestrial ecosystems to regulate the global climate by absorbing and retaining carbon in vegetation, soil, and dead organic matter. In this study, the carbon storage module of the InVEST model was applied to estimate CS service (Equation (7)).
where is carbon stock; represents the above-ground biomass carbon pool; is the below-ground biomass carbon pool; represents the soil organic matter carbon pool; and represents the pool of dead organic matter carbon. Corresponding carbon density parameters were locally calibrated, making it possible to support quantitative assessments of regional carbon stocks [43]. For specific parameter settings, please refer to Table A2 in Appendix A.
2.3.6. Leisure and Recreation
Leisure and recreation (LR) represent intangible ecosystem benefits to human well-being. Generally, ecosystems exhibit higher recreational service capacity when they possess greater naturalness, improved accessibility, a higher density of tourist attractions, and elevated surrounding population density [44]. Following the MAES framework [45], this study selected land use intensity, accessibility, tourist attraction density, and population density as key factors for the quantitative evaluation of recreational services.
where denotes the recreational service value of grid cell i; and , , , and represent the normalized values of population density, tourist attraction core density, road accessibility, and land use intensity, respectively. The kernel density of tourist sites and road accessibility were calculated using point-density and Euclidean distance analysis, respectively. The calculation of land use intensity followed the method proposed by Su et al. [46].
2.4. Theil–Sen Trend Analysis and Mann–Kendall Test
The Theil–Sen trend analysis and Mann–Kendall (MK) test were applied to examine temporal trends in six ESs based on five time points (2000, 2005, 2010, 2015, and 2020) at the pixel level (30 m × 30 m). This provides unprecedented spatial decision support for revealing the spatial heterogeneity patterns of ESs and identifying cold- and hotspots of ES changes. The Theil–Sen analysis, a robust linear regression method, estimates the median slope from sample points and effectively reduces the influence of outliers and extreme values [47]. Meanwhile the nonparametric Mann–Kendall test was applied to assess the significance of trends in ecosystem service changes. The Mann–Kendall test does not require the data to follow a normal distribution and is robust to missing values and outliers [48]. A significance level of α = 0.05 was adopted to determine statistically significant temporal trends of different ecosystem services in this study.
2.5. Ecosystem Service Trade-Off/Synergy Analysis
The trade-off/synergy analysis of the ESs was performed in four steps. The first was the preprocessing of ES assessment results. The quantification results of six ESs were consolidated onto a 1 km × 1 km grid, with each cell assigned a unique identifier. The Python 3.12.9 Quantile function was applied to standardize the ES data to follow a normal distribution. Secondly, Pearson’s correlation coefficient (r) was calculated. When combined with bagplot characteristics, r quantified the trade-off/synergy relationships between two ESs [14]. The six ESs covered in this study were categorized into 15 pairs. Thirdly, bagplot visualization was conducted. Using the depth median as a reference, the bagplot can be divided into four quadrants with each representing a potential relationship between ecosystem services A and B (Figure 2). If the bag primarily spans from the bottom-left to the top-right quadrant, covering negative/negative and positive/positive spaces, the two services are considered synergistic. Conversely, if the bag primarily spans from the top-left to the bottom-right quadrant, covering positive/negative and negative/positive spaces, the services exhibit an overall trade-off. If all four quadrants are equally covered, the relationship can be regarded as compatible. Fourthly, the interaction intensity of ecosystem services was ranked. The cumulative correlation coefficient (R) served to rank ESs based on their overall synergistic or trade-off effects with all other services in the correlation matrix. Specifically, the cumulative Ri for a given ecosystem service i is the sum of all pairwise correlation coefficients ri [49], reflecting the service’s overall level of synergy or conflict. A more positive cumulative Ri indicates stronger synergistic interactions or fewer trade-offs with other services. By mapping all data points within the bag onto selected ecosystem service pairs, regions of synergy (positive/positive and negative/negative), trade-offs (positive/negative and negative/positive), and irrelevance (outliers) were identified and analyzed to form comprehensive ecosystem service interaction maps.
Figure 2.
Example of a bagplot. (The red point (*) denotes the depth median. The dark blue region (bag) contains 50% of the observations, and the dashed boundary (fence), obtained by inflating the bag, defines the threshold for outliers. All points outside the fence are considered outliers. The four quadrants delineated by the depth median represent the spaces used in the analysis).
2.6. Analysis of Ecosystem Service Drivers
2.6.1. Selection of Drivers
The identification of the factors driving ESs is the key to understanding the complex coupling mechanism between society and ecosystem. By clarifying the intensity and spatial heterogeneity of the influencing factors, it is possible to accurately identify the key regions and core driving factors that are most sensitive to changes in ecosystem services. This provides a scientific target for formulating differentiated and efficient ecological protection and restoration measures. Based on fishing net data with a spatial resolution of 1 km × 1 km within the study area, and incorporating existing research alongside the natural and socioeconomic characteristics of Shandong Province, 15 natural and anthropogenic variables, including precipitation (PRE, X1), potential evapotranspiration (PET, X2), temperature (TEM, X3), digital elevation model (DEM, X4), slope (SLOPE, X5), population intensity (POP, X6), gross domestic product (GDP, X7), nightlight intensity (NL, X8), normalized difference vegetation index (NDVI, X9), net primary productivity (NPP, X10), largest patch index (LPI, X11), contagion (CONTAG, X12), Shannon diversity index (SHDI, X13), construction area (CON, X14), and cultivated land area (CUL, X15), were selected.
2.6.2. XGBoost Model
The XGBoost model, a machine learning algorithm derived from gradient boosting decision trees [50], was employed to analyze the drivers of ESs in Shandong Province. This model integrates optimization techniques like regularization, pruning, and parallel computing, and thus can be widely used in classification, regression, and feature-importance-ranking studies [51]. Previous studies have proved its superior performance, particularly in raster data modeling [52]. Grid search combined with 10-fold cross-validation was applied to optimize hyperparameters and prevent overfitting. In total, 80% of the dataset was used for model training, while the remaining 20% was reserved for validation. The results of modeling trade-offs/synergies among different ESs using XGBoost yielded R2 ranging from 0.62 to 0.95 (Table 2). This indicates that the model demonstrated satisfactory fit across the test datasets, satisfying the model’s assumptions and confirming the suitability of the model.
Table 2.
Training results of the XGBoost model for ESs in Shandong Province in 2000 and 2020.
2.6.3. Shapley Additive Explanations
The Shapley Additive Explanations (SHAP) values help to interpret the results of the XGBoost due to the complex internal decision mechanisms of the model. This transparency and interpretability step is particularly essential for raster data analysis [53]. SHAP, originated from the Shapley value in cooperative game theory, calculates the marginal contribution of features to the model output, thereby clarifying the decision-making logic of XGBoost from both global and local levels (Equation (9)).
where represents the SHAP value of feature i. Specifically, positive SHAP values indicate that the feature positively influences the model results; conversely, negative values signify suppressing influences. The absolute SHAP value characterizes the magnitude of the influence, with larger values indicating a greater degree of impact [54]. N is the set of all features; is a subset of features excluding i; indicates the model output when only the feature subset is used for prediction; and denotes the predicted value obtained when feature i is added to the subset .
2.7. Identification of Ecosystem Service Bundles
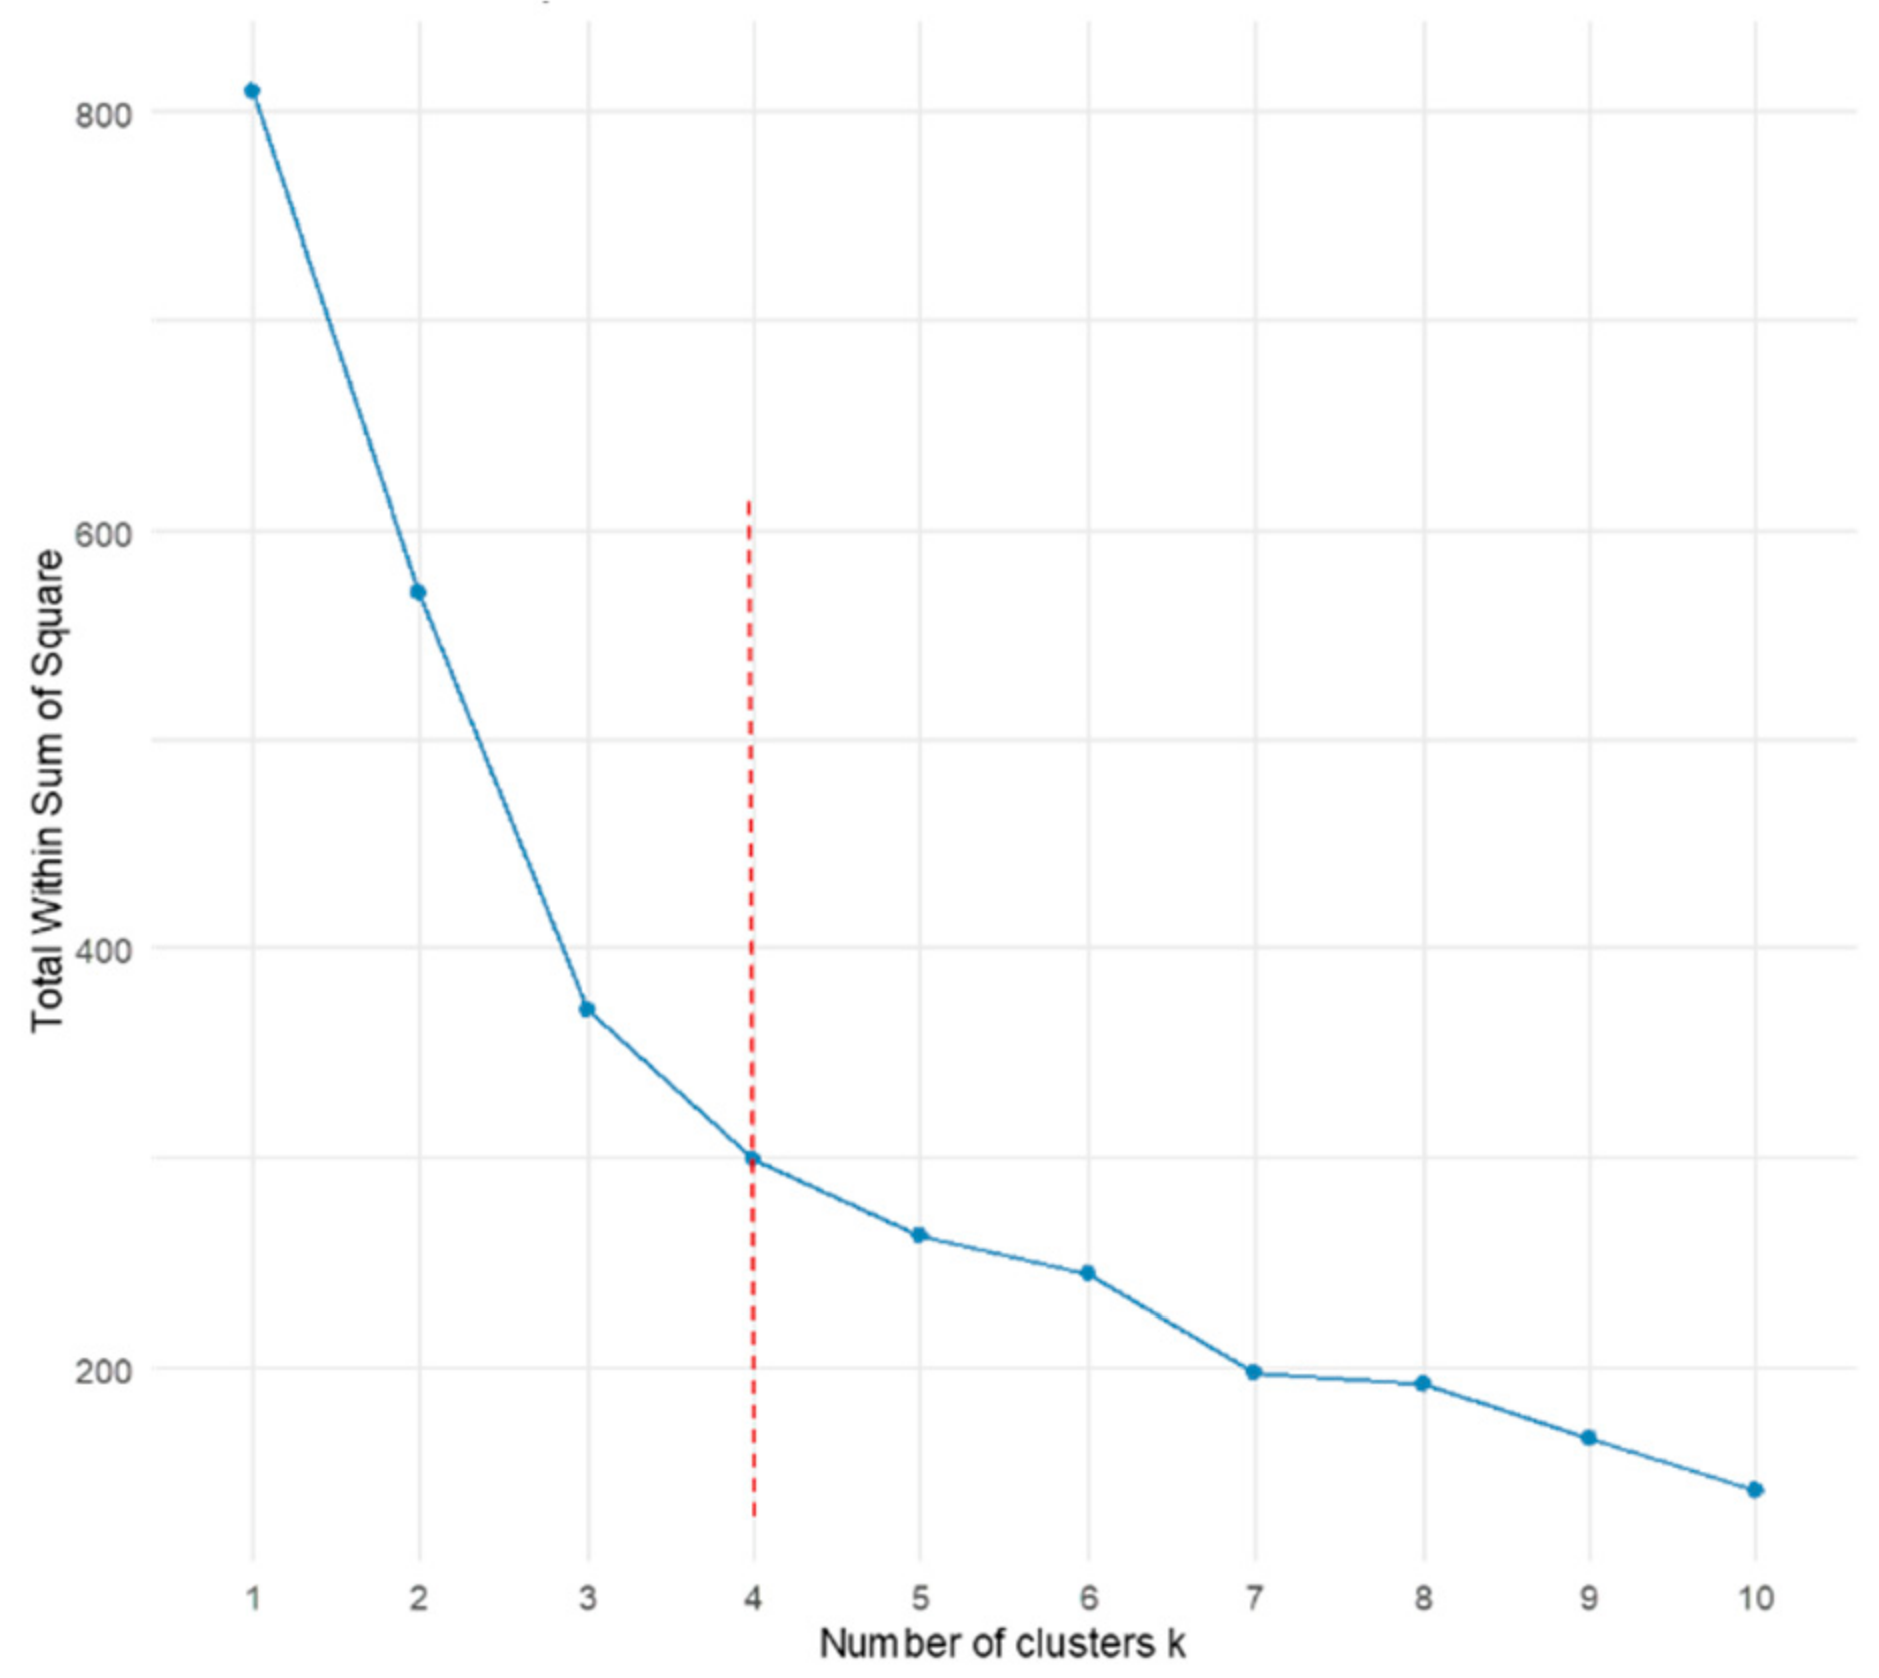
Ecosystem service bundles (ESBs) cluster similar ESs and map the spatial pattern of ES aggregation. The identification of ESBs helps to divide a region into different spatial units (i.e., ecosystem service zoning); thus, precise ecological protection and differentiated management strategies could be put forward. This study adopted a combined “SOM + K-means” approach, integrating the mean values of six types of ESs across 136 counties in Shandong Province to identify regional ESBs. SOM was first trained using the Kohonen package in R 4.0.2; the codebook vectors (i.e., weight vectors of each neuron) generated by SOM were then input into K-means for secondary clustering by minimizing the within-cluster sum of squares. The Elbow Method was used to determine the optimal number of clusters (Figure A1 in Appendix B). A distinct change can be observed when the cluster number was 4. Thus, 4 ESBs (B1,…,B4) were identified with each representing a distinct combination of ecosystem functions.
3. Results
3.1. Change in Land Use
Table 3 presents the spatial distribution and temporal changes in land uses in Shandong from 2000 to 2020. Cultivated land, accounting for approximately 66%, was the dominant land. The proportion fully demonstrated the status of Shandong as a major agricultural province and a key grain-producing area. Meanwhile, as a large economic and populous province, Shandong has witnessed a rapid growth in its construction land, which supported densely populated towns, developed industries, and widely dispersed rural settlements. Grassland, forestland, and water bodies were important components, accounting for approximately 17% in total.
Table 3.
Land use changes in Shandong Province in 2000–2020.
From a temporal perspective, Shandong experienced a continuous decline in both cropland and unused land between 2000 and 2020, with cumulative reductions of 2647.54 km2 and 1689.63 km2, respectively. In contrast, built-up land and water bodies expanded steadily, increasing by 7153.20 km2 and 3626.89 km2, respectively. These changes reflected the strong spatial expansion pressures induced by urbanization and industrialization, along with the ongoing implementation of regional water conservancy and ecological restoration projects. Furthermore, influenced by ecological protection policies and adjustments in land use structure, forestland and grassland areas exhibited a general downward trend, with grassland showing particularly notable reductions.
Figure 3 depicts that the land use transfer pattern in Shandong Province exhibited distinct characteristics. Specifically, cropland experienced the most extensive transformation, primarily converted to built-up land. This conversion occurred in varying degrees, reflecting the continuous encroachment and transformation of farmland driven by urbanization and industrialization. Forestland and grassland mainly converted into cropland and built-up land. Spatially, these transformations displayed distinct clustering patterns in JD and central mountains, suggesting that ecological spaces were under considerable pressure. Water bodies and unused land likewise experienced conversion, primarily into built-up land and cropland, with concentrations along the northern coastline and major river or lake systems. In contrast, the most substantial land conversion was characterized by the expansion of built-up land, primarily resulting from the transformation of farmland. The most notable increases in built-up land occurred within coastal urban agglomerations and areas surrounding Jinan, highlighting the continuous expansion of built-up land areas resulting from the rapid urbanization process.
Figure 3.
Change in land use in Shandong Province from 2000 to 2020. (a) Change in land use structure; (b) conversion of land use; (c) spatial change in land use.
From a regional perspective, three sub-regions in Shandong experienced substantial conversion of arable land to built-up land, although notable regional differences were observed. In LX, the dominant trend was the conversion of built-up land and unused land into cropland, demonstrating the significant effectiveness of land consolidation and reclamation efforts under the stringent policy of protecting the cropland red line. Similar conversion patterns primarily characterized by the transformation of grassland into cropland and built-up land can also be found in LZ and JD. This process resulted in a partial reduction in ecological land use, underscoring the crowding-out effect of increasing construction demand on ecological space.
3.2. Spatial–Temporal Evolution of Ecosystem Services
3.2.1. Temporal Dynamics
The annual mean values of ESs in Shandong from 2000 to 2020 displayed notable differences (Table 4). Specially, FS exhibited the most substantial and consistent upward trend, increasing from 444.402 t·ha−2 in 2000 to 650.709 t·ha−2 in 2020 with a cumulative growth of 46.42%. The increase was mainly driven by advances in agricultural technology, crop variety improvements, and the enhancement of farmland infrastructure, reflecting the intensification effects of modern agricultural management [55]. HQ displayed a dynamic decreasing trend, decreasing by 11.47% between 2000 and 2015 and subsequently recovering by 2020, although it remained below the level in 2000. Nevertheless, the lower level of HQ in 2020 also elucidated the lag effect and long-term process of ecosystem recovery [56]. WY exhibited a fluctuating growth trend from 2000 to 2020 with a net gain of 75.112 mm and an average annual increase of 3.76 mm. The fluctuating growth in WY epitomized the dynamic interplay between human water demand and the natural capacity of water resources. This also indirectly demonstrated that the WY service may be subject to multiple unstable factors. Despite a temporary decline to 172.395 t·ha−2 in 2015, the region’s long-term SR capacity has significantly improved. The rise in SR was closely associated with ecological restoration initiatives such as the Grain-for-Green Program and soil and water conservation projects, which improved vegetation cover, enhanced erosion resistance, and strengthened soil retention capacity [57]. CS reflected a minor weakening with a decrease rate of 2.01%. The deterioration of CS indicated that the ecological space (e.g., forests and grasslands) capable of providing CS has become fragmented, and this fragmentation was caused by the encroachment of agricultural expansion and urbanization. This phenomenon is also applicable in other rapidly developing regions [58]. The increase in LR was steady with an annual growth rate of 4.79%, which vividly portrayed the rising demand for compensation of ‘natural deficiency’ as well as the upgrading of LR consumption caused by the increase in residents’ income and leisure time [59].
Table 4.
Annual average of ecosystem services in Shandong Province.
3.2.2. Spatial Characteristics
Figure 4 depicts that all types of ESs exhibited marked spatial heterogeneity, reflecting clear regional differentiation. WY displayed a gradient decrease from southeastern to northwestern Shandong. This pattern was similar to precipitation on the one hand; that is, in terms of space, areas with heavy precipitation (i.e., the southeastern coastal zone) also have a strong potential water production capacity. On the other hand, the distribution of WY was spatially misaligned with that of agricultural water consumption, indicating that intensive agricultural water use may be the main driver of its long-term variation [60]. The high-value areas of CS and SR were concentrated in regions with extensive forest and grassland, like the eastern and central mountains, where strong vegetation-related carbon sequestration and soil conservation functions were mainly distributed. Meanwhile areas with low values were mainly in the surrounding plains, where intensive agriculture and severe soil erosion weaken ecosystem service performance. The spatial distribution of HQ closely resembled that of CS and SR with high-value zones (>0.8) concentrating in central Shandong and areas with dense water bodies, and low-value zones (<0.2) occurring in highly urbanized areas with significant human disturbance. FS largely mirrored the spatial distribution of cropland, exhibiting generally high values. In the western plain, where extensive farmland and favorable natural conditions support large-scale crop cultivation, the values of FS were higher than 500 t·hm−2. In mountainous areas, FS was below 200 t·hm−2 due to limited arable land and lower grain production capacity. As for LR, distinct spatial clustering characteristics can be observed with high-value areas (>0.4) concentrated in urban cores. This phenomenon indicates that it is not the ecosystems of urban areas themselves that are inherently superior, but that their value rather stems from a potent interplay between supply and demand dynamics and socioeconomic drivers.
Figure 4.
Spatial distribution of ecosystem services in Shandong Province from 2000 to 2020.
Viewed from each sub-region, the spatial distribution of each ecosystem service exhibited regional variations and clustering patterns (Figure 4). This may closely link to variations in topography, vegetation cover, and dominant land use type [61]. JD and LZ feature high ecosystem integrity and landscape diversity, serving as crucial ecological barrier zones within the province [62]. Consequently, these areas exhibited robust ecosystem regulating services. For example, JD constituted a high-value zone for services like WY, HQ, CS, and SR. This is probably due to the fact that its complex topography and dense vegetation provided natural foundations for synergistic ecological functions, while favorable hydrological conditions collectively sustain robust ecological regulating capacity. Similarly, LZ conferred notable advantages in both regulating (e.g., CS and SR) and cultural services. In contrast, the flat terrain and intensive agricultural practices in LX ensure stable agricultural outputs; yet the homogeneous farmland-dominated landscape and highly fragmented natural ecosystems result in weaker supporting and regulating ecosystem services. This further highlights the trade-offs that exists between ecosystem services [63].
3.2.3. Trend Analysis of Grid Scale
Figure 5 illustrates the spatial patterns of changes in six ESs between 2000 and 2020. Specifically, the annual average of WY exhibited a pronounced trend of declining, with degraded areas accounting for 47.99%, primarilsy concentrated in agricultural hubs such as LX. This pattern suggests excessive water consumption driven by intensive irrigation may impair regional hydrological process [64]. In contrast, localized areas within LZ and JD show slight increases in WY, attributable to vegetation restoration and enhanced water retention. CS also demonstrated an overall decline trend as degraded areas are nearly ubiquitous across the province. Minor improvements of CS can only be observed in a few mountainous regions, reflecting the persistent weakening of vegetation carbon sink functions due to urban expansion, farmland reclamation, and ecological space compression. SR remained largely stable, with over 90% of areas unchanged. Zones of functional improvement or decline were primarily concentrated in LX, where spatial variations closely correspond to localized ecological restoration initiatives and disturbances from slope agriculture. HQ exhibited the most extensive degradation, with 83.78% of its range showing a declining trend. Degraded areas were spatially distributed across nearly the entire province. This fact indicated that despite localized ecological restoration successes, habitat fragmentation pressures continue to intensify at the regional scale, posing a major challenge for future ecological conservation and restoration [65]. Conversely, FS showed continuous improvement, with gains concentrated in the core agricultural zones of LX, indicating the effectiveness of intensive management and high-yield cultivation [43]. LR service displayed a relatively balanced spatial pattern as stable areas were broadly distributed across the three sub-regions. This distributing characteristic also suggests that the impacts of urban–rural development and ecotourism expansion across regions may offset each other, which is consistent with previous findings [66].
Figure 5.
Trend of the annual average of each ecosystem service on grid cell in Shandong Province. (Each grid cell is classified into three categories based on the trend analysis: I (decreased), II (no significant change), and III (increased). The bar charts below each map indicate the proportion (%) of area corresponding to each category).
3.3. Trade-Off/Synergy of Ecosystem Services
3.3.1. Temporal Change in Trade-Off/Synergy
Figure 6 presents the bagplots, correlation coefficients, and ranking results for six ESs in Shandong Province. It can be seen that trade-off, synergy, and compatibility relationships coexisted, reflecting the complexity of ecosystem services in Shandong. Specifically, seven pairs of ESs exhibited synergistic relationships, primarily between regulating and supporting services, which coincided with Li et al. [67]. That is mainly because supporting services are the material basis and ecological prerequisite for the generation and maintenance of regulating services, while the enhancement of regulation services, in turn, will protect and consolidate supporting services. For example, the most tightly coupled and sustainable synergy occurred between CS and HQ, with r values consistently above 0.84 since 2005 and bagplots displaying elongated elliptical shapes along the positive diagonal. This confirms that an ecosystem with high-quality habitats is usually a powerful carbon sink; conversely, protecting and restoring ecosystems to enhance carbon sequestration will inevitably improve the quality of their habitats. The finding is consistent with that from relevant studies [68,69,70]. Nevertheless, the synergistic relationship between CS-SR and SR-HQ gradually weakened, indicating that changes in land use patterns and intensified human activities disrupted previously tightly coupled ecological processes, thereby reducing synergistic effects [71].
Figure 6.
The bagplots and correlation coefficients of two ecosystem services in Shandong Province. (Note: *** = correlations significant at 0.01 level. Ri = the cumulative correlation coefficient for a specific ES. Rank = the order of ESs synergistic potential. ns, nt, nn = the number of ESs showing synergistic, trade-off, and compatible relationships, respectively).
Trade-offs were more likely to occur between provisioning services and regulating or supporting services (e.g., WY-HQ, WY-CS, HQ-LR, CS-LR, and SR-FS) [13]. For instance, the significant negative r value (a mean value of −0.42) between FS–WY reflects the pressure that agricultural expansion places on water resources and ecological functions. Their corresponding bagplot confirmed the persistent trade-off constraint as the slanted funnel shape spanned from the positive/negative to negative/positive space. Xu et al. also found that agricultural intensification and increased irrigation were key drivers of regional water scarcity and ecosystem degradation [72,73].
Fewer pairs of ESs exhibited compatibility relationships (|r| < 0.1), with r approaching zero and no discernible bias in the bagplot. This is primarily observed between LR-SR and LR-FS, where correlations fluctuated slightly but generally showed a declining trend. This demonstrates that under specific management arrangements, two services (e.g., LR-SR and LR-FS) may coexist without interference or with only minimal impact, thereby enabling multi-objective management. For instance, developing agritourism allows visitors to cultivate and experience nature (cultural services); as long as it is properly managed (e.g., limiting areas and controlling the number of people), it will not cause serious damage to the ecological regulating functions (e.g., SR) and FS (providing services) of the core area. The finding that there were no significant interactions between recreational services and other services is different from others [12]. That is mainly because LR, as a cultural service, depends more heavily on regional socioeconomic factors, like population, tourism resources, and transportation accessibility, than natural ecological processes, resulting in weaker linkage with regulating, provisioning, and supporting services. These findings also suggest that future research should incorporate finer-scale spatial data and ecological indicators to more comprehensively reveal potential connections between cultural services and other ESs.
Additionally, Figure 6 illustrates the number of interactions, i.e., synergistic, trade-off, and compatible, for each ESs pair. Based on cumulative Ri rankings, SR emerged as the service with the highest cumulative R in the study area, indicating the greatest synergistic potential. SR maintained positive correlations with all other services except FS (r = −0.16). CS and HQ followed, both showing strong synergistic effects. In contrast, FS and WY exhibited more pronounced trade-offs, displaying negative correlations with all other ESs. Over time, WY has shifted from a synergistic to a trade-off relationship.
3.3.2. Spatial Change in Trade-Off/Synergy
Provisioning services predominantly exhibited trade-off relationships with other services (e.g., FS-WY and FS-SR), with trade-off areas accounting for more than 45% of the total (Figure 7). These areas were primarily concentrated in LX and the mountains in LZ and JD. This was mainly because that steep terrain and scarce arable land in LZ and JD constrained FS while the intact ecosystems maintained relatively high WY and SR [43]. Conversely, intensive fertilizer and irrigation inputs in LX elevated FS but reduced WY and SR by altering hydrological and soil processes. The synergistic zones of provisioning services with other services (e.g., FS-HQ and FS-CS) were mainly in the peripheral areas of Shandong. For example, positive–positive synergies (e.g., FS-HQ) were concentrated in the southeastern coast, likely driven by favorable hydrothermal conditions and intensive agricultural management that enhance ecosystem functioning and sustain multiple services (e.g., water conservation, CS, SR, and HQ) [43]. In contrast, negative–negative synergies (e.g., FS-CS) were mainly distributed in the northern province area, where limited water availability and extensive land use practices jointly suppressed ecosystem performance [74].
Figure 7.
Spatial distribution of trade-off/synergy between two ecosystem services in Shandong Province.
Regulating and supporting services predominantly exhibited synergistic relationships (e.g., WY-SR, CS-SR, CS-HQ, and SR-HQ), with synergistic areas covering more than 50%. Specially, positive–positive synergy (e.g., WY-SR and SR-HQ) zones were mainly distributed in the Taiyi, Yimeng, and Yantai–Weihai mountains of LZ and JD. This is probably due to the fact that these areas are ecologically intact with well-preserved ecosystem structures, which provides superior natural conditions for the production of a variety of ecosystem services (e.g., water conservation, CS, SR, and HQ) [74]. By contrast, negative–negative synergy (e.g., CS-SR and CS-HQ) zones were mainly distributed across the LX, where intensive cultivation and long-term soil–water degradation jointly diminish vegetation resilience and weaken ecosystem regulatory performance [74]. Moreover, the trade-off zones of supporting and regulating services (e.g., WY-CS and WY-HQ) were predominantly located in densely populated urban and certain agricultural regions, driven by impervious-surface expansion, soil compaction, pollution, and hydrological alteration that collectively diminish biodiversity and regulatory capacity [75].
The proportions of trade-offs and synergies between cultural and regulating/supporting services (e.g., LR–WY, LR–CS, LR–HQ, and LR-SR) were relatively similar. Spatially, positive–positive zones (e.g., LR-SR and LR-WY) were concentrated in the LZ mountains and urban cores, where high naturalness, intact ecosystems, and dense recreational resources jointly enhance both LR and ecological functions (e.g., WY, SR, CS, and HQ). Negative–negative zones (e.g., LR-SR and LR-WY) were predominantly found in LX, reflecting intensive cultivation and landscape homogenization sites. Trade-off zones between cultural and regulating/supporting services (e.g., LR-CS, LR-HQ, and LR-FS) occurred mainly in JD and peripheral central mountains, resulting from spatial mismatches between high ecological integrity and sparse recreational resources [76].
Overall, the trade-off/synergy of ESs in Shandong exhibited pronounced spatial variation. More specially, LX was dominated by trade-off relationships, mainly the trade-off of provisioning and regulating services (e.g., FS-WY and FS-SR). Intensive agricultural practices and urban expansion in this area have substantially increased provisioning services while weakening regulating and supporting services. In LZ, where ecology focused and multifunction coexisted, ecological (e.g., WY, CS, SR, and HQ) and cultural services (e.g., LR) reinforced each other to maintain high ecological stability. JD experienced the synergistic enhancement of services like water conservation, carbon storage, and habitat quality, forming a “high synergy” zone. In addition, it is worth noting that the spatial extent of trade-off/synergy zones between different service pairs is positively correlated with the absolute value of their correlation coefficients (r); the greater the absolute value of r, the larger the corresponding area of trade-off/synergy. This finding indicates that the strength of relationships between ecosystem services, whether trade-off or synergy, is directly reflected in the breadth of their spatial influence. The stronger the relationship, the wider the geographical area affected. The result corroborates previous studies [77].
3.4. Drivers of Ecosystem Services
Figure 8 shows that the drivers of six ESs varied significantly across ES types and temporal scales, reflecting their inherent complexity. More specifically, provisioning services (i.e., FS) were primarily influenced by both vegetation and socioeconomic factors. For example, NDVI consistently remained a key positive determinant of FS, demonstrating the high correlation between vegetation cover and crop production potential [78]. By 2020, the influence of POP and NL increased, whereas the effects of NPP and PRE weakened, suggesting that socioeconomic factors exert a greater influence on FS than natural factors. The finding clearly reflects that the actual FS capacity of a region is no longer simply determined by its natural endowments, but more by its socioeconomic endowments, namely the economic vitality, capital capacity and market size represented by POP and NL [74].
Figure 8.
Temporal changes in the ranking of the drivers for each ecosystem service.
The reason why the spatial pattern of regulating services was basically stable in the previous analysis may be that natural conditions and land use pattern constitute the basis of these services. Natural conditions (e.g., climate and topography) determine the baseline and potential of the ecosystem, whereas land use pattern shaped by human activities such as agriculture and urban construction serves as the carrier of ecological processes. For example, PRE, SLOPE, CON and CUL have consistently remained key factors influencing WY whether in 2000 or 2020. As for CS, DEM, SLOPE, CON and CUL were primary drivers that remained largely unchanged. Both reaffirm the persistent regulatory role of natural factors and land use in shaping WY and CS dynamics.
Supporting services provide the necessary foundation and prerequisite for the production of all other types of ESs, and their formation process is usually very slow (e.g., soil formation takes hundreds of years). The impact of their changes on the ecosystem is profound and long-term; once damaged, it is extremely difficult to restore. It is precisely because of this feature that HQ was more vulnerable to anthropogenic disturbance, with CON, CUL, and NL all exerting negative effects in 2000. The influence of human activities on supporting services further intensified by 2020 as negative effects from socioeconomic factors such as POP and NL deepened. This phenomenon indicates that accelerated urbanization continued to impose mounting pressure on ecosystems and exacerbate disturbance levels.
Cultural service was primarily influenced by socioeconomic factors, which exhibited considerable temporal fluctuations. GDP and PET exerted persistent positive influences on LR, reflecting the continued enhancement of leisure comfort and recreational opportunities. However, the influence of NL increased markedly in 2020, surpassing that of natural factors. This shift suggests that as regional economies expanded and public demand for recreation grew, socioeconomic activities gradually became the dominant determinants of cultural services, while the relative importance of natural factors declined.
Overall, the analysis of influencing factors for four types of ESs elucidates the combined effects of both the inherent constraints of natural conditions and the ongoing intensification of human activities. Over time, the influence of land use and socioeconomic factors has progressively increased, reflecting a dynamic shift in ESs from being primarily nature-driven to a composite human–land-interaction-driven system.
3.5. Zoning Results of Ecosystem Services
According to the classifying results of ESBs determined previously, multiple ESs that appear in a specific combination form in a certain area were further identified, establishing four corresponding ecosystem service zones, namely the food production, ecological core, urban composite, and ecologically degraded zones (Figure 9).
Figure 9.
Clustering of ecosystem service bundles and corresponding ecosystem service zoning in Shandong Province.
3.5.1. Food Production Zone (B1)
The food production zone encompassed the plains in LX, accounting for approximately 62.54% of the total area. The land use structure was overwhelmingly dominated by cropland, which accounts for 80.17% of the land. In terms of dominant ESs and their interactions, this zone exhibited a typical trade-off-dominated structure, where provisioning services (i.e., FS) are significantly enhanced at the expense of regulating and supporting services (e.g., HQ, SR, CS, and WY). This pattern reflects intensive agricultural practices and strong human intervention, leading to ecological simplification and reduced ecosystem resilience. Combined with the previous analysis, the continued growth of population and economic activities in this zone posed threats to the sustained supply of FS capacity. Coupled with the future food security strategy, the task of this zone as the national granary would become increasingly severe in the long run. How to ensure food security without damaging the ecology is a key direction that needs to be investigated. Therefore, the core management objective of this zone is to stabilize and enhance grain production capacity while minimizing its negative ecological impacts through enhancing the protection of cropland, promoting water-saving irrigation, and advancing ecological farmland management, thereby guiding agricultural development toward more environmentally friendly and less input-intensive practices (Figure 10).
Figure 10.
Management strategy for each ecosystem service zone.
3.5.2. Ecological Core Zone (B2)
The ecological core zone was primarily distributed across the mountains in LZ and JD, covering approximately 18.98% of the provincial territory. Forest (39.03%) and grassland (26.30%) were dominant land uses. This zone was characterized by consistently high levels of regulating and supporting services and strong synergies among CS, HQ, SR, and WY, indicating a stable, well-functioning ecological system dominated by natural processes. These synergistic relationships are principally driven by natural factors—precipitation, topography, and net primary productivity—which collectively enhance vegetation coverage and ecosystem multifunctionality, reinforcing the internal coherence and resilience of this zone. Shandong Province has designated this zone as a key soil and water conservation area, further intensifying its advantages in regulating and supporting services. Thus, the future development of this zone should consolidate and enhance its ecological regulating and supporting functions (Figure 10). In addition, a mechanism for realizing the value of ecological products should be developed (e.g., high-quality water rights trading, carbon sinks, ecotourism, and brand forest products) to achieve the transformative effect of the idea that ‘Lucid waters and lush mountains are invaluable assets’.
3.5.3. Ecological Degraded Zone (B3)
The ecological degraded zone was predominantly distributed around major lakes, reservoirs, and northern coastal areas, occupying approximately 7.27% of the province’s territory. Water body (62.44%) was the main land use. Theoretically speaking, the aforementioned areas constitute typical ecotones where aquatic and terrestrial environments interact, characterized by complex habitats and high biodiversity. Consequently, their inherent endowment of HQ service is particularly pronounced. However, the ecological degraded zone was characterized by generally low levels of multiple ESs and weak or inconsistent interactions among them. Both synergies and trade-offs are relatively limited, indicating a dysfunctional or transitional ecosystem state. The finding illustrated a phenomenon whereby regions (e.g., lakes, reservoirs, and coastal areas) that ought to possess high ecological value were experiencing a decline in their core ecological functions (i.e., HQ), while other services (e.g., providing, and regulating services) beneficial to humanity had also failed to be effectively stimulated. This discovery provides compelling evidence that HQ, as a supporting service, forms the bedrock upon which all other ESs are generated. Depleting this foundational asset renders other services unsustainable. This situation indicates that past management approaches to this critical zone were a failure. To break this deadlock, efforts must be made from two aspects, ‘protecting the foundation’ and ‘unlocking of latent potential’, with the core approach being ‘nature-based solutions’ (Figure 10). Firstly, the ecological protection red line must be demarcated and strictly adhered to in these areas with good HQ backgrounds but in the process of degradation. Secondly, ecosystem structures must be restored through measures such as returning farmland to wetlands, dismantling hardened embankments, restoring natural shorelines, and re-establishing aquatic vegetation. Thirdly, multifunctional collaborative management must be shifted toward to form a positive cycle of synergized ESs. For example, restoring a lakeside wetland (improving HQ) can better purify water quality (enhancing regulation services). On this basis, low-impact ecotourism activities such as birdwatching and nature education can be developed (activating cultural services). Meanwhile, a healthy wetland ecosystem can also provide sustainable fisheries (limited provisioning services).
3.5.4. Urban Composite Zones (B4)
The urban composite zone was primarily distributed in densely populated cities (e.g., Jinan, Zibo, Linyi, and Qingdao) and surrounding expansion areas, accounting for approximately 11.21% of the total. Construction land accounted for as much as 41.60%, making this zone a typical highly urbanized, densely built-up area. Consequently, provisioning (e.g., FS), supporting (e.g., HQ), or regulating (e.g., WY, CS, and SR) services remained comparatively weak, whereas cultural service (e.g., LR) was high. Moreover, cultural service tended to coexist compatibly with other services (e.g., LR-FS and LR-SR). This zone constituted highly artificial ecosystems centered on human activity, exhibiting markedly imbalanced service functions and specific patterns of compatibility. This is especially true as the primary purpose of urban land is to accommodate human habitation and economic activities, rather than ecological production and regulation. However, it does not mean that areas in this zone should be regarded as ‘deserts’ with ecological functions, but rather as unique ecosystems with huge potential for ecological restoration and multifunctional operation. Future management should focus on supporting and designing land uses capable of delivering multiple ESs, investing in green infrastructure (e.g., parks, green spaces, and water bodies), and empowering citizens to become active contributors to building and enhancing urban ESs, to build a more sustainable, resilient and livable ‘eco-city’ (Figure 10).
4. Discussion
4.1. Dynamics of ESs
Provisioning services (e.g., FS) were generally characterized by pronounced interannual fluctuations and strong sensitivity to climate variability [79]. However, contrary to the view of previous studies that food supply fluctuates significantly with climate [80], this study found that FS showed steady growth. This trend can be largely attributed to advancements in modern agricultural technologies, improved farmland infrastructure, and policy interventions [33]. These factors mitigate the impacts of climate change, transforming agricultural production from weather-dependent into a regulated system characterized by controllable inputs and stable outputs. However, this growth in FS entails significant ecological costs [81]. High FS areas (i.e., the plain in LX) coincided with a marked decline in regulating and supporting services (e.g., CS, SR, and HQ), indicating that the intensification of a single service leads to the simplification of land use and the weakening of the foundations of the ecosystem. Such patterns were common under rapid urbanization and agricultural intensification [82].
Supporting services (e.g., HQ) form the foundation that sustains provisioning, regulating, and cultural services [83]. This study revealed that HQ experienced a continuous degradation and then a slight rebound. HQ dynamics displayed two key characteristics: (1) pronounced lag effects, as habitat fragmentation from urban expansion and intensive agriculture gradually accumulates, making HQ slow to recover [84]; and (2) regional-scale vulnerability, with high HQ values concentrated in the LZ mountainous and water-rich regions, while urban cores and the LX plains persistently exhibit low values, reflecting spatial ecological pressure gradients. Overall, HQ is relatively insensitive to short-term natural fluctuations but highly vulnerable to large-scale human activities. This conclusion aligns with the finding of Han et al. [85]. This highlighted that the protection and recovery of support services requires long-term, systematic ecological conservation and land use regulation rather than fragmented, short-term interventions [86].
Regulating services (e.g., CS, SR, WY) relied on ecological processes to maintain system stability, exhibiting characteristics of “relative stability” and “threshold risk” [87]. Although SR experienced a brief decline in 2015, it generally improved, indicating that ecological restoration initiatives (e.g., the Shandong Ecological Civilization Construction Plan) enhanced system stability and reduced the likelihood of threshold-type functional collapse [88]. This phenomenon is highly consistent with conclusions regarding the Loess Plateau that the Grain-for-Green Program promoted soil retention services [89]. WY displayed fluctuating growth but showed marked degradation in the LX plain. This finding strongly supports the finding that long-term excessive groundwater extraction in the North China Plain has led to diminished water supply capacity [90,91]. CS exhibited a slight overall decline (−2.01%), yet degradation was widespread across the region, implying that ecological fragmentation driven by urban expansion and agricultural encroachment has exceeded its recovery capacity [92]. Overall, while ecological inertia buffers regulating services against abrupt short-term fluctuations, persistent human pressures such as land use conversion and resource overexploitation are gradually undermining their functionality. The regional degradation of WY and the diffuse decline of CS both indicate the emergence of threshold risks.
Unlike regulating and supporting services (e.g., WY, CS, and SR) that were largely governed by natural processes, culture services (e.g., LR) were characterized by strong subjective value perception and high sensitivity to socioeconomic conditions. The growth trend and spatial distribution of LR (concentrated in the urban core area) strongly depend on socioeconomic drivers (e.g., GDP, POP, and infrastructure) rather than the quality of natural ecology, aligning with the “supply–demand” matching mechanism [93]. These patterns indicate that LR closely tracks socioeconomic restructuring and serves as an effective indicator of regional development and shifting ecosystem service demand [46].
4.2. Relationships of ESs
This study introduced an integrated multi-method framework for diagnosing relationships among ESs by combining parametric statistics (i.e., Pearson correlation), nonparametric visualization (i.e., bagplots), and a synthetic metric (i.e., the cumulative correlation coefficient, R). This approach overcomes the limitation of the single-method in capturing multidimensional ecological interactions [94]. Compared with conventional correlation analyses, the framework offers three principal advantages. Firstly, Pearson’s r provided a rigorous quantitative basis for identifying ES relationships, thereby ensuring analytical objectivity. Secondly, the bagplot enhanced interpretability by visualizing overall distributional patterns, local outliers, and dominant interaction directions; and by converting abstract statistical associations into explicit spatial-quadrant configurations, which substantially deepen ecological insights [77]. Thirdly, the cumulative correlation coefficient (R) quantified the aggregate “interaction pressure” acting upon each ES, enabling a novel and robust basis for service ranking [14]. Furthermore, cross-validation across the three methods reduced misclassification stemming from individual metric biases and significantly strengthened the robustness of the ES relationship diagnostics.
Applying the multi-method framework to Shandong Province revealed a coherent and highly consistent structure of ES interactions. Strong synergies were observed among regulating and supporting services (e.g., CS–HQ, WY–SR, and CS–SR), which closely correspond with findings from studies in typical mountainous ecosystems of China [95]. These studies consistently demonstrate that intact ecological structures naturally reinforce hydrological regulation and carbon-related functions. Conversely, the trade-offs observed between provisioning services and regulating/supporting services (e.g., FS–WY and FS–SR) align with findings from studies in northern China’s agricultural regions [96] and European agricultural landscapes [14], where cropland expansion and irrigation typically diminish water regulation, HQ, and CS. Additionally, cultural services (e.g., LR) exhibited weaker compatibility relationships with other services (e.g., LR-FS and LR-SR), which aligns closely with existing research findings. For example, Plieninger et al. [97] observed in Mediterranean landscapes in France that cultural services were limited in their connections to ecological processes. This made it difficult to establish stable synergistic or trade-off structures. The strong agreement between our results and these established findings provides robust validation of the reliability and explanatory strength of the integrated multi-method framework for identifying ES relationships.
In summary, the integrated multi-method framework proposed in this study substantially advances the analytical depth of ES relationship assessments and offers significant methodological value. The framework provides a scalable approach for future research on ES synergies and trade-offs across regions and spatial scales, supporting a shift in ES relationship analysis from reliance on single-correlation metrics toward a more comprehensive, visual, and spatially explicit analytical paradigm.
4.3. Driving Mechanism of ESs
The spatiotemporal patterns and dynamics of ESs are not governed by any single factor but are shaped by the synergistic effects of natural conditions and human activities through complex, multi-level, and dynamic interactions [98]. Natural conditions, as the fundamental endowment of ESs, define the upper bounds of resource availability and the thresholds of process stability, thereby establishing the baseline constraints of ES dynamics [87]. Spatial heterogeneity in climatic factors (e.g., PRE and TEM), topographic factors (e.g., DEM and SLOPE) and vegetation factors (e.g., NDVI) is closely associated with the potential capacity of both regulating services (e.g., WY and CS) and provisioning services (e.g., FS). For example, the spatiotemporal alignment of precipitation regimes with slope morphology may influence surface runoff interception efficiency and infiltration processes, thereby regulating the level of water conservation services. This mechanism is consistent with the framework proposed by Martínez-Harms and Balvanera [99], which emphasized that the natural environment plays a fundamental role in shaping the provisioning and regulating functions of ESs.
Human activities have established an anthropogenically driven regulation pathway for ESs through land use transformation, socioeconomic development, and technological advancement [100]. This pathway may reshape the mechanisms and efficiency of ES delivery by modifying ecosystem structure and function [101]. Land use change represents the most direct form of human intervention. The expansion of built-up land and the intensification of agricultural land management generally associated with declines in supporting services (e.g., HQ) by altering land-cover properties, which is consistent with the findings of Yang et al. [10] regarding the disruptive effects of urbanization on supporting services. In contrast, intensive agricultural practices (e.g., increased fertilizer inputs and improved irrigation technologies), together with market demand associated with population agglomeration, have substantially enhanced the realized supply of provisioning services (e.g., FS) [102]. Consequently, socioeconomic drivers such as POP and NL have gradually surpassed natural factors (e.g., PRE and NPP) to become the dominant determinants of provisioning service dynamics.
Socioeconomic development further reinforces anthropogenic regulatory mechanisms through a dual pathway of demand-driven expansion and technology-enabled support [103]. Economic growth and population agglomeration not only intensify demand for agricultural products, recreational services, and other ecosystem-derived benefits, but also improve service supply efficiency through increased capital investment (e.g., agricultural mechanization and tourism infrastructure construction) [104]. For example, by 2020, NL, as a proxy for regional economic activity, shows a stronger association with cultural services (e.g., LR) than natural drivers. This shift indicates that regional economic expansion and rising recreational demand may jointly contribute to a transition of cultural services from a nature-dependent model toward a facility-supported mode of provision. This is consistent with the findings of Andersson et al. [105].
Overall, the driving mechanisms of the four categories of ESs demonstrate a clear evolutionary trajectory, shifting from a predominantly nature-driven paradigm toward a human–land-symbiosis-based framework [106]. With the intensification of human activities, anthropogenic influences have transitioned from external disturbances to intrinsic drivers that shape the pathways of ecosystem function development [107]. This transformation has reconfigured the patterns of synergy and trade-off among ESs and has intensified the complexity of human–land interactions and feedback mechanisms. As a result, ESs have become increasingly dynamic and more strongly conditioned by the adaptive capacity and regulatory effectiveness of social systems [108].
4.4. Limitations and Prospects
While this study provides a systematic assessment of ecosystem services (ESs), their trade-offs, and associated driving factors, several limitations should be acknowledged. First, the analysis relies on existing large-scale databases, which inherently constrain the scope of the ecosystem services that can be evaluated. This limitation may lead to an incomplete representation of ecosystem functioning and introduces potential bias in the identification of ES bundles. Second, the spatial resolution of the analysis restricts the ability to capture fine-scale heterogeneity within land use types. For example, different agricultural management practices (e.g., conventional versus ecological farming) can result in substantially different ecological outcomes, yet such intra-type variability cannot be distinguished at the resolution used in this study. As a result, the findings may appear generalized and may not fully support highly localized or practice-specific policy recommendations. Third, although this study integrates machine learning and spatial analysis to identify ES drivers, the explanatory variables are mainly limited to biophysical and measurable socioeconomic factors, while key socio-institutional drivers (e.g., policy, governance, and societal values) are not explicitly incorporated due to their qualitative and non-spatial nature. Consequently, ecosystem-service-based zoning should be viewed as a complementary ecological perspective rather than a prescriptive policy tool, as it cannot fully capture underlying mechanisms or directly identify actionable policy levers. Future research should integrate multi-source and higher-resolution data (e.g., hyperspectral remote sensing and field observations) to better capture ecological heterogeneity. In addition, combining quantitative models with qualitative approaches—such as policy analysis and stakeholder engagement—will be essential to incorporate socio-institutional drivers and enhance policy relevance. Advancing uncertainty analysis and multi-scale modeling will further improve the robustness and applicability of ES assessments.
5. Conclusions
This study systematically examined the spatiotemporal evolution of six key ESs in Shandong Province from 2000 to 2020 using multi-source datasets and integrated modeling approaches. The study further elucidated trade-off and synergy relationships, underlying driving mechanisms, and patterns of spatial functional zoning. The key findings are as follows:
- (1)
- ESs exhibited pronounced spatiotemporal heterogeneity and divergent developmental trajectories. Provisioning services (e.g., FS) and cultural services (e.g., LR) showed sustained enhancement over time. Regulating services (e.g., WY, CS, and SR) showed internal differentiation, with WY and SR generally increasing, whereas CS declined slightly. Supporting services (e.g., HQ) demonstrated an overall decreasing trend. Spatially, high-intensity provisioning services were concentrated in the LX plains, while high-value regulating and supporting services were primarily distributed in the JD hills and LZ mountains. Cultural services were highly clustered in urban built-up areas, forming a spatial pattern consistent with regional natural conditions and socioeconomic development.
- (2)
- ESs exhibited clear trade-offs, synergies, and compatibility patterns, with strong spatial heterogeneity. Synergistic interactions were most pronounced between regulating and supporting services (e.g., CS–HQ), whereas significant trade-offs were observed between provisioning services and most regulating and supporting services (e.g., FS–WY). Cultural services generally showed weak compatibility with other services. These spatial interaction patterns closely corresponded to correlation strengths: trade-offs predominated in the western plains, while synergistic enhancement prevailed in the central mountains and eastern hills.
- (3)
- The driving mechanisms of ESs have transitioned from being nature-dominated to human–land coupled. Natural conditions (e.g., climate and DEM) and land use patterns form the basis for the spatial differentiation of ESs. With ongoing socioeconomic development, the influence of socioeconomic factors (e.g., POP, GDP, and land use) has progressively intensified, particularly in driving provisioning and cultural services, where socioeconomic factors have now surpassed natural influences. This indicates that the supply mechanisms of ESs are increasingly shifting from being predominantly governed by natural processes to being strongly influenced by human–land coupled systems.
- (4)
- The identification of service clusters revealed four major ecological functional zones in Shandong Province. Each zone exhibits unique patterns of ecosystem service interactions and driving factors, which determine their management priorities and thus provide guidance for differentiated management.
This study utilizes an integrated analytical framework of “assessment–relationship–driving–zoning” to clearly explain the dynamic patterns and underlying mechanisms of ESs in Shandong Province. The framework offers a scientific reference for optimizing land use structure, improving ecosystem service supply capacity, and promoting coordinated regional development, thereby supporting sustainable development in regions with similar socio-ecological characteristics.
Author Contributions
Conceptualization, H.Y. (Haijiao Yu) and Z.Y.; methodology, H.L.; software, L.W.; validation, D.M. and H.Y. (Hangting Yu); formal analysis, H.L.; investigation, H.Y. (Haijiao Yu) and H.Y. (Hangting Yu); resources, L.W. and D.M.; data curation, Z.Y.; writing—original draft preparation, H.L.; writing—review and editing, H.Y. (Haijiao Yu) and L.W.; visualization, H.L.; supervision, H.Y. (Haijiao Yu) and L.W.; project administration, H.Y. (Haijiao Yu); funding acquisition, H.Y. (Haijiao Yu) and L.W. All authors have read and agreed to the published version of the manuscript.
Funding
This work was supported by the National Natural Sciences Foundation of China (42301361, 42201228) and the Natural Science Foundation of Shandong Province (ZR2024QD140).
Data Availability Statement
Data will be made available on request.
Acknowledgments
We gratefully acknowledge the constructive comments from the editors and reviewers, which have significantly contributed to the improvement of this paper.
Conflicts of Interest
The authors declare no conflicts of interest.
Abbreviations
The following abbreviations are used in this manuscript:
| ESs | Ecosystem services |
| ESBs | Ecosystem service bundles |
| WY | Water yield |
| CS | Carbon storage |
| FS | Food supply |
| SR | Soil retention |
| HQ | Habitat quality |
| LR | Leisure and recreation |
| LX | The western plain region |
| LZ | The central mountainous region |
| JD | The eastern hilly region |
| SOM | The self-organizing map |
Appendix A
Table A1.
Biophysical parameters of the water yield module of the InVEST.
Table A2.
Carbon density of the study (t·hm−2).
Table A3.
Table of habitat sensitivity parameters.
Table A4.
Threat factor parameters.
Table A5.
p value and C value of different land use types.
Appendix B
Figure A1.
Sum of squared errors for ecosystem services in Shandong Province under different clustering numbers.
References
- Daneshi, A.; Brouwer, R.; Najafinejad, A.; Panahi, M.; Zarandian, A.; Maghsood, F.F. Modelling the impacts of climate and land use change on water security in a semi-arid forested watershed using InVEST. J. Hydrol. 2021, 593, 125621. [Google Scholar] [CrossRef] [Scilit]
- Boone, R.B.; Conant, R.T.; Sircely, J.; Thornton, P.K.; Herrero, M. Climate change impacts on selected global rangeland ecosystem services. Glob. Change Biol. 2018, 24, 1382–1393. [Google Scholar] [CrossRef] [Scilit]
- Boyd, J.; Banzhaf, S. What are ecosystem services? The need for standardized environmental accounting units. Ecol. Econ. 2007, 63, 616–626. [Google Scholar] [CrossRef] [Scilit]
- Liu, X.; Ding, J.; Zhao, W. Divergent responses of ecosystem services to afforestation and grassland restoration in the Tibetan Plateau. J. Environ. Manag. 2023, 344, 118471. [Google Scholar] [CrossRef] [Scilit] [PubMed]
- Srivathsa, A.; Vasudev, D.; Nair, T.; Chakrabarti, S.; Chanchani, P.; DeFries, R.; Deomurari, A.; Dutta, S.; Ghose, D.; Goswami, V.R.; et al. Prioritizing India’s landscapes for biodiversity, ecosystem services and human well-being. Nat. Sustain. 2023, 6, 568–577. [Google Scholar] [CrossRef] [Scilit]
- Zhang, J.; Zhang, Z.; Liu, L.; Cao, Y.; Zhang, M.; Yuan, Z.; Ma, R.; Liu, X.; Liu, Y. Scaling effects of ecosystem service trade-off and synergy in arid inland river basins: A case study of the Manas River Basin of Xinjiang, China. Ecol. Indic. 2025, 173, 113358. [Google Scholar] [CrossRef] [Scilit]
- Geng, W.; Li, Y.; Zhang, P.; Yang, D.; Jing, W.; Rong, T. Analyzing spatio-temporal changes and trade-offs/synergies among ecosystem services in the Yellow River Basin, China. Ecol. Indic. 2022, 138, 108825. [Google Scholar] [CrossRef] [Scilit]
- Xie, Z.; He, L.; Wan, W.; Song, X.; Wu, Z.; Liang, H.; Du, H.; Qin, M.; Xiong, Y.; Qian, Y.; et al. Shifting patterns of ecosystem service trade-offs and synergies: Evidence from the Yangtze River Economic Belt, China. Glob. Ecol. Conserv. 2026, 65, e04020. [Google Scholar] [CrossRef] [Scilit]
- Pei, R.; Ma, B.; Liu, S.; Su, J.; Yu, M.; Li, W. Spatiotemporal differentiation and trade-offs and synergies of ecosystem services in Qilian Mountains National Park. Ecol. Indic. 2024, 169, 112891. [Google Scholar] [CrossRef] [Scilit]
- Yang, Y.; Li, M.; Feng, X.; Yan, H.; Su, M.; Wu, M. Spatiotemporal variation of essential ecosystem services and their trade-off/synergy along with rapid urbanization in the Lower Pearl River Basin, China. Ecol. Indic. 2021, 133, 108439. [Google Scholar] [CrossRef] [Scilit]
- Zhu, S.; Zhao, Y.; Huang, J.; Wang, S. Analysis of spatial-temporal differentiation and influencing factors of ecosystem services in resource-based cities in semiarid regions. Remote Sens. 2023, 15, 871. [Google Scholar] [CrossRef] [Scilit]
- Li, L.; Feng, R.; Hou, G.; Xi, J. Trade-offs, synergies and driving pathways between tourism cultural ecosystem service and multiple ecosystem services in ecological functional zone. Habitat. Int. 2025, 165, 103558. [Google Scholar] [CrossRef] [Scilit]
- Xue, C.; Chen, X.; Xue, L.; Zhang, H.; Chen, J.; Li, D. Modeling the spatially heterogeneous relationships between tradeoffs and synergies among ecosystem services and potential drivers considering geographic scale in Bairin Left Banner, China. Sci. Total Environ. 2023, 855, 158834. [Google Scholar] [CrossRef] [Scilit]
- Jopke, C.; Kreyling, J.; Maes, J.; Koellner, T. Interactions among ecosystem services across Europe: Bagplots and cumulative correlation coefficients reveal synergies, trade-offs, and regional patterns. Ecol. Indic. 2015, 49, 46–52. [Google Scholar] [CrossRef] [Scilit]
- Sun, X.Y.; Shan, R.F.; Liu, F. Spatio-temporal quantification of patterns, trade-offs and synergies among multiple hydrological ecosystem services in different topographic basins. J. Clean. Prod. 2020, 268, 122338. [Google Scholar] [CrossRef] [Scilit]
- Zhang, B.; Zheng, L.; Wang, Y.; Li, N.; Li, J.; Yang, H.; Bi, Y. Multiscale ecosystem service synergies/trade-offs and their driving mechanisms in the Han River Basin, China: Implications for watershed management. Environ. Sci. Pollut. Res. 2023, 30, 43440–43454. [Google Scholar] [CrossRef] [Scilit] [PubMed]
- An, M.; Wu, Y.; Ouyang, Y.; Song, M.; Huang, J.; Dong, X.; Thomas Stephen, R. Spatial-temporal evolvement and the contributing factors for the economic potential of ecosystem services in counties situated along a river. J. Nat. Conserv. 2023, 75, 126461. [Google Scholar] [CrossRef] [Scilit]
- Zhang, Z.; Liu, Y.; Wang, Y.; Liu, Y.; Zhang, Y.; Zhang, Y. What factors affect the synergy and tradeoff between ecosystem services, and how, from a geospatial perspective? J. Clean. Prod. 2020, 257, 120454. [Google Scholar] [CrossRef] [Scilit]
- Zhou, J.; Yang, J.; Tang, Z.; Xue, L.; Zhang, W.; Zhang, J. Driving mechanisms of ecosystem services and their trade-offs and synergies in the transition zone between the Qinghai-Tibet Plateau and the Loess Plateau. Ecol. Indic. 2025, 171, 113148. [Google Scholar] [CrossRef] [Scilit]
- Qu, J.; Xu, Z.; Dong, B.; Wang, H.; Han, Y. Analyzing trade-offs, synergies, and driving factors of ecosystem services in Anhui Province using spatial analysis and XGBoost modeling. Ecol. Indic. 2025, 171, 113098. [Google Scholar] [CrossRef] [Scilit]
- Zhang, T.; Zhang, S.; Cao, Q.; Wang, H.; Li, Y. The spatiotemporal dynamics of ecosystem services bundles and the social-economic-ecological drivers in the Yellow River Delta region. Ecol. Indic. 2022, 135, 108573. [Google Scholar] [CrossRef] [Scilit]
- Huang, X.; Liu, X.; Jin, Y.; Gao, X.; Chen, Y. Identification and attribution analysis of integrated ecological zones based on the XGBoost-SHAP model: A case study of Chengdu, China. Ecol. Indic. 2025, 177, 113787. [Google Scholar] [CrossRef] [Scilit]
- Tian, Y.; Zhang, Q.; Tao, J.; Zhang, Y.; Lin, J.; Bai, X. Use of interpretable machine learning for understanding ecosystem service trade-offs and their driving mechanisms in karst peak-cluster depression basin, China. Ecol. Indic. 2024, 166, 112474. [Google Scholar] [CrossRef] [Scilit]
- Agudelo, C.A.R.; Bustos, S.L.H.; Moreno, C.A.P. Modeling interactions among multiple ecosystem services. A critical review. Ecol. Modell. 2020, 429, 109103. [Google Scholar] [CrossRef] [Scilit]
- Dittrich, A.; Seppelt, R.; Václavík, T.; Cord, A.F. Integrating ecosystem service bundles and socio-environmental conditions–A national scale analysis from Germany. Ecosyst. Serv. 2017, 28, 273–282. [Google Scholar] [CrossRef] [Scilit]
- Rahmonov, O.; Abramowicz, A.; Pukowiec-Kurda, K.; Fagiewicz, K. The link between a high-mountain community and ecosystem services of juniper forests in Fann Mountains (Tajikistan). Ecosyst. Serv. 2021, 48, 101255. [Google Scholar] [CrossRef] [Scilit]
- Turner, K.G.; Odgaard, M.V.; Bøcher, P.K.; Dalgaard, T.; Svenning, J.-C. Bundling ecosystem services in Denmark: Trade-offs and synergies in a cultural landscape. Landsc. Urban Plan. 2014, 125, 89–104. [Google Scholar] [CrossRef] [Scilit]
- Kohonen, T. Self-organized formation of topologically correct feature maps. Biol. Cybern. 1982, 43, 59–69. [Google Scholar] [CrossRef] [Scilit]
- Dou, H.; Li, X.; Li, S.; Dang, D.; Li, X.; Lyu, X.; Li, M.; Liu, S. Mapping ecosystem services bundles for analyzing spatial trade-offs in Inner Mongolia, China. J. Clean. Prod. 2020, 256, 120444. [Google Scholar] [CrossRef] [Scilit]
- Vesanto, J.; Alhoniemi, E. Clustering of the self-organizing map. IEEE Trans. Neural Netw. 2000, 11, 586–600. [Google Scholar] [CrossRef] [Scilit]
- Sun, Y.; Hao, R.; Qiao, J.; Xue, H. Function zoning and spatial management of small watersheds based on ecosystem disservice bundles. J. Clean. Prod. 2020, 255, 120285. [Google Scholar] [CrossRef] [Scilit]
- Xu, Y.; Li, C. Investigating the heterogeneity of driving mechanisms and multi-dimensional policy pathways in ecosystem service supply-demand relationships: A case study of the Shandong Peninsula urban agglomeration. J. Clean. Prod. 2025, 505, 145523. [Google Scholar] [CrossRef] [Scilit]
- Ren, Q.; Liu, D.; Liu, Y. Spatio-temporal variation of ecosystem services and the response to urbanization: Evidence based on Shandong province of China. Ecol. Indic. 2023, 151, 110333. [Google Scholar] [CrossRef] [Scilit]
- Shen, J.; Zhao, M.; Tan, Z.; Zhu, L.; Guo, Y.; Li, Y.; Wu, C. Ecosystem service trade-offs and synergies relationships and their driving factor analysis based on the Bayesian Belief Network: A case study of the Yellow River Basin. Ecol. Indic. 2024, 163, 112070. [Google Scholar] [CrossRef] [Scilit]
- Huang, J.; Zheng, F.; Dong, X.; Wang, X.-C. Exploring the complex trade-offs and synergies among ecosystem services in the Tibet Autonomous Region. J. Clean. Prod. 2023, 384, 135483. [Google Scholar] [CrossRef] [Scilit]
- Huang, F.; Zuo, L.; Gao, J.; Jiang, Y.; Du, F.; Zhang, Y. Exploring the driving factors of trade-offs and synergies among ecological functional zones based on ecosystem service bundles. Ecol. Indic. 2023, 146, 109827. [Google Scholar] [CrossRef] [Scilit]
- Xia, H.; Yuan, S.; Prishchepov, A.V. Spatial-temporal heterogeneity of ecosystem service interactions and their social-ecological drivers: Implications for spatial planning and management. Resour. Conserv. Recycl. 2023, 189, 106767. [Google Scholar] [CrossRef] [Scilit]
- Zhou, W.; Liu, G.; Fan, J. Soil available water capacity and it’s empirical and statistical models-with a special reference to black soils in northeast China. J. Arid. Land Resour. Environ. 2003, 17, 88–95. (In Chinese) [Google Scholar]
- Crossman, N.D.; Burkhard, B.; Nedkov, S.; Willemen, L.; Petz, K.; Palomo, I.; Drakou, E.G.; Martín-Lopez, B.; McPhearson, T.; Boyanova, K. A blueprint for mapping and modelling ecosystem services. Ecosyst. Serv. 2013, 4, 4–14. [Google Scholar] [CrossRef] [Scilit]
- Zhang, W.; Fu, J. Rainfall erosivity estimation under different rainfall amount. Resour. Sci. 2003, 25, 35–41. (In Chinese) [Google Scholar]
- Williams, J.; Arnold, J. A system of erosion—Sediment yield models. Soil. Technol. 1997, 11, 43–55. [Google Scholar] [CrossRef] [Scilit]
- Sun, J.; Liu, Y.; Zhou, T.; Liu, G.; Wang, J. Soil conservation service on the Tibetan Plateau, 1984–2013. Earth Environ. Sci. Trans. R. Soc. Edinb. 2018, 109, 445–451. [Google Scholar] [CrossRef] [Scilit]
- Ren, Q.; Liu, D.; Liu, Y.; Liu, Y. Spatio-temporal dynamics and socio-ecological determinants of ecosystem service interplays in Shandong Province’s coastal region (2000–2020): Implications for environmental protection and sustainable ecosystem management. Environ. Res. 2024, 243, 117824. [Google Scholar] [CrossRef] [Scilit]
- Willis, C. The contribution of cultural ecosystem services to understanding the tourism–nature–wellbeing nexus. J. Outdoor Recreat. Tour. 2015, 10, 38–43. [Google Scholar] [CrossRef] [Scilit]
- Maes, J.; Hauck, J.; Paracchini, M.L.; Ratamäki, O.; Hutchins, M.; Termansen, M.; Furman, E.; Perez-Soba, M.; Braat, L.; Bidoglio, G. Mainstreaming ecosystem services into EU policy. Curr. Opin. Environ. Sustain. 2013, 5, 128–134. [Google Scholar] [CrossRef] [Scilit]
- Su, Y.; Feng, G.; Ren, J. Spatio-temporal evolution of land use and its eco-environmental effects in the Caohai National Nature Reserve of China. Sci. Rep. 2023, 13, 20150. [Google Scholar] [CrossRef] [Scilit]
- Yuan, Z.; Liang, Y.; Zhao, H.; Wei, D.; Wang, X. Trade-offs and synergies between ecosystem services on the Tibetan Plateau. Ecol. Indic. 2024, 158, 111384. [Google Scholar] [CrossRef] [Scilit]
- Chen, Y.; Zhao, Q.; Liu, Y.; Zeng, H. Exploring the impact of natural and human activities on vegetation changes: An integrated analysis framework based on trend analysis and machine learning. J. Environ. Manag. 2025, 374, 124092. [Google Scholar] [CrossRef] [Scilit] [PubMed]
- Li, W.; Kang, J.; Wang, Y. Effects of habitat fragmentation on ecosystem services and their trade-offs in Southwest China: A multi-perspective analysis. Ecol. Indic. 2024, 167, 112699. [Google Scholar] [CrossRef] [Scilit]
- Su, R.; Duan, C.; Chen, B. The shift in the spatiotemporal relationship between supply and demand of ecosystem services and its drivers in China. J. Environ. Manag. 2024, 365, 121698. [Google Scholar] [CrossRef] [Scilit] [PubMed]
- Li, K.; Zhao, J.; Li, Y.; Lin, Y. Identifying trade-offs and synergies among land use functions using an XGBoost-SHAP model: A case study of Kunming, China. Ecol. Indic. 2025, 172, 113330. [Google Scholar] [CrossRef] [Scilit]
- Chen, Y.; Hu, B.; Tang, J.; Wang, Y. Comprehensive consolidation and ecological restoration projects drive the variation of ecosystem services and their terrain gradient effect in Jiangxi Province, China. Ecol. Eng. 2025, 220, 107728. [Google Scholar] [CrossRef] [Scilit]
- Vega García, M.; Aznarte, J.L. Shapley additive explanations for no2 forecasting. Ecol. Inf. 2020, 56, 101039. [Google Scholar] [CrossRef] [Scilit]
- Zuo, L.; Liu, G.; Fang, Z.; Zhao, J.; Li, J.; Zheng, S.; Su, X. Assessing the destabilization risk of ecosystems dominated by carbon sequestration based on interpretable machine learning method. Ecol. Indic. 2024, 167, 112593. [Google Scholar] [CrossRef] [Scilit]
- Li, J.; Zhang, C. Exploring the relationship between key ecosystem services and socioecological drivers in alpine basins: A case of Issyk-Kul Basin in Central Asia. Glob. Ecol. Conserv. 2021, 29, e01729. [Google Scholar] [CrossRef] [Scilit]
- Li, M.; Zhou, Y.; Xiao, P.; Tian, Y.; Huang, H.; Xiao, L. Evolution of habitat quality and its topographic gradient effect in northwest Hubei Province from 2000 to 2020 based on the InVEST model. Land 2021, 10, 857. [Google Scholar] [CrossRef] [Scilit]
- Gao, J.; Li, F.; Gao, H.; Zhou, C.; Zhang, X. The impact of land-use change on water-related ecosystem services: A study of the Guishui River Basin, Beijing, China. J. Clean. Prod. 2017, 163, S148–S155. [Google Scholar] [CrossRef] [Scilit]
- Gou, M.; Li, L.; Ouyang, S.; Wang, N.; La, L.; Liu, C.; Xiao, W. Identifying and analyzing ecosystem service bundles and their socioecological drivers in the Three Gorges Reservoir Area. J. Clean. Prod. 2021, 307, 127208. [Google Scholar] [CrossRef] [Scilit]
- Wang, Z.; Sun, X.; Shan, R.; Wang, B. Mapping and assessing supply–demand matching of recreational ecosystem services in Shandong Province, China. Ecol. Indic. 2024, 160, 111859. [Google Scholar] [CrossRef] [Scilit]
- Li, J.; Zhang, C.; Zhu, S. Relative contributions of climate and land-use change to ecosystem services in arid inland basins. J. Clean. Prod. 2021, 298, 126844. [Google Scholar] [CrossRef] [Scilit]
- Lyu, K.; Li, Z. Scenario based assessment of carbon storage and habitat quality under land use change in Shandong Province China. Sci. Rep. 2025, 15, 38098. [Google Scholar] [CrossRef] [Scilit]
- Fan, J.; Liu, S.; Wang, W.; Li, Y.; Wang, Z.; Liu, M.; Zhao, Y.; Lin, J.; Tian, Z.; Wu, G. Identifying driving mechanisms and relationships between supply and demand of ecosystem services based on structural equation model in the upstream segment of the Yangtze River. J. Environ. Manag. 2025, 393, 127093. [Google Scholar] [CrossRef] [Scilit]
- Zhang, Y.; Lu, X.; Liu, B.; Wu, D.; Fu, G.; Zhao, Y.; Sun, P. Spatial relationships between ecosystem services and socioecological drivers across a large-scale region: A case study in the Yellow River Basin. Sci. Total Environ. 2021, 766, 142480. [Google Scholar] [CrossRef] [Scilit] [PubMed]
- Tao, J.; Lu, Y.; Ge, D.; Dong, P.; Gong, X.; Ma, X. The spatial pattern of agricultural ecosystem services from the production-living-ecology perspective: A case study of the Huaihai Economic Zone, China. Land Use Policy 2022, 122, 106355. [Google Scholar] [CrossRef] [Scilit]
- Fang, L.; Wang, L.; Chen, W.; Sun, J.; Cao, Q.; Wang, S.; Wang, L. Identifying the impacts of natural and human factors on ecosystem service in the Yangtze and Yellow River Basins. J. Clean. Prod. 2021, 314, 127995. [Google Scholar] [CrossRef] [Scilit]
- Zhang, J.; Guo, W.; Cheng, C.; Tang, Z.; Qi, L. Trade-offs and driving factors of multiple ecosystem services and bundles under spatiotemporal changes in the Danjiangkou Basin, China. Ecol. Indic. 2022, 144, 109550. [Google Scholar] [CrossRef] [Scilit]
- Li, W.; Kang, J.; Wang, Y. Identifying the impacts of landscape structure on ecosystem services trade-offs among ecosystem services bundles in the mountains of Southwest China. Ecol. Eng. 2024, 209, 107419. [Google Scholar] [CrossRef] [Scilit]
- Raudsepp-Hearne, C.; Peterson, G.D.; Bennett, E.M. Ecosystem service bundles for analyzing tradeoffs in diverse landscapes. Proc. Natl. Acad. Sci. USA 2010, 107, 5242–5247. [Google Scholar] [CrossRef] [Scilit]
- Yang, L.; Liu, Y.; Liu, Y.; Liu, R. Spatial-temporal dynamics and drivers of ecosystem service interactions along the Yellow River area in Shaanxi Province. J. Clean. Prod. 2025, 496, 145095. [Google Scholar] [CrossRef] [Scilit]
- Sun, Y.; Li, J.; Liu, X.; Ren, Z.; Zhou, Z.; Duan, Y. Spatially explicit analysis of trade-offs and synergies among multiple ecosystem services in Shaanxi Valley Basins. Forests 2020, 11, 209. [Google Scholar] [CrossRef] [Scilit]
- Li, Z.; Cheng, X.; Han, H. Analyzing land-use change scenarios for ecosystem services and their trade-offs in the ecological conservation area in Beijing, China. Int. J. Environ. Res. Public Health 2020, 17, 8632. [Google Scholar] [CrossRef] [Scilit]
- Xu, Y.; Tang, Q.; Zhang, H.; Duan, D.; Chen, P.; Luo, Y.; Wei, J.; He, X.; Yang, H.; Collins, L.A. Trade-offs and synergies of ecosystem services in the hilly purple soil area of Southwestern China: Implications for sustainable land management. J. Mt. Sci. 2025, 22, 2145–2158. [Google Scholar] [CrossRef] [Scilit]
- Qiao, X.; Gu, Y.; Zou, C.; Xu, D.; Wang, L.; Ye, X.; Yang, Y.; Huang, X. Temporal variation and spatial scale dependency of the trade-offs and synergies among multiple ecosystem services in the Taihu Lake Basin of China. Sci. Total Environ. 2019, 651, 218–229. [Google Scholar] [CrossRef] [Scilit] [PubMed]
- Kaya, M.Y.; Dupont-Nivet, G.L.; Frieling, J.; Fioroni, C.; Rohrmann, A.; Altiner, S.O.; Vardar, E.; Tanyas, H.; Mamtimin, M.; Guo, Z.J. The Eurasian epicontinental sea was an important carbon sink during the Palaeocene-Eocene Thermal Maximum. Commun. Earth Environ. 2022, 3, 124. [Google Scholar] [CrossRef] [Scilit]
- Liu, A.; Yan, T.; Shi, S.; Zhao, W.; Ke, S.; Zhang, F. Trade-off and coordination between development and ecological protection of urban agglomerations along rivers: A case study of urban agglomerations in the Shandong section of the Lower Yellow River. Land 2024, 13, 1368. [Google Scholar] [CrossRef] [Scilit]
- Zhai, J.-Q.; Luo, Y.-Z.; Luo, X.; Zhang, H. Ecosystem services and trade-offs and synergies in Shandong Province under the background of LUCC. Huan Jing Ke Xue= Huanjing Kexue 2025, 46, 5907–5918. [Google Scholar] [CrossRef] [Scilit]
- Li, M.; Li, T.; Zhu, L.; Gu, Y.; ZHan, D. The trade-offs and synergistic relationships among ecosystem services based on bagplots and correlation coefficients: A case study in Taihang Mountain. Acta Ecol. Sin. 2025, 45, 6512–6523. [Google Scholar] [CrossRef]
- Chang, J.; Liu, Q.; Wang, S.; Huang, C. Vegetation dynamics and their influencing factors in China from 1998 to 2019. Remote Sens. 2022, 14, 3390. [Google Scholar] [CrossRef] [Scilit]
- Zhang, H.; Wang, L.; Jiang, S.; Li, K.; Xin, X.; Huang, X.; Chen, J.; Zhou, L.; Li, Z. Impacts of rice–crayfish co-culture on ecosystem service trade-offs/synergies in agricultural watersheds: A case exploration in Sihu Lake Basin, China. Agric. Water Manag. 2025, 310, 109389. [Google Scholar] [CrossRef] [Scilit]
- Yin, X.; Olesen, J.E.; Wang, M.; Öztürk, I.; Zhang, H.; Chen, F. Impacts and adaptation of the cropping systems to climate change in the Northeast Farming Region of China. Eur. J. Agron. 2016, 78, 60–72. [Google Scholar] [CrossRef] [Scilit]
- Wang, S.; Liu, J.; Wang, R.; Ni, Z.; Xu, S.; Sun, Y. Impact of socioeconomic development on ecosystem services and its conservation strategies: A case study of Shandong Province, China. Environ. Monit. Assess. 2012, 184, 3213–3229. [Google Scholar] [CrossRef] [Scilit]
- Zhong, J.; Sun, Q.; Qi, W.; Yu, X. Quantifying and mapping the effects of ecosystem services on agricultural competitiveness: A case study in Shandong Province, China. Chin. Geogr. Sci. 2025, 35, 326–342. [Google Scholar] [CrossRef] [Scilit]
- Chen, C.; Liu, J.; Bi, L. Spatial and temporal changes of habitat quality and its influential factors in China based on the InVEST model. Forests 2023, 14, 374. [Google Scholar] [CrossRef] [Scilit]
- Fahrig, L. Effects of habitat fragmentation on biodiversity. Annu. Rev. Ecol. Evol. Syst. 2003, 34, 487–515. [Google Scholar] [CrossRef] [Scilit]
- Han, J.; Hu, Z.; Wang, P.; Yan, Z.; Li, G.; Zhang, Y.; Zhou, T. Spatio-temporal evolution and optimization analysis of ecosystem service value-A case study of coal resource-based city group in Shandong, China. J. Clean. Prod. 2022, 363, 132602. [Google Scholar] [CrossRef] [Scilit]
- Xu, W.; Xiao, Y.; Zhang, J.; Yang, W.; Zhang, L.; Hull, V.; Wang, Z.; Zheng, H.; Liu, J.; Polasky, S. Strengthening protected areas for biodiversity and ecosystem services in China. Proc. Natl. Acad. Sci. USA 2017, 114, 1601–1606. [Google Scholar] [CrossRef] [Scilit]
- Hu, Y.; Gao, M. Evaluations of water yield and soil erosion in the Shaanxi-Gansu Loess Plateau under different land use and climate change scenarios. Environ. Dev. 2020, 34, 100488. [Google Scholar] [CrossRef] [Scilit]
- Ma, D.; Lin, Z.; Wang, Q.; Yu, Y.; Yu, G. The spatio-temporal evolution of ecosystem service value and its driving factors analysis in Shandong Province of China. Adv. Space Res. 2025, 77, 1776–1794. [Google Scholar] [CrossRef] [Scilit]
- Feng, X.; Fu, B.; Piao, S.; Wang, S.; Ciais, P.; Zeng, Z.; Lü, Y.; Zeng, Y.; Li, Y.; Jiang, X.; et al. Revegetation in China’s Loess Plateau is approaching sustainable water resource limits. Nat. Clim. Change 2016, 6, 1019–1022. [Google Scholar] [CrossRef] [Scilit]
- Cao, G.; Zheng, C.; Scanlon, B.R.; Liu, J.; Li, W. Use of flow modeling to assess sustainability of groundwater resources in the North China Plain. Water Resour. Res. 2013, 49, 159–175. [Google Scholar] [CrossRef] [Scilit]
- Qiao, J.; Deng, L.; Liu, H.; Wang, Z. Spatiotemporal heterogeneity in ecosystem service trade-offs and their drivers in the Huang-Huai-Hai Plain, China. Landsc. Ecol. 2024, 39, 42. [Google Scholar] [CrossRef] [Scilit]
- Zheng, H.; Zheng, H. Assessment and prediction of carbon storage based on land use/land cover dynamics in the coastal area of Shandong Province. Ecol. Indic. 2023, 153, 110474. [Google Scholar] [CrossRef] [Scilit]
- Cao, Q.; Liang, J.-J.; Fang, X.-N.; Qiao, J.-M.; Wu, J. Trade-offs? Unveiling the interrelationships between urban ecosystem services and public services in heterogeneous landscapes. Ecol. Indic. 2025, 178, 113846. [Google Scholar] [CrossRef] [Scilit]
- Ellili-Bargaoui, Y.; Walter, C.; Lemercier, B.; Michot, D. Assessment of six soil ecosystem services by coupling simulation modelling and field measurement of soil properties. Ecol. Indic. 2021, 121, 107211. [Google Scholar] [CrossRef] [Scilit]
- Yue, L.; Xia, F.; Yichao, T.; Lin, Q.; Jinglan, L. Trade-offs and synergies of ecosystem services in the water conservation area in the Upper reaches of the Yangtze River based on Bayesian Network: Identification and diagnosis of driving factors and spatial optimization. Process Saf. Environ. Prot. 2026, 206, 108256. [Google Scholar] [CrossRef] [Scilit]
- Zhao, X.; Sun, W.; Zhang, S.; Yang, Y.; Yang, Y.; Lan, H.; Yu, T.; Li, X.; Xie, Y. How can ecosystem services trade-offs/synergies help select the optimal cultivated land restoration pattern? A study based on multi-scenario simulations. Appl. Geogr. 2025, 177, 103563. [Google Scholar] [CrossRef] [Scilit]
- Plieninger, T.; Dijks, S.; Oteros-Rozas, E.; Bieling, C. Assessing, mapping, and quantifying cultural ecosystem services at community level. Land Use Policy 2013, 33, 118–129. [Google Scholar] [CrossRef] [Scilit]
- Liu, J.; Dietz, T.; Carpenter, S.R.; Alberti, M.; Folke, C.; Moran, E.; Pell, A.N.; Deadman, P.; Kratz, T.; Lubchenco, J.; et al. Complexity of coupled human and natural systems. Science 2007, 317, 1513–1516. [Google Scholar] [CrossRef] [Scilit] [PubMed]
- Martínez-Harms, M.J.; Balvanera, P. Methods for mapping ecosystem service supply: A review. Int. J. Biodivers. Sci. Ecosyst. Serv. Manag. 2012, 8, 17–25. [Google Scholar] [CrossRef] [Scilit]
- Foley, J.A.; DeFries, R.; Asner, G.P.; Barford, C.; Bonan, G.; Carpenter, S.R.; Chapin, F.S.; Coe, M.T.; Daily, G.C.; Gibbs, H.K.; et al. Global consequences of land use. Science 2005, 309, 570–574. [Google Scholar] [CrossRef] [Scilit]
- Zhao, M.; Zhou, Q.; Luo, Y.; Li, Y.; Wang, Y.; Yuan, E. Threshold effects between ecosystem services and natural and social drivers in karst landscapes. Land 2024, 13, 691. [Google Scholar] [CrossRef] [Scilit]
- Brück, M.; Fischer, J.; Law, E.A.; Schultner, J.; Abson, D.J. Drivers of ecosystem service specialization in a smallholder agricultural landscape of the Global South: A case study in Ethiopia. Ecol. Soc. 2023, 28, 1. [Google Scholar] [CrossRef] [Scilit]
- Guo, S.; Wu, C.; Wang, Y.; Qiu, G.; Zhu, D.; Niu, Q.; Qin, L. Threshold effect of ecosystem services in response to climate change, human activity and landscape pattern in the Upper and Middle Yellow River of China. Ecol. Indic. 2022, 136, 108603. [Google Scholar] [CrossRef] [Scilit]
- Polasky, S.; Nelson, E.; Pennington, D.; Johnson, K.A. The impact of land-use change on ecosystem services, biodiversity and returns to landowners: A case study in the state of Minnesota. Environ. Resour. Econ. 2011, 48, 219–242. [Google Scholar] [CrossRef] [Scilit]
- Andersson, E.; Tengö, M.; McPhearson, T.; Kremer, P. Cultural ecosystem services as a gateway for improving urban sustainability. Ecosyst. Serv. 2015, 12, 165–168. [Google Scholar] [CrossRef] [Scilit]
- Jaureguiberry, P.; Titeux, N.; Wiemers, M.; Bowler, D.E.; Coscieme, L.; Golden, A.S.; Guerra, C.A.; Jacob, U.; Takahashi, Y.; Settele, J.; et al. The direct drivers of recent global anthropogenic biodiversity loss. Sci. Adv. 2022, 8, eabm9982. [Google Scholar] [CrossRef] [Scilit]
- Le, T.-A.T.; Vodden, K.; Wu, J.; Atiwesh, G. Trade-offs and synergies in ecosystem services for sustainability. Front. Sustain. Resour. Manag. 2023, 2, 1129396. [Google Scholar] [CrossRef] [Scilit]
- Schultz, L.; Folke, C.; Österblom, H.; Olsson, P. Adaptive governance, ecosystem management, and natural capital. Proc. Natl. Acad. Sci. USA 2015, 112, 7369–7374. [Google Scholar] [CrossRef] [Scilit] [PubMed]
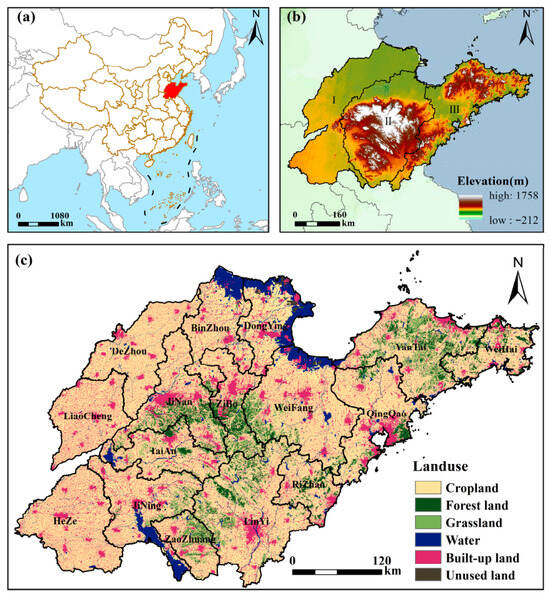
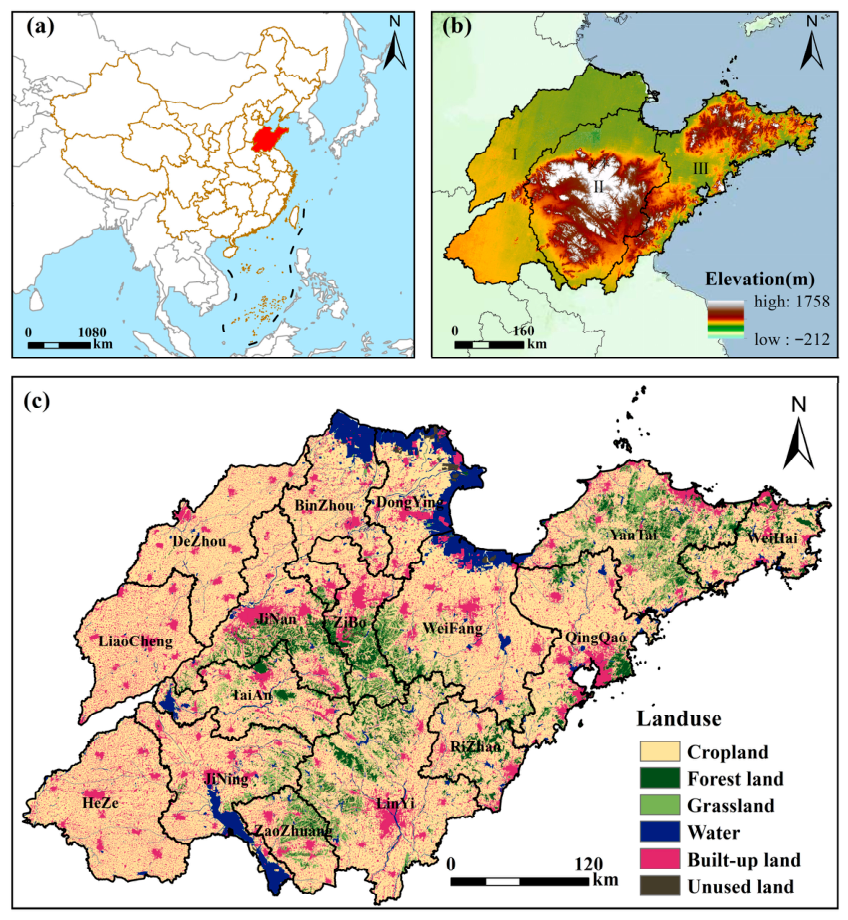
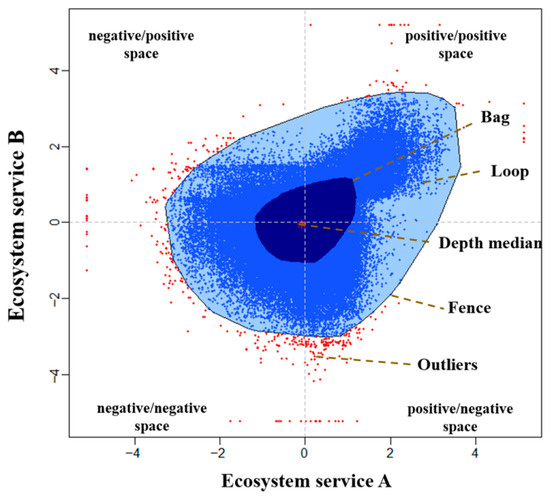
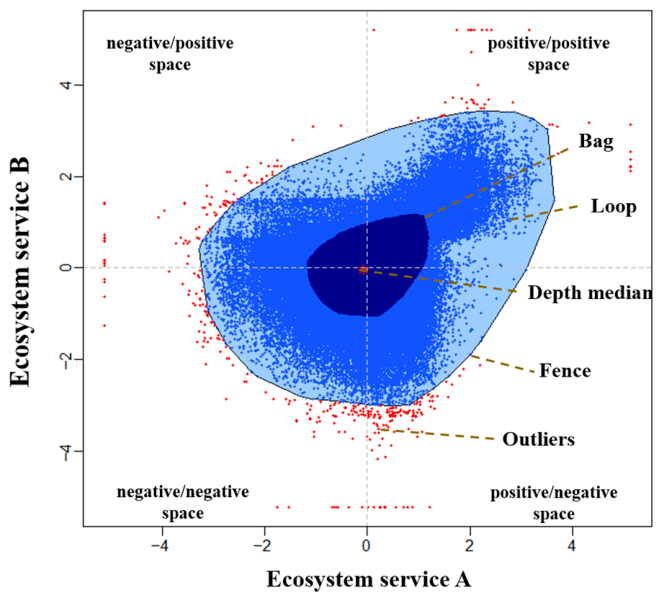
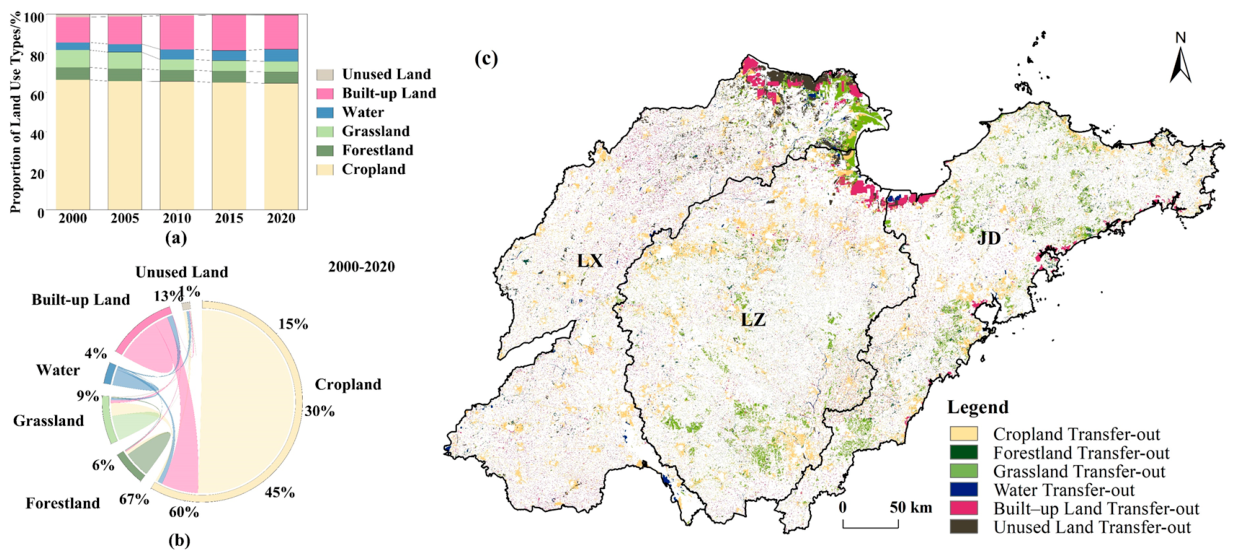
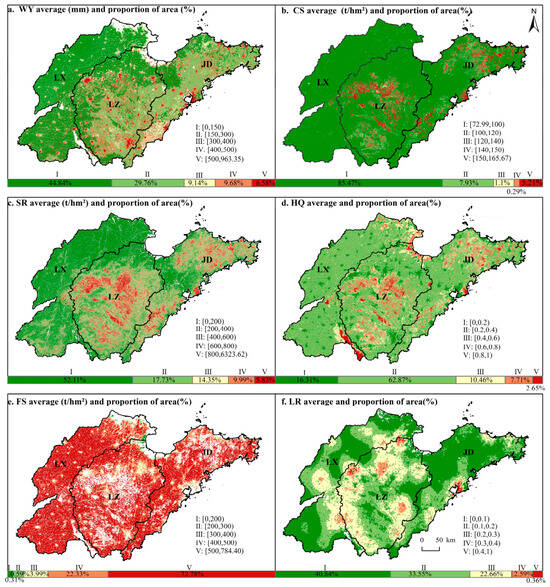
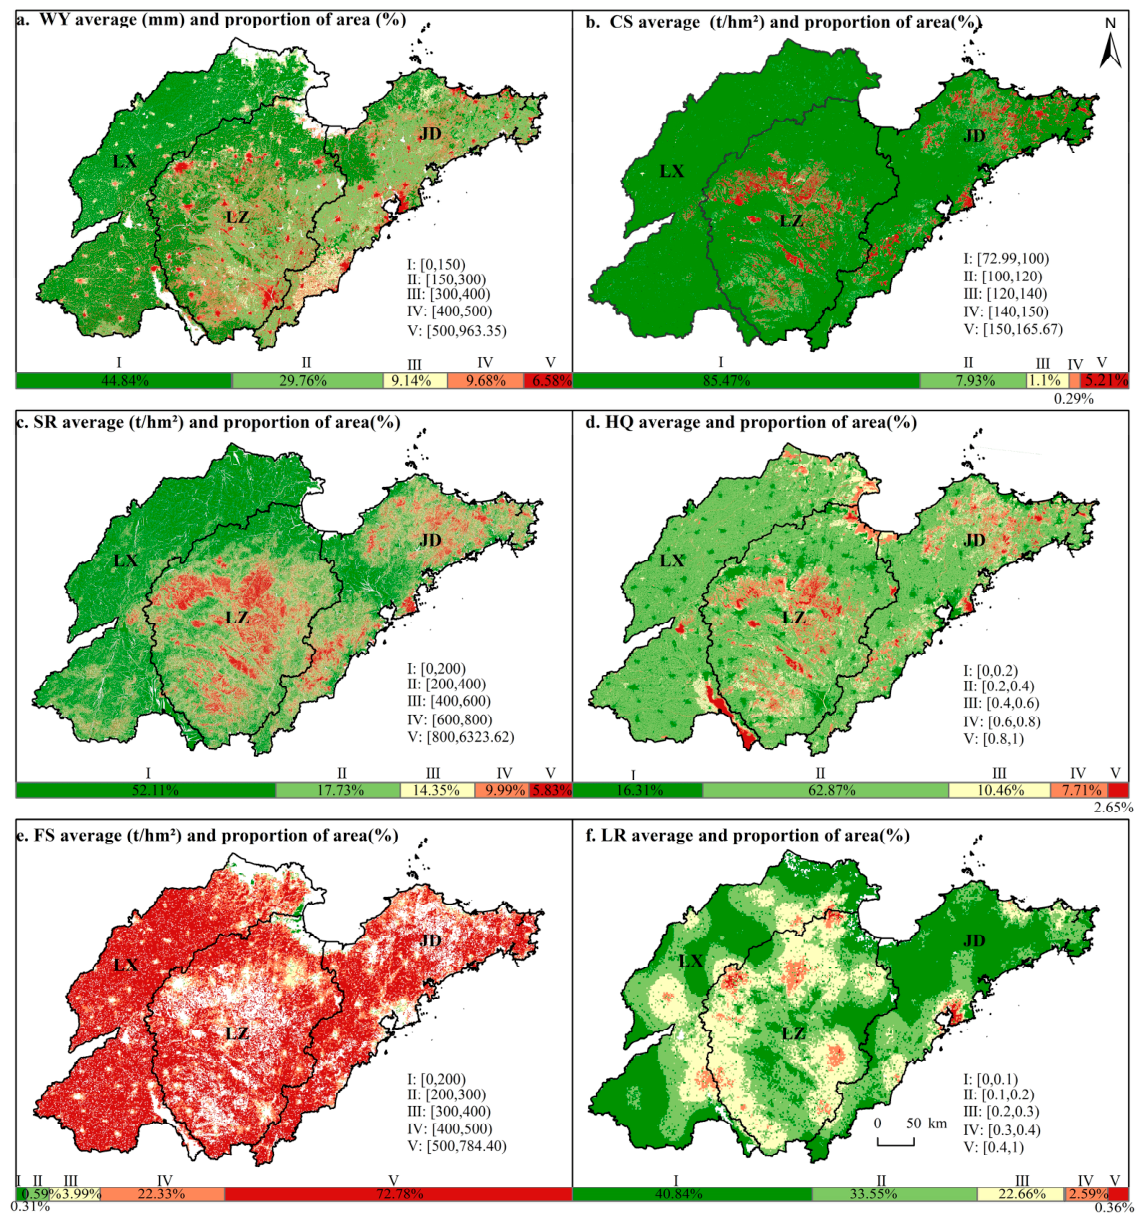
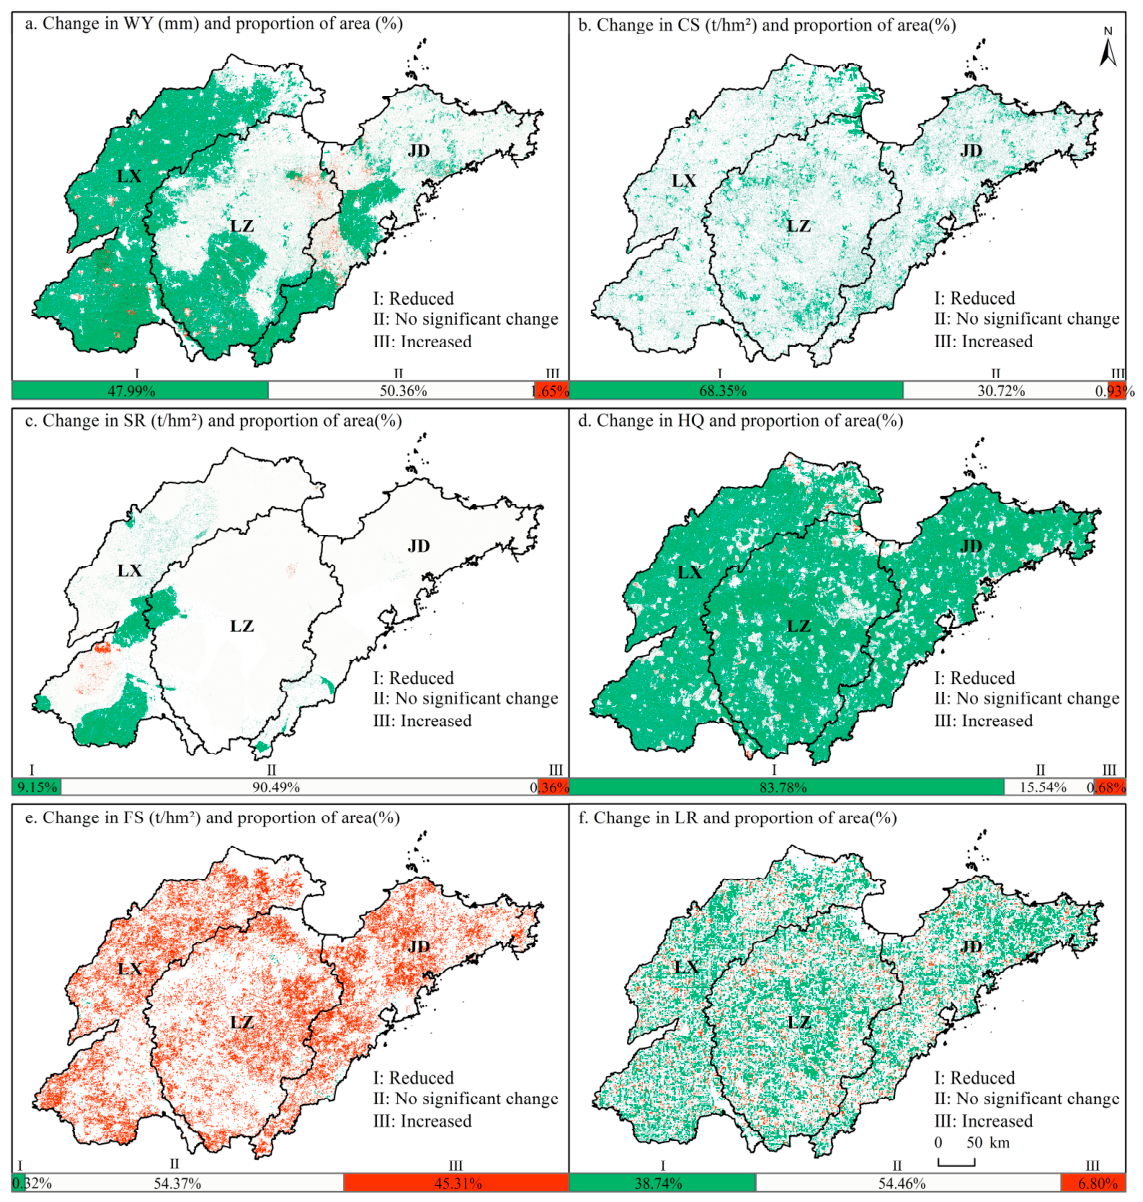
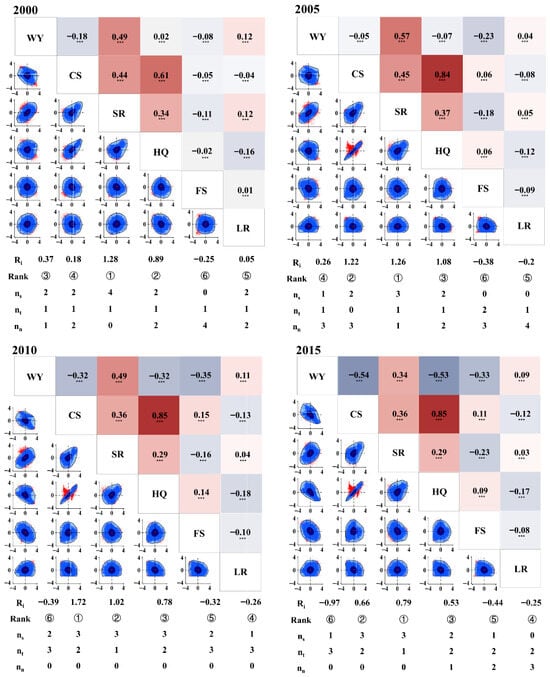
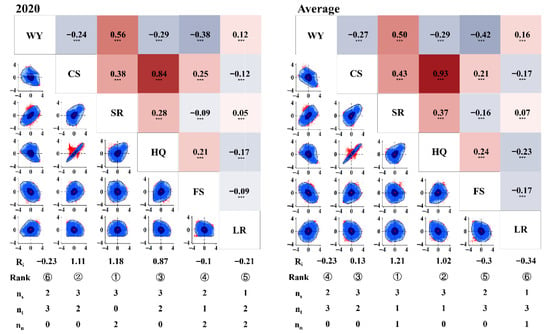
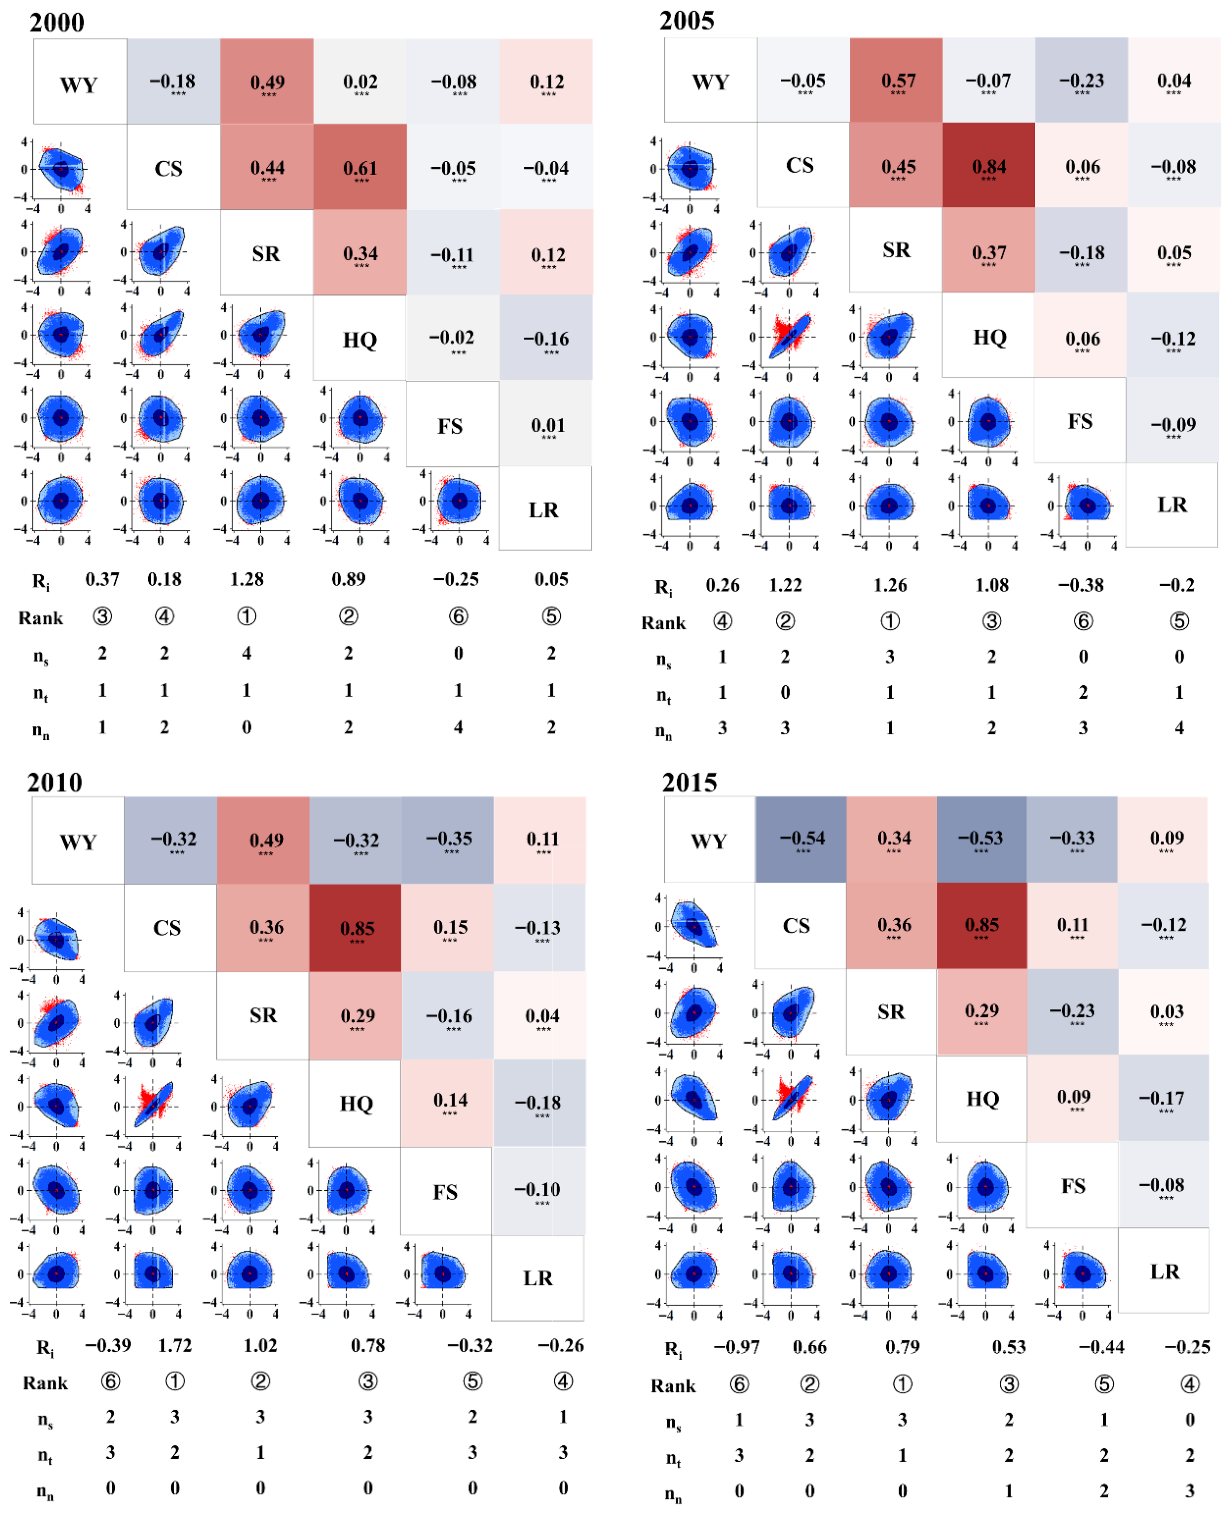
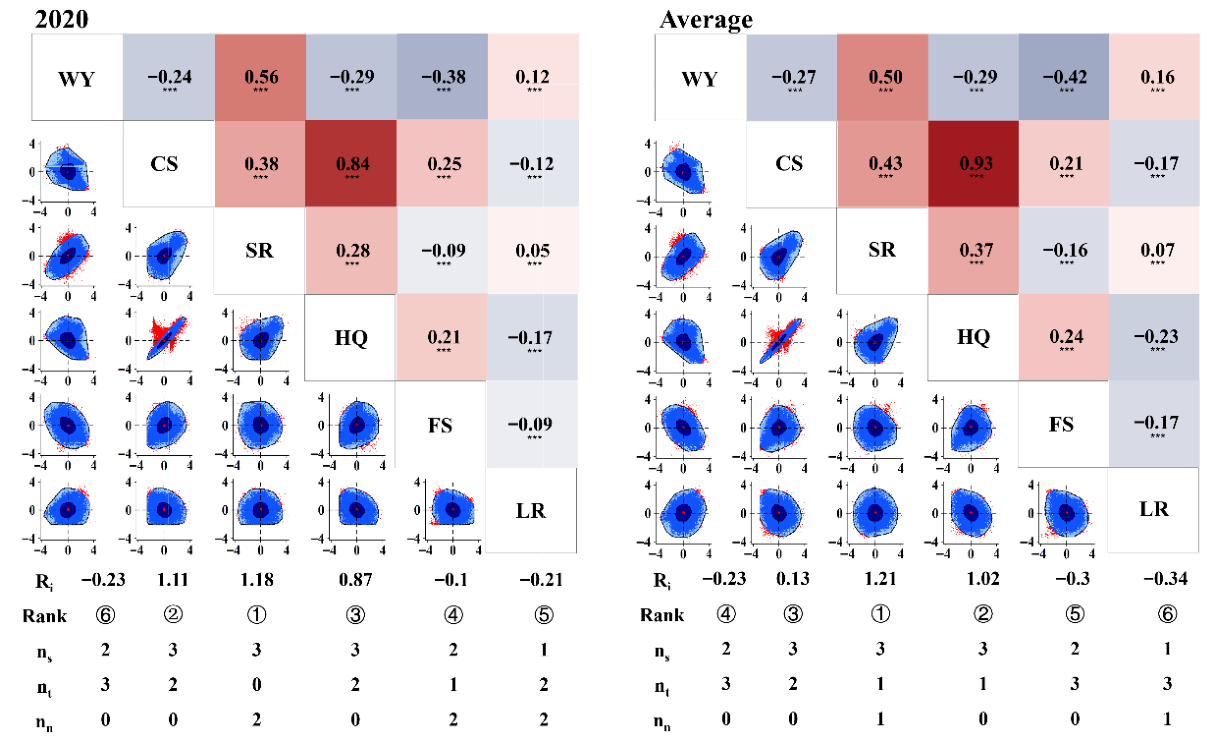
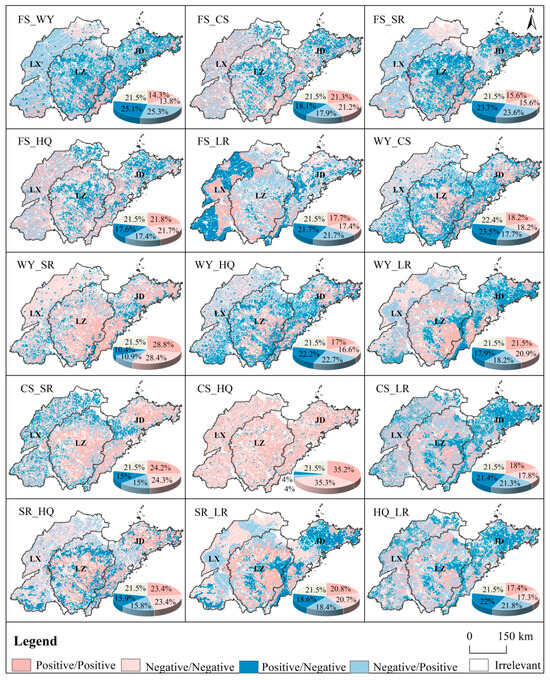
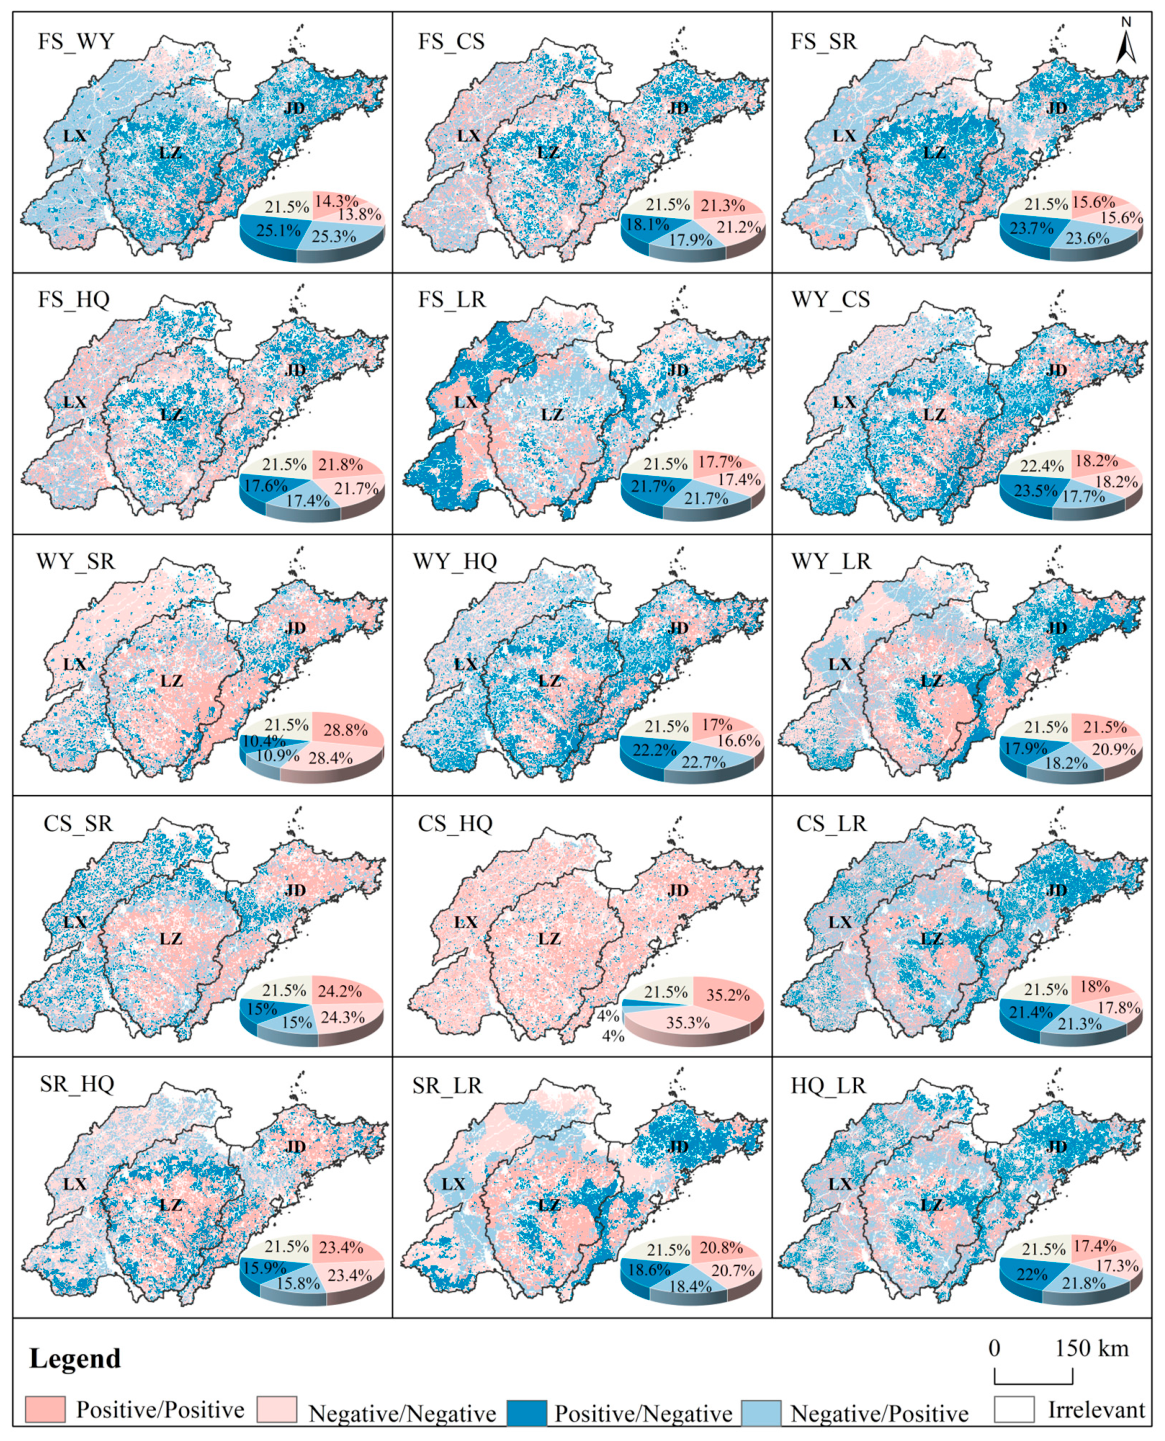
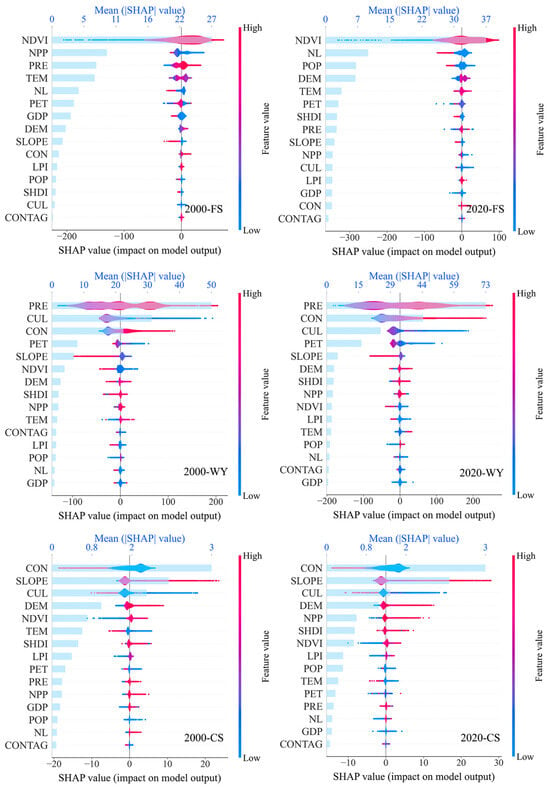
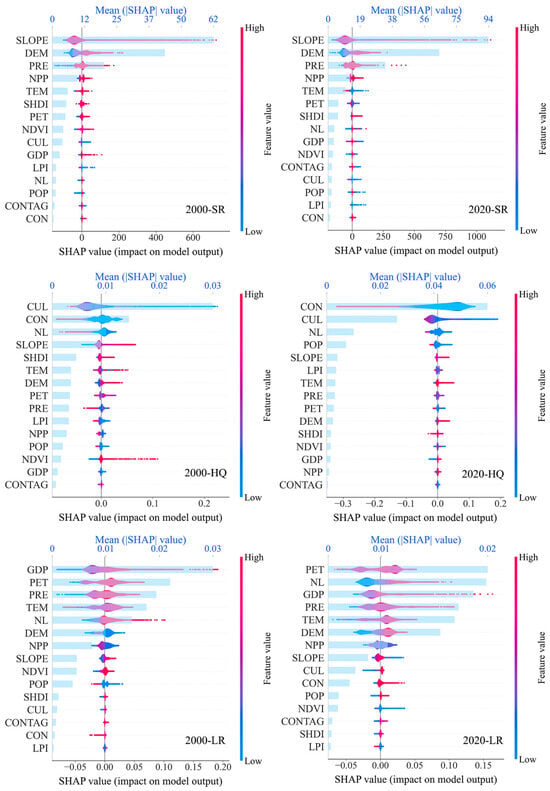
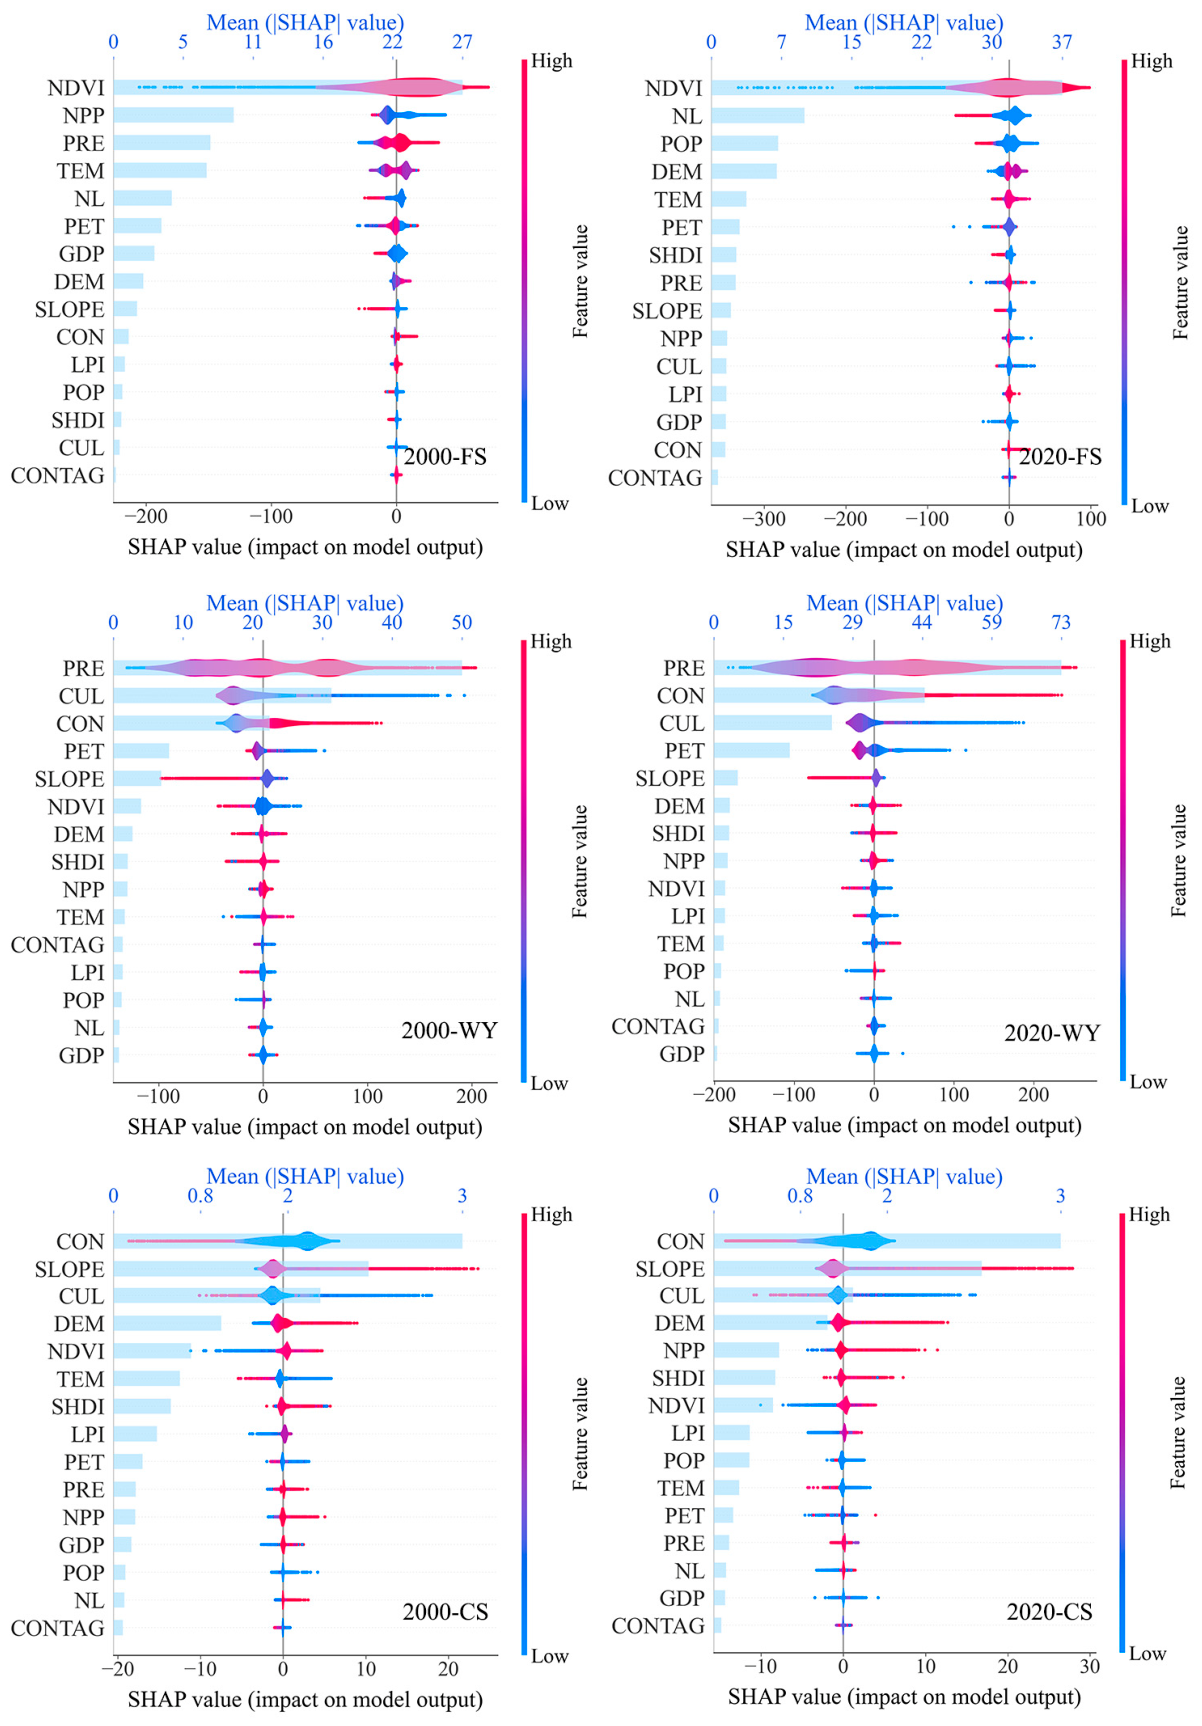
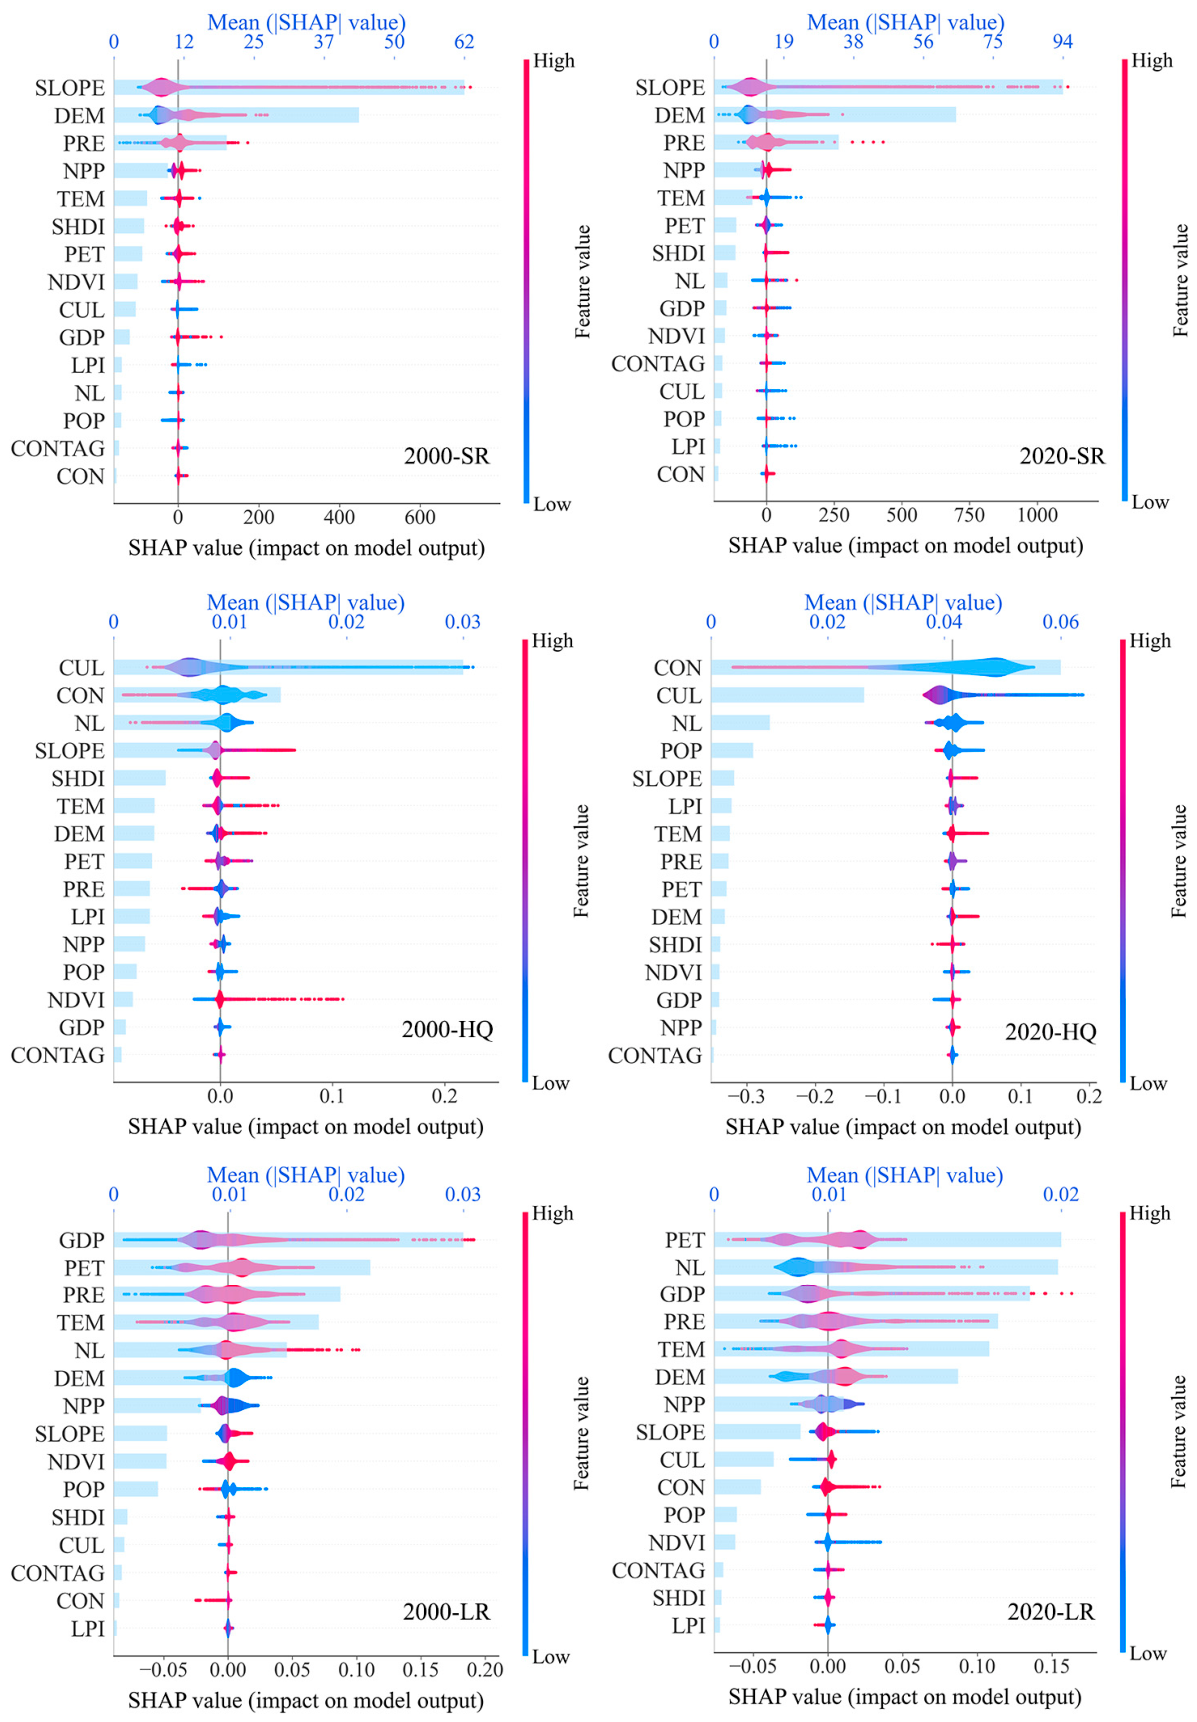
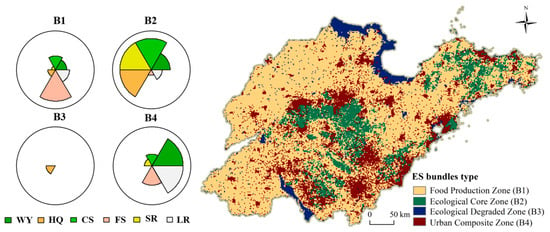
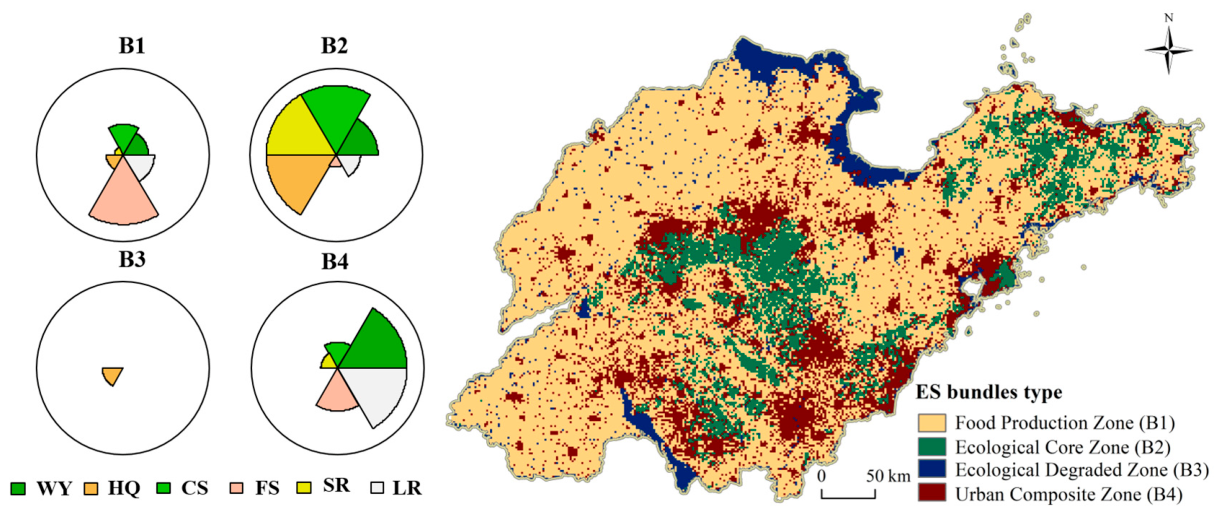
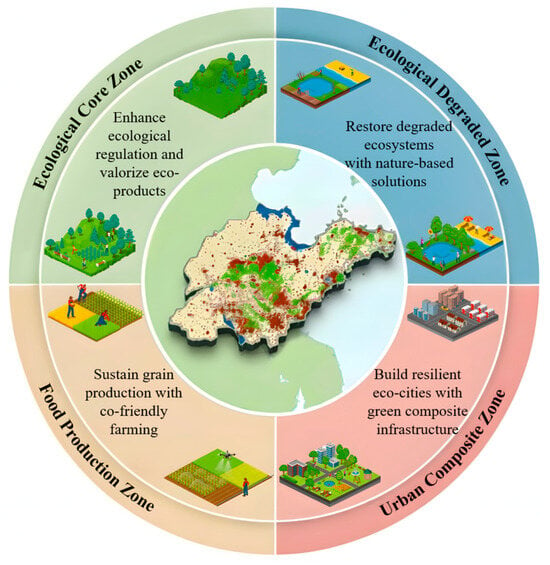
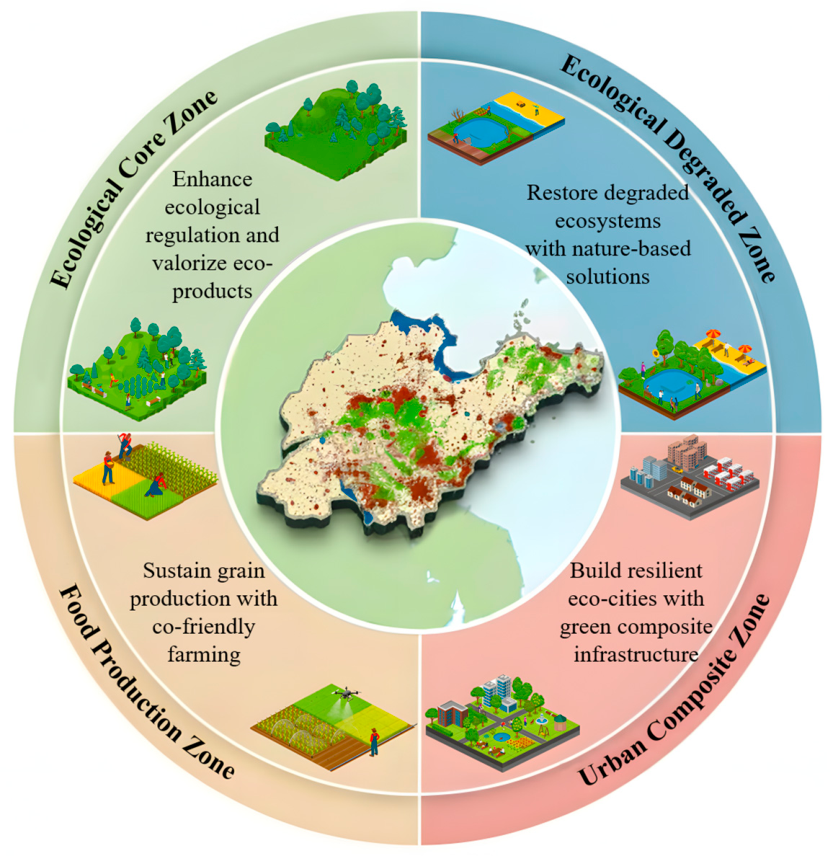

Disclaimer/Publisher’s Note: The statements, opinions and data contained in all publications are solely those of the individual author(s) and contributor(s) and not of MDPI and/or the editor(s). MDPI and/or the editor(s) disclaim responsibility for any injury to people or property resulting from any ideas, methods, instructions or products referred to in the content. |
© 2026 by the authors. Licensee MDPI, Basel, Switzerland. This article is an open access article distributed under the terms and conditions of the Creative Commons Attribution (CC BY) license.