


Abstract
Ecological resilience (ER) describes the ability of ecosystems to resist, adapt, and recover from external shocks. How to improve ER has become a crucial component of high-quality development (HQD) in the new era. Therefore, there is an urgent need to investigate the synergistic relationship between HQD and ER. In this study, taking the Yellow River Basin as an example, long-term time series data (2008–2022) were used at the provincial scale. Then we developed a logical framework to reveal the interrelationship and intrinsic mechanism between HQD and ER. Next, we explored the spatiotemporal coupling characteristics of HQD and ER using a comprehensive evaluation model and coupling coordination analysis. We found that from 2008 to 2022, the comprehensive level of HQD and ER fluctuated, and the coupling coordination degree showed significant spatial distribution characteristics. Meanwhile, from 2008 to 2022, the spatial evolution level of HQD increased in 89% of the study regions, while ER improved markedly across most regions. Furthermore, using principal component analysis (PCA), we analyzed the driving factors for HQD and ER. The analysis revealed that economic development, green innovation, livelihood improvement, and ecological adaptation play significant roles in promoting the coordinated development of HQD and ER. This research can serve as a reference and methodological guidance for achieving high-quality and sustainable development in the Yellow River Basin.
1. Introduction
Throughout human civilization’s long history, river basins have nurtured many great ancient societies, such as those of China, India, and Egypt. As history progressed, various resources and factors continued to concentrate within these basins. For instance, the United States 2050 Spatial Strategic Plan identified 11 mega-regions, including the Mississippi River Basin, which have attracted over 75.7 percent of the population and industries. However, the development of river basins often undergoes a cyclical pattern of “rise, decline, and development.” Basins like Europe’s Rhine River and the United States’ Mississippi River have faced issues such as spatial imbalance and ecological disruption due to excessive exploitation and unsustainable human practices. Thus, the irrational development and utilization of river basins has long been a persistent challenge globally [1].
Internationally, research on river basins primarily focuses on human–land–water interactions, water risk identification, water resources management, and sustainable development [2,3,4,5]. In human–land–water interactions, Jaeger [6] utilized a human–Earth system model to determine the impacts of climate change and socio-economic growth on water use. Tesfatsion [7] investigated the feedback mechanisms among hydrology, climate, and human strategic decision-making within basins. Regarding water risk identification [8,9], there are a variety of methods, from Hierarchical Holographic Modeling (HHM) to harmony-based evaluation indices. However, water risk identification still focuses on diagnosis, lacking the ability to predict emerging threats. In water management and sustainable development, scholars primarily use hydrological prediction and spatial morphometry to improve predictive ability [10,11]. Overall, international research tends to concentrate on technological and methodological innovations to address basin-related challenges.
The Yellow River Basin is one of the most important birthplaces of the Chinese nation and also an important ecological barrier and economic belt in China [12]. With the rapid socio-economic development, ecological problems have increasingly emerged as obstacles to both ecological protection and high-quality development (HQD) in the region [13]. HQD, initially proposed in the Chinese context, is closely related to the globally established concept of sustainable development. Sustainable development emphasizes that meeting current needs must not compromise future generations’ ability to meet their own needs, whereas HQD especially emphasizes the shift from quantitative growth to collaborative progress in quality and economy. The core goal of the two frameworks is to balance environmental protection, economic development, and social conditions. In this sense, the HQD principle is suitable for China’s current economic transformation and ecological governance stage. At present, academic research on improving the HQD of the Yellow River Basin mainly focuses on ecological security, ecosystem service function, ecological vulnerability, ecological health, and other aspects.
Research on the Yellow River Basin has focused on three areas: ecosystem service quantification, ecological conservation and carbon emissions, and ecological governance. For instance, research on ecosystem services primarily employs various methods and perspectives to quantitatively analyze and simulate the physical quantities and values of ecosystem services, as well as their trade-off/synergy relationships [14,15,16]. Regarding ecological conservation and carbon emissions in the basin, with the advancement of key ecological protection zones and the accelerated development of urban agglomerations and industrial agglomerations, structural convergence within the basin has intensified. Consequently, a growing number of scholars are focusing on aspects such as the spatiotemporal differences in carbon emissions [17,18]; the interactions among water, soil, energy, and carbon [19]; pathways for carbon emission reduction [20]; and carbon compensation zoning [21] in the region. In terms of ecological governance in the Yellow River Basin, researchers have explored adjustment pathways and governance strategies from the perspectives of air pollution control, water pollution management, and ecological environment governance to ensure the basin’s healthy ecological development [22,23].
While scholars have conducted extensive research on the Yellow River Basin, most studies have focused on topics such as ecosystem services and ecological conservation. However, there is still relatively limited research that analyzes the ecosystem’s resistance to disturbances and self-regulating capacity from a resilience perspective. The “resilience” originally stems from the fields of mechanics and physics. Holling [24] first introduced the concept of “resilience” into ecology to describe the continuity of a system’s internal structure and its ability to withstand external disturbances. As research has deepened, the concept of resilience has evolved within ecology and has since expanded into urban studies [25,26,27,28]. Regarding dynamic evolution, some scholars have constructed an ecological resilience (ER) indicator system based on the “resistance–adaptation–restoration” perspective and analyzed the dynamic evolutionary patterns of ER [29,30,31]. Other researchers, adopting an evolutionary resilience perspective, have analyzed the spatiotemporal differentiation of ER [12,32]. In terms of dynamic interrelationships, most scholars adopt a coupling perspective to examine the coordinated evolution of economic development, urbanization, and ER [33,34,35]. In summary, current research primarily focuses on the conceptual definition of ER, the construction of an indicator system [36], its spatiotemporal patterns [37], and methodological approaches [38]. In terms of research scale, studies are mainly concentrated at the provincial level [39], with relatively scant attention paid to a basin-wide perspective.
Based on this, most existing studies regard HQD and ER as a single system for analysis. The synergy mechanism and evolution pattern between the two systems are not mature, and no empirical exploration has been carried out at the watershed scale. With the increasing emphasis on HQD in the Yellow River Basin, it is of great significance to scientifically measure the evolutionary characteristics and influencing factors of HQD and ER. Therefore, this study selects the Yellow River Basin as the research area, expanding the research perspective to the coupling relationship between HQD and ER, exploring the evolution and spatiotemporal coupling characteristics from 2008 to 2022, and finally, providing theoretical support and practical experience for the coordinated development of HQD and ER. The main objectives of this research include the following: (1) to analyze the spatiotemporal differentiation characteristics of HQD and ER; (2) to explore the evolutionary process of HQD and ER; (3) to analyze coupling coordination characteristics of spatiotemporal sequences of HQD and ER; (4) to explore the influencing factors of the coupling coordination degree between HQD and ER.
2. Analytical Framework
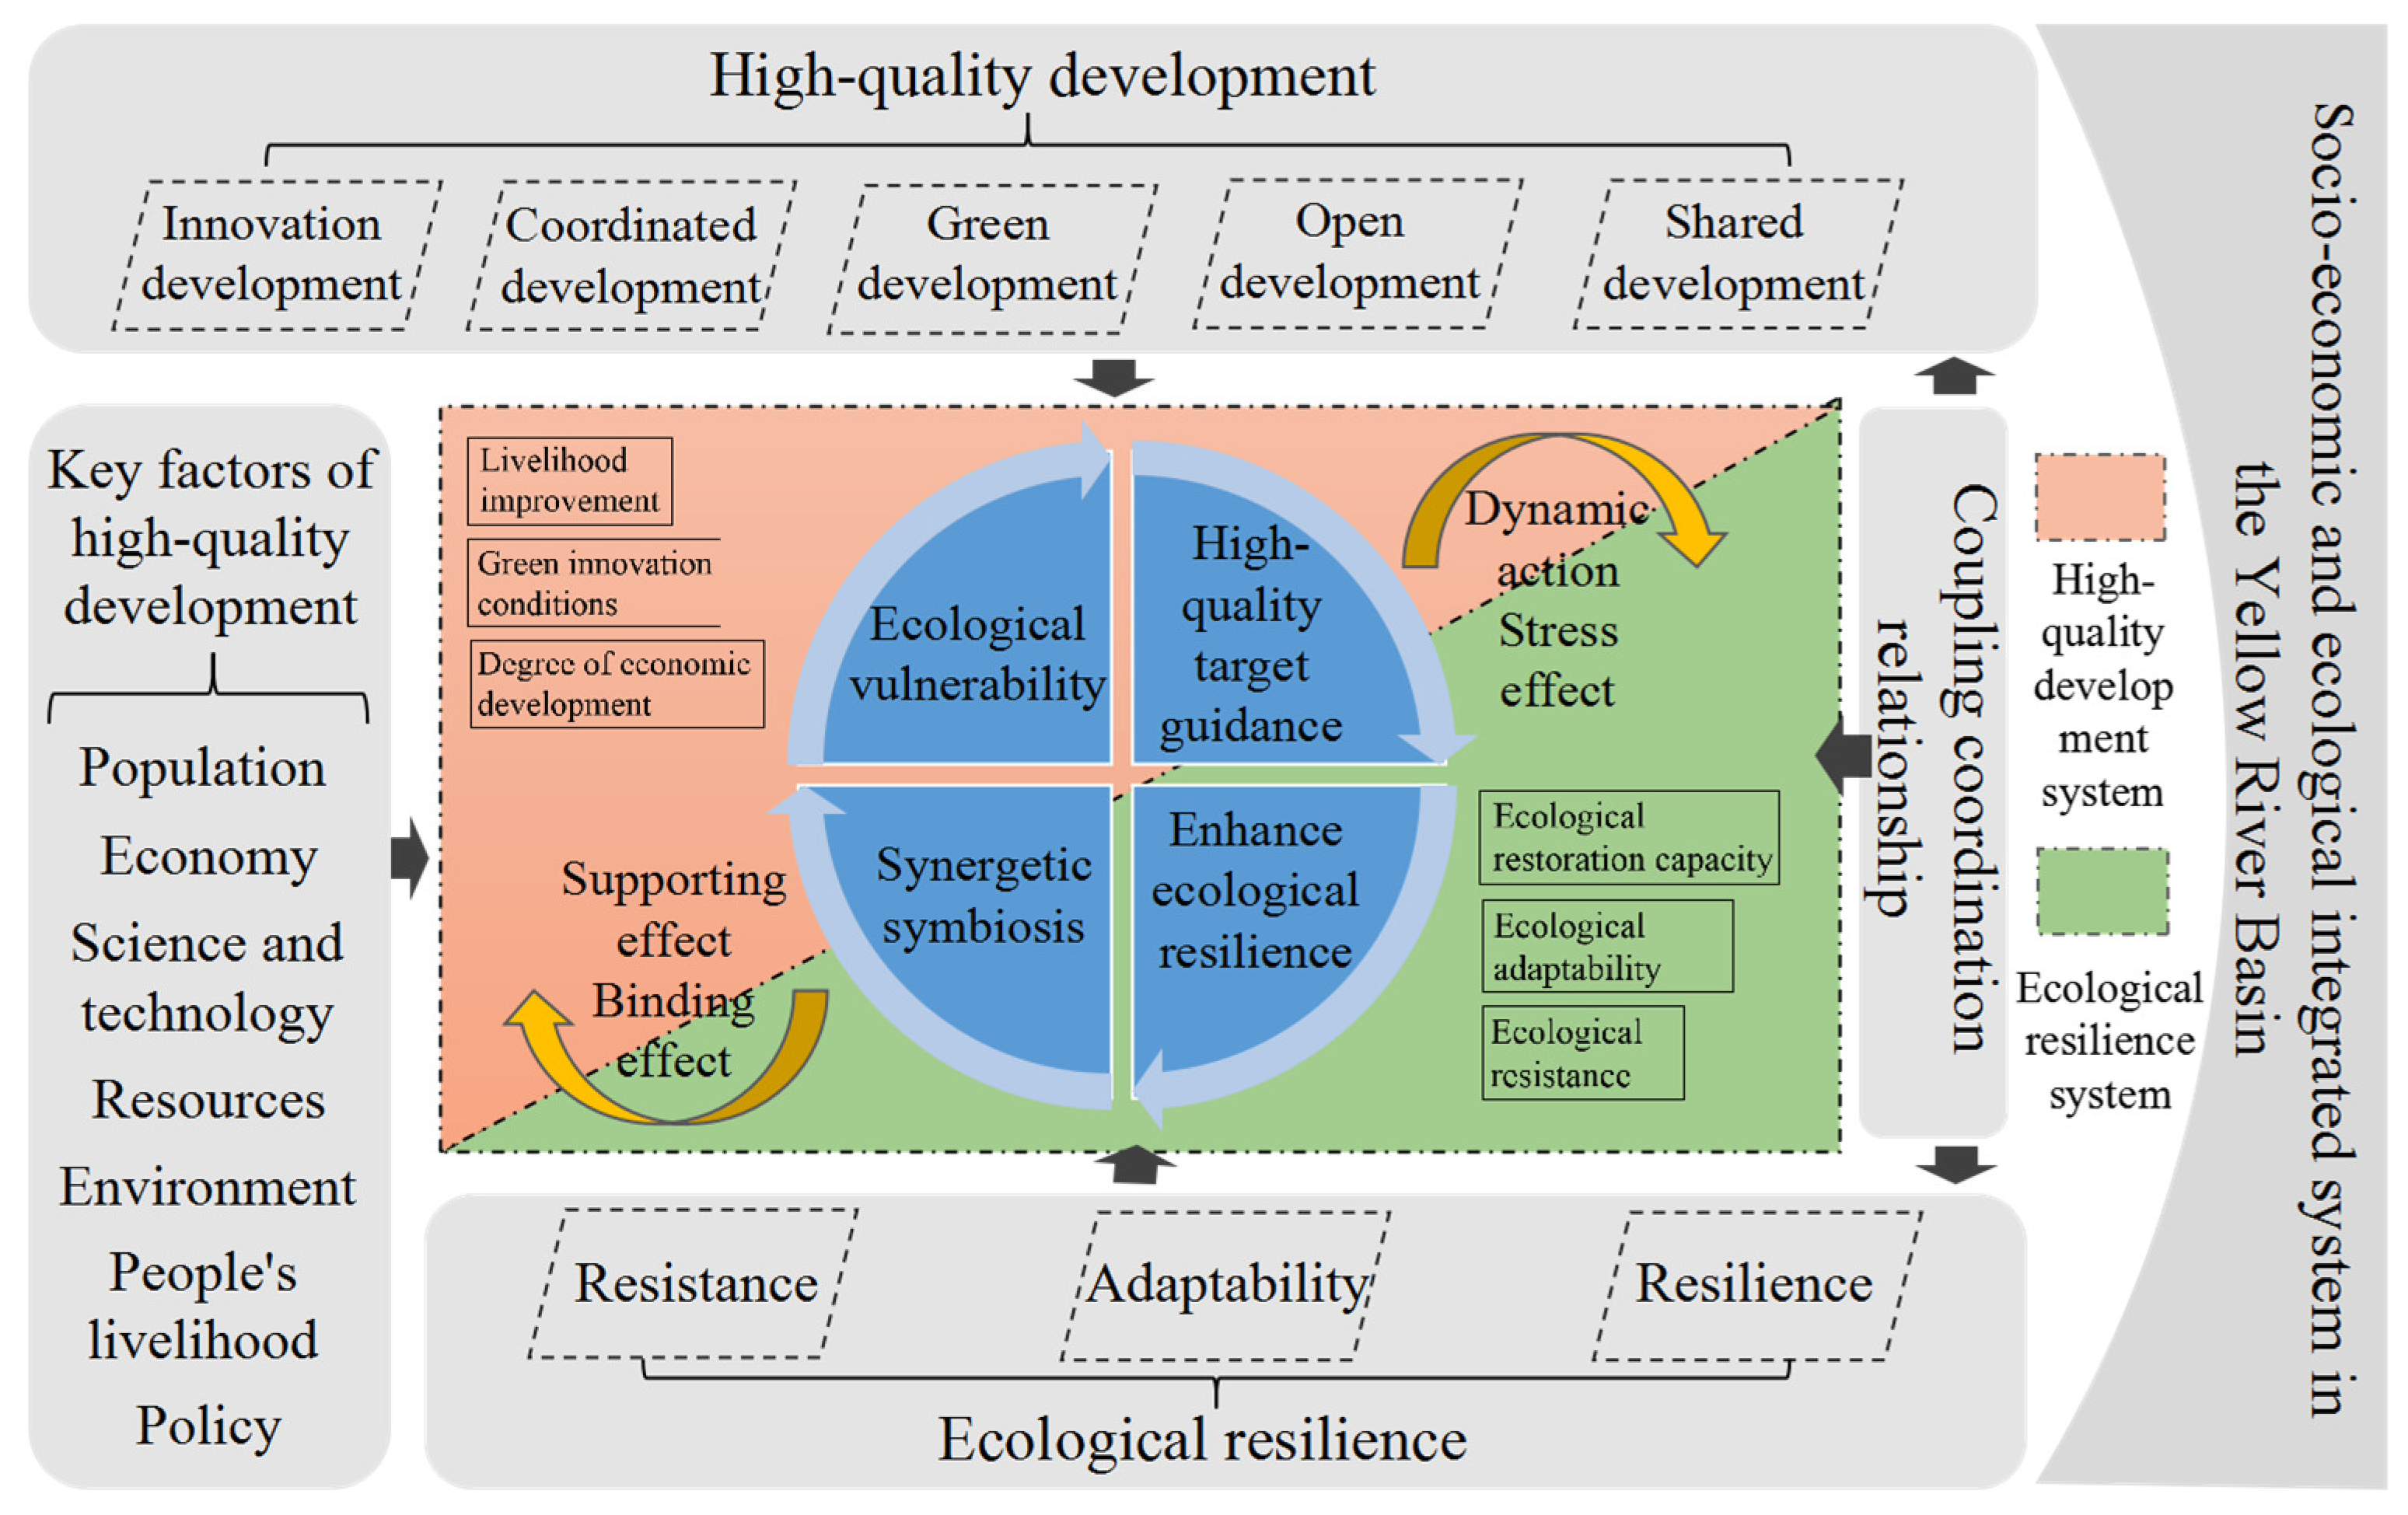
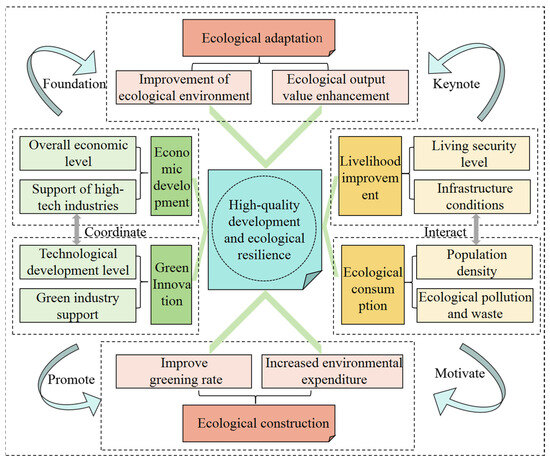
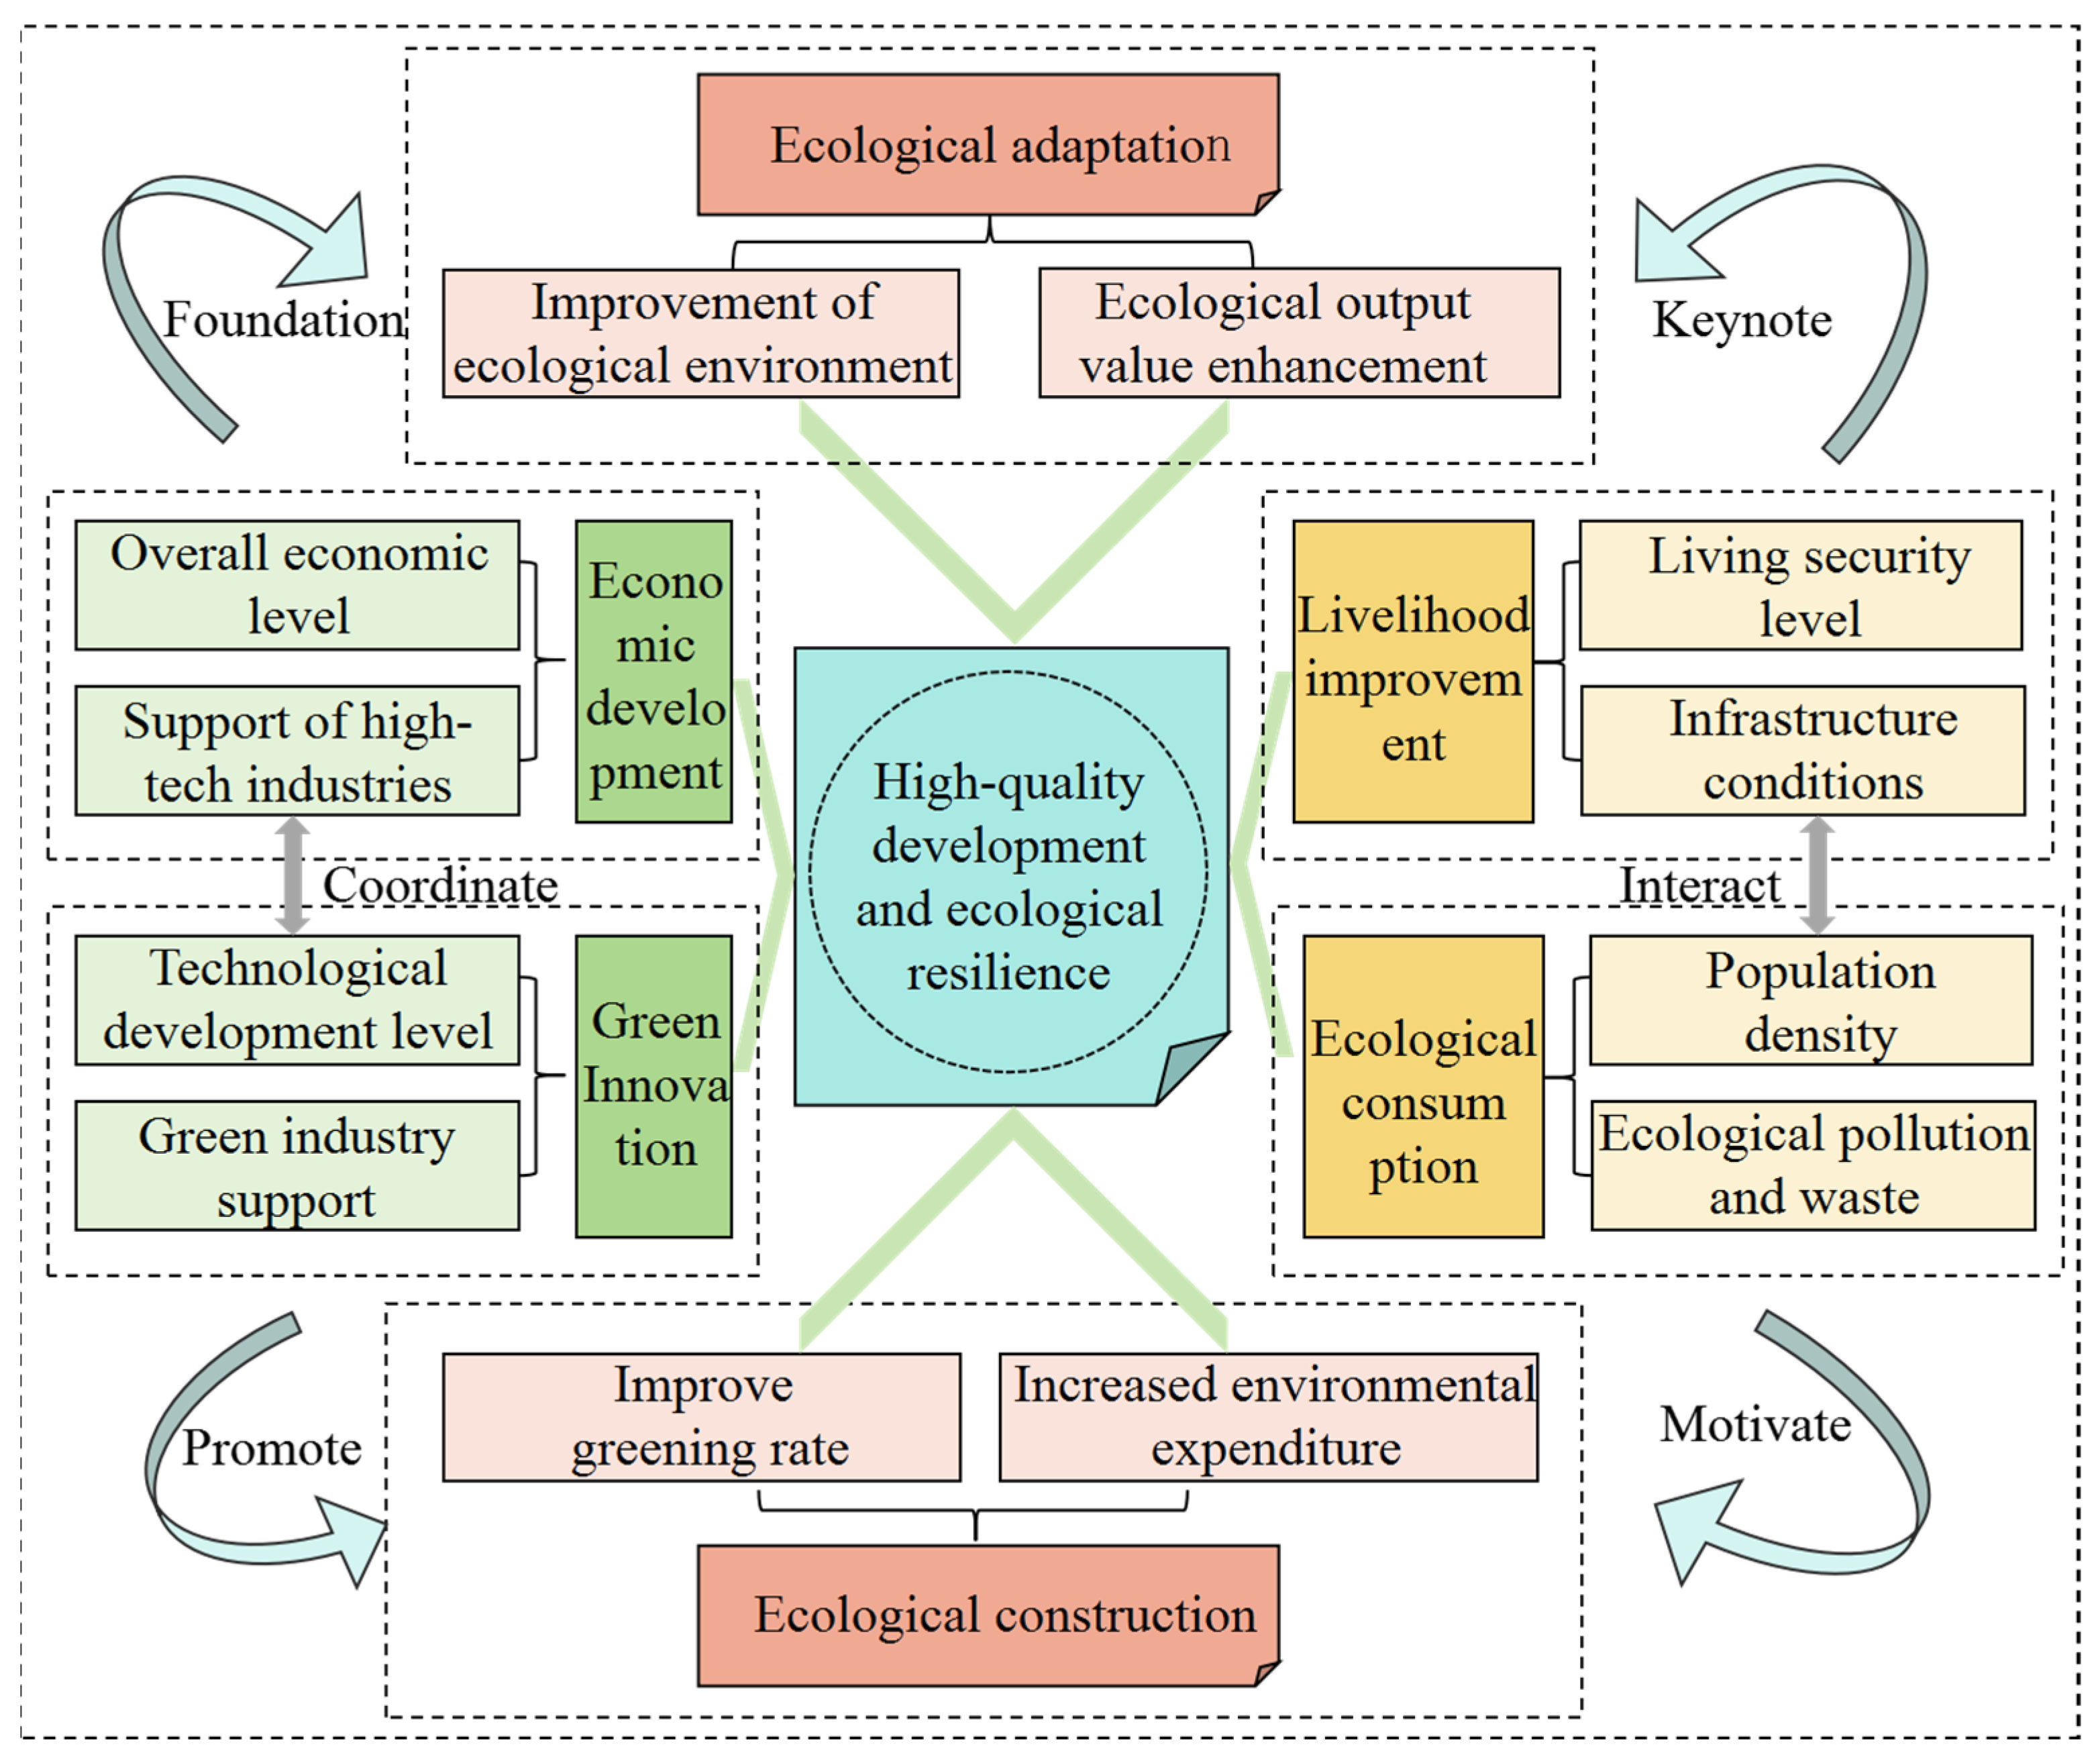
A sound ecological environment is a prerequisite for achieving sustainable socio-economic development. Thus, enhancing ER can promote HQD within a river basin [40,41]. HQD in the Yellow River Basin, a crucial national strategy, is key to advancing the region’s economy and structural optimization. It encompasses multiple factors, including population, economy, technology, resources, environment, and policy. Specifically, improving ER can optimize the efficiency of natural resource utilization, compel the adoption of green technologies, drive industrial restructuring towards low-carbon models, and then cultivate HQD [42]. Conversely, high-quality economic growth provides the essential economic foundation for ecological conservation and harmony. In other words, it acts as a driving force for enhancing ER [43]. Therefore, a relationship of mutual connection and constraint exists between HQD and ER in the Yellow River Basin. By strengthening positive feedback mechanisms within the socio-ecological–economic system, ER enhances environmental risk resilience and economic quality, thereby promoting HQD in the Yellow River Basin. Conversely, neglecting HQD and persisting with extensive, resource-intensive growth models will lead to ecosystem destruction, resource depletion, and pollution, exerting significant stress on the ecological environment.
Given the synergistic interaction between ER and HQD, this study investigates the co-evolutionary dynamics between them in the Yellow River Basin to achieve symbiotic synergy and mutual benefit. The specific theoretical analytical framework is presented in Figure 1.
Figure 1.
Logical framework of high-quality development (HQD) and ecological resilience (ER).
3. Materials and Methods
3.1. Case Study
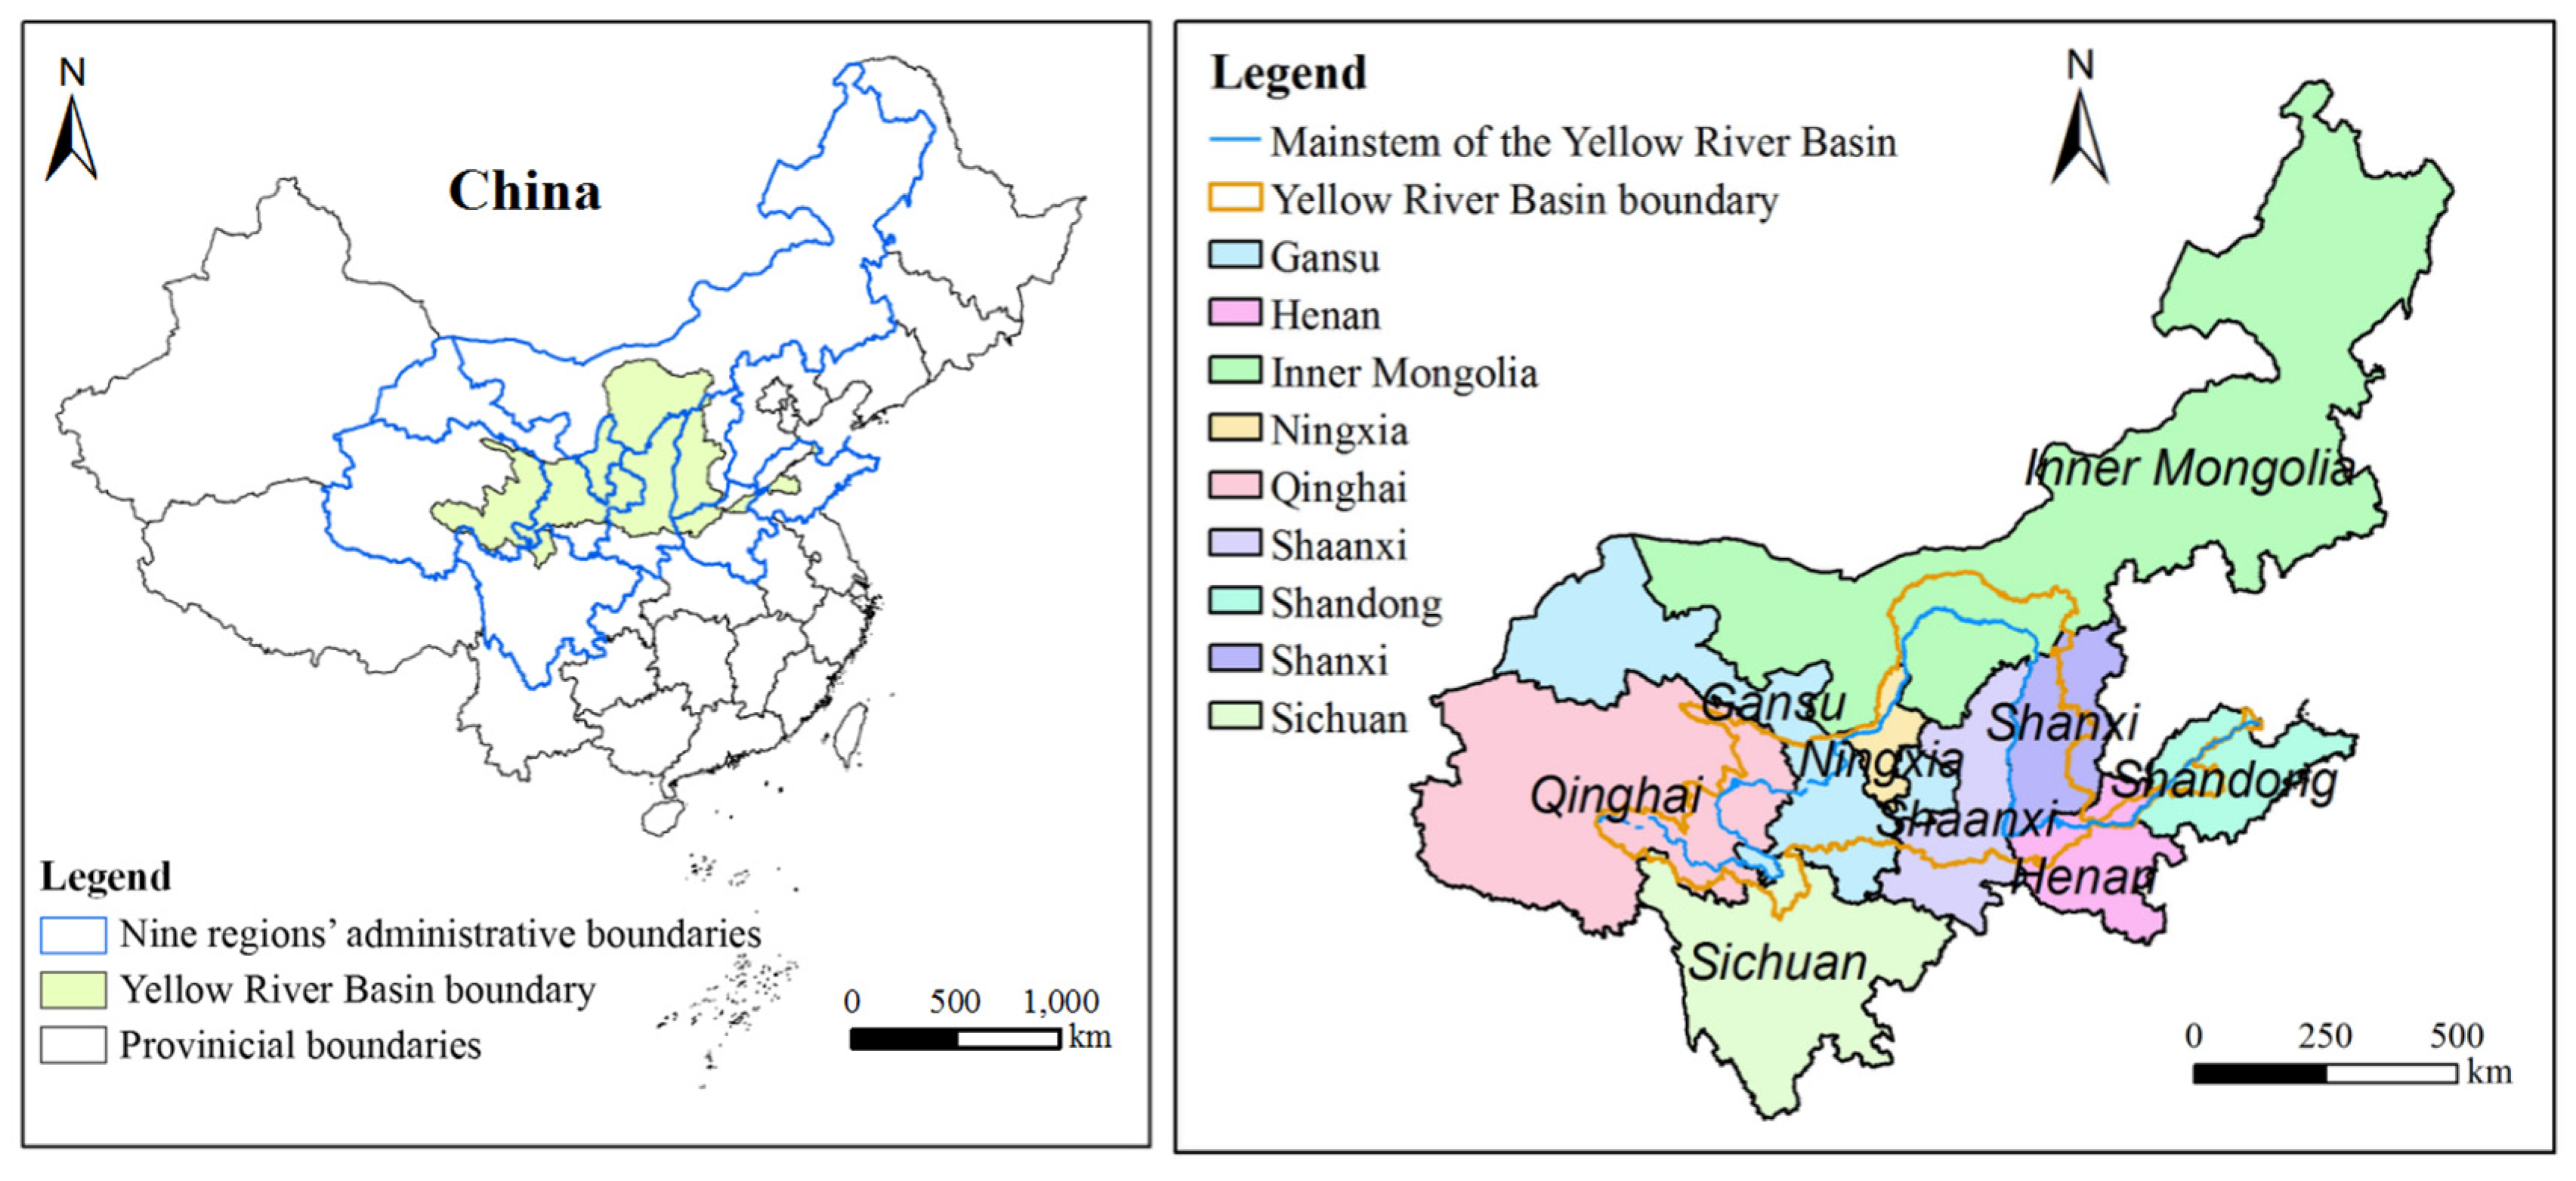
The Yellow River, the second-longest river in China, flows through the central and western regions of the country, with its terrain descending from west to east and covering a basin area of approximately 7.95 × 10⁵ km2 (Figure 2). It traverses nine provincial-level regions—Qinghai, Sichuan, Gansu, Ningxia, Inner Mongolia, Shanxi, Shaanxi, Henan, and Shandong—before discharging into the Bohai Sea at Dongying City in Shandong Province. In recent years, influenced by both natural and anthropogenic factors, the overall ecological environment of the Yellow River Basin has undergone significant changes, accompanied by a growing imbalance in population distribution within the basin. Compared with the Yangtze River Economic Belt, socio-economic development in the Yellow River Basin remains relatively lagging, characterized by insufficient industrial coordination and challenges to sustainable economic growth. Against the backdrop of HQD, it is imperative to rationally assess the interactive coupling between HQD and ER to optimize the overall spatial development and utilization of the Yellow River Basin.
Figure 2.
Geographical location of the Yellow River Basin.
3.2. Data Acquisition
The data employed in this study include the following: (1) Land use data and natural statistical data derived from the Resource and Environmental Science Data Center (https://www.resdc.cn [accessed on 25 November 2025]); (2) social data and economic data obtained from statistical yearbooks, as well as the statistical bulletin of the national economy and social development; (3) environmental data provided by the environmental status bulletin and water resources bulletins. The missing data for individual years in some cities are based on adjacent years’ data, supplemented by moving-average and trend extrapolation methods.
Given the differences in dimension and magnitude across the selected indicators, the data need to be normalized before analysis. This article uses a dimensionless method to standardize the positive and negative indicator data [44], and the formulas are as follows:
where i is the indicator, j is the year, Xij is the standardized value, xij is the original value, and max (xij) and min (xij) represent the maximum and minimum value of the indicator i in all of the years studied.
3.3. The Indexes for Evaluation of HQD and ER
Against the backdrop of rapid socio-economic development, coordinating the relationship between HQD and ER is crucial for achieving sustainable development in the Yellow River Basin. Therefore, based on the coupling mechanism between HQD and ER, a corresponding evaluation indicator system has been constructed around these two subsystems.
In terms of HQD, some scholars have examined it from the perspective of the five development concepts: “innovation, coordination, greenness, openness, and sharing” [45,46]. To facilitate empirical measurement while maintaining theoretical coherence, this study consolidates these concepts into three dimensions: economic development (encompassing coordination and openness), green innovation (integrating innovation and greenness), and livelihood improvement (reflecting sharing). Accordingly, 18 indicators are selected across these dimensions (Table 1). Among these, economic development is the primary driver of HQD, measured by indicators such as per capita gross regional product and economic density. Green innovation emphasizes the greening of production processes and the development of indigenous innovation capabilities. Livelihood improvement, which underpins HQD, focuses on infrastructure development, public service delivery, and quality of life.
Table 1.
The evaluation index system of high-quality development (HQD).
From an “evolutionary resilience” perspective, this study views ER as a fundamental attribute of watershed ecosystems that enables sustainable development through dynamic adaptation and transformation (Table 2). While the traditional pressure–state–response (PSR) framework treats ecosystems as passive recipients of external pressures, we adopt the State–Function–Interaction (SFI) perspective, which highlights that resilience emerges from dynamic interactions among system states, ecological functions, and feedback mechanisms [47,48]. Drawing on existing research [49,50], we construct an ER indicator system encompassing three dimensions that capture the ecosystem’s active response across the disturbance cycle: resistance capacity (pre-disturbance), adaptation capacity (during disturbance), and restoration capacity (post-disturbance). Here, resistance capacity denotes the system’s ability to withstand disturbances and keep its structure and functions unchanged, relying on its natural endowments. Adaptation capacity refers to the system’s ability to adjust to changing external conditions during the disturbance process. Restoration capacity indicates the ecosystem’s ability to restore its original structure and functions after experiencing disturbances.
Table 2.
The evaluation index system of ecological resilience (ER).
3.4. Comprehensive Index Evaluation Model of HQD and ER
Since this article involves multi-regional and multi-year data, takes into account the interrelationships among indicators, and aims to eliminate the interference of subjective factors on the evaluation results, this article adopts the entropy method to calculate the index weights [51]. As an objective weighting method, the entropy method determines the index weight by calculating the index information entropy and the relative change degree of the index. The calculation equation is as follows:
where i is the indicator, j is the year, n is the number of research units, ej is the information entropy of the i evaluation index, hi is the information utility value of the i evaluation index, and Wi is the weight of the i evaluation index.
Furthermore, the linear weighting method is used to calculate the evaluation values of the HQD and ER systems, respectively. The calculation method is as follows:
where F(x) represents the comprehensive evaluation value of HQD, G(y) represents the comprehensive evaluation value of ER, Xi represents the standardized value of HQD, Yj represents the standardized value of ER, Wi represents the evaluation index weight of HQD, and Wj represents evaluation index weight of ER. In this study, the natural breakpoint method (Jenks) is used for classification. At the same time, due to interannual differences in the numerical ranges of HQD and ER, uniform thresholds may result in overly concentrated classification categories in some years, thereby compromising discriminability. Therefore, the spatial patterns of HQD and ER across different periods canbe ensured by determining the breakpoints for the four periods.
3.5. Spatiotemporal Differentiation Model for Changes in HQD and ER
A comparative coefficient model is constructed to analyze spatiotemporal variation in HQD and ER across units within the Yellow River Basin, based on changes observed between the baseline and final years [52]. The specific calculation formula is as follows:
where Ci represents the change coefficient of HQD and ER for each unit, and Sit and Sit−1 denote the indices of HQD and ER for the final year and baseline year, respectively. A value of Ci > 0 indicates an improvement in the relevant index for the unit, while Ci < 0 signifies a decline.
3.6. Coupling Coordination Degree Model of HQD and ER
3.6.1. Coupling Degree Model
Coupling degree is a physical concept that primarily measures the degree of closeness between various modules in a certain system [46,53]. Studying the degree of coupling between HQD and ER can quantitatively reflect the interaction and stress relationship. Refer to existing related research to construct a coupling degree model between HQD and ER. The calculation method is as follows:
where C represents the coupling degree between HQD and ER, C ∈ [0, 1]; the larger the value of C, the higher the coupling degree and the stronger the interaction relationship. k represents the adjustment coefficient. Since this article mainly measures the coupling degree of the HQD system and ER system, k = 2.
3.6.2. Coordination Degree Model
Although the coupling degree model can measure the strength of the interaction between different systems, it cannot reflect the level of coordinated development between different systems. Therefore, this article constructs the coordination degree model between HQD and ER [46,53]. The calculation method is as follows:
where D is the coordination degree between HQD and ER, T is the index value of HQD and ER, α and β are the undetermined coefficients of HQD and ER, respectively, and α + β = 1. In this study, α and β are both set to 0.5 for the following reasons. First, HQD and ER are two interdependent dimensions of regional sustainable development. At the same time, equal weighting is the standard approach in coupling coordination research when subsystems have comparable theoretical status, and there is no empirical evidence that suggests differential importance. Finally, China’s sustainable development strategy consistently emphasizes the coordinated promotion of economic quality and ecological protection, so the undetermined coefficients α and β are both set to 0.5.
By referring to the standards of some scholars for the classification of the coupling coordination degree [46,54], this paper divides the coupling coordination degree into 3 categories and 10 sub-categories according to the value of D (Table 3).
Table 3.
Classification of coupling coordination types.
3.7. Principal Component Analysis
Multiple factors influence the synergistic relationship between HQD and ER. Statistically, it is generally required that variables introduced for research be independent, be significant, and exert a notable impact on the subject of study. However, in practice, these variables often exhibit varying degrees of intercorrelation. To eliminate redundant information in these correlations, principal component analysis (PCA) is used to reduce the dimensionality of the numerous variables. This method extracts principal components that retain the essential information of the original variables, thereby clarifying the influence of these variables on the subject of investigation [50,55].
The level of coordination between HQD and ER is jointly shaped by factors such as regional economic development, social living conditions, and the natural ecological foundation. Drawing on existing research, this study integrates the selected evaluation indicators for HQD and ER into six key influencing factors for analysis. These six factors encompass economic, social, and natural ecological dimensions. Among them, economic development reflects the current state of development and economic capacity. Green innovation represents the level of innovative development and awareness of environmental protection. Livelihood improvement serves as an indicator of social welfare and living standards. The ecological environment is a crucial factor influencing the synergy between HQD and ER. Thus, ecological consumption, ecological adaptation, and ecological construction are selected.
4. Results
4.1. Temporal Changes in HQD and ER in the Yellow River Basin
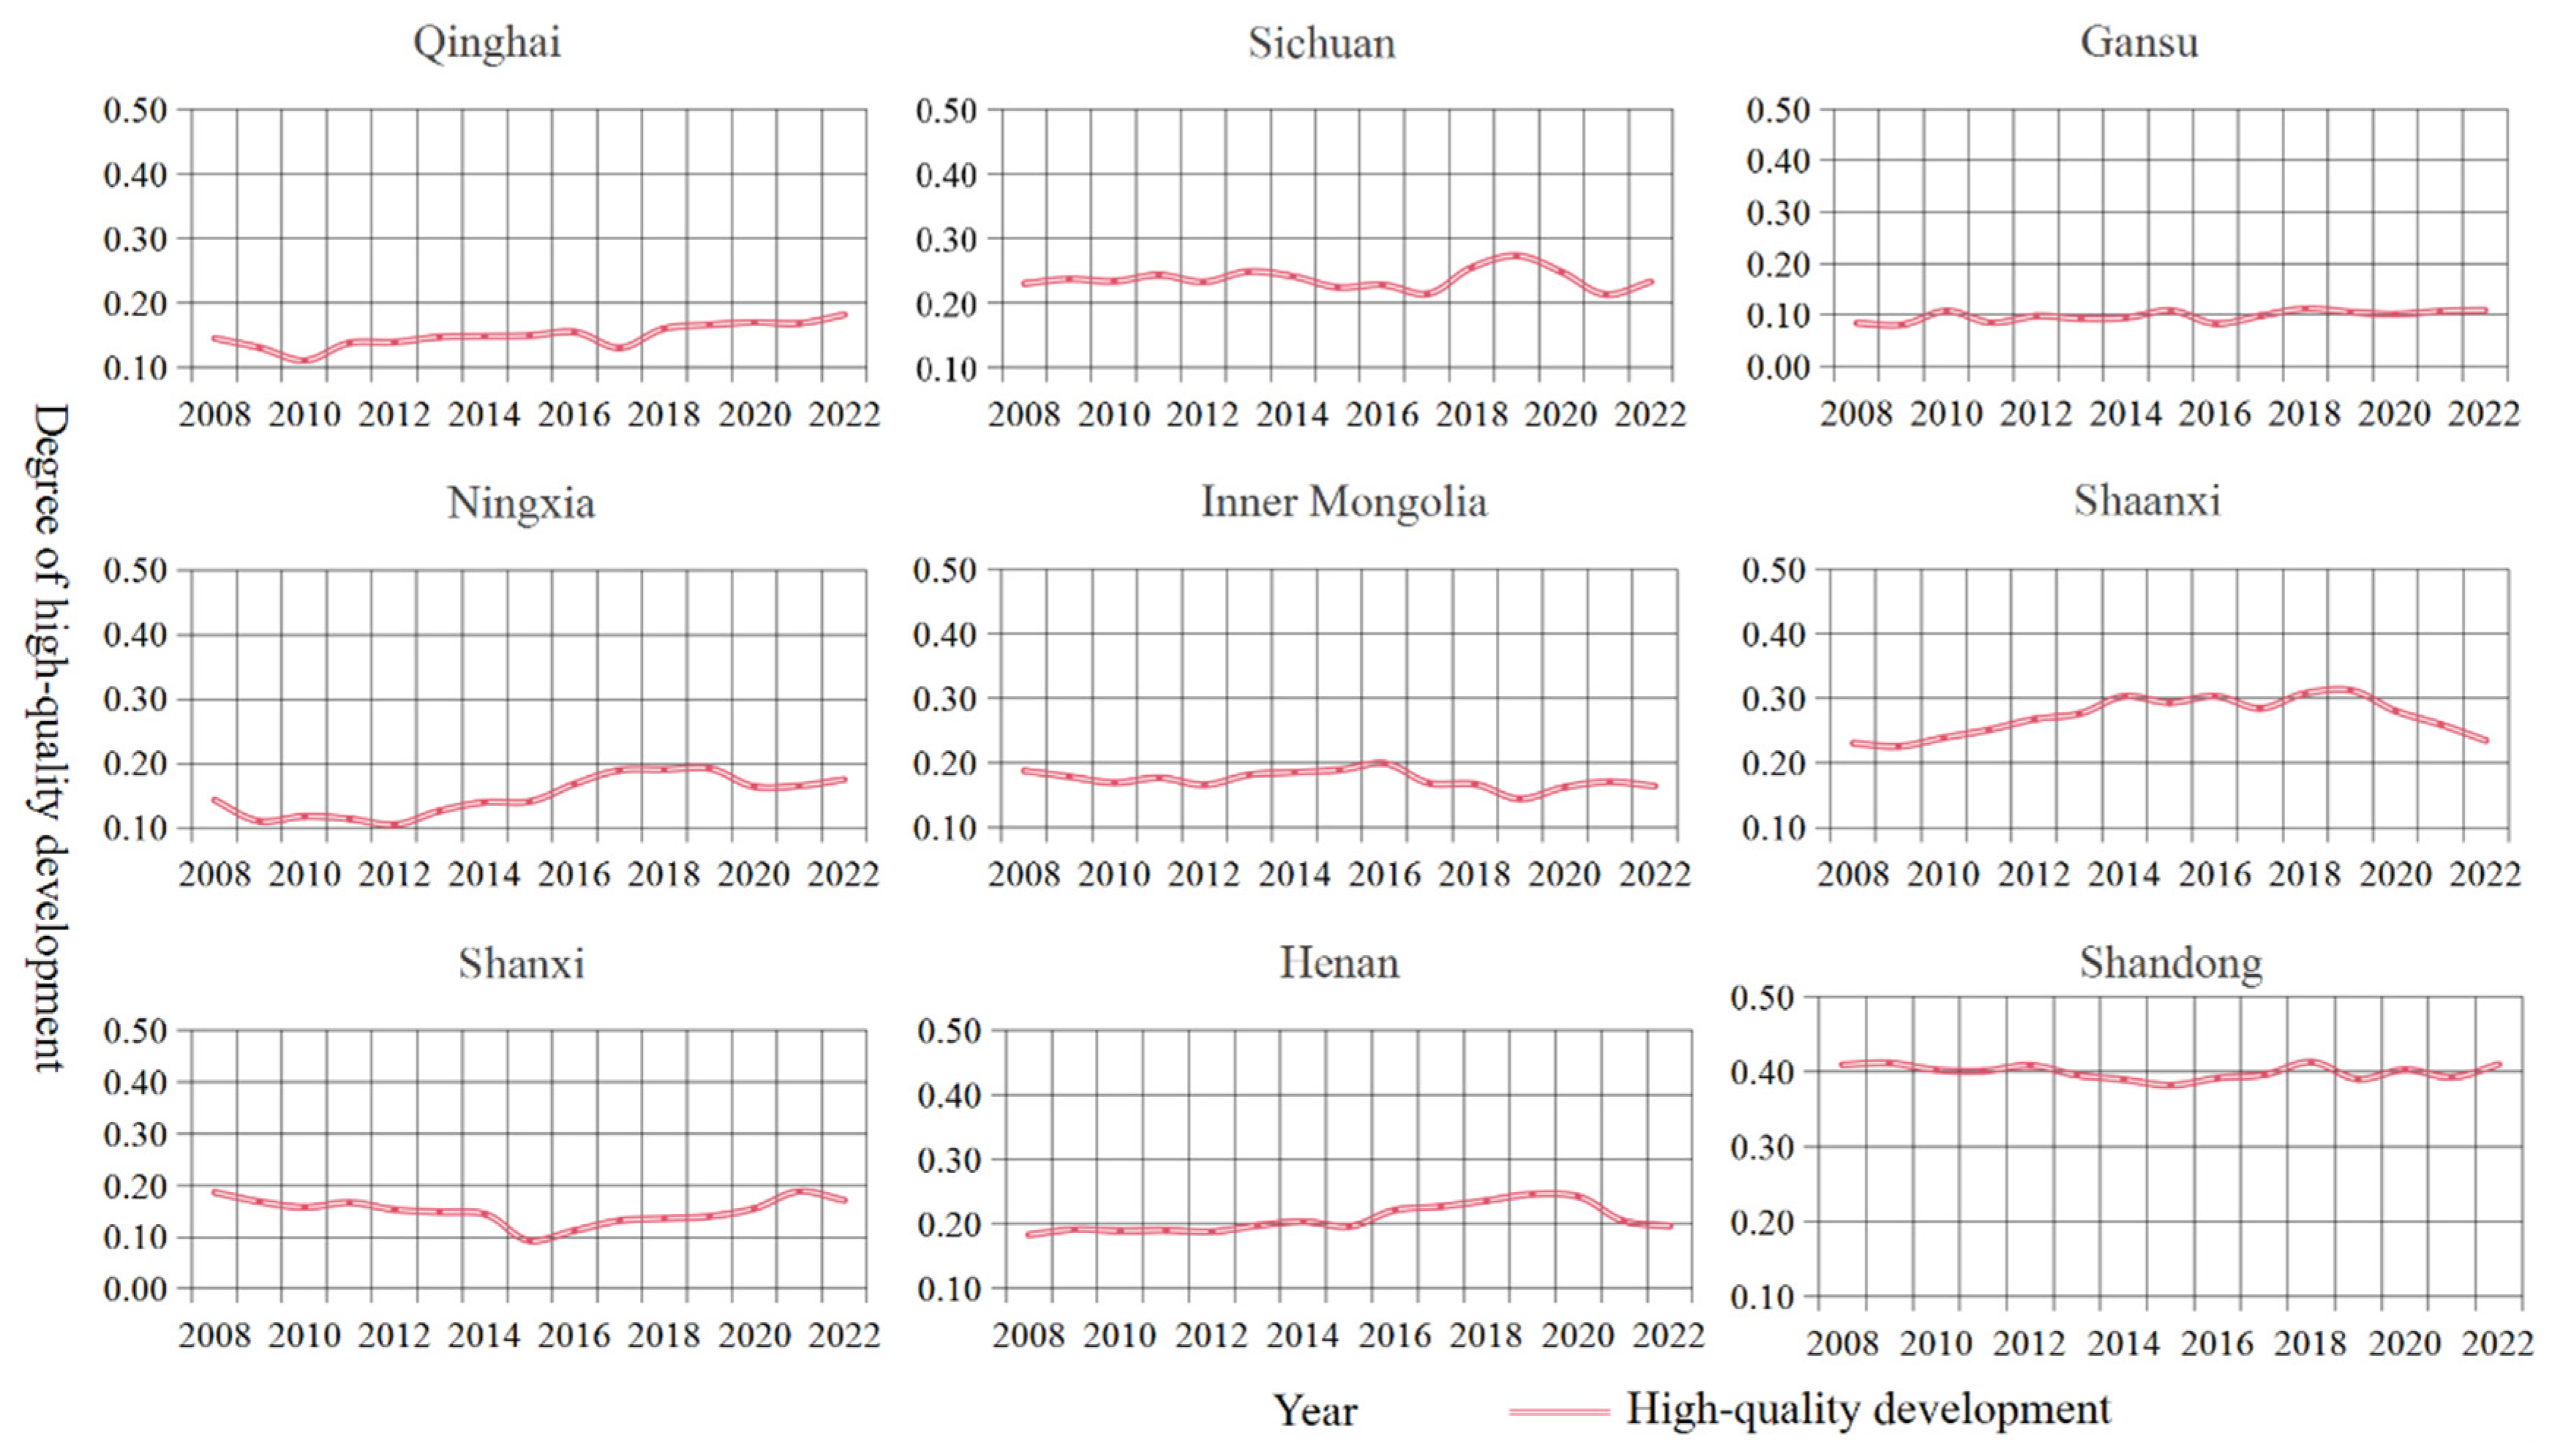
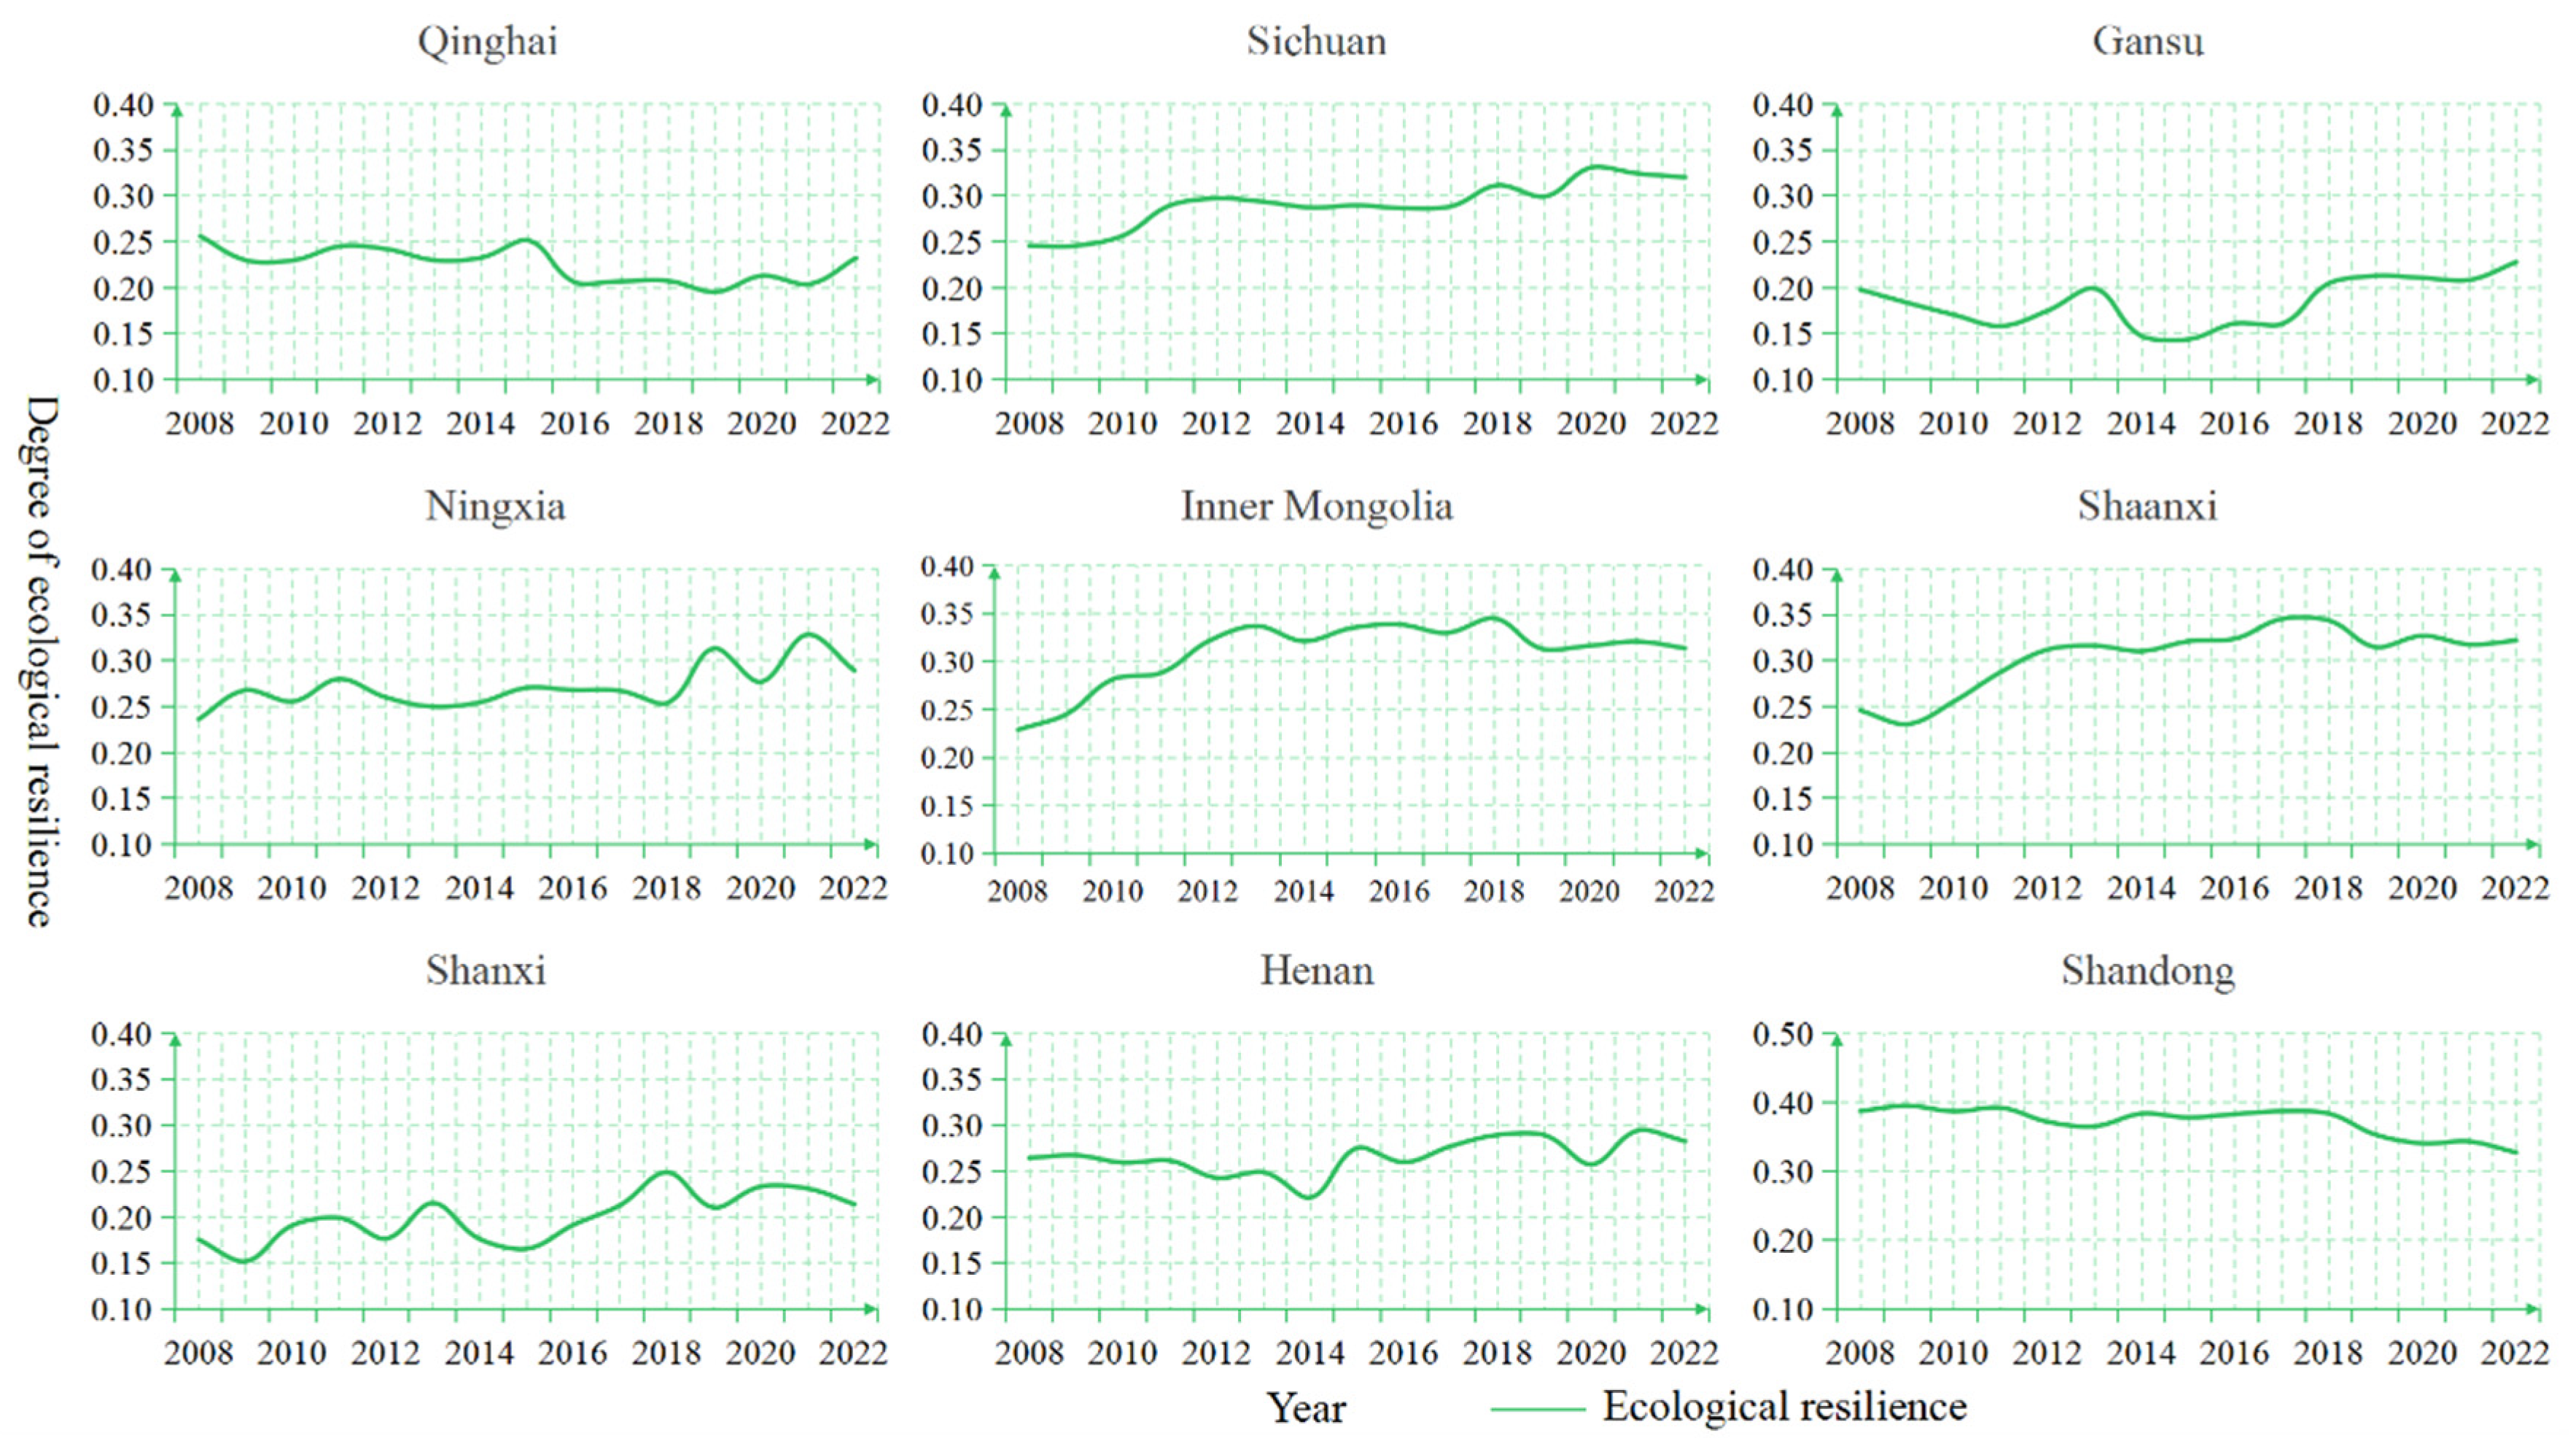
Based on the entropy method and the comprehensive evaluation model, HQD and ER levels in the Yellow River Basin were measured, as shown in Figure 3 and Figure 4.
Figure 3.
Temporal variation in HQD during 2008–2022 in the Yellow River Basin.
Figure 4.
Temporal variation in ER during 2008–2022 in the Yellow River Basin.
Regarding the temporal changes in HQD (Figure 3), various regions in the Yellow River Basin exhibited a fluctuating upward trend from 2008 to 2022. Among them, Sichuan, Shaanxi, and Shandong demonstrated relatively higher HQD, with Shandong consistently maintaining a value around 0.4. This indicates that the middle and lower reaches of the Yellow River Basin serve as central zones for economic development, with increasing emphasis on improving infrastructure, optimizing industrial structure, enriching social resources, and enhancing the level of HQD. In comparison, the growth rate in the lower reaches was relatively stable, while more pronounced fluctuations were observed in the middle and upper reaches, particularly in Shaanxi and Shanxi. In terms of ER (Figure 4), the regions in the Yellow River Basin generally experienced dynamic fluctuations over the study period. Qinghai and Shandong showed a declining trend with fluctuations, whereas Sichuan, Inner Mongolia, and Shanxi gradually increased in ER, with Shaanxi displaying a particularly notable upward trend. Ningxia, Shanxi, and Henan remained in a state of fluctuation from 2008 to 2022.
4.2. Spatiotemporal Differentiation Characteristics of HQD and ER in the Yellow River Basin
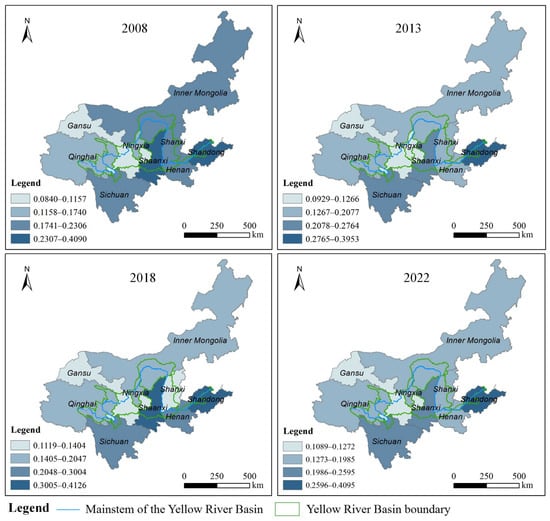
Regarding the spatial pattern of HQD, in the initial period (2008), the overall distribution of the HQD index showed lower reaches > middle reaches > upper reaches. Starting in the second period, the middle and lower reaches began alternating in taking the lead. This indicates that the overall level of HQD in the middle and lower reaches of the Yellow River Basin is generally higher than that in the upper reaches. HQD displays a pattern of higher levels in the central-eastern regions and lower levels in the northwestern regions There has been a gradual rise in urban agglomerations in the middle and lower reaches, such as the Guanzhong, Taiyuan, Central Plains, and Shandong Peninsula urban agglomerations. This region has progressively strengthened its influence on regional economic development, thereby significantly improving the level of HQD. In contrast, the agglomeration effect of urban clusters in the upper reaches has not yet fully materialized. Several provinces in this area consistently rank low nationally in terms of economic performance, and their economic growth remains relatively extensive, resulting in a lower level of HQD. At the provincial level, the HQD index within the Yellow River Basin shows notable variation (Figure 5). Shandong and Shaanxi ranked among the top provinces most frequently across the four periods, representing high-value regions for HQD. Gansu consistently ranked at the bottom throughout the four periods, representing a low-value region for HQD.
Figure 5.
Spatial variation in HQD during 2008–2022 in the Yellow River Basin.
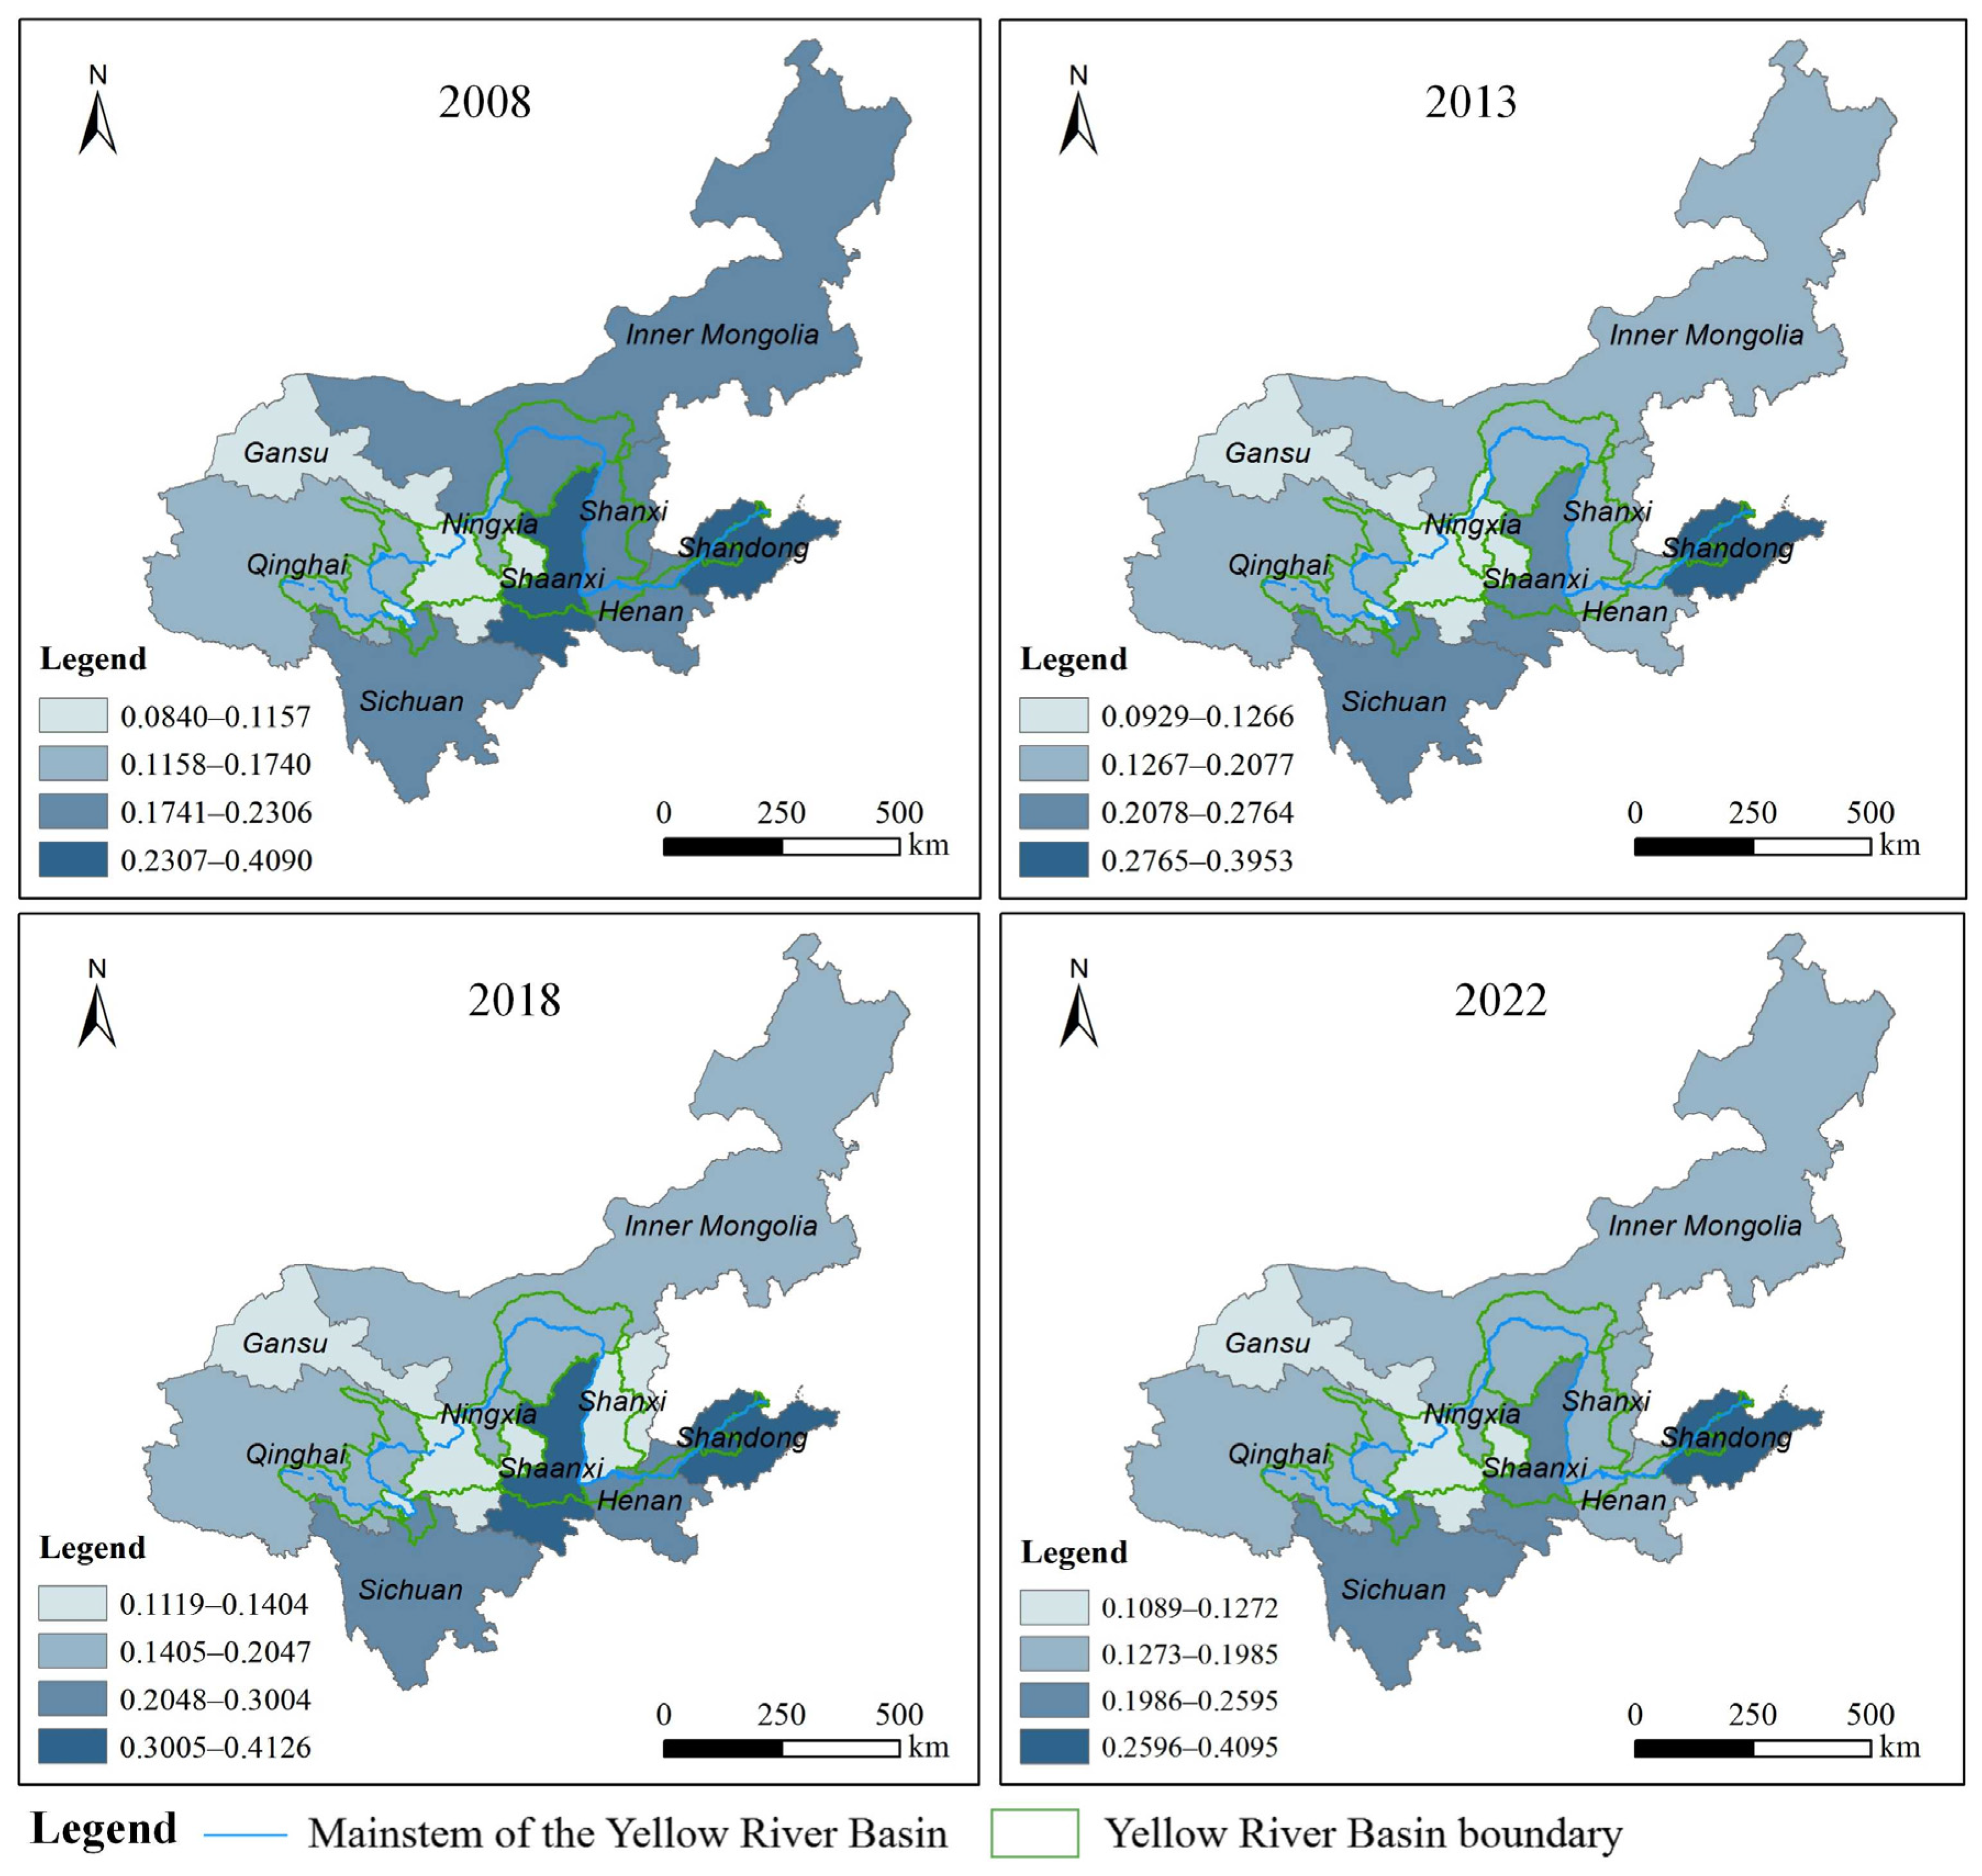
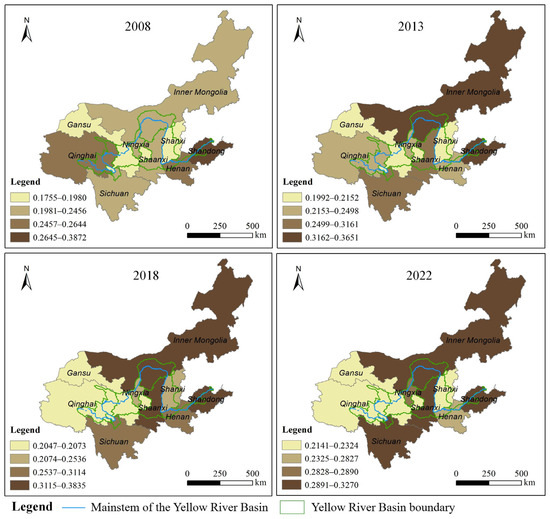
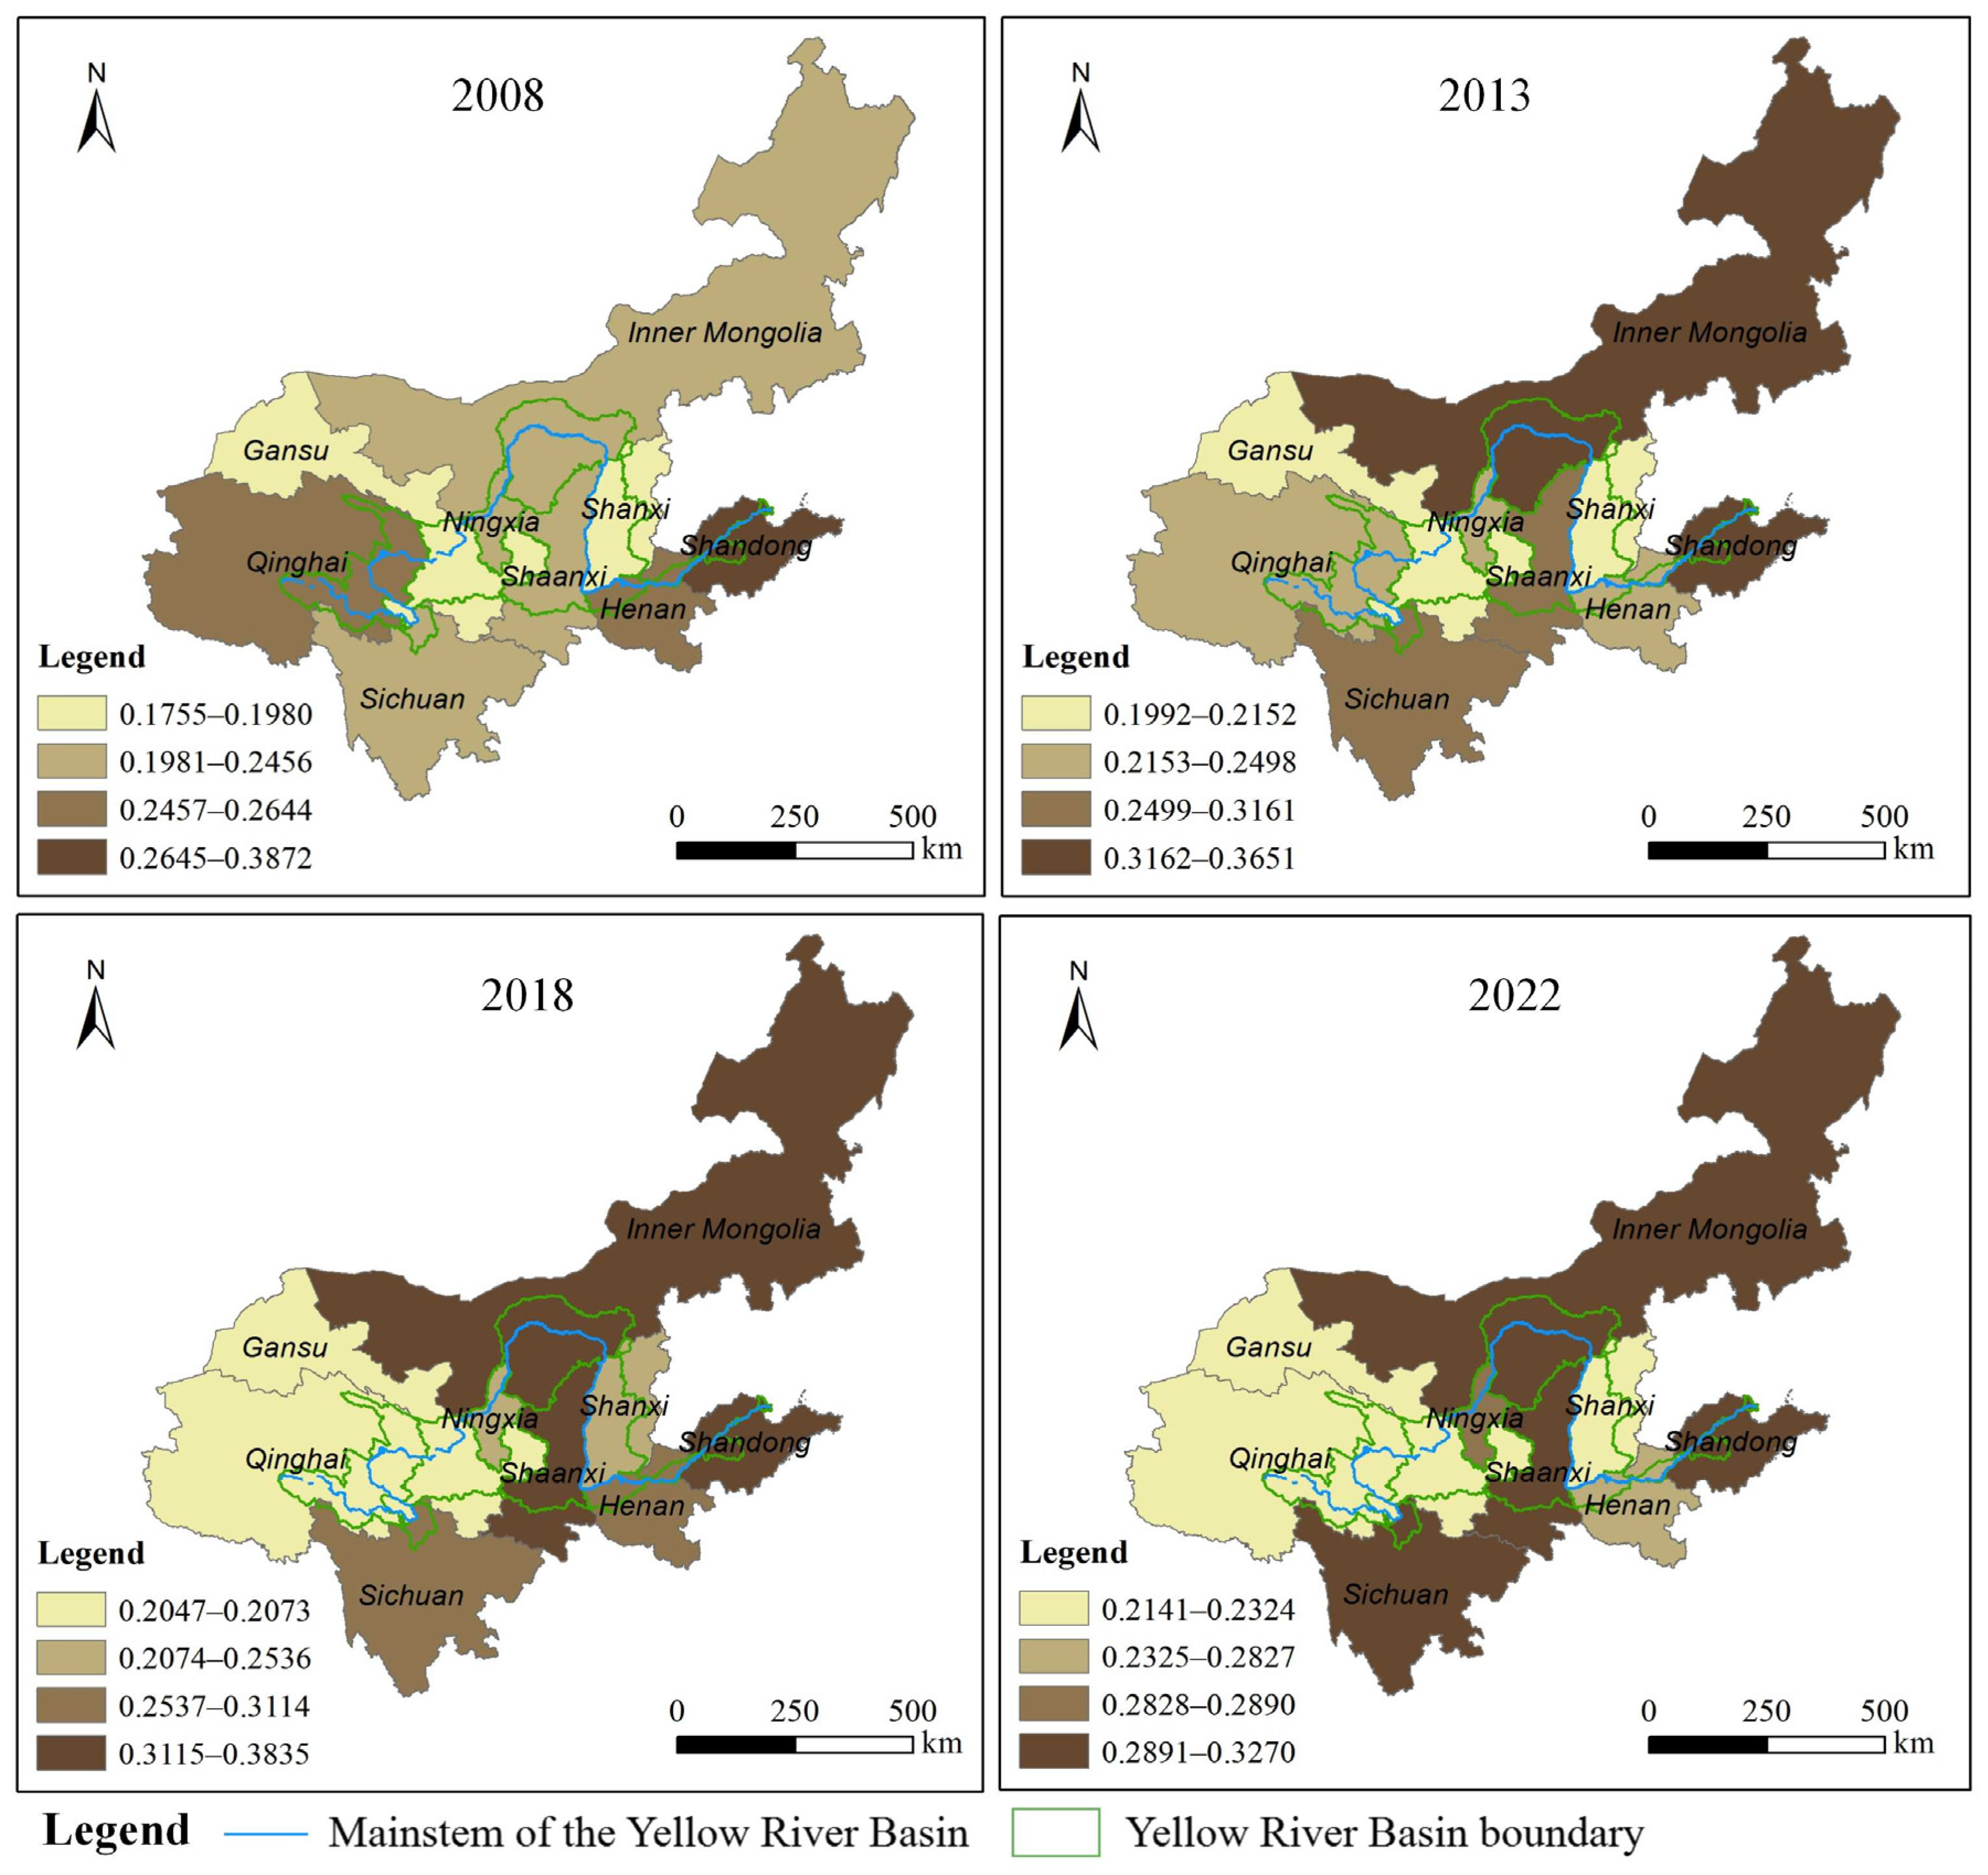
We analyzed the spatial pattern of ER. In the initial period (2008), the overall distribution of the ER index exhibited a pattern of lower reaches > upper reaches > middle reaches. Subsequently, as the middle reaches intensified efforts in ecological conservation and environmental governance, the growth rate of its ER index significantly outpaced that of the upper and lower reaches. By the second period (2013), the middle reaches had caught up with the upper reaches, and by the third period (2018), it surpassed the lower reaches. Since then, the spatial pattern of the ER index in the Yellow River Basin has stabilized as middle reaches > lower reaches > upper reaches. Due to its relatively poor ecological baseline, which characterizes it as an ecologically fragile zone, and the high intensity of exploitation of land, water resources, minerals, and energy, the upper reaches have maintained a low ER index, consistently ranking at the bottom since the second period (Figure 6).
Figure 6.
Spatial variation in ER during 2008–2022 in the Yellow River Basin.
4.3. Analysis of the Evolutionary Process of HQD and ER in the Yellow River Basin
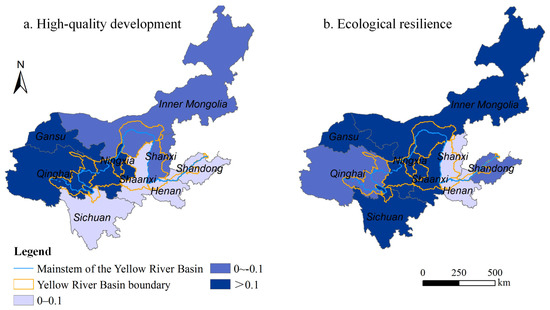
By calculating comparative coefficients for HQD and ER across regions within the Yellow River Basin, this study analyzed changes in HQD and ER indices between 2008 and 2022. The objective was to reveal the evolutionary patterns and magnitudes of the change in HQD and ER across regions, as summarized visually in Figure 7.
Figure 7.
Spatial pattern coefficient of variation of HQD and ER in the Yellow River Basin from 2008 to 2022.
Among them, from 2008 to 2022, the HQD index increased in approximately 89% of the units within the Yellow River Basin. However, a notable decline was observed in Inner Mongolia. This can be attributed to its relatively slower pace of economic development and a comparatively homogeneous industrial structure, which have impeded its progress toward HQD. During the same period, the ER index improved in the majority of the basin, with about 78% of the units showing enhanced resilience levels. The areas experiencing decline are primarily in Qinghai Province in the upper reaches and in Shandong Province in the lower reaches. Qinghai Province, a recognized ecologically fragile zone, has seen its resilience weakened due to insufficient implementation of ecological conservation measures. In contrast, Shandong Province, a rapidly developing coastal province with high economic activity, faces significant ecological pollution associated with its growth, underscoring the pressing need for further improvement in its ER.
4.4. Spatiotemporal Differentiation Characteristics of the Coupling Coordination Degree Between HQD and ER in the Yellow River Basin
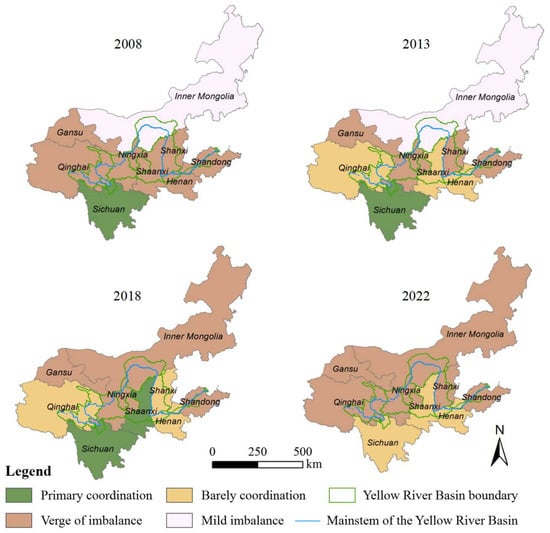
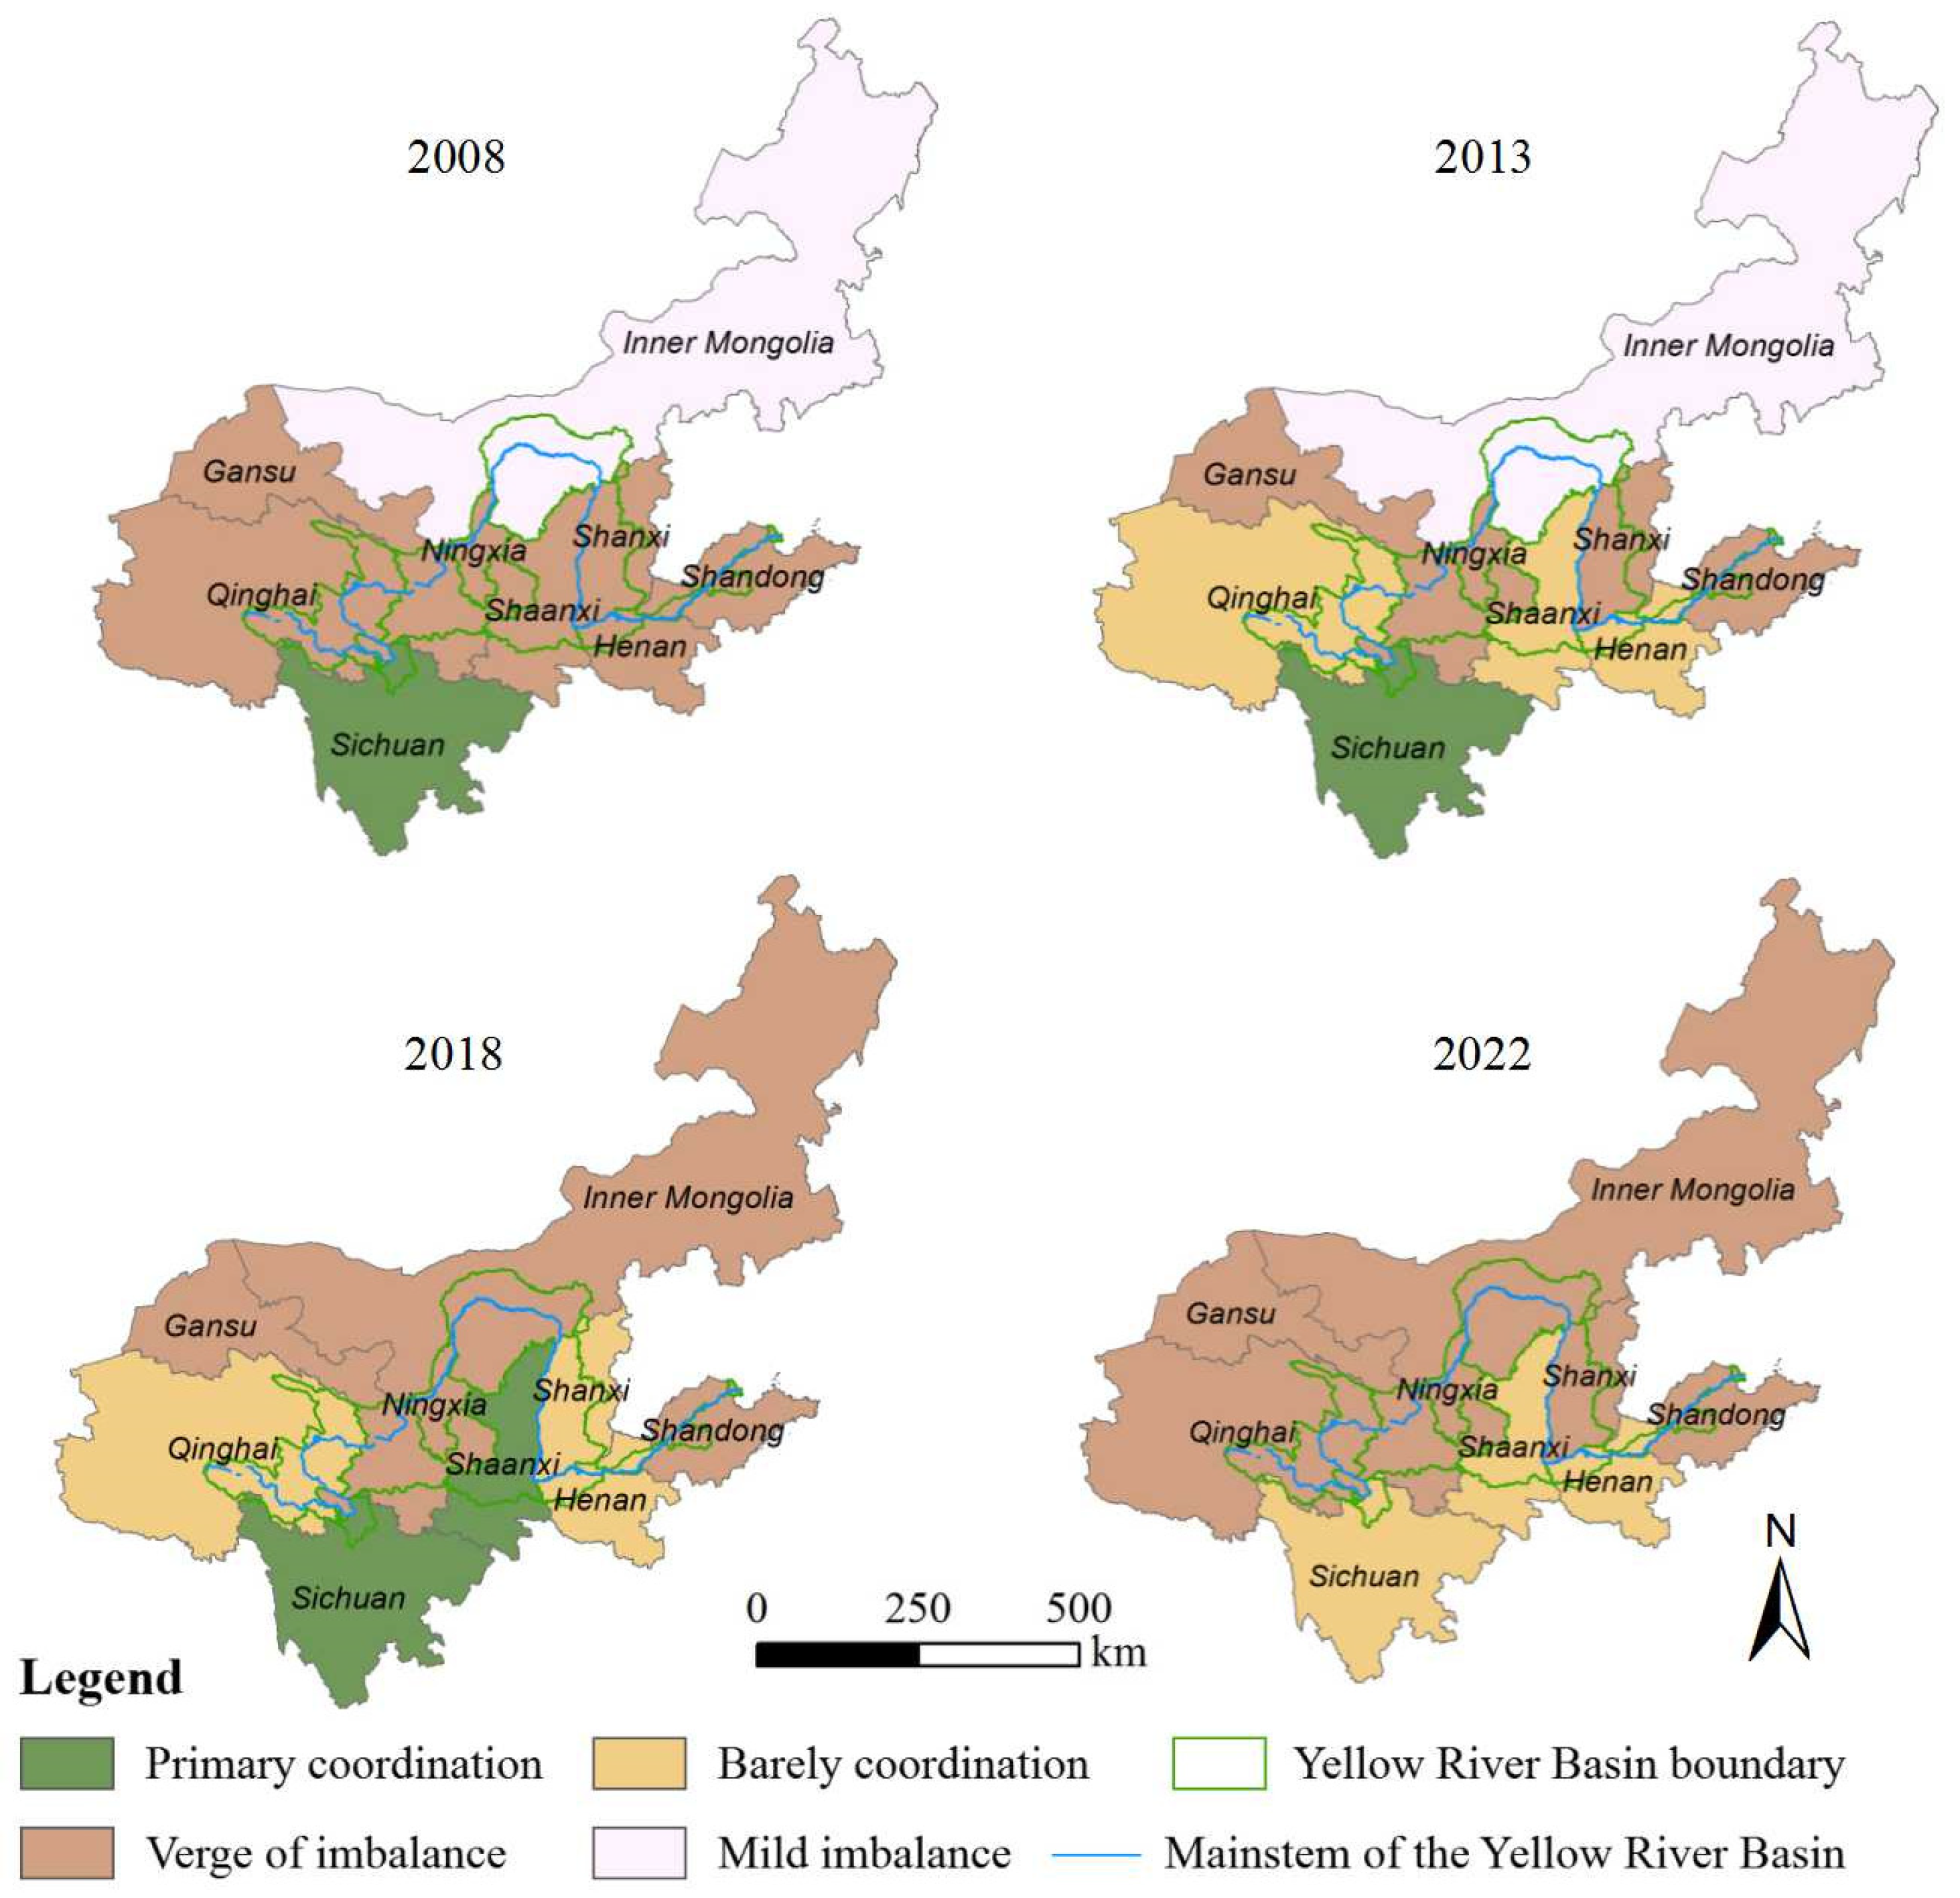
At the temporal level, the coupling coordination degree between HQD and ER in the Yellow River Basin exhibited a consistent pattern of being lower in the northwest and higher in the southeast across all four periods (Figure 8). In 2008, most regions in the basin were on the verge of imbalance in coordination. Only Sichuan Province had achieved primary coordination. The main reason was that the economic development of the Yellow River Basin placed significant pressure on the ecological environment, and the ecological background was fragile, resulting in a low degree in many regions. By 2013, the overall coupling coordination degree had improved, with an increase in areas classified as barely coordinated, including Qinghai, Shaanxi, and Henan. In 2018, the overall coupling coordination of the Yellow River Basin was further improved. Notably, Inner Mongolia transitioned from a mild imbalance to the verge of imbalance, and Shaanxi progressed to primary coordination. However, by 2022, the rate of improvement in coupling coordination degree had slowed. The areas with primary coordination disappeared. At the regional level, the coupling coordination degree between HQD and ER in the Yellow River Basin showed fluctuating patterns over the four periods. Throughout the study period, Sichuan, Henan, and Shaanxi consistently maintained relatively higher levels. In contrast, Inner Mongolia demonstrated the poorest coupling coordination status.
Figure 8.
Spatiotemporal variation in the coupling coordination degree of HQD and ER in the Yellow River Basin from 2008 to 2022.
4.5. Analysis on the Influencing Factors of the Coupling Coordination Degree Between HQD and ER in the Yellow River Basin
A PCA method was conducted to identify the key factors influencing the coupling coordination. Initially, the Kaiser–Meyer–Olkin (KMO) measure and Bartlett’s test were performed on the data. The KMO values for all four periods exceeded 0.6, and Bartlett’s test yielded a significance level (p-value) below 0.05. These results confirm the sampling adequacy and suitability of the data for factor analysis. Subsequently, PCA was employed to extract principal components from the six original variables. The extraction criteria required eigenvalues greater than 1 and a cumulative variance contribution rate exceeding 80%. This process yielded two principal components, F1 and F2. F1, termed “degree of socio-economic development”, reflects the human driving force of HQD. F2, termed “ecosystem engagement,” represents the response capacity of the ecosystem. Finally, a varimax rotation was applied to the factor component matrix to obtain a clearer factor structure, resulting in the factor score coefficient matrices for F1 and F2, as presented in Table 4.
Table 4.
Score coefficient matrix of principal component factors from 2008 to 2022.
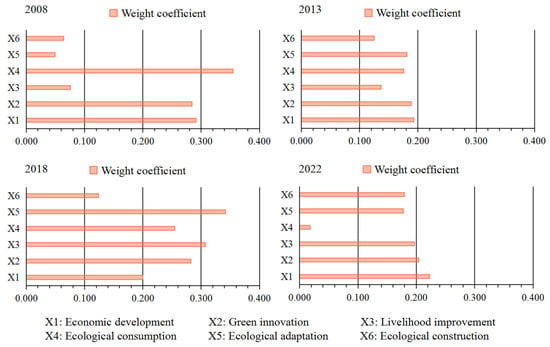
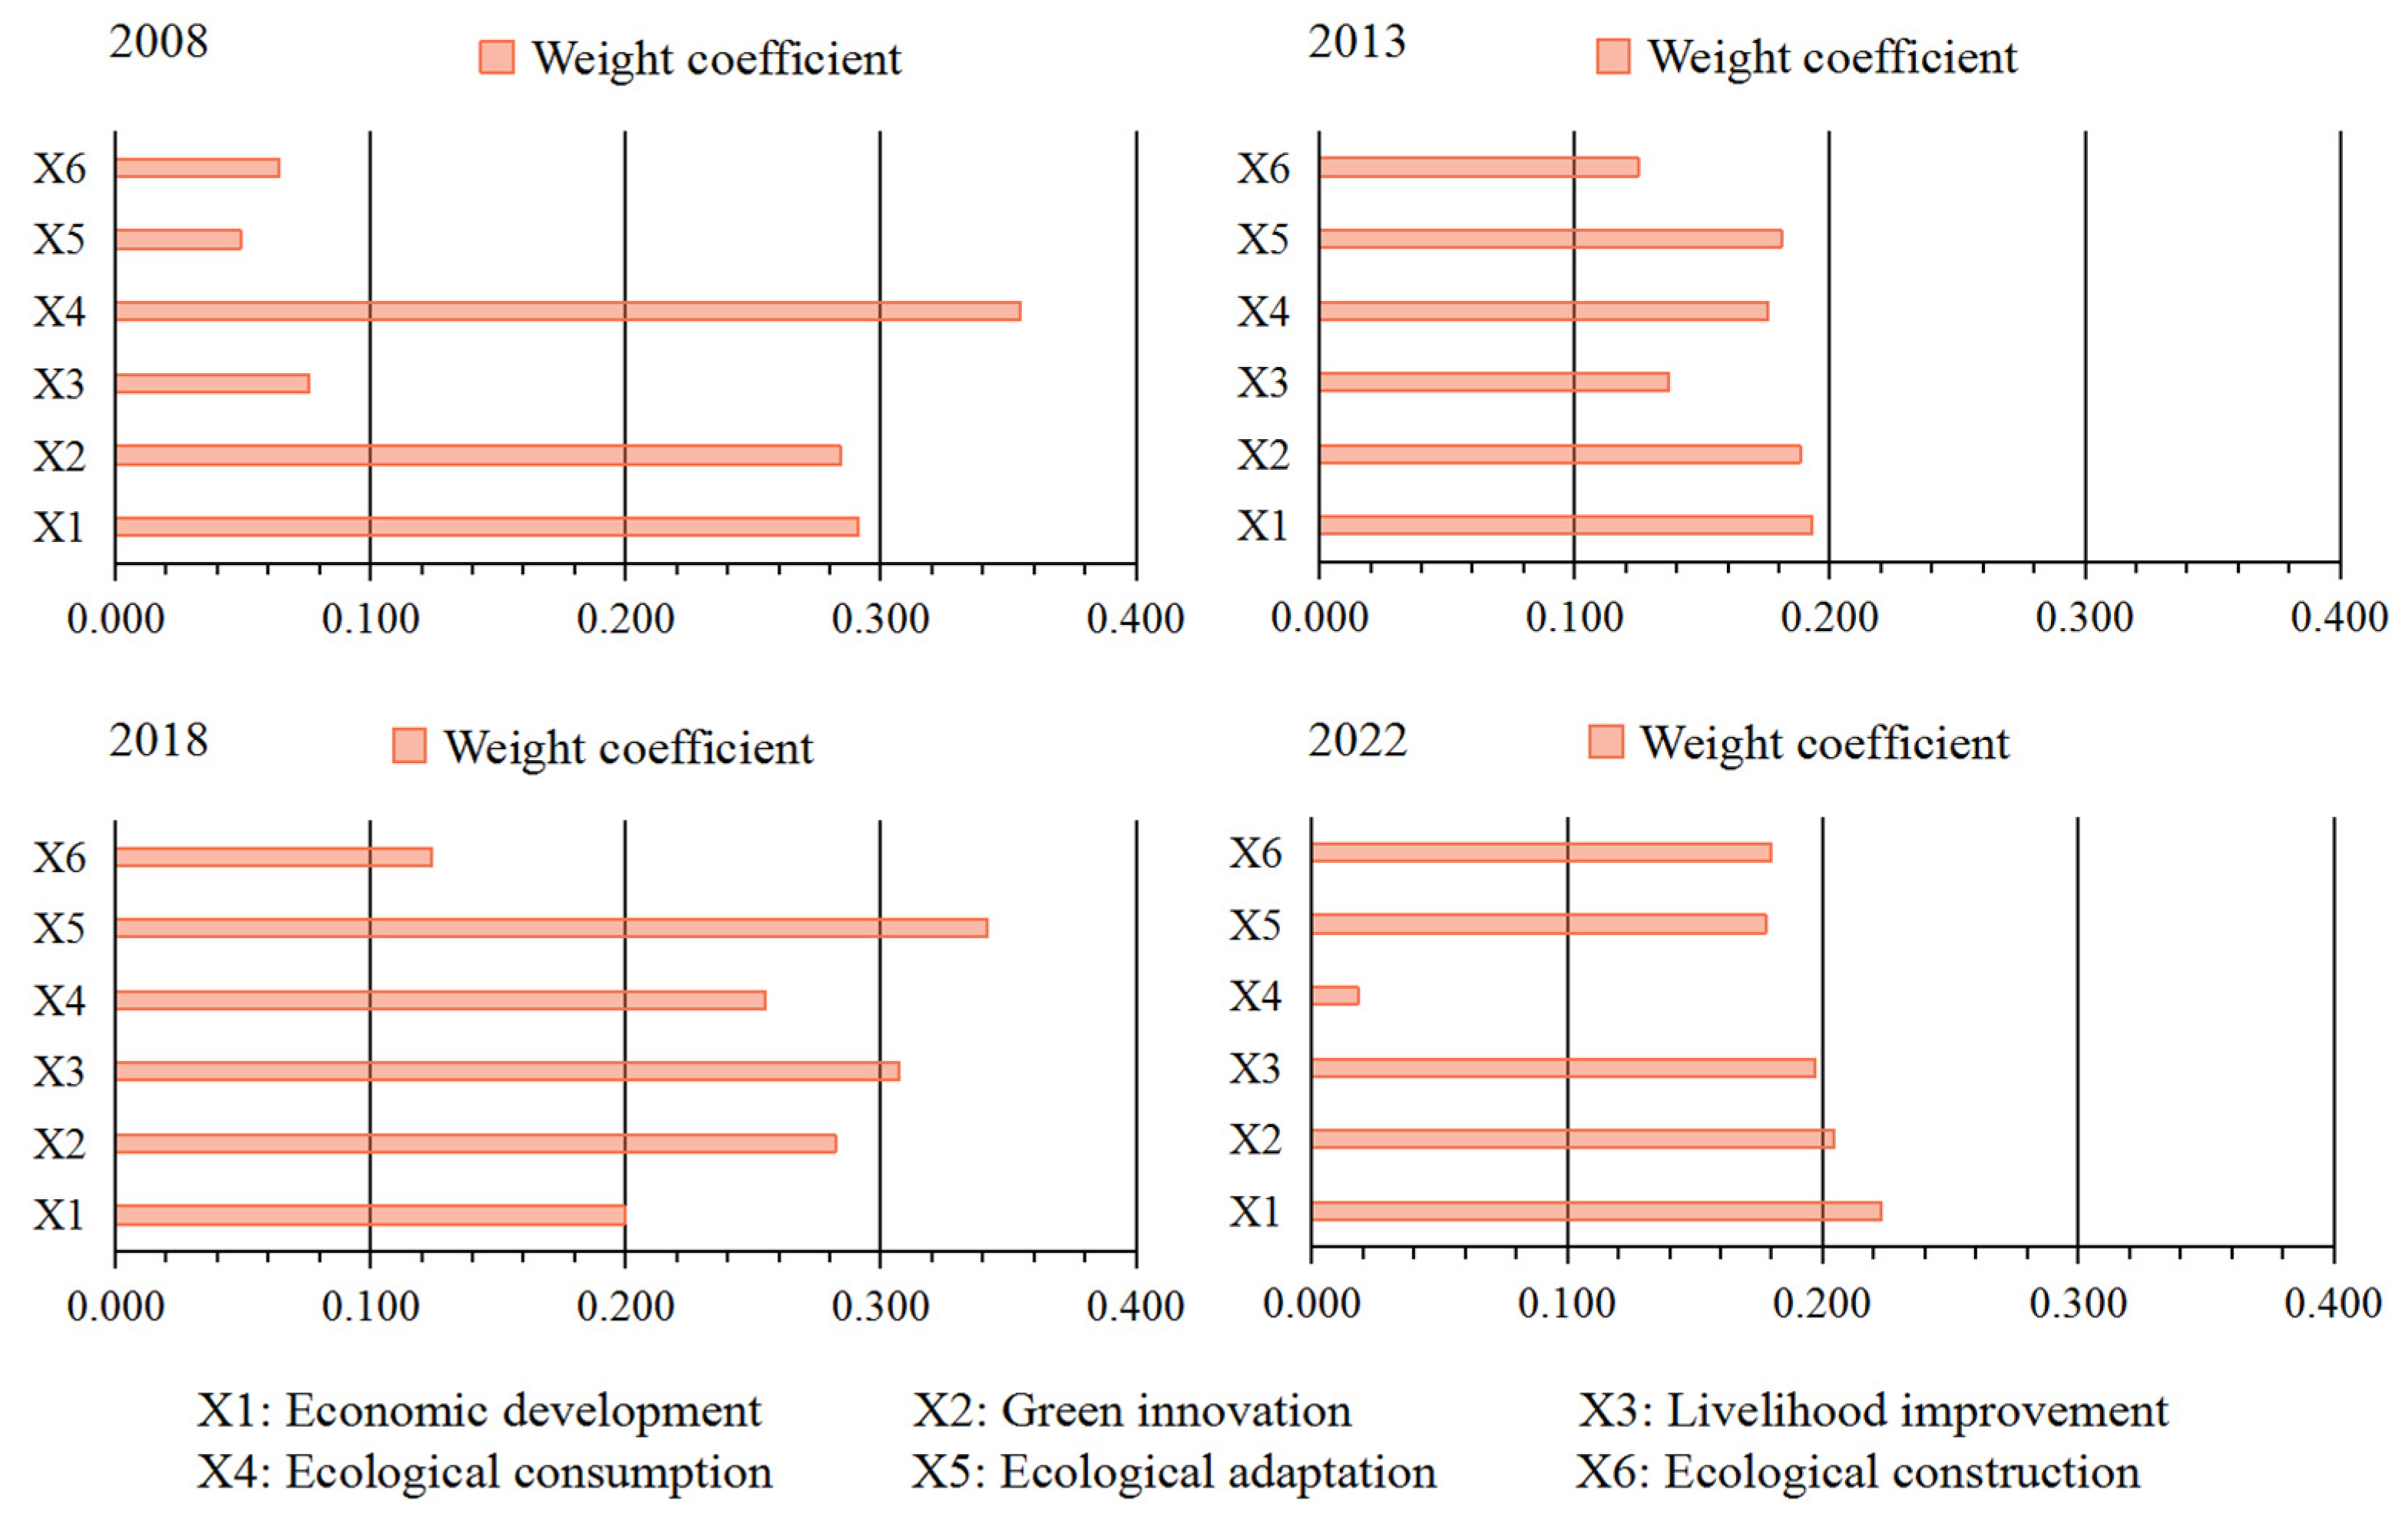
Based on the factor score coefficients of each original variable in F1 and F2 (Table 4) and the contribution rates of the principal components F1 and F2, the weight coefficients of the six main influencing factors were calculated (Figure 9). As shown in Figure 9, the primary factors affecting the coupling coordination between HQD and ER in 2008 were economic development, green innovation, and ecological consumption. In 2013, the weight coefficients of the influencing factors were similar to those in 2008, with the top-ranked factors being economic development, green innovation, and ecological adaptation. By 2018, the main influencing factors shifted to green innovation, livelihood improvement, and ecological adaptation. The ranking for 2022 was similar to that of 2013. However, the overall influence of ecological consumption decreased significantly.
Figure 9.
Impact of various factors on coupling coordination degree between HQD and ER from 2008 to 2022.
Between 2008 and 2022, economic development and green innovation consistently ranked among the most influential factors, followed by livelihood improvement and ecological adaptation. From a temporal perspective, the rankings of ecological adaptation and ecological construction gradually rose, indicating that their influence strengthened. Specifically, the weight of ecological adaptation increased from 0.049 in 2008 to 0.178 in 2022. Conversely, the influence of ecological consumption steadily declined, decreasing from 0.354 in 2008 to 0.018 in 2022. This suggests that its constraining effect on the coupling coordination between HQD and ER in the Yellow River Basin gradually diminished.
5. Discussion
5.1. Rationality of Research on HQD and ER in the Yellow River Basin
Existing research has highlighted the coupling of ecological protection and HQD in the Yellow River Basin [46,56,57], laying a crucial foundation for this paper. However, current studies often focus on evaluating a single subsystem [58,59], lacking comprehensive measurement and analysis of HQD and ER as an integrated, synergistic system. Specifically, much of the existing research employs static analysis, making it difficult to depict the dynamic evolutionary trajectory and phased characteristics of HQD and ER. Furthermore, in terms of mechanistic exploration, existing explanations often rely on macro-level policies or linear drivers of single factors [60,61], thereby failing to reveal the complex interrelationships among multidimensional subsystems. This study addresses these gaps by constructing a co-evolution analysis framework and a dynamic measurement model. It quantifies the spatiotemporal differentiation patterns of the coupling coordination between HQD and ER. This finding provides a new theoretical and empirical basis for understanding the complex relationships between humans and land in river basins. It offers decision-making support for achieving a dynamic balance between “protection” and “development”.
5.2. Spatiotemporal Differentiation Characteristics and Evolutionary Patterns of Coupling Coordination Degree in Different River Basins
This study reveals a significant gradient pattern in the coupling coordination degree between HQD and ER in the Yellow River Basin, which decreases from the downstream to the middle and upper reaches. This spatiotemporal heterogeneity is rooted in the differences in the basin’s inherent conditions and developmental stages. This conclusion is consistent with the research of many scholars [62]. In contrast, the existing literature on the Yangtze River Basin shows different research emphases. Studies specifically targeting HQD are relatively limited. Research on “resilience” predominantly focuses on economic resilience [63,64] and urban resilience [65,66]. Studies on ER in the Yangtze River Basin primarily focus on the impact of economic development on ER [67] and the spatiotemporal characteristics of ER [68], among other themes. This indicates a distinct difference in the research paradigms for multi-system coupling coordination between the two major basins: studies related to the Yellow River Basin are more often based on a macro-policy perspective, exploring the synergistic relationships among multidimensional systems and their influencing mechanisms [46,69]. Conversely, when examining synergistic relationships, research on the Yangtze River Basin more frequently incorporates and delves into specific contextual factors such as economic empowerment, digital innovation, and urban–rural integration [70].
Internationally, studies such as those on the Mississippi and Amazon Rivers focus on ecological–economic binary coupling or single-system resilience assessment. For instance, studies of the Amazon River emphasize the resilience of forest ecosystems under the pressure of deforestation, focusing on ecological critical points [71]. Mississippi River research focuses on assessing single ecosystem services. For example, Jenkins’ research quantifies three ecosystem services: greenhouse gas mitigation, nitrogen mitigation, and waterfowl entertainment. At the same time, Mississippi River research emphasizes the application of system engineering to ecological restoration, which is essentially aimed at resolving the conflict among flood control, agriculture, and ecology [72,73]. The Danube River Basin is the river that flows through the most countries. Systematic ecological restoration and cross-border cooperation are its research priorities, such as the resilience of ecological restoration with “connectivity” as the core [74]. The study of the Yellow River Basin is rooted in Chinese characteristics, focusing on resolving the contradiction between extreme water scarcity and the demand for rapid development. Therefore, it pays more attention to the system’s toughness of “water resources–society– economy” in the basin, which offers clear policy guidance. Therefore, using the co-evolution framework of HQD and ER, this study can provide a reference template for the ecosystem coupling mechanism of other basins undergoing rapid environmental change.
5.3. Analysis of Influencing Factors of the Coupling Coordination Degree in the Yellow River Basin
Analysis of the relationships affecting the coupling coordination degree (Figure 10) reveals several key findings. First, economic development and green innovation are primary driving forces. Rapid socio-economic growth exerts multifaceted impacts on the evolution of coupling coordination in the Yellow River Basin, while green innovation investment acts as a key catalyst for synergistic enhancement [75]. Second, livelihood improvement forms the foundation for promoting coupling coordination. For most residents, high-quality living conditions, a livable environment, and reliable access to employment, healthcare, and education have become crucial benchmarks of progress. Meanwhile, these factors are significant for the synergistic development of HQD and ER [76]. Finally, the natural environment and ecological initiatives provide essential safeguards. A sound natural endowment positively influences regional development and ecological synergy [77]. The comprehensive implementation of ecological conservation and restoration projects has markedly improved the environmental quality of the Yellow River Basin. Based on these findings, this study proposes that governance in the Yellow River Basin should adopt spatially differentiated strategies, for example, optimizing the green circular system in the lower reaches, enhancing green technology empowerment in the middle reaches, and safeguarding basic livelihoods while exploring pathways for realizing ecological value in the upper reaches.
Figure 10.
Influencing factors of the coupling coordination degree in the Yellow River Basin.
5.4. Limitations and Future Prospects
While this study has contributed to the measurement and mechanistic exploration of the synergy between HQD and ER in the Yellow River Basin, several limitations warrant acknowledgment and suggest avenues for future research. Firstly, although a multidimensional indicator system was constructed, the characterization of ER primarily relied on a pressure–state–response framework. Secondly, the coupling coordination model employed effectively assessed the interaction intensity and coordination status between the two systems. However, it offered a relatively static description and had a limited capacity to simulate the complex nonlinear feedback inherent in their co-evolutionary processes. Finally, the conclusions were derived from an empirical analysis of the Yellow River Basin. The extent to which the identified synergistic mechanisms apply to other major river basins with distinct natural geographical conditions and developmental stages, such as the Yangtze River Basin, requires further validation through comparative studies.
Therefore, future research introducing dynamic simulation models could more accurately capture the nonlinear trajectories and heterogeneous impacts of synergistic evolution. In terms of scope, research should focus on “granularity” and “comparison”. On one hand, conducting case studies at finer scales, such as the county or urban agglomeration level, is useful. On the other hand, cross-basin comparative analyses are essential to distill more universal patterns of synergistic evolution and governance frameworks.
6. Conclusions
This study constructs an indicator system for HQD and ER from three dimensions. At the same time, a comprehensive index evaluation model, coupling coordination analysis, and principal component analysis are applied to quantitatively analyze the evolutionary characteristics, coupling differentiation characteristics and influencing factors between HQD and ER in the Yellow River Basin from 2008 to 2022. The following conclusions can be obtained:
- (1)
- During the study period, both the HQD and ER indices in the Yellow River Basin showed an upward trend, indicating an overall improvement in HQD and ER. Additionally, the spatial patterns of both indices generally showed that levels in the middle and lower reaches were higher than those in the upper reaches.
- (2)
- Throughout the study period, the spatial evolution of HQD and ER in the Yellow River Basin displayed significant characteristics. From 2008 to 2022, the HQD index increased in 89% of the units, whereas a notable decline was observed in Inner Mongolia. Meanwhile, the ER index improved across most of the basin, with declines primarily concentrated in Qinghai Province in the upper reaches and Shandong Province in the lower reaches.
- (3)
- During the study period, the coupling coordination degree between HQD and ER in the Yellow River Basin showed an overall increasing trend. Across all four periods, a spatial pattern characterized by lower levels in the northwest and higher levels in the southeast was consistently observed. Spatially, Sichuan, Henan, and Shaanxi maintained relatively high levels of coupling coordination, while Inner Mongolia exhibited the lowest coordination status.
- (4)
- From 2008 to 2022, economic development and green innovation consistently ranked as the most influential factors, followed by livelihood improvement and ecological adaptation. Over time, the importance of ecological adaptation and ecological construction progressively increased, indicating a strengthening influence. Conversely, the impact of ecological consumption gradually weakened. Overall, the synergistic enhancement of HQD and ER in the Yellow River Basin results from the interaction of multiple factors. The joint effect of these different influencing factors is essential for promoting the development of the Yellow River Basin.
Author Contributions
Conceptualization, X.X. and Y.L.; methodology, X.X.; software, X.X. and W.H.; validation, X.X.; formal analysis, X.X.; investigation, X.X.; resources, X.X.; data curation, S.G. and W.H.; writing—original draft preparation, X.X.; writing—review and editing, S.G. and W.H.; visualization, X.X.; supervision, Y.L.; project administration, Y.L.; funding acquisition, Y.L. and X.X. All authors have read and agreed to the published version of the manuscript.
Funding
This research was financed by the Henan Provincial Natural Science Foundation (Grant No. 262300420659), National Natural Science Foundation of China (Grant No. 42371314; 42371271), General Projects of Humanities and Social Sciences Research in Henan Province Universities (Grant No. 2026-ZZJH-030), Scientific and Technological Research Project of Henan Province (Grant No. 262102321115), Henan Province Soft Science Research Project (Grant No. 252400410078), and Henan Province Science and Technology Research and Development Program Joint Fund (Key Project) (Grant No. 235200810024).
Data Availability Statement
The original contributions presented in this study are included in the article. Further inquiries can be directed to the corresponding author.
Acknowledgments
The authors would like to thank the anonymous reviewers for their comments and suggestions.
Conflicts of Interest
The authors declare no conflicts of interest.
References
- Feng, Y.; Zhu, A.; Liu, P.; Liu, Z. Coupling and coordinated relationship of water utilization, industrial development and ecological welfare in the Yellow River Basin, China. J. Clean. Prod. 2022, 379, 134824. [Google Scholar] [CrossRef] [Scilit]
- Pokhrel, Y.N.; Hanasaki, N.; Wada, Y.; Kim, H. Recent progresses in incorporating human land-water management into global land surface models toward their integration into Earth system models. WIREs Water 2016, 3, 548–574. [Google Scholar] [CrossRef] [Scilit]
- Chen, J.; Yang, X.; Dao, H.; Gu, H.; Chen, G.; Mao, C.; Bai, S.; Gu, S.; Zhou, Z.; Yan, Z. Analyses on Characteristics of Spatial Distribution and Matching of the Human-Land-Water-Heat System on the Yunnan Plateau. Water 2024, 16, 867. [Google Scholar] [CrossRef] [Scilit]
- Swanson, A.C.; Bohlman, S. Cumulative Impacts of Land Cover Change and Dams on the Land-Water Interface of the Tocantins River. Front. Environ. Sci. 2021, 9, 662904. [Google Scholar] [CrossRef] [Scilit]
- Zhao, F.; Guo, M.; Zhao, X.; Shu, X. Spatio-temporal characteristics and coupling coordination factors of industrial water resource system resilience and utilization efficiency: A case study of the Yangtze River Economic Belt. Ecol. Indic. 2024, 167, 112704. [Google Scholar] [CrossRef] [Scilit]
- Jaeger, W.K.; Amos, A.; Bigelow, D.P.; Chang, H.; Conklin, D.R.; Haggerty, R.; Langpap, C.; Moore, K.; Mote, P.W.; Nolin, A.W.; et al. Finding water scarcity amid abundance using human–natural system models. Proc. Natl. Acad. Sci. USA 2017, 114, 11884–11889. [Google Scholar] [CrossRef] [Scilit]
- Tesfatsion, L.; Rehmann, C.R.; Cardoso, D.S.; Jie, Y.; Gutowski, W.J. An agent-based platform for the study of watersheds as coupled natural and human systems. Environ. Modell. Softw. 2017, 89, 40–60. [Google Scholar] [CrossRef] [Scilit]
- Jiang, Q.; Wang, T.; Wang, Z.; Fu, Q.; Zhou, Z.; Zhao, Y.; Dong, Y. HHM- and RFRM-Based Water Resource System Risk Identification. Water Resour. Manag. 2018, 32, 4045–4061. [Google Scholar] [CrossRef] [Scilit]
- Bao, C.; Zou, J. Evaluation of water resource security patterns in the Beijing-Tianjin-Hebei urban agglomeration based on human-water relationships. Acta Ecol. Sin. 2018, 38, 4180–4191. (In Chinese) [Google Scholar]
- Bogner, K.; Liechti, K.; Bernhard, L.; Monhart, S.; Zappa, M. Skill of Hydrological Extended Range Forecasts for Water Resources Management in Switzerland. Water Resour. Manag. 2018, 32, 969–984. [Google Scholar] [CrossRef] [Scilit]
- Girma, R.; Abraham, T.; Muluneh, A. Quantitative evaluation of watershed attributes for water resources management in the Rift Valley Lakes Basin, Ethiopia: A case from Tikur Wuha river watershed. Appl. Water Sci. 2020, 10, 196. [Google Scholar] [CrossRef] [Scilit]
- Wang, S.; Niu, J. Spatio-temporal evolution and influencing factors of urban ecological resilience in the Yellow River Basin. Acta Ecol. Sin. 2023, 43, 8309–8320. (In Chinese) [Google Scholar]
- Li, X.; Wen, Y.; Li, Y.; Yang, H. High-Quality Development of the Yellow River Basin from a Perspective of Economic Geography: Man-Land and Spatial Coordination. Econ. Geogr. 2020, 40, 1–10. (In Chinese) [Google Scholar]
- Dang, L.; Zhao, F.; Teng, Y.; Teng, J.; Zhan, J.; Zhang, F.; Liu, W.; Wang, L. Scale dependency of trade-offs/synergies analysis of ecosystem services based on Bayesian Belief Networks: A case of the Yellow River Basin. J. Environ. Manag. 2025, 375, 124410. [Google Scholar] [CrossRef] [Scilit]
- Zhai, T.; Ma, Y.; Huang, L.; Lu, Y.; Li, L.; Chen, Y.; Chang, M.; Ma, Z. Research on the spatiotemporal evolution characteristics and driving mechanisms of supply-demand risks of ecosystem services in the yellow river basin integrating the hierarchy of needs theory. Ecol. Indic. 2025, 171, 113229. [Google Scholar] [CrossRef] [Scilit]
- Xu, Y.; Yang, X.; Xing, X.; Wei, L. Coupling eco-environmental quality and ecosystem services to delineate priority ecological reserves-A case study in the Yellow River Basin. J. Environ. Manag. 2024, 365, 121645. [Google Scholar] [CrossRef] [Scilit]
- Xue, R.; Gu, R.; Ong, T. How does coupling coordination between industrial structure optimization and ecosystem services dynamically affect carbon emissions in the Yellow River Basin? J. Clean. Prod. 2025, 517, 145872. [Google Scholar] [CrossRef] [Scilit]
- Niu, H.; Chen, S.; Xiao, D. Multi-Scenario land cover changes and carbon emissions prediction for peak carbon emissions in the Yellow River Basin, China. Ecol. Indic. 2024, 168, 112794. [Google Scholar] [CrossRef] [Scilit]
- Liu, J.; Pu, L.; Huang, L.; Shi, T. Research on the Coupling Evaluation and Driving Factors of Water-Energy-Carbon in the Yellow River Basin. Water 2023, 15, 2377. [Google Scholar] [CrossRef] [Scilit]
- Shi, T.; Hou, Z.; Liu, J.; Fang, H.; Wang, Q.; Guo, Y.; Zhang, R.; Huang, L. Mechanisms and Scenario Predictions of the Digital Economy’s Impact on Pollution and Carbon Emission Reduction: A Case Study of the Yellow River Basin in China. Int. J. Environ. Res. 2026, 20, 37. [Google Scholar] [CrossRef] [Scilit]
- Zhang, L.; Song, M.; Zhang, J.; Hao, X. Multiscale spatiotemporal evolution and zoning of energy consumption carbon footprint in the Yellow River Basin. Energy Sci. Eng. 2024, 12, 4662–4679. [Google Scholar] [CrossRef] [Scilit]
- Jiang, W.; Gao, W.; Gao, X.; Ma, M.; Zhou, M.; Du, K.; Ma, X. Spatio-temporal heterogeneity of air pollution and its key influencing factors in the Yellow River Economic Belt of China from 2014 to 2019. J. Environ. Manag. 2021, 296, 113172. [Google Scholar] [CrossRef] [Scilit]
- Dou, J.; Xia, R.; Zhang, K.; Xu, C.; Chen, Y.; Liu, X.; Hou, X.; Yin, Y.; Li, L. Landscape fragmentation of built-up land significantly impact on water quality in the Yellow River Basin. J. Environ. Manag. 2024, 371, 123232. [Google Scholar] [CrossRef] [Scilit]
- Holling, C.S. Resilience and stability of ecological systems. Annu. Rev. Ecol. Syst. 1973, 4, 1–23. [Google Scholar] [CrossRef] [Scilit]
- Yu, J.; Hu, W.; Hou, L. Towards more resilient cities-analyzing the impact of new-type urbanization on urban resilience: Considering spatial spillover boundaries. Sustain. Cities Soc. 2024, 114, 105735. [Google Scholar] [CrossRef] [Scilit]
- Fuady, M.; Buraida Kevin, M.A.; Farrel, M.R.; Triaputri, A. Enhancing Urban Resilience: Opportunities and Challenges in Adapting to Natural Disasters in Indonesian Cities. Sustainability 2025, 17, 1632. [Google Scholar] [CrossRef] [Scilit]
- Moradpour, N.; Pourahmad, A.; Ziari, K.; Hataminejad, H.; Sharifi, A. Downscaling urban resilience assessment: A spatiotemporal analysis of urban blocks using the fuzzy Delphi method and K-means clustering. Build. Environ. 2024, 263, 111898. [Google Scholar] [CrossRef] [Scilit]
- Zhang, T.; Sun, Y.; Wang, R.; Yang, Y.; Yin, L.; Li, L.; Zhang, B. A new framework for assessing and dealing with heat risk from an urban resilience perspective. J. Clean. Prod. 2024, 479, 144008. [Google Scholar] [CrossRef] [Scilit]
- Xu, C.; Li, B.; Kong, F.; He, T. Spatial-temporal variation, driving mechanism and management zoning of ecological resilience based on RSEI in a coastal metropolitan area. Ecol. Indic. 2024, 158, 111447. [Google Scholar] [CrossRef] [Scilit]
- Zhang, M.; Zhao, Y.; Mo, D. Coordinated development and convergence of urban ecological resilience and land use intensity in the Yellow River Basin. J. Nat. Resour. 2025, 40, 2479–2496. (In Chinese) [Google Scholar] [CrossRef] [Scilit]
- Hu, H.; Yan, K.; Fan, H.; Lv, T.; Huang, Y.; Zhang, X.; Feng, Y. Coordination or imbalance? Understanding the relationship between economic resilience and ecological resilience in Hunan Province. Phys. Chem. Earth 2025, 140, 103997. [Google Scholar] [CrossRef] [Scilit]
- Liang, X.; Gao, X.; Zhao, M.; Guo, Z.; Shen, W. Ecological space resilience assessment of Baiyangdian Basin from the perspective of evolutionary resilience. Front. Ecol. Evol. 2023, 11, 1200218. [Google Scholar] [CrossRef] [Scilit]
- Datta, S.; Roy, J. Threats from weather events, urbanization and resilience: A case study of a coastal geography in India. J. Integr. Environ. Sci. 2023, 20, 2218474. [Google Scholar] [CrossRef] [Scilit]
- Chen, M.; Xu, X.; Tan, Y.; Lin, Y. Assessing ecological vulnerability and resilience-sensitivity under rapid urbanization in China’s Jiangsu province. Ecol. Indic. 2024, 167, 112607. [Google Scholar] [CrossRef] [Scilit]
- Sharma, M.; Sharma, B.; Kumar, N.; Kumar, A. Establishing Conceptual Components for Urban Resilience: Taking Clues from Urbanization through a Planner’s Lens. Nat. Hazards Rev. 2022, 24, 04022040. [Google Scholar] [CrossRef] [Scilit]
- Wu, W.; Gao, Y.; Chen, C. CLSER: A new indicator for the social-ecological resilience of coastal systems and sustainable management. J. Clean. Prod. 2024, 435, 140564. [Google Scholar] [CrossRef] [Scilit]
- Cheng, A. Spatiotemporal changes and underlying factors of urban ecological resilience: Evidence from Chinese cities. Environ. Dev. Sustain. 2025. [Google Scholar] [CrossRef] [Scilit]
- Huang, L.; Wang, J.; Lu, Y.; Ye, Y.; Zhai, T. Measuring the resilience of mountain city ecological network: A methodological framework integrating real disaster shocks and simulated disturbance scenarios. J. Environ. Manag. 2025, 384, 125573. [Google Scholar] [CrossRef] [Scilit]
- Ning, W.; Wang, S. The coupling coordination and driving factors of tourism economy and urban ecological resilience: A case study of Shandong Province, China. Environ. Dev. Sustain. 2024. [Google Scholar] [CrossRef] [Scilit]
- Kong, S.; Zhang, C.; Zhang, M.; Lu, W. Heterogeneity analysis of the effects of new quality productive forces on ecological resilience in the Yangtze River Delta Economic Belt. Sci. Rep. 2025, 15, 20563. [Google Scholar] [CrossRef] [Scilit]
- Wang, Y.; Tian, Z.; Li, M.; Jing, X. Analysis of the dynamic relationships and coupling coordination effects of digital technology, new-type urbanization and urban ecological resilience: A case study of the Yangtze River Delta Urban Agglomeration in China. Environ. Dev. Sustain. 2025. [Google Scholar] [CrossRef] [Scilit]
- Yu, Y.; Hua, T.; Chen, L.; Zhang, Z.; Pereira, P. Divergent Changes in Vegetation Greenness, Productivity, and Rainfall Use Efficiency Are Characteristic of Ecological Restoration Towards High-Quality Development in the Yellow River Basin, China. Engineering 2024, 34, 109–119. [Google Scholar] [CrossRef] [Scilit]
- Miao, C.; Xia, C.; Jin, F.; Ma, L.; Zhang, W.; Fu, B. Implementation effectiveness and promotion strategies of ecological protection and high-quality development strategy in the Yellow River Basin. J. Nat. Resour. 2025, 40, 569–583. (In Chinese) [Google Scholar] [CrossRef] [Scilit]
- Xiao, Y.; Lan, G.; Ou, Y.; Zhang, L.; Xia, J. Impact of urbanization on the spatial and temporal evolution of the water system pattern: A study of the Wuhan metropolitan area in China. Ecol. Indic. 2023, 153, 110408. [Google Scholar] [CrossRef] [Scilit]
- Zhang, J.; Hou, Y.; Liu, P.; He, J.; Zhuo, X. The goal, requirement and strategic path of high quality development. J. Manag. World. 2019, 35, 1–7. (In Chinese) [Google Scholar]
- Liu, L.; Liang, L.; Gao, P.; Fan, C.; Wang, H.; Wang, H. Coupling relationship and interactive response between ecological protection and high-quality development in the Yellow River Basin. J. Nat. Resour. 2021, 36, 176–195. (In Chinese) [Google Scholar] [CrossRef] [Scilit]
- Biggs, R.; Schlüter, M.; Biggs, D.; Bohensky, E.L.; BurnSilver, S.; Cundill, G.; Dakos, V.; Daw, T.M.; Evans, L.; Kotschy, K.; et al. Toward principles for enhancing the resilience of ecosystem services. Annu. Rev. Environ. Resour. 2012, 37, 421–448. [Google Scholar] [CrossRef] [Scilit]
- Wu, Q.; Zhan, J.; Song, M.; Jiang, X. Nonlinear response and threshold identification for arid ecosystem resilience to coupled stressors from extreme climate events and anthropogenic activities. J. Environ. Manag. 2026, 404, 129436. [Google Scholar] [CrossRef] [Scilit]
- Zhou, Y.; Chen, Y.; Li, Z.; Jiang, W. Ecological resilience assessment of an emerging urban agglomeration: A case study of Chengdu Chongqing economic circle, China. Pol. J. Environ. Stud. 2022, 31, 2381–2395. [Google Scholar] [CrossRef] [Scilit]
- Li, D.; Yang, W.; Huang, R. The multidimensional differences and driving forces of ecological environment resilience in China. Environ. Impact Assess. Rev. 2023, 98, 106954. [Google Scholar] [CrossRef] [Scilit]
- Xie, X.; Li, X.; Fan, H.; He, W. Spatial analysis of production-living-ecological functions and zoning method under symbiosis theory of Henan, China. Environ. Sci. Pollut. Res. 2021, 28, 69093–69110. [Google Scholar] [CrossRef] [Scilit]
- Xie, X.; Li, X. Spatio-temporal evolution characteristics and influencing factors of “production-living-ecological” functions in Henan Province, China. Trans. CSAE 2021, 37, 243–252. (In Chinese) [Google Scholar]
- Xie, X.; Wu, K.; Li, Y.; Guo, S.; Li, X. How to Coordinate the Relationship between Urban Space Exploitation, Economic Development, and Ecological Environment: Evidence from Henan Province, China. Land 2024, 13, 537. [Google Scholar] [CrossRef] [Scilit]
- Cai, J.; Li, X.; Liu, L.; Chen, Y.; Wang, X.; Lu, S. Coupling and coordinated development of new urbanization and agro-ecological environment in China. Sci. Total Environ. 2021, 776, 145837. [Google Scholar] [CrossRef] [Scilit]
- Jolliffe, I.T.; Cadima, J. Principal component analysis: A review and recent developments. Philos. Trans. A Math. Phys. Eng. Sci. 2016, 374, 20150202. [Google Scholar] [CrossRef] [Scilit]
- Ma, L.; Zhao, X.; Yan, B.; Fan, J.; Wang, M.; Liu, M. How does the coupling coordination between high-quality development and eco-environmental carrying capacity in the Yellow river basin over time? Front. Environ. Sci. 2024, 12, 1403265. [Google Scholar] [CrossRef] [Scilit]
- Wang, H.; Xu, Y.; Li, C. Coupling coordination and spatio-temporal pattern evolution between ecological protection and high-quality development in the Yellow River Basin. Heliyon 2023, 9, e21089. [Google Scholar] [CrossRef] [Scilit]
- Liu, Z.; Zhang, H.; Guo, C.; Yang, Y. New Quality Productive Forces Enabling High-Quality Development: Mechanism, Measurement, and Empirical Analysis. Sustainability 2025, 17, 8146. [Google Scholar] [CrossRef] [Scilit]
- Ji, J.; Chi, Y.; Yin, X. Research on the driving effect of marine economy on the high-quality development of regional economy—Evidence from China’s coastal areas. Reg. Stud. Mar. Sci. 2024, 74, 103550. [Google Scholar] [CrossRef] [Scilit]
- Jin, M.; Liu, K. Has Ecological Protection and High-Quality Development Been Promoted by Green Finance? -Empirical Evidence from the Yellow River Basin. Pol. J. Environ. Stud. 2025, 35, 2153–2172. [Google Scholar] [CrossRef] [Scilit]
- Zhou, Y.; Zhang, C.; Yin, S.; Sun, T. Coupling Coordination and Influencing Mechanisms of Ecological Resilience in the Yangtze River Delta Region: A Resistance-Adaptation-Recovery Framework. Econ. Geogr. 2025, 45, 160–170. (In Chinese) [Google Scholar]
- Zhang, W.; Xiang, C. Co-evolutionary and driving factors of ecological protection and high-quality economic development in the Yellow River Basin. Geogr. Sci. 2025, 45, 1710–1719. (In Chinese) [Google Scholar]
- Tang, D.; Zhao, Z.; Li, J.; Boamah, V. Research on coupling coordination degree of digital finance and economic resilience in the Yangtze River Economic Belt. Nat. Hazards 2024, 120, 14279–14309. [Google Scholar] [CrossRef] [Scilit]
- Peng, L.; Wu, H.; Li, Z. Spatial-Temporal Evolutions of Ecological Environment Quality and Ecological Resilience Pattern in the Middle and Lower Reaches of the Yangtze River Economic Belt. Remote Sens. 2023, 15, 430. [Google Scholar] [CrossRef] [Scilit]
- Yin, S.; Shi, R.; Wu, N.; Yang, J. Measuring the impact of technological innovation on urban resilience through explainable machine learning: A case study of the Yangtze River Delta region, China. Sustain. Cities Soc. 2025, 127, 106457. [Google Scholar] [CrossRef] [Scilit]
- Yin, Y.; Gu, J.; Li, M. Sustainability-oriented urban resilience assessment: The case of China’s Yangtze River Delta region. J. Clean. Prod. 2025, 514, 145835. [Google Scholar] [CrossRef] [Scilit]
- Shi, R.; Chen, D.; Zhou, J.; Yin, S. Boost or hinder? Spatial spillover effects decomposition of digital economy driving ecological resilience: Evidence from the Yangtze River Economic Belt, China. Environ. Dev. Sustain. 2025. [Google Scholar] [CrossRef] [Scilit]
- Zhang, X.; Gou, P.; Chen, W.; Li, G.; Huang, Y.; Zhou, T.; Liu, Y.; Nie, W. Spatiotemporal distribution characteristics of ecosystem health and the synergetic impact of its driving factors in the Yangtze River Delta, China. Environ. Sci. Pollut. Res. 2023, 30, 85184–85197. [Google Scholar] [CrossRef] [Scilit]
- Yang, Y.; Chen, Y.; Li, X. Spatial and Temporal Distribution and Influencing Factors of “Water-Energy-Food-Ecology” System Resilience. Land 2025, 14, 8. [Google Scholar] [CrossRef] [Scilit]
- Li, R.; Xu, Q.; Yu, J.; Chen, L.; Peng, Y. Multiscale assessment of the spatiotemporal coupling relationship between urbanization and ecosystem service value along an urban-rural gradient:A case study of the Yangtze River Delta urban agglomeration, China. Ecol. Indic. 2024, 160, 111864. [Google Scholar] [CrossRef] [Scilit]
- Lima, R.C.; Veríssimo, A.; Coutinho, C.G.V.; Gonçalves, G.O. Deforestation and economic growth in the Amazon region: Investigating with a transposed environmental Kuznets curve. Ecol. Soc. 2025, 30, 29. [Google Scholar] [CrossRef] [Scilit]
- Jenkins, W.A.; Murray, B.C.; Kramer, R.A.; Faulkner, S.P. Valuing ecosystem services from wetlands restoration in the Mississippi Alluvial Valley. Ecol. Econ. 2010, 69, 1051–1061. [Google Scholar] [CrossRef] [Scilit]
- Manuel, L.; Meselhe, E.; Hu, K.; Reed, D.J. Systemic analysis of the tradeoffs associated with management strategies for natural and built Mississippi River outlets. J. Environ. Manag. 2025, 393, 127117. [Google Scholar] [CrossRef] [Scilit]
- Kowal, J.L.; Funk, A.; Unfer, G.; Baldan, D.; Haidvogl, G.; Hauer, C.; Ferreira, T.M.; Branco, P.; Schinegger, R.; Hein, T. River continuum disruptions in a highly altered system: The perspective of potamodromous fish. Ecol. Indic. 2024, 164, 112130. [Google Scholar] [CrossRef] [Scilit]
- Li, J.; Sun, W.; Li, M.; Meng, L. Coupling coordination degree of production, living and ecological spaces and its influencing factors in the Yellow River Basin. J. Clean. Prod. 2021, 298, 126803. [Google Scholar] [CrossRef] [Scilit]
- Shen, Q.; Lu, J.; Tutore, I.; Cucari, N.; Guo, Q. How does horizontal ecological compensation promote the coupled development of ecological environment protection and high-quality economy growth? Evidence from China’s circular economy practices. Socio-Econ. Plan. Sci. 2025, 102, 102320. [Google Scholar] [CrossRef] [Scilit]
- Tang, T.; Stevenson, R.J.; Grace, J.B. The importance of natural versus human factors for ecological conditions of streams and rivers. Sci. Total Environ. 2020, 704, 135268. [Google Scholar] [CrossRef] [Scilit]

Disclaimer/Publisher’s Note: The statements, opinions and data contained in all publications are solely those of the individual author(s) and contributor(s) and not of MDPI and/or the editor(s). MDPI and/or the editor(s) disclaim responsibility for any injury to people or property resulting from any ideas, methods, instructions or products referred to in the content. |
© 2026 by the authors. Licensee MDPI, Basel, Switzerland. This article is an open access article distributed under the terms and conditions of the Creative Commons Attribution (CC BY) license.