1. Introduction
With the continuous intensification of global climate change and the deepening of the sustainable development process, the problem of ecological environment preservation has become increasingly severe. Promoting the harmonious coexistence between humans and nature has become a common international consensus [
1]. In this context, China has incorporated ecological civilization construction into the overall national development plan, viewing it as an important strategy for responding to environmental challenges, promoting green transformation, and achieving sustainable development [
2,
3]. Tourism was once regarded as an environmentally friendly “smoke-free industry”, but as its scale has expanded, its dual characteristics of environmental dependence and resource consumption have gradually become apparent: on the one hand, tourism development is highly dependent on good natural ecological resources; on the other hand, excessive tourism openness may lead to problems such as resource consumption, environmental pollution, and ecological degradation [
4]. China’s border provinces possess a number of rich and diverse ecosystem types, including forests, grasslands, wetlands, snowy mountains, deserts, and other natural landscapes [
5], which provide unique resource endowments for tourism development. However, at the same time, these regions exhibit a strong ecological vulnerability and limited environmental carrying capacity [
6], and are thus prone to being affected by human activities. As peripheral regions that lag in development, China’s border provinces need to promote the Revitalizing Border Areas and Enriching the People Initiative and high-level opening up through tourism development, while simultaneously undertaking the strategic mission of building a national ecological security barrier, as the ecological security of these border areas concerns the whole country [
5]. Therefore, achieving the coordinated development of tourism economic growth and ecological environment improvement is not only an internal necessity for sustainable development in border areas, but also a practical need to consolidate national ecological security, promote cross-border ecological governance, and implement the development philosophy that “lucid waters and lush mountains are invaluable assets”.
Coupling coordination theory is a concept derived from physics, referring to the phenomenon where two or more systems achieve coordinated development through interaction [
7]. In the study of the relationship between tourism and ecology, the coupling coordination model can reveal the interactive state between the systems: when the intensity of tourism development is within the range of ecological carrying capacity, the advantages of the ecological environment are transformed into tourism resource advantages, and the development of the tourism industry increases fiscal revenue to foster environmental protection; when the intensity of tourism development exceeds the range of ecological carrying capacity, tourism activities result in the concentrated influx of tourists, the intensification of pollution at tourism destinations, the disorderly development of tourism, and the intensification of resource consumption and environmental damage, resulting in an imbalance between the two systems [
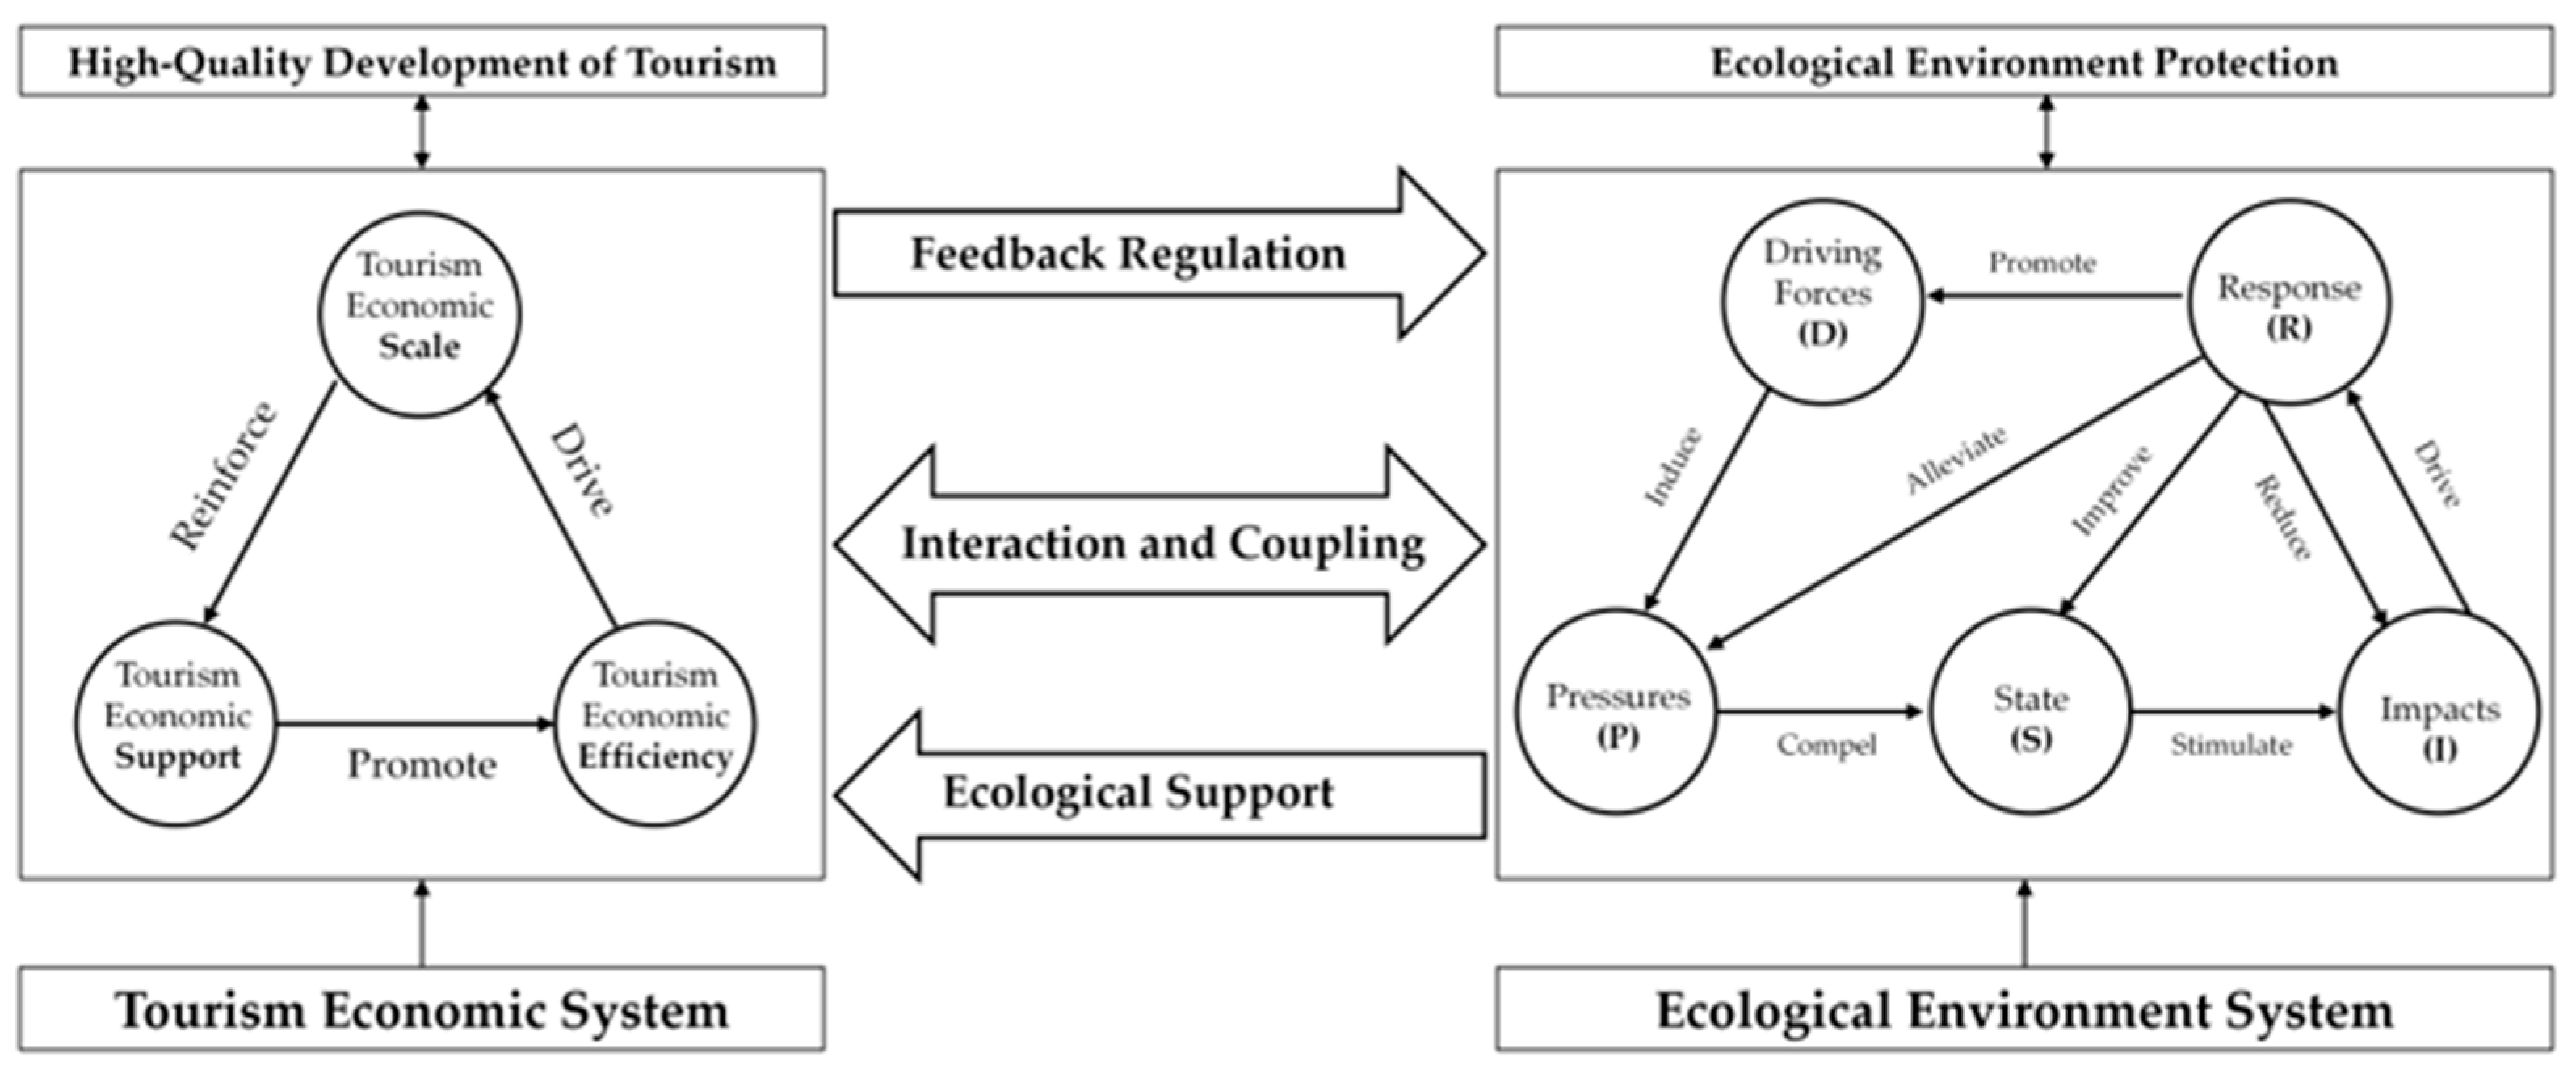
7]. The coupling coordination theory distinguishes and analyzes the relationship between tourism and ecology, but it cannot capture the dynamic evolution path or identify the turning point, while the environmental Kuznets curve provides an important theoretical perspective to reveal the evolution pattern. The environmental Kuznets curve holds that economic development will increase environmental pressure, and when economic development reaches a certain level, it will gradually improve environmental pressure; that is, there is an “inverted U-shaped” interactive coercive relationship between the two [
8]. Similarly, in the relationship between the tourism economy and ecological environment, tourism, as a social and economic activity, develops rapidly, exerting pressure on the ecological environment. When tourism development reaches a certain threshold, the increasingly serious ecological and environmental problems will force the tourism economy to slow down its coercive effect on the ecological environment, and the two will return to a coordinated relationship. Existing studies have verified the “inverted U-shaped” relationship between urbanization level and the ecological environment by constructing the interactive coercive relationship through the double exponential function [
9,
10]. On the basis of clarifying the coordination status and interactive coercive relationship between the tourism economy and ecological environment, this study introduces the obstacle degree model to diagnose the obstacle factors in order to further explore the influencing factors that restrict the coordinated development and interactive relationship between the two, so as to provide theoretical guidance for practical development. Therefore, through the coupling coordination, interactive coercive, and obstacle degree models, the analytical framework of “coupling relationship identification–coercion threshold identification–impact factor diagnosis” is formed, which systematically reveals the interaction mechanism and evolution path of the tourism economy and ecological environment in China’s border provinces.
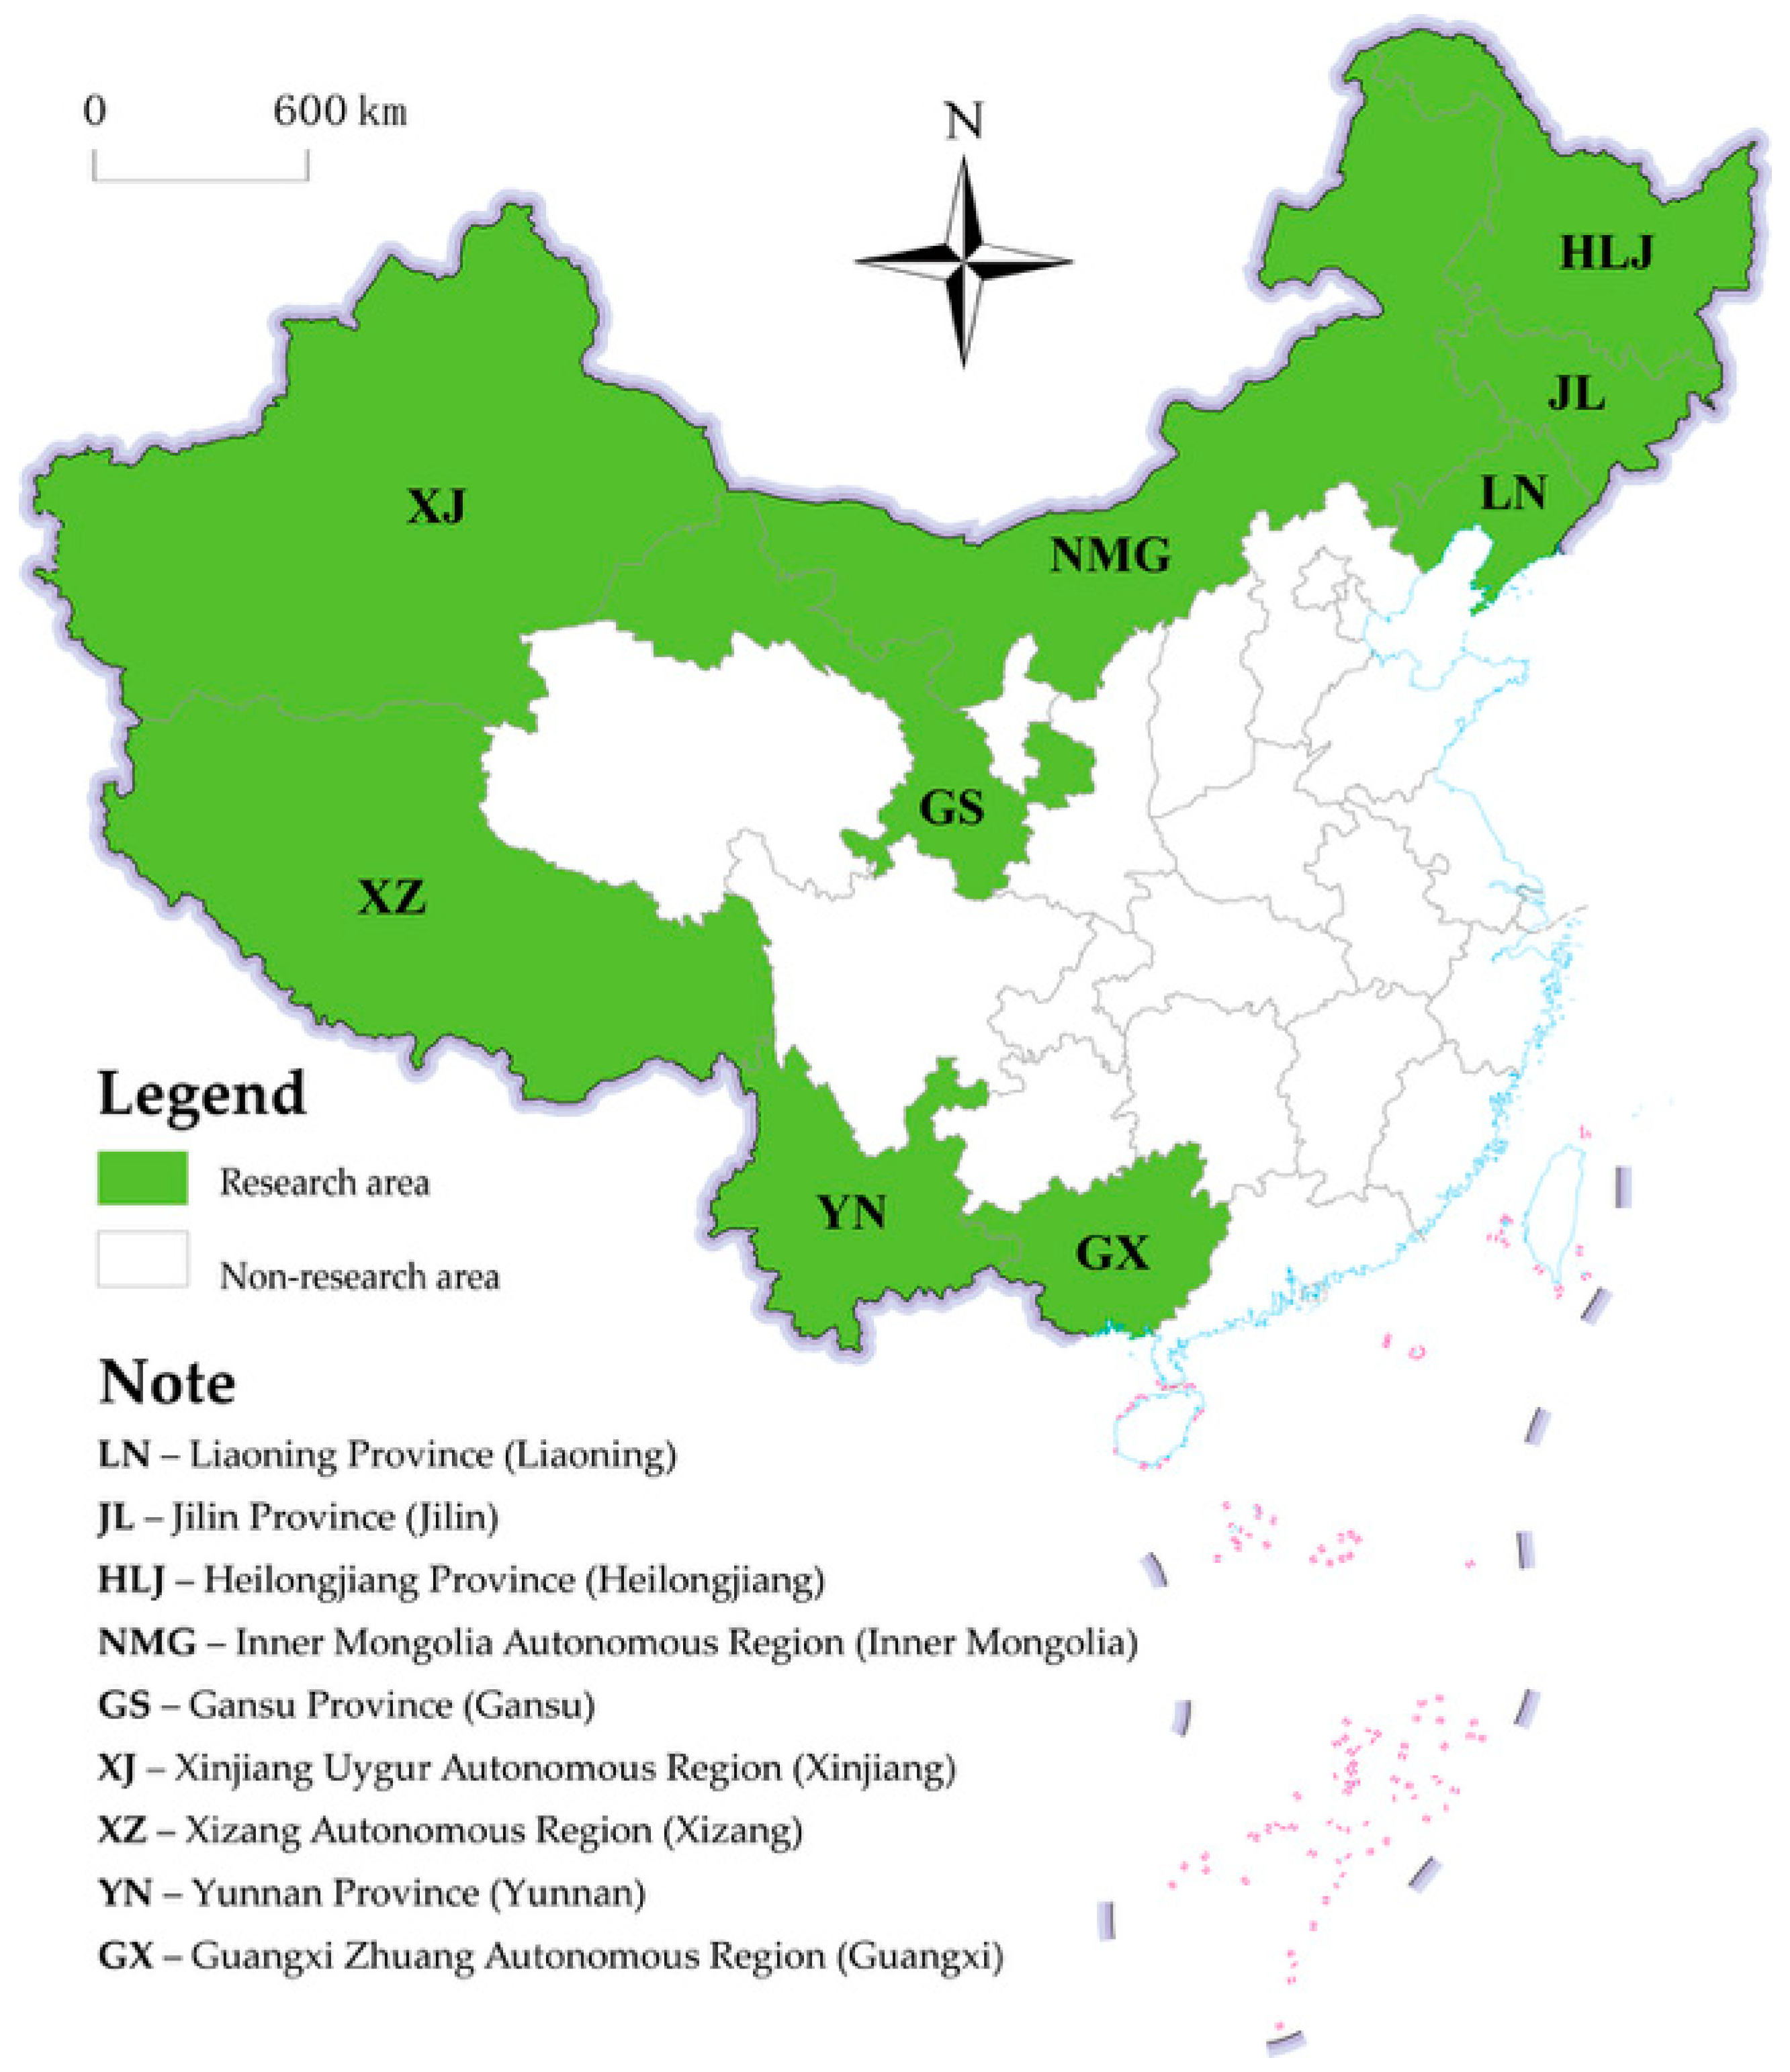
This study selected nine border provinces in China as the case areas, and chose 2009–2019 as the study period to avoid the impact of missing data during the COVID-19 pandemic. By constructing an evaluation index system for the tourism economy and ecological environment, this study systematically explores the development level, coupling coordination level, and interactive coercion relationship between the two in China‘s border provinces, and investigates the obstacle factors affecting their coordinated development, so as to provide a theoretical reference and policy recommendations for promoting high-quality tourism development and ecological barrier construction in these areas. In summary, the marginal contributions of this study are as follows: (1) the construction of an indicator system for the tourism economy and ecological environment in China‘s border provinces, providing a framework reference for subsequent research; (2) the revelation of the spatiotemporal evolution characteristics of the coupling coordination between the tourism economy and ecological environment, clarifying the regional differences and evolution patterns of the coordination state; (3) the revelation of the interactive coercion relationship between the two, identifying the turning point where the coercion relationship shifts from strong to weak; (4) the identification of the main obstacle factors hindering the coordinated development of the two systems, providing theoretical guidance for practical development; and (5) based on the research conclusions, the provision of countermeasures and suggestions to promote the coordinated development of tourism and ecology.
2. Literature Review
The relationship between tourism and ecology has long comprised a cross-cutting field of tourism, geography, and ecology. In the 1970s, with the development of mass tourism and the intensification of environmental problems, the ecological environment of tourism destinations began to attract academic attention [
7,
8]. Early studies focused on the negative impacts of tourism activities on destinations, such as environmental pollution [
11], ecological damage [
12], and resource consumption [
13]. In response, scholars attempted to address these issues through research on tourism carrying capacity [
14], environmental regulation [
15], and technological innovation [
16]. In this process, the coordinated development of tourism and ecology became an important research direction, and concepts such as tourism ecological footprint [
17], tourism eco-efficiency [
18], tourism eco-safety [
19,
20], and ecotourism [
21] were successively proposed, forming the theoretical foundation for research on the relationship between tourism and ecology. As research theories continued to develop, research methods also evolved, shifting from early qualitative approaches to quantitative methods. Methods such as spatial econometric models [
22], the Lotka–Volterra symbiosis model [
23,
24], geographic detector models [
25,
26], the coupling coordination model [
7,
27], and the grey correlation model [
13] were introduced. Research areas covered both macro and micro scales such as provinces [
28], cities [
29], counties [
30], and scenic areas [
31], as well as natural ecosystems such as islands [
32,
33], river basins [
10,
34], and protected areas [
35,
36]. Existing research has established a relatively systematic analytical framework and theoretical system, with continuously expanding research areas and increasingly enriched research methods, laying a solid foundation for related studies.
The special geographical characteristics of border areas make the relationship between tourism and ecology complicated [
37]. On the one hand, borders, as artificial administrative boundaries, affect the integrity of ecosystems, and ecological protection and environmental governance in border areas usually require cross-border cooperation. For example, the construction of the border wall between the United States and Mexico has harmed the migration and breeding of wildlife [
38]. In response to this issue, Poland and Czechoslovakia pioneered cross-border ecological governance through cross-border cooperation in nature reserves [
39]. As the practice has developed, the cooperation framework and governance mode of cross-border nature reserves have attracted widespread attention [
40]. At the same time, some scholars have critically discussed this model, revealing that it involves land politics and a capital logic that may exacerbate power inequality and lead to the marginalization of Indigenous people [
41]. On the other hand, tourism comprises political expectations beyond its economic scope, and neighboring countries hope to improve bilateral relations through tourism cooperation. For example, South Africa, Mozambique, and Zimbabwe jointly established the Greater Limpopo Cross-border National Park, bringing the continuous ecosystem across the three countries under unified management, hoping to strengthen mutual political trust and improve regional relations through tourism development cooperation [
42]. The establishment of the Schengen Area in Europe has reduced the obstructive effect of borders and promoted the development of border and cross-border tourism [
43]. In this process, institutional differences between different countries have created management challenges for tourism cooperation in border areas, with issues such as language barriers, human resources, and cultural differences emerging in cooperative governance [
44], indicating that the border functions as a socially constructed barrier with long-term stability [
45].
To sum up, relevant research has yielded some results, but the following aspects warrant further discussion: (1) From the research perspective, tourism and ecology are often placed within composite concepts such as tourism ecological security, tourism eco-efficiency, and tourism environmental carrying capacity, making it difficult to reveal the interactive mechanisms between the systems; (2) In terms of research methods, although existing methods can measure the development levels of the tourism economy and ecological environment, they lack direct verification and discussion of their interactive coercive relationship, making it impossible to pinpoint its key turning points; (3) In terms of research areas, while relevant studies have revealed the complex relationship between tourism and ecology in border areas from multiple dimensions, less attention has been paid to China’s border provinces, which are characterized by high ecological vulnerability and complex geographical features. Therefore, in border areas where ecosystems are fragmented by borders and tourism development is deeply influenced by geopolitics, promoting the coordinated development of tourism and ecology is not only relevant to the construction of national ecological security barriers, but also serves as an important fulcrum for advancing the Revitalizing Border Areas and Enriching the People Initiative and high-level opening up.
5. Results
5.1. Basic Index Level
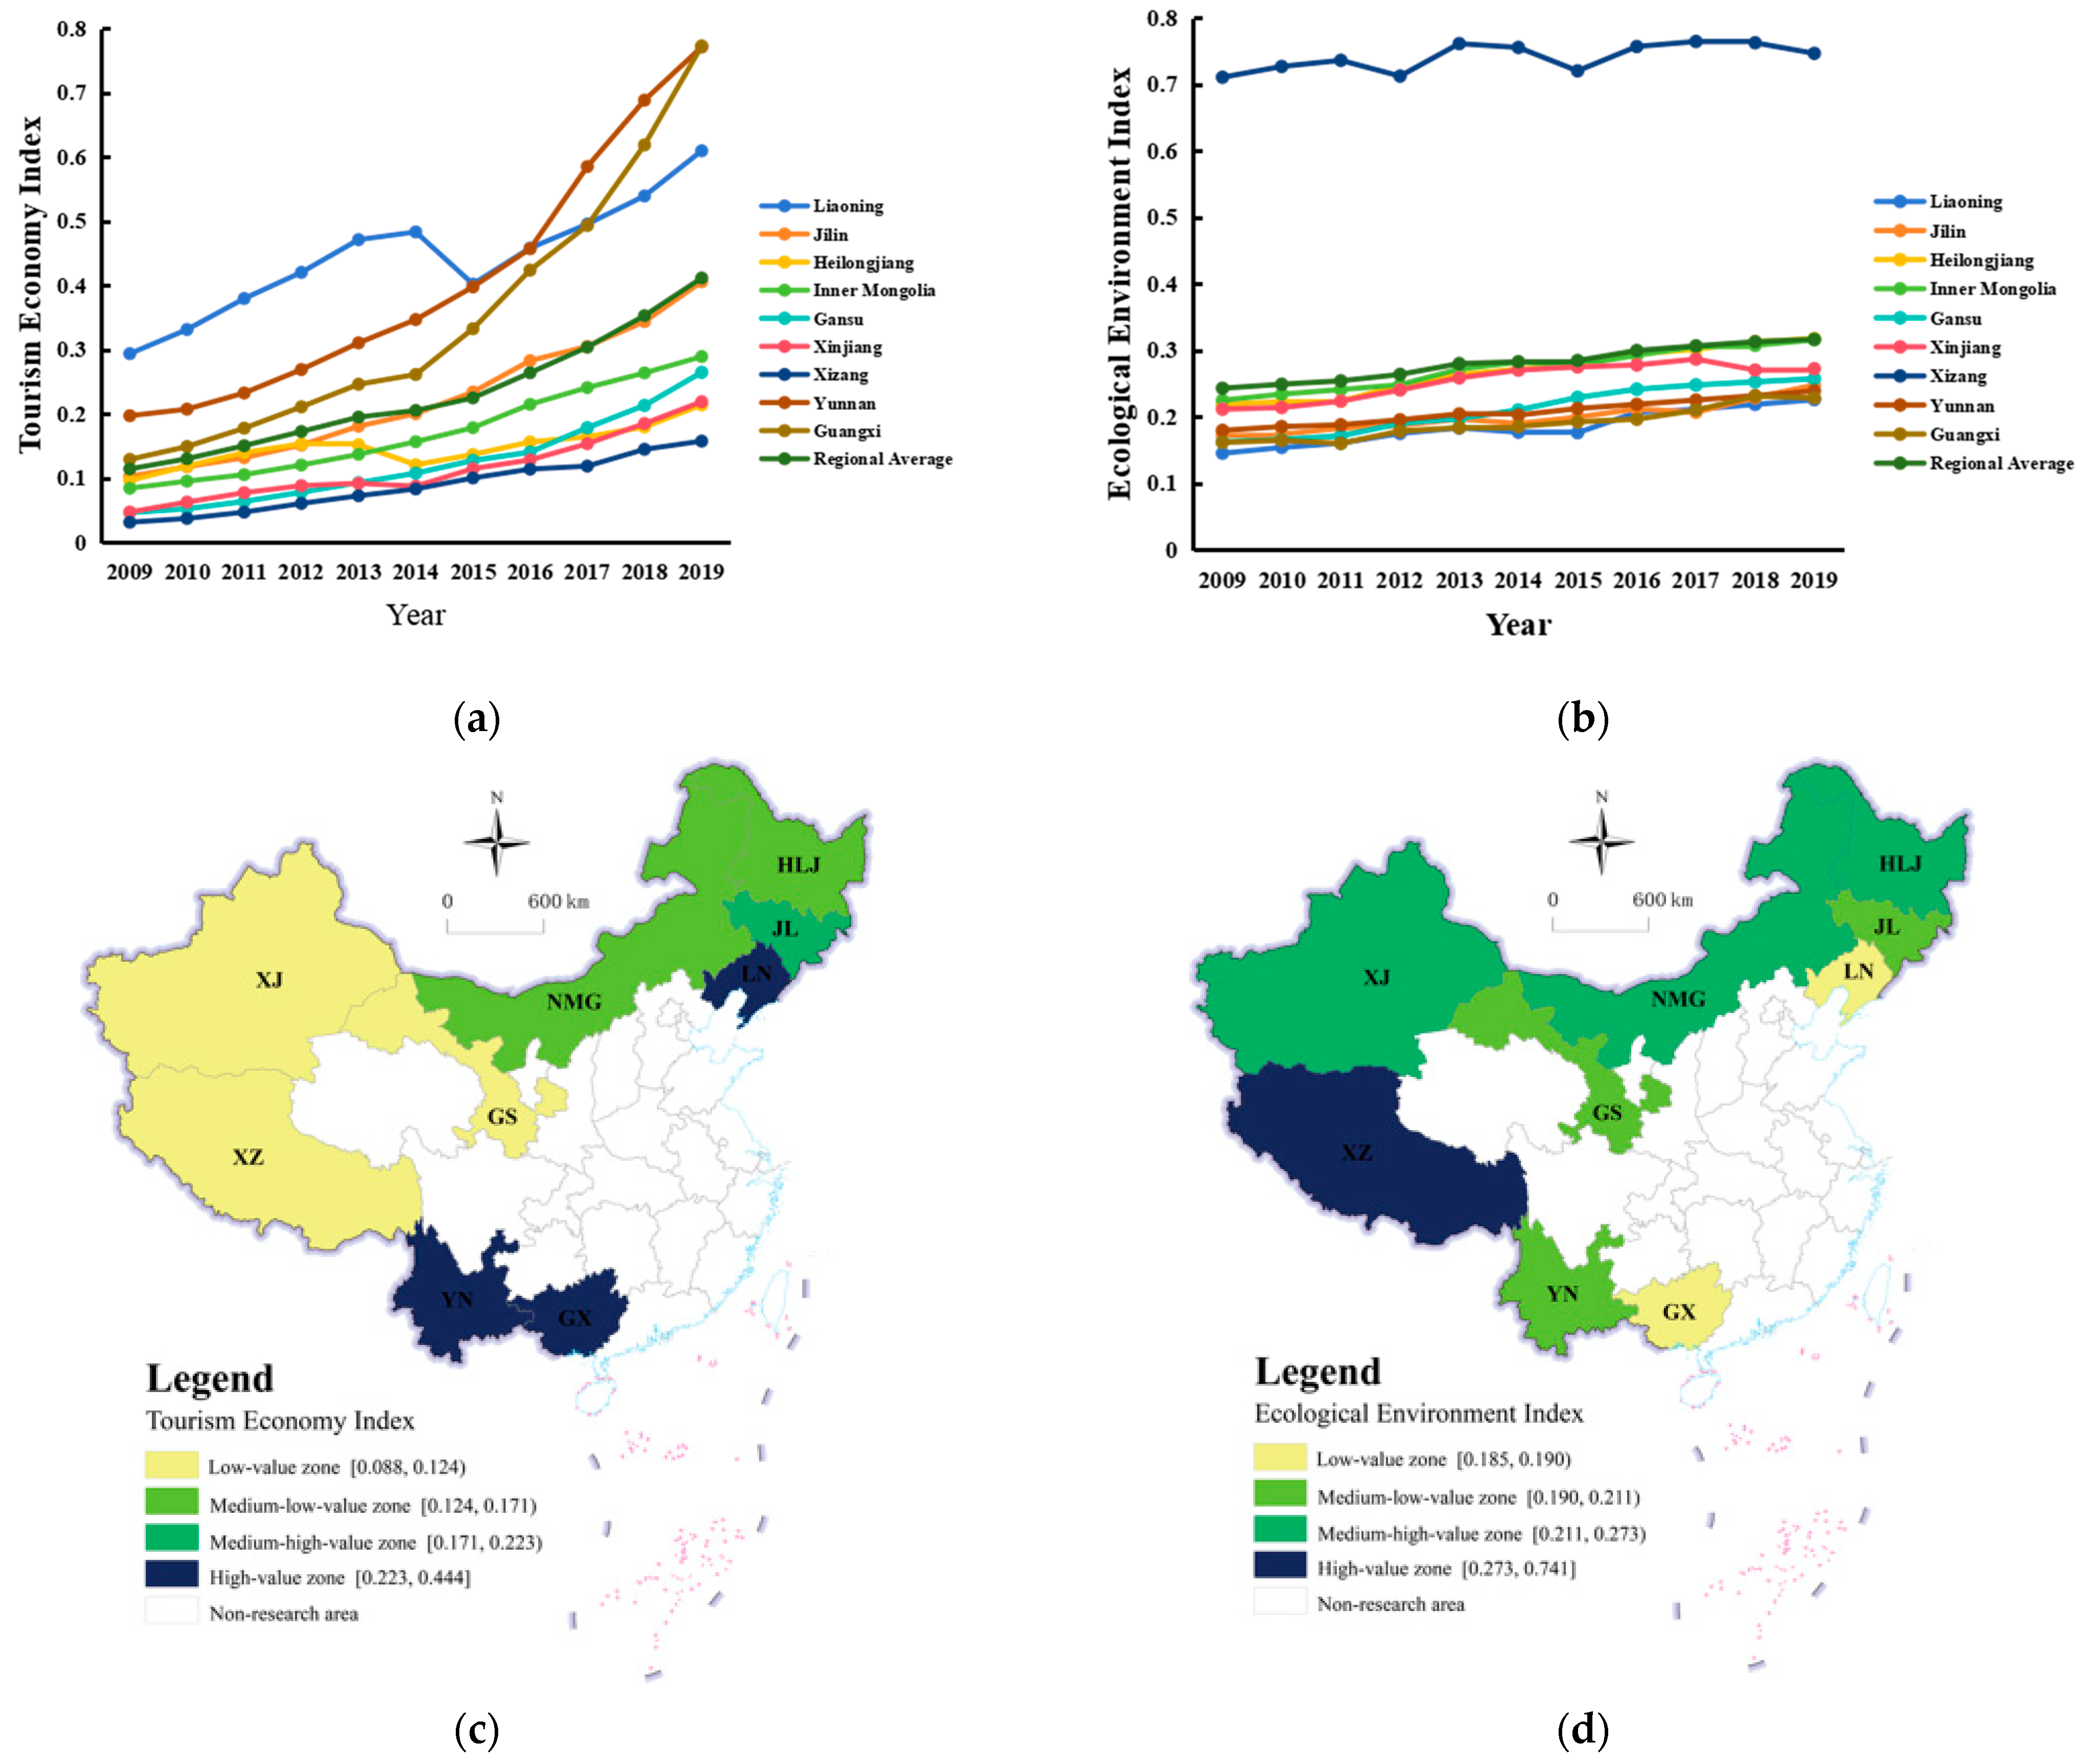
The comprehensive index method was used to calculate the tourism economy and ecological environment indices. The natural breaks method was then applied to classify the mean values of these indices for each province during the study period into low-value zone, medium-low-value zone, medium-high-value zone, and high-value zone categories, from which the spatiotemporal distribution maps of the tourism economy and ecological environment indices in China’s border provinces (
Figure 3) were generated to explore the temporal evolution and spatial distribution characteristics of the two.
The tourism economy index of China’s border provinces increased rapidly, showing a distribution pattern of “high in the southwest, second in the northeast, and low in the northwest”. Over the study period, the tourism economy index of China’s border provinces increased from 0.114 to 0.412 (
Figure 3a), an overall increase of 360%, indicating the rapid development of tourism in China’s border areas. Among them, Guangxi, Yunnan, and Liaoning experienced rapid growth, with their indices consistently above the regional average during the study period, making them key areas driving the overall development of the region. Xizang, Gansu, Xinjiang, and other provinces, despite having a relatively low tourism economy base, also maintained a steady growth trend. In terms of space (
Figure 3c), the mean tourism economy index for the study area was 0.229, and the mean values for each province exhibited an uneven distribution pattern. Yunnan and Guangxi in the southwest were in the high-value zone; Liaoning, Jilin, Heilongjiang, and Inner Mongolia in the northeast were above the medium-low-value zone; while Xizang, Xinjiang, and Gansu were in the low-value zone.
Restricted by factors such as geographical location, infrastructure, and economic conditions, tourism in China’s border provinces started relatively late. However, with the sustained support of national strategies such as “opening up”, the “Revitalizing Border Areas and Enriching the People Initiative”, and the “Western Development Strategy”, tourism in border areas has developed rapidly. Among them, Liaoning’s relatively strong economic foundation enabled its tourism industry to start earlier; Yunnan and Guangxi have gained strong momentum for industrial development through cross-border tourism cooperation; while Xizang, Xinjiang, and Gansu, despite possessing unique tourism resources, have faced challenges in regional accessibility, but their tourism development is expected to continue improving as infrastructure is gradually enhanced.
The ecological environment index of China’s border provinces fluctuated but rose, showing a distribution pattern of “single-pole leading and convergence among multiple provinces”. Over the study period, the ecological environment index of China’s border provinces increased from 0.243 to 0.317 (
Figure 3b), reflecting a continuous improvement in the ecological environment level of border provinces. The added value of the ecological environment index in all provinces was below 0.1. With the exception of Heilongjiang and Gansu, where the index showed a continuous upward trend, the ecological environment index in all provinces exhibited a fluctuating upward trend, with Heilongjiang, Inner Mongolia, and Gansu increasing relatively fast. In terms of space (
Figure 3d), the mean value for the study area was 0.281, and the mean ecological environment index for each province exhibited a distribution pattern of “single-pole leading and convergence among multiple provinces”. During the study period, the ecological environment index of Xizang remained above 0.7, far higher than that of the other provinces, forming a unipolar leading pattern. Apart from Xizang, the differences among the other provinces were relatively small, generally remaining within 0.1. Inner Mongolia, Heilongjiang, and Xinjiang were in the medium-high-value zone, while Liaoning and Guangxi were in the low-value zone.
China’s border areas importantly function as national ecological security barriers, which requires that the development of border areas adheres to the strategy of ecological priority. Therefore, under the background of ecological civilization construction, the ecological environment of China’s border areas has continued to improve. Xizang, located in the Qinghai–Tibet Plateau region, possesses ecological resources such as snow-capped mountains, glaciers, grasslands, and lakes. Due to its high-altitude, oxygen-deficient geographical conditions, the region has a relatively small population, resulting in relatively low pressure from human activities on the ecological environment and relatively abundant per capita resource reserves, thus explaining its relatively high ecological environment index.
5.2. Coupling Coordination Spatiotemporal Characteristics
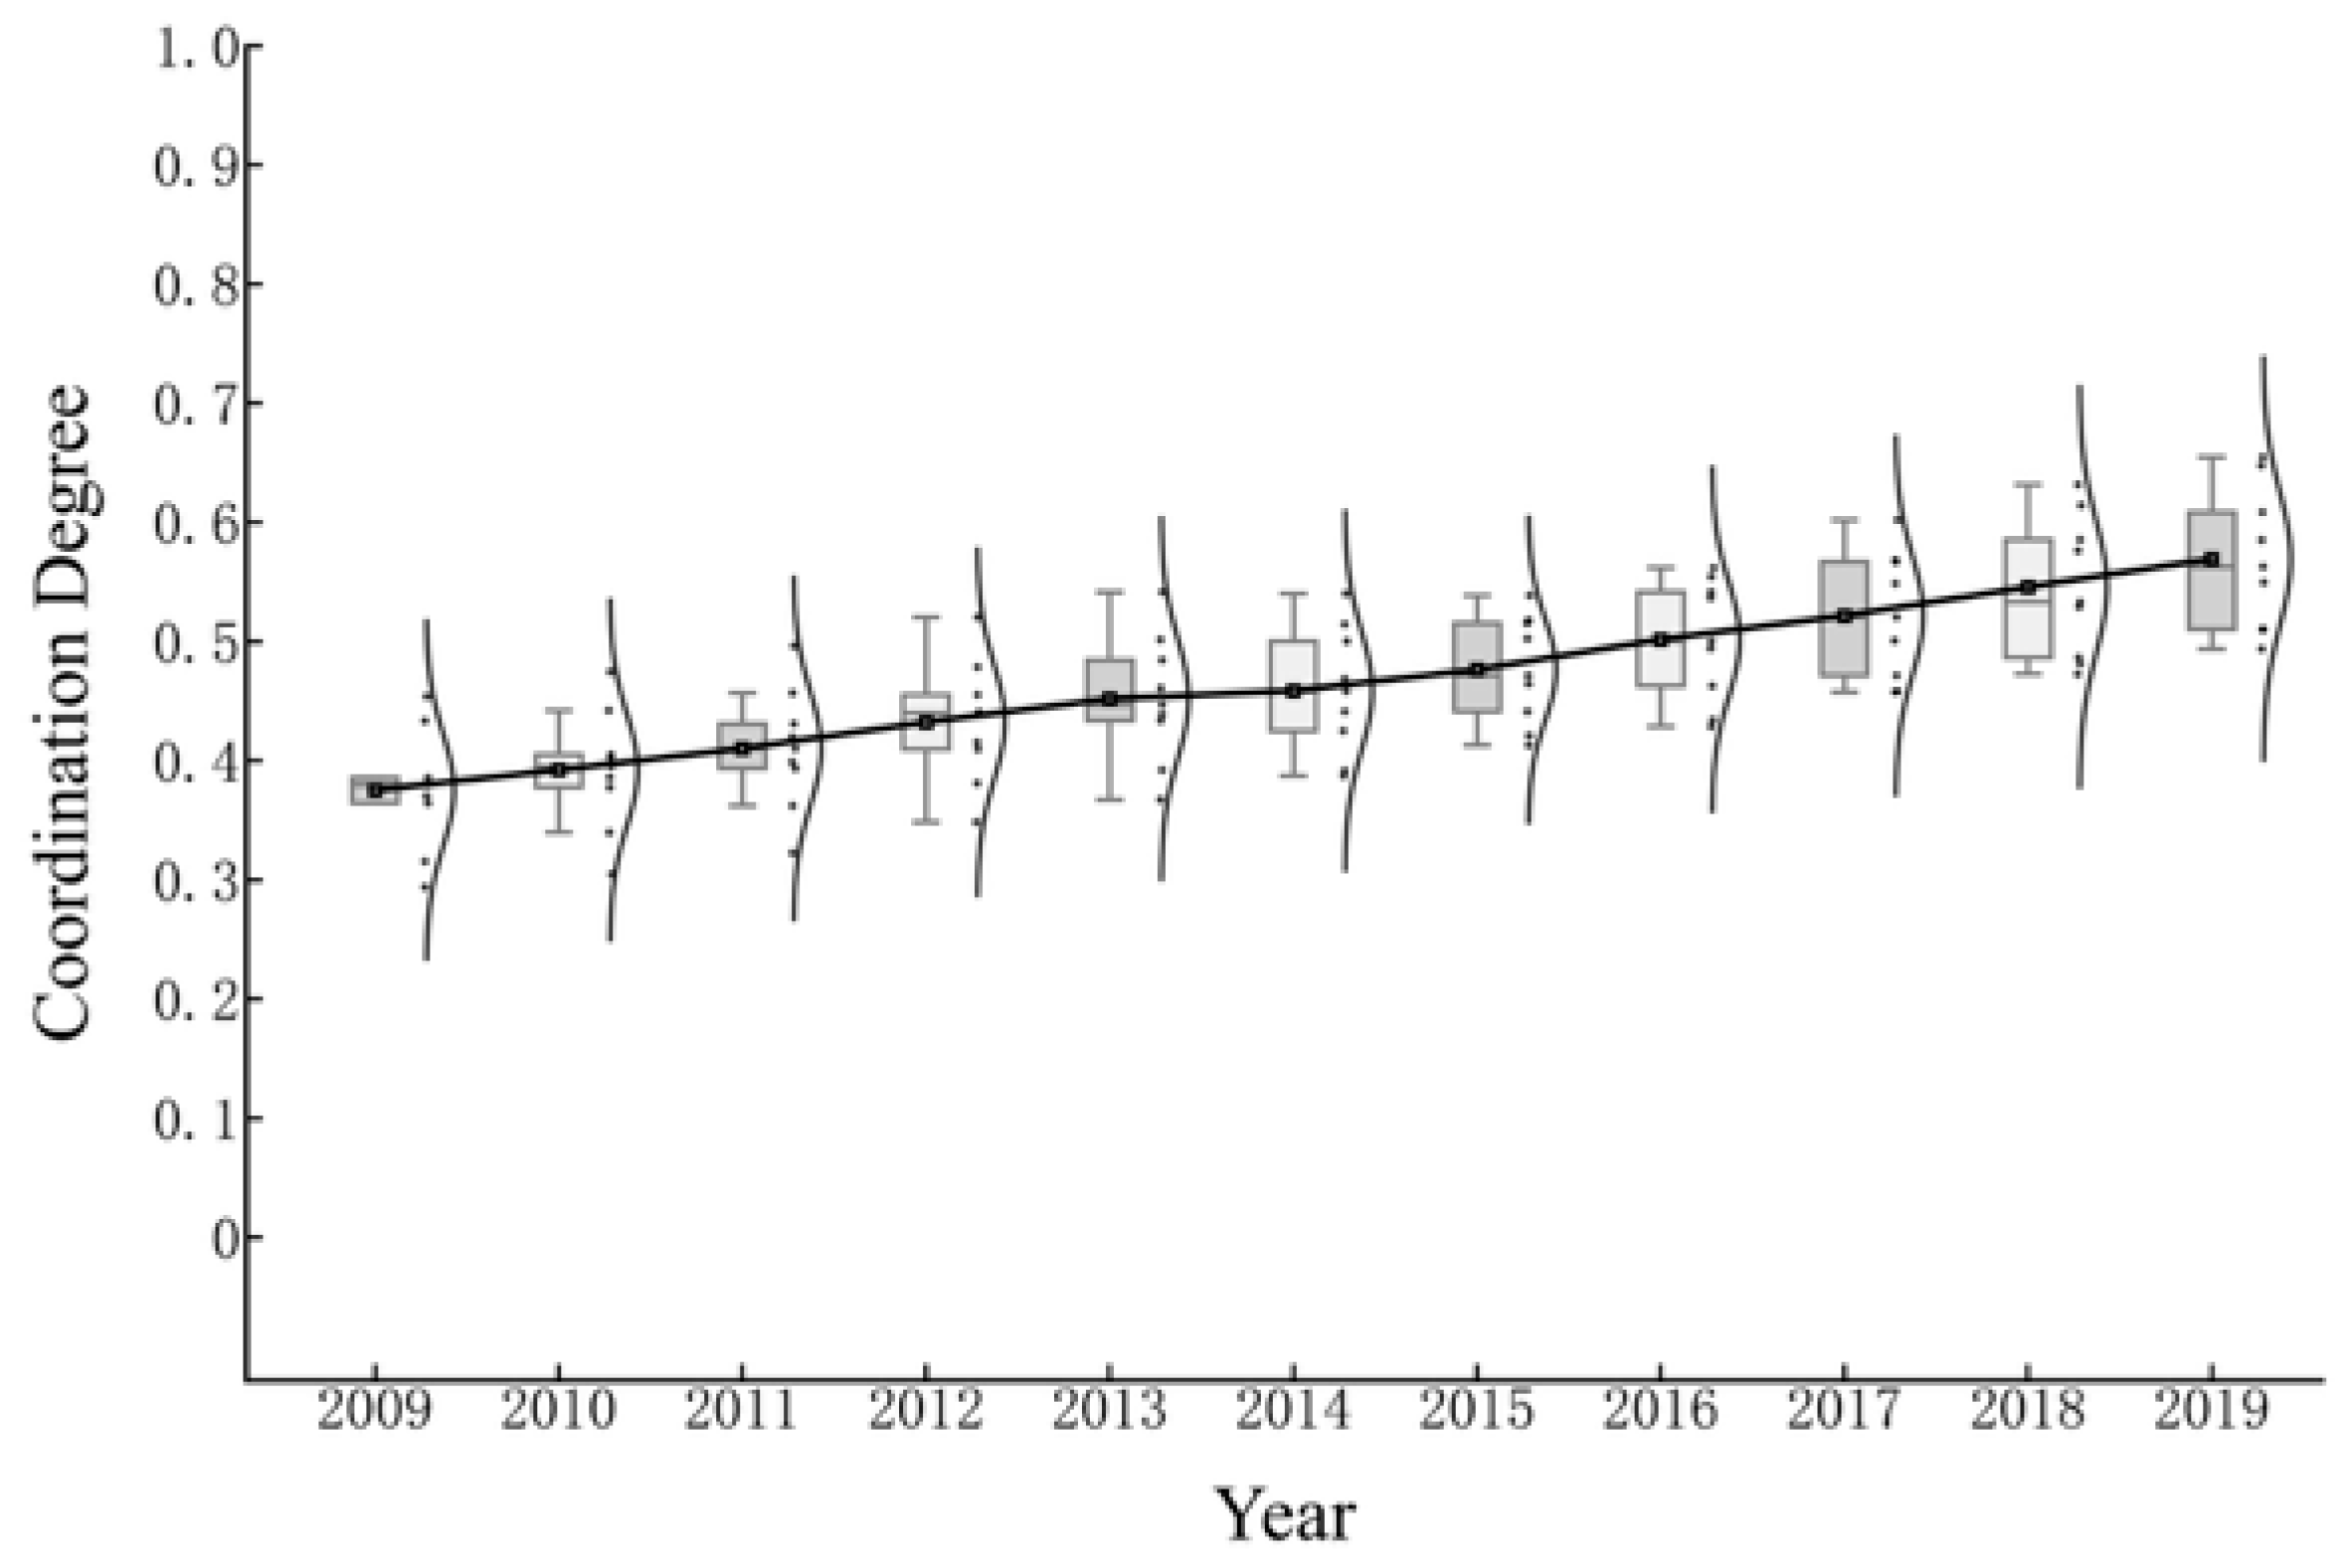
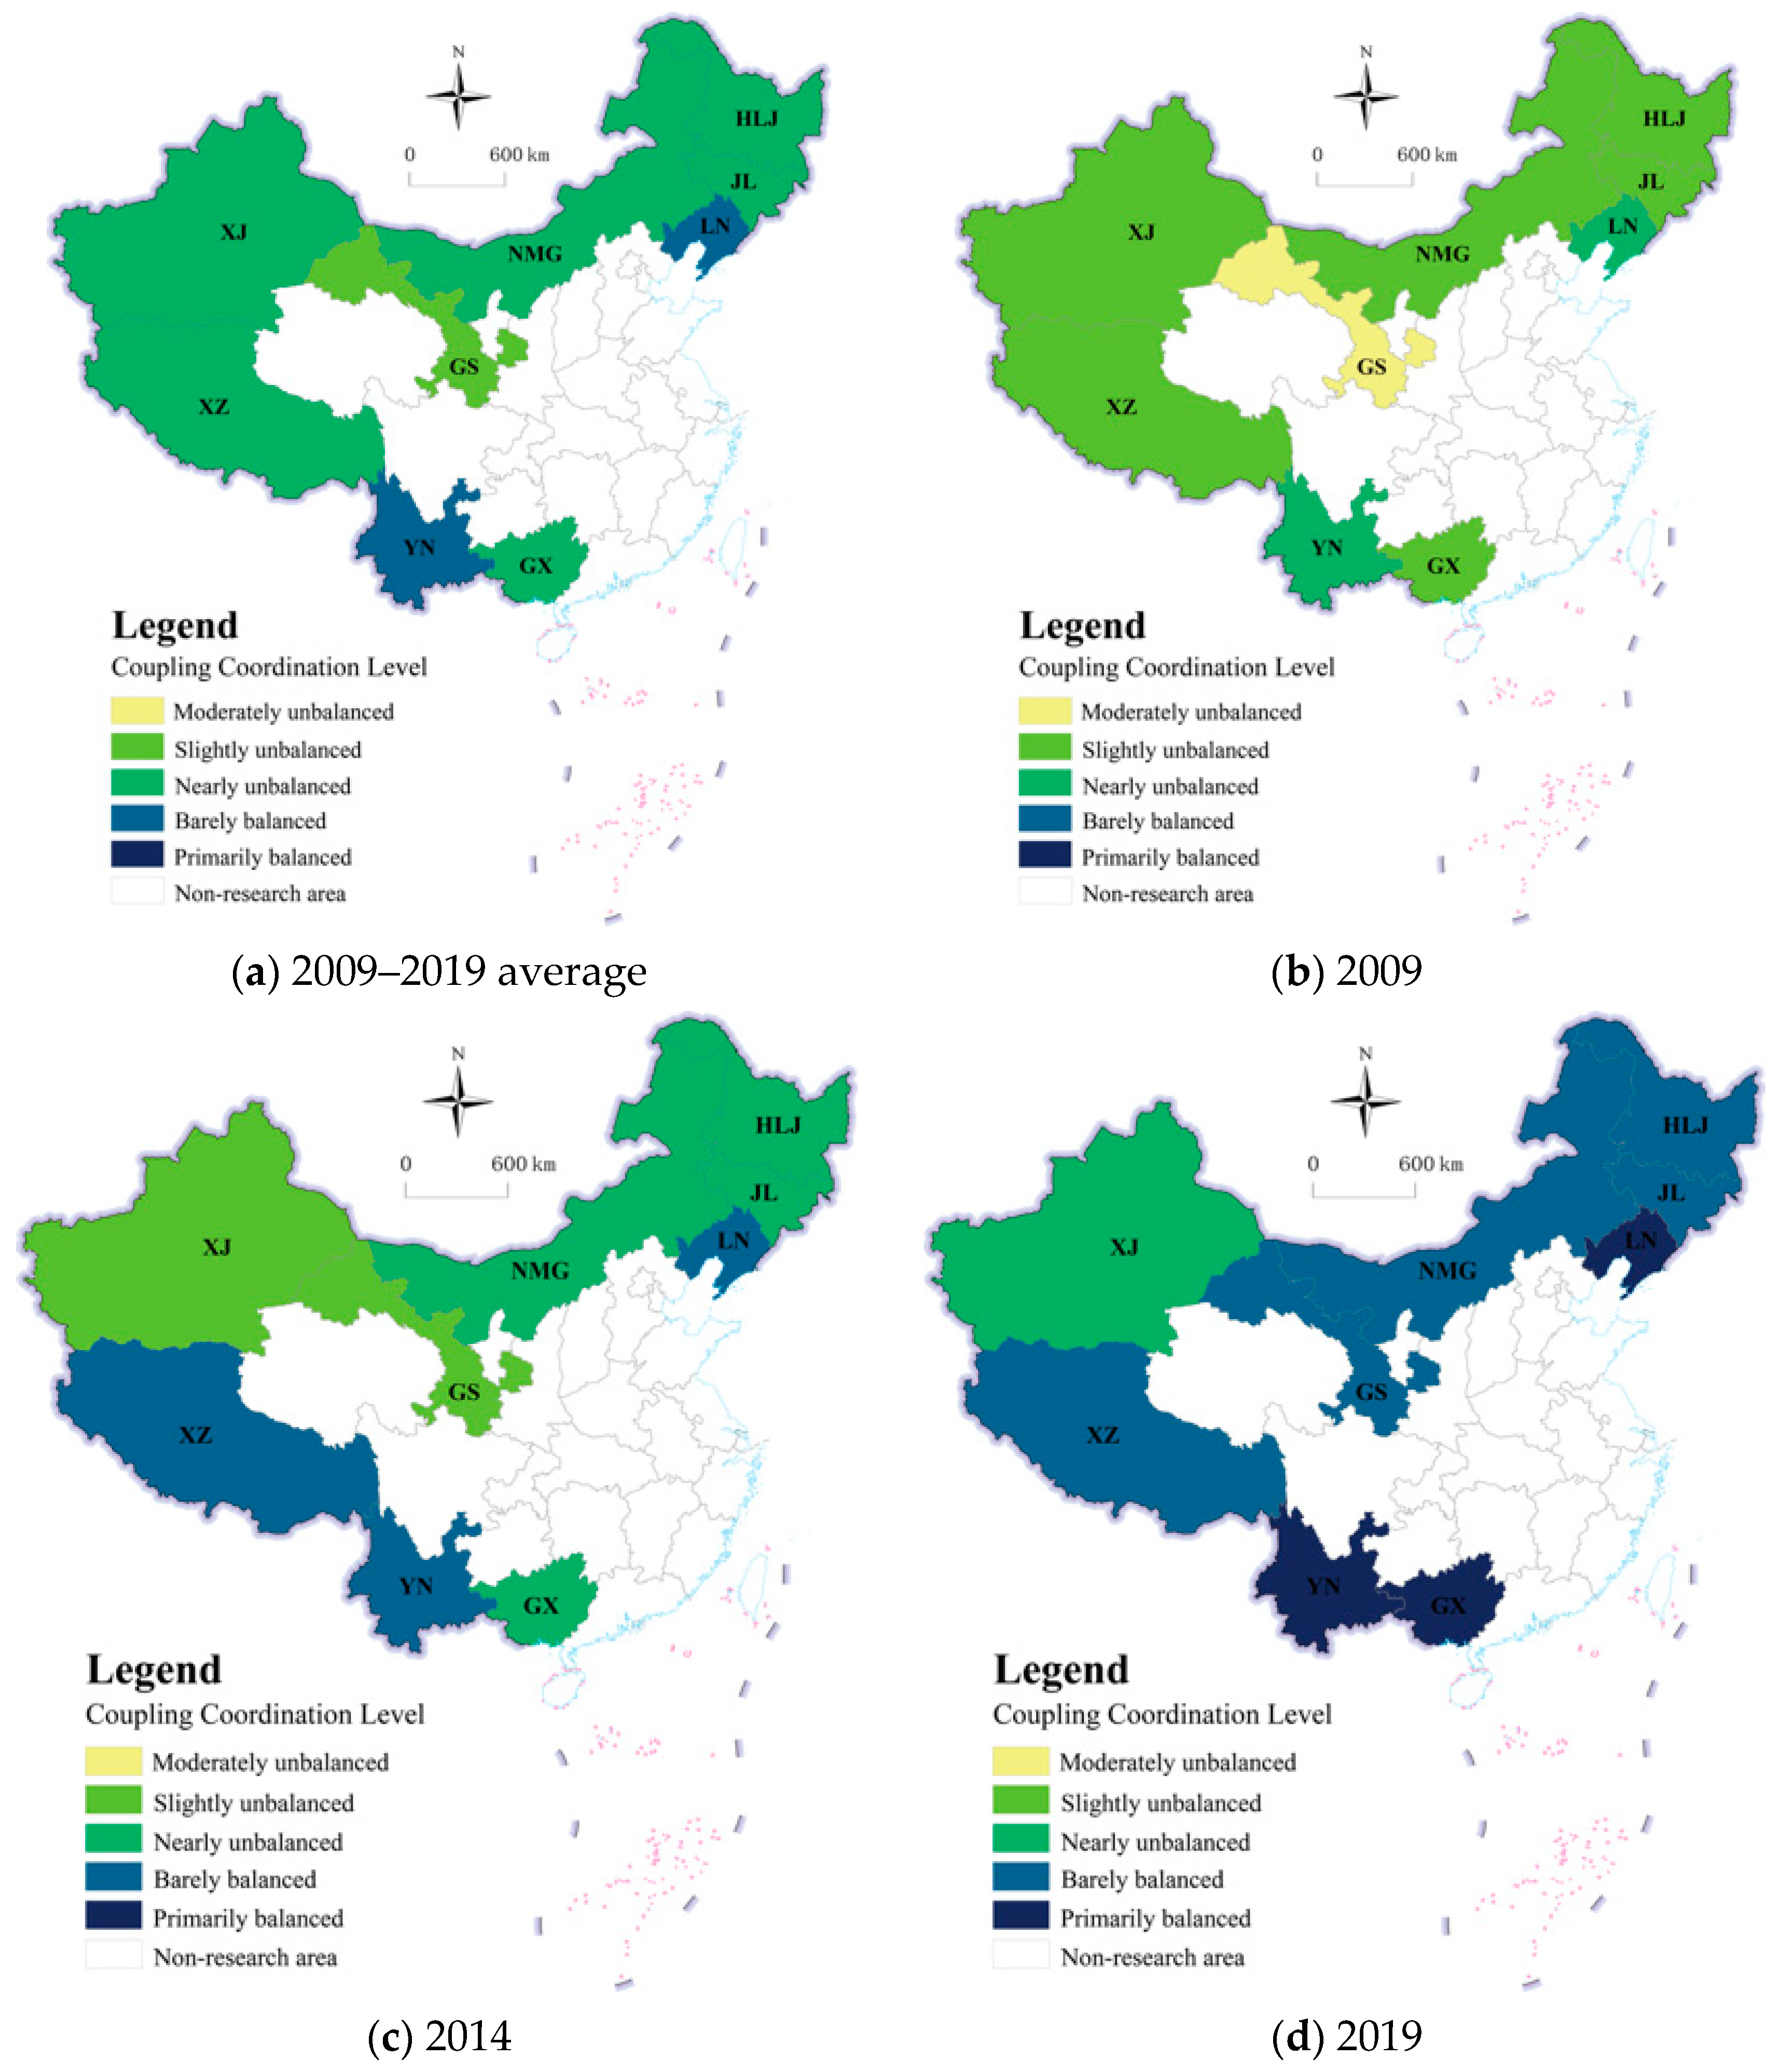
The coupling coordination degree of the tourism economy and ecological environment in China’s border provinces was calculated using the coupling coordination degree model. Based on relevant studies, the coupling coordination degree was classified into extremely unbalanced (0, 0.1], severely unbalanced (0.1, 0.2], moderately unbalanced (0.2, 0.3], slightly unbalanced (0.3, 0.4], nearly unbalanced (0.4, 0.5], barely balanced (0.5, 0.6], primarily balanced (0.6, 0.7], intermediately balanced (0.7, 0.8], well balanced (0.8, 0.9], and excellently balanced (0.9, 1]. A box plot of the coupling coordination degree of the tourism economy and ecological environment in China’s border provinces was drawn (
Figure 4) to explore the temporal evolution characteristics. Spatial differentiation maps (
Figure 5) were drawn by selecting the average values of 2009, 2014, 2019, and the study period to explore the spatial distribution characteristics.
In terms of temporal evolution, the coupling coordination degree of the tourism economy and ecological environment in China’s border provinces steadily improved, with the growth rate accelerating after 2015. Over the study period, the coupling coordination degree increased from 0.376 to 0.567, experiencing a developmental trajectory from slightly unbalanced and nearly unbalanced to barely balanced, indicating that the tourism economy and ecological environment transitioned from mutual constraint to synergistic progress. Before 2015, the average annual growth rate of the coupling coordination degree was approximately 3.7%, while after 2015, it was about 5.2%. In the box plot, the box position and median line rose year by year, indicating that the coordination degree of each province increased steadily; the box length increased and the peak of the normal distribution curve flattened, reflecting growing disparities among provinces; and the upward shift of the normal distribution curve peak suggests that provinces with higher values are increasing. In 2015, “Opinions of the Central Committee of the Communist Party of China and the State Council on Accelerating the Construction of Ecological Civilization” and the “Overall Plan for the Reform of the Ecological Civilization System” were officially issued, which clarified the overall requirements and pathways for ecological civilization construction, providing theoretical support and methodological guidance for the coordinated development of the tourism economy and ecological environment.
In terms of spatial distribution, the coupling coordination degree varied significantly among China’s border provinces, with Liaoning, Yunnan, Xizang, and Guangxi showing relatively high levels, while Gansu lags behind. The mean coupling coordination degree of Liaoning and Yunnan during the study period was at the primarily balanced level, while that of Xizang and Guangxi also exceeded 0.49, placing them in a leading position among the border provinces. Among them, Liaoning, Yunnan, and Guangxi achieved coordinated development by improving the ecological environment through tourism economy growth, whereas Xizang accelerated tourism development based on its superior ecological environment to realize the integration of ecological and economic benefits. Although Gansu remains in the slightly unbalanced category, its mean value has exceeded 0.39, indicating that it is also moving out of the imbalanced stage. Specifically, Liaoning and Yunnan maintained a relatively synchronous development trend, staying at the same level in 2009, 2014, and 2019, forming a dual-core leading role supported by a strong economic foundation and rich tourism resources. Xizang and Guangxi achieved leapfrog growth in 2014 and 2019, respectively, entering the barely balanced and primarily balanced categories, reflecting Xizang’s efforts in tourism development and Guangxi’s efforts in ecological environment improvement. Xinjiang’s coupling coordination degree remained relatively low, and it had still not moved out of the imbalanced range by 2019, suggesting that it needs to accelerate tourism development and improve the ecological environment to achieve coordinated development between the two systems.
5.3. Interactive Coercion Relationship
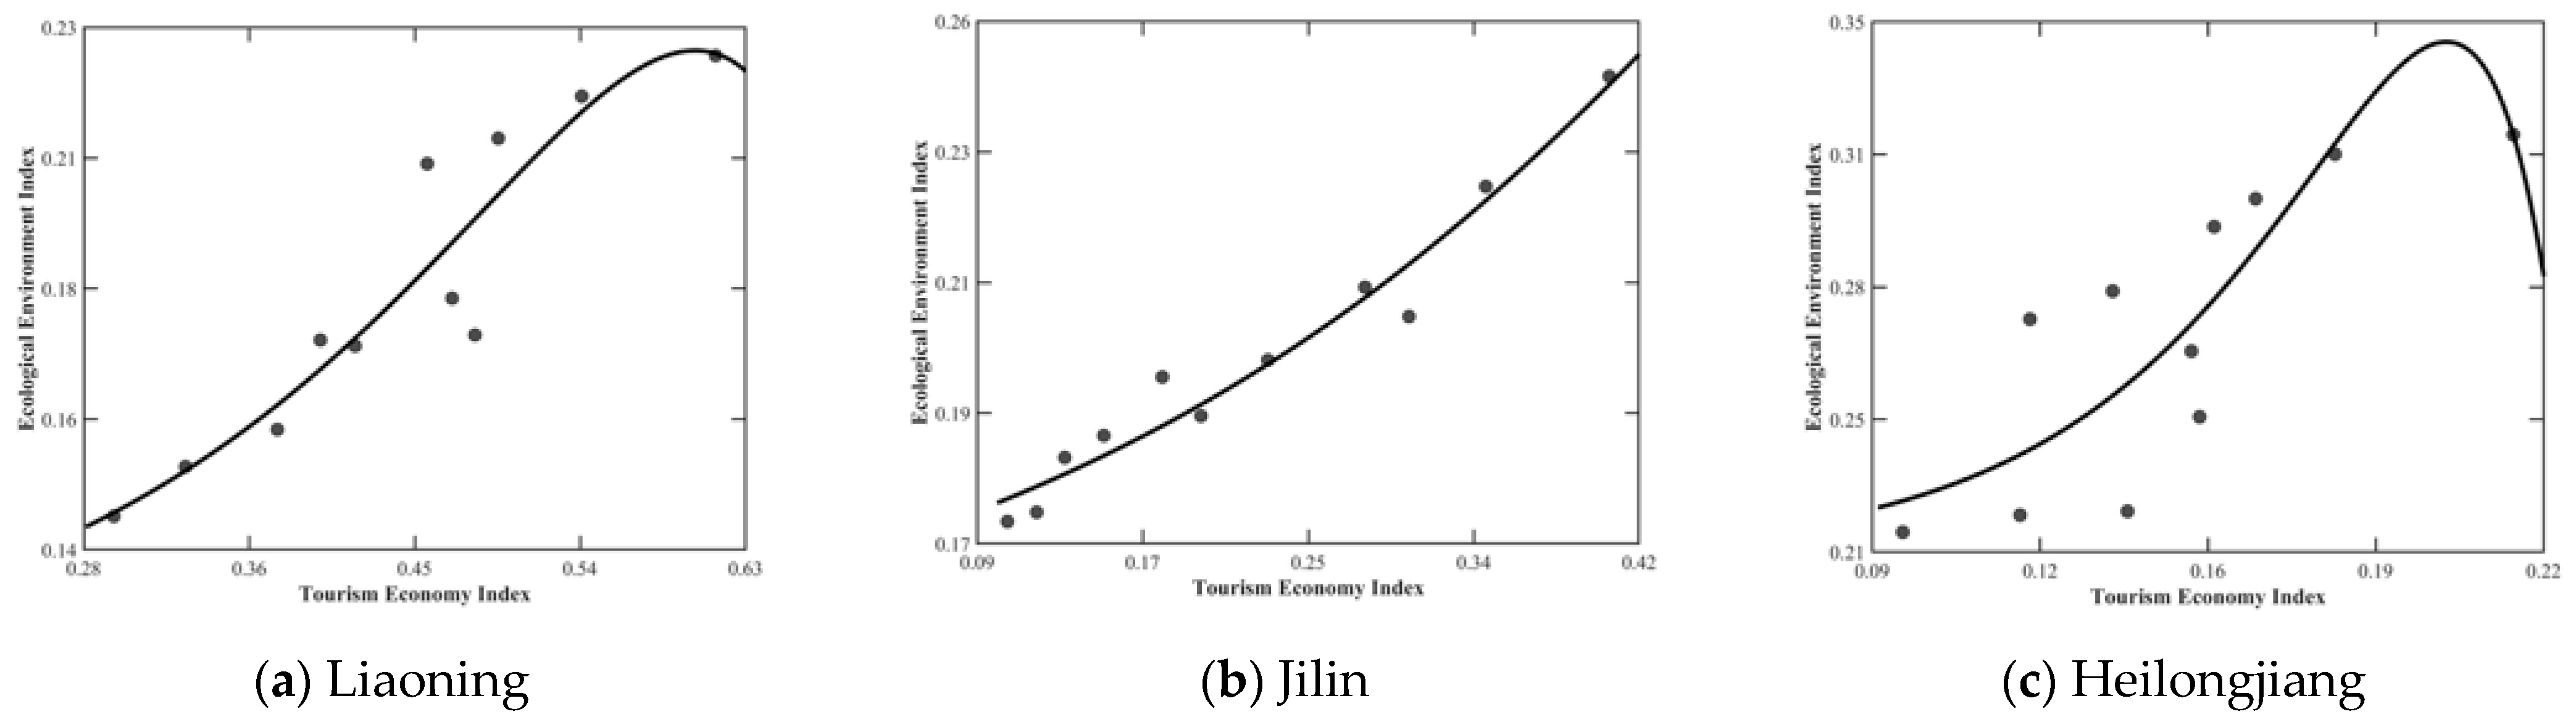
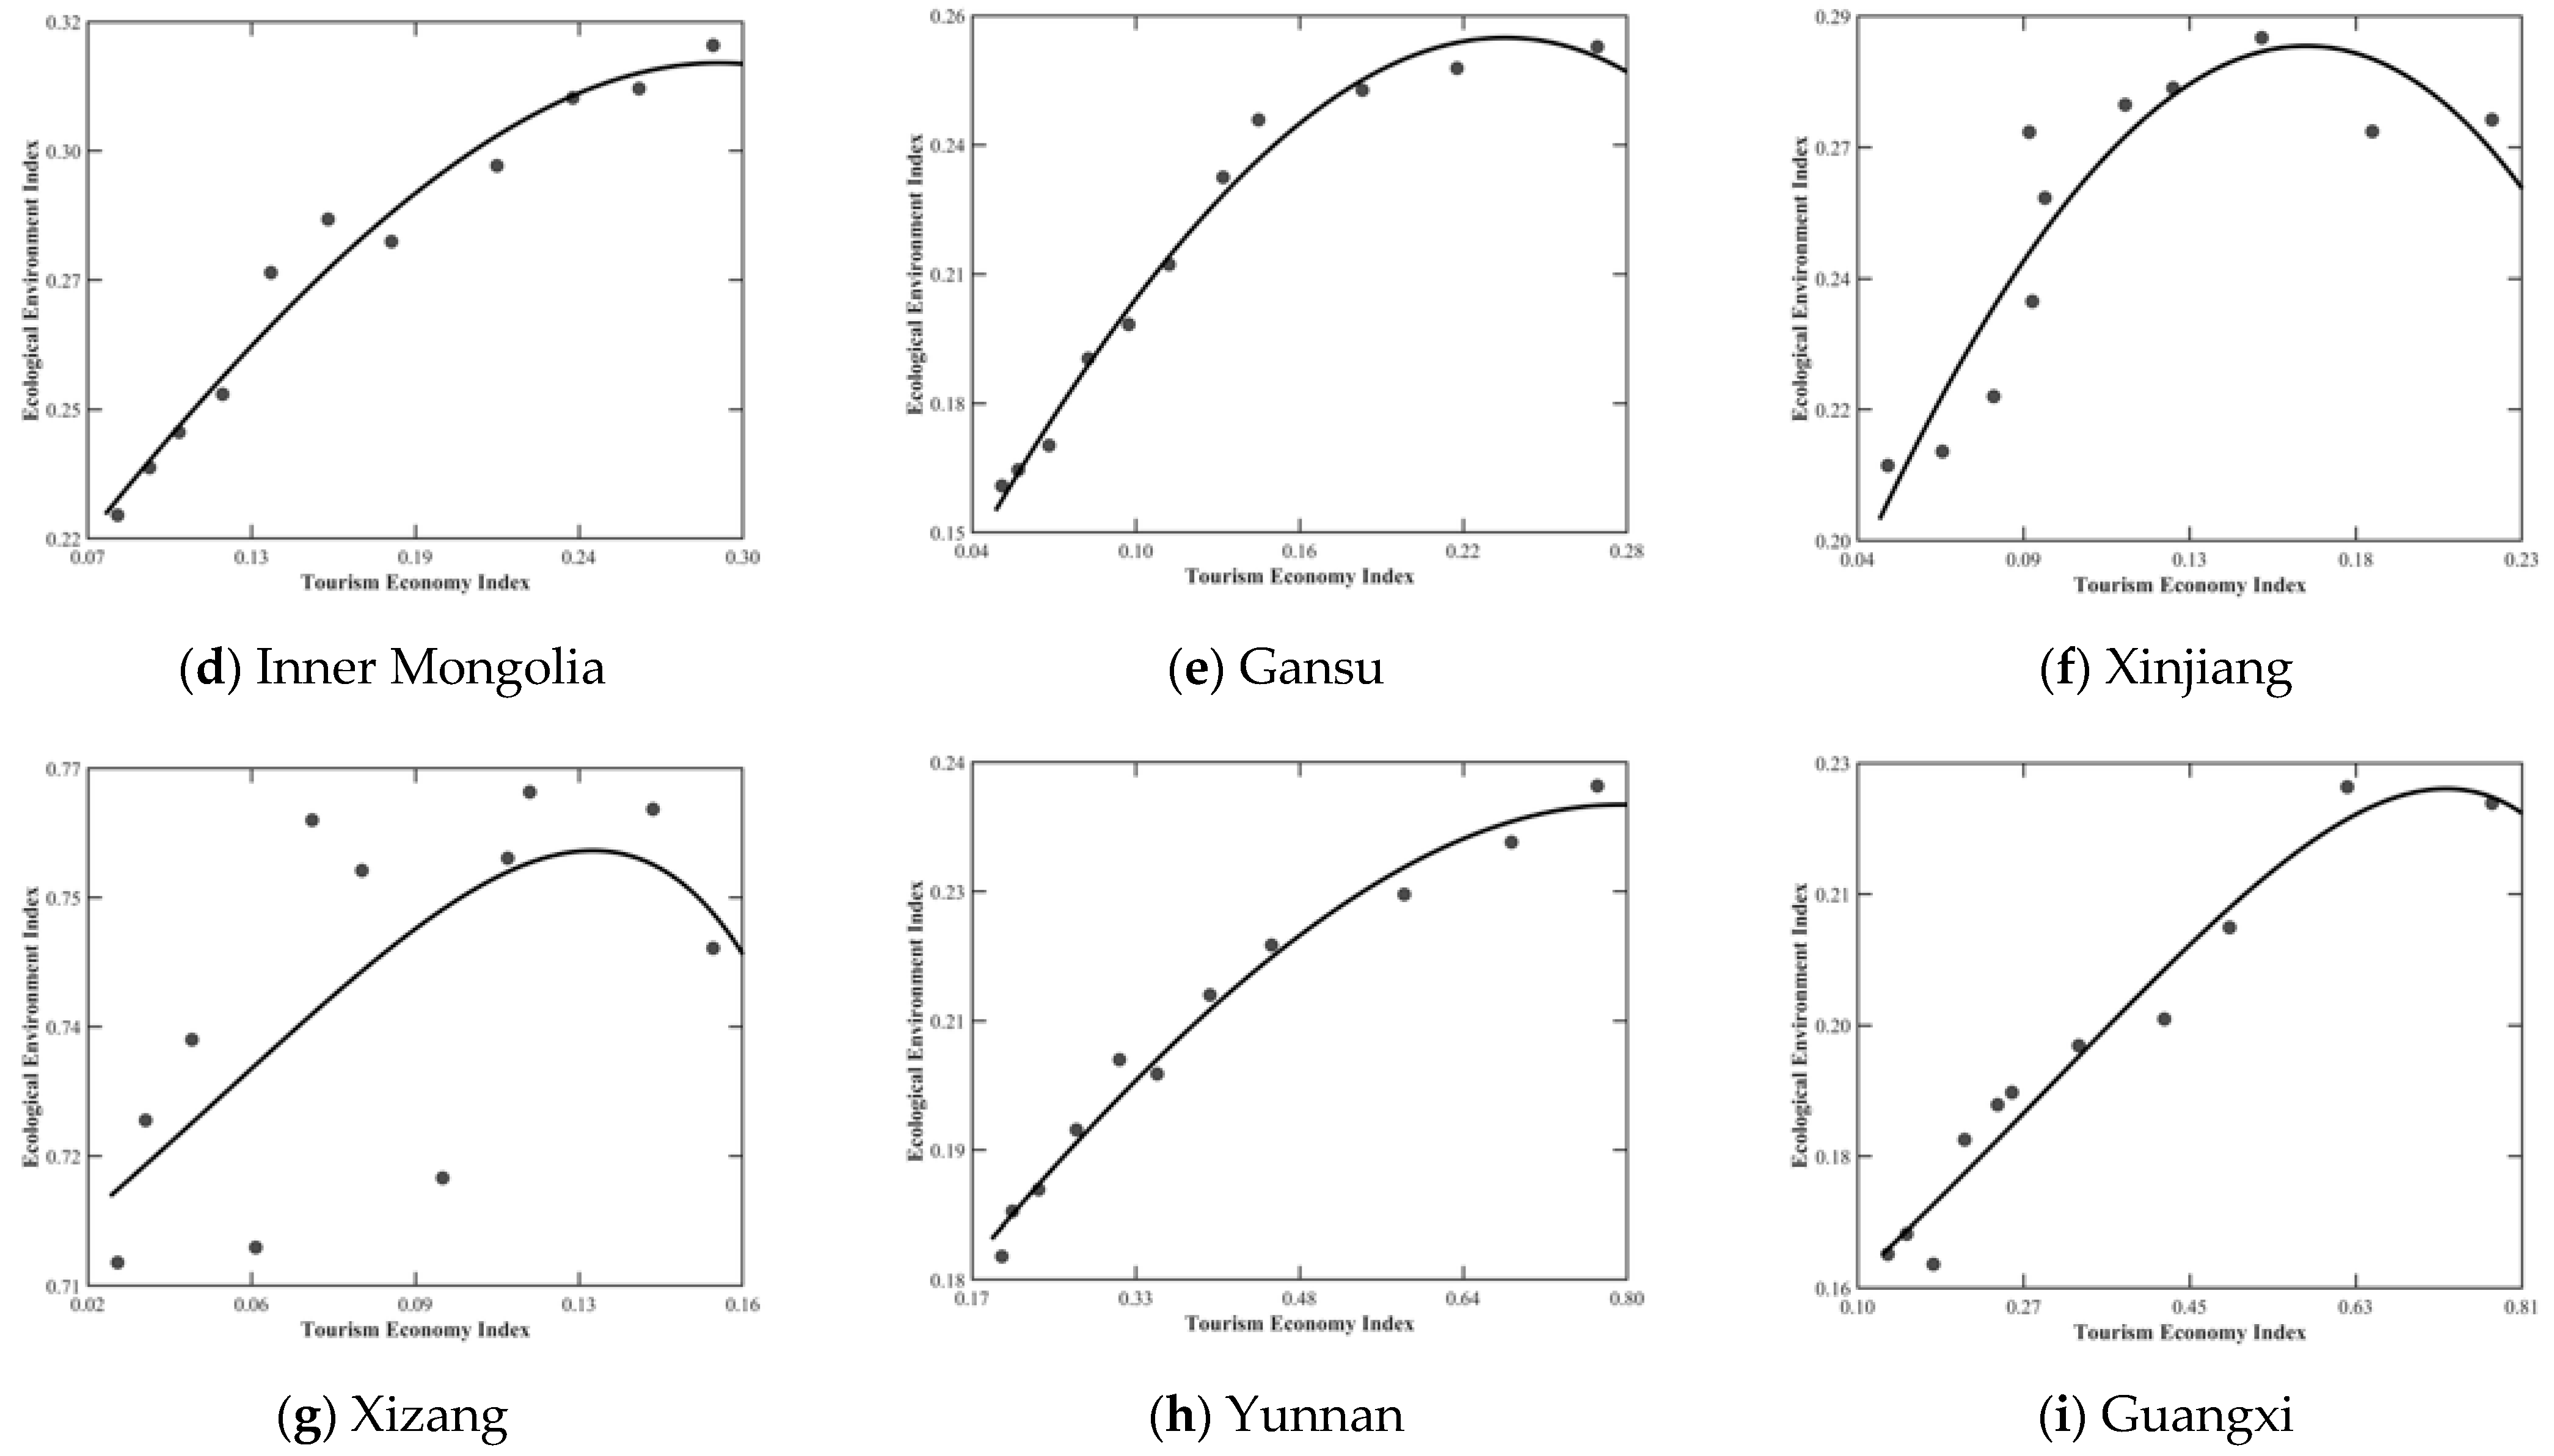
Based on the interactive coercion model, curve fitting was performed for the tourism economy and ecological environment in China’s border provinces over the study period, yielding the double exponential function equations (
Table 3) and their fitting curves (
Figure 6). The parameter m represents the ecological environment level corresponding to the turning point of the curve, indicating the ecological environment index at which the coercion relationship shifts from strong to weak. The values of m, from largest to smallest, were Xizang > Heilongjiang > Jilin > Inner Mongolia > Xinjiang > Gansu > Yunnan > Guangxi > Liaoning, indicating that ecologically fragile regions may bear greater pressure of ecological degradation when the turning point occurs. For example, Xizang’s ecological environment index was higher than that of other provinces, mainly due to lower socioeconomic activity, which does not conflict with its ecological fragility. The relatively high m value of Xizang suggests that unreasonable future tourism development could severely damage its fragile ecological environment when the turning point is reached. In contrast, Liaoning, Guangxi, Yunnan, and other regions started their tourism industries earlier, and the interactive relationship between tourism and ecology has been continuously improving during development, making the ecological environment more adaptive to tourism activities. Hence, their m values were lower. The parameter n represents the response speed of the ecological environment to changes in the tourism economy, indicating the change in the ecological environment index when the tourism economy index changes by one unit. The values of n, from largest to smallest, were Xinjiang > Gansu > Yunnan > Inner Mongolia > Jilin > Heilongjiang > Xizang > Guangxi > Liaoning, indicating that the sensitivity of the ecological environment to tourism development varies across regions. For example, Xinjiang, Gansu, and Xizang are all arid and semi-arid regions, with tourism development in Xinjiang and Gansu having a greater impact on the ecological environment, while the impact in Xizang is relatively small. This may be due to differences in the level of tourism development and environmental carrying capacity across provinces. Xizang has a relatively low level of tourism development compared to Xinjiang and Gansu. In addition, Yunnan has a relatively high n value despite its well-developed tourism industry, which may indicate that tourism development has reached the upper limit of its environmental carrying capacity, and there is an urgent need to optimize the tourism development model to mitigate adverse impacts on the ecological environment. The parameter b represents the tourism economy level corresponding to the turning point, indicating the tourism economy index at which the coercion relationship shifts from strong to weak. The values of b, from largest to smallest, were Yunnan > Guangxi > Jilin > Liaoning > Xinjiang > Gansu > Heilongjiang > Xizang > Inner Mongolia, indicating that the timing of the turning point is related to the level of tourism development. Among them, Yunnan, Guangxi, Jilin, and Liaoning had relatively high b values, and all are provinces whose average tourism economy index during the study period was in the medium-high-value zone or above, suggesting that provinces with a stronger tourism economy base typically need to reach a higher stage of development before achieving systematic improvement in the ecological environment. In contrast, provinces with lower b values have experienced ecological constraints at an early stage of tourism development. They need to draw on the development experience of other provinces to dynamically adjust the relationship with the ecological environment during tourism development, and explore a sustainable development path that coordinates the tourism economy and ecological environment.
According to
Figure 6, the majority of provincial fitting curves exhibited a significant “inverted U-shaped” feature. Additionally, as indicated in
Table 4, the R
2 values show that the curve fitting is quite high, indicating that the interactive coercion relationship between the tourism economy and ecological environment in China’s border provinces follows an evolutionary trend of “stress first, then coordination”, with significant spatial heterogeneity. This suggests that optimizing the interactive coercion relationship requires adapting to local conditions. Among them, Jilin did not present a complete “inverted U-shaped” curve, yet its R
2 value was relatively high, indicating that within the observed range of coordinates, the coercive effect of the tourism economy on the ecological environment remains dominant, meaning that the curve is still located to the left of the turning point. Xizang had a low R
2 value because its ecological environment index ranked the highest while its tourism economy index ranked the lowest, representing an extreme case of “high ecological endowment and low tourism development intensity”. Consequently, the interactive coercion relationship between tourism and ecology is not significant at this stage. Heilongjiang’s low R
2 value is due to its relatively weak tourism economy base and high fluctuations in the ecological environment. Overall, before the tourism economy reaches its inflection point, the ecological environment is accompanied by the development of tourism. Tourism activities exacerbate the consumption of ecological resources and cause ecological damage. The extensive expansion of tourism exerts a negative impact on the ecological environment. After the tourism economy exceeds the inflection point, the adverse impacts of tourism activities on the ecological environment have been met with responses from all parties. The tourism industry contributes to ecological governance and environmental restoration through measures such as tax support, technological innovation, and product optimization, thereby achieving a positive feedback of tourism development on the ecological environment. Specifically, tourism pioneer regions such as Liaoning, Yunnan, and Guangxi should build on their advantageous industrial conditions to achieve green development, promoting transformation of the tourism development model from “scale expansion” to “quality improvement”, thereby achieving a virtuous cycle of synergy between the tourism economy and ecological environment. Tourism-lagging regions such as Jilin, Heilongjiang, and Inner Mongolia should establish ecological access and environmental supervision systems compatible with tourism development, avoiding the extensive development path of “pollution first, then treatment” and pursuing the sustainable development path of “lucid waters and lush mountains are invaluable assets”. For ecologically vulnerable regions such as Xinjiang, Gansu, and Xizang, under the premise of prioritizing protection and strictly adhering to the ecological red line, scientific and reasonable tourism development plans should be formulated to prevent irreversible ecological damage caused by tourism activities.
5.4. Main Obstacle Factors
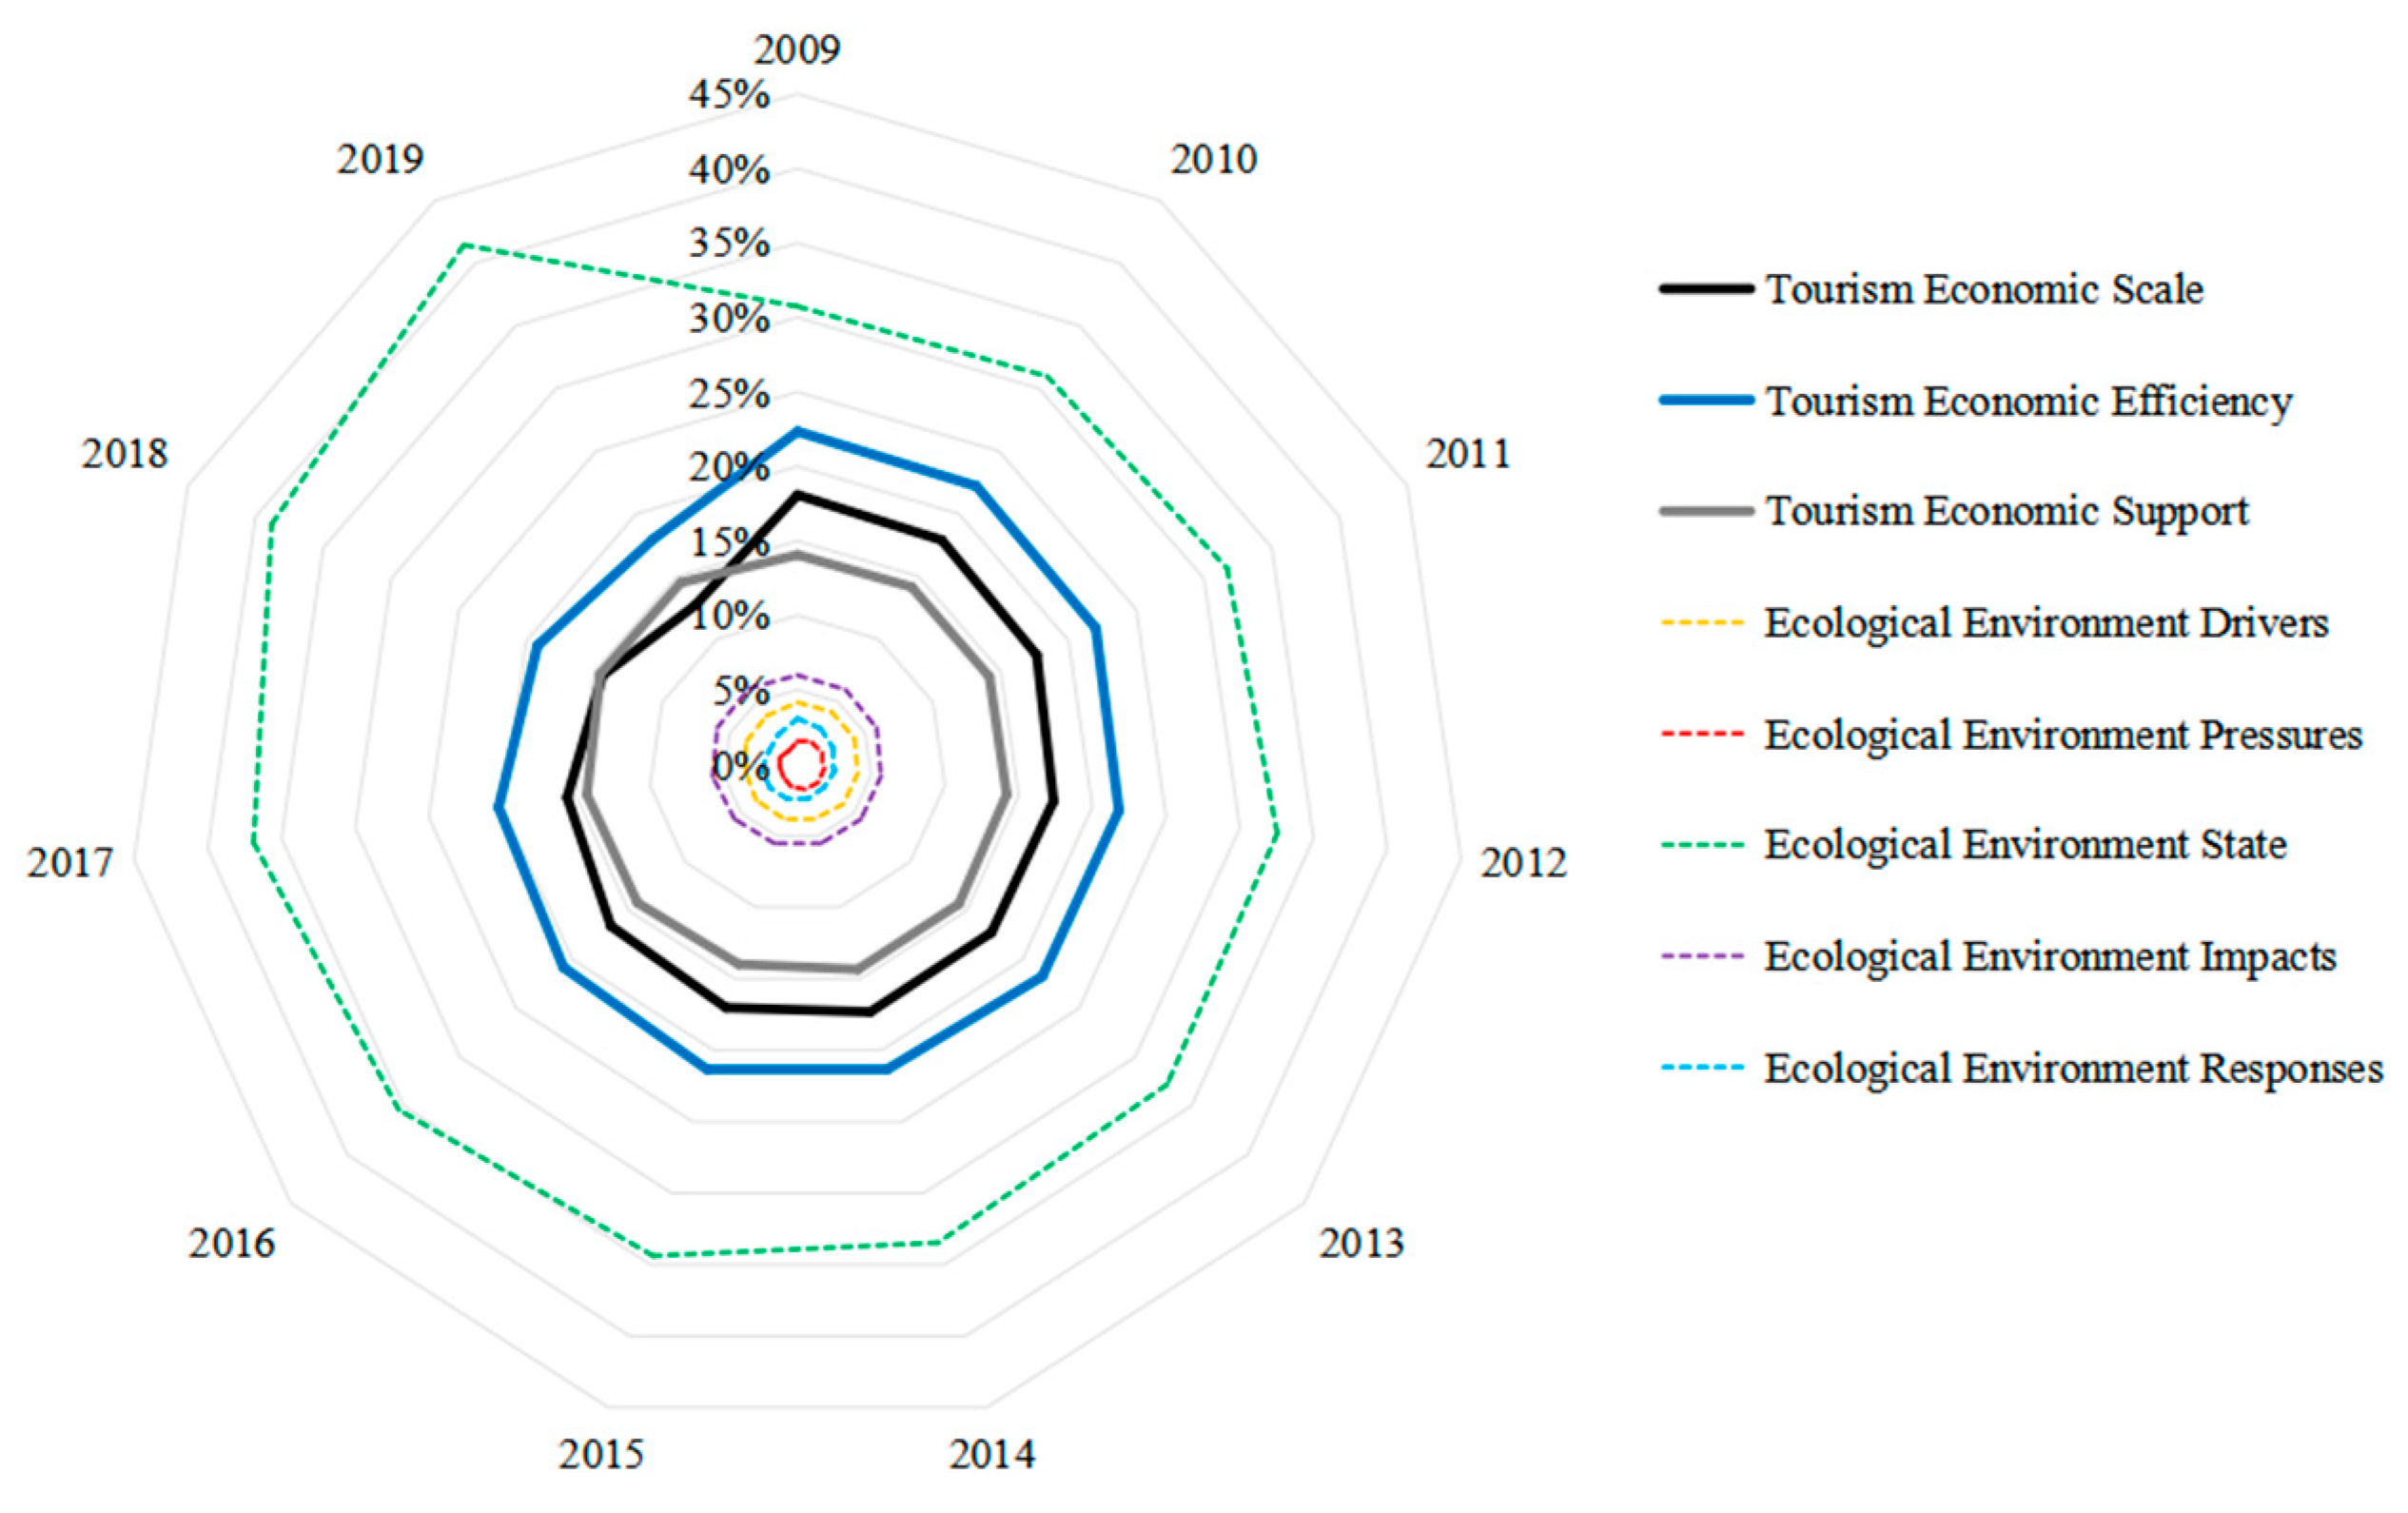
To further explore the factors hindering the coupling coordination between the tourism economy and ecological environment, the obstacle degree was calculated using the obstacle degree model. A radar chart of obstacle factors at the criterion layer (
Figure 7) and a ranking table at the indicator layer (
Table 4) were produced for analysis. The greater the obstacle degree, the stronger the hindrance of that indicator to the coordinated development of the system.
During the study period, the main obstacle factors at the criterion layer affecting the coupling coordination between the systems were the ecological environment state, tourism economic efficiency, and tourism economic scale. In terms of evolutionary trends, the obstacle degree of tourism economic support and ecological environment state continued to rise. Overall, the obstacle degree of ecological environment state was the highest, indicating that the strategic positioning of the national ecological security barrier in border provinces and the policy requirements for advancing ecological civilization construction constitute the essential constraints for border development, providing institutional guarantees for transforming ecological resource advantages into tourism development advantages. The obstacle degree of tourism economic efficiency was the second highest, indicating that the tourism development model in border areas urgently needs optimization, with existing challenges such as the low added value of tourism products, insufficient innovation in tourism business formats, and the attribute of border tourism transit areas, which hinder the full transformation of resource advantages into economic advantages. There is a need to enhance the promoting effect of the tourism economy on ecological environment improvement through tourism supply-side reform. The obstacle degree of tourism economic scale was the third highest, indicating that border provinces are undergoing a transitional stage from “extensive expansion” to “intensive efficiency improvement” and that traditional industrial scale expansion is not conducive to high-quality tourism development. It is necessary to explore a sustainable development path that coordinates tourism and ecology. In the tourism economic system, the obstacle degree of the support layer increased, while the scale and efficiency layers showed phased adjustments, indicating that tourism development in border provinces may be in a painful period of transition from extensive expansion to high-quality and sustainable development. During this period, the driving effect of scale expansion weakens, new industrial momentum is still being cultivated, and there is a need to optimize and improve the support layer in terms of infrastructure, business environment, and service quality, thereby laying a systematic foundation for the recovery of tourism economic scale and efficiency. In the ecological environment system, the obstacle degree of the state layer continued to rise, while the impact layer increased slightly, and the driving, pressure, and response layers decreased, indicating that the ecological environment system has moved beyond the primary stage of pollution control and ecological restoration and entered a critical period for establishing long-term governance mechanisms. The coupling coordination between the tourism economy and ecological environment exhibited phased interactive characteristics during industrial transformation and ecological governance, indicating that the coordinated development of the two is continuously deepening.
The main obstacle factors at the indicator layer for the coupling coordination between the tourism economy and ecological environment in China’s border provinces are generally similar, with particularities observed in Liaoning and Xizang. From an overall perspective, the main obstacle factors in the tourism economy system are the proportion of entry–exit personnel at ports (T15), tourism economic density (T9), and tourist density (T10). This indicates that cross-border tourism convenience is a key constraint on tourism development in border provinces. Efforts should be made to improve border clearance efficiency, innovate tourism business formats, and enrich tourism products to facilitate the transformation of border provinces from cross-border transit areas to border tourism destinations. Tourism economic density and tourist density reflect the pressure exerted by industrial development and tourist activities on the ecological environment of destinations, suggesting that current tourism activities place significant pressure on the environment. Measures such as promoting ecosystem restoration, strengthening environmental pollution control, and advocating low-carbon tourism are needed to mitigate the negative impact of tourism activities on the environment. The main obstacle factors in the ecological environment system are per capita water resource reserves (E14), per capita wetland area (E12), and per capita forest area (E13), indicating that ecological resources and environmental carrying capacity serve as rigid constraints for high-quality tourism development. Tourism economic development must be based on maintaining the state of the ecological environment. Furthermore, the particularity of Liaoning lies in the fact that the main obstacle factors in its tourism economy system are the proportion of entry–exit personnel at ports (T15), domestic tourism revenue (T1), and tourism foreign exchange earnings (T2). This suggests that as a border province with a strong tourism economy, it is difficult to continuously increase the tourism economic benefits and support ecological environment improvement solely through tourist growth, indicating that Liaoning is in a critical stage of transitioning from “flow-driven” to “value-driven” development. It is necessary to increase the marginal benefit per tourist through product upgrading and business format innovation. The particularity of Xizang lies in the fact that the main obstacle factors in its ecological environment system are per capita cultivated land area (E11), proportion of agricultural, forestry, and fishery output value (E16), and per capita income of residents (E18). This is because Xizang’s tourism economy remains at a relatively low level of development, and the impact of tourism activities on the ecological environment is not yet significant. At present, priority should be given to addressing the pressure that traditional agricultural and pastoral activities place on the ecological environment. By moderately developing the tourism industry, it is possible to increase employment opportunities and sources of income, reduce residents’ dependence on traditional production models, and simultaneously raise residents’ income, thereby enhancing the endogenous driving force for regional ecological governance.
6. Discussion
Under the trend of globalization, border areas are transforming from peripheral regions of the country to the forefront of openness. China has land borders that border 14 countries. Their unique spatial location leads to the complex characteristics of the tourism economy and ecological environment in border provinces. Through empirical research, this study provides a Chinese case for systematically understanding the complex relationship between tourism and ecology in border areas. However, this research only focused on domestic border areas within China without discussing the perspective of cross-border cooperation. Under the policy orientation of accelerating high-level opening up, China’s border areas need to coordinate the interactive relationship between tourism development and ecological protection and accelerate the high-quality development of tourism and the construction of ecological barriers. Specifically, in terms of tourism development, China’s border areas are important channels for cross-border tourism and pioneering areas for cross-border tourism cooperation; tourism has strengthened exchanges and cooperation between China and its neighboring countries. In terms of the ecological environment, the existence of borders hinders cross-regional ecological governance, resulting in cross-border ecological security issues [
53]. A cross-border ecological governance mechanism needs to be established. Promoting the coordinated development of tourism and ecology through cross-border cooperation is a hot topic in international research. Relevant studies focus on cross-border ecological governance, border tourism corridors, cross-border national parks, etc. For example, Clark et al. used the U.S.–Mexico border as a case study, and based on political ecology, explored the differences in the attitudes of stakeholders regarding tourism development and ecological restoration under unequal power [
54]; Pankiv et al. used the East Carpathian cross-border biosphere reserve as an example to discuss how to create a cross-border tourism corridor through low-carbon tourism methods such as bicycle riding in Ukraine, Poland, and Slovakia [
55]; Trogisch et al., through research on the Virunga cross-border reserve, found that while ecological resources such as gorillas promote tourism development, they may exacerbate border conflicts and complicate ecological governance [
56]. Relevant studies show that cross-border tourism and ecological governance are greatly influenced by geopolitical factors, bilateral relations, and institutional environment, providing important references for China’s cross-border cooperation research. It is worth noting that in complex international situations, some countries or regions have begun a “re-borderization” process, such as the construction of the U.S.–Mexico border wall [
57]. This trend has an impact on tourism and ecology in border areas that deserves further exploration. At the same time, China actively develops friendly relations with neighboring countries and continuously promotes bilateral cooperation. In this context, how to promote the common development of tourism and ecology through cross-border cooperation, achieve win–win situations with neighboring countries, and propose a “China solution” for geopolitical governance are topics worthy of attention.
7. Conclusions and Policy Implications
7.1. Conclusions
The theoretical contribution of this study lies in systematically revealing the interaction mechanisms and evolutionary pathways of the tourism economy and ecological environment in China’s border provinces. The main conclusions are as follows:
(1) The tourism economic index of the border provinces in China increased rapidly, showing a distribution pattern of “high in the southwest, followed by the northeast, and low in the northwest”. Liaoning, Yunnan, and Guangxi had relatively high levels of development. The ecological environment index fluctuated but rose, showing a distribution pattern of “single-pole leading and convergence among multiple provinces”. Xizang had a relatively good level of ecological environment, while the gaps among the other border provinces were small.
(2) The coupling coordination degree of the tourism economy and ecological environment in China’s border provinces steadily improved, with the growth rate accelerating after 2015. A series of policies on ecological civilization construction promoted the coordinated development of tourism and ecology. In terms of spatial distribution, the coupling coordination degree varied significantly across border provinces, with Liaoning, Yunnan, Xizang, and Guangxi achieving relatively high coordination levels, while Gansu lagged behind.
(3) The relationship between the tourism economy and ecological environment in China’s border provinces exhibits an evolutionary characteristic of “stress first, then coordination”. The tourism economy exerts a significant coercive effect on the ecological environment, and the ecological environment, in turn, imposes constraints on tourism development. Spatially, this relationship shows heterogeneity, and each province needs to adopt appropriate institutional measures to improve the interactive coercion relationship between the two.
(4) The main obstacle factors at the criterion layer for the coupling coordination of the tourism economy and ecological environment in China’s border provinces are the ecological environment state, tourism economic efficiency, and tourism economic scale. Within the system, the obstacle degree of tourism economic support and ecological environment state continued to rise. The main obstacle factors at the indicator layer share commonalities: in the tourism economic system, they are the proportion of entry–exit personnel at ports (T15), tourism economic density (T9), and tourist density (T10); in the ecological environment system, they are per capita water resource reserves (E14), per capita wetland area (E12), and per capita forest area (E13).
7.2. Policy Implications
The practical contribution of this study lies in proposing the following countermeasures and suggestions based on the research findings and the current development status of China’s border provinces to promote the coordinated development of the tourism economy and ecological environment:
(1) Actively promote the transformation and upgrading of the tourism industry to achieve high-quality development: Border provinces should make supply-side structural adjustments based on their own tourism resources. By developing emerging tourism business formats such as ice and snow tourism, ethnic tourism, health and wellness tourism, and food tourism, they can shift away from the “ticket economy” model, in which traditional scenic spots rely solely on ticket revenue as their main source of profit. Through the integration of culture and tourism, provinces can enhance product value and improve the tourist experience. At the same time, they should capitalize on their locational advantages as border regions and use border tourism as a key lever to strengthen their tourism competitiveness. By optimizing the business environment, improving infrastructure, and enhancing tourism destination marketing, provinces can transform from cross-border transit areas into border tourism destinations, thereby forming a differentiated competitive advantage in the domestic tourism market and strengthening the endogenous drivers of tourism economic development.
(2) Improve the long-term governance mechanism for the ecological environment and lay a solid foundation for sustainable development: China’s border provinces encompass important ecological functional areas such as snow-capped mountains, forests, grasslands, lakes, and deserts, with diverse ecological types. It is essential to strictly adhere to ecological protection red lines to ensure that socioeconomic development remains within the carrying capacity of the ecological environment. A multi-stakeholder governance model led by the government and involving public participation should be actively promoted to establish a solid ecological foundation for pursuing the sustainable development path of “lucid waters and lush mountains are invaluable assets”.
(3) Improve the relationship between tourism and ecology according to local conditions and promote their coordinated development: Given the differences in tourism economy and ecological environment levels across provinces, targeted measures should be adopted based on regional development conditions. For ecologically fragile areas, the principle of protection first should be upheld, and scientific planning is needed to prevent tourism activities from causing irreversible and severe impacts on the ecological environment. For regions with high tourism economic value, green industrial transformation should be promoted, and a positive feedback mechanism should be established in which the tourism economy supports ecological restoration, pollution control, and environmental improvement. In addition, exchanges and cooperation among border provinces should be strengthened to learn from advanced tourism development practices in other regions and avoid unsustainable development pathways. By jointly building regional tourism alliances, border road tourism corridors, national parks, and other forms of cooperation, a tourism development community can be formed to promote cross-regional tourism synergy and ecological governance.
7.3. Limitations and Research Prospects
The research limitations and future directions are as follows. (1) Due to data availability constraints in border areas, there remains room for improvement in indicator selection. Additionally, the study period was set from 2009 to 2019 to avoid data disruptions caused by the COVID-19 pandemic. Future research can explore the dynamic changes in the relationship between the tourism economy and ecological environment in the post-pandemic era once data become available, thereby enhancing the timeliness of the research. (2) This study was based on the provincial scale, and while it revealed macro-level patterns in China’s border areas, it did not capture the heterogeneity within provinces at finer spatial scales. Future research could further investigate the coordination between the tourism economy and ecological environment at the municipal, county, and scenic area scales to more deeply uncover the underlying mechanisms of their coordination. (3) Owing to differing statistical standards across countries, this study focused only on China’s border provinces. Future research, when data become accessible, could extend to border regions of neighboring countries to examine differences in the tourism–ecology interaction under varying institutional environments and stages of development, offering a more universal reference for cross-border ecological governance and tourism cooperation.