


Abstract
Landscape visual impact assessment is a key component of environmental impact studies, as it enables the identification and management of negative effects on the territory. Traditional methods are often subjective, rely on expert judgement, and consider limited criteria. To address these limitations, this study proposes a quantitative index based on the integration of grey clustering and Shannon entropy complemented with Geographic Information System (GIS). This approach allows classification under uncertainty and the objective weighting of indicators related to physiographic, biotic, and anthropic factors of visual quality, fragility, and accessibility. The methodology was applied to an open-pit mine in Peru. Results show that terrain modifications, presence of artificial elements, and the alteration of water bodies significantly affect visual quality, while the absence of restoration measures, observer exposure, and vegetation type increase fragility and reduce landscape resilience. The proposed method provides a robust, transparent, and reproducible framework that overcomes subjectivity in traditional approaches, supporting more reliable environmental planning and management.
1. Introduction
Landscape is the spatial and visual expression of the environment, encompassing both natural and cultural aspects. Its perception may vary among social groups and over time [1]. Despite its value as a natural and cultural resource, the landscape is affected by unplanned urban growth and economic activities such as natural resource exploitation, intensive agriculture, and industry [2]. Landscape visual impact assessment has become a key component in environmental impact assessment for investment projects, enabling planners to implement preventive, corrective, and mitigation measures to reduce the negative impacts on the territory. In the mining sector, for example, the impacts generated can significantly affect the landscape due to topography modifications; soil loss, erosion, and contamination; loss of vegetation; and degradation of surface water quality, among others [3].
Traditionally, most methodologies employed for landscape visual impact assessment adopt a qualitative and subjective approach, which may vary depending on the criteria or measurement systems considered by experts. These methodologies include expert-based scoring systems, multicriteria decision-making techniques such as the Analytic Hierarchy Process (AHP), probabilistic approaches, and fuzzy logic models. Although probabilistic methods rely on statistical distributions and are effective when abundant and reliable data are available, their applicability is limited in landscape assessments, which are often characterized by incomplete information and a strong qualitative component. Likewise, AHP and other expert-driven multicriteria methods require pairwise comparisons and weighting schemes that depend on the evaluators’ preferences, experiences, and sociocultural contexts [4]. Nevertheless, from a geosystemic perspective, landscape visual impact assessment allows the identification of territorial elements—such as structure, form, land use, and quality—that do not depend exclusively on individual perception [4]. Consequently, there is a need for the development of a more objective quantitative methodology that integrates well-defined criteria and explicitly accounts for uncertainty in landscape evaluations.
Recent advances in decision-support methods provide pathways to reduce subjectivity in environmental assessments. In particular, grey systems theory offers tools to address problems characterized by limited information or small sample sizes [5], which are common situations in environmental and landscape studies. The grey clustering method, based on grey systems theory, quantifies qualitative information and classifies observations into definable categories (also known as grey classes) using predetermined membership functions (whitening functions) [6]. This approach explicitly incorporates uncertainty into the analysis, allowing each landscape unit or scenario to be assigned a degree of membership in each impact category rather than a single all-or-nothing classification [7]. By employing clear class definitions (i.e., fixed ranges for impact levels) while acknowledging incomplete information through graded membership, grey clustering produces more reliable and reproducible results and reduces the arbitrariness often observed in assessments driven purely by expert judgement.
In parallel, information theory provides an objective approach to determining the relative importance of evaluation criteria through the use of Shannon entropy, a concept introduced by Claude E. Shannon in 1948 to measure information uncertainty [8,9]. Entropy makes it possible to quantify the contrast or diversity among alternatives: a criterion exhibiting greater variability yields a higher entropy value and, consequently, receives greater weight, reflecting its influence on decision outcomes. This entropy weighting method, originally described by Zeleny (1976), eliminates the need for experts to assign weights subjectively, as the weights are derived directly from the data themselves, thereby contributing to more transparent and well-founded decision-making [10].
This study aims to develop an index for the objective assessment of landscape visual impact through an integrated approach that combines grey clustering and Shannon entropy, complemented with Geographic Information System (GIS). The rationale behind this integration lies in the fact that entropy-derived weights assign an objective importance to each criterion, while grey clustering employs these weighted criteria to classify the impact level of each landscape unit, accounting for uncertainty in data distribution. The analysis considers two main dimensions: the effect of change on landscape visual quality and the visual incidence of territorial alterations, the latter determined by visual fragility and accessibility. Hence, the method seeks to reduce the subjectivity and uncertainty inherent in traditional techniques, providing a systematic and transparent classification of impact severity. As a practical application, a mining project in Peru is used as a case study to demonstrate how the proposed methodology produces a robust and replicable index for landscape visual impact assessment, thereby addressing the need for quantitative tools that incorporate well-defined criteria and explicit modelling of uncertainty in landscape management.
2. Literature Review
Landscape visual impact assessment encompasses a wide range of visual and perceptible changes in complex environments, where natural and cultural components interact [11]. Hence, two main dimensions are recognized:
- A.
- Natural factors. The assessment of impacts derived from elements such as landform, water, and vegetation are often complex due to the diversity and interaction of ecological components. Modelling the geographical complexity of the landscape entails inherent risks and uncertainties, particularly in mining contexts where cartography faces technical and methodological limitations [12].
- B.
- Cultural and social factors. These factors are related to the symbolic and social value assigned to a landscape and to the subjective perception held by the population. Perceptions vary according to cultural values and individual experiences, which adds complexity to the assessment and requires consideration of multiple perspectives and evaluators with diverse viewpoints [11].
One of the main challenges lies in subjective considerations. Existing methodologies do not accurately capture the variability of perceptions among different observers, which are strongly influenced by social and geographical contexts [13]. This highlights the need for methods capable of managing uncertainty and reducing reliance on individual judgments in landscape visual impact assessment.
2.1. Methods for Managing Uncertainty in Decision-Making
In the field of modelling certainty or uncertainty management in decision problems, several methods are used, among which the following stand out:
- Probabilistic methods. Based on classical probability theory, they model uncertainty through statistical distributions [14,15]. They perform well when abundant data and well-defined assumptions are available but are less effective in situations with small samples or limited information.
- Fuzzy logic. Introduced by Zadeh (1965), it allows ambiguity and imprecision to be represented through fuzzy sets and membership functions [16]. This framework has been widely applied in environmental and multicriteria assessments, as it enables the integration of expert opinions and linguistic judgments into quantifiable models. However, it requires precise definitions of membership functions and rules, which may introduce new biases or subjectivity.
- Grey systems. Proposed by Ju-Long in 1982 [17], they focus on contexts with incomplete or insufficient information. Unlike probabilistic and fuzzy approaches, grey systems are particularly effective for problems with small samples, providing reliable estimates under high levels of uncertainty [18]. They have been applied to environmental quality assessment (water, soil, air), social conflicts [19], and environmental impact studies [20].
Table 1 summarizes the characteristics, advantages, and limitations of these methods, highlighting the key differences among probabilistic approaches, fuzzy logic, and grey systems.
Table 1.
Comparison of methods for uncertainty management.
2.2. Grey Systems Theory and Its Application in Environmental Studies
Grey systems theory, first formulated by Ju-Long (1982) [17], directly addresses scenarios characterized by limited or incomplete information. A “grey” system is one in which part of the information is known and another part is unknown, in contrast to “white” systems (fully known) or “black” systems (completely unknown). Within this theory, methods such as grey relational analysis, grey prediction, and grey clustering have proven effective for classifying objects or scenarios under uncertainty [22]. Grey clustering, in particular, allows partial membership degrees to be assigned to predefined categories (e.g., impact levels), thereby avoiding rigid classifications and facilitating the representation of intermediate states. This is especially useful in landscape assessments, where a given landscape may simultaneously exhibit characteristics of different impact levels.
Its ability to operate with limited data and to translate qualitative inputs into objective quantitative results represents a significant advantage in environmental management, particularly in contexts where obtaining extensive datasets is costly or unfeasible.
2.3. Shannon Entropy and Objective Weighting of Criteria
On the other hand, information theory, developed by Claude Shannon, studies various aspects, including the measurement of information. Shannon introduced the concept of entropy in the field of information theory as a parameter that quantifies the uncertainty associated with a source of information [23]. In relation to this, the following points stand out: (a) Shannon’s Entropy is used to measure the degree of spatial concentration or dispersion according to the defined evaluation criteria or groups, which allows calculating objective weights according to the characteristics of each criterion and established group; (b) The application of Shannon’s entropy in conjunction with the grey systems methodology allows us to reduce the uncertainty associated with landscape evaluations by considering the distribution of the data within the defined classes [24].
The underlying principle is that a criterion with high variability provides more discriminatory information and therefore receives greater weight within the multicriteria decision-making and aggregation process, whereas a more homogeneous criterion contributes less information and is assigned a lower weight [10]. Furthermore, by deriving weights directly from data variability, this technique eliminates the need to rely exclusively on expert judgement for assigning weights, thereby reducing bias and increasing the objectivity of the models [24].
2.4. Integrated Approach
In recent years, the combination of methodologies has emerged as a promising strategy to overcome the individual limitations of each technique. Hybrid methods aim to simultaneously reduce subjective bias and manage uncertainty. Examples of integration include fuzzy logic with multicriteria methods (AHP, TOPSIS) [25] or the use of Delphi in conjunction with AHP to incorporate expert judgments [26]. Nevertheless, these combinations still rely heavily on expert involvement, which may introduce potential inconsistencies.
The integration of grey clustering with entropy weighting represents an innovative advancement, as it combines two frameworks specifically designed to address uncertainty and limited information. This approach has proven effective in contexts such as environmental conflict management [20] and mine safety assessment [27], where it enabled robust scenario classification and the derivation of objective weights without relying exclusively on experts.
Previous applications of the integrated approach have been reported by Delgado et al. (2022), where the methodology was employed exclusively to assess the intrinsic visual quality of the landscape of a mining project located in Cajamarca, Peru [28]. However, the present study significantly expands this framework by developing a comprehensive Landscape Visual Impact Index that integrates not only visual quality but also visual fragility, accessibility, and the effect of change between pre- and post-project conditions.
Hence, the proposed methodology extends the application of the integrated grey–Shannon model beyond the assessment of visual quality, offering a holistic framework for evaluating overall landscape visual impact. This broader perspective allows a more complete understanding of how anthropogenic activities affect the visual, structural, and functional components of the territory. Consequently, this study addresses an existing gap in the literature by adapting and applying the integrated grey clustering and entropy weighting approach to the analysis of landscape visual impact in an open-pit mine. The advantages of the proposed methodology lie in its ability to classify complex and heterogeneous data, as well as to quantify uncertainty and diversity in complex systems such as the landscape, providing more robust and reliable results. In this sense, the proposed framework aims to offer a quantitative, transparent, and replicable tool that complements traditional evaluations, which are generally qualitative and dependent on subjective judgments.
Notably, although methodologies combining the grey and Shannon methods already exist, the approach proposed in this study additionally incorporates spatial analysis through GIS, in order to determine the landscape evaluation parameters with greater precision.
3. Methodology
The Landscape Visual Impact Index (LI), proposed in this work, considers two fundamental components: the effect of the change in the visual quality of the landscape (EV) and the visual incidence of the territory (IV), which is a function of the visual fragility of the landscape (FV) and the visual accessibility of the landscape (AV) [29]. Figure 1 shows the components that make up the Landscape Visual Impact Index (LI).
Figure 1.
Components of the Landscape Visual Impact Index.
The components of the Landscape Visual Impact Index are described below:
- (a)
- Landscape Visual Impact Index (LI): A measure that evaluates the degree of alteration or modification that a landscape undergoes, and that can be perceived by observers, caused by anthropogenic or natural activities [30].
- (b)
- Effect of change in the visual quality of the landscape (EV): Indicates the magnitude of the change in the value of the visual quality of the landscape, between two different moments in time, produced by human activities [29].
- (c)
- Visual quality of the landscape (QV): Refers to the quality derived from the inherent characteristics of each study area, based on its biophysical and biological components [29].
- (d)
- Visual incidence of the territory (IV): This is defined as the assimilation and perception of the environment based on the visual absorption capacity of the territory, its degree of restoration, and the visibility of its alterations from defined observation points [29].
- (e)
- Visual fragility of the landscape (FV): This refers to the susceptibility of a landscape to change when a use or action is developed on it and is reflected in its capacity to visually assimilate and absorb these alterations [29].
- (f)
- Visual accessibility (AV): Refers to the visibility of a territory from established observation points [31].
The index proposed is based on the grey clustering method, which divides a series of objects to predetermined classes by means of the grey incidence matrix or the corresponding whitenization functions [32]. Specifically, the Centre Point Triangle Whitenization Weight Functions (CTWFs) procedure was applied [22]. In addition, an evaluation of criteria weights was performed by the weight-entropy method based on Shannon’s entropy theory, which considers the uncertainty and measures the contrast between the analyzed criteria [10]. This method can be used for decision-making related, for example, to assessing water quality [33] or environmental conflict analysis [34]. The scheme of the integrated grey clustering and Shannon entropy model is presented in the following figure.
Figure 1 presents the components of the Landscape Visual Impact Index, while Figure 2 illustrates the integrated grey clustering and Shannon entropy model. Based on these elements, Figure 3 shows the methodology applied in this study to develop the Landscape Visual Impact Index.
Figure 2.
Integrated grey clustering and Shannon entropy model.
Figure 3.
Methodology to determine the Landscape Visual Impact Index.
The proposed framework involves several numerical transformations, including the initial rating of landscape criteria, the definition of grey classes, the calculation of membership degrees through Centre Point Triangular Whitenization Weight Functions (CTWFs), and the aggregation of weighted scores into a final index. To improve the clarity and traceability of these transformations, Table 2 provides a generalized synthesis of the relationships between the numerical domains, methodological stages, and qualitative interpretations used in the Landscape Visual Impact Index. The specific number of grey classes and their corresponding intervals are defined according to the characteristics of each case study and are presented in the following sections.
Table 2.
Summary of numerical scales, grey classes, and qualitative interpretation used in the proposed framework.
The proposed methodology to determine the Landscape Visual Impact Index in the present study is developed according to Figure 3, by means of the following stages.
3.1. Effect of Change in the Visual Quality of the Landscape (EV)
The Ev is calculated by the variation in the visual quality of the landscape (Qv) according to Equation (1).
where Qi(b) y Qi(a) are the objective evaluations before and after project implementation, respectively, which are related to the visual quality of the landscape.
The methodological procedure is summarized in Figure 2 and consists of five sequential steps [7,35]:
Definition 1.
It is assumed that there is a set of “m” study objects, “n” evaluation criteria, and “s” grey classes, according to the sample value xᵢⱼ (i = 1, 2, …, m; j = 1, 2, …, n) [22,36].
Step 1: Centre points
The intervals of the criteria are divided into “s” grey classes, then their central points are obtained for each of them: λ1, λ2, … and λs. The grey classes are expanded in their end directions, adding the grey classes 0 and s+1 with their centre points λ0 and λs+1, respectively. The new sequence of centre points is as follows: λ0, λ1, λ2, …, λs and λs+1. See Figure 4.
Figure 4.
Centre Point Triangle Whitenization Weight Functions (CTWFs).
Step 2: Triangular functions and their values.
The triangular functions are formed from the determined grey classes. For an observed value xᵢⱼ of the kth grey class, k = 1, 2, …, s, and of the jth criterion, j = 1, 2, …, n, the CTWFs are obtained by Equations (2)–(4).
Step 3: Percentage system
A percentage system, in s classes, is defined by the values α1, α2, …, and αs, where α1 = 100/(s + 2), α2 = α1 + (3/2)α1, α3 = α1 + α2, …, αs−1 = α1 + αs−2, and αs = 100 − α1. The results for each evaluated object are calculated using Equation (5).
where fjk(xij) is the CTWF value of the kth grey class of the jth criterion αk is the percentage value of each grey class. The resulting values of are represented in a Z matrix defined by Equation (6).
Step 4: Weight of criteria
The weight of each criterion is determined using Shannon’s weight-entropy method, which consists of the following steps:
Step 4.1: The decision matrix Z = = {zij; i = 1, 2, …, m; j = 1, 2, …, n} is normalized for each criterion Cⱼ (j = 1, 2, …, n). The normalized values Pij are calculated using Equation (7).
Step 4.2: The entropy Hj of each criterion Cj is calculated by Equation (8).
Step 4.3: The degree of divergence divj for each criterion Cj is calculated by Equation (9).
Step 4.4: The entropy weight wj of each criterion Cj is calculated by Equation (10).
where is the entropy weight of criterion.
Step 5: Objective evaluation
The objective evaluation Qᵢ for each object i, i = 1, 2, …, m, is determined by Equation (11).
where is the entropy weight of criterion.
The obtained results of the objective evaluation are expressed in a rating range of [0–4], which is divided into classes with lower limits L1, L2,…, Ls where L1 = 0, L2 = 2[4/(s + 2)], L3 = L2 + 4/(s + 2), …, and Ls = Ls−1 + 4/(s + 2); furthermore, Ls+1 = Ls + 2[4/(s + 2)].
3.2. Visual Incidence of the Territory (Iv)
The visual incidence is determined by the weighted sum of the components that define it according to Equation (12).
where Fv is the visual fragility and Av is the visual accessibility of the landscape.
3.2.1. Visual Fragility of the Landscape (FV)
To determine Fv, steps 1–5 of the integrated model from Figure 2 are applied. Then, the obtained results of the visual fragility (FV) are expressed on a 0–4 scale, similar to that defined in Section 3.1.
3.2.2. Visual Accessibility (AV)
Visual accessibility, based on the determination of visual basins, is defined as the areas visible from observation points. In this analysis, visibility was evaluated as a function of distance and frequency of observation, establishing a critical distance of 3000 m. In addition, observation frequency intervals are defined to determine how many times a point is seen from different observation points, which is referred to as the frequency of observation of visually accessible areas (Fob) (see Table 3) [29]. Finally, the visual accessibility (AV) of the affected area was calculated, in relation to Fob and the critical distance (D) (see Table 4).
Table 3.
Frequency of observation (Fob).
Table 4.
Rating and score of visual accessibility.
It is important to mention that the obtained results of the visual accessibility (AV) are expressed in a rating range of [0–4], which is divided into “s” classes with lower limits L1, L2, …, Ls where L1 = 0, L2 = 2[4/(s + 2)], L3 = L2 + 4/(s + 2), …, and Ls = Ls−1 + 4/(s + 2); furthermore, Ls+1 = Ls + 2[4/(s + 2)].
3.3. Landscape Visual Impact Index (LI)
Finally, the Landscape Visual Impact Index (LI) is calculated, which is obtained from the weighted sum of the effect of change and the visual impact, as shown in Equation (13).
4. Case Study
The landscape evaluation was conducted in an open-pit mine operation covering approximately 84 km2, located at an altitude between 3800 and 4600 m.a.s.l. in the department of Apurimac in Peru (see Figure 5). The study evaluated the landscape visual impact of the project in its area of influence and based on the results identified the criteria most affected by the mining activity.
Figure 5.
Location map of the mining project.
Then, the following definitions are necessary to apply the integrated grey clustering and Shannon entropy model, according to Definition 1.
4.1. Definition of Study Objects
The landscape unit (LU) is the portion of territory identified by its internal coherence and its differences with respect to contiguous units [37]. The delimitation of landscape units is carried out by integrating visual values and homogeneity criteria with respect to biotic and abiotic characteristics [38].
In this study, the landscape units were established as the main objects of analysis. Their delimitation was performed using Geographic Information System (GIS), integrating hydrographic basins and geomorphological features as primary spatial references. The process involved the use of ArcMap 10.8.1 software, applying the Watershed tool to delineate drainage basins from a Digital Elevation Model (DEM). Subsequently, geomorphological units were overlaid to refine the boundaries, ensuring internal homogeneity in both physical structure and visual perception (see Table 5 and Figure 6).
Table 5.
Study objects—landscape units.
Figure 6.
Landscape units of the project area.
The choice of watersheds is justified because they constitute a comprehensive environmental framework that brings together elements relevant to visual assessment, including vegetation cover, water bodies, and relief, which directly influence the visibility and perception of the landscape. Hence, the visual assessment is contextualized within the natural structure of the territory, ensuring that landscape visual impacts are analyzed in a manner consistent with the environmental and visual configuration of the area under study [39].
4.2. Evaluation Criteria
In the case study, four and six evaluation criteria were defined for visual quality and visual fragility of the landscape, respectively. The criteria were evaluated through the methodology of grey clustering and Shannon entropy.
The geospatial evaluation of all the criteria described below was carried out using ArcMap 10.8.1 software. To this end, data from the open-pit mine project and its surrounding landscape were used, including vegetation cover maps, national charts, hydrography, road networks, administrative boundaries, population centres, and digital project information. These data were obtained from official sources such as the Ministry of the Environment, the National Geographic Institute, the Ministry of Transport and Communications, and SENACE, which are Peruvian government institutions with scales ranging from 1:25,000 to 1:500,000, allowing the required geospatial indicators to be extracted.
The 0–4 rating scale was adopted to ensure consistency with established landscape impact assessment frameworks commonly used in mining and landscape studies. This scale provides a clear correspondence between numerical values and qualitative levels of visual quality and impact, has been widely applied in previous studies [29], and facilitates integration with the grey clustering and entropy-based weighting approach used in this study.
4.2.1. Criteria of Visual Quality of the Landscape (QV)
The following criteria are used to assess visual quality.
C1: Visual quality of the relief. Covers the physiographic and geomorphologic characteristics of each LU. The assessment is based on the relief, characterized by the predominant slopes. Hence, it is based on the average slope characteristic of each LU, applying a weighting by relative areas. The evaluation is performed by means of values ranging from 0 to 4, where a lower score indicates flat and gentle relief, while higher scores denote more abrupt and steep relief [29,40,41].
C2: Visual quality of vegetation and land use. Considers factors of physiognomy, vertical structure, chromatic contrast, and stationary change for each type of vegetation or land use present in each LU [42]. Its assessment is based on the assignment of quality scores from 0 to 4 for each type of vegetation and land use identified. These scores are weighted according to their relative area of occupation within each LU, which allows one to obtain an overall quality score [29,40].
C3: Visual quality of water. The assessment is related to the presence or absence of water features and their manifestation in the territory. The evaluation is performed by values ranging from 0 to 4, according to the relative length of streams or the relative area of lentic bodies within each LU [41].
C4: Visual quality of artificial elements. This is a function of the surface area occupied and the degree of integration or discordance of the artificial elements with the landscape. Artificial elements are population centres, communication routes, the area of mining use, mining infrastructure, and waste storage infrastructure, among others. C4 is determined as a rating scale ranging 0–4, using the interpolation of the area occupied by artificial elements. A lower presence of these elements translates into greater naturalness and, consequently, higher intrinsic visual quality [29].
The specific details for the evaluation of these four criteria, including the intervals used and the coefficients applied, are based on the detailed investigations in the works of Alberruche-del Campo et al. (2015) and Aguilera-Fernández et al. (2016) [29,40]. Interested readers are encouraged to consult these works for further information and a deeper understanding of the criteria calculations.
Figure 7 illustrates the analyzed criteria, while Table 6 summarizes the results obtained for the four criteria applied in the visual evaluation of landscape quality before and after the implementation of the mining project.
Figure 7.
Criteria of visual quality of the landscape.
Table 6.
Evaluation criteria—Visual quality.
4.2.2. Criteria of Visual Fragility of the Landscape (FV)
Criteria for the assessment of visual fragility are considered:
F1: Adjacent vegetation and land use. Evaluated for each type of vegetation or land use present in the immediate vicinity of the mining operation. The criterion depends on leafiness and height, as well as vertical structure, chromatic contrast, and seasonal change. For the determination of F1, a rating scale of 0–4 was used, where zero represents less fragility and therefore greater camouflage power, while a value of four indicates greater fragility, that is, less capacity for visual absorption of disturbances [29].
F2: Observer’s position. Observation points are identified as the places from which the landscape visual impacts could be visualized. For the determination of F2, a scoring scale of 0–4 was used, where the highest score is given to those that are located at a height well above (>27°) or well below (<27°) their viewshed. The opposite is the case when the observation points are at the same level, thus presenting a lower score and consequently less visual fragility [43,44].
F3: Mining restoration. Mining restoration is a function of the area restored and the degree of integration of the restored area with the landscape. In the evaluation of F3, a rating scale of 0–4 was used. Hence, a larger restored area will represent a greater capacity for visual absorption and, consequently, less visual fragility [29].
F4: Terrain slope. It is calculated by identifying the average slope characteristic of each LU, followed by the application of a weighting by relative areas. For the determination of F4, a scoring scale of 0–4 was used. It is considered that a steeper terrain slope corresponds to a higher visual fragility due to the exposure of mining activities in the territory [45].
F5: Viewshed shape. Visual fragility is related to the size, compactness, and shape of the viewshed, where a more visible area indicates greater vulnerability. In the F5 assessment, viewsheds are generated from observation points using GIS software (ArcMap 10.8.1). They are assessed by considering shape and compactness using a scoring scale of 0–4. The most fragile viewsheds are those with more visible areas, especially if they are elongated or focused. In contrast, irregular, rounded watersheds with fewer visible areas present less fragility, and offer multidirectional visibility [46].
F6: Orientation/illumination. Three types of exposure are distinguished according to the orientation to light, which present different levels of visual fragility. The most fragile are sunny (south, southeast, and southwest orientation), followed by intermediate (east and west) and shady (north, northeast, and northwest), which are the least fragile. The results of the orientation are obtained from the raster model of the topography of the territory using GIS software and valued according to the orientation of the light in a range of 0–4 [47].
The specific details for the evaluation of these six criteria were adapted from the research detailed in the work of Alberruche-del Campo et al. (2015) [29] and Muñoz-Pedreros (2004) [30]. Figure 8 illustrates the analyzed criteria, while Table 7 summarizes the results obtained for the six criteria applied in the evaluation of visual fragility.
Figure 8.
Criteria of visual fragility of the landscape.
Table 7.
Evaluation criteria—visual fragility.
4.3. Definition of Grey Classes
In the case study, based on the described methodology, six grey classes were determined for the evaluation of visual quality, visual fragility, and accessibility of the landscape. The six grey classes were as follows: S1 = low, S2 = medium–low, S3 = medium, S4 = medium–high, S5 = high, and S6 = very high, which are presented in Table 8.
Table 8.
Definition of grey classes.
The numerical intervals associated with each grey class do not represent uniform metric ranges but correspond to centre point-based membership zones defined through triangular whitenization functions. As a result, interval widths may vary to ensure smooth transitions between adjacent classes and an adequate representation of uncertainty. Furthermore, the qualitative classification focuses on higher impact levels, including a “very high” class to represent critical visual impacts. At the lower end of the scale, the “low” category already represents minimal or negligible alteration, making an additional “very low” class unnecessary for the objectives of landscape impact assessment and management.
Now, the methodology to determine the Landscape Visual Impact Index is applied, according to Figure 3.
5. Results
The methodology used to determine the visual impact assessment index on the landscape is presented below. First, the effect of change in the visual quality of the landscape was calculated, which depends on the visual quality of the landscape. Subsequently, the visual incidence of the territory was analyzed, determined from the visual fragility of the landscape and its visual accessibility.
5.1. Effect of Change in the Visual Quality of the Landscape (Ev)
According to Figure 2, steps 1–5, proposed for the assessment of QV, were performed. The objective assessment was performed for both before and after the mining intervention, in order to determine the EV.
Step 1: First, from Table 8, the centre points of the grey classes were determined: λ1, λ2, λ3, λ4, λ5, and λ6, and the centre points of the two extended grey classes, λ0 and λS+1, were defined (see Table 9).
Table 9.
Central points of the extended grey classes for the evaluation criteria.
Step 2: The values presented in Table 9 were then substituted into Equations (2)–(4) to obtain the CTWFs for the six grey classes. The equations are the same for all criteria; the first, third, and sixth CTWFs for C1 are shown as an example in Equations (14)–(16).
Then, the values from Table 6 were replaced in the equations to calculate the CTWF values for each criterion for each LU. As an example, the results for LU-1, before project implementation, are shown in Table 10.
Table 10.
CTWF values of visual quality for LU-1 before project implementation.
In turn, the CTWF values for all criteria in all LUs, for before and after project implementation, were obtained using the same procedure.
Step 3: For the assessment of visual quality in the case study, a percentage system defined by the values α1, α2, α3, α4, α5, and α6 was used, where α1 = 100/8 = 12.50, α2= α1 + 3/2 α1 = 31.25, α3 = α1 + α2 = 43.75, α4 = α1 + α3 = 56.25, α5 = α1+ α4 = 68.75, and α6 = 87.50, according to the six grey classes established, as shown in Table 11.
Table 11.
Percentage system for the case study.
The results of the CTWF values for visual quality with the application of the percentage system for LU-1, before the project implementation, are presented in Table 12.
Table 12.
Values of the visual quality percentage system for LU-1.
The results obtained will be used to generate the decision matrices ZA1 and ZA2, for before and after project implementation, respectively.
Step 4: The steps for the Shannon entropy calculation were applied. The three evaluation objects and four criteria of the decision matrix ZA1 = {zij; i = 1, 2, 3; j = 1, 2, 3, 4}.
Step 4.1: The decision matrix ZA1 is normalized for each criterion Cj (j = 1, 2, 3, 4). The normalized values Pij are calculated using Equation (7). The results are presented in Table 13.
Table 13.
Normalized values for each criterion of visual quality.
Step 4.2: The entropy Hj of each criterion Cj was calculated by Equation (8). The results are presented in Table 14.
Table 14.
Values of Hj, divj, and wj for each visual quality criterion.
Step 4.3: The degree of divergence divj of the intrinsic information in each criterion Cj is calculated by Equation (9). The results are presented in Table 14.
Step 4.4: The entropy weight wj of each criterion Cj is calculated by Equation (10). The results are presented in Table 14.
The entropy weights reflect that criteria C3 (0.3802) and C4 (0.3871) have the greatest influence on the visual quality assessment, together accounting for more than 76% of the total weighting. Meanwhile, C1 (0.1591) and, above all, C2 (0.0736) contribute less significantly to the assessment.
Step 5: According to the objective evaluation, the visual quality values for the LU, before and after the implementation of the mining project, were obtained by Equation 11, by applying the entropy weights of Table 14. The results are shown in Table 15.
Table 15.
Assessment results of visual quality.
As shown in Figure 9, which was constructed from Table 15, the ratings of the visual quality for each criterion analyzed before and after the project implementation are presented for each landscape unit.
Figure 9.
Visual quality of the landscape in the LUs (a) before the project and (b) after the project.
Before the project, landscape units (LUs) scored high on criteria C3 and C4, indicating high visual quality associated with the presence of water bodies and low presence of artificial elements. Criteria C1 and C2, related to relief and vegetation, scored moderately, reflecting characteristic slopes and predominant vegetation cover, such as Andean scrubland.
After the project, a significant decrease was observed in all criteria, with more pronounced impacts on C3 and C4. The reduction in C3 is related to the loss or modification of water bodies, while the decrease in C4 reflects an increase in anthropogenic areas, such as mining zones, urban areas, and roads, which diminish the naturalness of the landscape. C1 and C2, in contrast, recorded more moderate declines; for example, in LU-1, C2 decreased from 38.962 to 30.275, LU-2 from 39.342 to 35.775, and LU-3 from 40.843 to 27.807. Despite this reduction, C2 remains within the same visual quality category, indicating that the relative visual impact associated with this criterion has not changed significantly.
The effect of change was calculated using Equation (1), and its valuation was determined in relation to the variation intervals shown in Table 16.
Table 16.
Results of the evaluation of the effect of change.
As shown in Table 16, the most affected units were LU-1 and LU-3, whose visual quality decreased from very high to medium–low, while LU-2 showed a lesser deterioration, going from high to medium–high. These results highlight that the preservation of water bodies and the minimal presence of artificial elements are the most determining factors for the visual quality of the landscape in the study area.
Figure 10 provides a graphical representation of the visual quality assessment for the three LUs before and after the implementation of the mining project.
Figure 10.
Visual quality of the landscape for each LU.
Finally, for the subsequent evaluation of the landscape visual impact, the results of the effect of change [29] are expressed on a scale of [0–4] according to Table 17.
Table 17.
Effect of change and its equivalence between percentage values and scores.
The results show that the open-pit mine had a mixed impact on the landscape (see Table 18). LU-3 scored 3.263, classified as “very notable”, reflecting a substantial decrease in visual quality due to the project’s impact. LU-1 showed a similar effect, with a score of 3.210 and the same rating of “very notable.” In contrast, LU-2 obtained a lower score of 2.330, rated as “very significant,” indicating a less severe deterioration in visual quality.
Table 18.
Rating and score of the effect of change.
5.2. Visual Incidence of the Territory (Iv)
The visual incidence of the territory is a function of visual fragility and visual accessibility.
5.2.1. Visual Fragility of the Landscape (FV)
To determine the visual fragility, steps 1–5 of the index described above are applied; the values will be obtained according to the criteria described for fragility.
Step 1: The values for the centre points of each grey class are the same as those determined for the visual quality of the landscape, shown in Table 9.
Step 2: The values in Table 7 were replaced into the six CTWFs, defined by Equations (2)–(4), to obtain their CTWF values for each criterion for each LU. As an example, the results for LU-1 are shown in Table 19.
Table 19.
CTWF values of visual fragility for LU-1.
In turn, the CTWF values for all criteria for the three LUs were obtained through the same procedure.
Step 3: According to the six grey classes, the percentage system shown in Table 11 was established. The results of the visual fragility assessment with the application of the percentage system for LU-1 are presented in Table 20.
Table 20.
Values from the visual fragility percentage system for LU-1.
Step 4: The steps of Shannon’s entropy were applied.
The three objects for evaluation and the six criteria form the decision matrix ZB = {zij; i = 1, 2, 3; j = 1, 2, 3, 4, 5, 6}.
Step 4.1: The decision matrix ZB is normalized for each criterion. The normalized values Pij were calculated using Equation (7). The results are presented in Table 21.
Table 21.
Normalized values for each criterion of visual fragility.
The calculations obtained from steps 4.2 to 4.4 are shown in Table 22.
Table 22.
Values Hj, divj, and wj for each criterion of visual fragility.
Step 5: According to the objective evaluation, visual fragility values for the LUs were obtained by applying the entropy weights from Table 22. The results are shown in Table 23 and Figure 11.
Table 23.
Results of the visual fragility assessment.
Figure 11.
Visual fragility of the landscape in the LUs.
The results indicate that LU-1 and LU-2 have the highest overall visual fragility, with total scores of 55.144 and 54.255, respectively, while LU-3 shows a slightly lower value of 52.846. Criterion F3 (mining restoration) obtained the highest score in all LUs, reflecting that restored areas contribute significantly to reducing visual fragility. In contrast, F2 (observer’s position) and F6 (orientation/illumination) had lower values, indicating that the location of the viewpoint and shade reduce visual vulnerability.
Other criteria show large differences between LUs. For example, F1 (adjacent vegetation and land use) is slightly higher in LU-1 (62.935) and LU-2 (61.350) compared to LU-3 (56.525), suggesting that the vegetation and ground cover of LU-3 provide better camouflage and reduce fragility. F4 (terrain slope) is higher in LU-3 (60.590), indicating greater exposure to mining activities due to steeper slopes, while F5 (viewshed shape) remains relatively constant across all LUs, reflecting similar visibility patterns in the landscape.
Overall, these results highlight that restoration initiatives, vegetation cover, and terrain configuration are the main factors influencing visual fragility in the study area. LU-1 and LU-2 are more vulnerable to visual impacts, while LU-3, despite having steeper slopes, shows slightly lower fragility due to favourable vegetation and terrain characteristics.
To assess visual incidence of the territory, an equivalence is established between the visual fragility values and the scores assigned from 0 to 4 for each rating interval, as shown in Table 24.
Table 24.
Visual fragility rating and its equivalence.
The ratings and scores corresponding to the visual fragility of the landscape for each LU are presented in Table 25.
Table 25.
Rating and score of visual fragility and visual accessibility.
5.2.2. Visual Accessibility (AV)
The visual accessibility of the LU was determined on the basis of the observation points, which in the case studied were population centres and roads. The frequency of observation of the territory was assessed on the basis of the area visible from the observation points selected for each LU. Subsequently, accessibility was determined, taking into account the criteria shown in Table 3 and Table 4, which consider the frequency of observation and a maximum distance of 3000 m (critical distance), which is the distance at which the landscape can be perceived without significantly affecting its sharpness.
The geospatial assessment of visual accessibility was carried out with the software ArcMap 10.8.1. The degree of assimilation and perception of the environment based on the visual absorption capacity of the territory, calculated through visual fragility and visual accessibility, reveals that LU-1 has a medium–high incidence, LU-2 has a high incidence, and LU-3 has a medium incidence.
In summary, the ratings and scores of visual fragility and visual accessibility for each LU are presented in Table 25.
The results indicate that LU-2 and LU-1 showed a very high and medium–high level of visual accessibility, respectively. This means that, from different points within these units, the perception of the open-pit mining area is clear and extensive due to the minimal presence of visual obstructions, as well as favourable topographic characteristics that do not limit the view or geographical arrangement of the area. Nevertheless, despite LU-3 being the landscape unit with the highest number of observation points and the most extensive, covering an area of approximately 186.57 km2, its visual accessibility was determined to be medium.
Finally, visual incidence is calculated using Equation (12) and is rated according to Table 24. The results are shown in Table 26.
Table 26.
Rating and score of visual incidences.
5.3. Landscape Visual Impact Index (LI)
The landscape visual impact is determined with the Landscape Visual Impact Index using Equation (13), derived from the results of the assessments of the effect of change and visual incidence. The corresponding ratings, based on Table 24, are presented in Table 27.
Table 27.
Rating and score of Landscape Visual Impact Index.
The landscape visual impact, evaluated through the Landscape Visual Impact Assessment Index, showed a medium–high rating for LU-2 and a high rating for LU-1 and LU-3. Figure 12 presents the results obtained for the three landscape units, including the effect of change, visual incidence, and the overall visual impact assessment index, reflecting the influence of the project’s mining activities on the territory.
Figure 12.
Landscape visual impact index of the LUs.
6. Discussion
6.1. About the Case Study
The analysis indicated for visual quality of the relief (C1) shows a decrease after the implementation of the project, due to the modifications made to the territory by clearing and earthmoving activities, which coincides with the findings of Alberruche-del Campo et al. [29] and Menegaki [48], who reported comparable effects on relief quality in landscape studies of similar mining projects.
For its part, C2 (vegetation and land use) shows a moderate decrease, mainly associated with the replacement of native vegetation by anthropized areas, which coincides with the evidence presented in the Punta Gorda study, where the conversion of forests and plantations directly influenced visual perception of Aguilera-Fernández et al. (2016) [40]. It also coincides with the findings of Zhang et al. (2022) [49], who indicate that open-pit mining causes a loss of grasslands and natural vegetation, increasing the area used for industrial and mining purposes, which leads to greater fragmentation and a reduction in the visual quality of the landscape.
In relation to C3 (presence of water), the observed decrease reflects the impact on water bodies and streams during mining operations, highlighting the sensitivity of the landscape to interventions near water resources, a phenomenon also described by Aguilera-Fernández et al. (2016) [40] in Punta Gorda, where the visibility and alteration of reservoirs and rivers contributed to the perception of visual impact.
The criterion with the greatest weight was C4 (artificial elements), a result that differs from that found by Alberruche-del Campo et al. (2015) and Aguilera-Fernández et al. (2016) [29,40], who identified vegetation as the most important criterion. This variation can be attributed to differences in the scale of analysis and the weighting method applied. While those authors relied on expert judgement, the present study employed the Shannon entropy method, which enhances objectivity in weight assignment.
Using the entropy weighting method, the criteria for visual quality were ranked as follows: C4, C3, C1, and C2, with C4 being the most highly valued. This outcome further supports the influence of methodological differences—particularly the use of entropy weighting over expert judgement—on the resulting prioritization of criteria.
On the other hand, visual fragility was identified as medium–high in the three units analyzed, with LU-1 being the most susceptible due to the contrast between natural cover and anthropic uses, which increases visual exposure. Factors such as terrain observer’s position (F2), adjacent vegetation and land use (F1) y terrain slope (F4) are critical in increasing fragility. Nevertheless, according to Alberruche-del Campo et al. (2015), the criteria with the greatest weighting in determining visual fragility are mining restoration (F3) and adjacent vegetation and land use (F1) [29].
The absence of restoration measures highlights the landscape’s low capacity to absorb visual impacts, placing the area at high risk of landscape degradation. For their part, Zhang et al. (2022) [49] point out that the implementation of ecological recovery projects reduces landscape fragmentation. In this research, as no restoration measures were applied, visual fragility related to this criterion remained very high, increasing the visual impact on the territory.
In addition, according to Menegaki (2020), much of the literature focuses on describing physical changes in the landscape, such as relief, colour, and coverage [48]. In contrast, this research incorporates the perceptual dimension, considering factors such as the observer’s position, solar orientation, and visual accessibility. This integration enriches the analysis by approaching the way society perceives the transformed landscape and responds directly to the methodological gap pointed out by Menegaki, which demands holistic approaches capable of articulating multiple dimensions of visual impact.
Finally, Dentoni et al. (2020) focus on quantifying visual impact using the Lvi method, which employs digital photographs and image analysis software, and estimates colour contrast [50]. However, in this research, a grey clustering approach is applied that considers physiographic, biotic, and anthropic indicators, weighted according to landscape units. Both methods seek to reduce subjectivity in the assessment, albeit in different ways: Lvi focuses on the mathematical precision of visual perception, while the approach used here integrates the territorial and ecological context. A combination of both methods could improve future assessments, combining the geometric and chromatic rigour of Lvi with the spatial and ecological vision of traditional criteria.
6.2. Methodological Discussion
Currently, many landscape visual impact assessment methodologies rely on subjective evaluation, meaning they largely depend on expert opinion or perceptual judgments without a strong data-driven foundation. Such traditional approaches (e.g., qualitative landscape score sheets or visual impact matrices) often lack concrete data thresholds to classify impact levels. Evaluators may select only a handful of criteria—focusing, for instance, on scenic beauty scores and visibility measures—due to the difficulty of assessing all possible landscape factors. This selective inclusion can lead to uncertain evaluations, as important dimensions may be omitted and results may reflect the evaluator’s perspective more than an objective reality. Moreover, conventional methods are generally applied only in well-studied areas or viewpoints where sufficient information is available, which limits their comprehensiveness. As a result, two landscape visual impact assessments of the same project may differ significantly depending on who conducts them and which criteria are emphasized, undermining confidence in the findings.
The proposed index, based on grey clustering and Shannon entropy, directly addresses these shortcomings by introducing clear thresholds for criteria and an explicit treatment of uncertainty. In this method, each evaluation criterion is defined with a clear extension—that is, a fixed scale or threshold for classification into impact categories (e.g., visual fragility classified as Low/Medium/High according to slope or vegetation cover ranges). At the same time, an “uncertain intention” is acknowledged in the sense of Deng’s grey theory, as it is impossible to capture every nuance of landscape character or every subjective impression within the established criteria. Grey clustering manages this by generating membership percentages for each landscape unit in each predefined impact class, rather than forcing an all-or-nothing assignment. For example, a particular landscape unit may be evaluated as belonging 80% to the “High Impact” category and 20% to the “Moderate Impact” category, based on its indicator values. This contrasts with classical methods that simply label the unit as “High Impact”. By providing degrees of membership, the grey approach preserves information on uncertainty: stakeholders can see whether a unit lies at the boundary between classes or firmly within one. This produces richer and more informative outcomes for decision-makers, avoiding the loss of detail that occurs when only absolute classifications are used [51]. Another advantage of the grey clustering component is its suitability for small samples or limited-data contexts. Even with only a few observation points or a restricted study area, the grey model can still classify cases by extrapolating from the defined whitening functions—something statistical models struggle with due to their reliance on distributive certainty.
Complementing grey clustering, Shannon entropy weighting introduces objectivity into an area where traditional methods are highly subjective. Techniques such as Delphi or AHP assign weights based on expert consensus or pairwise comparisons, effectively assuming the importance of each criterion according to human judgement. By contrast, in our approach, the importance of each criterion is derived directly from the data themselves. The entropy weighting method calculates how much variability each criterion exhibits across the landscape units under study, assigning greater weight to those with higher informational contrast [20]. For instance, if “visual accessibility” (project visibility from key viewpoints) varies widely among different units, it receives a higher weight, reflecting its stronger discriminatory power. Methods such as Delphi and AHP do not account for this data-driven perspective; they require experts to assume or agree that visual accessibility is more important, which may be influenced by their experience or biases. Recent studies highlight this distinction: Abady Ayman et al. (2025) used Delphi to determine weights in a medical evaluation, and Xiao et al. (2025) applied AHP to weight sustainability factors, but both approaches depended on expert input and faced the usual drawbacks of subjectivity and potential inconsistencies [52,53]. By using entropy weights, our method avoids the need for subjective weighting altogether, instead aligning with an objective logic where each criterion “speaks for itself” through its data dispersion. This data-driven weighting is especially valuable in new or controversial domains; for instance, landscape characteristics that experts might underestimate could emerge as significant if their entropy weight is high, thereby challenging preconceived notions.
Thus, the integrated grey clustering and entropy index complemented with Geographic Information System (GIS) offers a significant alternative for landscape visual impact assessment by rigorously considering both uncertainty and objectivity in tandem. In essence, grey clustering manages how to aggregate and classify impacts given uncertain and limited data, while entropy weighting manages how to fairly weight each criterion without bias. This complementary combination substantially reduces subjectivity: one component mitigates subjective bias in weighting, while the other mitigates arbitrariness in classification by allowing partial memberships. Indeed, Zhang et al. (2022) [49] note that incorporating Shannon entropy into analyses can reduce uncertainty in results by accounting for data distribution, and here it does so within the grey system framework. Our results are expressed not only as a single index value but also as a profile of percentage contributions to each impact category, providing both quantitative and qualitative insights into landscape visual impact. This is particularly useful for decision-makers who need to understand the confidence of an assessment—for example, whether a “High Impact” designation is clear or marginal. The method is demonstrably well-suited to scenarios with limited information, fulfilling the original purpose of grey systems theory to address problems that classical methods find intractable. As a minor drawback, a recurring challenge is recognized: grey systems and Shannon entropy techniques are still less widely adopted in practice than, for instance, standard statistical or fuzzy logic methods. This means practitioners may be less familiar with their use, and adoption could be slow without proper guidance or tools [20]. Moreover, setting up the analysis requires defining grey classes (intervals for each category), which introduces a subjective step: class boundaries must be determined by experts or standards, and different choices may slightly affect results [20]. To minimize subjectivity, class boundaries were based on values reported in the literature—such as previously defined levels of visual fragility.
In this study, a percentage-based system was also incorporated to better represent uncertainty in landscape visual impacts. Instead of considering only the highest membership value from the grey clustering outcome for each landscape unit (which would essentially reduce the result to a single class label), all membership values across categories were taken into account. This approach prevents the exclusion of lower membership values that may still convey relevant information about landscape conditions. For example, if a landscape unit is 60% “High Impact” and 40% “Moderate Impact,” our index reflects that mixture, whereas a classical evaluation might simply label it “High Impact” and ignore the moderate aspect. This nuanced reporting is particularly valuable in landscape assessment, where multiple factors interact and a unit may lie at the threshold between two impact categories. It provides a more comprehensive picture and can guide more fine- tuned mitigation strategies, perhaps addressing the factors causing the moderate portion of the impact in addition to those driving it toward high impact.
Assumptions and Limitations
Within the grey clustering and entropy approach, one assumption is that the selected criteria and the defined grey classes are sufficiently representative of the landscape visual impact problem. It is assumed that, by establishing class thresholds (e.g., what constitutes “High” versus “Medium” visual fragility), the spectrum of impact levels can be meaningfully captured. These class boundaries often need to be determined through expert knowledge or regulatory standards, which introduces a subjective element during the configuration phase [20]. If an inappropriate class range is chosen, it could bias the results (although sensitivity analysis can be performed to test the robustness of class definitions). Another assumption in entropy weighting is that data variation implies importance. While generally reasonable, there may be cases where a criterion is uniformly high across all alternatives (low variability, and thus low entropy weight) but is nonetheless fundamentally critical to the impact; such a criterion could be undervalued by pure entropy weighting. In practice, entropy can be combined with a minimum weight or complemented with expert judgement to adjust for this, but, in our study, only entropy weighting was applied in order to maintain objectivity.
In terms of limitations, as noted, the approach is not yet widely adopted in practice than, for instance, standard statistical or fuzzy logic methods. Its relative novelty means that analysts may require training to apply grey clustering correctly, and stakeholders may need guidance to interpret percentage-based impact results. The computational steps—from data normalization, to entropy calculation, to resolving grey membership functions for each class and object—can be tedious to perform manually. This is not a conceptual limitation but rather a practical one; it can be overcome with dedicated software or scripts (in our case, Python 3.10.11 and Microsoft Excel 365 tools were used to efficiently manage the calculations). Another limitation, highlighted by Delgado and Romero (2017), is the need for validation across diverse contexts [20]. Our study demonstrates the method in a mining landscape scenario; applying it to other contexts (urban landscapes, linear infrastructure projects, etc.) would further test its effectiveness and reveal whether adjustments are necessary. Finally, while the grey entropy method reduces subjectivity and uncertainty, it does not eliminate them entirely; instead, it formalizes and quantifies them. Decision-makers should therefore continue to exercise judgement in interpreting the results, particularly if some criteria were excluded (due to lack of data) or if entropy weights are very low for factors considered important (which may indicate an information gap).
In summary, the index developed constitutes a novel methodological contribution by integrating grey clustering and Shannon entropy into landscape visual impact assessment. This combination enables the classification of complex environmental data while assigning objective weights to criteria, thereby reducing the subjectivity inherent in traditional approaches. The method provides a more robust and reliable evaluation in contexts characterized by data scarcity and the interplay of natural and cultural factors, bringing greater rigour and transparency to the process. By reflecting landscape variability in the results, the approach strengthens environmental decision-making, whether by applying stricter mitigation measures in critical areas or by clearly and accurately communicating impact levels to society.
7. Conclusions
This study conducted a landscape visual impact assessment of an open-pit mining landscape through an integrated methodology combining grey clustering and Shannon entropy, complemented with Geographic Information System (GIS). The integration of both methods enabled the development of a quantitative index to assess the extent of landscape alteration caused by project activities. Results showed that the landscape units LU-1 and LU-3 were classified as having a high impact, while the landscape unit LU-2 was rated medium–high, highlighting the heterogeneity of visual disturbance across the territory.
The proposed index proved useful and practical for landscape visual impact assessment, offering several notable advantages over more traditional approaches. Grey systems theory enabled explicit handling of uncertainty and data scarcity, producing stable and informative classifications even with limited samples. Meanwhile, Shannon entropy weighting introduced a higher level of objectivity by deriving criteria of importance from data variability rather than subjective judgement. Consequently, factors such as visual fragility and visual quality were weighted transparently and consistently, enhancing stakeholder confidence and addressing a persistent challenge in landscape assessment: the justification of criterion relevance.
From a decision-making perspective, the methodology developed provides a valuable tool for informed environmental management. The resulting index integrates multiple components, such as changes in visual quality and the visual incidence of territorial alterations, within a unified quantitative framework. In practical applications, it can be incorporated into environmental impact assessments to identify critical areas, design visual mitigation and restoration strategies, and monitor post-project landscape recovery.
Supplementary Materials
The following supporting information can be downloaded at: https://www.mdpi.com/article/10.3390/land15040670/s1, Table S1: Environmental Impact Assessment Index on landscape (T1); Table S2: Environmental Impact Assessment Index on landscape (T2).
Author Contributions
Conceptualization, A.D., A.M., C.L. and J.C.; methodology, A.D., A.M., C.L. and J.C.; validation, A.D.; formal analysis, A.D., A.M., C.L. and J.C.; investigation, A.D., A.M., C.L. and J.C.; data curation, A.M., C.L. and J.C.; writing—original draft preparation, A.M., C.L. and J.C.; writing—review and editing, A.D.; visualization, A.D., A.M., C.L. and J.C.; supervision, A.D.; project administration, A.D. All authors have read and agreed to the published version of the manuscript.
Funding
This research received no external funding.
Data Availability Statement
The original contributions presented in this study are included in the article/Supplementary Material. Further inquiries can be directed to the corresponding author.
Acknowledgments
We would like to express our gratitude to the Research Unit of the Faculty of Environmental Engineering at the National University of Engineering, Lima, Peru for supporting this project through the 2021 Formative Research Projects competition.
Conflicts of Interest
The authors declare no conflicts of interest.
References
- Zhang, Y.; He, J. Understanding the Visual Image of Kailash Sacred Landscape through Geo-Tagged Landscape Photos Mapping. Environ. Chall. 2021, 5, 100360. [Google Scholar] [CrossRef] [Scilit]
- Prodanova, H.; Nedkov, S.; Petrov, G. GIS-Based Modelling of Landscape Patterns in Mountain Areas Using Climate Indices and Regression Analysis. Environ. Model. Softw. 2024, 180, 106160. [Google Scholar] [CrossRef] [Scilit]
- Antonelli, G.; Gerrard, M.; Colangelo, S.; Montedoro, G.; Santise, M.; Lavrysen, L.; Ferroni, M.V. Environmental Law Before the Courts: A US-EU Narrative; Springer International Publishing: Berlin/Heidelberg, Germany, 2023. [Google Scholar]
- Zherdev, N.; Klein, O.; Sconfienza, U.; Gerber, P.; Vladušič, D.; Butler, J.; Pasic, A. A Framework for Enabling Ex-Ante Social Impact Assessment of Project-Based Technological Solutions: The Case of Remote Infrastructure Inspection. In Proceedings of the 2024 19th Conference on Computer Science and Intelligence Systems (FedCSIS), Belgrade, Serbia, 8–11 September 2024; pp. 513–524. [Google Scholar]
- Liu, S. Grey Systems Analysis; Springer Nature: Singapore, 2025. [Google Scholar]
- Kaiyu, Z.; Shanshan, S.; Haojing, W.; Guangxu, H. Reliability Evaluation of Distribution System Based on Grey Correlation Method. In Proceedings of the 2021 6th International Conference on Power and Renewable Energy (ICPRE); IEEE: New York, NY, USA, 2021; pp. 598–601. [Google Scholar]
- Lyu, F.; Zhu, Y. The Evaluation Model of Enterprises’ Digital Transformation Competence Based on the Grey Cluster Method. In Proceedings of the 2021 IEEE International Conference on Industrial Engineering and Engineering Management (IEEM); IEEE: New York, NY, USA, 2021; pp. 533–537. [Google Scholar]
- Zhou, M. A Theory on AI Uncertainty Based on Rademacher Complexity and Shannon Entropy. In Proceedings of 2020 IEEE 3rd International Conference of Safe Production and Informatization, IICSPI; IEEE: New York, NY, USA, 2020; pp. 24–27. [Google Scholar] [CrossRef] [Scilit]
- Hedi, I.; Malic, E.; Sikirica, N.; Musulin, M.; Simag, D.; Filjar, R. An Analysis of GNSS TEC Predictability during a Rapidly Developing Short-Term Geomagnetic Storm Using Shannon Entropy. In Proceedings of the 2022 30th Telecommunications Forum, TELFOR 2022—Proceedings; Institute of Electrical and Electronics Engineers Inc.: New York, NY, USA, 2022. [Google Scholar]
- Zeleny, M. Multiple Criteria Decision Making Kyoto; Springer: Berlin/Heidelberg, Germany, 1976; Volume 123. [Google Scholar]
- Liu, Q.; Li, Y. Design and Application of Landscape Design Space Perception Teaching Based on VR Virtual Environment Technology. In Proceedings of the Proceedings of the 6th IEEE Eurasian Conference on Educational Innovation 2023: Educational Innovations and Emerging Technologies, ECEI 2023; Institute of Electrical and Electronics Engineers Inc.: New York, NY, USA, 2023; pp. 92–95. [Google Scholar]
- Werner, T.; Bebbington, A.; Gregory, G. Assessing Impacts of Mining: Recent Contributions from GIS and Remote Sensing. Extr. Ind. Soc. 2019, 6, 993–1012. [Google Scholar] [CrossRef] [Scilit]
- Delgado, A.; Aliaga, D.; Carlos, C.; Vergaray, L.; Carbajal, C. Artificial Intelligence Model Based on Grey Clustering for Integral Analysis of Industrial Hygiene Risk. Int. J. Adv. Comput. Sci. Appl. 2021, 12, 389–395. [Google Scholar] [CrossRef] [Scilit]
- Augustsson, A.; Filipsson, M.; Öberg, T.; Bergbäck, B. Climate Change—An Uncertainty Factor in Risk Analysis of Contaminated Land. Sci. Total Environ. 2011, 409, 4693–4700. [Google Scholar] [CrossRef] [Scilit]
- Kenari, M.T.; Ozdemir, A.; Heidari, A. Probabilistic Approach to Assess and Minimize the Voltage Violation Risk in Active Distribution Networks. In Proceedings of the 2024 18th International Conference on Probabilistic Methods Applied to Power Systems (PMAPS); IEEE: New York, NY, USA, 2024; pp. 1–5. [Google Scholar]
- Zadeh, L. Fuzzy Sets. Inf. Control 1965, 8, 338–353. [Google Scholar] [CrossRef] [Scilit]
- Ju-Long, D. Control Problems of Grey Systems. Syst. Control Lett. 1982, 1, 288–294. [Google Scholar] [CrossRef] [Scilit]
- Liu, S.; Lin, Y. Grey Systems; Springer: Berlin/Heidelberg, Germany, 2011; Volume 68. [Google Scholar]
- Rios, S.; Delgado, A.; De la Cruz, A. Applying Grey Clustering and Shannon Entropy to Assess Social Impact from Lithium Mining Project. In Proceedings of the 2022 IEEE XXIX International Conference on Electronics, Electrical Engineering and Computing (INTERCON); IEEE: New York, NY, USA, 2022; pp. 1–4. [Google Scholar]
- Delgado, A.; Romero, I. Applying Grey Systems and Shannon Entropy to Social Impact Assessment and Environmental Conflict Analysis. Int. J. Appl. Eng. Res. 2017, 12, 14327–14337. [Google Scholar]
- DeGroot, M.H.; Schervish, M.J. Probability and Statistic, 4th ed.; Addison-Wesley, Ed.; Thang Long University: Hanoi, Vietnam, 2012. [Google Scholar]
- Liu, S.; Lin, C.; Yang, Y. Several Problems Need to Be Studied in Grey System Theory. In Proceedings of the 2017 International Conference on Grey Systems and Intelligent Services (GSIS); IEEE: New York, NY, USA, 2017; pp. 1–4. [Google Scholar]
- Shannon, C. A Mathematical Theory of Communication. Bell Syst. Tech. J. 1948, 27, 379–423. [Google Scholar] [CrossRef] [Scilit]
- Dwivedi, P.P.; Sharma, D.K. Application of Shannon Entropy and CoCoSo Methods in Selection of the Most Appropriate Engineering Sustainability Components. Clean. Mater. 2022, 5, 100118. [Google Scholar] [CrossRef] [Scilit]
- Dao, M.; Nguyen, A.; Nguyen, T.; Pham, H.; Nguyen, D.; Tran, Q.; Dao, H.; Nguyen, D.; Dang, H.; Hens, L. A Hybrid Approach Using Fuzzy AHP-TOPSIS Assessing Environmental Conflicts in the Titan Mining Industry along Central Coast Vietnam. Appl. Sci. 2019, 9, 2930. [Google Scholar] [CrossRef] [Scilit]
- Sang, K.; Fontana, G.L.; Piovan, S.E. Assessing Railway Landscape by AHP Process with GIS: A Study of the Yunnan-Vietnam Railway. Remote Sens. 2022, 14, 603. [Google Scholar] [CrossRef] [Scilit]
- Jiskani, I.M.; Han, S.; Rehman, A.U.; Shahani, N.M.; Tariq, M.; Brohi, M.A. An Integrated Entropy Weight and Grey Clustering Method–Based Evaluation to Improve Safety in Mines. Min. Metall. Explor. 2021, 38, 1773–1787. [Google Scholar] [CrossRef] [Scilit]
- Delgado, A.; Minhuey, Y.; Lino, C.; Culqui, J.; Huamani, E.L. Algorithm Based on Grey Clustering and Shannon Entropy to Assess Landscape Visual Quality. Int. J. Emerg. Technol. Adv. Eng. 2022, 12, 106160. [Google Scholar] [CrossRef] [Scilit]
- Alberruche-del Campo, M.E.; Arranz-González, J.C.; Rodríguez-Gómez, V.; Fernández-Naranjo, F.J.; Rodríguez-Pacheco, R.; Vadillo-Fernández, L. Methodology for the Evaluation of the Residual Impact on Landscape Due to an Opencast Coal Mine in Laciana Valley (Spain). Dyna 2015, 82, 60–69. [Google Scholar] [CrossRef] [Scilit]
- Muñoz-Pedreros, A. La Evaluación Del Paisaje: Una Herramienta de Gestión Ambiental. Rev. Chil. Hist. Nat. 2004, 77, 139–156. [Google Scholar] [CrossRef] [Scilit]
- Franch-Pardo, I.; Cancer-Pomar, L. El Componente Visual En La Cartografía Del Paisaje. Aptitud Paisajística Para La Protección En La Cuenca Del Río Chiquito (Morelia, Michoacán). Investig. Geográficas 2016, 2017, 42–60. [Google Scholar] [CrossRef] [Scilit]
- Shramchenko, A.; Shramchenko, V. Mutual Incidence Matrix of Two Balanced Incomplete Block Designs. J. Comb. Des. 2024, 32, 579–590. [Google Scholar] [CrossRef] [Scilit]
- Delgado, A.; Aguirre, A.; Palomino, E.; Salazar, G. Applying Triangular Whitenization Weight Functions to Assess Water Quality of Main Affluents of Rimac River. In Proceedings of the 2017 Electronic Congress, E-CON UNI; IEEE: New York, NY, USA, 2017; pp. 1–4. [Google Scholar] [CrossRef] [Scilit]
- Delgado, A.; Romero, I. Environmental Conflict Analysis on a Hydrocarbon Exploration Project Using the Shannon Entropy. In Proceedings of the 2017 Electronic Congress, E-CON UNI 2017; Institute of Electrical and Electronics Engineers Inc.: New York, NY, USA, 2017; pp. 1–4. [Google Scholar]
- Huang, W.; Chuai, X.; Rao, Y.; Li, B. Shannon Entropy-Based Seismic Local Correlation Measure and Enhancement. IEEE Geosci. Remote Sens. Lett. 2022, 19, 3000905. [Google Scholar] [CrossRef] [Scilit]
- Zhang, Y.; Ni, J.; Liu, J.; Jian, L. Grey Evaluation Empirical Study Based on Center-Point Triangular Whitenization Weight Function of Jiangsu Province Industrial Technology Innovation Strategy Alliance. Grey Syst. Theory Appl. 2014, 4, 124–136. [Google Scholar] [CrossRef] [Scilit]
- Pallot, M.; Krawczyk, P. Landscaping User Centered Related Methods Applied in the Context of Living Labs. In Proceedings of the 2015 IEEE International Conference on Engineering, Technology and Innovation/International Technology Management Conference (ICE/ITMC); IEEE: New York, NY, USA, 2015; pp. 1–8. [Google Scholar]
- Fu, Y.; Bao, R. Design of GPU Parallel Algorithm for Landscape Index Based on Virtual Reality Technology. In Proceedings of the 2022 International Conference on Knowledge Engineering and Communication Systems (ICKES); IEEE: New York, NY, USA, 2022; pp. 1–4. [Google Scholar]
- Quintero, L.F.O. Cuencas Hidrográficas y Ecología Del Paisaje: Una Guía Conceptual y Metodológica; Universidad Distrital Francisco Jose de Caldas: Bogotá, Colombia, 2021. [Google Scholar]
- Aguilera-Fernández, I.; Batista-Legrá, Y.; Bastola, S.; Rojas-Purón, L. Impacto Visual Generado Por La Explotación Minera En El Yacimiento Punta Gorda, Moa. Minería Y Geol. 2016, 32, 141–159. [Google Scholar]
- Mei, X.; Kunii, Y. The Correlation Between Quantitative Metrics and Subjective Assessment of Sequential and Scene Landscape in Game Ghost of Tsushima. In Proceedings of the 2024 IEEE Gaming, Entertainment, and Media Conference (GEM); IEEE: New York, NY, USA, 2024; pp. 1–6. [Google Scholar]
- Wei, X.; Xin, L.; Mengyuan, T. Analysis and Prospect of Traditional Tibetan Settlement Landscape Knowledge Mapping Based on the Citespace Method. In Proceedings of the 2021 IEEE International Conference on Artificial Intelligence and Computer Applications (ICAICA); IEEE: New York, NY, USA, 2021; pp. 1–8. [Google Scholar]
- Higuchi, T. The Visual and Spatial Structure of Landscape; Gihodo Publishing: Tokyo, Japan, 1975. [Google Scholar]
- Xu, F.; Zhang, W.; Li, H. Landscape Pattern Analysis of Farmland under Different Slope. In Proceedings of the 2013 Second International Conference on Agro-Geoinformatics (Agro-Geoinformatics); IEEE: New York, NY, USA, 2013; pp. 352–355. [Google Scholar]
- Montaya, R.; Padilla, J.; Stanford, C. Valoración de La Calidad y Fragilidad Visual Del Paisaje En El Valle de Zapotitlán de Las Salinas, Puebla (México). Boletín Asoc. Geógrafos Españoles 2003, 35, 123–136. [Google Scholar]
- Wang, Y.; Wang, S.; Wang, X.; Huang, X.; Li, X.; Zhang, X.; Li, Z. Dynamic Visual Landscape Assessment of Disused Railway in Complex Terrain: A Study of Jingmen Railway. IEEE J. Sel. Top Appl. Earth Obs. Remote Sens. 2024, 17, 10877–10892. [Google Scholar] [CrossRef] [Scilit]
- Parrilla, E.; Márquez, J.; Rodríguez, V. Establecimiento de La Fragilidad Visual Del Paisaje Mediante SIG En El Entorno Del P.N. de La Breña y Marismas Del Barbate (Cádiz, España): Aproximación Metodológica; Departamento de Geografía Física y Análisis Geográfico Regional, Universidad de Sevilla: Sevilla, Spain, 2005. [Google Scholar]
- Menegaki, M. Assessing the Visual Impacts of Surface Mining: A Systematic Review a Systematic Review. Acta Innov. 2020, 37, 21–35. [Google Scholar] [CrossRef] [Scilit]
- Zhang, L.; Zhai, Z.; Zhou, Y.; Liu, S.; Wang, L. The Landscape Pattern Evolution of Typical Open-Pit Coal Mines Based on Land Use in Inner Mongolia of China During 20 Years. Sustainability 2022, 14, 9590. [Google Scholar] [CrossRef] [Scilit]
- Dentoni, V.; Grosso, B.; Massacci, G.; Soddu, G.P. Visual Impact Evaluation of Mines and Quarries: The Updated Lvi Method. Environ. Earth Sci. 2020, 79, 100. [Google Scholar] [CrossRef] [Scilit]
- Sacasqui, M. Comparison of Methodologies: Analytical Hierarchy Process and Grey Clustering with Entropy Weight for the Multicriteria Assessment of the Energy Sources of Perú. In Proceedings of the 2018 IEEE PES Transmission & Distribution Conference and Exhibition—Latin America (T&D-LA); IEEE: New York, NY, USA, 2018; pp. 1–5. [Google Scholar]
- Abady Avman, M.; Osmotherly, P.G.; Snodgrass, S.J. Hip Joint Kinematic Assessment in Chronic Non-Specific Low Back Pain Patients. A Delphi Study. Musculoskelet Sci. Pract. 2025, 75, 103215. [Google Scholar] [CrossRef] [Scilit] [PubMed]
- Xiao, H.; Zeng, S.; Peng, Y.; Kou, G. A Simulation Optimization Approach for Weight Valuation in Analytic Hierarchy Process. Eur. J. Oper. Res. 2025, 321, 851–864. [Google Scholar] [CrossRef] [Scilit]
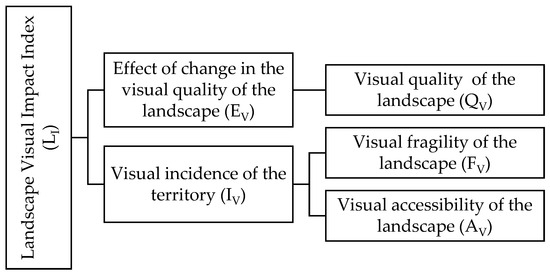
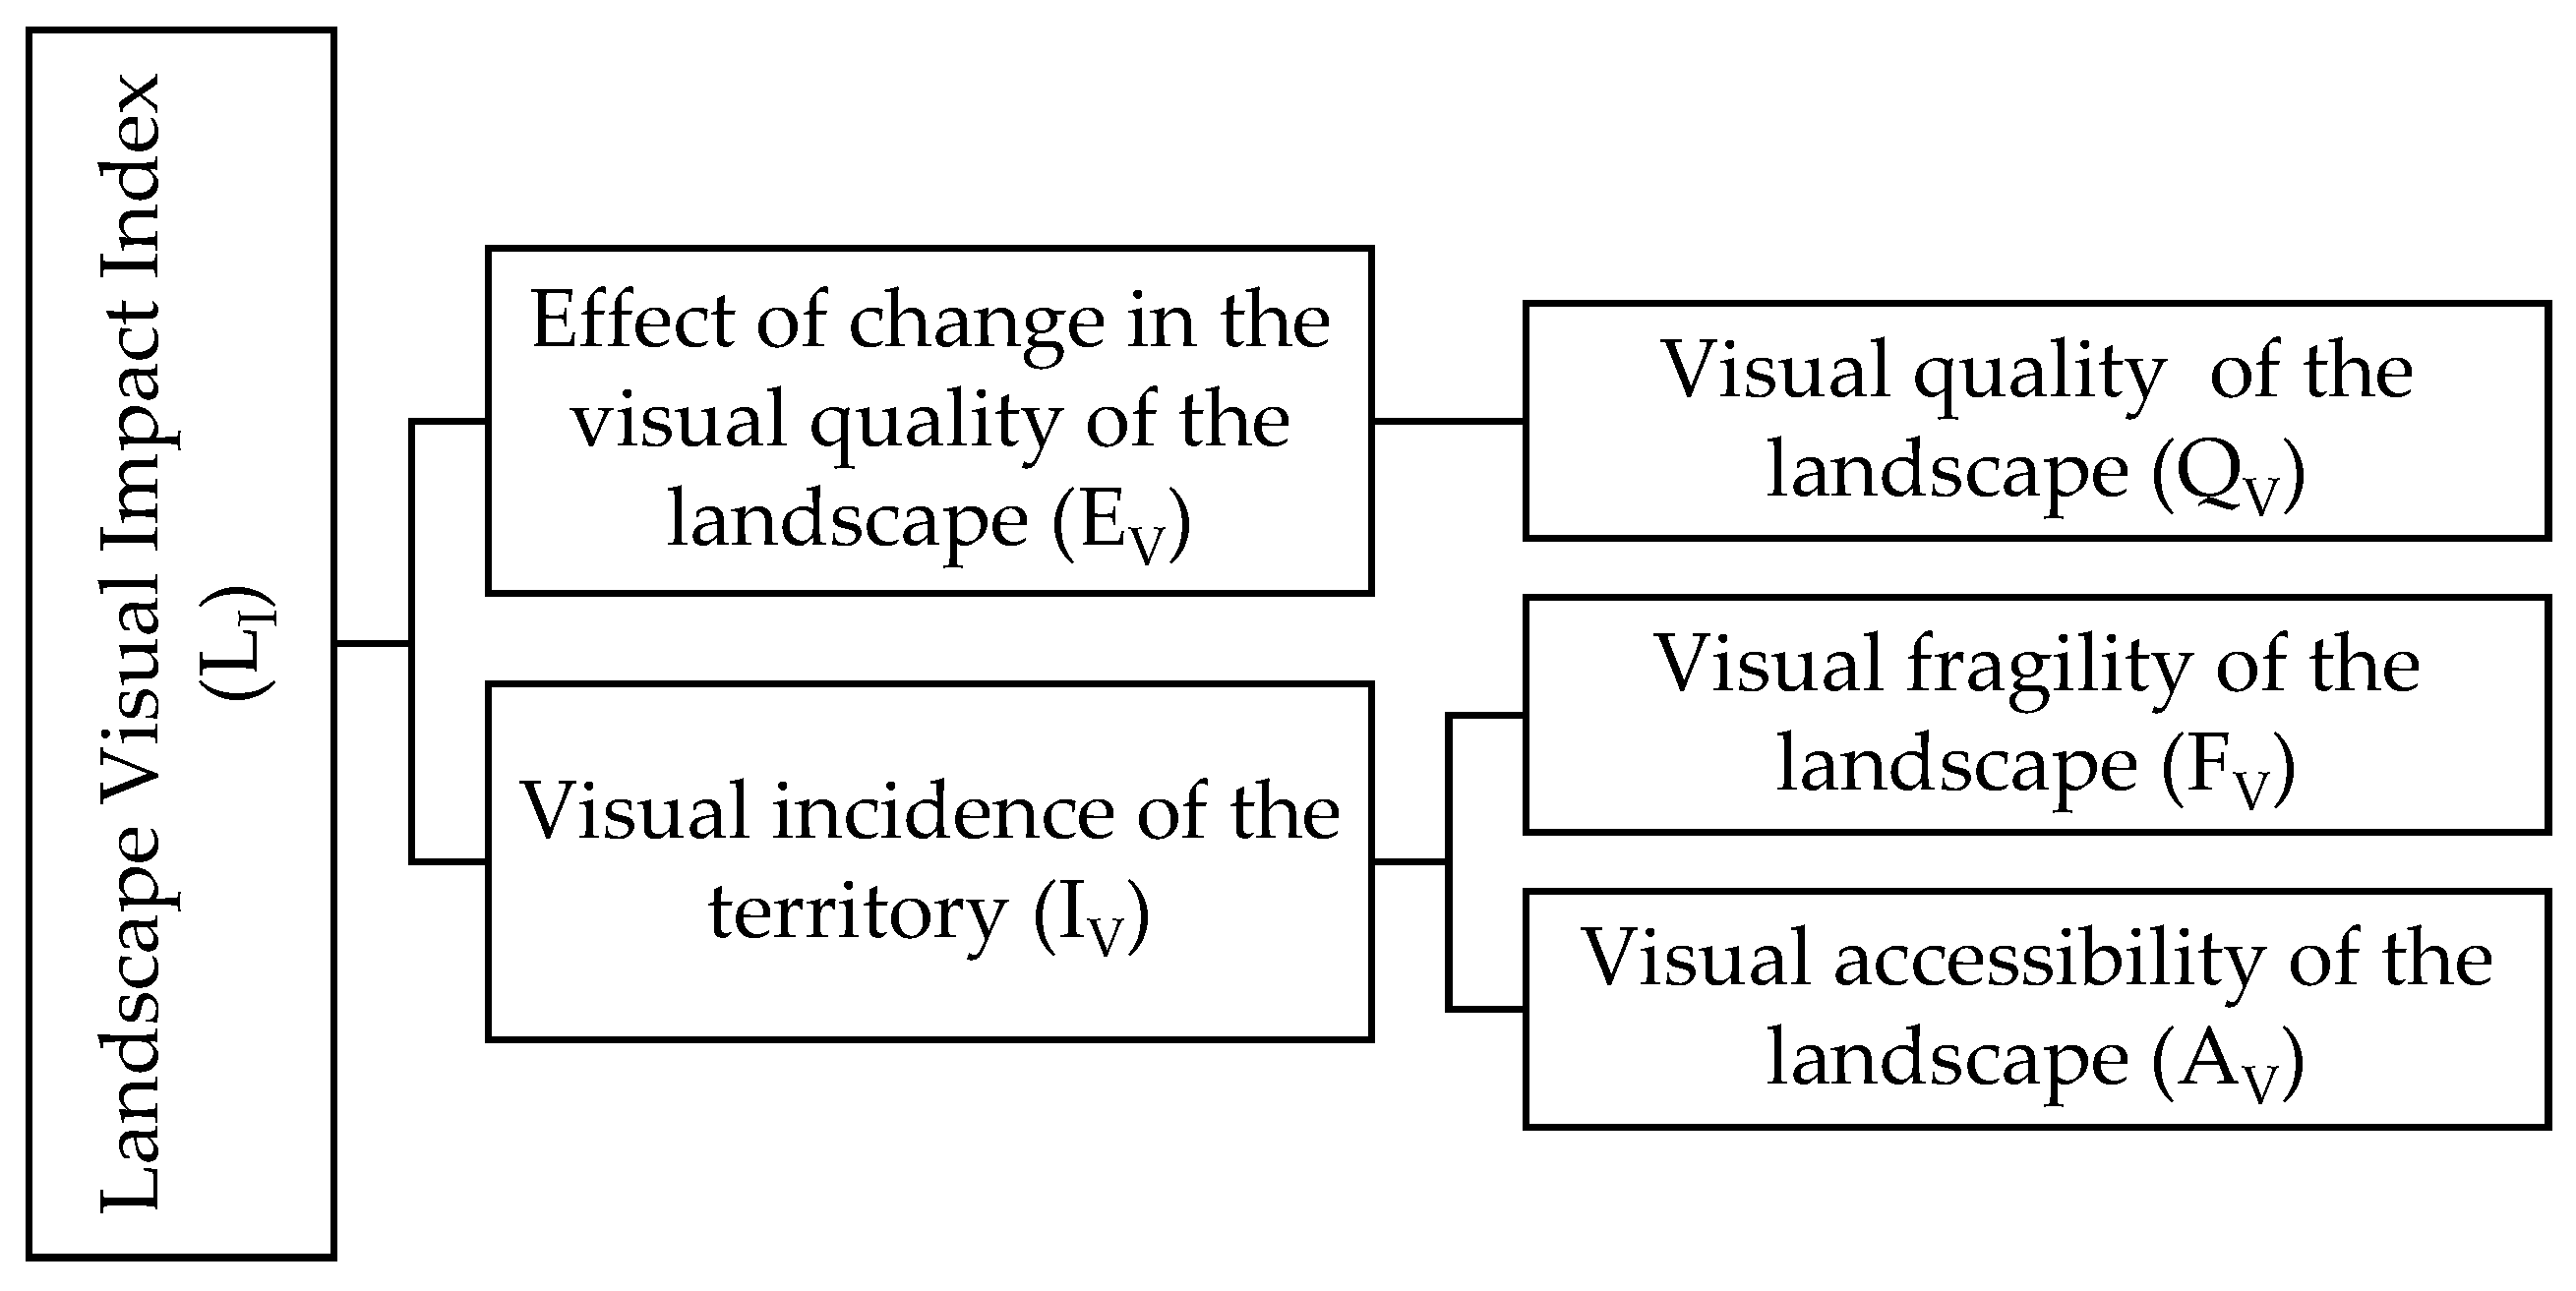
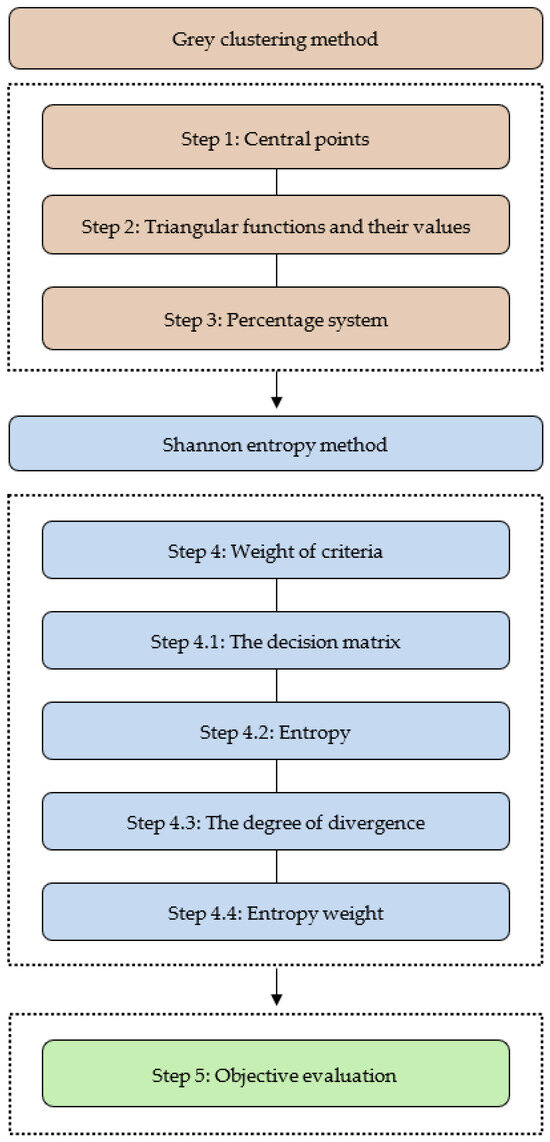
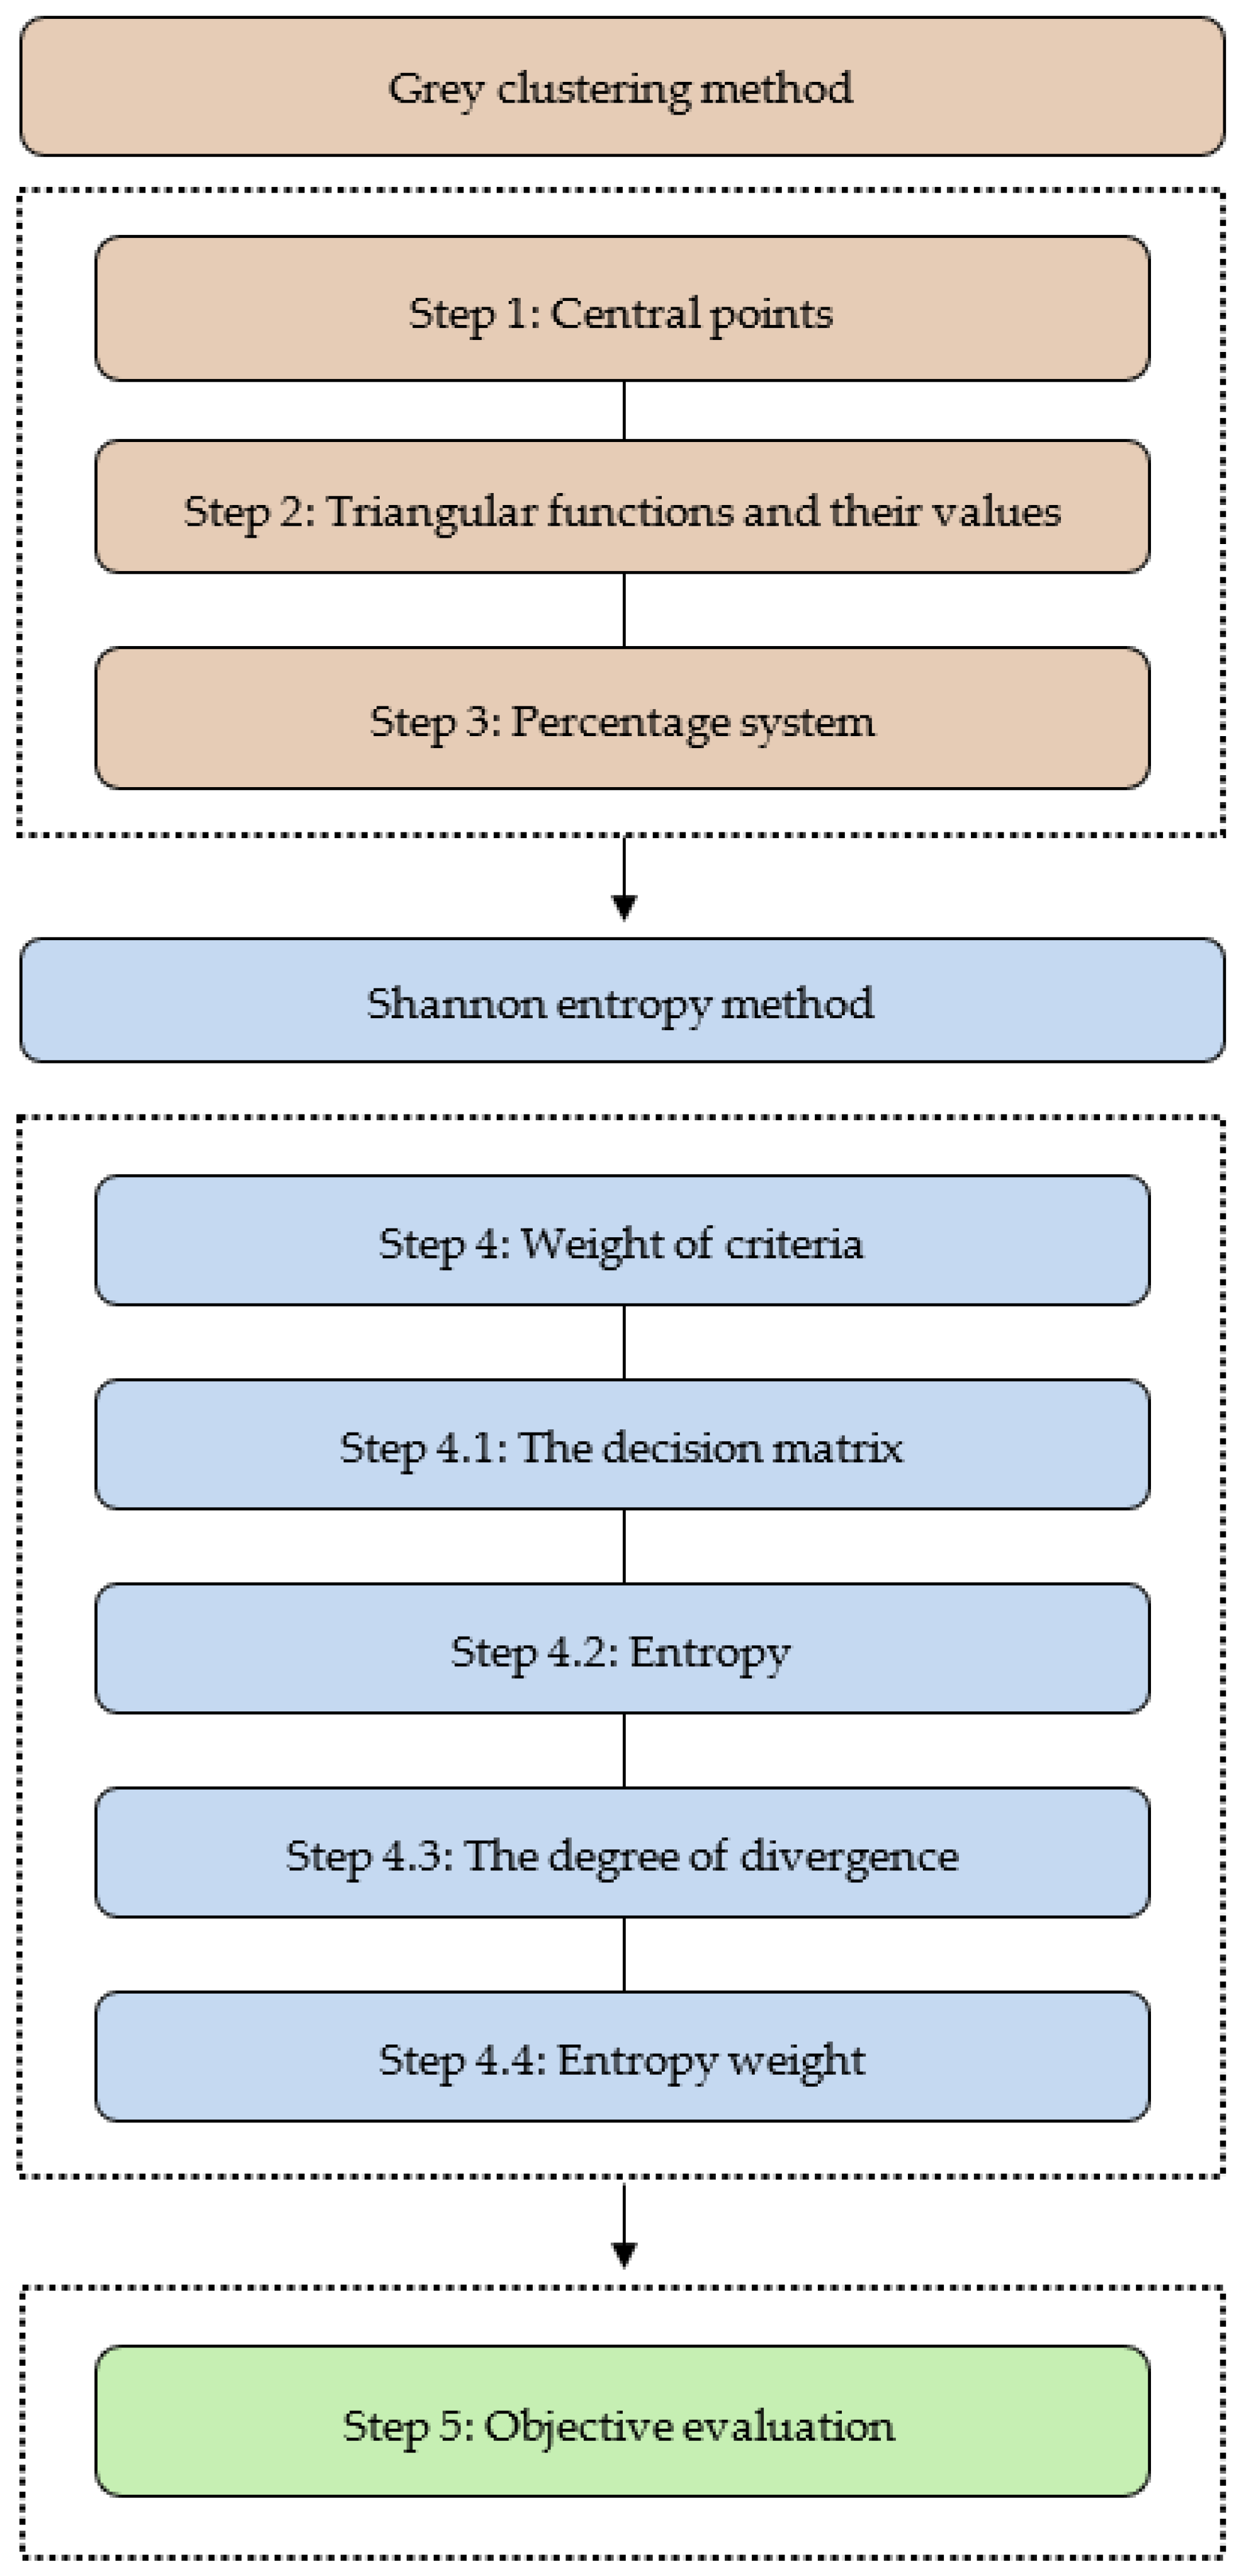
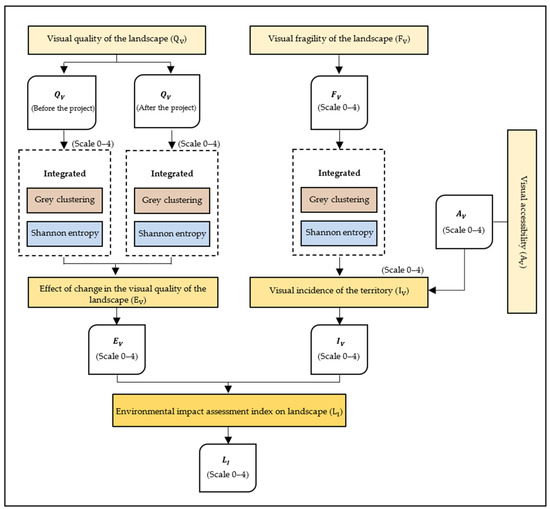
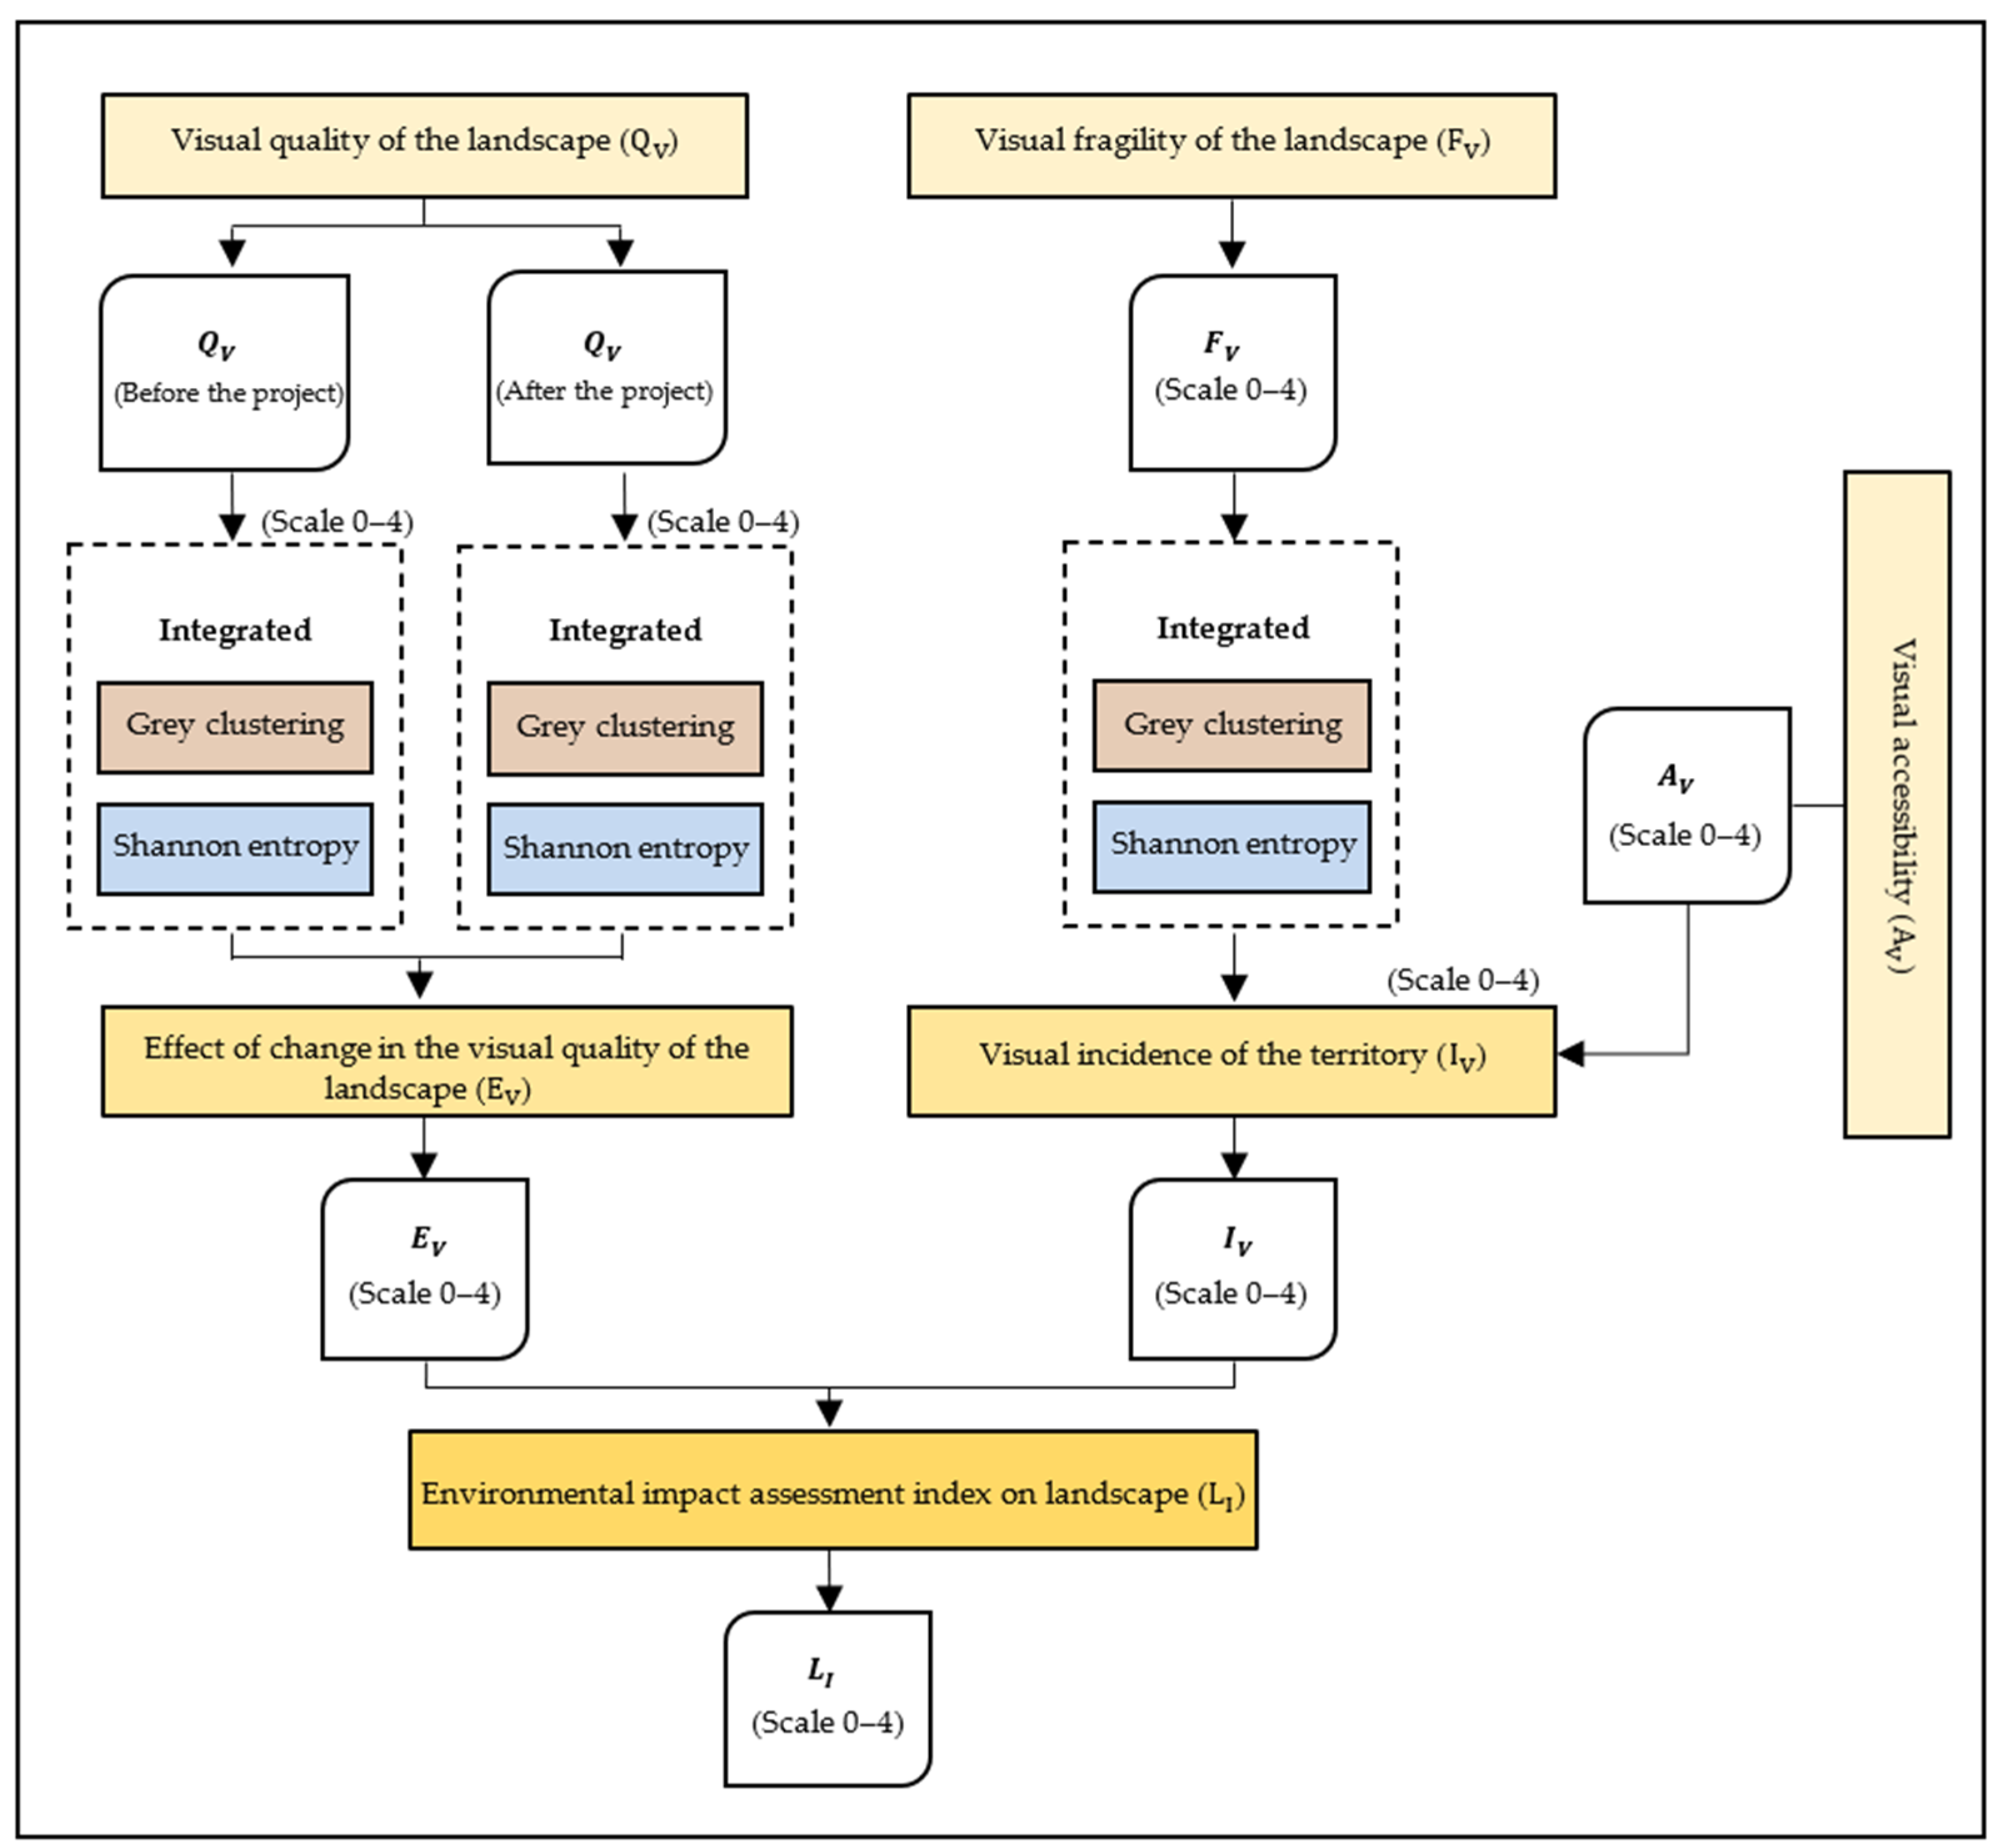
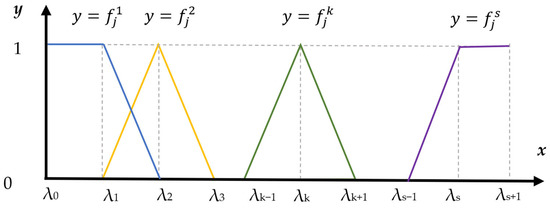
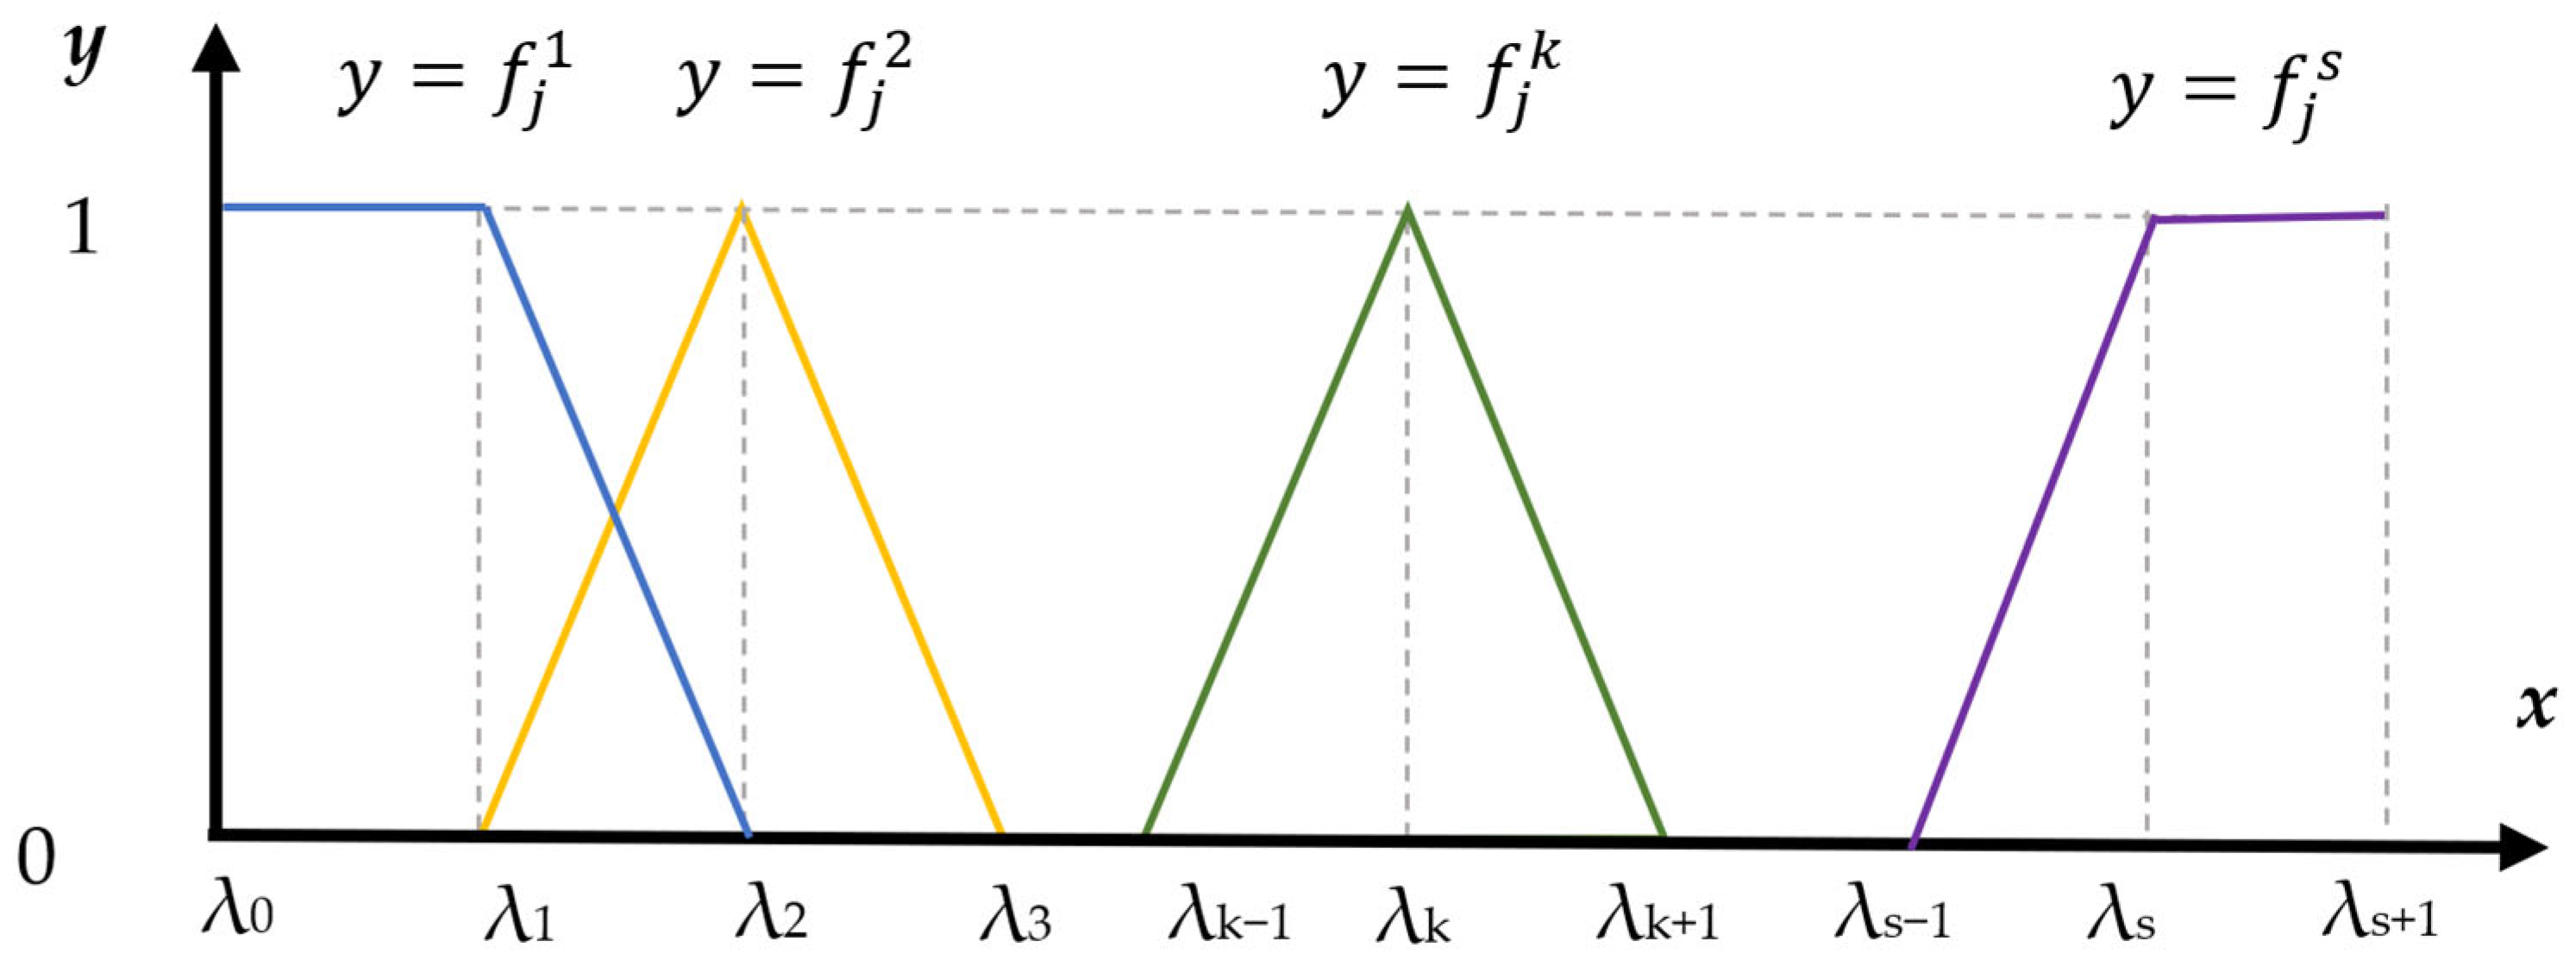
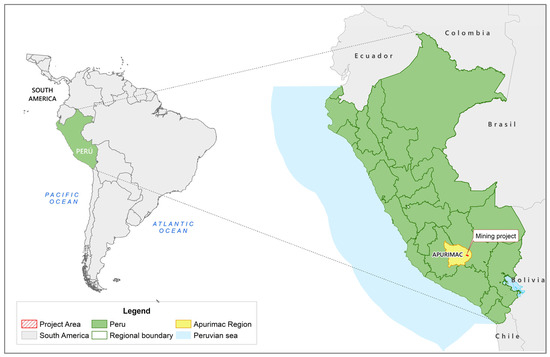
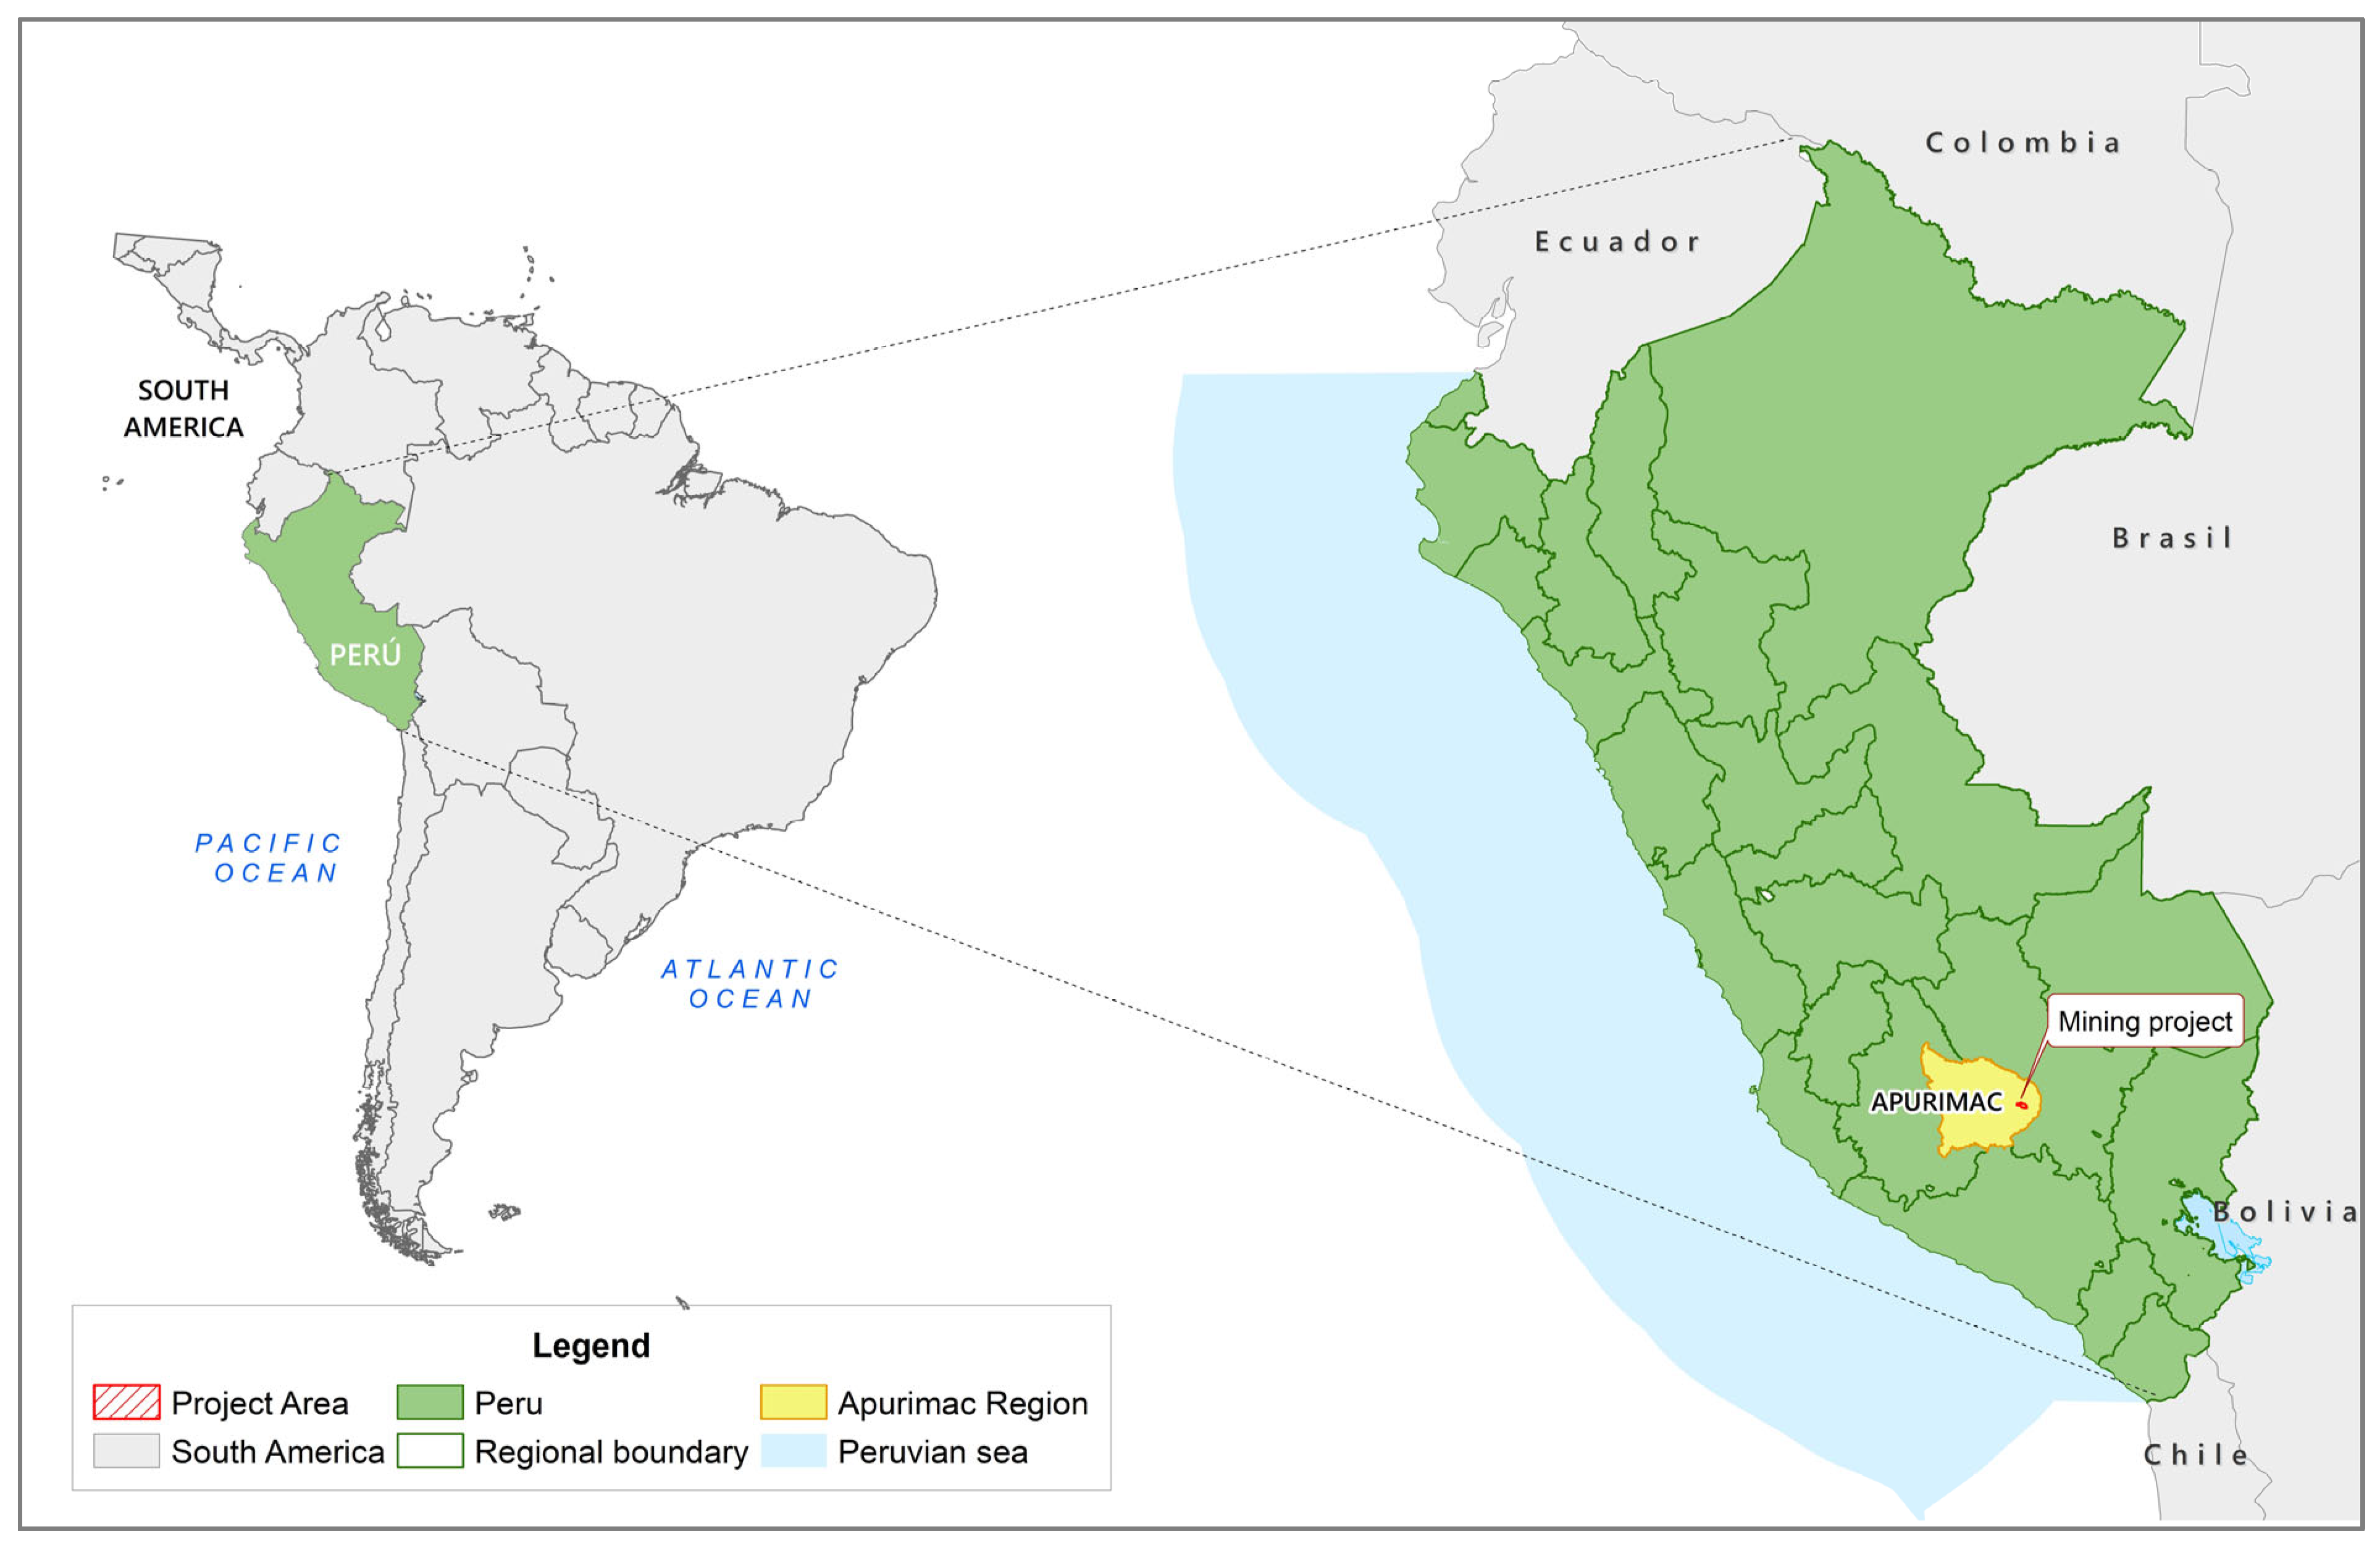
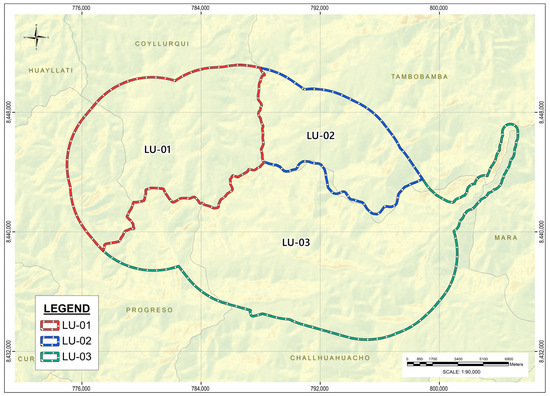
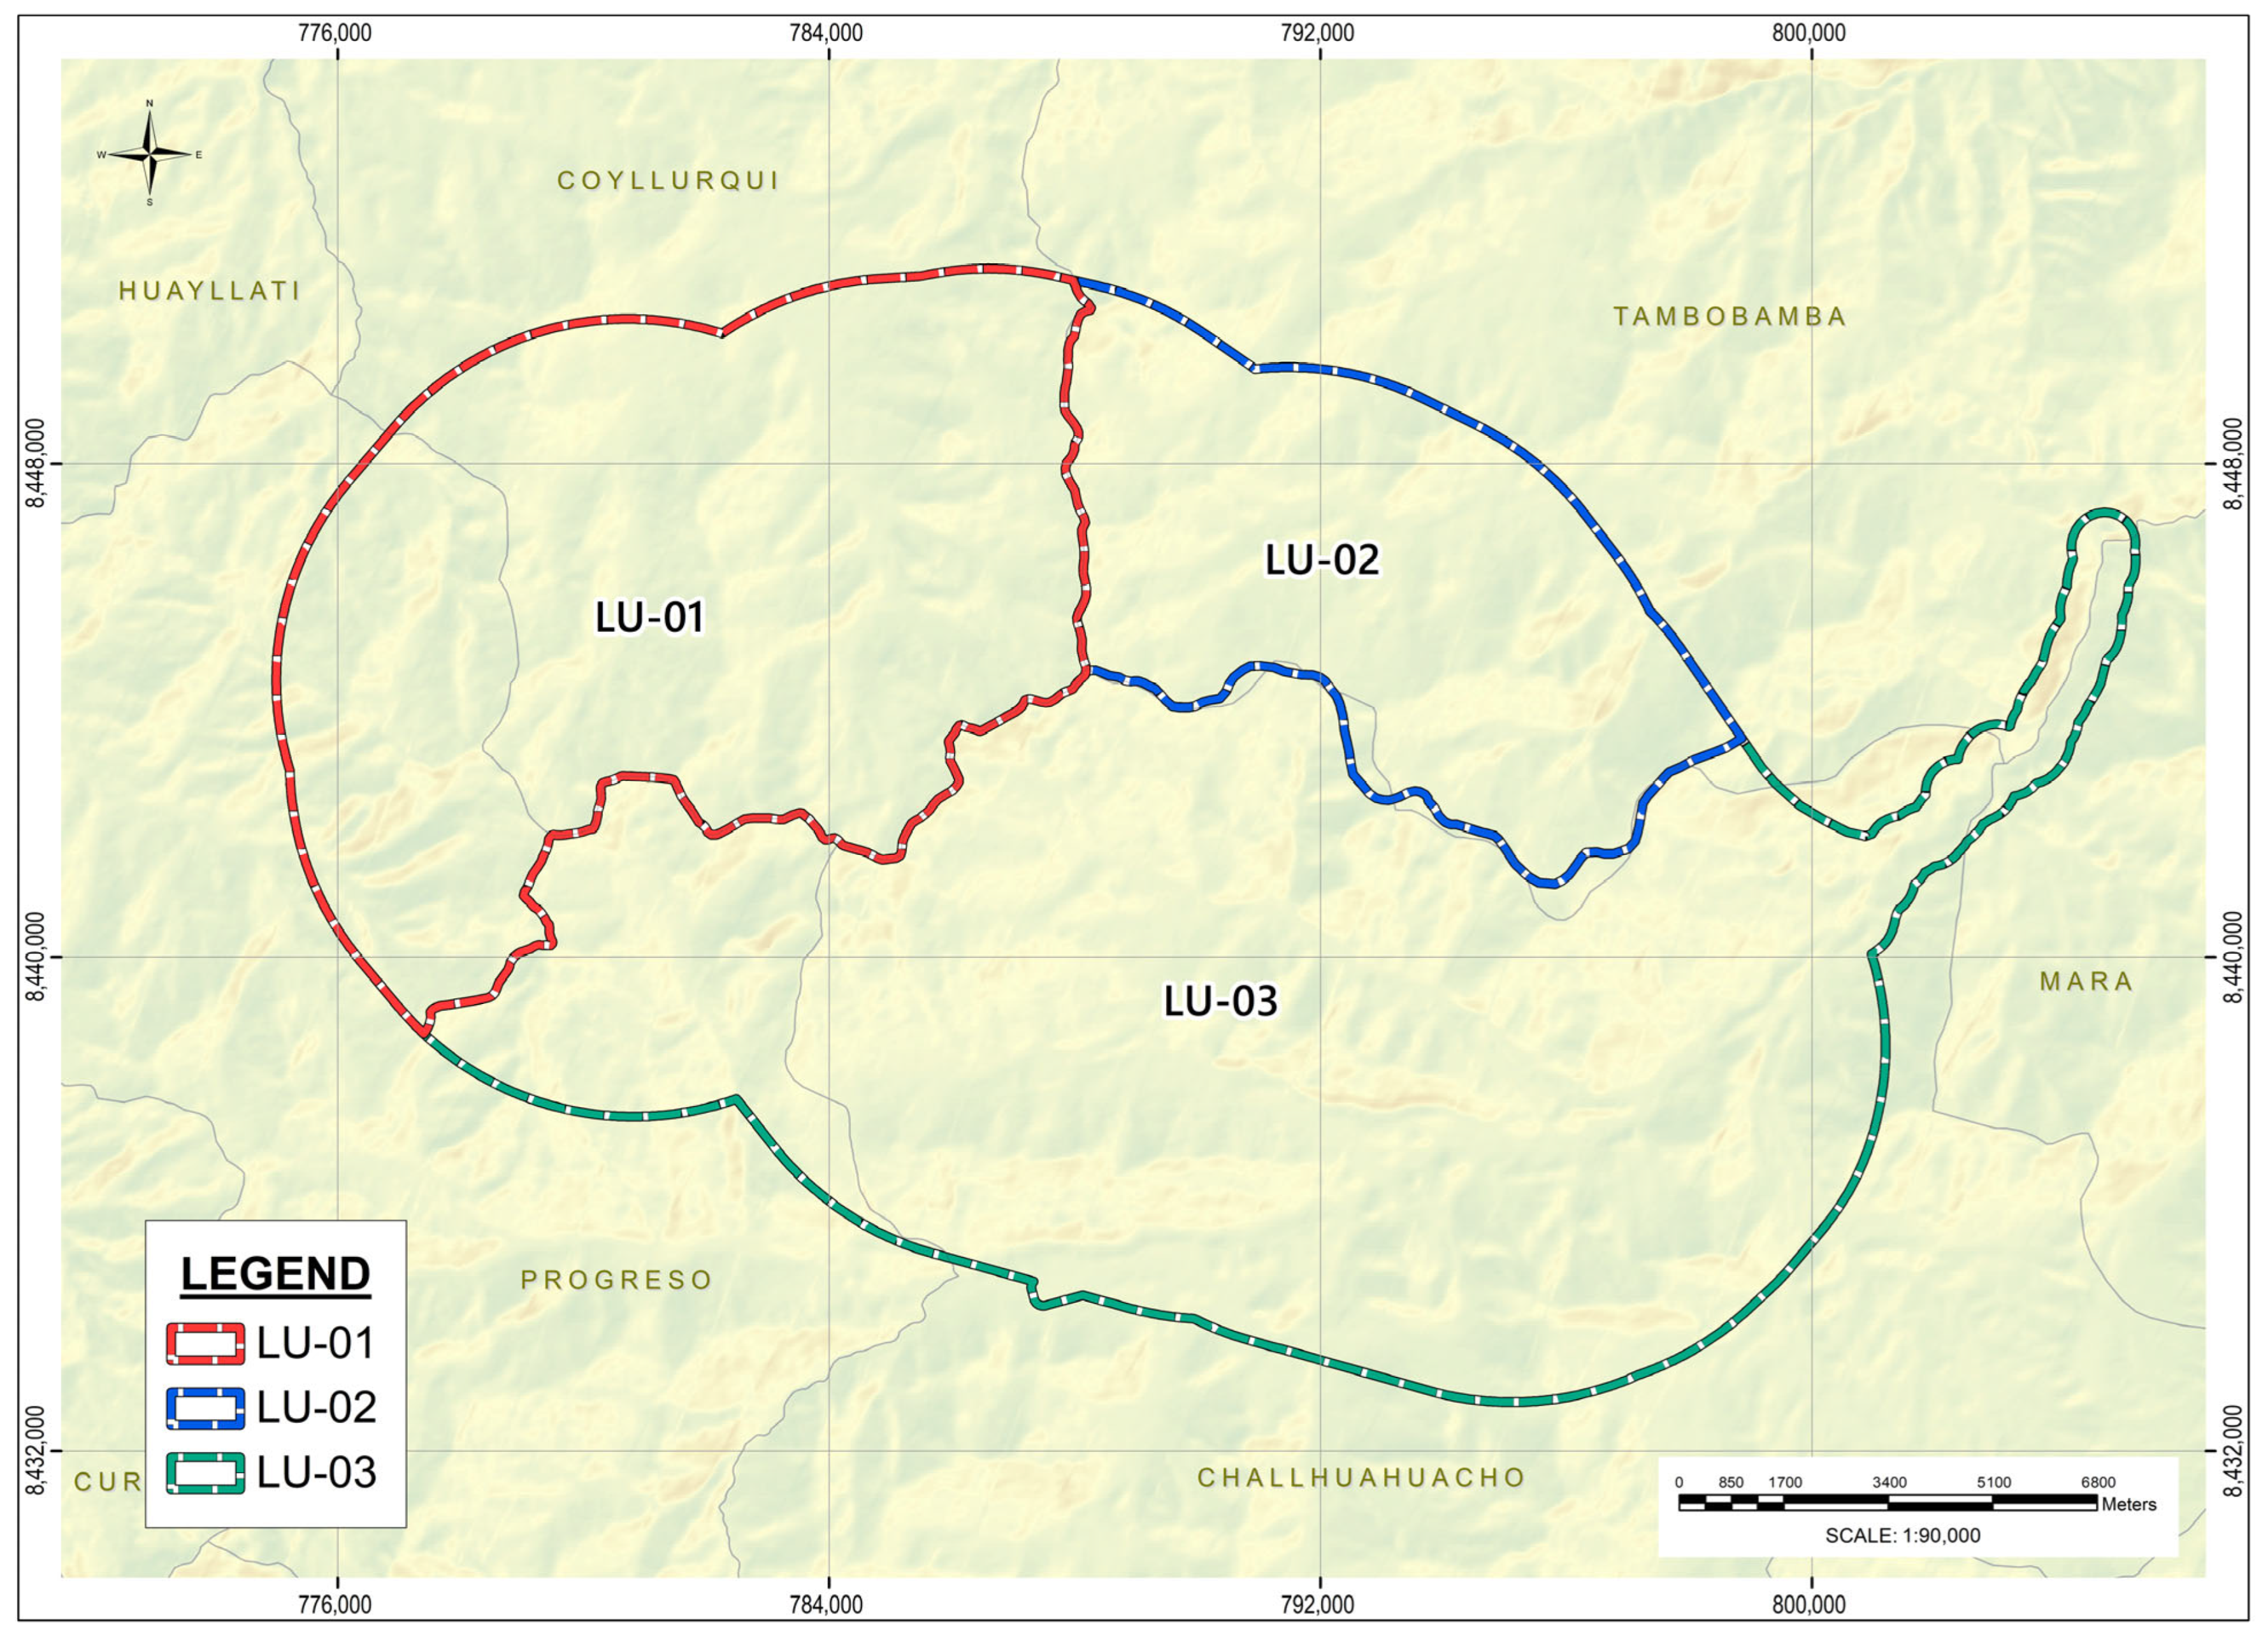
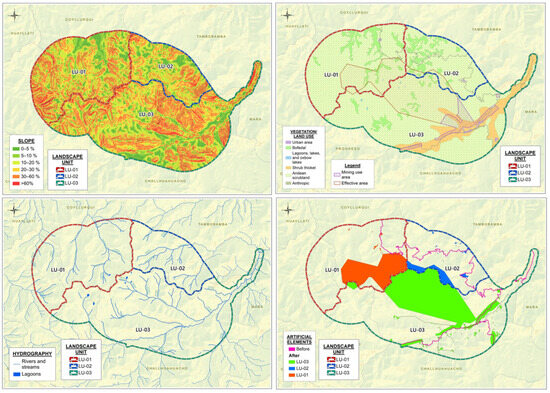
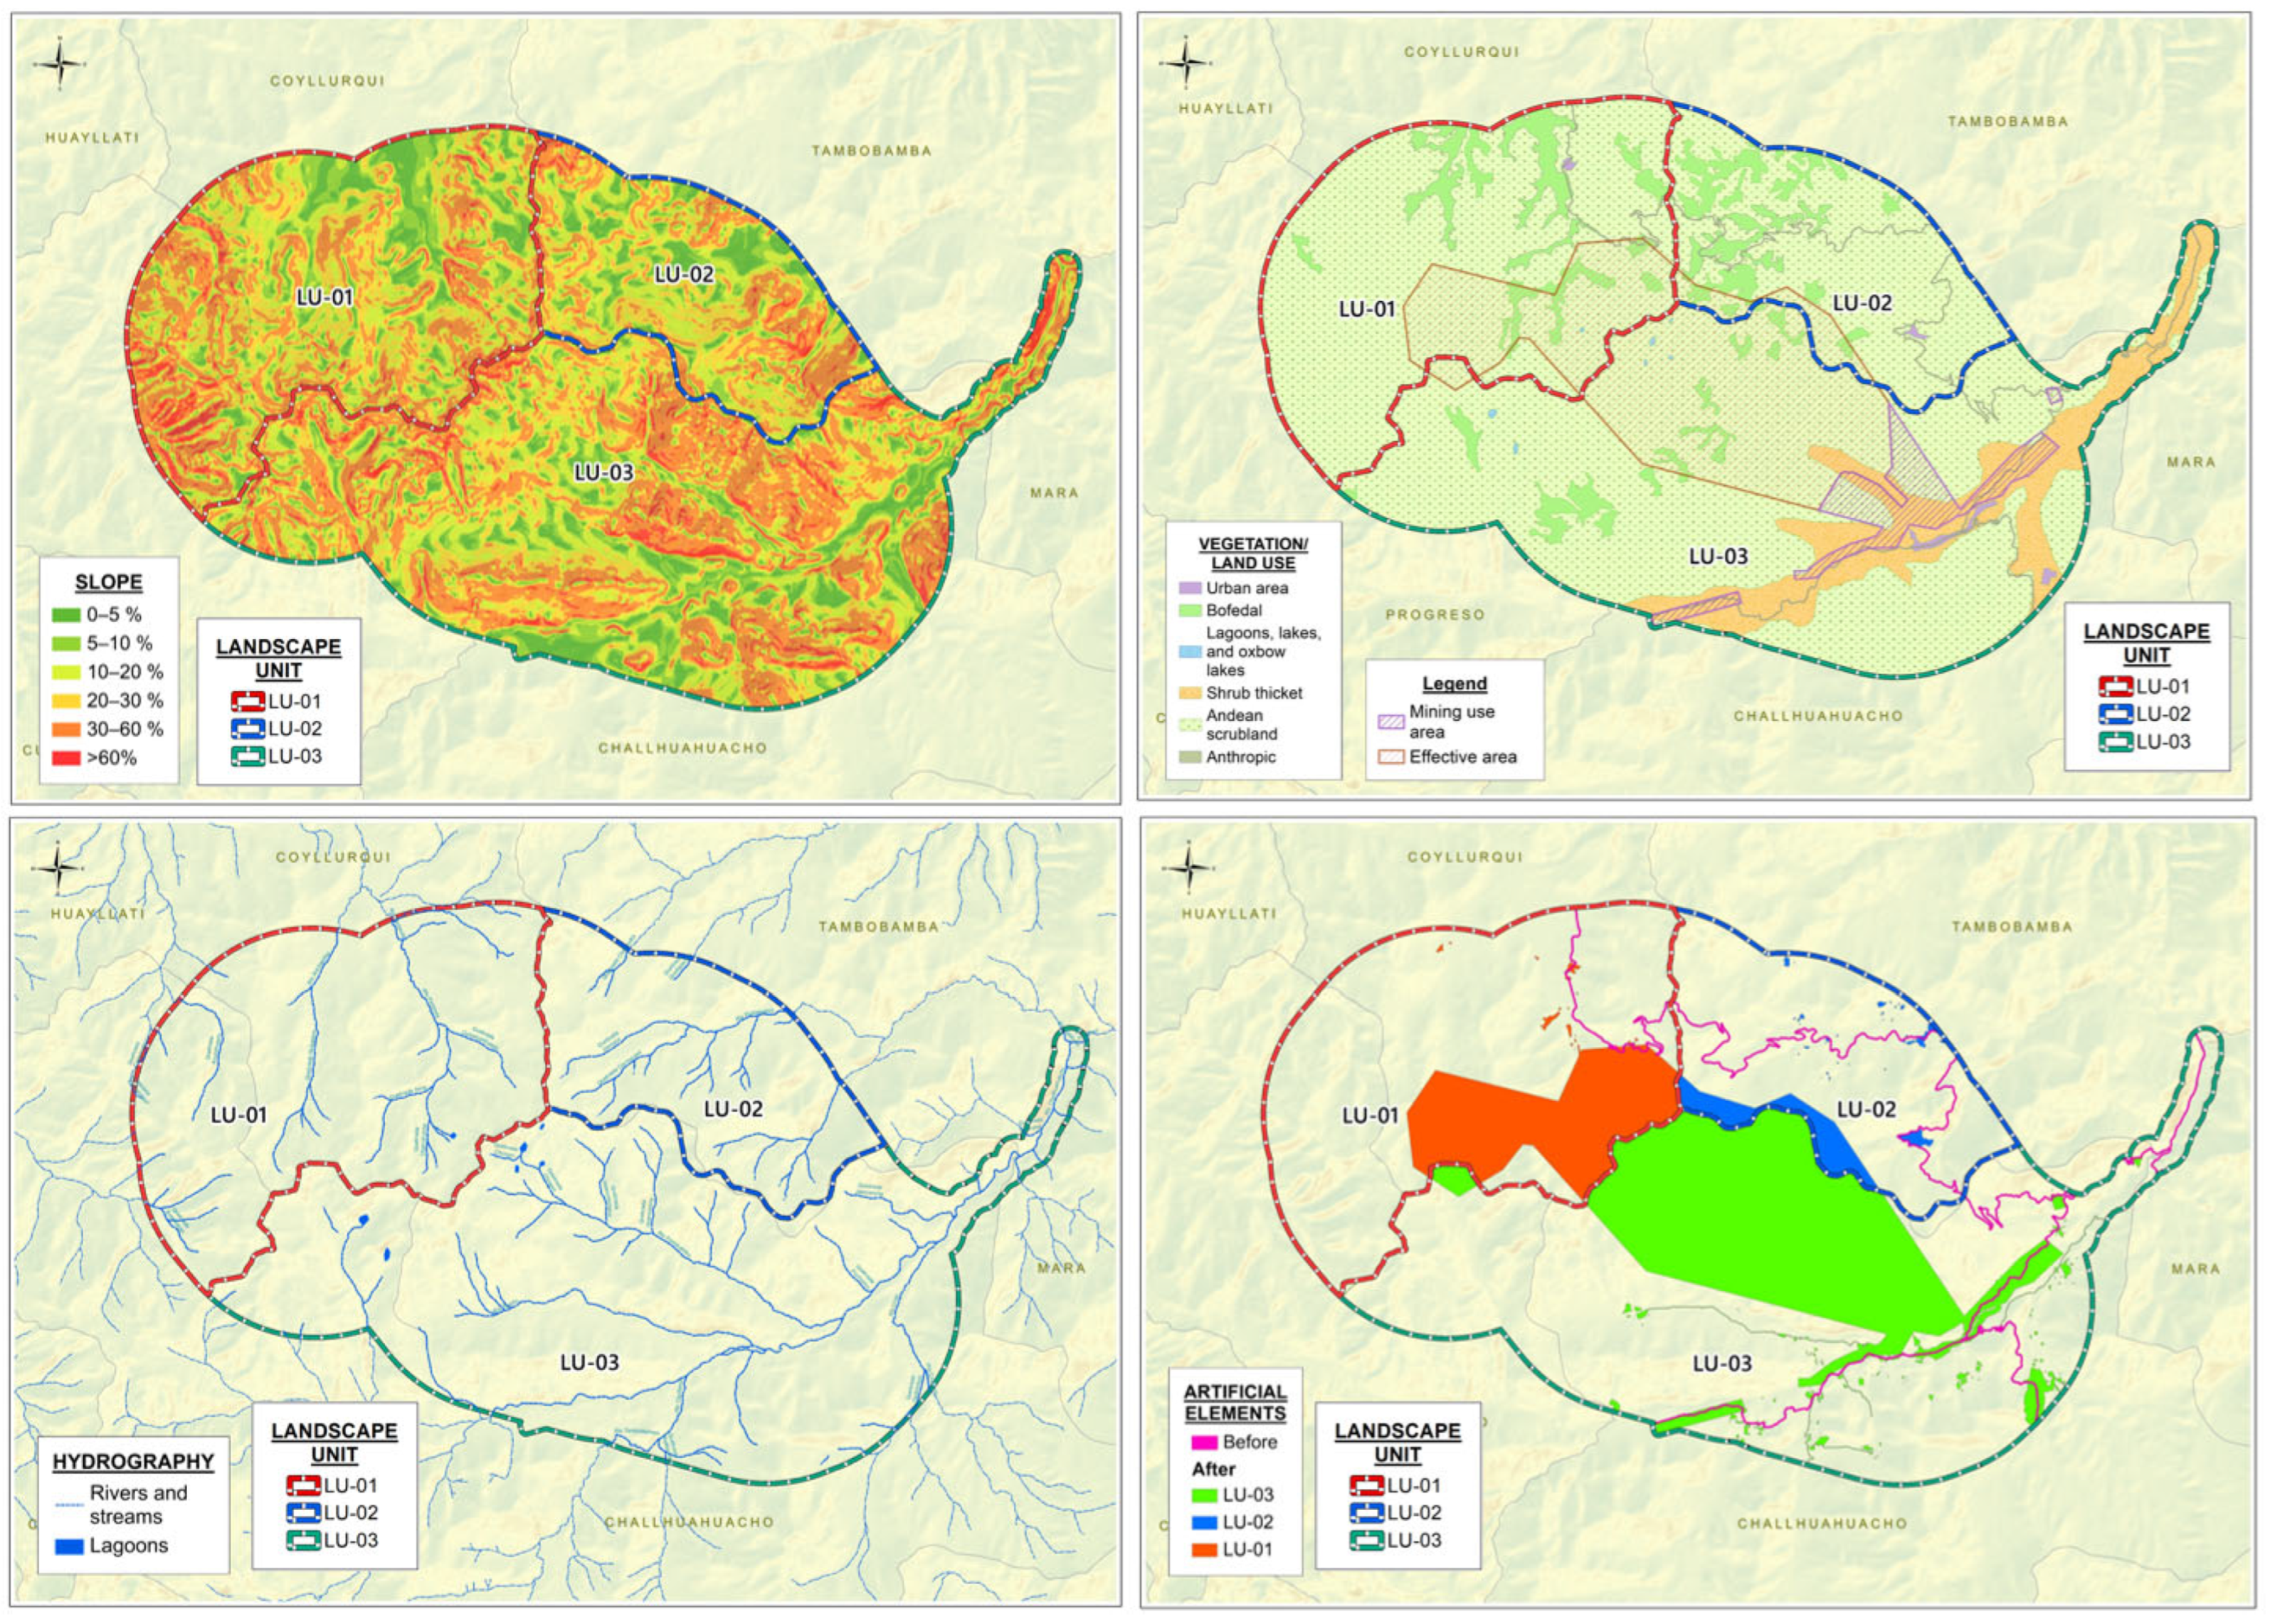
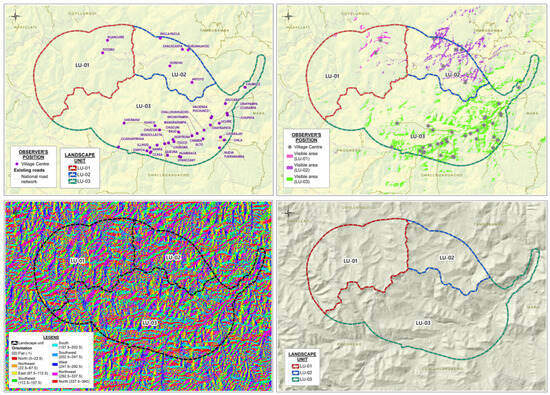
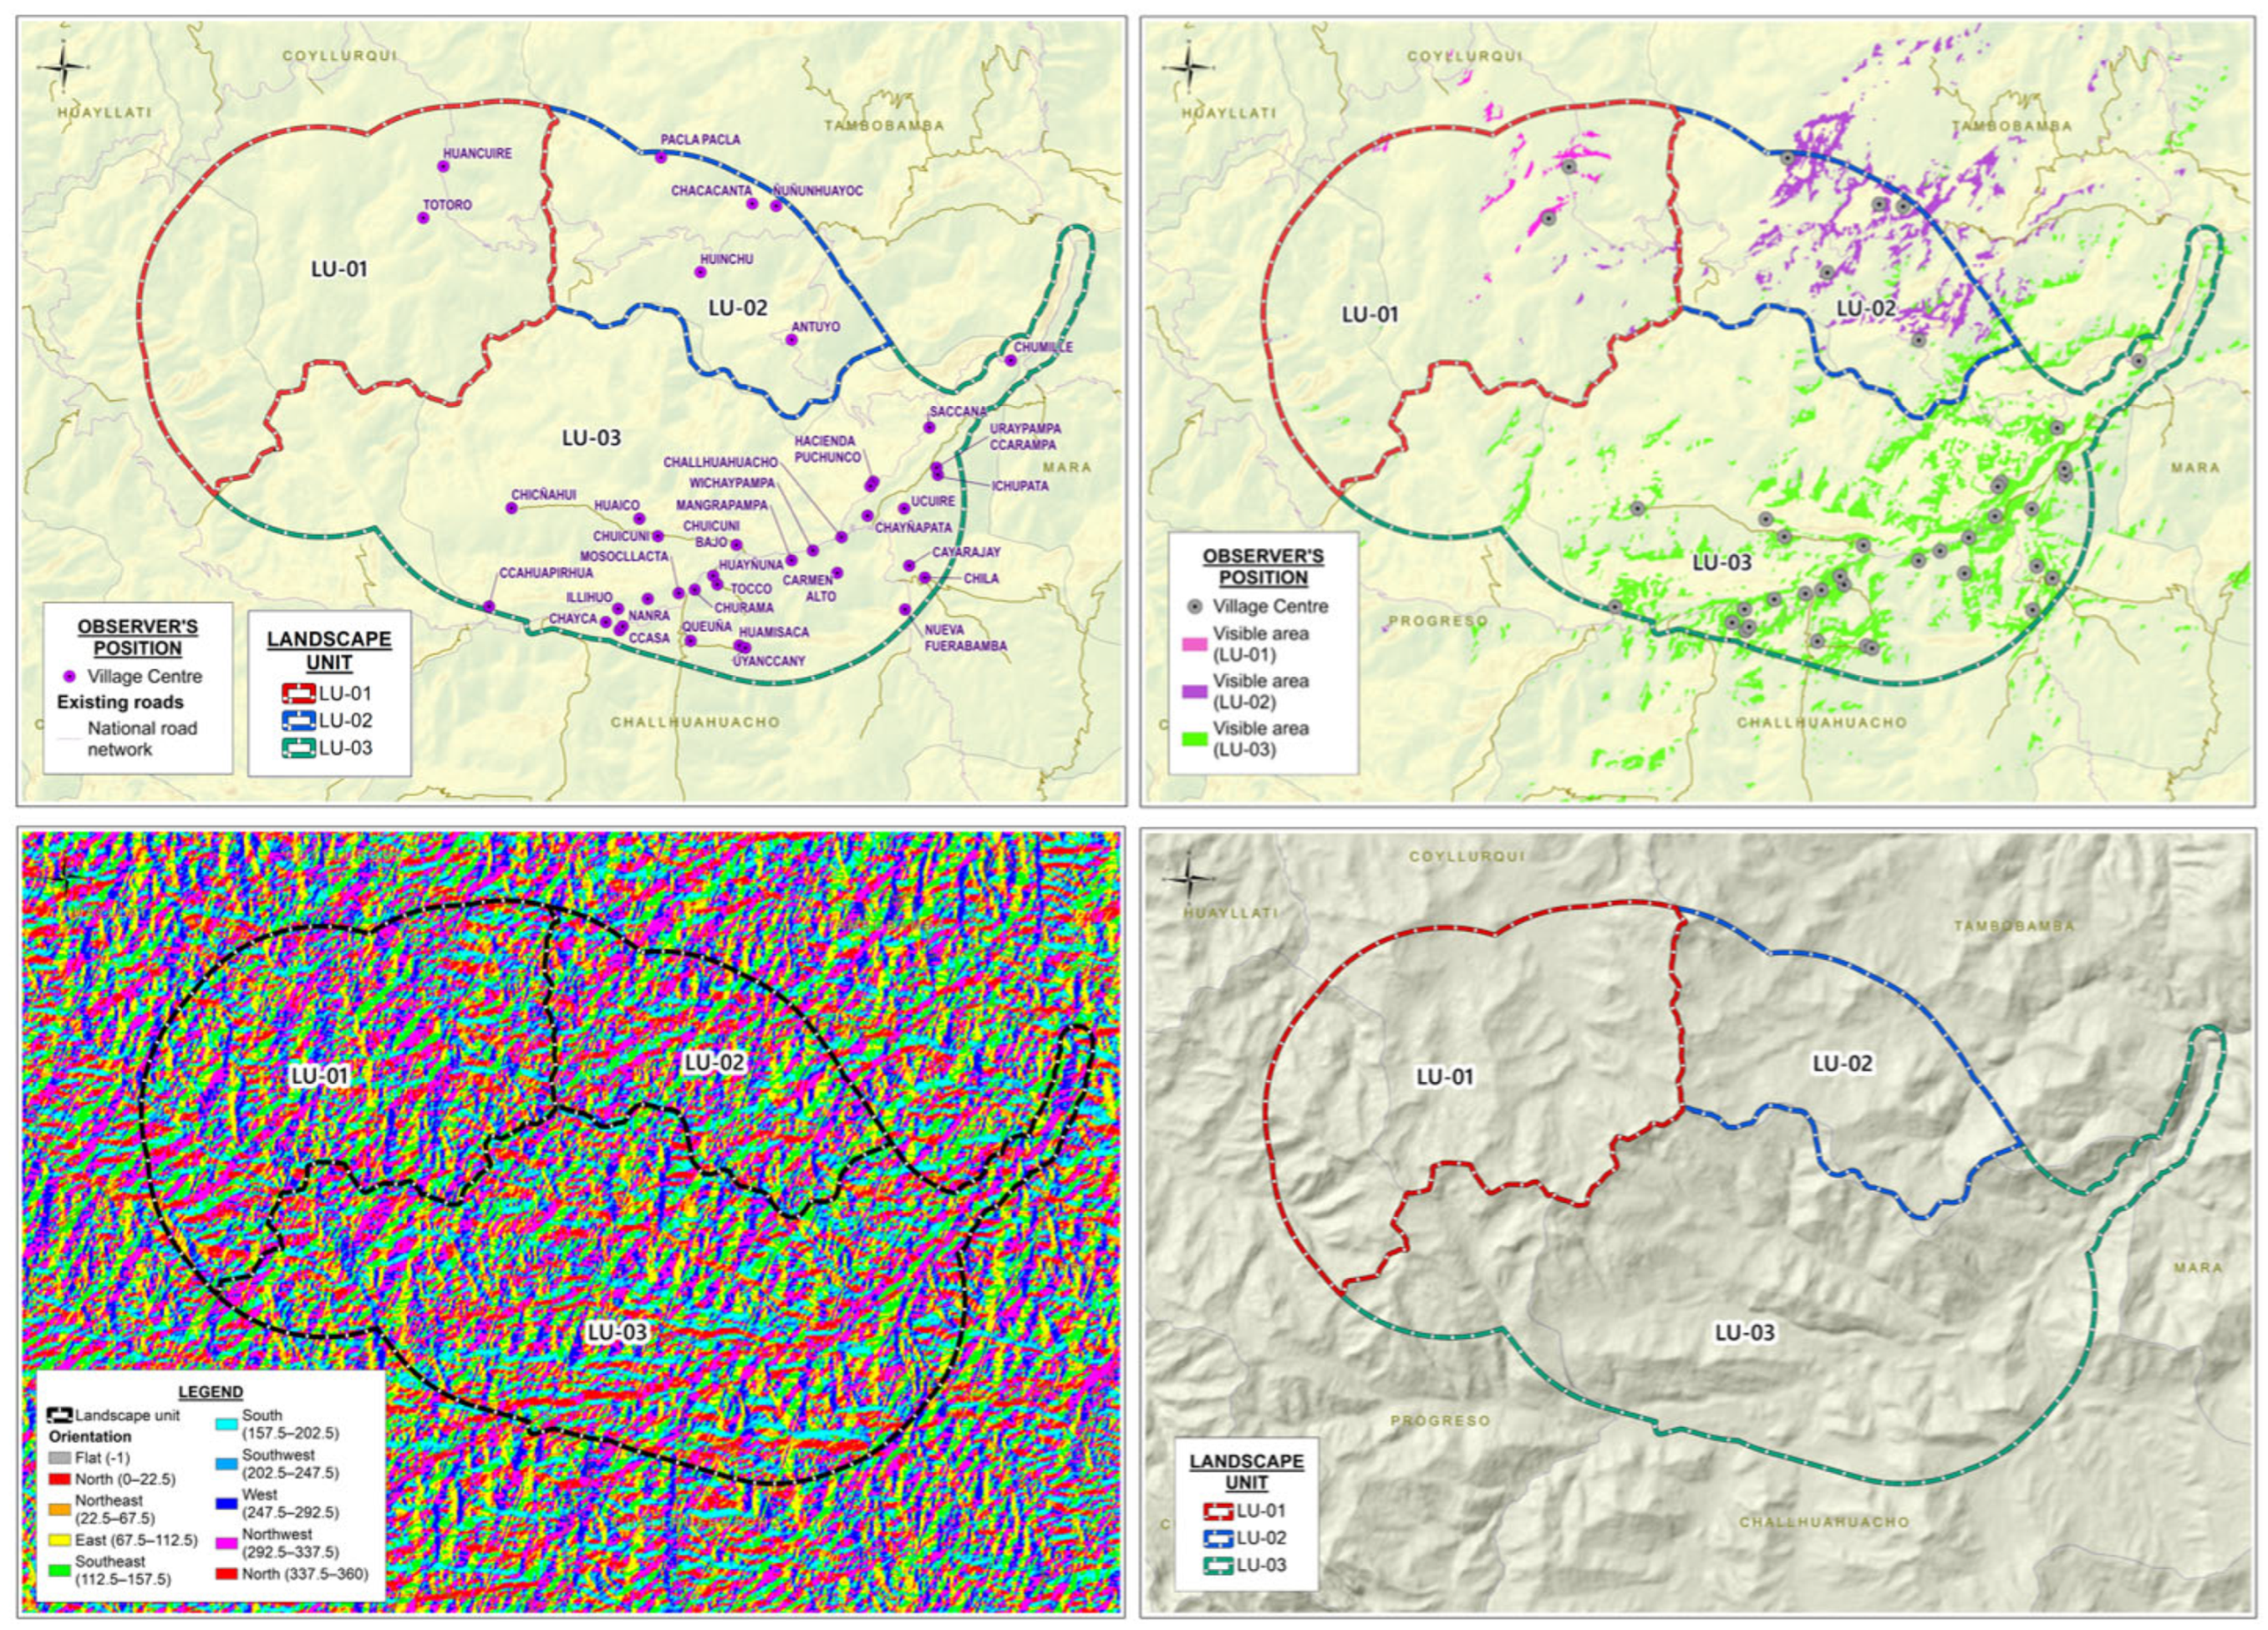
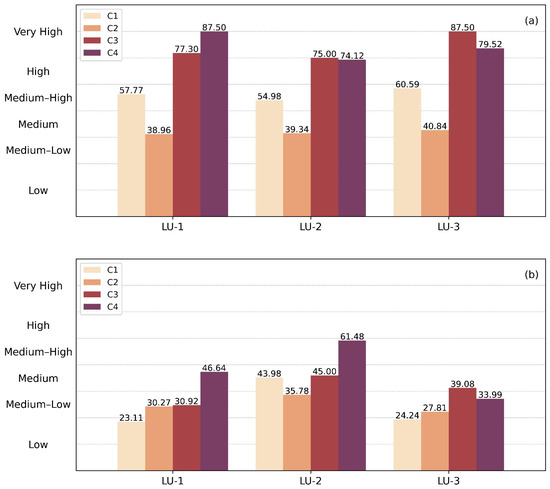
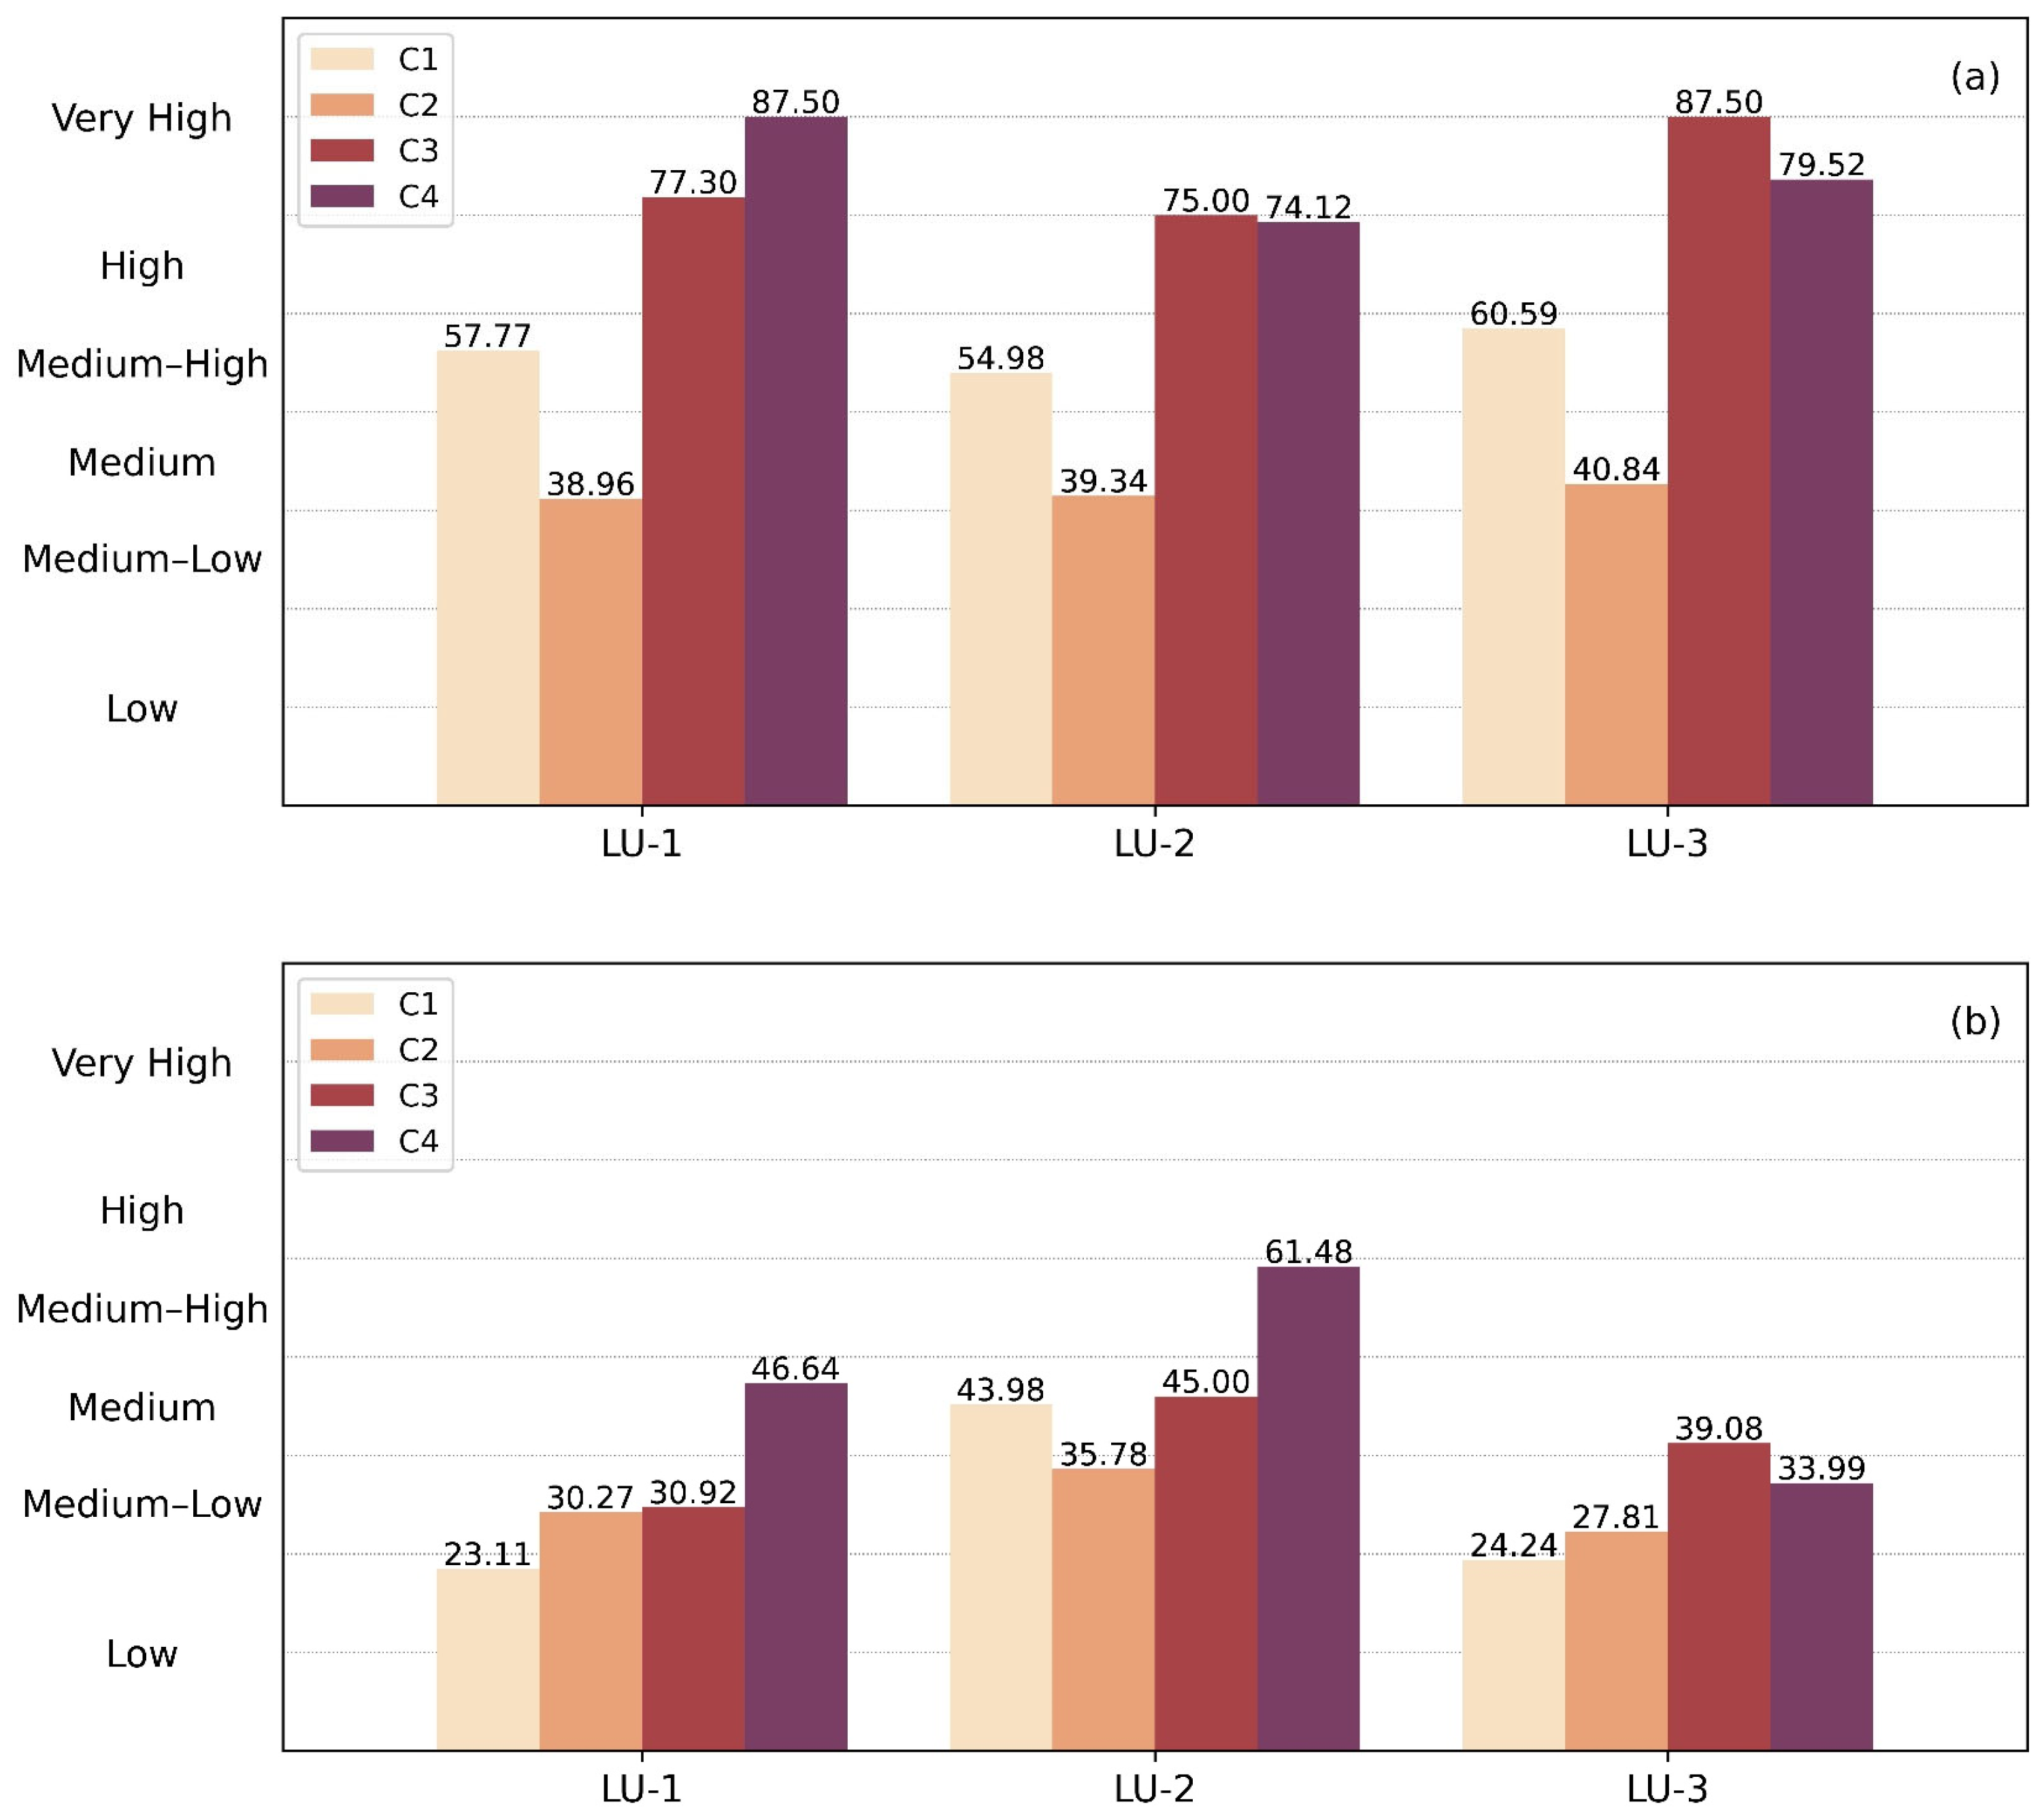
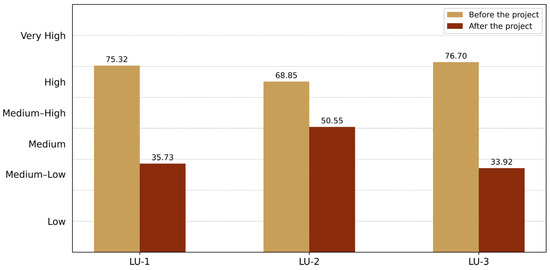
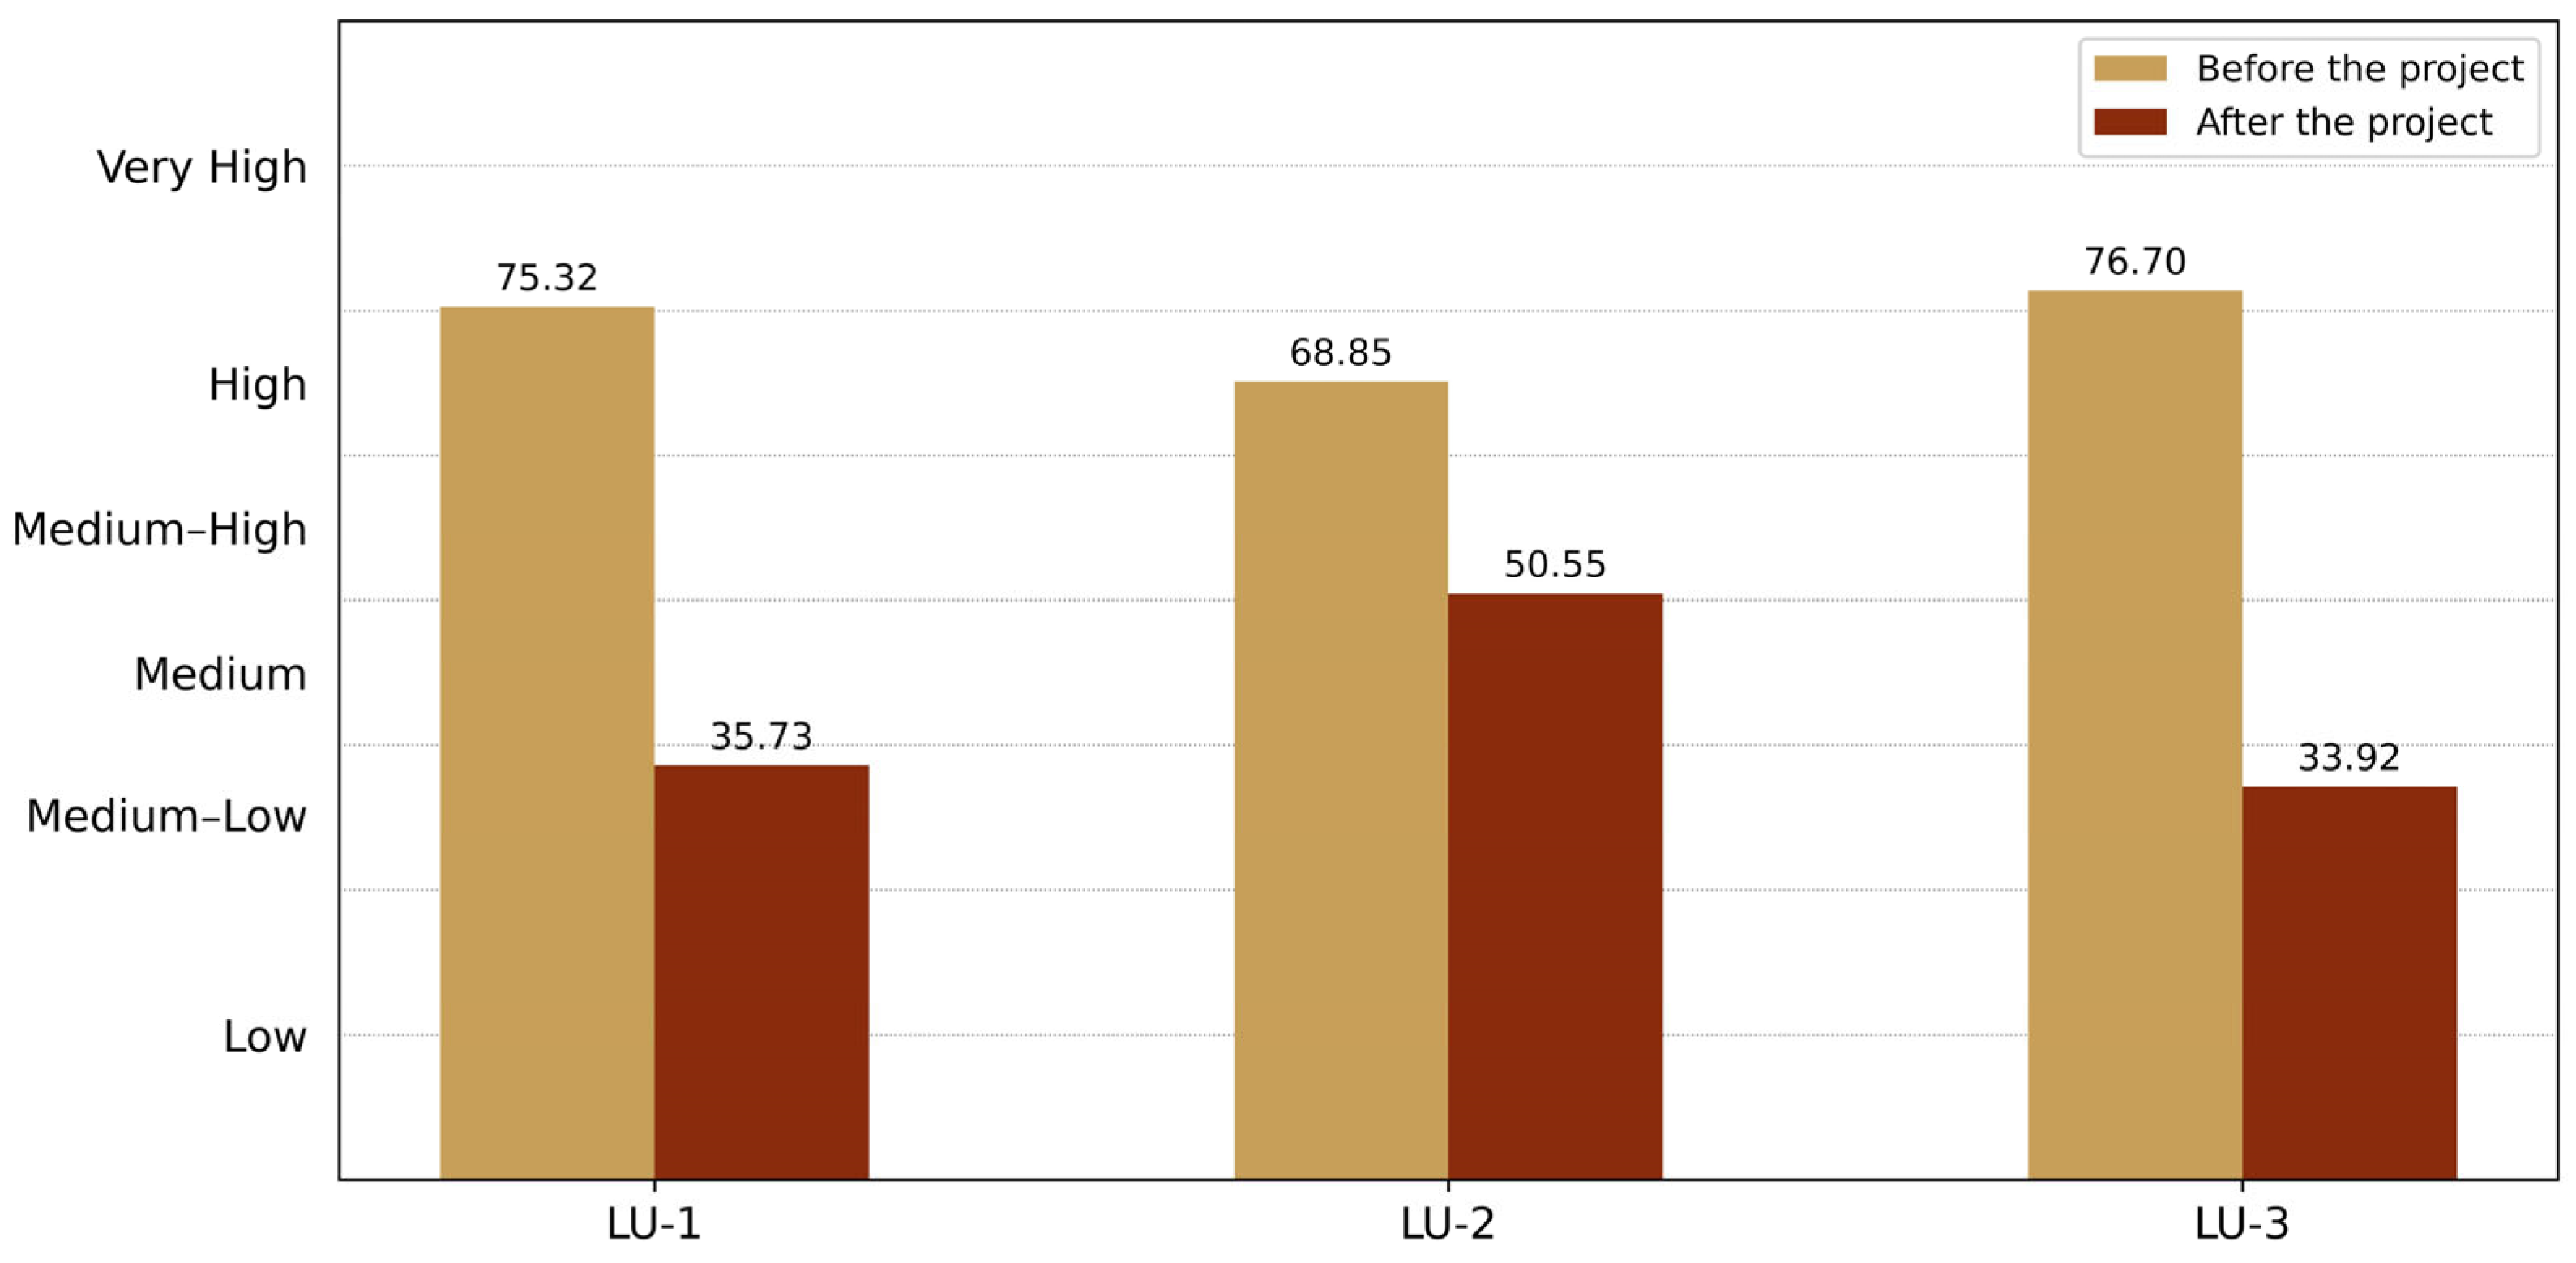
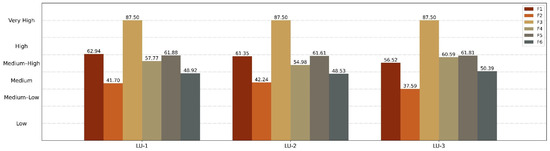
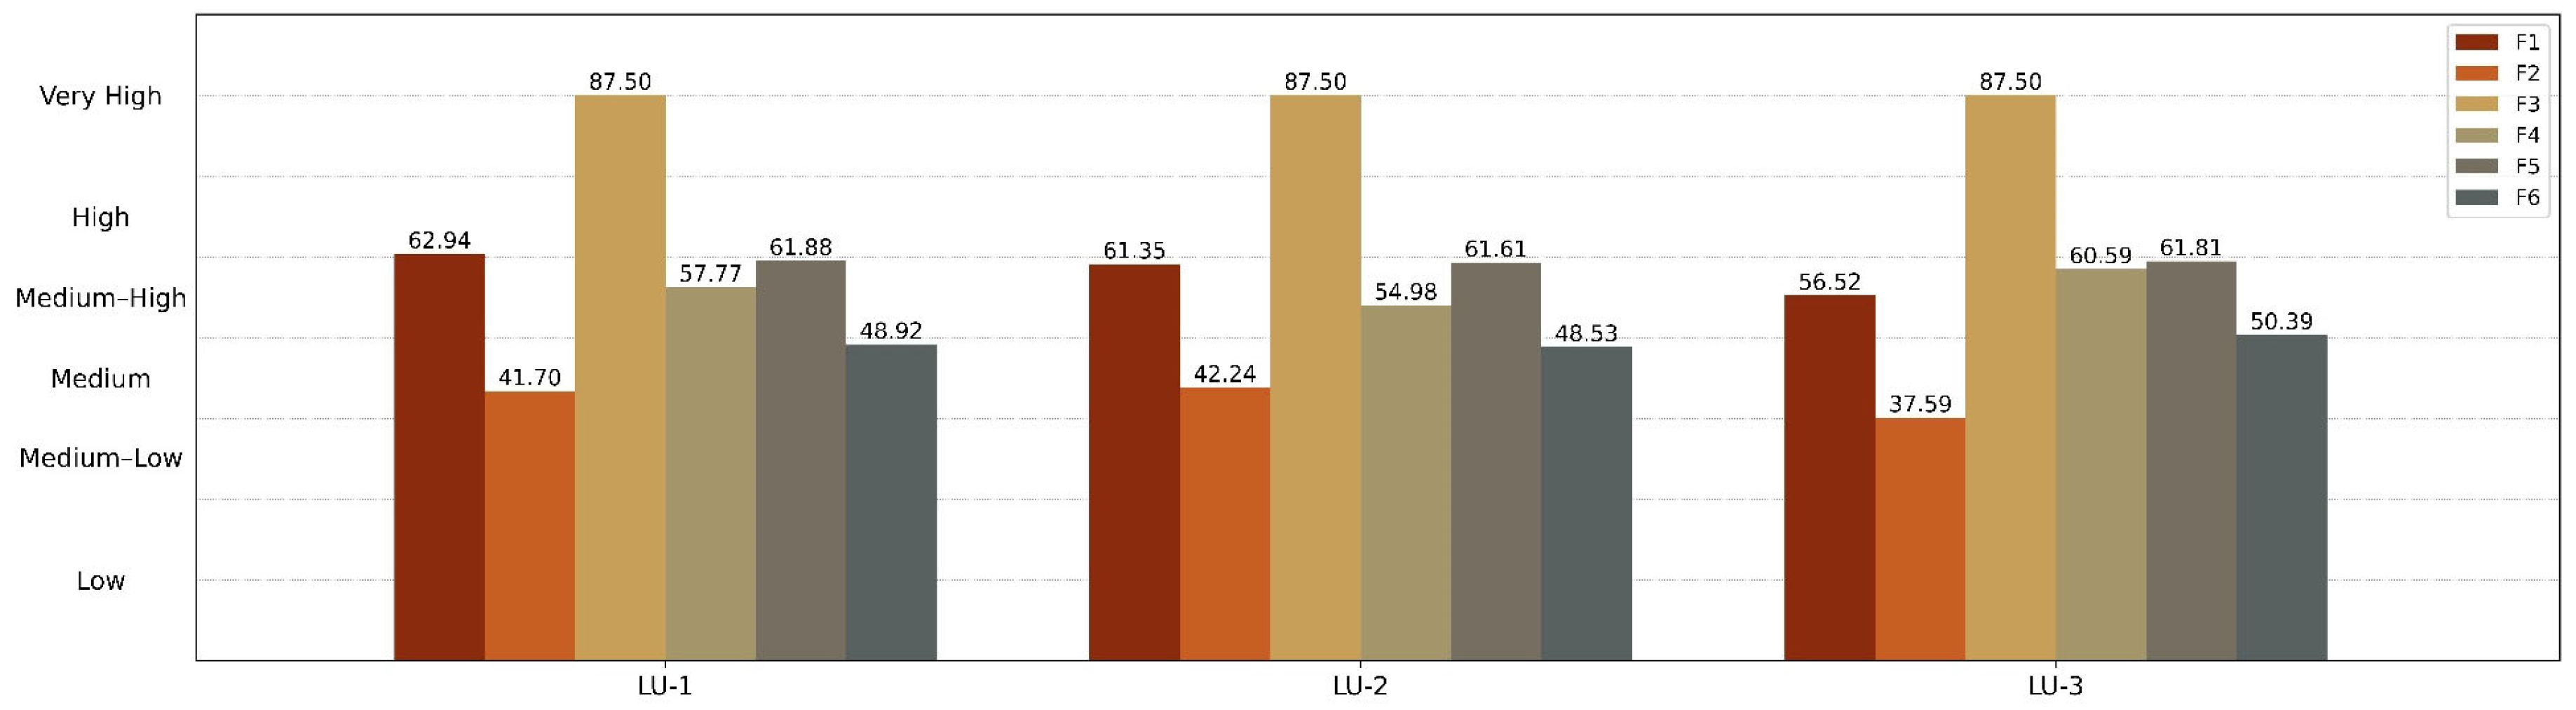
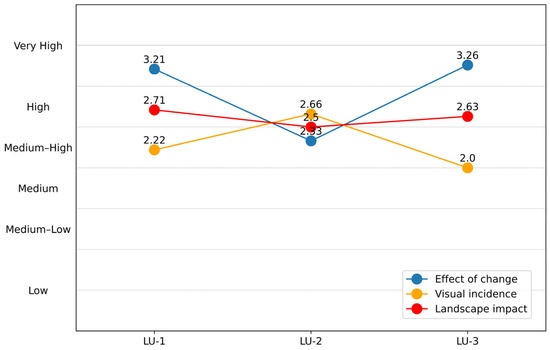
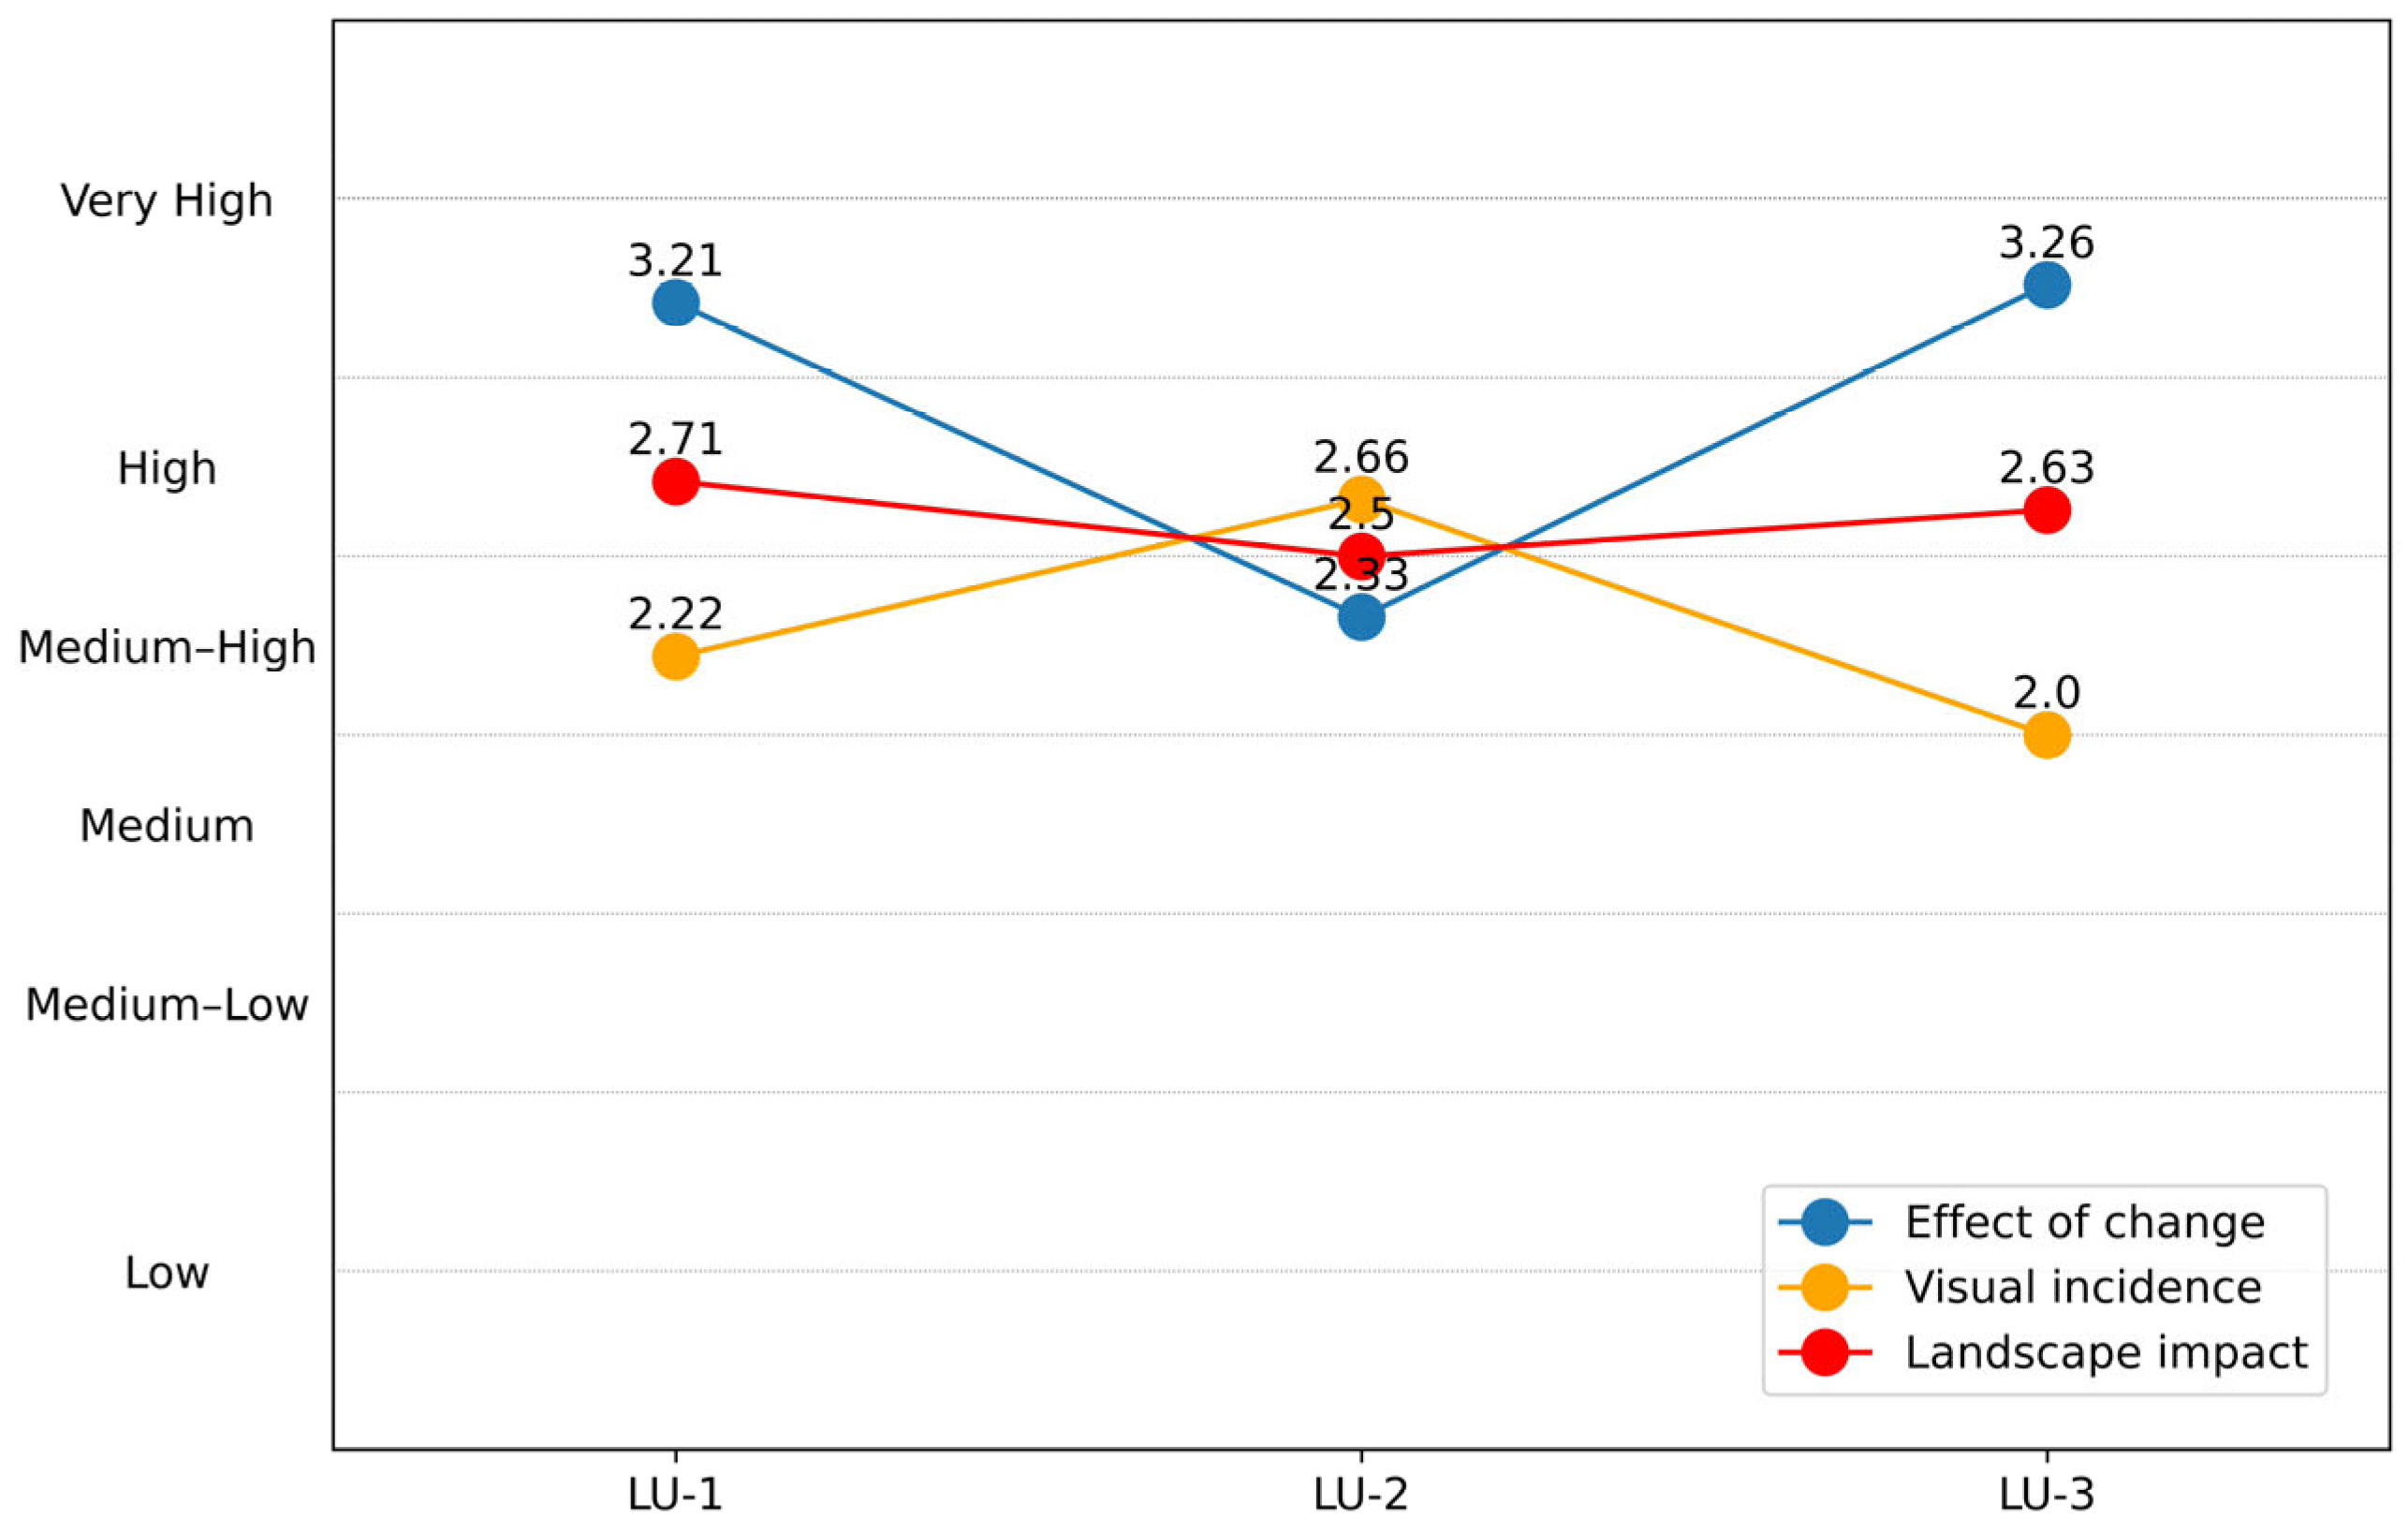

Disclaimer/Publisher’s Note: The statements, opinions and data contained in all publications are solely those of the individual author(s) and contributor(s) and not of MDPI and/or the editor(s). MDPI and/or the editor(s) disclaim responsibility for any injury to people or property resulting from any ideas, methods, instructions or products referred to in the content. |
© 2026 by the authors. Licensee MDPI, Basel, Switzerland. This article is an open access article distributed under the terms and conditions of the Creative Commons Attribution (CC BY) license.