Visual Impact Assessment Index on Landscape Based on Grey Clustering and Shannon Entropy: A Case Study on a Mining Project


Abstract
1. Introduction
2. Literature Review
- A.
- Natural factors. The assessment of impacts derived from elements such as landform, water, and vegetation are often complex due to the diversity and interaction of ecological components. Modelling the geographical complexity of the landscape entails inherent risks and uncertainties, particularly in mining contexts where cartography faces technical and methodological limitations [12].
- B.
- Cultural and social factors. These factors are related to the symbolic and social value assigned to a landscape and to the subjective perception held by the population. Perceptions vary according to cultural values and individual experiences, which adds complexity to the assessment and requires consideration of multiple perspectives and evaluators with diverse viewpoints [11].
2.1. Methods for Managing Uncertainty in Decision-Making
- Fuzzy logic. Introduced by Zadeh (1965), it allows ambiguity and imprecision to be represented through fuzzy sets and membership functions [16]. This framework has been widely applied in environmental and multicriteria assessments, as it enables the integration of expert opinions and linguistic judgments into quantifiable models. However, it requires precise definitions of membership functions and rules, which may introduce new biases or subjectivity.
- Grey systems. Proposed by Ju-Long in 1982 [17], they focus on contexts with incomplete or insufficient information. Unlike probabilistic and fuzzy approaches, grey systems are particularly effective for problems with small samples, providing reliable estimates under high levels of uncertainty [18]. They have been applied to environmental quality assessment (water, soil, air), social conflicts [19], and environmental impact studies [20].
2.2. Grey Systems Theory and Its Application in Environmental Studies
2.3. Shannon Entropy and Objective Weighting of Criteria
2.4. Integrated Approach
3. Methodology
- (a)
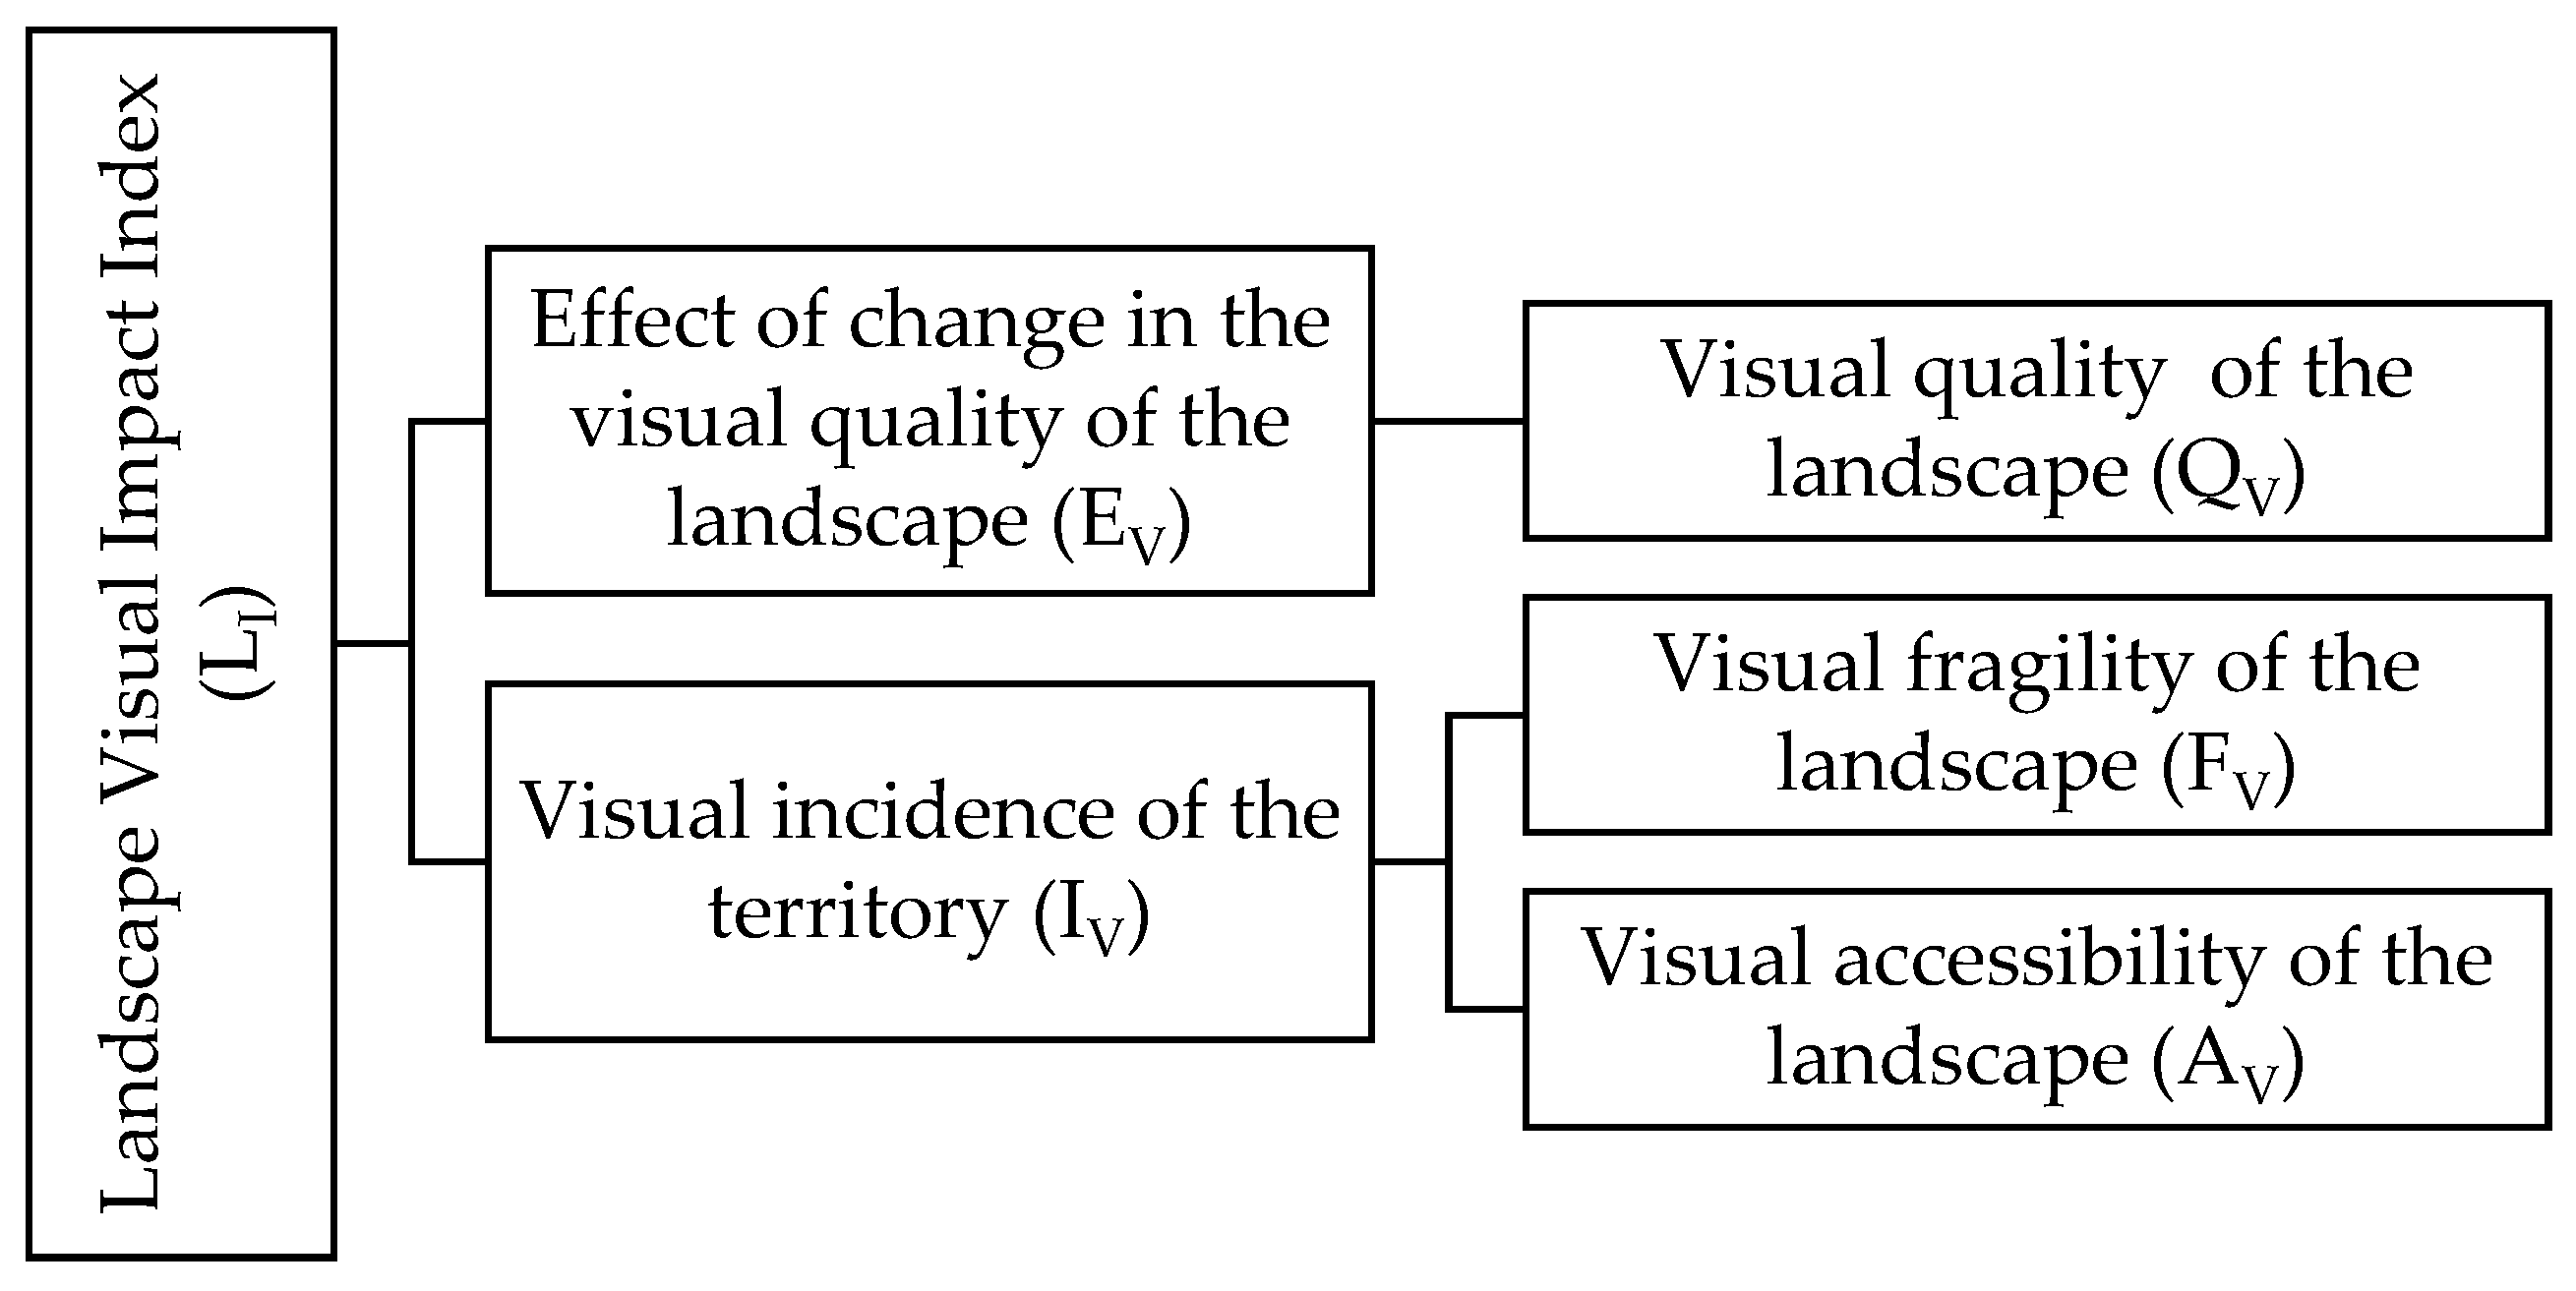
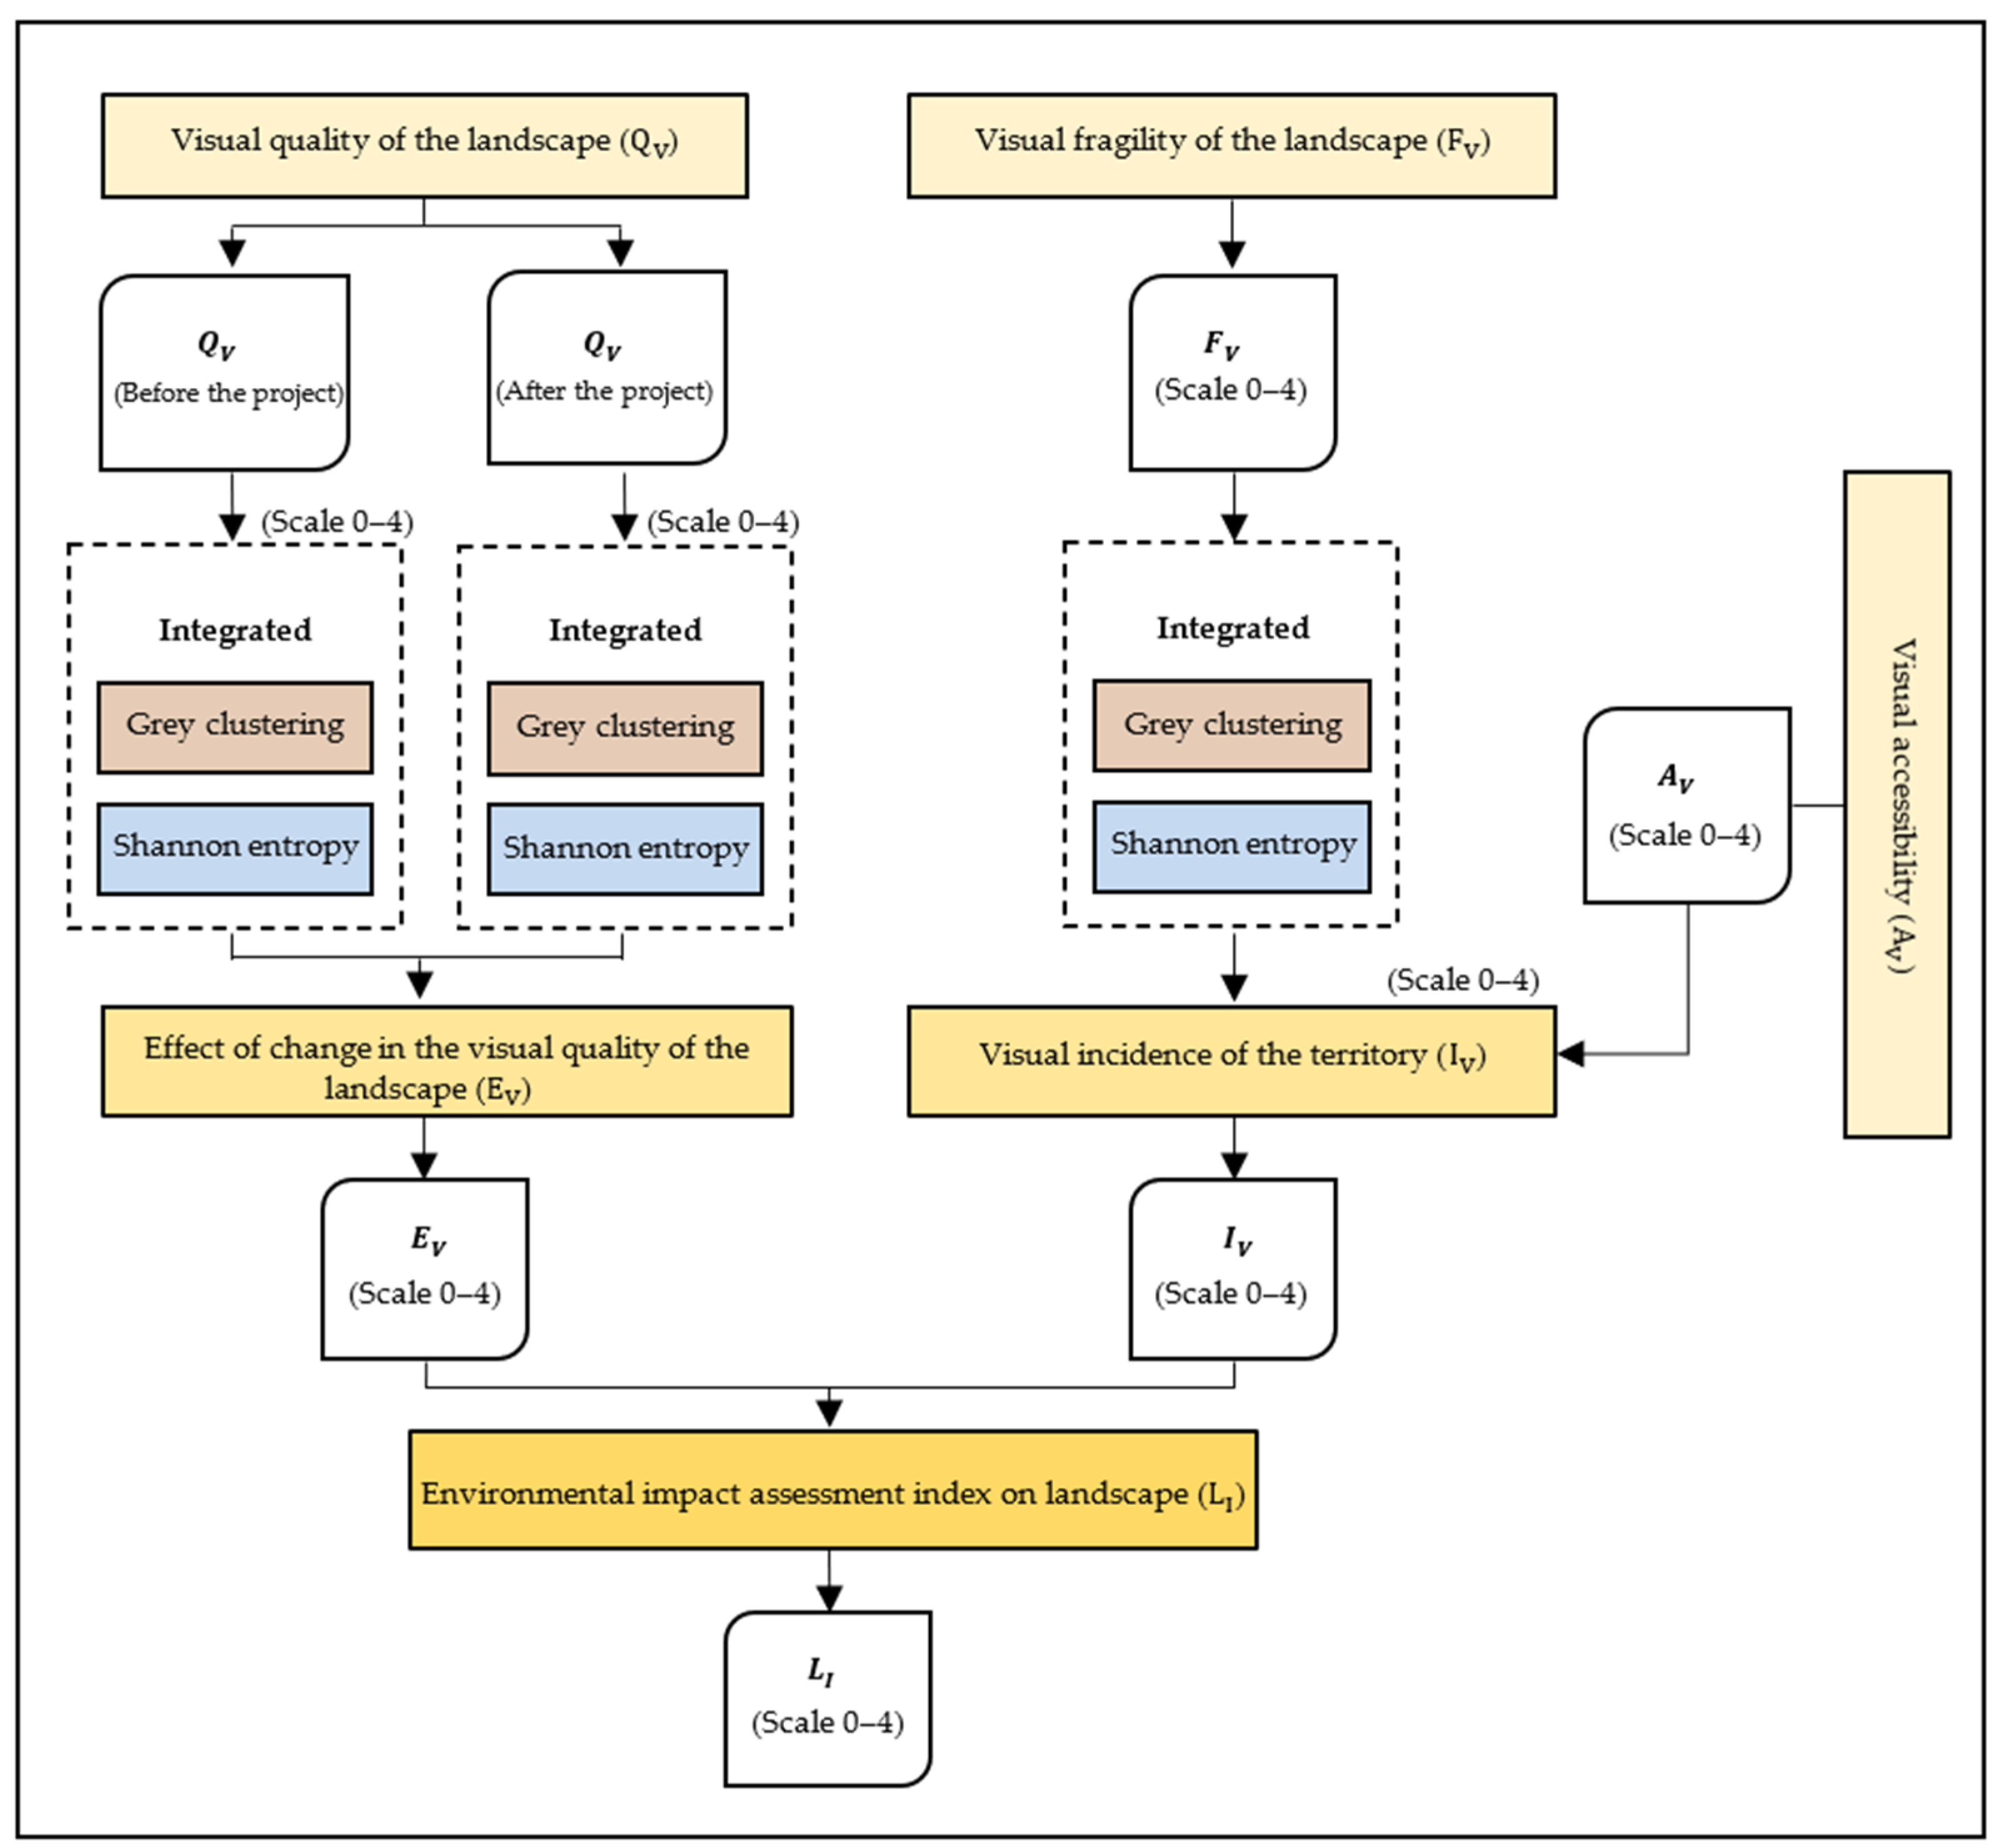
- Landscape Visual Impact Index (LI): A measure that evaluates the degree of alteration or modification that a landscape undergoes, and that can be perceived by observers, caused by anthropogenic or natural activities [30].
- (b)
- Effect of change in the visual quality of the landscape (EV): Indicates the magnitude of the change in the value of the visual quality of the landscape, between two different moments in time, produced by human activities [29].
- (c)
- Visual quality of the landscape (QV): Refers to the quality derived from the inherent characteristics of each study area, based on its biophysical and biological components [29].
- (d)
- Visual incidence of the territory (IV): This is defined as the assimilation and perception of the environment based on the visual absorption capacity of the territory, its degree of restoration, and the visibility of its alterations from defined observation points [29].
- (e)
- Visual fragility of the landscape (FV): This refers to the susceptibility of a landscape to change when a use or action is developed on it and is reflected in its capacity to visually assimilate and absorb these alterations [29].
- (f)
- Visual accessibility (AV): Refers to the visibility of a territory from established observation points [31].
3.1. Effect of Change in the Visual Quality of the Landscape (EV)
3.2. Visual Incidence of the Territory (Iv)
3.2.1. Visual Fragility of the Landscape (FV)
3.2.2. Visual Accessibility (AV)
3.3. Landscape Visual Impact Index (LI)
4. Case Study
4.1. Definition of Study Objects
4.2. Evaluation Criteria
4.2.1. Criteria of Visual Quality of the Landscape (QV)
4.2.2. Criteria of Visual Fragility of the Landscape (FV)
4.3. Definition of Grey Classes
5. Results
5.1. Effect of Change in the Visual Quality of the Landscape (Ev)
5.2. Visual Incidence of the Territory (Iv)
5.2.1. Visual Fragility of the Landscape (FV)
5.2.2. Visual Accessibility (AV)
5.3. Landscape Visual Impact Index (LI)
6. Discussion
6.1. About the Case Study
6.2. Methodological Discussion
Assumptions and Limitations
7. Conclusions
Supplementary Materials
Author Contributions
Funding
Data Availability Statement
Acknowledgments
Conflicts of Interest
References
- Zhang, Y.; He, J. Understanding the Visual Image of Kailash Sacred Landscape through Geo-Tagged Landscape Photos Mapping. Environ. Chall. 2021, 5, 100360. [Google Scholar] [CrossRef] [Scilit]
- Prodanova, H.; Nedkov, S.; Petrov, G. GIS-Based Modelling of Landscape Patterns in Mountain Areas Using Climate Indices and Regression Analysis. Environ. Model. Softw. 2024, 180, 106160. [Google Scholar] [CrossRef] [Scilit]
- Antonelli, G.; Gerrard, M.; Colangelo, S.; Montedoro, G.; Santise, M.; Lavrysen, L.; Ferroni, M.V. Environmental Law Before the Courts: A US-EU Narrative; Springer International Publishing: Berlin/Heidelberg, Germany, 2023. [Google Scholar]
- Zherdev, N.; Klein, O.; Sconfienza, U.; Gerber, P.; Vladušič, D.; Butler, J.; Pasic, A. A Framework for Enabling Ex-Ante Social Impact Assessment of Project-Based Technological Solutions: The Case of Remote Infrastructure Inspection. In Proceedings of the 2024 19th Conference on Computer Science and Intelligence Systems (FedCSIS), Belgrade, Serbia, 8–11 September 2024; pp. 513–524. [Google Scholar]
- Liu, S. Grey Systems Analysis; Springer Nature: Singapore, 2025. [Google Scholar]
- Kaiyu, Z.; Shanshan, S.; Haojing, W.; Guangxu, H. Reliability Evaluation of Distribution System Based on Grey Correlation Method. In Proceedings of the 2021 6th International Conference on Power and Renewable Energy (ICPRE); IEEE: New York, NY, USA, 2021; pp. 598–601. [Google Scholar]
- Lyu, F.; Zhu, Y. The Evaluation Model of Enterprises’ Digital Transformation Competence Based on the Grey Cluster Method. In Proceedings of the 2021 IEEE International Conference on Industrial Engineering and Engineering Management (IEEM); IEEE: New York, NY, USA, 2021; pp. 533–537. [Google Scholar]
- Zhou, M. A Theory on AI Uncertainty Based on Rademacher Complexity and Shannon Entropy. In Proceedings of 2020 IEEE 3rd International Conference of Safe Production and Informatization, IICSPI; IEEE: New York, NY, USA, 2020; pp. 24–27. [Google Scholar] [CrossRef] [Scilit]
- Hedi, I.; Malic, E.; Sikirica, N.; Musulin, M.; Simag, D.; Filjar, R. An Analysis of GNSS TEC Predictability during a Rapidly Developing Short-Term Geomagnetic Storm Using Shannon Entropy. In Proceedings of the 2022 30th Telecommunications Forum, TELFOR 2022—Proceedings; Institute of Electrical and Electronics Engineers Inc.: New York, NY, USA, 2022. [Google Scholar]
- Zeleny, M. Multiple Criteria Decision Making Kyoto; Springer: Berlin/Heidelberg, Germany, 1976; Volume 123. [Google Scholar]
- Liu, Q.; Li, Y. Design and Application of Landscape Design Space Perception Teaching Based on VR Virtual Environment Technology. In Proceedings of the Proceedings of the 6th IEEE Eurasian Conference on Educational Innovation 2023: Educational Innovations and Emerging Technologies, ECEI 2023; Institute of Electrical and Electronics Engineers Inc.: New York, NY, USA, 2023; pp. 92–95. [Google Scholar]
- Werner, T.; Bebbington, A.; Gregory, G. Assessing Impacts of Mining: Recent Contributions from GIS and Remote Sensing. Extr. Ind. Soc. 2019, 6, 993–1012. [Google Scholar] [CrossRef] [Scilit]
- Delgado, A.; Aliaga, D.; Carlos, C.; Vergaray, L.; Carbajal, C. Artificial Intelligence Model Based on Grey Clustering for Integral Analysis of Industrial Hygiene Risk. Int. J. Adv. Comput. Sci. Appl. 2021, 12, 389–395. [Google Scholar] [CrossRef] [Scilit]
- Augustsson, A.; Filipsson, M.; Öberg, T.; Bergbäck, B. Climate Change—An Uncertainty Factor in Risk Analysis of Contaminated Land. Sci. Total Environ. 2011, 409, 4693–4700. [Google Scholar] [CrossRef] [Scilit]
- Kenari, M.T.; Ozdemir, A.; Heidari, A. Probabilistic Approach to Assess and Minimize the Voltage Violation Risk in Active Distribution Networks. In Proceedings of the 2024 18th International Conference on Probabilistic Methods Applied to Power Systems (PMAPS); IEEE: New York, NY, USA, 2024; pp. 1–5. [Google Scholar]
- Zadeh, L. Fuzzy Sets. Inf. Control 1965, 8, 338–353. [Google Scholar] [CrossRef] [Scilit]
- Ju-Long, D. Control Problems of Grey Systems. Syst. Control Lett. 1982, 1, 288–294. [Google Scholar] [CrossRef] [Scilit]
- Liu, S.; Lin, Y. Grey Systems; Springer: Berlin/Heidelberg, Germany, 2011; Volume 68. [Google Scholar]
- Rios, S.; Delgado, A.; De la Cruz, A. Applying Grey Clustering and Shannon Entropy to Assess Social Impact from Lithium Mining Project. In Proceedings of the 2022 IEEE XXIX International Conference on Electronics, Electrical Engineering and Computing (INTERCON); IEEE: New York, NY, USA, 2022; pp. 1–4. [Google Scholar]
- Delgado, A.; Romero, I. Applying Grey Systems and Shannon Entropy to Social Impact Assessment and Environmental Conflict Analysis. Int. J. Appl. Eng. Res. 2017, 12, 14327–14337. [Google Scholar]
- DeGroot, M.H.; Schervish, M.J. Probability and Statistic, 4th ed.; Addison-Wesley, Ed.; Thang Long University: Hanoi, Vietnam, 2012. [Google Scholar]
- Liu, S.; Lin, C.; Yang, Y. Several Problems Need to Be Studied in Grey System Theory. In Proceedings of the 2017 International Conference on Grey Systems and Intelligent Services (GSIS); IEEE: New York, NY, USA, 2017; pp. 1–4. [Google Scholar]
- Shannon, C. A Mathematical Theory of Communication. Bell Syst. Tech. J. 1948, 27, 379–423. [Google Scholar] [CrossRef] [Scilit]
- Dwivedi, P.P.; Sharma, D.K. Application of Shannon Entropy and CoCoSo Methods in Selection of the Most Appropriate Engineering Sustainability Components. Clean. Mater. 2022, 5, 100118. [Google Scholar] [CrossRef] [Scilit]
- Dao, M.; Nguyen, A.; Nguyen, T.; Pham, H.; Nguyen, D.; Tran, Q.; Dao, H.; Nguyen, D.; Dang, H.; Hens, L. A Hybrid Approach Using Fuzzy AHP-TOPSIS Assessing Environmental Conflicts in the Titan Mining Industry along Central Coast Vietnam. Appl. Sci. 2019, 9, 2930. [Google Scholar] [CrossRef] [Scilit]
- Sang, K.; Fontana, G.L.; Piovan, S.E. Assessing Railway Landscape by AHP Process with GIS: A Study of the Yunnan-Vietnam Railway. Remote Sens. 2022, 14, 603. [Google Scholar] [CrossRef] [Scilit]
- Jiskani, I.M.; Han, S.; Rehman, A.U.; Shahani, N.M.; Tariq, M.; Brohi, M.A. An Integrated Entropy Weight and Grey Clustering Method–Based Evaluation to Improve Safety in Mines. Min. Metall. Explor. 2021, 38, 1773–1787. [Google Scholar] [CrossRef] [Scilit]
- Delgado, A.; Minhuey, Y.; Lino, C.; Culqui, J.; Huamani, E.L. Algorithm Based on Grey Clustering and Shannon Entropy to Assess Landscape Visual Quality. Int. J. Emerg. Technol. Adv. Eng. 2022, 12, 106160. [Google Scholar] [CrossRef] [Scilit]
- Alberruche-del Campo, M.E.; Arranz-González, J.C.; Rodríguez-Gómez, V.; Fernández-Naranjo, F.J.; Rodríguez-Pacheco, R.; Vadillo-Fernández, L. Methodology for the Evaluation of the Residual Impact on Landscape Due to an Opencast Coal Mine in Laciana Valley (Spain). Dyna 2015, 82, 60–69. [Google Scholar] [CrossRef] [Scilit]
- Muñoz-Pedreros, A. La Evaluación Del Paisaje: Una Herramienta de Gestión Ambiental. Rev. Chil. Hist. Nat. 2004, 77, 139–156. [Google Scholar] [CrossRef] [Scilit]
- Franch-Pardo, I.; Cancer-Pomar, L. El Componente Visual En La Cartografía Del Paisaje. Aptitud Paisajística Para La Protección En La Cuenca Del Río Chiquito (Morelia, Michoacán). Investig. Geográficas 2016, 2017, 42–60. [Google Scholar] [CrossRef] [Scilit]
- Shramchenko, A.; Shramchenko, V. Mutual Incidence Matrix of Two Balanced Incomplete Block Designs. J. Comb. Des. 2024, 32, 579–590. [Google Scholar] [CrossRef] [Scilit]
- Delgado, A.; Aguirre, A.; Palomino, E.; Salazar, G. Applying Triangular Whitenization Weight Functions to Assess Water Quality of Main Affluents of Rimac River. In Proceedings of the 2017 Electronic Congress, E-CON UNI; IEEE: New York, NY, USA, 2017; pp. 1–4. [Google Scholar] [CrossRef] [Scilit]
- Delgado, A.; Romero, I. Environmental Conflict Analysis on a Hydrocarbon Exploration Project Using the Shannon Entropy. In Proceedings of the 2017 Electronic Congress, E-CON UNI 2017; Institute of Electrical and Electronics Engineers Inc.: New York, NY, USA, 2017; pp. 1–4. [Google Scholar]
- Huang, W.; Chuai, X.; Rao, Y.; Li, B. Shannon Entropy-Based Seismic Local Correlation Measure and Enhancement. IEEE Geosci. Remote Sens. Lett. 2022, 19, 3000905. [Google Scholar] [CrossRef] [Scilit]
- Zhang, Y.; Ni, J.; Liu, J.; Jian, L. Grey Evaluation Empirical Study Based on Center-Point Triangular Whitenization Weight Function of Jiangsu Province Industrial Technology Innovation Strategy Alliance. Grey Syst. Theory Appl. 2014, 4, 124–136. [Google Scholar] [CrossRef] [Scilit]
- Pallot, M.; Krawczyk, P. Landscaping User Centered Related Methods Applied in the Context of Living Labs. In Proceedings of the 2015 IEEE International Conference on Engineering, Technology and Innovation/International Technology Management Conference (ICE/ITMC); IEEE: New York, NY, USA, 2015; pp. 1–8. [Google Scholar]
- Fu, Y.; Bao, R. Design of GPU Parallel Algorithm for Landscape Index Based on Virtual Reality Technology. In Proceedings of the 2022 International Conference on Knowledge Engineering and Communication Systems (ICKES); IEEE: New York, NY, USA, 2022; pp. 1–4. [Google Scholar]
- Quintero, L.F.O. Cuencas Hidrográficas y Ecología Del Paisaje: Una Guía Conceptual y Metodológica; Universidad Distrital Francisco Jose de Caldas: Bogotá, Colombia, 2021. [Google Scholar]
- Aguilera-Fernández, I.; Batista-Legrá, Y.; Bastola, S.; Rojas-Purón, L. Impacto Visual Generado Por La Explotación Minera En El Yacimiento Punta Gorda, Moa. Minería Y Geol. 2016, 32, 141–159. [Google Scholar]
- Mei, X.; Kunii, Y. The Correlation Between Quantitative Metrics and Subjective Assessment of Sequential and Scene Landscape in Game Ghost of Tsushima. In Proceedings of the 2024 IEEE Gaming, Entertainment, and Media Conference (GEM); IEEE: New York, NY, USA, 2024; pp. 1–6. [Google Scholar]
- Wei, X.; Xin, L.; Mengyuan, T. Analysis and Prospect of Traditional Tibetan Settlement Landscape Knowledge Mapping Based on the Citespace Method. In Proceedings of the 2021 IEEE International Conference on Artificial Intelligence and Computer Applications (ICAICA); IEEE: New York, NY, USA, 2021; pp. 1–8. [Google Scholar]
- Higuchi, T. The Visual and Spatial Structure of Landscape; Gihodo Publishing: Tokyo, Japan, 1975. [Google Scholar]
- Xu, F.; Zhang, W.; Li, H. Landscape Pattern Analysis of Farmland under Different Slope. In Proceedings of the 2013 Second International Conference on Agro-Geoinformatics (Agro-Geoinformatics); IEEE: New York, NY, USA, 2013; pp. 352–355. [Google Scholar]
- Montaya, R.; Padilla, J.; Stanford, C. Valoración de La Calidad y Fragilidad Visual Del Paisaje En El Valle de Zapotitlán de Las Salinas, Puebla (México). Boletín Asoc. Geógrafos Españoles 2003, 35, 123–136. [Google Scholar]
- Wang, Y.; Wang, S.; Wang, X.; Huang, X.; Li, X.; Zhang, X.; Li, Z. Dynamic Visual Landscape Assessment of Disused Railway in Complex Terrain: A Study of Jingmen Railway. IEEE J. Sel. Top Appl. Earth Obs. Remote Sens. 2024, 17, 10877–10892. [Google Scholar] [CrossRef] [Scilit]
- Parrilla, E.; Márquez, J.; Rodríguez, V. Establecimiento de La Fragilidad Visual Del Paisaje Mediante SIG En El Entorno Del P.N. de La Breña y Marismas Del Barbate (Cádiz, España): Aproximación Metodológica; Departamento de Geografía Física y Análisis Geográfico Regional, Universidad de Sevilla: Sevilla, Spain, 2005. [Google Scholar]
- Menegaki, M. Assessing the Visual Impacts of Surface Mining: A Systematic Review a Systematic Review. Acta Innov. 2020, 37, 21–35. [Google Scholar] [CrossRef] [Scilit]
- Zhang, L.; Zhai, Z.; Zhou, Y.; Liu, S.; Wang, L. The Landscape Pattern Evolution of Typical Open-Pit Coal Mines Based on Land Use in Inner Mongolia of China During 20 Years. Sustainability 2022, 14, 9590. [Google Scholar] [CrossRef] [Scilit]
- Dentoni, V.; Grosso, B.; Massacci, G.; Soddu, G.P. Visual Impact Evaluation of Mines and Quarries: The Updated Lvi Method. Environ. Earth Sci. 2020, 79, 100. [Google Scholar] [CrossRef] [Scilit]
- Sacasqui, M. Comparison of Methodologies: Analytical Hierarchy Process and Grey Clustering with Entropy Weight for the Multicriteria Assessment of the Energy Sources of Perú. In Proceedings of the 2018 IEEE PES Transmission & Distribution Conference and Exhibition—Latin America (T&D-LA); IEEE: New York, NY, USA, 2018; pp. 1–5. [Google Scholar]
- Abady Avman, M.; Osmotherly, P.G.; Snodgrass, S.J. Hip Joint Kinematic Assessment in Chronic Non-Specific Low Back Pain Patients. A Delphi Study. Musculoskelet Sci. Pract. 2025, 75, 103215. [Google Scholar] [CrossRef] [Scilit] [PubMed]
- Xiao, H.; Zeng, S.; Peng, Y.; Kou, G. A Simulation Optimization Approach for Weight Valuation in Analytic Hierarchy Process. Eur. J. Oper. Res. 2025, 321, 851–864. [Google Scholar] [CrossRef] [Scilit]





| Method | Probabilistic Approaches [14,21] | Fuzzy Logic [16] | Grey Systems [7,18,22] |
|---|---|---|---|
| Theoretical basis and approach | Based on probability theory, they model uncertainty by means of probability distributions. | It uses fuzzy sets and fuzzy implication rules to represent uncertainty and imprecision in a more flexible way. | Based on the theory of grey systems. Uses the concept of “grey” to represent the uncertainty between black and white. |
| Areas of application | Common in statistics and data analysis, it works well with organized data and large samples. | Widely used in fuzzy control systems and decision-making in the presence of ambiguous or imprecise data. | Widely used in social conflict assessments, environmental quality, and information-poor decision-making. |
| Advantages | Handles quantifiable uncertainty with a solid mathematical basis to provide accurate results in various cases. | Addresses uncertainty in non-quantifiable situations, managing imprecision and vagueness. Handles subjective and qualitative uncertainty, allowing one to express diffuse degrees of membership. | It manages uncertainty in limited data and adapts to small samples, allowing complex systems with multiple variables to be modelled intuitively. |
| Disadvantages | Needs detailed data and accurate assumptions for quantifiable environments. Not suitable for situations with limited information, small samples, or qualitative uncertainty. | Interpolation between categories can be subjective, requiring a precise definition of fuzzy rules. Its construction is complex and requires expert knowledge to define fuzzy sets and appropriate rules. | Limited applicability in quantifiable problems, possible difficulty in interpreting results. Less accurate than probabilistic approaches with abundant data, and less suitable for purely logical problems. |
| Methodological Stage | Numerical Domain | Description |
|---|---|---|
| Initial rating of criteria | [0–4] | Original evaluation scale of landscape criteria |
| Grey classes | s classes | Discretization of the numerical domain into grey classes |
| CTWF | [0–1] | Degree of membership to each grey class |
| Percentage system | αk (%) | Transformation of membership values into relative intensity |
| Final index | [0–4] | Aggregated weighted score |
| Interpretation | Qualitative levels | Linguistic description of impact severity |
| Classes of Fob | Area in Relation to Each Landscape Unit (LU) (%) | Score |
|---|---|---|
| Very High | >80.00 | 3.00–4.00 |
| High | 16.00–80.00 | 2.50–3.00 |
| Medium–High | 8.00–16.00 | 2.00–2.50 |
| Medium | 4.00–8.00 | 1.50–2.00 |
| Low–Medium | 2.00–4.00 | 1.00–1.50 |
| Low | <2.00 | 0.00–1.00 |
| Visual Accessibility | Description | Score |
|---|---|---|
| Very High | D < 3000 m and Fob very high | 3.00–4.00 |
| High | D < 3000 m and Fob high | 2.50–3.00 |
| Medium–High | D < 3000 m and F medium–high or D > 3000 m and Fob very high | 2.00–2.50 |
| Medium | D < 3000 m and F medium or D > 3000 m and Fob (high or medium–high) | 1.50–2.00 |
| Low–Medium | D < 3000 m and F (medium, low, or low–medium) or D > 3000 m and Fob medium | 1.00–1.50 |
| Low | D > 3000 m and Fob low | 0.00–1.00 |
| Code | Landscape Units (LUs) |
|---|---|
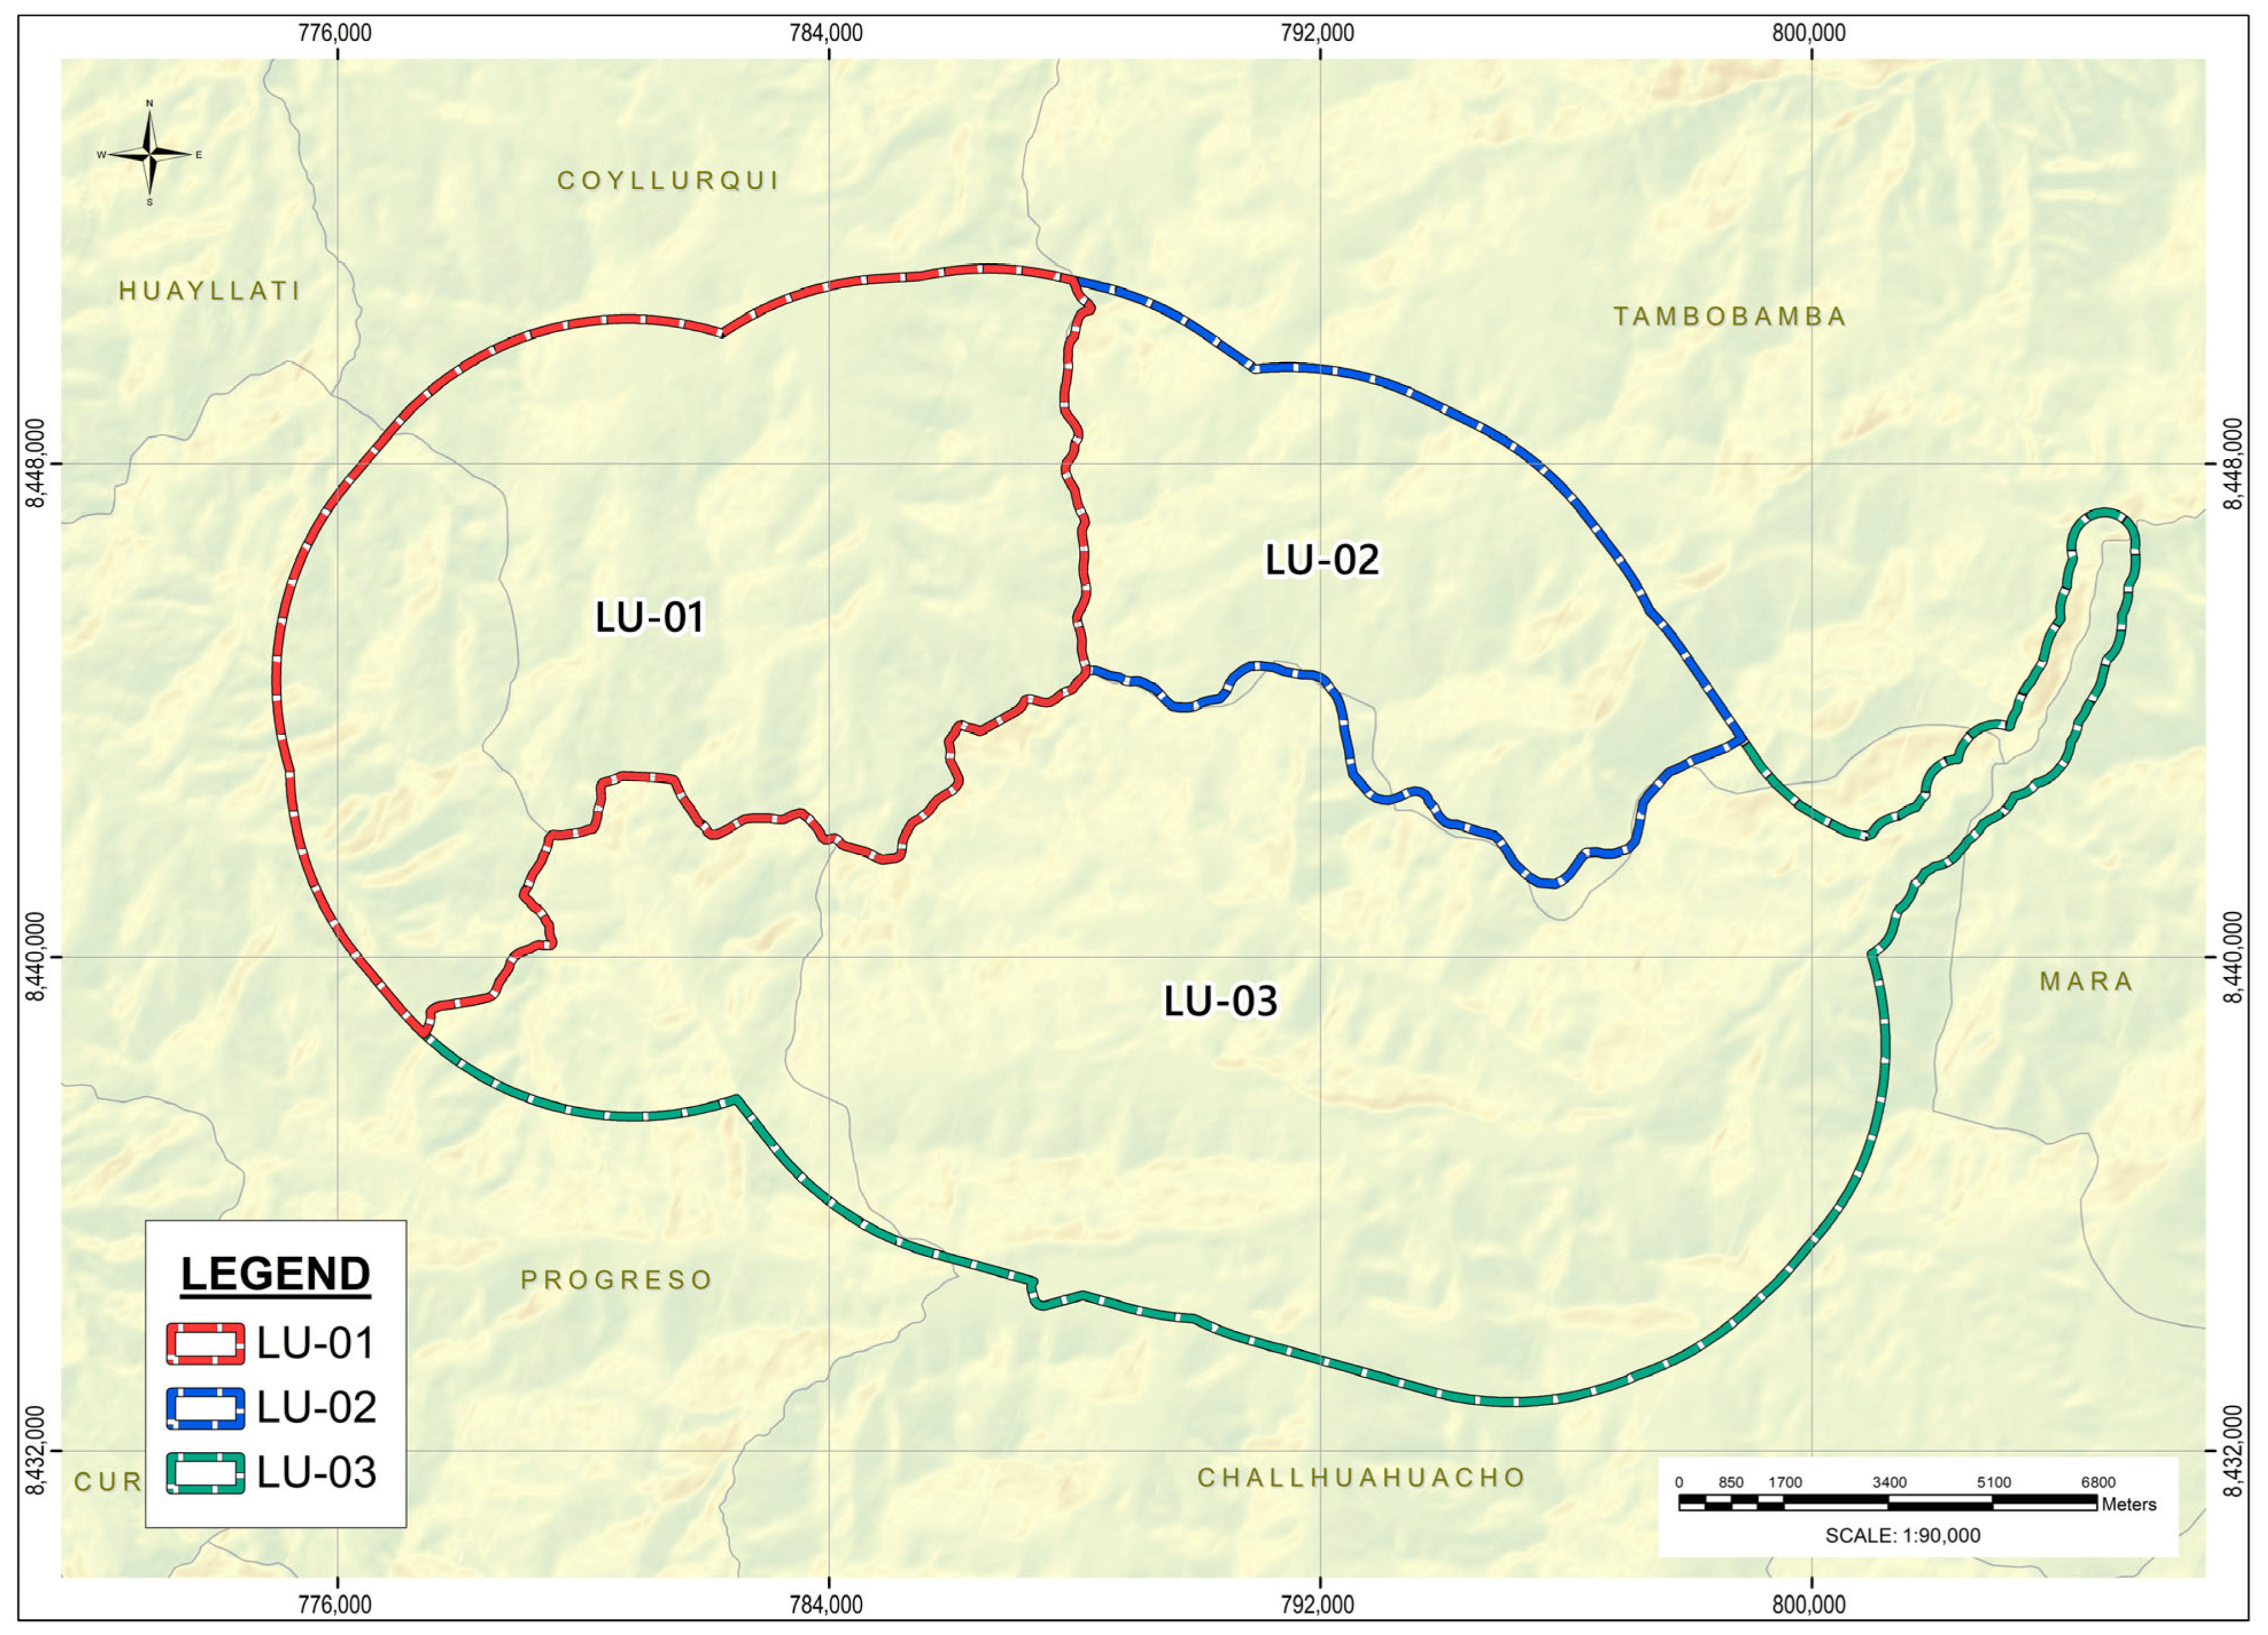
| LU-1 | Upper Ucayali Watershed |
| LU-2 | St. Thomas North Watershed |
| LU-3 | St. Thomas South Watershed |
| LU | Criteria | |||
|---|---|---|---|---|
| C1 | C2 | C3 | C4 | |
| Before the project | ||||
| LU-1 | 2.311 | 1.558 | 3.092 | 3.583 |
| LU-2 | 2.199 | 1.574 | 3.000 | 2.965 |
| LU-3 | 2.424 | 1.634 | 3.908 | 3.181 |
| After the project | ||||
| LU-1 | 0.924 | 1.211 | 1.237 | 1.866 |
| LU-2 | 1.759 | 1.431 | 1.800 | 2.459 |
| LU-3 | 0.969 | 1.112 | 1.563 | 1.360 |
| LU | Criteria | |||||
|---|---|---|---|---|---|---|
| F1 | F2 | F3 | F4 | F5 | F6 | |
| LU-1 | 2.517 | 1.668 | 4.000 | 2.311 | 2.475 | 1.957 |
| LU-2 | 2.454 | 1.690 | 4.000 | 2.199 | 2.464 | 1.941 |
| LU-3 | 2.261 | 1.504 | 4.000 | 2.424 | 2.472 | 2.015 |
| Grey Classes | |||||
|---|---|---|---|---|---|
| S1 | S2 | S3 | S4 | S5 | S6 |
| [0.00–1.00] | [1.00–1.50] | [1.50–2.00] | [2.00–2.50] | [2.50–3.00] | [3.00–4.00] |
| Criteria | Grey Classes | |||||||
|---|---|---|---|---|---|---|---|---|
| S1 | S2 | S3 | S4 | S5 | S6 | |||
| λ0 | λ1 | λ2 | λ3 | λ4 | λ5 | λ6 | λ7 | |
| C1 | 0 | 0.50 | 1.25 | 1.75 | 2.25 | 2.75 | 3.50 | 4 |
| C2 | 0 | 0.50 | 1.25 | 1.75 | 2.25 | 2.75 | 3.50 | 4 |
| C3 | 0 | 0.50 | 1.25 | 1.75 | 2.25 | 2.75 | 3.50 | 4 |
| C4 | 0 | 0.50 | 1.25 | 1.75 | 2.25 | 2.75 | 3.50 | 4 |
| Functions | LU-1 | |||
|---|---|---|---|---|
| C1 | C2 | C3 | C4 | |
| 0.000 | 0.000 | 0.000 | 0.000 | |
| 0.000 | 0.383 | 0.000 | 0.000 | |
| 0.000 | 0.617 | 0.000 | 0.000 | |
| 0.878 | 0.000 | 0.000 | 0.000 | |
| 0.122 | 0.000 | 0.544 | 0.000 | |
| 0.000 | 0.000 | 0.456 | 1.000 | |
| Grey Classes | Interval | αk | |
|---|---|---|---|
| S1 | Low | 0.00–25.00 | 12.50 |
| S2 | Medium–Low | 25.00–37.50 | 31.25 |
| S3 | Medium | 37.50–50.00 | 43.75 |
| S4 | Medium–High | 50.00–62.50 | 56.25 |
| S5 | High | 62.50–75.00 | 68.75 |
| S6 | Very High | 75.00–100.00 | 87.50 |
| Functions | LU-1 | |||
|---|---|---|---|---|
| C1 | C2 | C3 | C4 | |
| 0.000 | 0.000 | 0.000 | 0.000 | |
| 0.000 | 11.969 | 0.000 | 0.000 | |
| 0.000 | 26.993 | 0.000 | 0.000 | |
| 49.398 | 0.000 | 0.000 | 0.000 | |
| 8.375 | 0.000 | 37.401 | 0.000 | |
| 0.000 | 0.000 | 39.899 | 87.500 | |
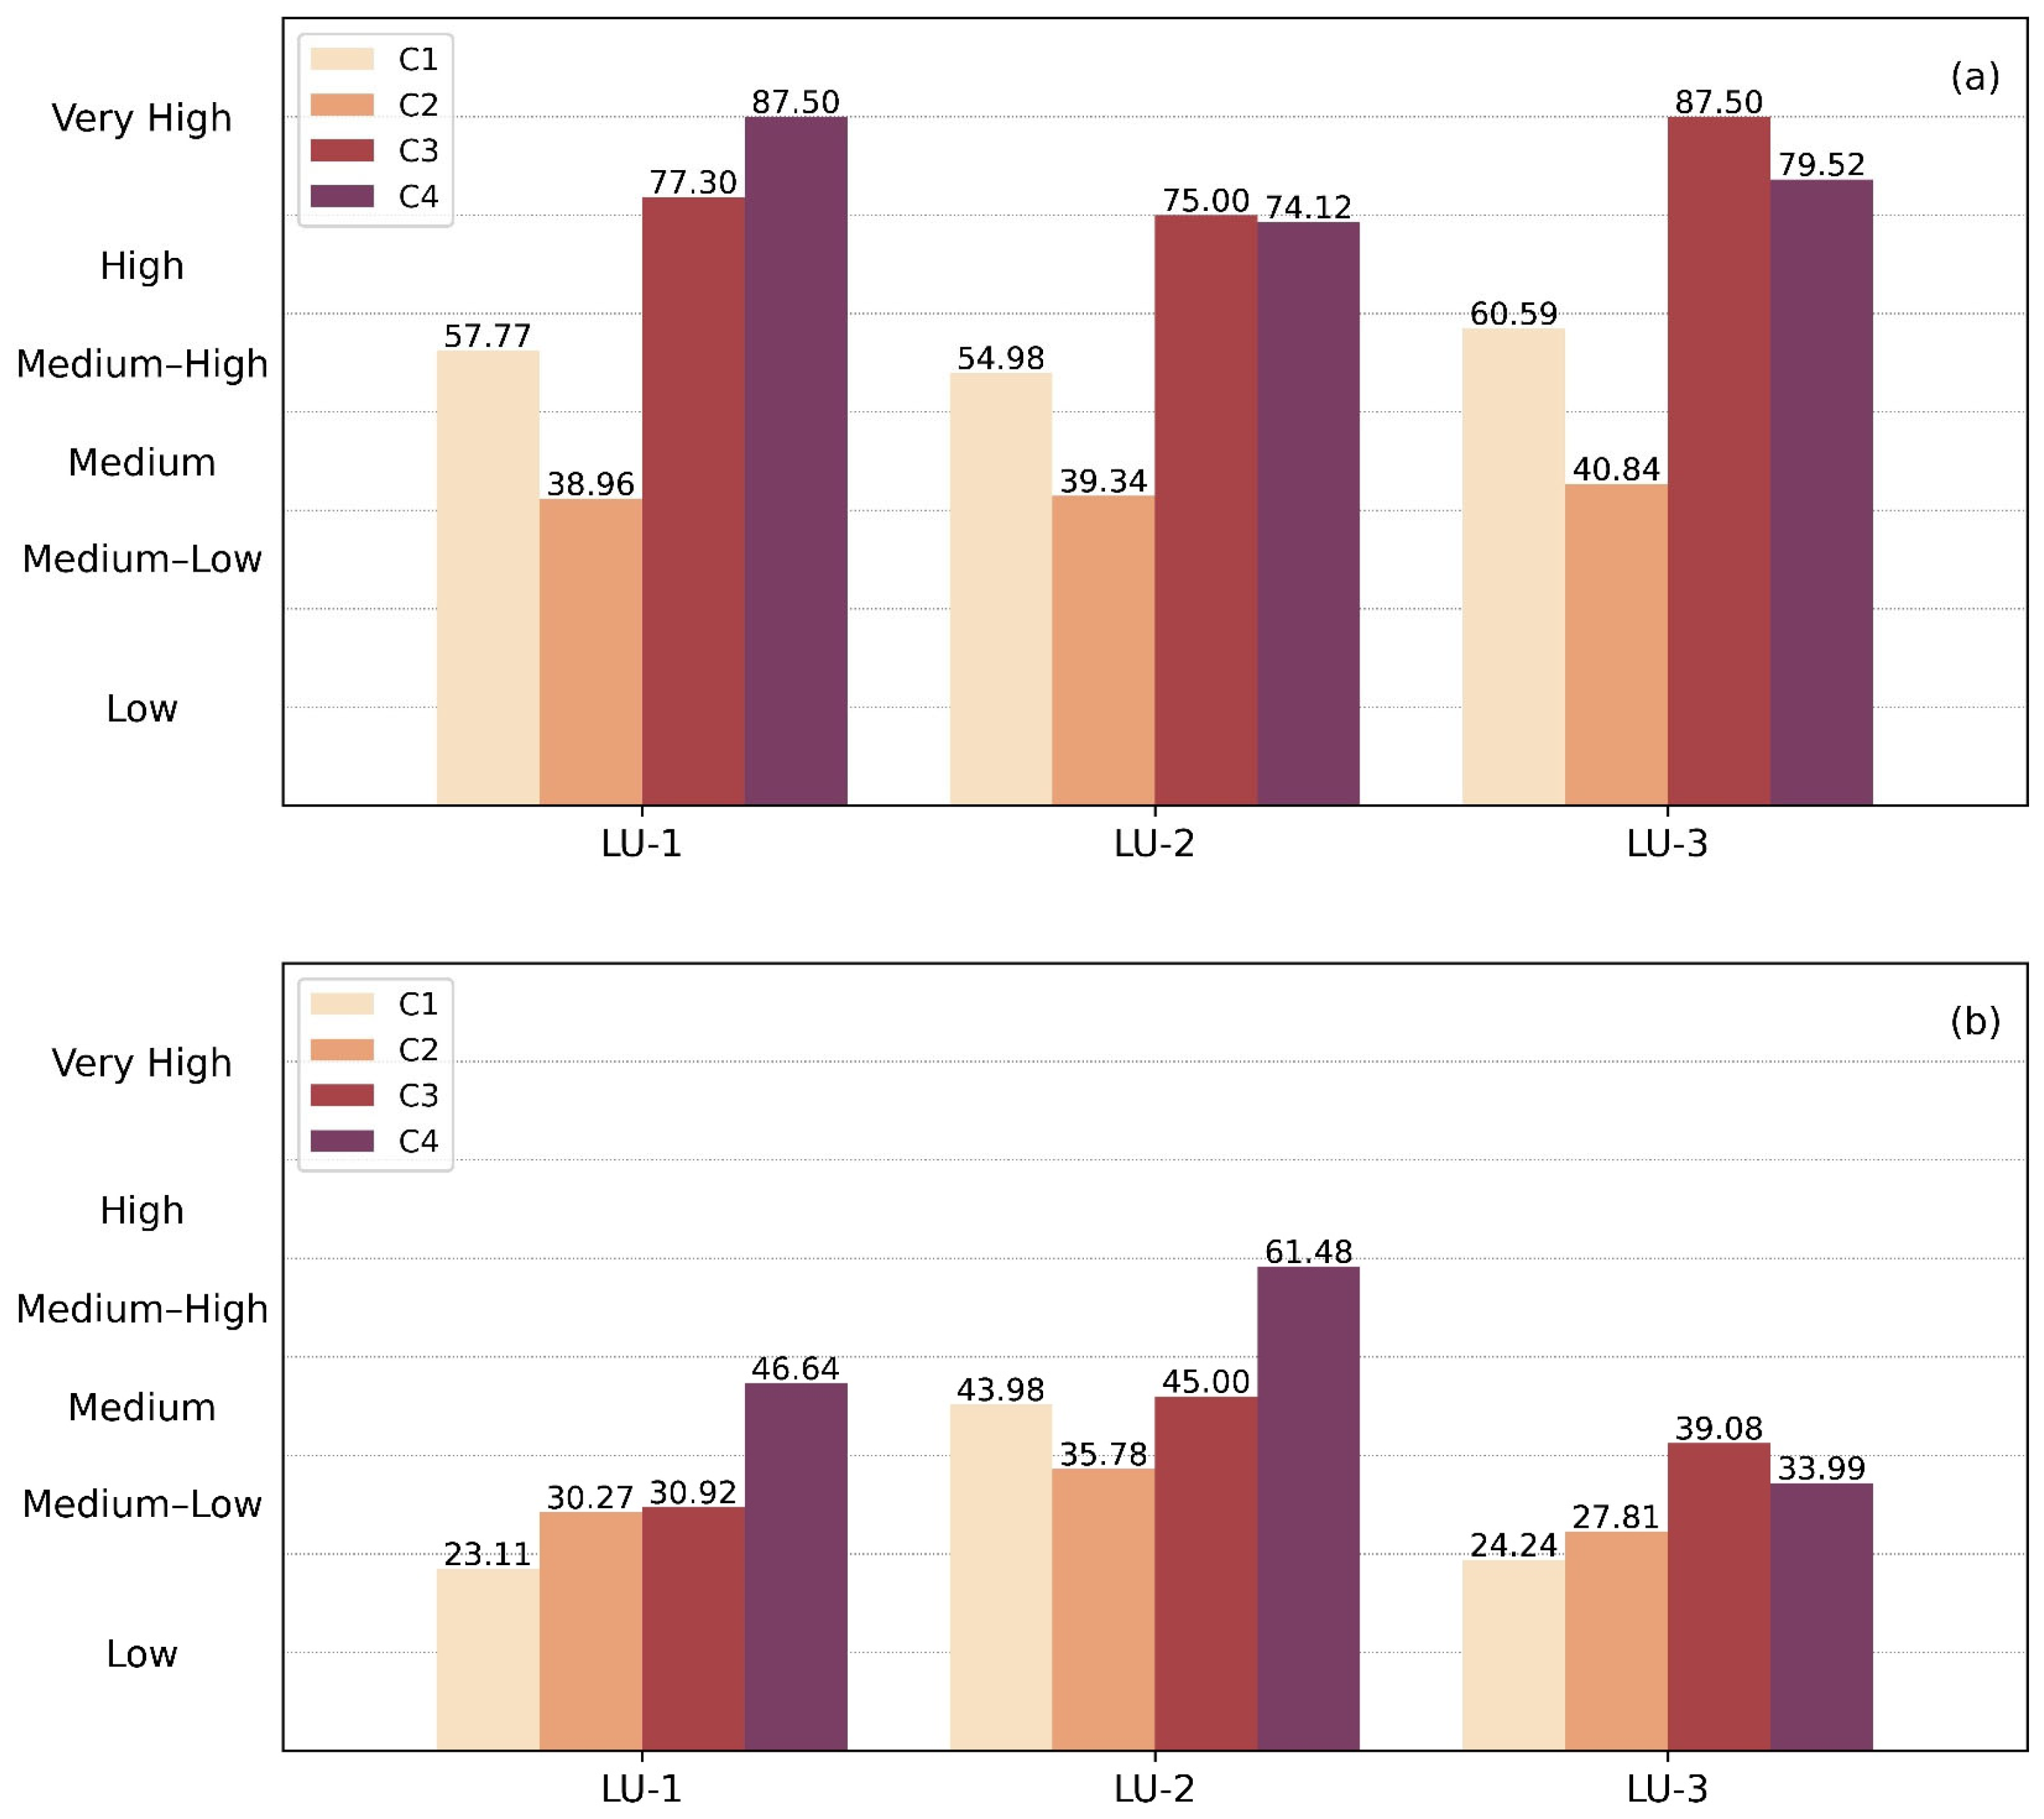
| Total | 57.773 | 38.962 | 77.300 | 87.500 |
| LU | Criteria | |||
|---|---|---|---|---|
| C1 | C2 | C3 | C4 | |
| LU-1 | 0.3333 | 0.3270 | 0.3224 | 0.3629 |
| LU-2 | 0.3172 | 0.3302 | 0.3128 | 0.3074 |
| LU-3 | 0.3495 | 0.3428 | 0.3649 | 0.3298 |
| Sum | 1.0000 | 1.0000 | 1.0000 | 1.0000 |
| Parameter | C1 | C2 | C3 | C4 |
|---|---|---|---|---|
| Hj | 0.9990 | 0.9995 | 0.9977 | 0.9976 |
| divj | 0.0010 | 0.0005 | 0.0023 | 0.0024 |
| wj | 0.1591 | 0.0736 | 0.3802 | 0.3871 |
| LU | Criteria | Total | |||
|---|---|---|---|---|---|
| C1 | C2 | C3 | C4 | ||
| Before the project | |||||
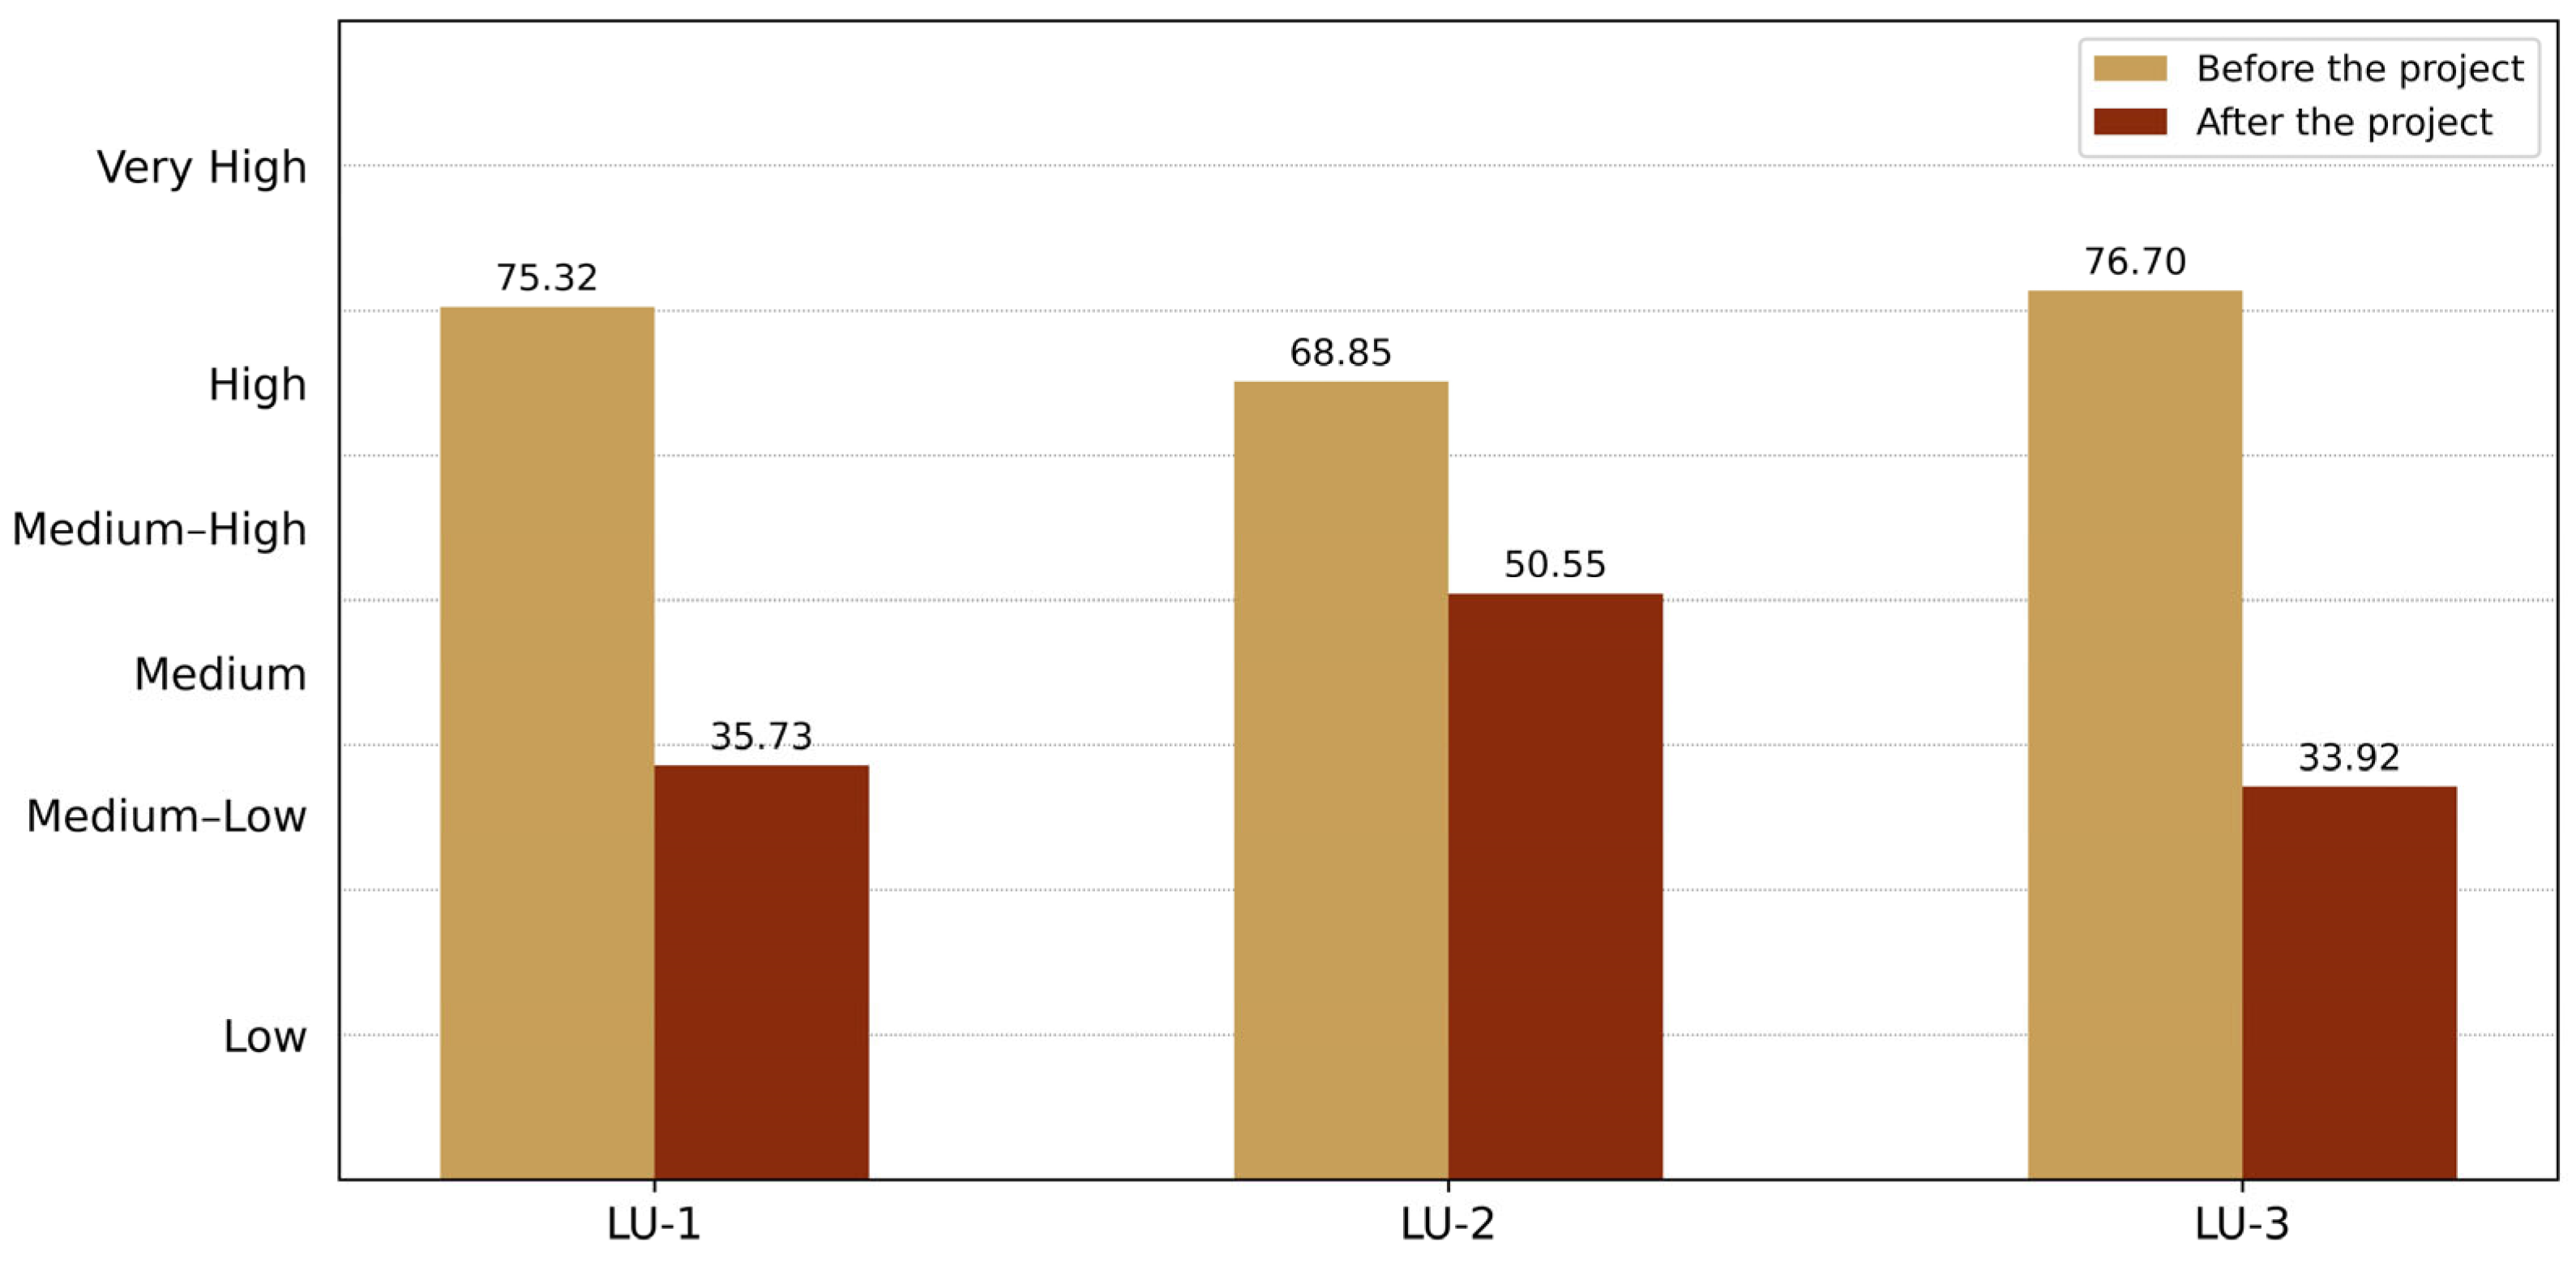
| LU-1 | 57.773 | 38.962 | 77.300 | 87.500 | 75.321 |
| LU-2 | 54.981 | 39.342 | 75.000 | 74.125 | 68.853 |
| LU-3 | 60.590 | 40.843 | 87.500 | 79.520 | 76.697 |
| After the project | |||||
| LU-1 | 23.109 | 30.275 | 30.920 | 46.641 | 35.716 |
| LU-2 | 43.985 | 35.775 | 45.000 | 61.475 | 50.537 |
| LU-3 | 24.236 | 27.807 | 39.080 | 33.994 | 33.920 |
| LU | LU-1 | LU-2 | LU-3 | |
|---|---|---|---|---|
| Before the project | Coefficient | 75.321 | 68.853 | 76.700 |
| Visual Quality | Very High | High | Very High | |
| After the project | Coefficient | 35.726 | 50.547 | 33.920 |
| Visual Quality | Medium–Low | Medium–High | Medium–Low | |
| Effect of change | −52.582% | −26.601% | −55.774% | |
| Effect of Change | Interval (%) | Score |
|---|---|---|
| No effect | 0.00–5.00 | 0.00–1.00 |
| Not significant | 5.00–10.00 | 1.00–1.50 |
| Significant | 10.00–20.00 | 1.50–2.00 |
| Highly significant | 20.00–30.00 | 2.00–2.50 |
| Notable | 30.00–40.00 | 2.50–3.00 |
| Very notable | 40.00–100.00 | 3.00–4.00 |
| LU | Effect of Change | |
|---|---|---|
| Score | Rating | |
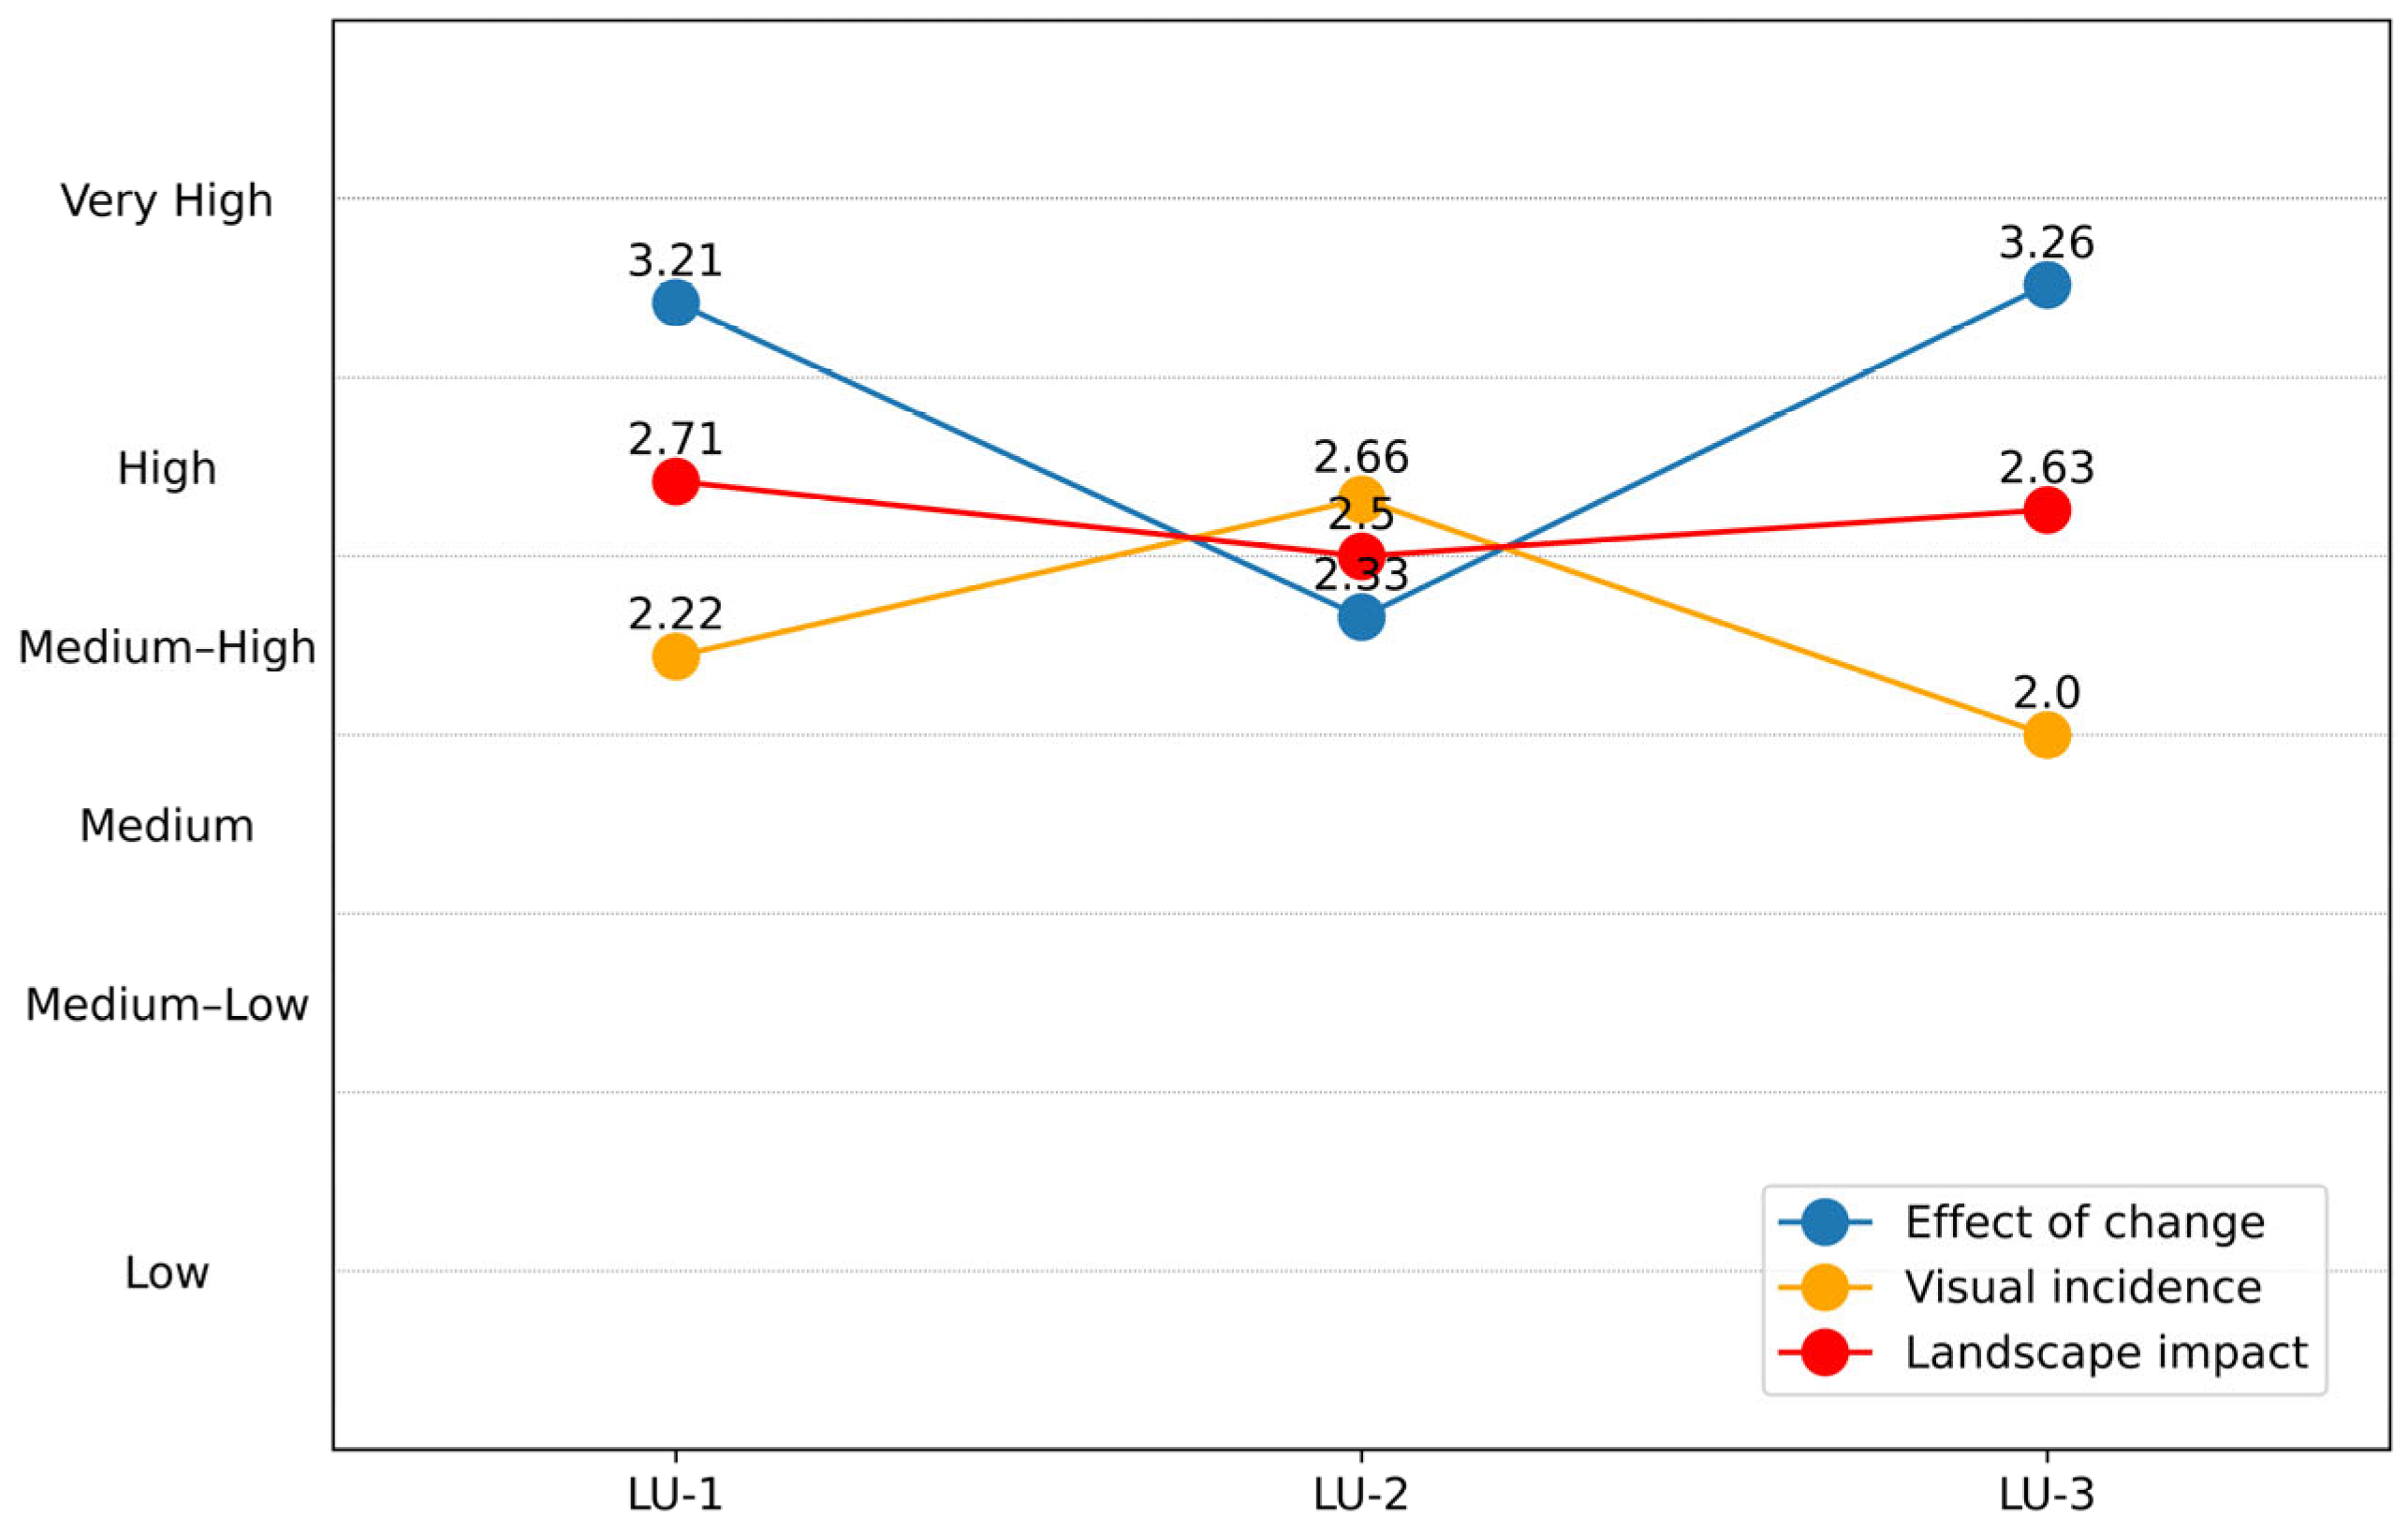
| LU-1 | 3.210 | Very notable |
| LU-2 | 2.330 | Highly significant |
| LU-3 | 3.263 | Very notable |
| Functions | LU-1 | |||||
|---|---|---|---|---|---|---|
| F1 | F2 | F3 | F4 | F5 | F6 | |
| 0.000 | 0.000 | 0.000 | 0.000 | 0.000 | 0.000 | |
| 0.000 | 0.164 | 0.000 | 0.000 | 0.000 | 0.000 | |
| 0.000 | 0.836 | 0.000 | 0.000 | 0.000 | 0.586 | |
| 0.465 | 0.000 | 0.000 | 0.878 | 0.549 | 0.414 | |
| 0.535 | 0.000 | 0.000 | 0.122 | 0.451 | 0.000 | |
| 0.000 | 0.000 | 1.000 | 0.000 | 0.000 | 0.000 | |
| Functions | LU-1 | |||||
|---|---|---|---|---|---|---|
| F1 | F2 | F3 | F4 | F5 | F6 | |
| 0.000 | 0.000 | 0.000 | 0.000 | 0.000 | 0.000 | |
| 0.000 | 5.120 | 0.000 | 0.000 | 0.000 | 0.000 | |
| 0.000 | 36.582 | 0.000 | 0.000 | 0.000 | 25.641 | |
| 26.168 | 0.000 | 0.000 | 49.397 | 30.908 | 23.284 | |
| 36.768 | 0.000 | 0.000 | 8.375 | 30.974 | 0.000 | |
| 0.000 | 0.000 | 87.500 | 0.000 | 0.000 | 0.000 | |
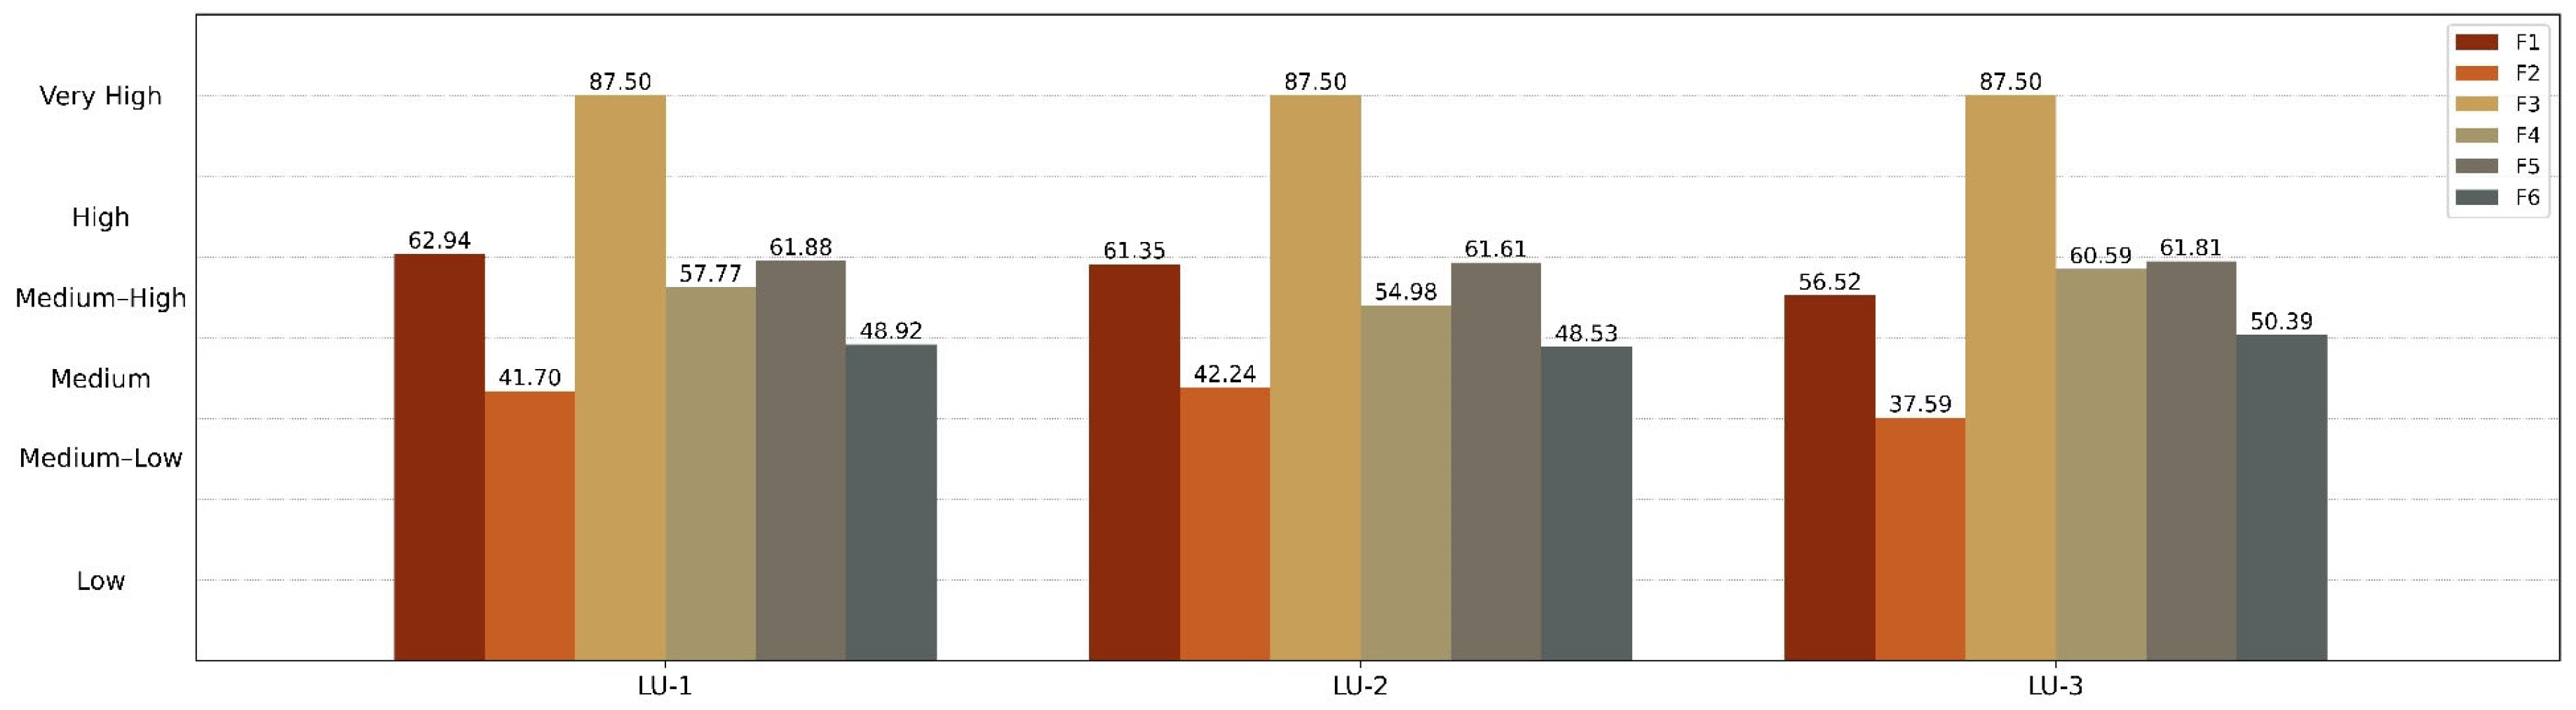
| Total | 62.935 | 41.702 | 87.500 | 57.773 | 61.882 | 48.924 |
| LU | Criteria | |||||
|---|---|---|---|---|---|---|
| F1 | F2 | F3 | F4 | F5 | F6 | |
| LU-1 | 0.348 | 0.343 | 0.333 | 0.333 | 0.334 | 0.331 |
| LU-2 | 0.339 | 0.348 | 0.333 | 0.317 | 0.332 | 0.328 |
| LU-3 | 0.313 | 0.309 | 0.333 | 0.350 | 0.334 | 0.341 |
| Sum | 1.000 | 1.000 | 1.000 | 1.000 | 1.000 | 1.000 |
| F1 | F2 | F3 | F4 | F5 | F6 | |
|---|---|---|---|---|---|---|
| Hj | 0.9988 | 0.9985 | 0.9997 | 0.9990 | 0.9997 | 0.9996 |
| divj | 0.0012 | 0.0015 | 0.0003 | 0.0010 | 0.0003 | 0.0004 |
| wj | 0.2633 | 0.3233 | 0.0575 | 0.2141 | 0.0579 | 0.0838 |
| LU | Criteria | ||||||
|---|---|---|---|---|---|---|---|
| F1 | F2 | F3 | F4 | F5 | F6 | Total | |
| LU-1 | 62.935 | 41.702 | 87.500 | 57.773 | 61.882 | 48.924 | 55.144 |
| LU-2 | 61.350 | 42.244 | 87.500 | 54.981 | 61.610 | 48.529 | 54.255 |
| LU-3 | 56.525 | 37.586 | 87.500 | 60.590 | 61.807 | 50.391 | 52.846 |
| Visual Fragility | Interval | Score |
|---|---|---|
| Low | 0.00–25.00 | 0.00–1.00 |
| Low–Medium | 25.00–37.50 | 1.00–1.50 |
| Medium | 37.50–50.00 | 1.50–2.00 |
| Medium–High | 50.00–62.50 | 2.00–2.50 |
| High | 62.50–75.00 | 2.50–3.00 |
| Very High | 75.00–100.00 | 3.00–4.00 |
| LU | Visual Fragility | Visual Accessibility | ||
|---|---|---|---|---|
| Score | Rating | Score | Rating | |
| LU-1 | 2.206 | Medium–High | 2.230 | Medium–High |
| LU-2 | 2.170 | Medium–High | 3.392 | Very High |
| LU-3 | 2.114 | Medium–High | 1.823 | Medium |
| LU | Visual Incidence | |
|---|---|---|
| Score | Rating | |
| LU-1 | 2.216 | Medium–High |
| LU-2 | 2.659 | High |
| LU-3 | 1.998 | Medium |
| LU | Landscape Visual Impact Index (LI) | |
|---|---|---|
| Score | Rating | |
| LU-1 | 2.713 | High |
| LU-2 | 2.495 | Medium–High |
| LU-3 | 2.630 | High |
Disclaimer/Publisher’s Note: The statements, opinions and data contained in all publications are solely those of the individual author(s) and contributor(s) and not of MDPI and/or the editor(s). MDPI and/or the editor(s) disclaim responsibility for any injury to people or property resulting from any ideas, methods, instructions or products referred to in the content. |
© 2026 by the authors. Licensee MDPI, Basel, Switzerland. This article is an open access article distributed under the terms and conditions of the Creative Commons Attribution (CC BY) license.
Share and Cite
Delgado, A.; Minhuey, A.; Lino, C.; Culqui, J. Visual Impact Assessment Index on Landscape Based on Grey Clustering and Shannon Entropy: A Case Study on a Mining Project. Land 2026, 15, 670. https://doi.org/10.3390/land15040670
Delgado A, Minhuey A, Lino C, Culqui J. Visual Impact Assessment Index on Landscape Based on Grey Clustering and Shannon Entropy: A Case Study on a Mining Project. Land. 2026; 15(4):670. https://doi.org/10.3390/land15040670
Chicago/Turabian StyleDelgado, Alexi, Anabella Minhuey, Carla Lino, and Jhonattan Culqui. 2026. "Visual Impact Assessment Index on Landscape Based on Grey Clustering and Shannon Entropy: A Case Study on a Mining Project" Land 15, no. 4: 670. https://doi.org/10.3390/land15040670
APA StyleDelgado, A., Minhuey, A., Lino, C., & Culqui, J. (2026). Visual Impact Assessment Index on Landscape Based on Grey Clustering and Shannon Entropy: A Case Study on a Mining Project. Land, 15(4), 670. https://doi.org/10.3390/land15040670