


Abstract
The Historical Lateral Mobility Zone (HLMZ) represents the portion of the alluvial plain occupied by the river channel over the last decades or centuries and represents the most flood-prone sector of the floodplain. Mapping Land-Use–Land Cover (LULC) changes within HLMZs helps reconstruct human-driven land-use dynamics and identify the areas potentially exposed to the highest flood risk. Among the rivers of Southern Italy, the Sele River is characterized by one of the largest mean annual discharges and has experienced extreme and destructive floods, such as those from 1935 and 2010. Over the last 150 years, it has also undergone remarkable channel adjustments, consisting of narrowing up to ~120 m, morphological changes, and riverbed degradation. In this study, LULC changes that occurred between 1988 and 2023 within the HLMZ of the Sele River, formed over the last 150 years, were analyzed and mapped in a GIS environment. Active channels were digitized from historical maps, topographic maps, and orthophotos to map the HLMZ. LULC changes were assessed through visual interpretation of orthophotos and Google Earth imagery in a GIS environment. Results show a transition, over 35 years towards more pristine conditions, with forest expansion, reduction in agricultural areas, and absence of further artificialization. LULC dynamics appear to be strictly controlled by an increased awareness of the high flood hazard within the HLMZ, with positive implications in terms of flood risk, which, however, should be further assessed quantitatively in future studies and, possibly, reduced, given the high proneness of the Sele River to destructive floods.
1. Introduction
Land-Use and Land-Cover (LULC) change analysis represents a crucial reference for the assessment of the evolutionary dynamics of the earth’s surface, spatial planning, and environmental policies [1,2]. A large number of studies have investigated the relationships between LULC changes and a wide range of environmental issues, including soil erosion [3,4,5], geo-hydrological phenomena and risks under climate change [6,7,8], demographic pressure and rapid urbanization [9,10]. According to several authors [11,12,13], upland and floodplain LULC changes (mainly afforestation versus deforestation) also affect geomorphological adjustments of river channels, as they control rates of soil erosion on slopes and, consequently, sediment supply to the rivers. In turn, the latter controls river sediment discharge, which is one of the key variables causing river channel adjustments. LULC changes also influence riparian environments [14], widely recognized as among the most threatened habitats at the global scale [15,16], with significant ecological implications for water quality and biodiversity preservation [17], sediment retention and supply, bank erosion control, and flood mitigation [18,19].
In an ecologically fragile and desertification-prone territory, whose economy is largely based on agriculture, as Southern Italy is [20], updated LULC datasets provide a basis for understanding medium- and short-term LULC variation trends in relation to specific environmental and climatic settings. In Italy, despite the availability of LULC change studies at national [21], regional [22], and basin scales [4,23,24], LULC dynamics within the rivers’ Historical Lateral Mobility Zone (hereinafter, HLMZ), which is the most flood-prone portion of the alluvial plain, have not been investigated so far. In this framework, it is worth noting that LULC in river HLMZs deeply affects flood risk, as it influences both vulnerability and exposure. Changes in infrastructure distribution or agricultural activities, which have economic relevance, may increase the potential damages caused by flooding events, increasing vulnerability and exposure. Conversely, natural or semi-natural LULC classes, such as forests, riparian vegetation, and grasslands, generally reduce exposure and contribute to mitigating flood impacts by enhancing hydraulic roughness, stabilizing riverbanks, and promoting sediment retention.
The HLMZ is the portion of the alluvial plain that has been occupied, at least once, by the river’s active channel in a given time span, e.g., in the last 100–200 years. According to Malavoi et al. [25], HLMZ can also be referred to as the functional mobility zone, the latter defined by the channel movements observed in recent decades. In a GIS environment, HLMZ is obtained from the envelope of the different areas occupied by the active channel in the considered time-span. Within HLMZ, the river is free to move laterally, erode, and deposit sediments without being constrained by artificial protections. HMLZs are recognized as preferential zones of channel dynamism over historical times, where morphological adjustments are most likely to occur, and fluvial processes (e.g., channel migration, widening, and erosion) can be sustained, maintaining the river’s ecological and hydraulic functions [26,27]. This concept provides a basis for river management, hazard and risk assessment, and ecological restoration [28]. A correct delineation of the HLMZ is fundamental to defining the Event Morphodynamic Corridor (EMC) [29], which includes the portion of the alluvial plain that is likely to be (re)activated by channel dynamics during severe-to-extreme floods. Existing contributions in the literature focused on HLMZs are relatively scarce in Italy and mainly focused on the geomorphological reconstruction of historical river corridors and channel dynamics [28,29,30,31]. Moreover, studies concerning LULC changes at the HLMZ scale are still scarce, and such analyses are largely unexplored, particularly in Southern Italy.
The interrelationships between fluvial dynamics and LULC changes are deep, as documented in several studies linking agricultural expansion, deforestation, and urbanization to changes in channel dynamics and morphology [4,32,33,34]. Human activities affecting river systems and floodplains (i.e., flow regulation, floodplain land conversion, embankments, gravel mining, and forestry practices) at the local scale have been studied as one of the main driving forces of channel adjustments, as they affect both flow and sediment discharge [32,35,36]. Thus, these activities may ultimately influence channel mobility and the associated spatial configuration of the HLMZ. Because HLMZs are the products of fluvial dynamics, it is straightforward to deduce that investigating the interrelationships between LULC changes and HLMZs is of critical relevance for understanding fluvial dynamics and associated risks.
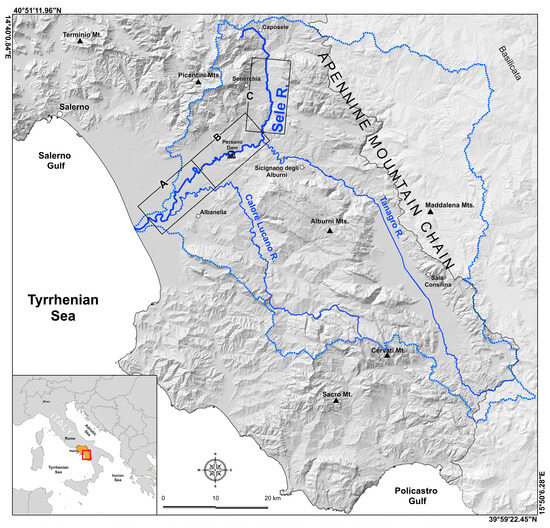
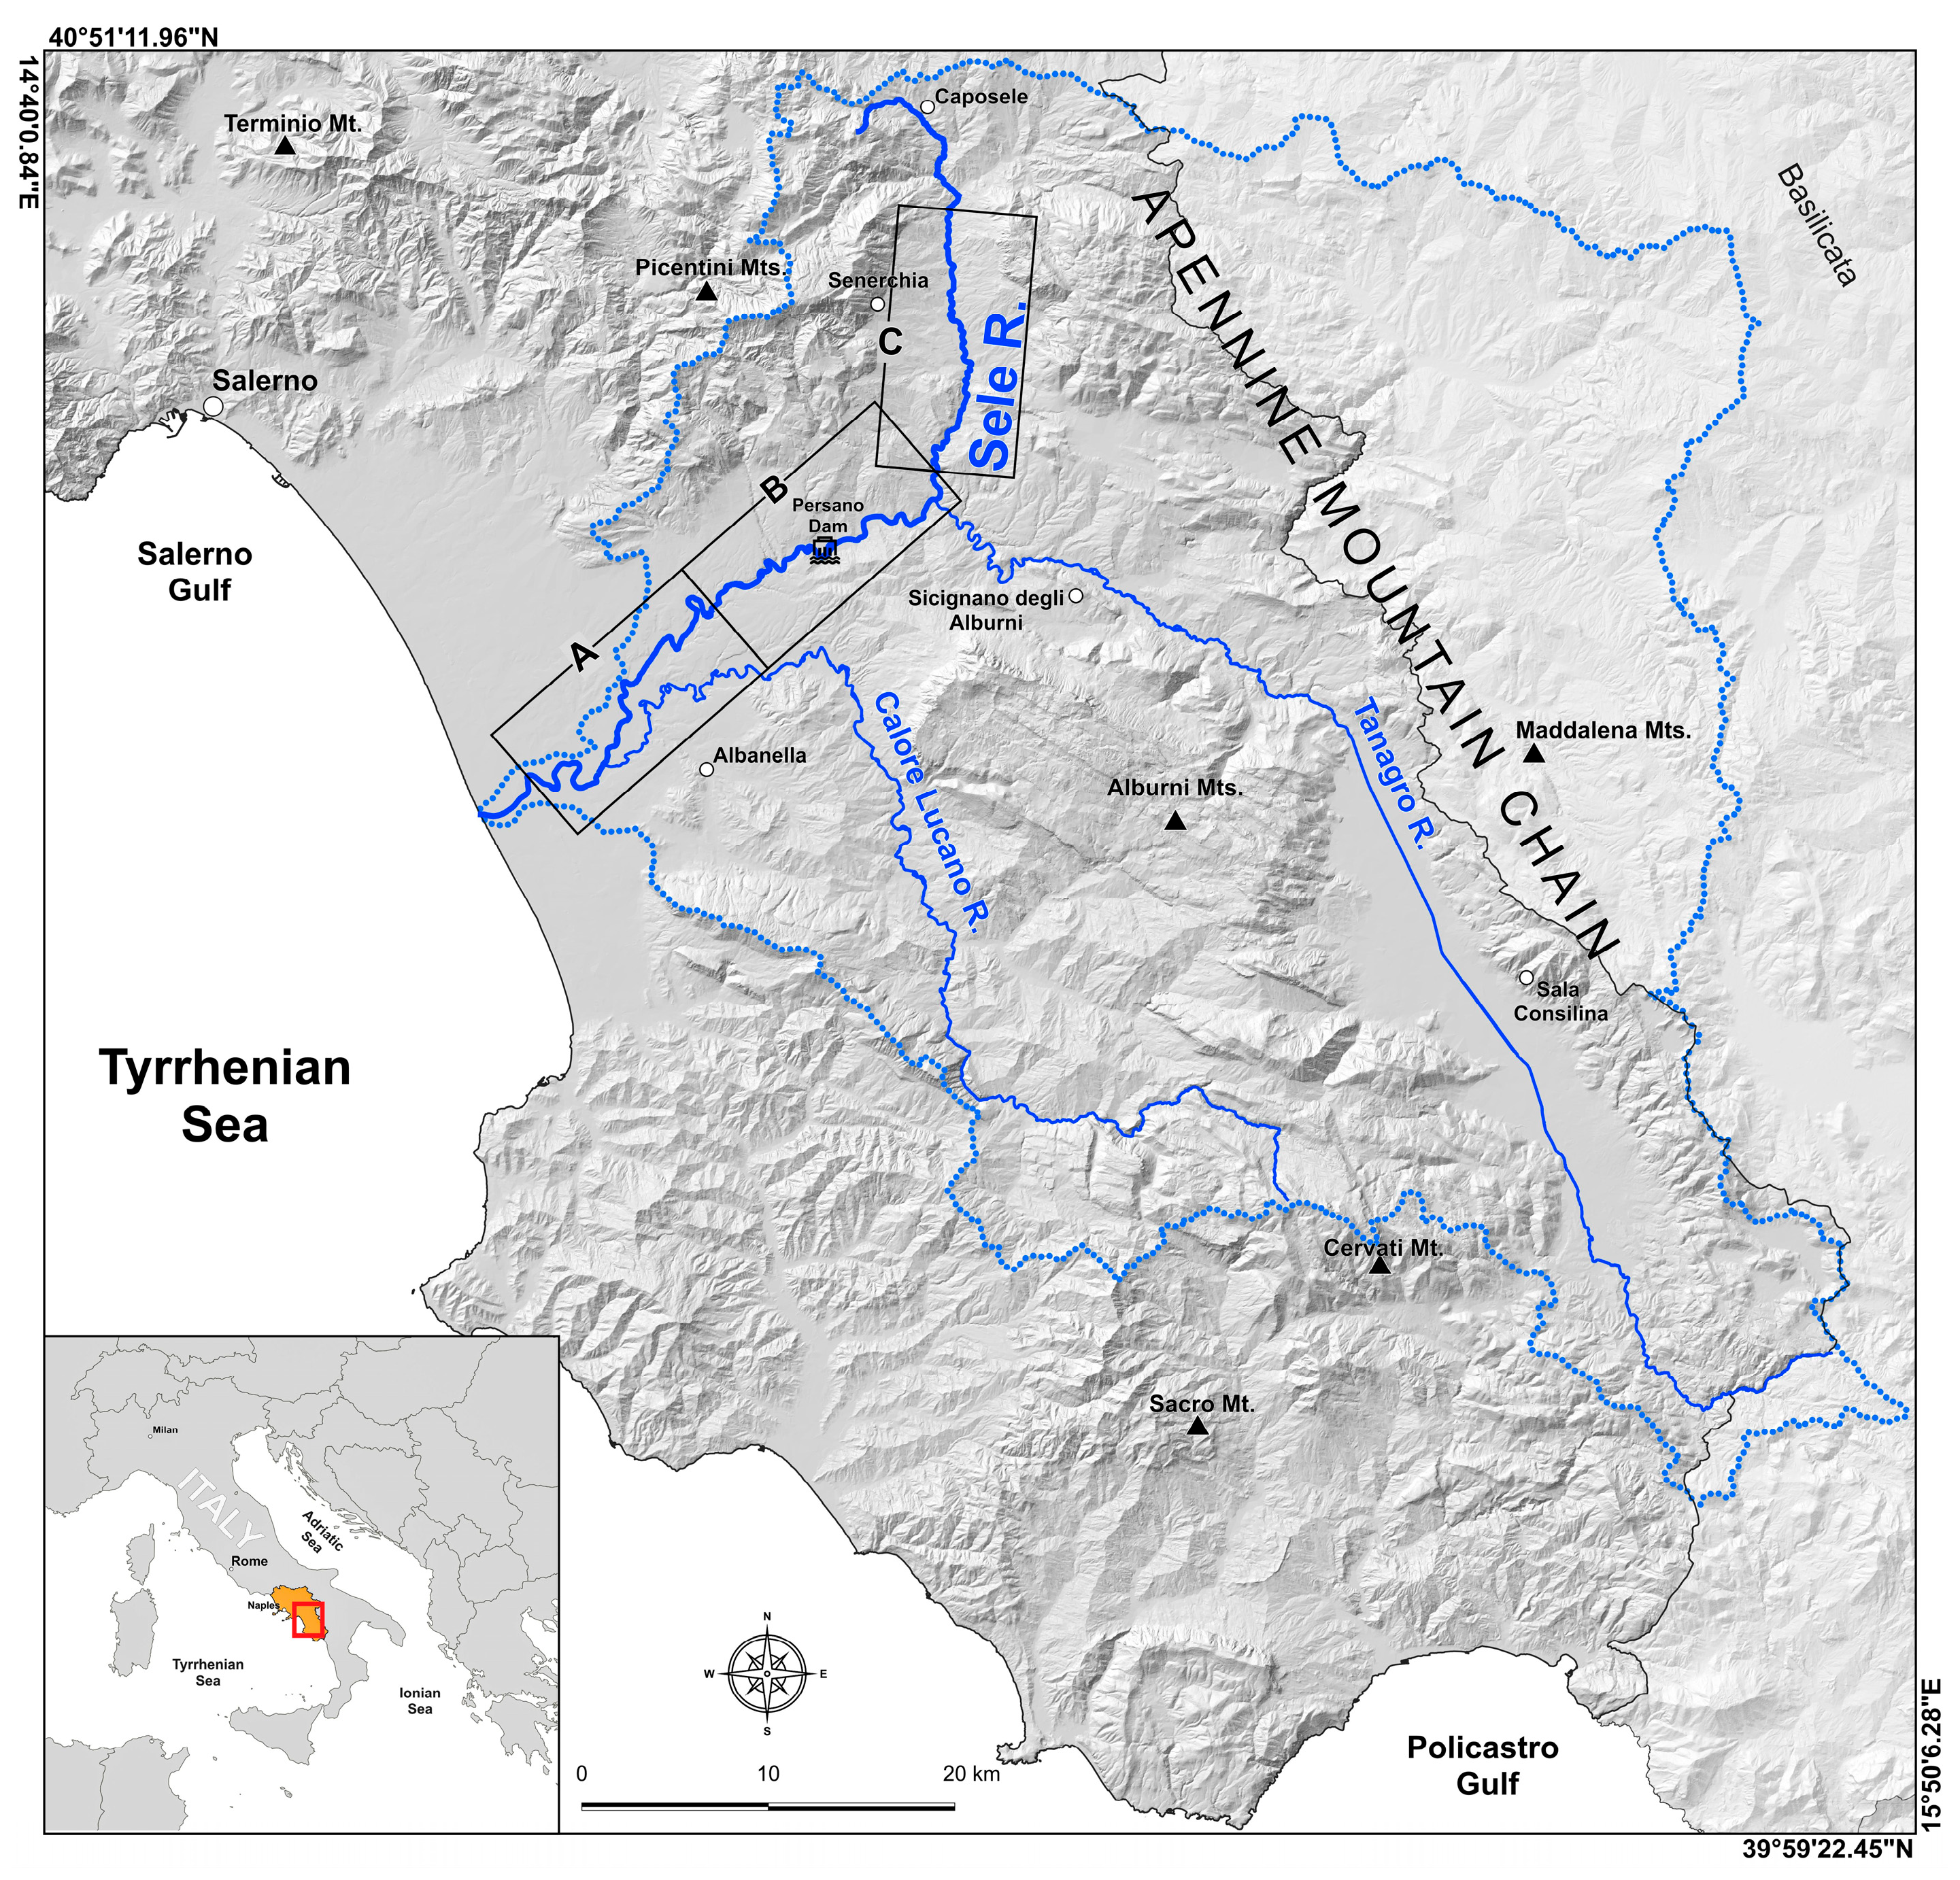
This study has focused on the LULC changes experienced between 1988 and 2023 by the HLMZ of the Sele River, located in the hilly-piedmont and the coastal area of the Campania Region (Southern Italy; Figure 1). According to Magliulo et al. [4], the entire Sele River basin has experienced substantial transformations of LULC in the past decades. Nevertheless, no research has specifically investigated LULC changes at the HLMZ scale, and the novelty of this study lies in its focus on analyzing such changes within this part of the alluvial plain. Orthophotos and Google Earth imagery have been interpreted in a GIS environment and integrated with literature data. LULC classes have been analyzed to assess trends and transformations. Furthermore, from several different standpoints (e.g., dimensions, flow discharge, geomorphology, geological setting, human impacts), the Sele River is representative of many rivers of a much wider morphoclimatic scenario (i.e., the Mediterranean area). Thus, the methodology we have used can be easily adopted for many Mediterranean rivers and associated HLMZs, and the data we have produced can be, at least partly, transferred and/or discussed both to evaluate LULC changes in other HLMZs and to preliminarily assess flood risk in the most dynamic sector of the alluvial plains.
Figure 1.
Location map of the study area, in the framework of the Italian and Campania region territories (lower left) and Sele River basin (dotted blue line). A, B, and C indicate the three sectors in which, for the sake of readability of the LULC maps (see text for details), the Sele River historical lateral mobility zone (HLMZ) has been subdivided.
Thus, the final aim of our study has been twofold: (i) to produce large-scale LULC maps of the Sele River HLMZ for the period 1988–2023, providing a useful dataset to enhance knowledge of current LULC scenario and its evolution over the past 35 years, also providing part of the basic data to correctly assess flood risk; and, to a broader standpoint, (ii) contributing to fill the existing gap in studies addressing LULC dynamics at the HLMZ scale.
2. Materials and Methods
2.1. Study Area
The Sele River basin is located within the Perithyrrenic Area of Southern Italy, between the Apennine mountain chain and the coastal zone, in the south-central part of the Campania Region. The basin lies approximately between 40°11′N to 40°52′ N latitude and from 14°58′ E to 15°47′ E longitude (Figure 1). The Sele River is ~68 km long and drains a basin area of approximately 3230 km2. The main tributaries are the Tanagro, Calore Lucano, and Tenza Rivers, which drain the steep reliefs of the Monti Picentini and Alburni massifs. The landscape is dominated by mountainous reliefs for more than 54%, while flat land surfaces accounted for 5.1%.
The climate is of Mediterranean type, with warm, dry summers and mild, wet winters [37]. The average annual rainfall is ~1180 mm/year, with significant spatial variability controlled by both elevations, ranging between 0 m a.s.l. and 1886 m a.s.l. [4], and distance from the coast [38].
The geological setting is characterized by carbonate rocks of the Apennine Mountain Range (AMR) [39] and by Miocene–Pliocene terrigenous deposits in the hilly-piedimont sectors [40,41,42].
The main rivers flow into morphostructural depressions filled with Quaternary-aged alluvial, volcanic, and slope deposits [43,44]. Alluvial fans and scree taluses connect the slopes to the alluvial plains [4]. Finally, the coastal plain is characterized by sandy beach and dune deposits, and travertine bodies [45].
The mountainous sector is characterized by steep slopes, locally deeply dissected by gorges, while the hilly-piedmont areas show gentler topography affected by water erosion processes and widespread landslides [4,46,47,48]. Fluvial processes are widespread within alluvial plains, which are characterized by different orders of river terraces.
The Sele River has one of the highest mean annual flow discharges among the rivers of Southern Italy (i.e., ~69.4 m3/s). In the early 20th century, the Sele River springs were captured to supply drinking water to vast areas of Southern Italy. Subsequently, the Persano Dam (Figure 1) was built between 1929 and 1932, leading to the creation of the Persano Reservoir. The Sele River main tributaries, i.e., the Tanagro R. (92 km-long) and the Calore Lucano R. (63 km-long), contribute significantly to the overall basin discharge. During the 1920s, extensive land reclamation works strongly modified the Tanagro and Sele alluvial plains, contributing to major geomorphological and hydrological reshaping [4]. These LULC changes have contributed to the prolonged channel narrowing of the Sele River observed between the late 19th century and the early 2000s [4], highlighting a primary role of LULC changes in controlling the magnitude of hillslope erosion and, consequently, sediment supply to the river [49,50].
In 2010, an unusual succession of heavy rainfalls triggered an extreme flood of the Sele River, causing significant damage to urban infrastructures, utility networks, and both agricultural and industrial settlements. Historical series of annual maxima of the areal average precipitation over two consecutive days, reconstructed for the Sele River basin at the hydrometric station of Albanella [51], show that the cumulative precipitation recorded on 8–9 November 2010 (125.6 mm) represents the absolute maximum since 1933, exceeding the value of 110.7 mm associated with the 1935 flood event.
In recent decades, the basin has also experienced significant LULC changes. According to Magliulo et al. [4], the area has exhibited the trend of the Italian inner territories moving towards more pristine conditions, with an increase in forested areas by 18% between 1960 and 1990 and by 14% from 1990 to 2012, mainly at the expense of grasslands, while agricultural areas remained substantially unchanged.
2.2. Data Sources and Processing
The first step of the study consisted of a geomorphological analysis of the Sele River alluvial plain, aimed at digitizing the active channels in a GIS environment and defining the HLMZ shaped during the last 150 years. The geomorphological analysis has been focused on fluvial landforms indicative of past positions of the river channel (e.g., inactive fluvial erosional scarps indicative of past riverbanks) and has been carried out by means of a multi-temporal interpretation of aerial photos, high-resolution Google Earth imagery, and historical and more recent topographic maps (Table 1).
Table 1.
Materials used in the geomorphological and, partly, in the LULC analysis. Legend: HM = historical topographic map; RM = more recent topographic map; O = orthorectified remotely sensed imagery; IGMI = Italian Geographical Military Institute; IMESE = Italian Ministry of Environment and Energy Safety; CRA = Campania Region Authority; GE = Google Earth; * = scale of visualization. Positional errors are calculated according to Slama et al. [52] and Taylor [53].
In particular, the cartographic materials, covering the entire Sele River valley, have consisted of (i) two 1:50,000-scale topographic historical map sheets dated back to 1870 and 1909, respectively, based on the Sanson Flamsteed projection (datum: Roma 40 system and Bessel Ellipsoid-Genoa-oriented international spheroid); (ii) a 1:25,000-scale topographic map dated back to 1955 (Gauss Boaga—Transverse Mercator conformal projection; datum: ED 50—European Geodetic Reference System); (iii) 1:10,000 and 1:5000-nominal scale color orthophotos dated back to 1988, 1998, 2004, 2008, 2011 and 2014, respectively, for which the projection and datum are UTM WGS84; (iv) Google Earth images from 2023. All topographic maps have been scanned in 8-bit gray scale at a resolution between 300 and 1200 dpi, and subsequently rectified and georeferenced in a GIS environment (ArcGIS 10.4, ESRI, Redlands, CA, USA), using the UTM-WGS84, Zone 33N, Transverse Mercator projection. A total of 22 Ground Control Points (GCPs), mainly located near the river channel, have been employed. First-order polynomial transformations have been applied to the 1870 and 1909 historical maps, whereas a second-order polynomial transformation has been adopted for the 1955 topographic map. The positional errors associated with the georeferencing of the historical maps have been calculated following the method proposed by Slama et al. [52] and Taylor [53].
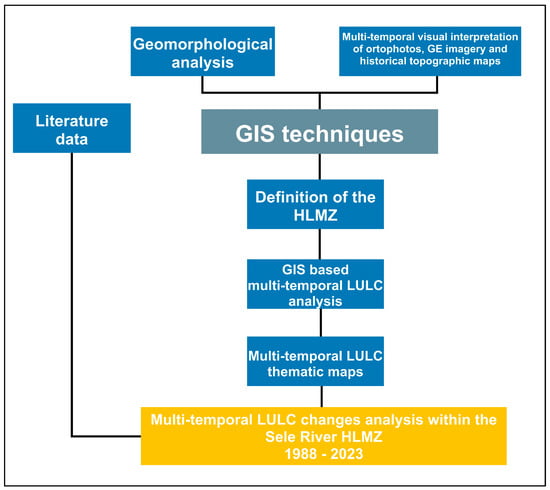
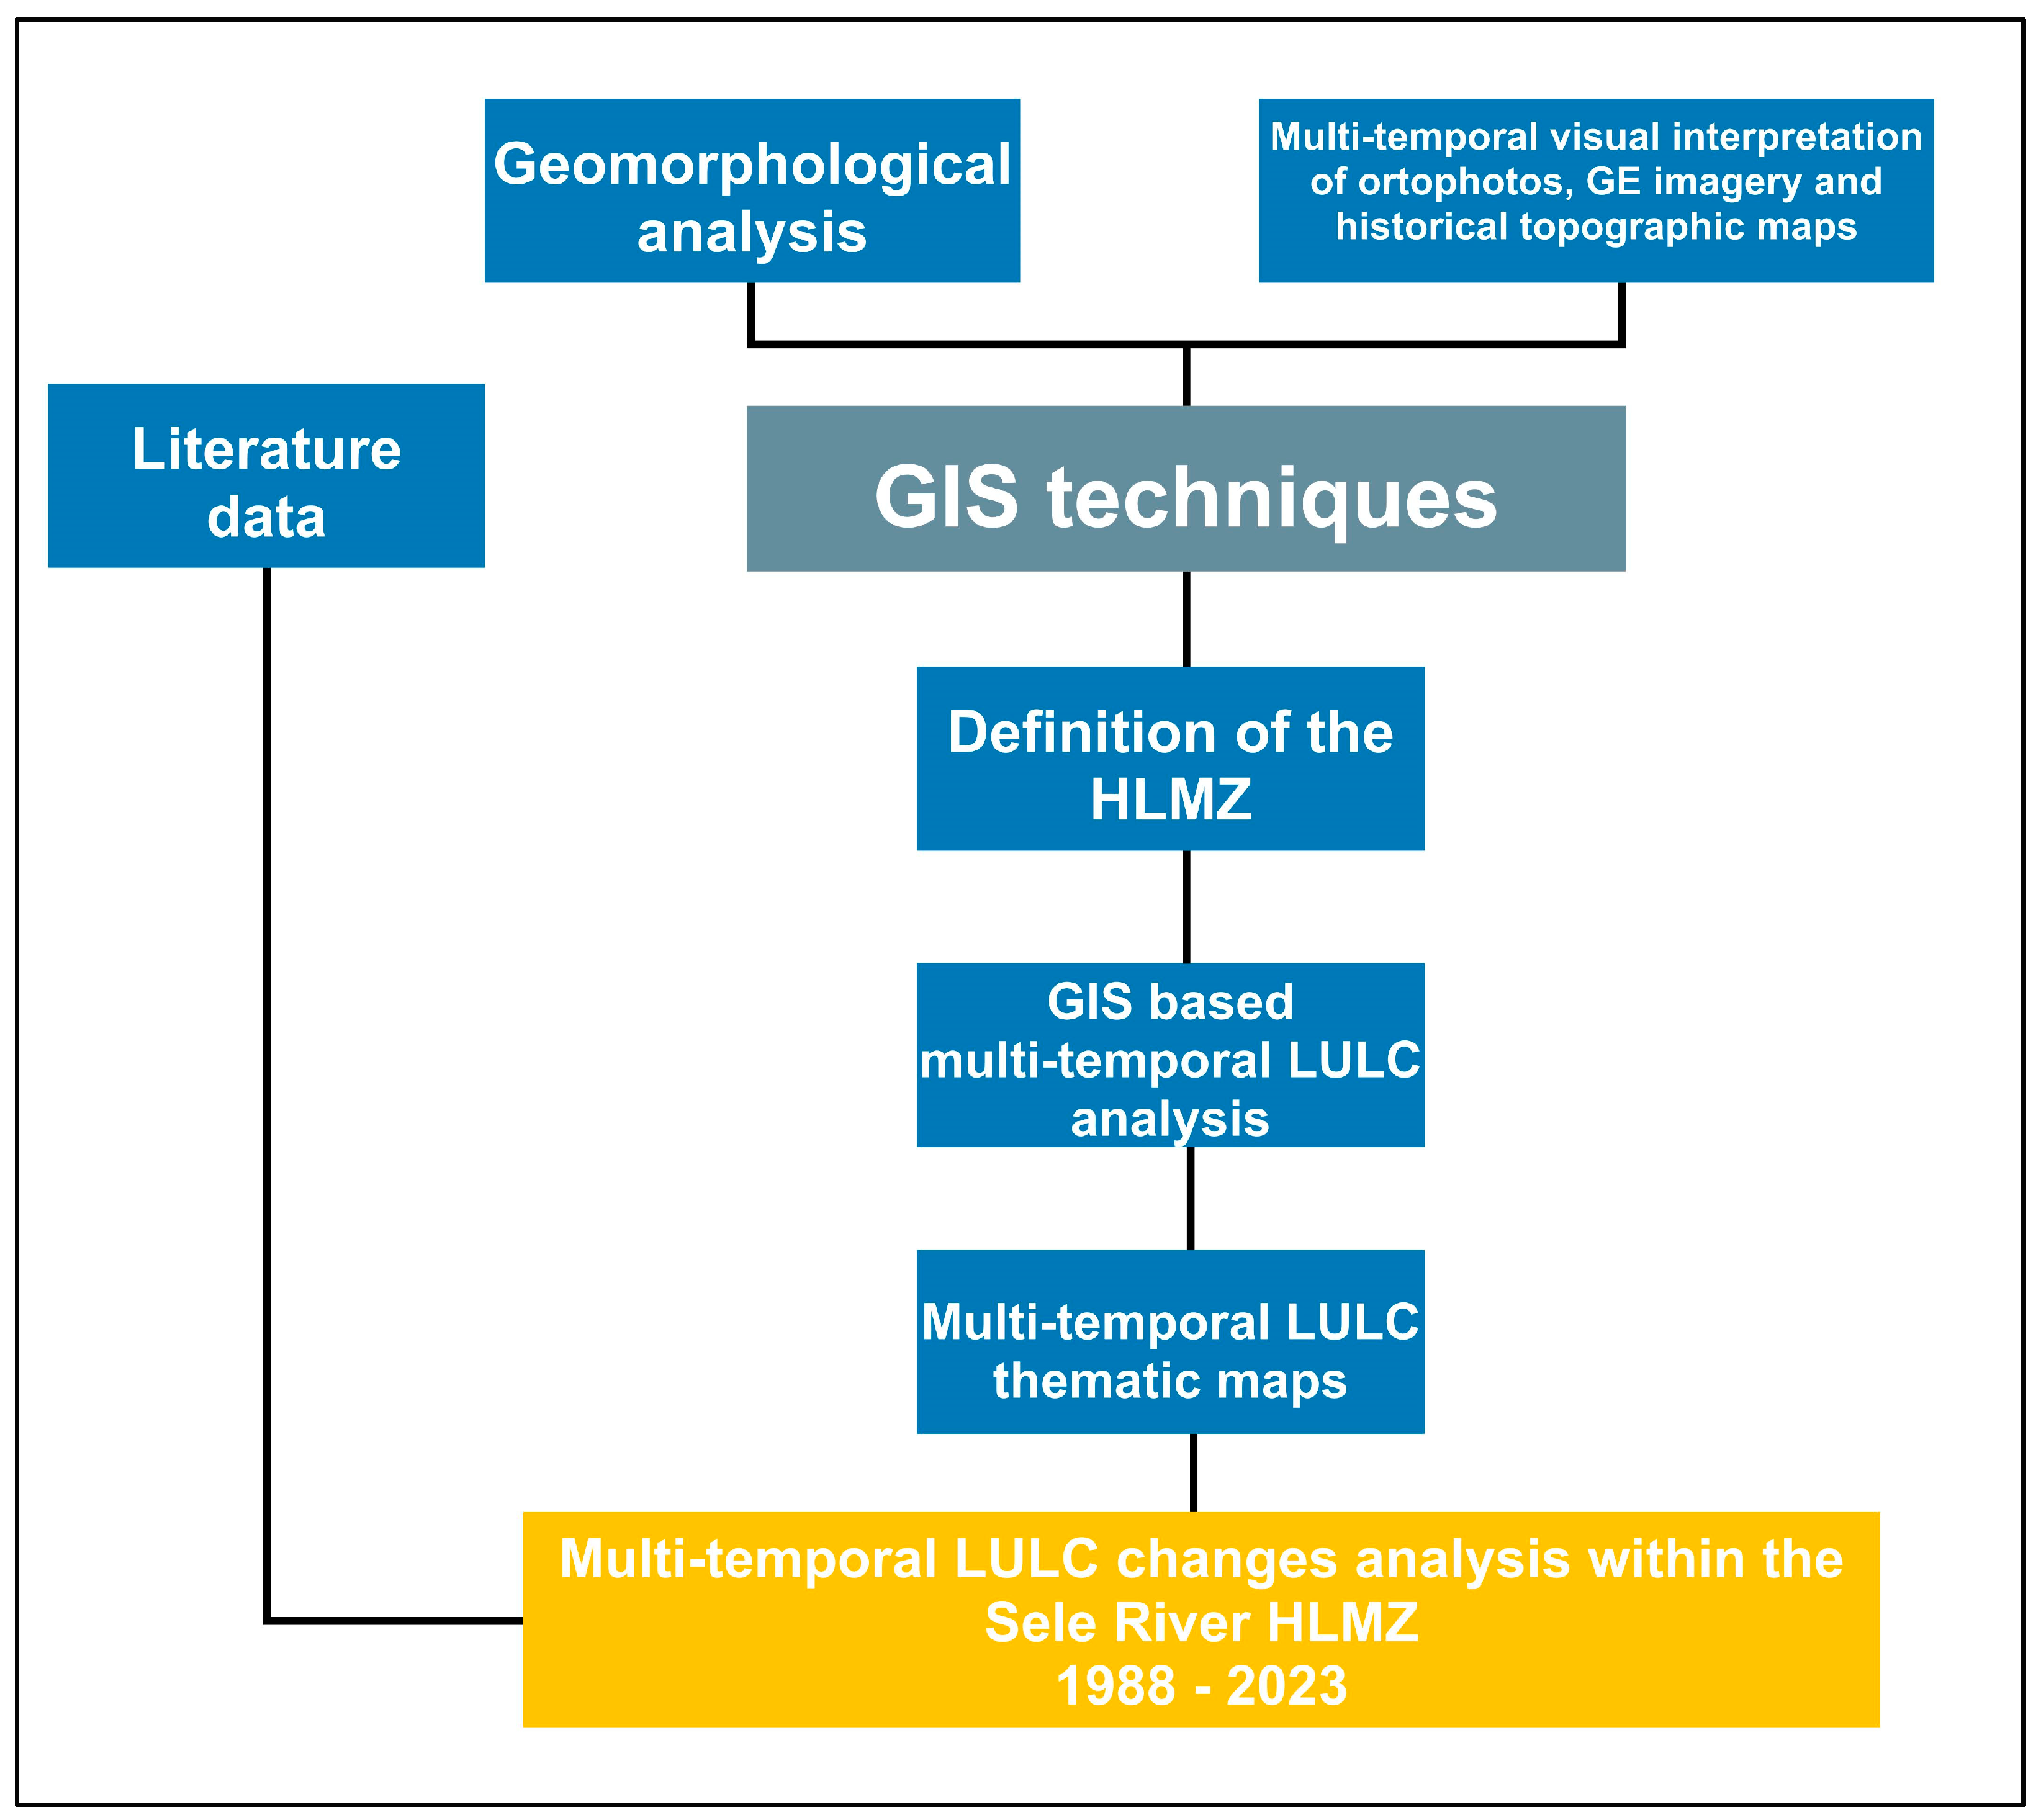
The methodological approach consisted of two main GIS-based steps, carried out by using QGIS 3.40.6 ‘Bratislava’ and ESRI ArcGIS 10.3 software, on multi-temporal raster datasets. In the first step, a multi-temporal and morphometric analysis of the Sele River channels at the considered dates has been performed by manually digitizing raster datasets spanning from 1870 to 2023, in order to obtain the Sele River HLMZ boundaries over a period of approximately 150 years. The second step has consisted of LULC analysis and mapping through visual interpretation of aerial photographs and Google Earth imagery for the period 1988–2023. LULC classes have been manually digitized in a GIS environment based on the visual identification of land-use patterns and landscape features. These two steps are further detailed below. Figure 2 synthesizes the flowchart of this study.
Figure 2.
Flowchart illustrating the different steps of the research. Legend—HLMZ: historical lateral mobility zone; LULC: Land-Use–Land Cover; GE: Google Earth.
2.2.1. Definition of the HLMZ of the Sele River
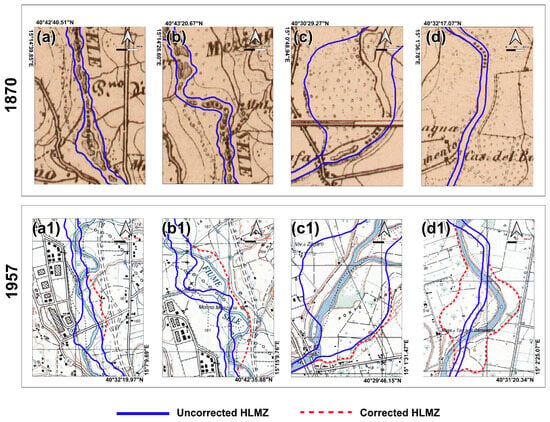
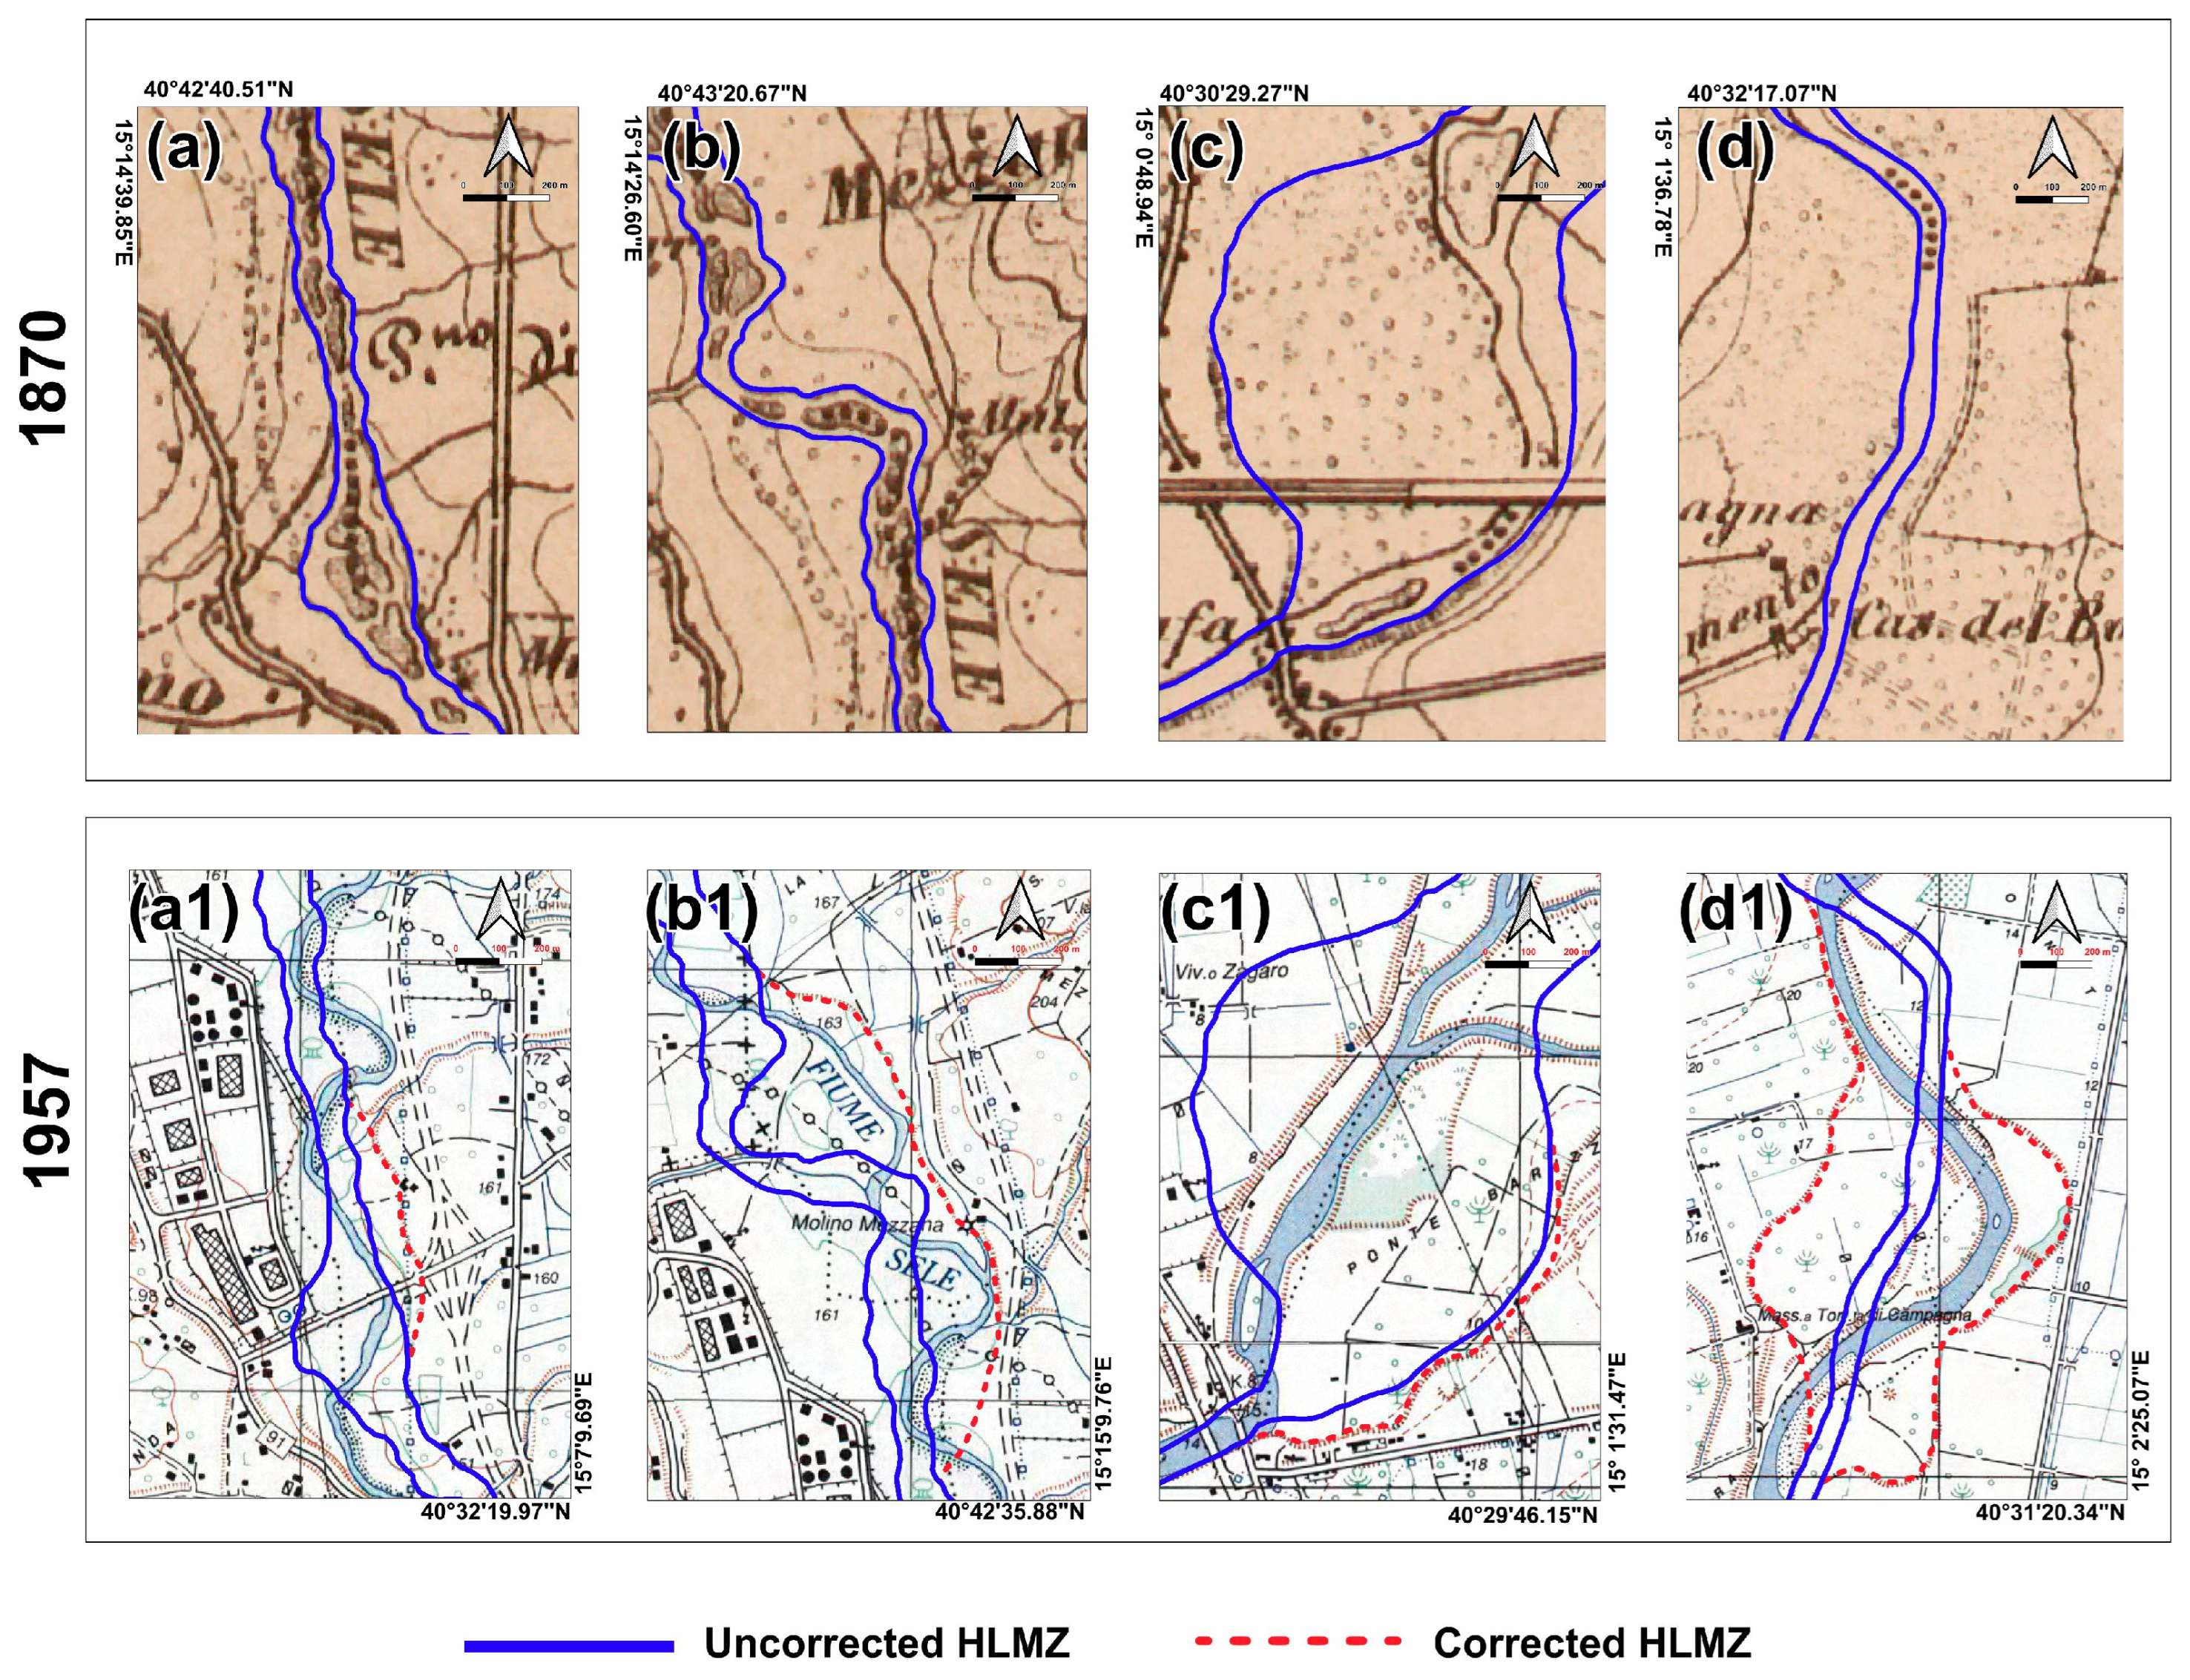
The mapping of the Sele River HLMZ has been carried out according to the existing literature dealing with geomorphological and hydromorphological indicators useful to determine HLMZ boundaries, i.e., channel planform, cross-sectional variability, and occurrence of typical fluvial landforms such as bars and islands [32]. The active floodplain areas and the riparian vegetation belt have been considered to estimate the potential extent of lateral channel mobility, as within these zones active fluvial processes and channel-floodplain interactions occur [54,55,56,57,58]. A multi-temporal analysis has been performed through visual interpretation of historical maps, topographic maps, orthophotos, and Google Earth imagery. The ten active channels (i.e., one for each considered year) have been digitized as polygonal features by using the QGIS software (v. 3.42; OSGeo, Beaverton, OR, USA). The digitized channels have then been overlaid and merged to create a first approximation of the 150-year HLMZ of the Sele River. The latter has been, then, refined, as the two historical maps (1870, 1909) employed in this study have exhibited a certain degree of uncertainty and positional inconsistency (Table 1), confirmed by pre-existing literature [59]. Thus, in order to refine the Sele River HLMZ boundaries digitized from historical maps, an overlay with the more recent topographic maps (Figure 3) and aerial imagery has been carried out, focusing on common geomorphological features observable in both datasets, i.e., inactive fluvial scarps and abandoned channels. In particular, inactive fluvial scarps have indicated the correct position of riverbank segments from 1870 to 1909 channels that, in some cases, coincided with the boundaries of the HLMZ.
Figure 3.
Sketches showing the correction procedure of the HLMZ boundaries derived from historical maps by means of topographic maps analysis in a GIS environment. The same the letter (e.g., a,a1), the same the sector. (a–d) Historical maps from 1870 or 1909; (a1–d1) topographic maps from 1955.
This method has helped to reduce uncertainties in the visual interpretation of historical maps and the associated overestimation or underestimation of the HLMZ area, which has been delimited with the highest accuracy (Figure 3).
Exclusively for the sake of readability, the HLMZ has been subdivided into three sectors (A, B, C), whose location is shown in Figure 1. The total HLMZ area has been automatically calculated, and a centerline was derived from the digitized polygon using a semi-automated GIS procedure based on Voronoi polygons implemented in the GRASS GIS environment (“v.voronoi.skeleton” function). The mean HLMZ width has been calculated by dividing the total area by the centerline length. This procedure has allowed the calculation of surface area, centerline length, and mean width for both the entire HLMZ and each individual sector.
2.2.2. Multitemporal LULC Analysis and Mapping
With the aim of investigating LULC evolution over the last 35 years within the previously mapped Sele River HLMZ, a multitemporal analysis has been performed through on-screen visual interpretation of orthophotos (1988, 1998, 2008, 2014) and Google Earth imagery (2023). LULC classes have been selected among those reported in the CORINE Land Cover (CLC) legend [60,61] and manually digitized in a GIS environment based on the visual identification of land-use patterns. In particular, five CLC LULC classes fully encompass the LULC within the Sele River HLMZ, i.e., (1) Artificial surfaces; (2) Agricultural areas; (3) Grasslands and Pastures; (4) Forests; (5) Water bodies. These classes are consistent with the availability and accuracy of the imagery data, thereby reducing uncertainties in the assessment of LULC changes [4,7,62,63,64], as they represent markedly distinct land-use types.
According to CLC specifications [64], forests have been identified as areas covered by trees exceeding 5 m in height and exhibiting a canopy closure of at least 30%. These criteria have allowed us to distinguish forests from both agricultural areas and grassland and pastures. The class “artificial surfaces” has included both urban and industrial settlements, as well as sediment extraction sites (i.e., non-soil areas). Water bodies have mainly corresponded to the active channel of the Sele River.
Within this framework, LULC mapping has been performed manually by on-screen digitization of each LULC class through visual photointerpretation in a GIS environment. Generally speaking, visual aerial photo interpretation has reduced uncertainties compared to an automated or semi-automated imagery classification. In our study, visual interpretation has provided very detailed LULC maps. LULC maps have been compiled for each considered year, and the area of each class has been automatically calculated by GIS software. Then, a year-on-year comparison of the results has been carried out to investigate changes in the spatial distribution of LULC classes within the Sele River HLMZ. LULC changes have been assessed by comparing the spatial extent of mapped classes at the considered dates and should therefore be interpreted as a descriptive spatial analysis of quantitative areal data.
3. Results
3.1. The Sele River HLMZ
The obtained Sele River HLMZ has exhibited a prevailing SW-NE orientation in sectors A-B, whereas it has been mainly NNE-SSW elongated in sector C (Figure 1). It has covered a total area of ~16 km2, with a centerline length of 55.9 km and a mean width of 285 m. At the sector scale, the mean width is ~327 m in sector A, ~332 m in sector B, and ~181 m in sector C. The HLMZ has accounted for ~49% of the whole Sele River alluvial plain. The active channel from 2023, i.e., the most recent channel among those considered in this study, has covered 22.8% of the HLMZ area (Table 2)
Table 2.
Mean area of the Sele River channel at the different considered dates and the percent of the HLMZ occupied by the Sele River channels.
The visual analysis of the active channels overlaid in a GIS environment has shown that the HLMZ boundaries mainly coincide with the riverbanks from 1870, 1909, and, subordinately, 1955. Within these boundaries, the more recent active channels (i.e., from 1988 to 2023) are mostly comprised. The HLMZ boundaries have coincided with the more recent riverbanks (1988–2023) only in correspondence with the outer banks of the Sele River main meanders.
3.2. LULC Analysis and Mapping
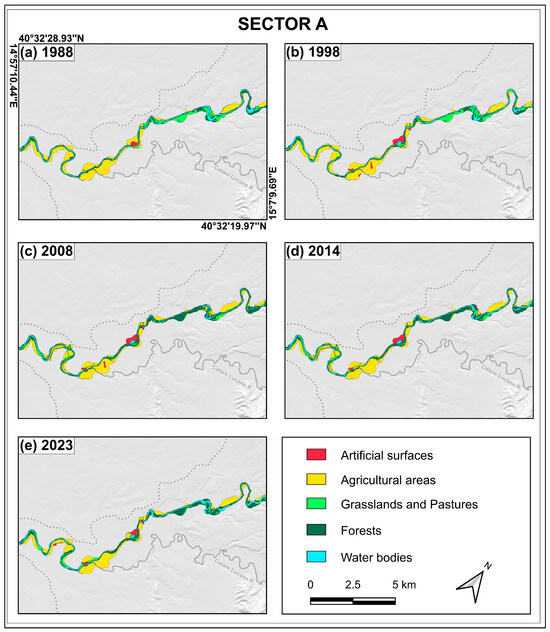
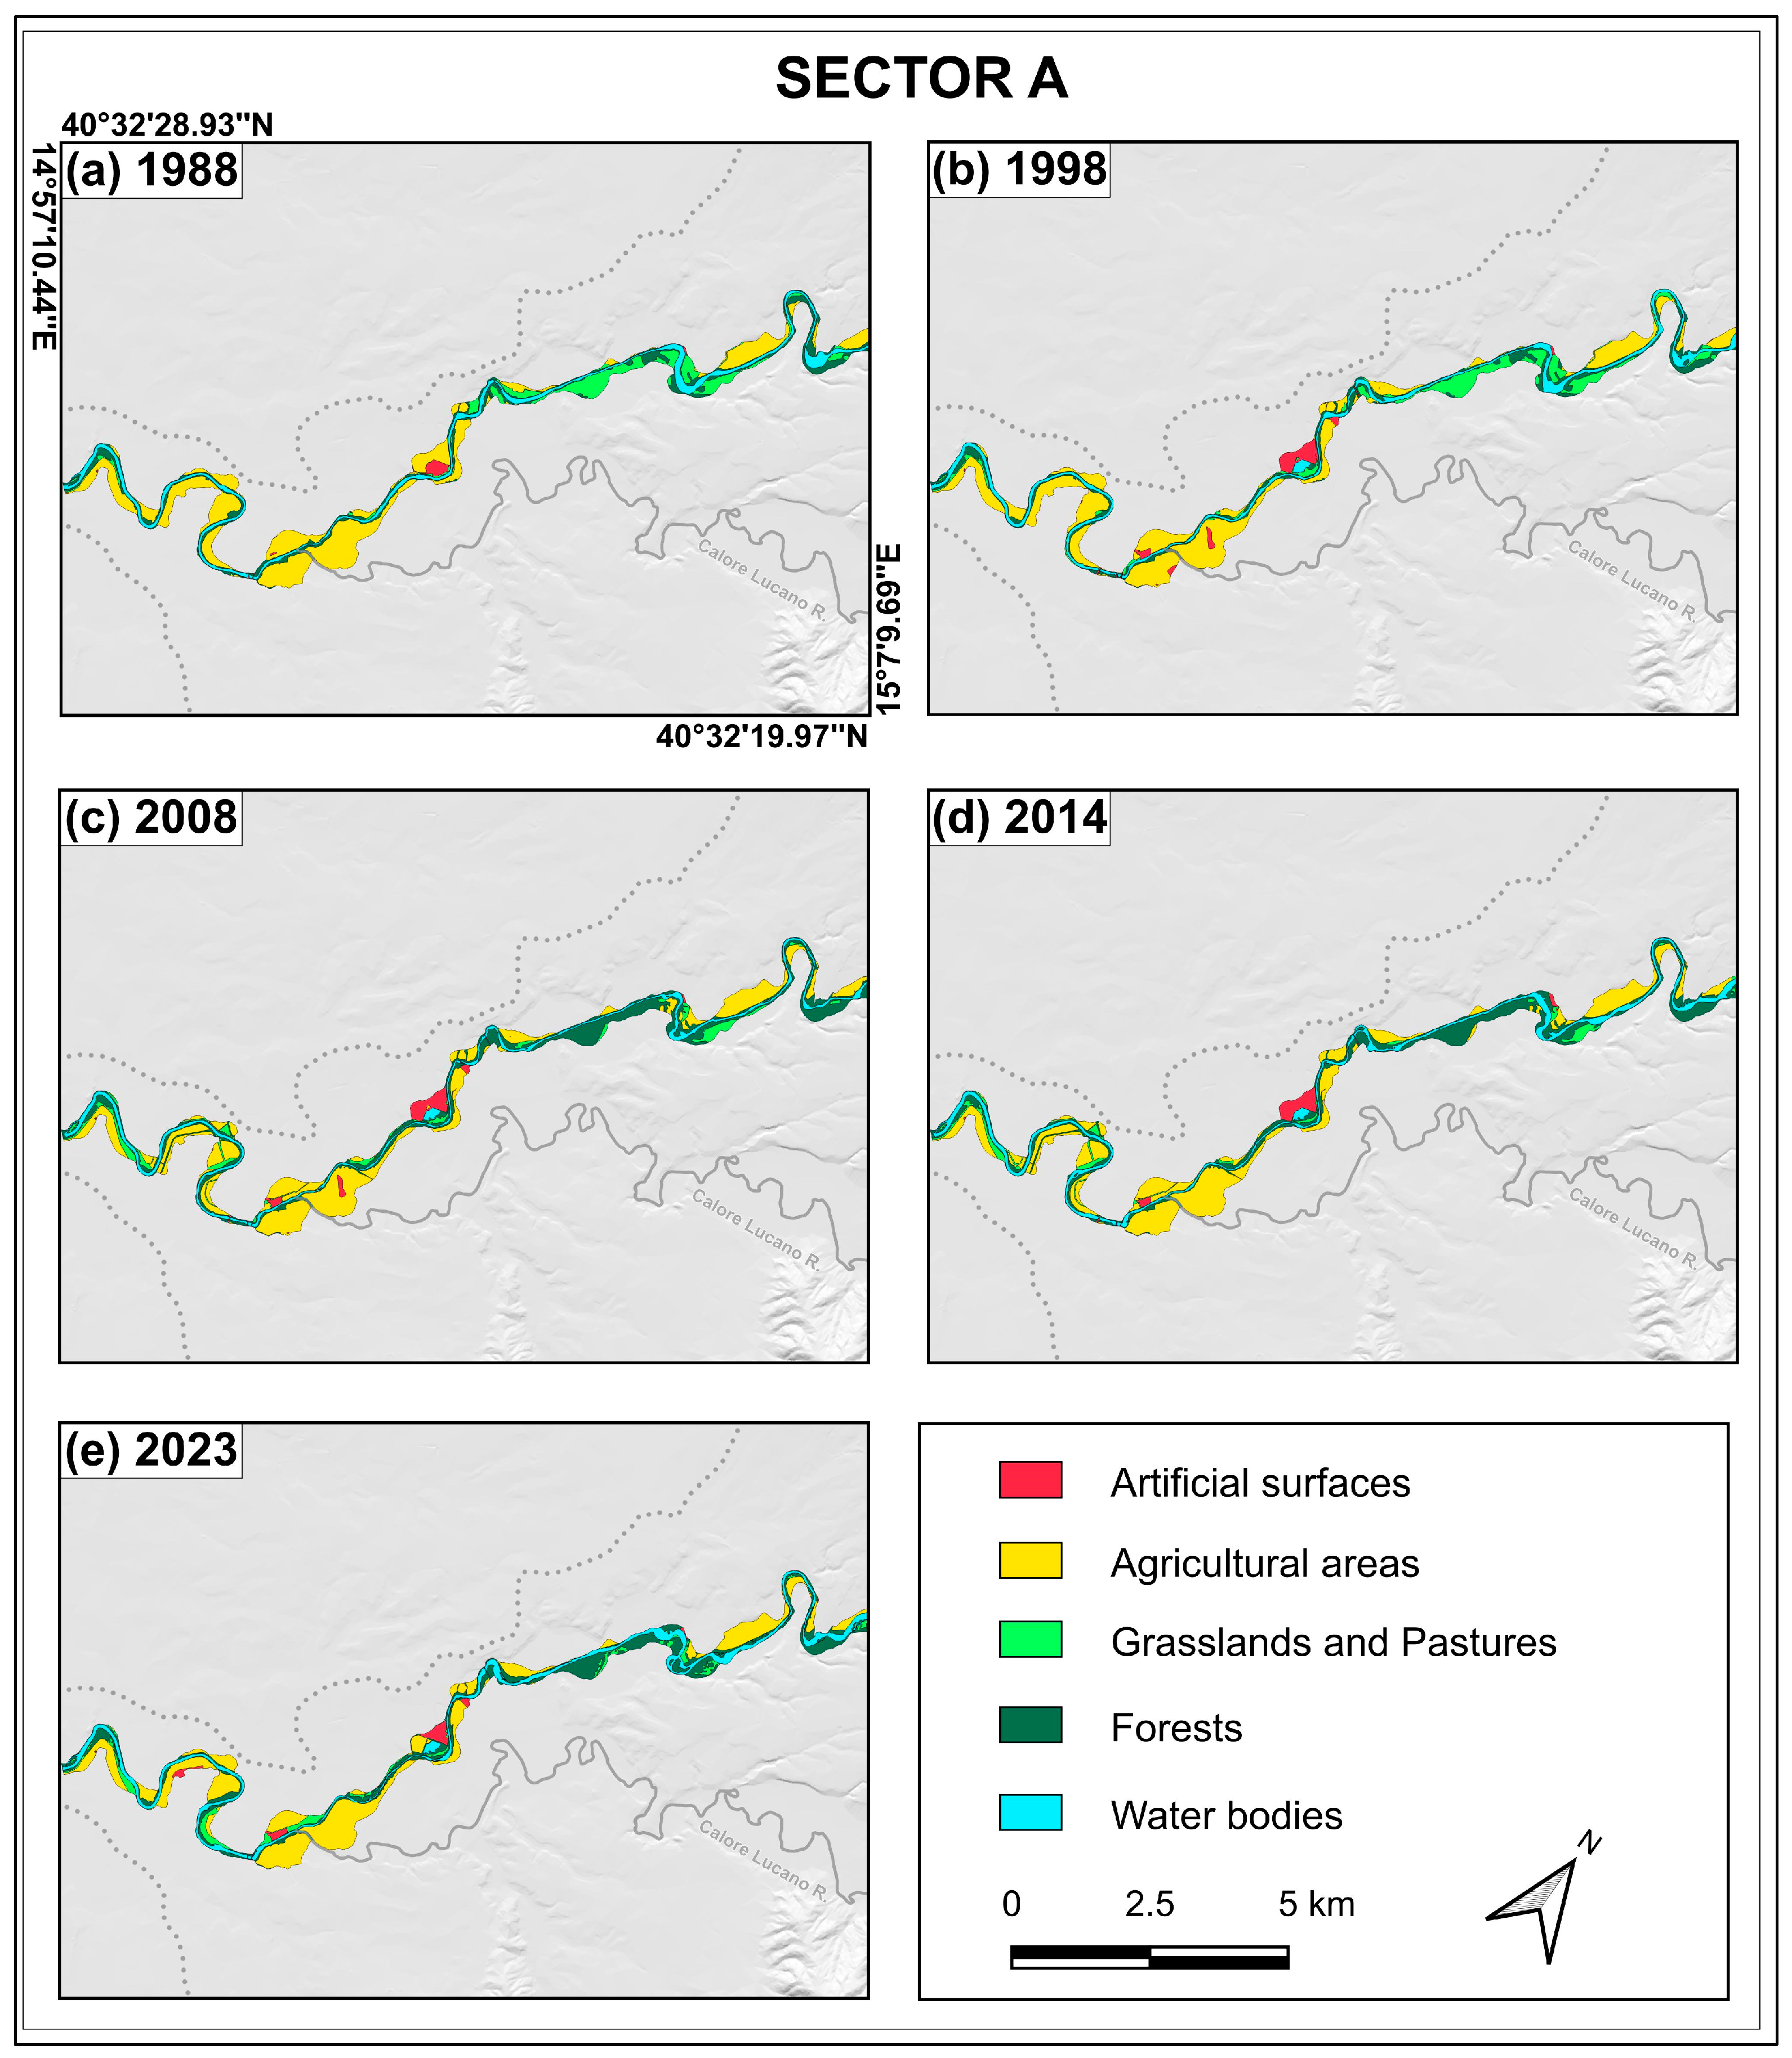
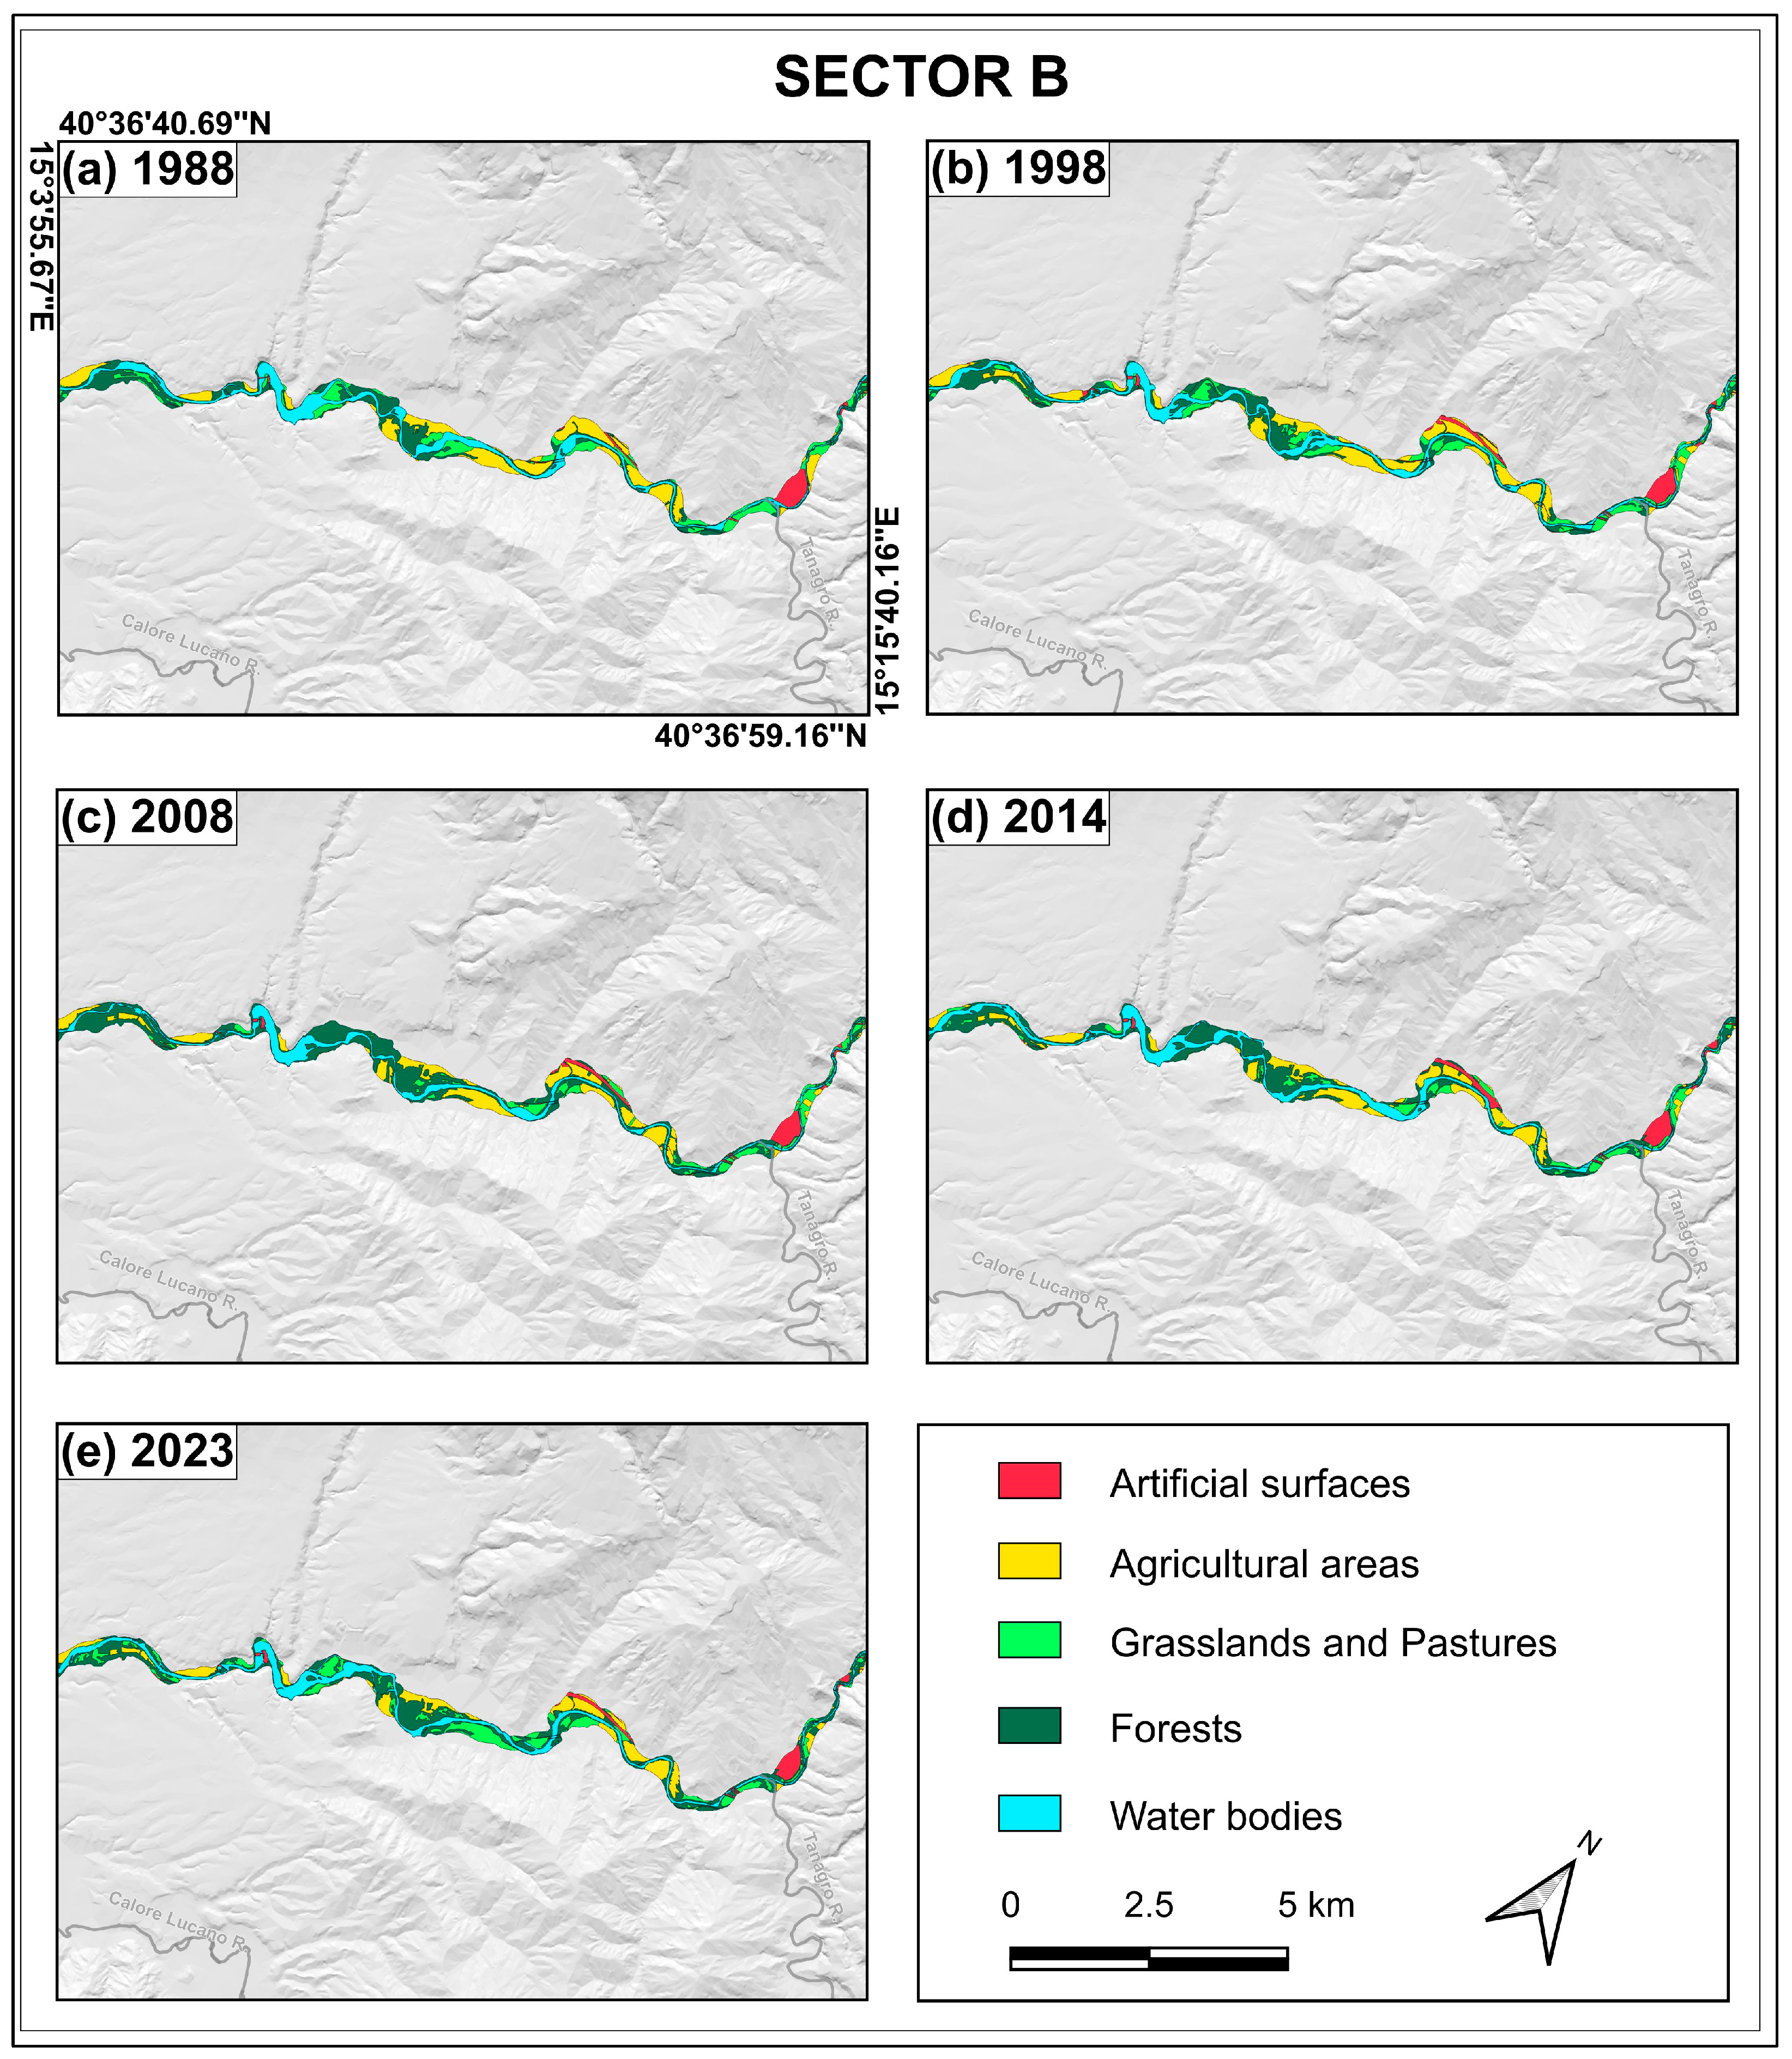
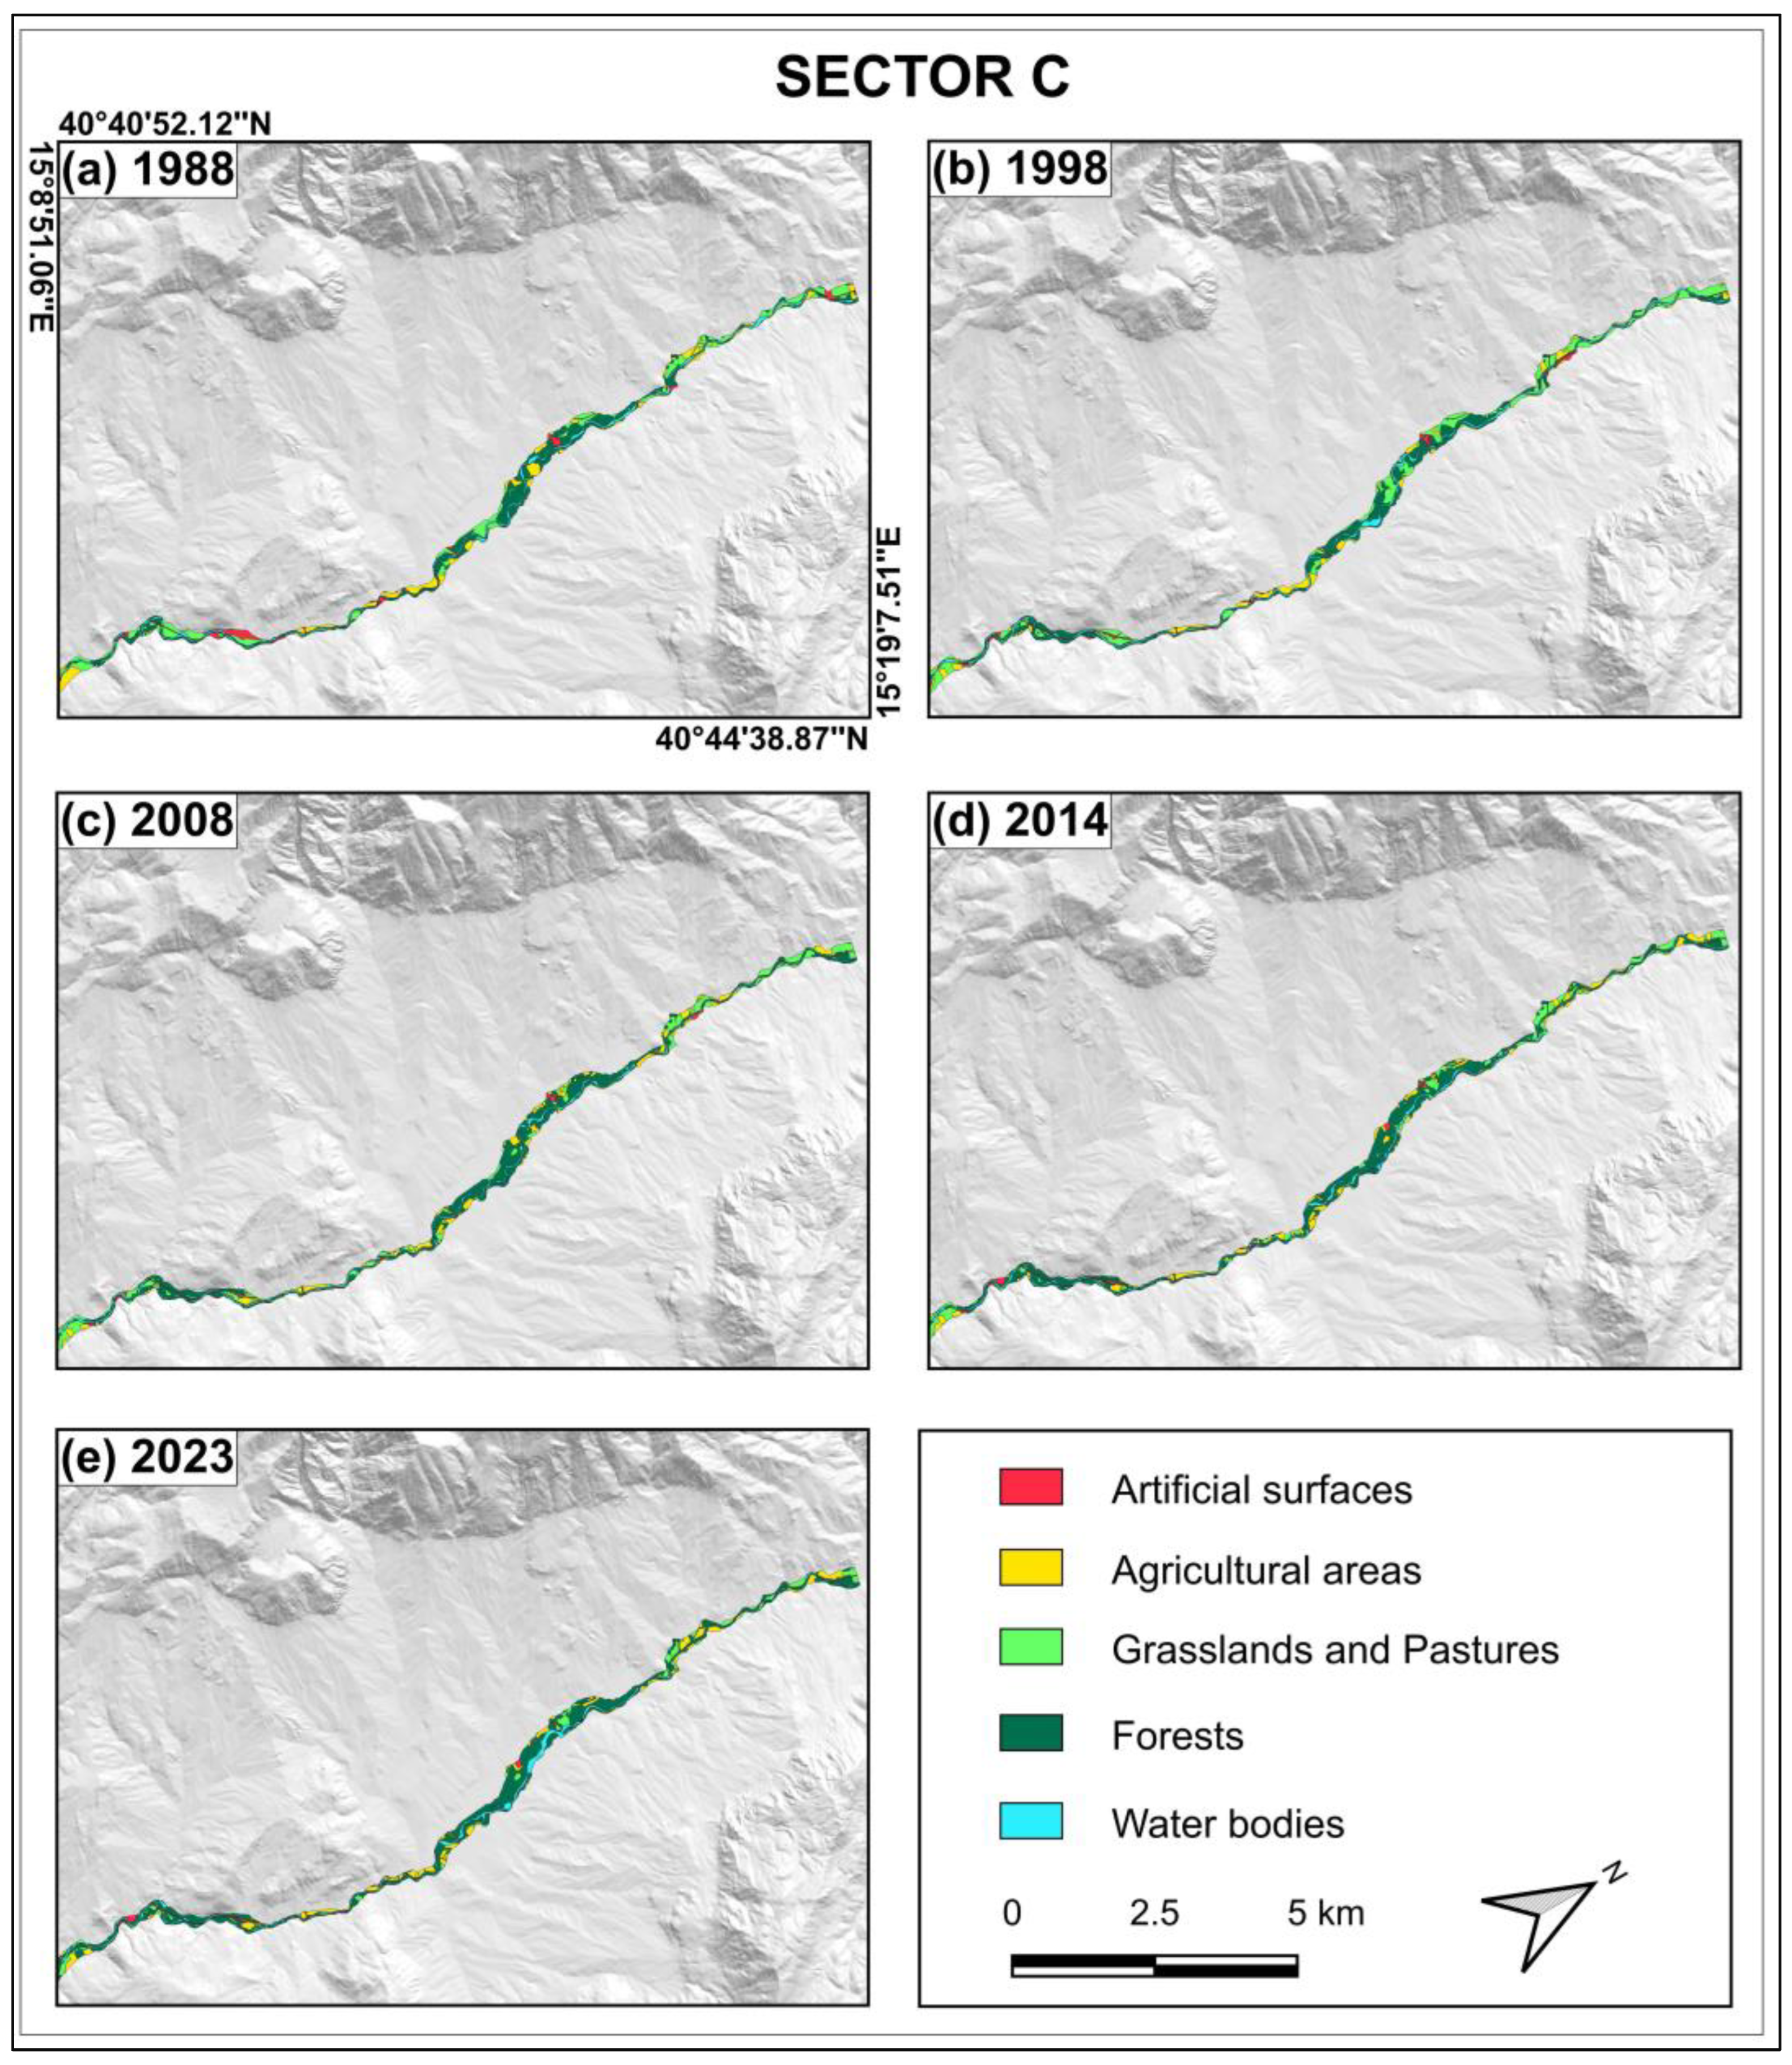
Figure 4, Figure 5 and Figure 6 graphically show year-on-year spatial data about the distribution of the LULC classes within the HLMZ of the Sele River between 1988 and 2023. For the sake of readability of the produced LULC maps, the Sele River HLMZ has been subdivided into three sectors, whose location is reported in Figure 1.
Figure 4.
LULC Maps from 1988, 1998, 2008, 2014, and 2023 of the Sele River HLMZ sector A (see Figure 1 for location). Grey lines indicate the main tributaries of the Sele River, while grey dotted lines indicate the basin boundary.
Figure 5.
LULC Maps from 1988, 1998, 2008, 2014, and 2023 of the Sele River HLMZ sector B (see Figure 1 for location). Grey lines indicate the main tributaries of the Sele River.
Figure 6.
LULC Maps from 1988, 1998, 2008, 2014, and 2023 of the Sele River HLMZ sector C (see Figure 1 for location).
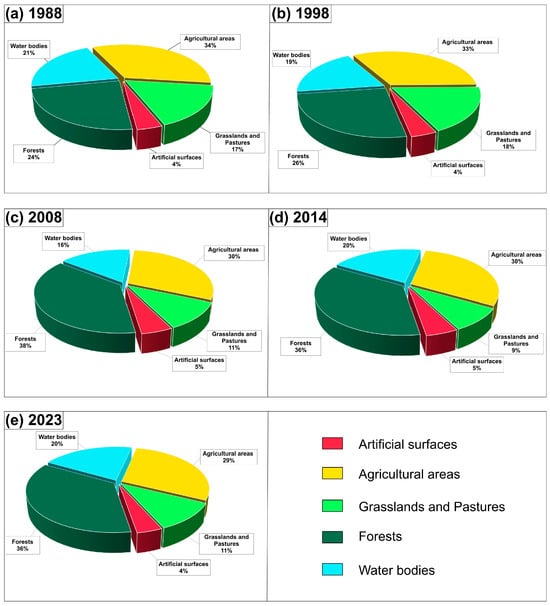
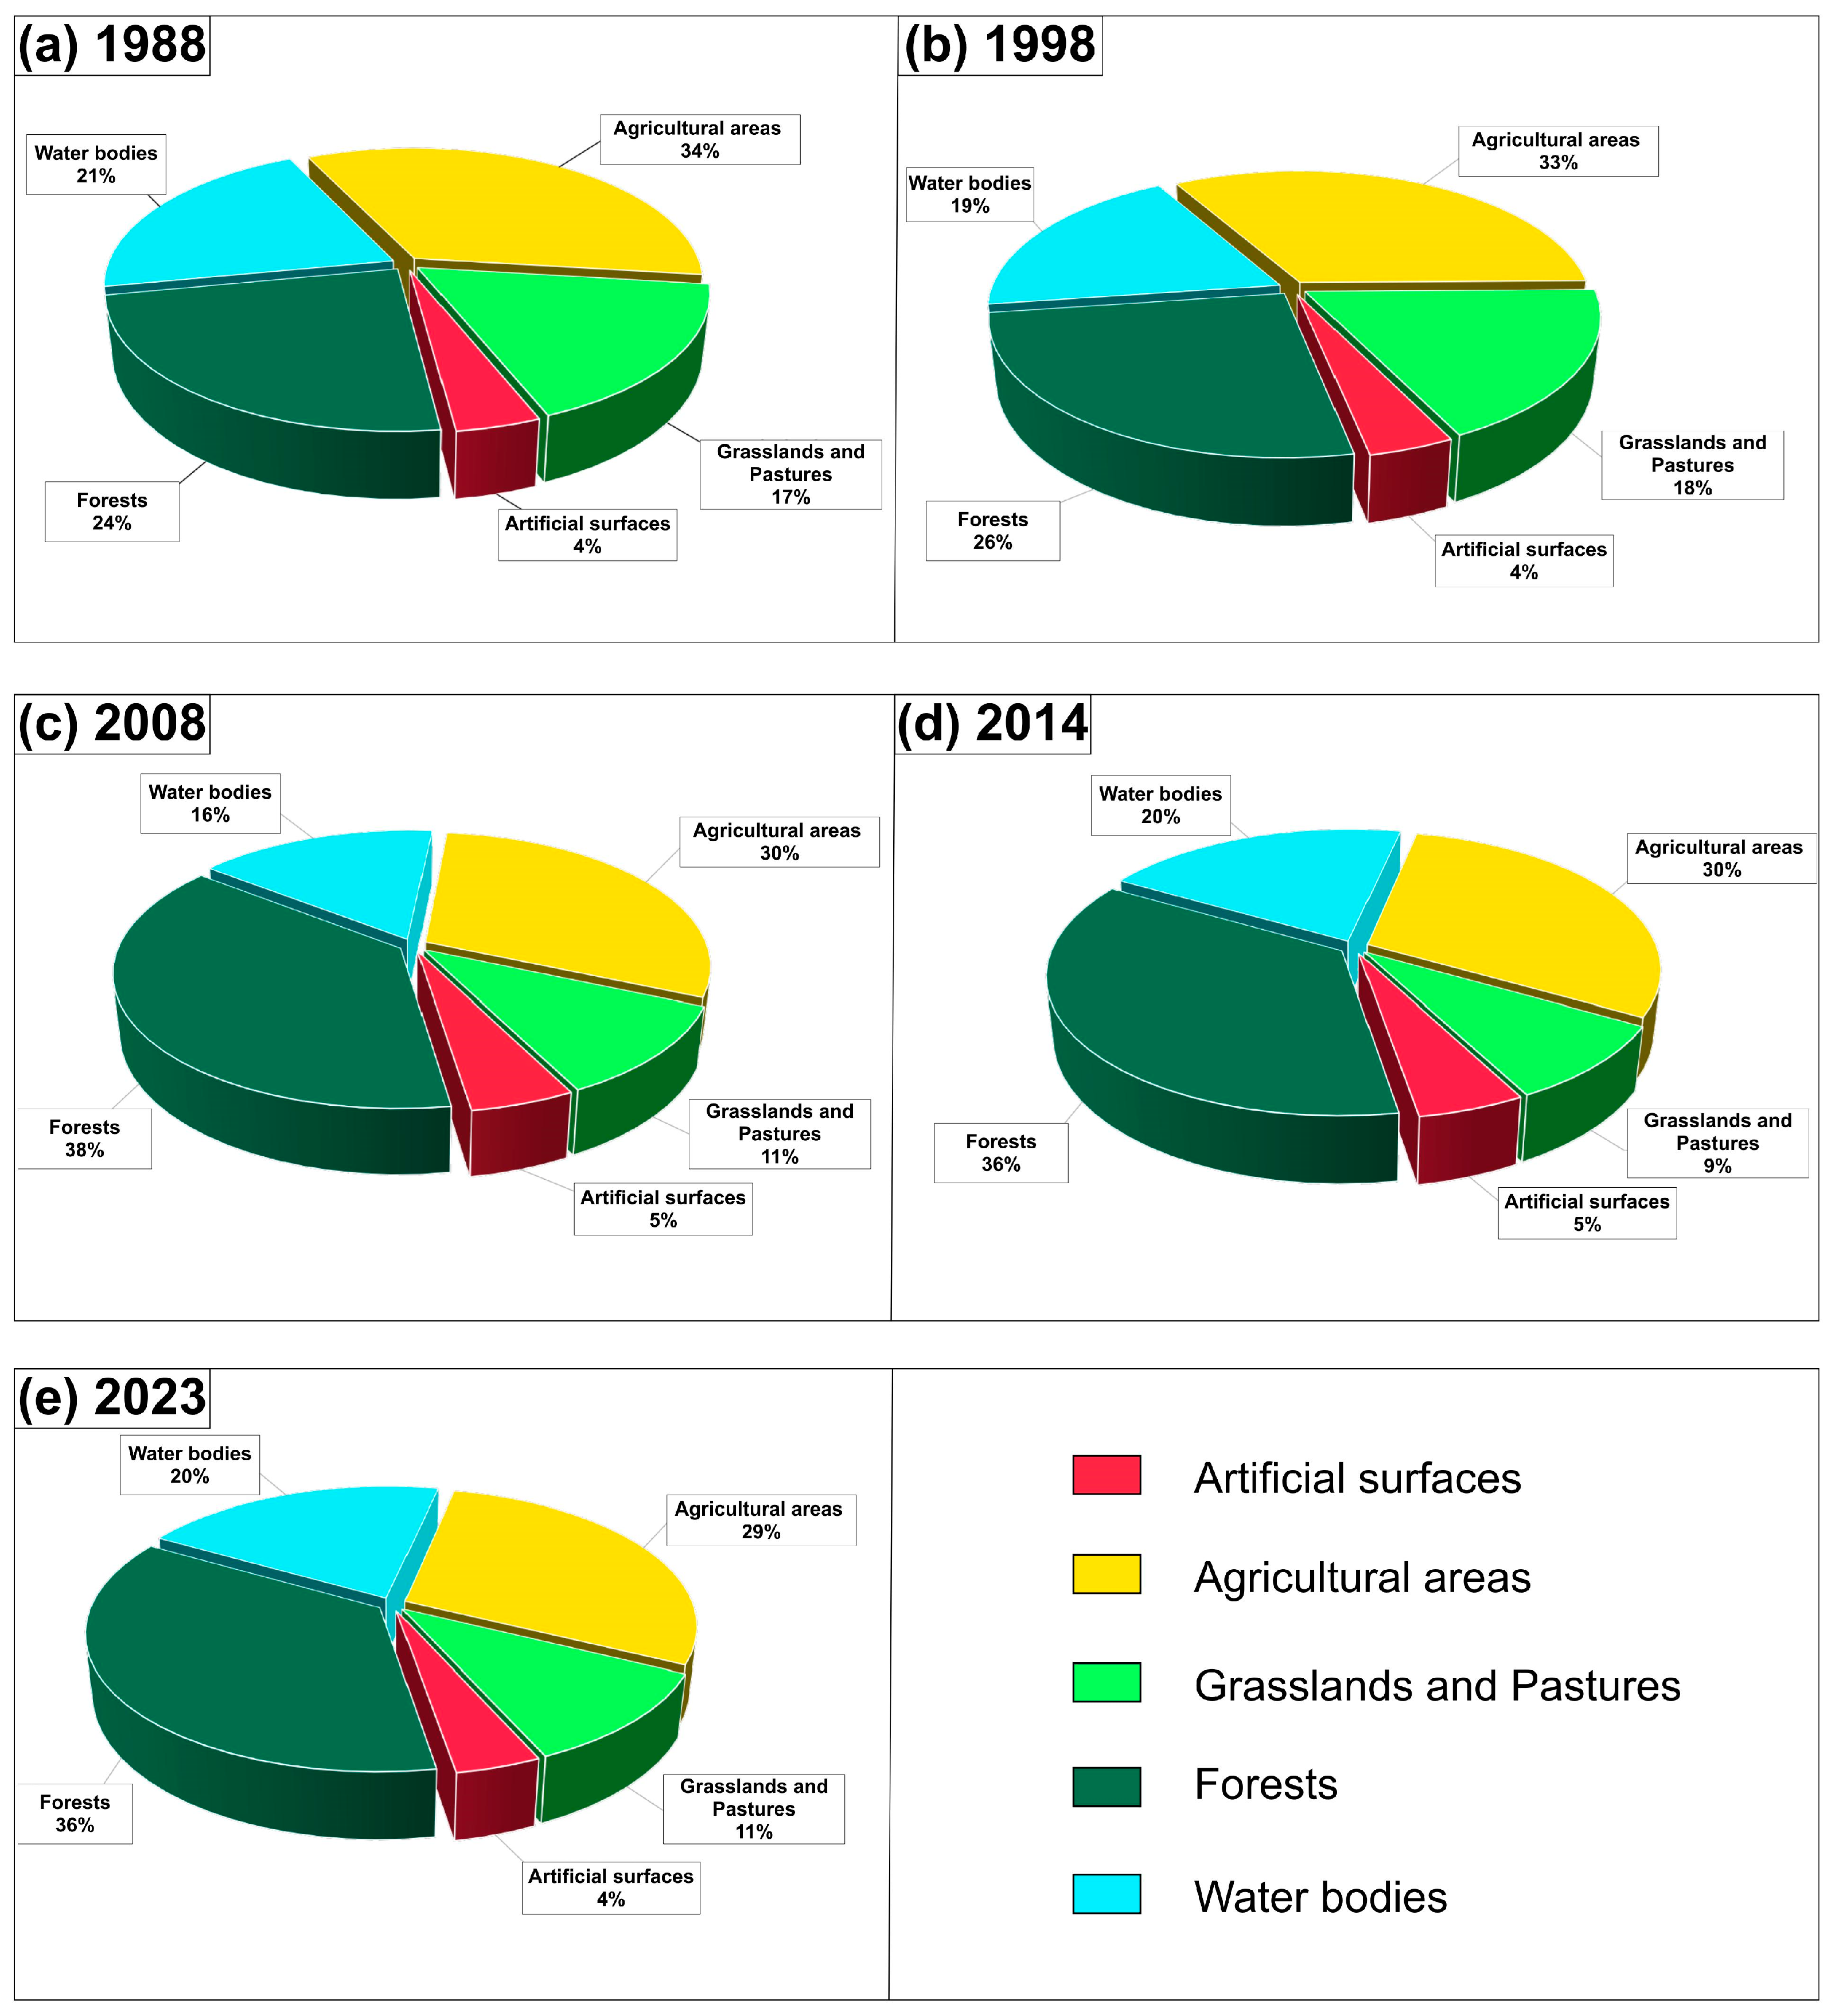
Figure 7 graphically displays the percentages of the HLMZ occupied by the different LULC classes at the considered dates.
Figure 7.
Pie-charts showing the percentage of the Sele River HLMZ area occupied by the different LULC classes at the considered dates.
The spatial extent of the LULC classes for each analyzed year and the corresponding changes and variations in each class area are shown in Table 3. Water bodies mainly correspond to the Sele River active channel.
Table 3.
Extensions and associated variations in the considered LULC class in the different investigated sub-periods and in the entire time-span (1988–2023).
In 1988 (Figure 4a, Figure 5a, Figure 6a and Figure 7a), more than one-third of the HLMZ total surface consisted of agricultural areas. Forests have resulted in being irregularly distributed along riverbanks, oxbows zones, and along the inactive fluvial scarps, showing more persistence within sectors B and C (Figure 4a, Figure 5a and Figure 6a). Grasslands and pastures have accounted for 17% of the total HLMZ surface (Figure 7a) and resulted in a sparsely distributed pattern, with a prevalence within the sectors B and C (Figure 4a, Figure 5a and Figure 6a). Water bodies have accounted for 21% of the HLMZ area, whereas artificial surfaces have represented a negligible portion of the HLMZ.
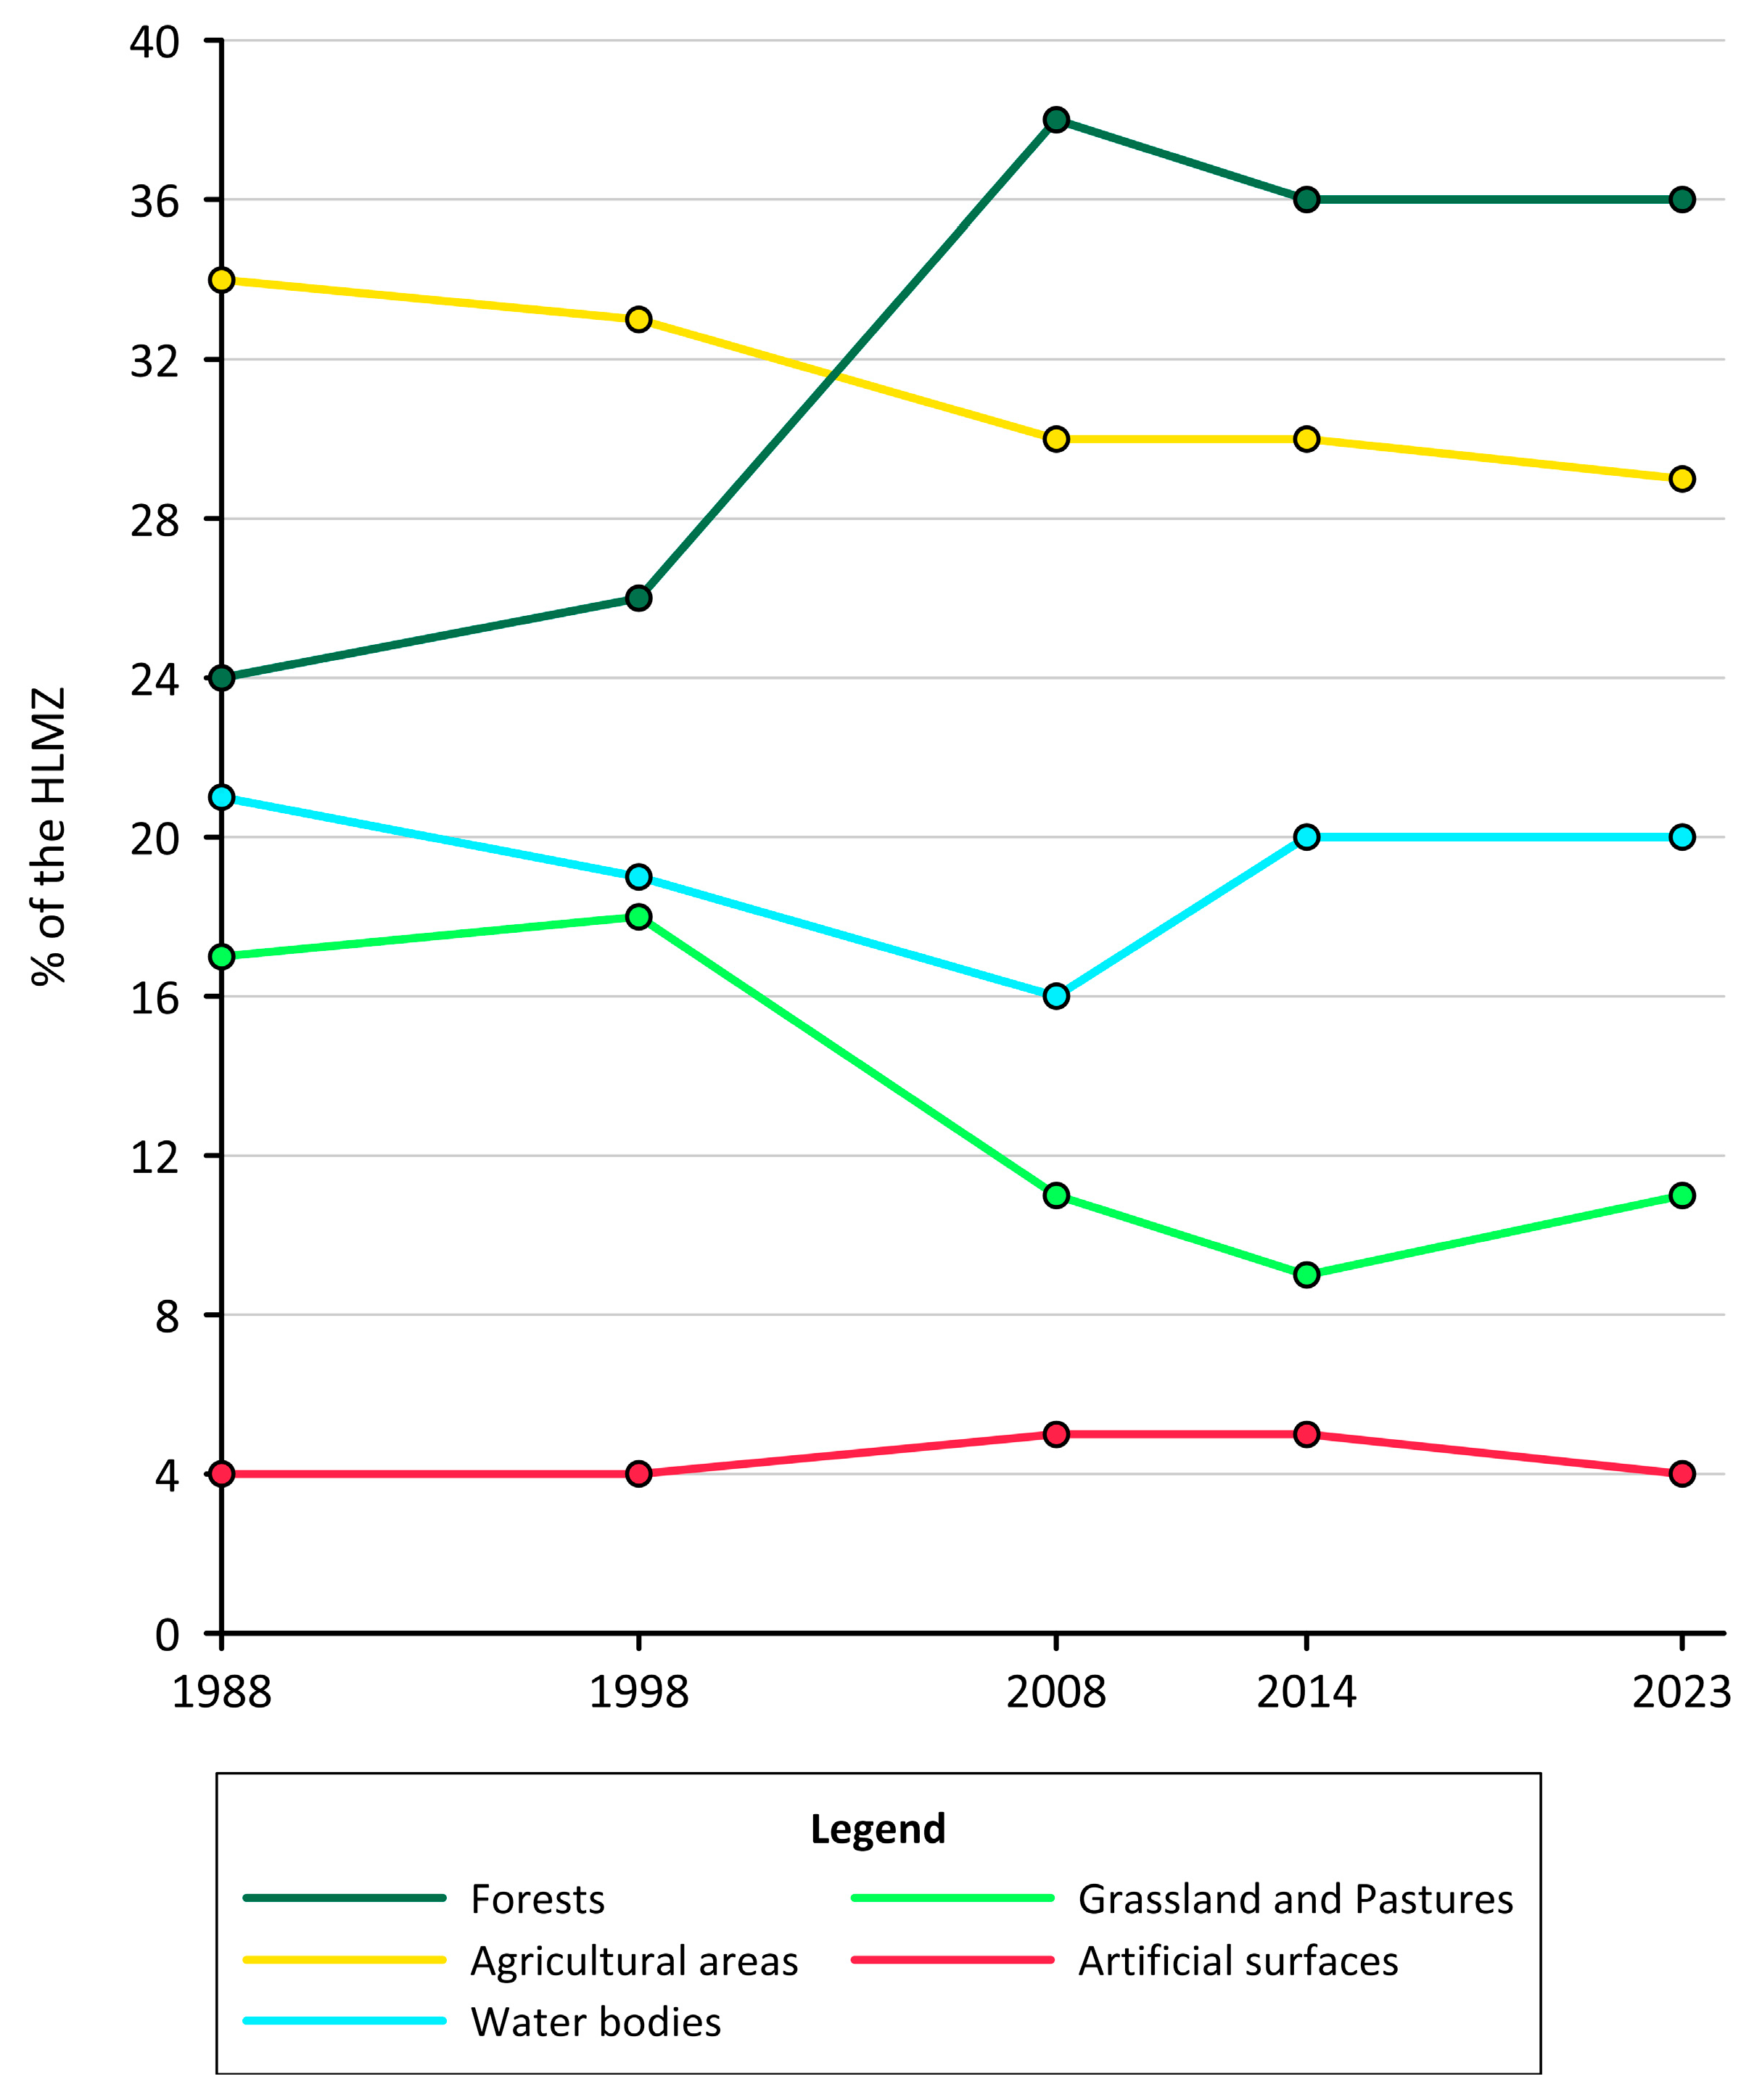
In 1998 (Figure 4b, Figure 5b, Figure 6b and Figure 7b), agricultural areas have remained the most widespread LULC class, followed by forests, water bodies, grasslands and pastures, and, finally, artificial surfaces. Considering the period 1988–1998 (Table 3, Figure 8), it can be observed that the percentage of the HLMZ area occupied by forests and grasslands/pastures LULC classes has slightly increased. Differently, the percentage of the HLMZ area occupied by agricultural lands and water bodies has slightly decreased, while such a percentage has remained unchanged for the artificial surfaces. Table 3 also shows that, in terms of areal variation in each LULC class within the HLMZ, no significant changes have occurred. Agricultural areas have slightly decreased in their overall extension when compared to the HLMZ area. The area of all the remaining LULC classes has experienced a negligible increase, ranging from +4.2% for forests to +7.2% for artificial surfaces. The latter, however, has remained negligible in their overall area (Table 3).
Figure 8.
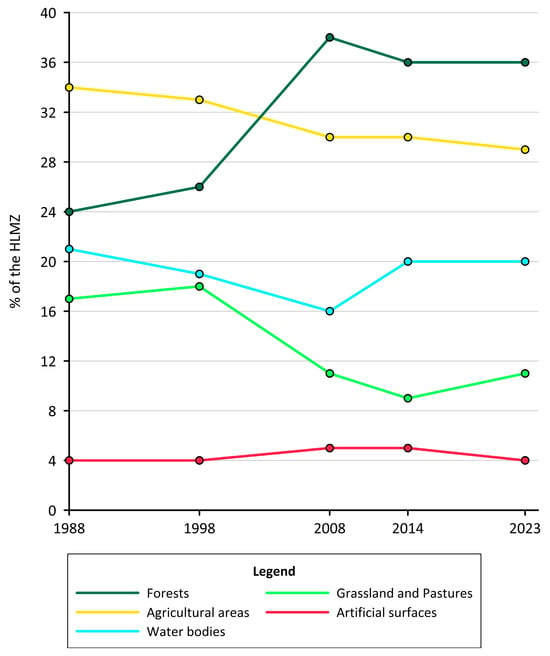
Multitemporal variations in the LULC classes areas (expressed as percent of the Sele River HLMZ area) in the investigated time span.
In 2008, forests became the most widespread LULC class, accounting for 38% of the HLMZ area, followed by agricultural lands, water bodies, grasslands/pastures, and artificial surfaces (Figure 4c, Figure 5c, Figure 6c and Figure 7c). Thus, over the period 1998–2008, significant changes have occurred (Figure 8). The percentage of the HLMZ area occupied by forests has significantly increased. Conversely, the areal percentage of agricultural areas and water bodies has slightly decreased, while grassland and pastures have decreased more markedly (Table 3). Artificial surfaces have increased by 1%, only. Table 3 also shows that, in terms of areal variation in each LULC class within the HLMZ, significant changes have occurred. Forests have experienced a marked increase in their extent (+48%), as well as the artificial surfaces (+19.3%). The area of all the remaining LULC classes has decreased, mainly grasslands and pastures and water bodies, while agricultural areas have undergone a moderate decline.
In 2014, no significant changes compared to the previous year were detected (Figure 4d, Figure 5d, Figure 6d and Figure 7d). Forests have remained the most widespread LULC class, followed by agricultural areas, water bodies, grasslands and pastures, and artificial surfaces (Table 3, Figure 7d). Considering the period 2008–2014 (Table 3, Figure 8), the percentage of the HLMZ area occupied by forests and grasslands/pastures classes has slightly decreased. Conversely, water bodies have slightly increased, while the percentages of artificial surfaces and agricultural areas have remained unchanged. In terms of areal variation among the LULC classes (Table 3), forests have experienced only a slight decrease in their extent, while the reduction in grasslands and pastures has been more significant (−19.4%). The area of water bodies has significantly increased (+20.9%), whereas both agricultural areas and artificial surfaces have shown almost no change.
In 2023 (Figure 4e, Figure 5e, Figure 6e and Figure 7e), forests still occupied 36% of the total HLMZ area, followed by agricultural areas, water bodies, grasslands and pastures, and artificial surfaces (Figure 7e). During the period 2014–2023 (Table 3, Figure 8), the areal extent of forests and water bodies has remained essentially unchanged within the HLMZ area, whereas grasslands and pastures have shown a modest increase. In contrast, agricultural areas and artificial surfaces have exhibited a very slight decrease. In terms of areal variation (Table 3), grasslands and pastures have significantly expanded (+25.3%), as well as water bodies, even to a much lesser extent. The area of all the remaining LULC classes has decreased.
Finally, considering the multitemporal LULC change analysis over the entire time span (1988–2023; Table 3 and Figure 8), the variation in areal extent has mainly concerned a forest expansion, reflected by the fact that the percentage of the HLMZ area occupied by forests has increased by 12%. Such expansion has been still more evident considering the areal variation in the forest LULC class, whose extent has increased by 43.5% (Table 3). Also significant, in the considered time span, is the net reduction in grasslands and pastures, as the percentage of the HLMZ occupied by this LULC class decreased by 33.6%. The areal reduction in agricultural areas has been more linear, even if quantitatively less significant than those mentioned above (Figure 8), as the percentage of HLMZ used for agricultural purposes has decreased by 5% only. The net area variation in water bodies and artificial surfaces has been negligible, even if the former has been subject to more significant fluctuations associated with the channel adjustments experienced by the Sele River active channel in the considered time span.
4. Discussion
The accurate mapping of the HLMZ is unquestionably of utmost importance, as this zone represents the portion of the floodplain most susceptible to channel dynamics. Several limitations have emerged during the HLMZ delimitation (Figure 2), mainly related to the use of historical topographic maps (Figure 3). These limitations have mainly concerned spatial inaccuracies and variable detail in channel representation, which sometimes has resulted in positional uncertainties of some parts of the historical channels. On this basis, with the aim of defining the HLMZ boundaries more precisely, it has been necessary to integrate cartographic information derived from active channel digitization on historical maps with a comparative analysis with geomorphological features (e.g., inactive fluvial scarps and abandoned channels) identifiable in more recent and detailed topographic maps and/or aerial imagery. This approach has resulted in a more reliable mapping of the overall HLMZ. In certain cases, in fact, historical maps represent river morphology in a generalized way, omitting key floodplain features and introducing biases in the reconstruction of the HLMZ extent. The detailed comparative analysis with the 1955 IGMI topographic maps and remotely sensed imagery (i.e., orthophotos and Google Earth imagery) from 1998 to 2023 has allowed a reliable identification and correction of potential over- or underestimations of the HLMZ area (Figure 3).
The multitemporal analysis for the period 1988–2023 of the correctly mapped HLMZ has allowed the evaluation of the LULC evolution and trends within this zone. As stated in Section 2.2.1 the digitization of the different LULC classes has been carried out by means of on-screen visual interpretation of high-quality materials in a GIS environment. Such a method is unquestionably time-consuming if applied to vast areas; however, this has not been the case with the Sele River HLMZ, which covers approximately 16 km2. Furthermore, compared to automated or supervised classifications of remotely sensed data, on-screen visual interpretation reduces the possibility of erroneous interpretations, as it is based on direct reconnaissance and mapping of well-distinct LULC class patterns by the operator, especially when the used materials are at a detailed scale, as in this study. This further confirms the necessity of selecting a limited number of LULC classes with markedly different visual characteristics, as already highlighted in the literature [4,64,65]. Finally, compared to automated and/or supervised classifications, on-screen visual interpretation and digitation in GIS environment avoids the necessity of time-consuming calculations of statistical metrics (e.g., K-coefficient, user’s accuracy, producer’s accuracy, sensitivity, specificity; [66]) and the following GIS-analysis of the digitized LULC classes polygons provides the possibility of a quantitative study of the LULC classes variations.
Considering that this study has been based on slightly heterogeneous datasets, as digitized by different operators, it has been important, according to the literature [4,65,66], to select LULC classes able to represent strikingly different LULC classes. In fact, in accordance with the studies mentioned above, any analysis of LULC changes based on datasets from different sources is generally subject to technical problems. Thus, minimizing the number of LULC categories reduces the potential occurrence of misclassification errors [21]. Furthermore, the use of a few and easily recognizable LULC classes unquestionably favors the comparisons and/or the transfer of the obtained data to other study areas similar, from a morphoclimatic point of view, to the HLMZ analyzed in this study.
Although LULC mapping in this study has been performed through manual visual interpretation, classification reliability and uncertainty have been considered. Visual interpretation of aerial and remotely sensed imagery inherently involves a degree of subjectivity, since the identification of the LULC class depends on operator experience and on the quality and resolution of the available data [67,68]. In the present study, uncertainty has been mitigated by adopting a multi-source approach based on high-resolution orthophotos and Google Earth imagery, as well as by selecting a limited number of broad and clearly distinguishable LULC classes, thus reducing classification ambiguity [69]. Repeated visual cross-checks have also been performed during the digitization process in order to improve internal consistency. Nevertheless, some degree of uncertainty cannot be completely excluded, particularly due to differences in spatial resolution and quality among the multi-temporal datasets, and to the operator-dependent nature of the interpretation process. Therefore, minor variations should be interpreted with caution. A formal quantitative validation would have required independent reference data for each analyzed year, which are currently not available.
In the considered period (1988–2023), the multitemporal analysis has shown that an overall agricultural vocation has characterized the Sele River HLMZ during the first part of the investigated period (i.e., from 1988 to 1998), while from 1998 onwards pristine or marginally anthropized landsurfaces (i.e., forests and grasslands/pastures) have become dominant over more anthropized ones (i.e., agricultural areas and artificial surfaces). Because comparable HLMZ-scale studies are lacking, the observed trends have been compared with LULC dynamics documented at alluvial plain, basin, regional, and national scales.
A first interesting comparison has been carried out between the LULC trend observed in the Sele River HLMZ and the one reported by Magliulo et al. [4] for the entire alluvial plain of the Sele River, even if in a longer period compared to the one considered in this study (i.e., 1960–2012 vs. 1988–2023). In fact, Magliulo et al. [4] have observed that agricultural areas have shown strong persistence in the whole Sele River alluvial plain due to soil fertility and suitability for mechanized farming, the latter favored by the flat morphometry of the valley floor. This trend has resulted in contrast with the one observed in the Sele River HLMZ, where the agricultural areas have experienced a decline in their extension (Figure 8). Possibly, the reduction in agricultural areas in the most flood-prone portion of the Sele River alluvial valley (i.e., the HLMZ) could reflect an increased sensitivity to flood hazard and an attempt to minimize the associated risks. This is proved by the fact that, in recent years, measures of re-naturalization and ecological–functional recovery of river corridors and riparian zones, consisting of reforestation or environmental restoration projects, have been implemented [70].
The trend in LULC changes we have observed in the Sele River HLMZ (i.e., the increase in natural and semi-natural areas at the expense of more anthropized ones) is partly in good accordance with the overall LULC dynamics that have affected the entire Sele River basin from the 1960s onwards. In fact, Magliulo et al. [4] have documented an increase in forested areas in the entire basin, which accounted for one-third of the total basin area. Similarly to the entire basin, in the Sele River HLMZ, forests have expanded mainly at the expense of grasslands and pastures and, to a lesser extent, agricultural areas (Figure 8). The same trends have also been reported for other basins in Southern Italy, e.g., the Calore [23] and Fortore basins [24], suggesting a regional dimension of such LULC changes. This is confirmed by the studies by Di Gennaro et al. [22], Rivieccio et al. [71], and, at a broader scale, Falcucci et al. [21].
However, a striking difference in the LULC trends at the basin, regional, and national scale, and the one we have observed in the Sele River HLMZ has concerned the artificial surfaces. At the Sele River basin scale, Magliulo et al. [4] have reported that artificial surfaces have almost tripled between the 1960s and early 2010s. At the regional scale, the data by Di Gennaro et al. [22] have shown that artificial surfaces have increased by four times in the period 1960–1998, and that 55.4% of such increase has been localized in the alluvial and coastal plains. Finally, at the national scale, Falcucci et al. [21] have reported an increase by 3.27% of the artificial surfaces in the period 1990–2000. Different from all the above-described trends, in the Sele River HLMZ, the artificial surfaces have remained almost stable (Figure 8) over the entire period of 35 years (i.e., 1998–2023) that we have examined, always occupying a negligible portion of the HLMZ (i.e., 4–5%; Table 3 and Figure 7). As well as the reduction in agricultural areas, the expansion of forests, and the absence of artificial surface expansion within the HLMZ have suggested that LULC dynamics have been mainly driven by the perception of the high flood hazard, differently from the drivers acting at basin, regional, and national scales (e.g., depopulation and/or agricultural land abandonment as driving force of afforestation). More precisely, given that the HLMZ corresponds to the most flood-prone and morphodynamically active portion of the alluvial plain, the high flood hazard associated with the Sele River may have limited the expansion of artificial surfaces within this zone, thereby discouraging agriculture and promoting forest expansion, as forests can dissipate flood energy, stabilize riverbanks, and reduce exposure and vulnerability. Recurrent flood events, such as the extreme 2010 flood, together with hazard zoning and planning constraints, may have discouraged permanent urban development within the area.
As concerns the areal variations in the water bodies LULC class, which almost totally correspond to the Sele River active channel, it is interesting to note the full accordance between such variations and the results of previous studies dealing with the Sele River short-term channel adjustments. In particular, Magliulo et al. [24] have reported a prolonged phase of narrowing of the Sele River active channel from the end of XIX century to the early 2000s. Such a phase is fully reflected by the decrease in the extent of water bodies LULC class between 1998 and 2008 (Table 3; Figure 7 and Figure 8). The same Authors have documented a following phase of widening of the Sele River channel that they have attributed, based on literature data [27,70,71,72,73,74,75], to the geomorphological effects of the extreme Sele River flood of 2010. Also, this phase is fully reflected by the increase in water bodies’ LULC area observed in this study (Table 3; Figure 7 and Figure 8).
Finally, the data we have obtained in this research also allow some preliminary considerations about the multitemporal variations in flood risk within the Sele River HLMZ. Direct field observations and visual analysis of 1:5000 topographic maps have shown that the HLMZ consists of flat land surfaces hanging ~2 m above the current riverbed, which are characterized by an almost constant elevation. Thus, the flood hazard can be considered very high, as stated above, and quite constant over the entire HLMZ. As concerns vulnerability and exposure, this study highlighted that, at least from 1998 onwards, the HLMZ evolved towards more pristine conditions through a marked increase in the forested areas (Table 3; Figure 7 and Figure 8), which was coupled, from 2014 to 2023, with an increase in grasslands and pastures (mostly of natural origin), too. In other words, the HLMZ area that was occupied by LULC classes characterized by a null or very low vulnerability and/or exposure (i.e., forests, grasslands/pastures) increased from the late 1990s onwards. Differently, the areal percent of the HLMZ covered by the LULC classes characterized by the highest vulnerability and/or exposure, i.e., agricultural areas and artificial surfaces, remained quite constant or decreased. Agricultural areas can be damaged by floods through damage to cultivations, soil loss by erosion, and, following deposition, damage to agricultural machinery, and, finally, injuries or deaths of the farmers. However, agricultural areas are still quite widespread within the flood-prone HLMZ, as they still account for 29% of the HLMZ area, due to the high fertility of alluvial soils, and their conversion to more pristine LULC classes would be desirable to further reduce flood risk. Similarly, artificial surfaces, which are the LULC class characterized by the highest vulnerability and exposure, still represent “spots” of very high flood risk, even if they account for 4% of the HLMZ surface only. Any case, the picture that emerges in terms of flood risk within the Sele River HLMZ is quite encouraging. In particular, the significant afforestation that occurred between 1998 and 2008 has likely greatly reduced the damage induced by the Sele River catastrophic flood of 8–9 November 2010. Any case, a more detailed risk assessment, which is out of the main scope of this study, should be carried out and is already planned in the following stages of the research. More precisely, because no hydrological modeling or quantitative flood risk assessment has been carried out in this study, the possible implications in the flood risk perspective of the detected LULC dynamics should be considered as preliminary and mainly intended to support future investigations.
5. Conclusions
The results of this study have provided information about the changes in the spatial distribution of LULC classes within the Sele River HLMZ over the last 35 years. This area has not been investigated so far and includes the current active channel and the zones of the alluvial plain where channel morphological adjustments are most likely to occur, and fluvial processes (i.e., channel migration, widening, and erosion) can be sustained.
The study has provided a contribution to fill the gap in studies dealing with multidecadal assessment of LULC changes at the HLMZ scale, which is particularly relevant because this zone represents the portion of the alluvial plain most susceptible to channel adjustments and reactivation during floods. Despite the availability of LULC studies at national, regional, and basin scales, no previous research dealing with LULC has specifically focused on the HLMZs.
The study has demonstrated the effectiveness of integrating historical cartography, aerial orthophotos, and geomorphological indicators (e.g., active/inactive fluvial scarps, abandoned channels) to more accurately delineate the HLMZ.
The LULC analysis we have carried out has allowed us to observe the variations that occurred between 1988 and 2023. The most significant outcome of the LULC analysis has been the transition of the HLMZ towards more pristine conditions, with an increase in forests at the expense of agricultural areas and a lack of significant expansion of artificial surfaces. Different from those at the basin, regional, and national scales, this trend has probably been driven by an increased sensitivity towards the Sele River flood hazard and could have positive implications in terms of flood risk.
Future research should focus on a more detailed evolution and quantitative assessment of the flood hazard and risk. In this framework, the data we have produced are unquestionably a key starting point and should be integrated with an additional analytical component (e.g., hydraulic modeling, flood inundation mapping, quantitative exposure analysis, and/or comparison with official hazard maps). This approach could be applied in similar contexts, also taking into account the lack of HLMZ-scaled studies.
Author Contributions
Conceptualization, P.M.; methodology, P.M.; software, E.G.D.; validation, E.G.D., F.A. and P.M.; formal analysis, E.G.D. and F.A.; investigation, E.G.D., F.A. and P.M.; resources, P.M.; data curation, E.G.D., F.A. and P.M.; writing—original draft preparation, E.G.D.; writing—review and editing, E.G.D. and P.M.; visualization, E.G.D., F.A. and P.M.; supervision, P.M.; project administration, P.M.; funding acquisition, P.M. All authors have read and agreed to the published version of the manuscript.
Funding
This research was funded by Università degli Studi del Sannio, RESIDUI_FRA_MAGLIULO (Id: 7288), Responsible: Paolo Magliulo.
Data Availability Statement
Data are contained within the paper.
Acknowledgments
The Authors are grateful to the three anonymous reviewers, whose valuable comments and suggestions greatly helped in improving the clarity of the article.
Conflicts of Interest
The authors declare no conflicts of interest.
References
- Lillesand, T.M.; Kiefer, R.W.; Chipman, J.W. Remote Sensing and Image Interpretation, 6th ed.; John Wiley & Sons: Hoboken, NJ, USA, 2008; p. 804. [Google Scholar]
- Zhao, Y.; Zhang, K.; Fu, Y.; Zhang, H. Examining land use/land cover change in the Lake Dianchi watershed of the Yunnan–Guizhou Plateau of Southwest China with remote sensing and GIS techniques: 1974–2008. Int. J. Environ. Res. Public Health 2012, 9, 3843–3865. [Google Scholar] [CrossRef] [Scilit] [PubMed]
- Magliulo, P.; Di Lisio, A.; Russo, F.; Zelano, A. Geomorphology and landslide susceptibility assessment using GIS and bivariate statistics: A case study in southern Italy. Nat. Hazards 2008, 47, 411–435. [Google Scholar] [CrossRef] [Scilit]
- Magliulo, P.; Cusano, A.; Russo, F. Land-use changes in the Sele River Basin Landscape (Southern Italy) between 1960 and 2012: Comparisons and implications for soil erosion assessment. Geographies 2021, 1, 315–332. [Google Scholar] [CrossRef] [Scilit]
- Borrelli, P.; Robinson, D.A.; Fleischer, L.R.; Lugato, E.; Ballabio, C.; Alewell, C.; Meusburger, K.; Modugno, S.; Schütt, B.; Ferro, V.; et al. An assessment of the global impact of 21st century land use change on soil erosion. Nat. Commun. 2017, 8, 2013. [Google Scholar] [CrossRef] [Scilit]
- Bessah, E.; Raji, A.O.; Taiwo, O.J.; Agodzo, S.K.; Ololade, O.O. The impact of varying spatial resolution of climate models on future rainfall simulations in the Pra River Basin (Ghana). J. Water Clim. Change 2020, 11, 1263–1283. [Google Scholar] [CrossRef] [Scilit]
- Paglia, G.; Mancinelli, V.; Schipani, I.; Miccadei, E. Land-use changes and geo-hydrological phenomena in the Abruzzo Periadriatic Area (central Italy): The case of the Pescara River basin. Sustain. Environ. 2024, 10, 2391135. [Google Scholar] [CrossRef] [Scilit]
- Khodaei, H.; Nasiri Saleh, F.; Nobakht Dalir, A.; Zarei, E. Future flood susceptibility mapping under climate and land use change. Sci. Rep. 2025, 15, 12394. [Google Scholar] [CrossRef] [Scilit]
- Patel, S.; Indraganti, M.; Jawarneh, R.N. Land surface temperature responses to land use dynamics in urban areas of Doha, Qatar. Sustain. Cities Soc. 2024, 104, 105273. [Google Scholar] [CrossRef] [Scilit]
- Bikis, A.; Engdaw, M.; Pandey, D.; Pandey, B.K. The impact of urbanization on land use land cover change using geographic information system and remote sensing: A case of Mizan Aman City, Southwest Ethiopia. Sci. Rep. 2025, 15, 12014. [Google Scholar] [CrossRef] [Scilit]
- Scorpio, V.; Piégay, H. Is afforestation a driver of change in Italian rivers within the Anthropocene era? Catena 2021, 202, 105031. [Google Scholar] [CrossRef] [Scilit]
- Miller, J.R.; Grow, D.; Philyaw, L.S. Influence of historical land-use change on contemporary channel processes, form, and restoration. Geosciences 2021, 11, 423. [Google Scholar] [CrossRef] [Scilit]
- Das, D.; Prodhan, F.A.; Hoque, M.Z.; Haque, M.E.; Kabir, M.H. Monitoring and Future Prediction of Land Use Land Cover Dynamics in Northern Bangladesh Using Remote Sensing and CA-ANN Model. Earth 2025, 6, 73. [Google Scholar] [CrossRef] [Scilit]
- Fernández, D.; Barquín, J.; Álvarez-Cabria, M.; Peñas, F.J. Land-Use Coverage as an Indicator of Riparian Quality. Ecol. Indic. 2014, 41, 165–174. [Google Scholar] [CrossRef] [Scilit]
- Naiman, R.J.; Decamps, H. The ecology of interfaces: Riparian zones. Annu. Rev. Ecol. Syst. 1997, 28, 621–658. [Google Scholar] [CrossRef] [Scilit]
- Lind, L.; Hasselquist, E.M.; Laudon, H. Towards ecologically functional riparian zones: A meta-analysis to develop guidelines for protecting ecosystem functions and biodiversity in agricultural landscapes. J. Environ. Manag. 2019, 249, 109391. [Google Scholar] [CrossRef] [Scilit] [PubMed]
- Renouf, K.; Harding, J.S. Characterizing riparian buffer zones of an agriculturally modified landscape. N. Z. J. Mar. Freshw. Res. 2015, 49, 323–332. [Google Scholar] [CrossRef] [Scilit]
- Olokeogun, O.S.; Kumar, M. An indicator based approach for assessing the vulnerability of riparian ecosystem under the influence of urbanisation in the Indian Himalayan city, Dehradun. Ecol. Indic. 2020, 119, 106796. [Google Scholar] [CrossRef] [Scilit]
- Gay, E.T.; Martin, K.L.; Caldwell, P.V.; Emanuel, R.E.; Sanchez, G.M.; Suttles, K.M. Riparian buffers increase future baseflow and reduce peakflows in a developing watershed. Sci. Total Environ. 2023, 862, 160834. [Google Scholar] [CrossRef] [Scilit]
- Forino, G.; Ciccarelli, S.; Bonamici, S.; Perini, L.; Salvati, L. Developmental policies, long-term land-use changes and the way towards soil degradation: Evidence from Southern Italy. Scott. Geogr. J. 2015, 131, 123–140. [Google Scholar] [CrossRef] [Scilit]
- Falcucci, A.; Maiorano, L.; Boitani, L. Changes in land-use/land-cover patterns in Italy and their implications for biodiversity conservation. Landsc. Ecol. 2007, 22, 617–631. [Google Scholar] [CrossRef] [Scilit]
- Di Gennaro, A.; Innamorato, F.; Capone, S. La grande trasformazione: Land cover e land use in Campania. In Estimo e Territorio–Valutare e Gestire L’ambiente; Edagricole: Bologna, Italy, 2005; Volume 3(LXVII), pp. 25–39. [Google Scholar]
- Magliulo, P.; Cusano, A.; Sessa, S.; Beatrice, M.; Russo, F. Multidecadal land-use changes and implications on soil protection in the Calore River Basin landscape (Southern Italy). Geosciences 2022, 12, 156. [Google Scholar] [CrossRef] [Scilit]
- Magliulo, P.; Cusano, A.; Iacomino Caputo, G.; Russo, F. Changes in Land-Cover/Land-Use Pattern in the Fortore River Basin (Southern Italy) and Morphodynamic Implications. Land 2023, 12, 1393. [Google Scholar] [CrossRef] [Scilit]
- Malavoi, J.R.; Bravard, J.P.; Piegay, H.; Herouin, E.; Ramez, P. Determination de l’espace de liberte’ des cours d’eau. In Guide Technique No. 2; Agence de l’Eau Rhône Méditerranée Corse: Lyon, France, 1998; p. 39. [Google Scholar]
- Leopold, L.B. A View of the River; Harvard University Press: Cambridge, MA, USA, 1994; ISBN 0-674-93732-5. [Google Scholar]
- Magliulo, P.; Valente, A. GIS-based geomorphological map of the Calore River flood plain near Benevento (Southern Italy) overflooded by the 15th October 2015 event. Water 2020, 12, 148. [Google Scholar] [CrossRef] [Scilit]
- Scorpio, V.; Surian, N.; Cucato, M.; Dai Prá, E.; Zolezzi, G.; Comiti, F. Channel changes of the Adige River (Eastern Italian Alps) over the last 1000 years and identification of the historical fluvial corridor. J. Maps 2018, 14, 680–691. [Google Scholar] [CrossRef] [Scilit]
- Brenna, A.; Bizzi, S.; Surian, N. How Multiple Anthropic Pressures May Lead to Unplanned Channel Patterns: Insights from the Evolutionary Trajectory of the Po River (Italy). Catena 2024, 234, 19. [Google Scholar] [CrossRef] [Scilit]
- Rinaldi, M.; Gumiero, B.; Monaci, M.; Ori, R.; Lenzi, D.; Bellacci, L.; Belletti, B. The Panaro River (Northern Italy): Definition of possible strategies for river restoration. In Proceedings of the 4th ECRR International Conference on River Restoration, Venice, Italy, 16–21 June 2008; pp. 531–540. [Google Scholar]
- Rinaldi, M.; Surian, N.; Comiti, F.; Bussettini, M. A methodological framework for hydromorphological assessment, analysis and monitoring (IDRAIM) aimed at promoting integrated river management. Geomorphology 2015, 251, 122–136. [Google Scholar] [CrossRef] [Scilit]
- Surian, N.; Rinaldi, M. Morphological response to river engineering and management in alluvial channels in Italy. Geomorphology 2003, 50, 307–326. [Google Scholar] [CrossRef] [Scilit]
- Gregory, K.J. The human role in changing river channels. Geomorphology 2006, 79, 172–191. [Google Scholar] [CrossRef] [Scilit]
- Hooke, J.M. Human impacts on fluvial systems in the Mediterranean region. Geomorphology 2006, 79, 311–335. [Google Scholar] [CrossRef] [Scilit]
- Dufour, S.; Rinaldi, M.; Piégay, H.; Michalon, A. How do river dynamics and human influences affect the landscape pattern of fluvial corridors? Lessons from the Magra River, Central–Northern Italy. Land Urban Plan. 2015, 134, 107–118. [Google Scholar] [CrossRef] [Scilit]
- Angelone, F.; D’Onofrio, E.G.; Russo, F.; Valente, A.; Magliulo, P. Channel pattern medium-term changes in four rivers of Southern Italy: A summary. Geogr. Fis. Din. Quat. 2025, 48, 133–148. [Google Scholar] [CrossRef]
- Diodato, N. The influence of topographic co-variables on the spatial variability of precipitation over small regions of complex terrain. Int. J. Climatol. 2005, 25, 351–363. [Google Scholar] [CrossRef] [Scilit]
- Diodato, N.; Fagnano, M.; Alberico, I.; Chirico, G.B. Mapping soil erodibility from composed data set in Sele River Basin, Italy. Nat. Hazards 2011, 58, 445–457. [Google Scholar] [CrossRef] [Scilit]
- Mostardini, F.; Merlini, S. Appennino centro meridionale. Sezioni geologiche e proposta di modello strutturale. Mem. Soc. Geol. Ital. 1986, 35, 177–202. [Google Scholar]
- Scandone, P.; Sgrosso, I. Il Mesozoico nel gruppo montuoso dell’Accellica (Monti Picentini–Salerno). Mem. Soc. Geol. Ital. 1963, 4, 1–8. [Google Scholar]
- Iannace, P.; Torrente, M.M.; Milia, A. Tectono-stratigraphic evolution of the Southern Campania Margin: A key area for the evolution of the Tyrrhenian-Apennine system. Oil Gas Sci. Technol.–Rev. IFP Energ. Nouv. 2018, 73, 18. [Google Scholar] [CrossRef] [Scilit]
- Vitale, S.; Ciarcia, S. Tectono-stratigraphic setting of the Campania region (southern Italy). J. Maps 2018, 14, 9–21. [Google Scholar] [CrossRef] [Scilit]
- Brancaccio, L.; Cinque, A.; D’Angelo, G.; Russo, F.; Santangelo, N.; Sgrosso, I. Evoluzione tettonica e geomorfologica della Piana del Sele (Campania, Appennino Meridionale): Tectonic and geomorphological evolution of the Sele Plain (Campania, Southern Apennine). Geogr. Fis. Din. Quat. 1987, 10, 47–55. [Google Scholar]
- Guida, D.; Iaccarino, G.; Lazzari, S. Map of the landslides of the upper Basento valley. In Proceedings of the Conference Ambiente Fisico Uso e Tutela del Territorio di Potenza; Italian National Research Council (CNR): Potenza, Italy, 1988; CNR Publication 1225. [Google Scholar]
- Amato, V.; Aucelli, P.P.C.; Ciampo, G.; Cinque, A.; Di Donato, V.; Pappone, G.; Petrosino, P.; Romano, P.; Rosskopf, C.M.; Russo Ermolli, E. Relative sea level changes and paleogeographical evolution of the southern Sele plain (Italy) during the Holocene. Quat. Intern. 2013, 288, 112–128. [Google Scholar] [CrossRef] [Scilit]
- Monti, L.; D’Elia, G.; Toccaceli, R.M. Analisi del dissesto da frane in Campania. In Rapporto Sulle Frane in Italia. Il Progetto IFFI—Metodologia, Risultati e Rapporti Regionali; Agenzia per la Protezione dell’Ambiente e per i Servizi Tecnici (APAT): Rome, Italy, 2007; pp. 509–545. [Google Scholar]
- Di Lisio, A.; Aucelli, P.P.C.; Russo, F. Rapporto tra franosità e caratteristiche geo-ambientali mediante l’utilizzo del GIS. In Proceedings of the Conference on Geo-Environmental and GIS Applications; XI Conferenza Nazionale ASITA: Milano, Italy, November 2007; pp. 1001–1006. [Google Scholar]
- Esposito, C.; Mastrantoni, G.; Marmoni, G.M.; Antonielli, B.; Caprari, P.; Pica, A.; Schilirò, L.; Mazzanti, P.; Bozzano, F. From theory to practice: Optimization of available information for landslide hazard assessment in Rome relying on official, fragmented data sources. Landslides 2023, 20, 2055–2073. [Google Scholar] [CrossRef] [Scilit]
- Teshome, D.S.; Leta, M.K.; Taddese, H.; Moshe, A.; Tolessa, T.; Ayele, G.T.; You, S. Watershed Hydrological Responses to Land Cover Changes at Muger Watershed, Upper Blue Nile River Basin, Ethiopia. Water 2023, 15, 2533. [Google Scholar] [CrossRef] [Scilit]
- Van Rompaey, R. New perspectives on tropical rain forest vegetation ecology in West Africa. IDS Bull. 2002, 33, 31–38. [Google Scholar] [CrossRef] [Scilit]
- Centro Funzionale per la Previsione Meteorologica e il Monitoraggio Meteopluvioidrometrico e Delle Frane. Rapporto Dell’evento Dell’8–10 Novembre 2010 nel Territorio Della Provincia di Salerno; Regione Campania: Naples, Italy, 2010; p. 38. Available online: https://portaleprotezionecivile.regione.campania.it (accessed on 20 February 2026).
- Slama, C.C.; Henriksen, S.W.; Theurer, C. Manual of Photogrammetry, 4th ed.; American Society of Photogrammetry: Falls Church, VA, USA, 1980; p. 1056. [Google Scholar]
- Taylor, J.R. An Introduction to Error Analysis; University Science Books: Sausalito, CA, USA, 1982; p. 327. [Google Scholar]
- Likos, W.J.; D’Odorico, P.; Marani, M. Modelling river-bank erosion processes and mass failure mechanisms: Progress towards fully coupled simulations. Adv. Water Resour. 2007, 30, 1356–1370. [Google Scholar] [CrossRef] [Scilit]
- Rinaldi, M.; Amponsah, W.; Benvenuti, M.; Borga, M.; Comiti, F.; Lucìa, A.; Marchi, L.; Nardi, L.; Righini, M.; Surian, N. An integrated approach for investigating geomorphic response to extreme events: Methodological framework and application to the October 2011 flood in the Magra River catchment, Italy. Earth Surf. Process. Landf. 2016, 41, 835–846. [Google Scholar] [CrossRef] [Scilit]
- Scott, J.A.; Merritt, D.M. Riparian response guilds shift in response to flow alteration in montane streams of the southern Rocky Mountains. Ecosphere 2020, 11, e03253. [Google Scholar] [CrossRef] [Scilit]
- Lightbody, A.F.; Kui, L.; Stella, J.C.; Skorko, K.W.; Bywater-Reyes, S.; Wilcox, A.C. Riparian vegetation and sediment supply regulate the morphodynamic response of an experimental stream to floods. Front. Environ. Sci. 2019, 7, 40. [Google Scholar] [CrossRef] [Scilit]
- Galia, T.; Poledniková, Z.; Kapustová, V.; Ruiz-Villanueva, V.; Škarpich, V. Interannual spatial distribution and dynamics of large wood in a meandering river. J. Hydrol. 2025, 659, 133302. [Google Scholar] [CrossRef] [Scilit]
- Kratochvílová, D.; Cajthaml, J. Accuracy assessment of old large-scale maps and reducing positional error in land use change analyses. Sci. Rep. 2025, 15, 26994. [Google Scholar] [CrossRef] [Scilit]
- Copernicus—Land Monitoring Service. Available online: https://land.copernicus.eu/pan-european/corine-land-cover (accessed on 20 February 2026).
- Congedo, L.; Sallustio, L.; Munafò, M.; Ottaviano, M.; Tonti, D.; Marchetti, M. Copernicus high-resolution layers for land cover classification in Italy. J. Maps 2016, 12, 1195–1205. [Google Scholar] [CrossRef] [Scilit]
- García-Álvarez, D.; Camacho Olmedo, M.T.; Paegelow, M.; Mas, J.-F. Land Use Cover Datasets and Validation Tools: Validation Practices with QGIS, 1st ed.; Springer: Cham, Switzerland, 2022; pp. 39–42. [Google Scholar] [CrossRef] [Scilit]
- Brivio, P.A.; Lechi, G.; Zilioli, E. Principi e Metodi Di Telerilevamento; CittàStudi: Milan, Italy, 2006; p. 524. ISBN 978-88-251-7293-5. [Google Scholar]
- European Environment Agency, European Topic Centre on Urban land Soil Systems; ETC/ULS. Updated CLC Illustrated Nomenclature Guidelines. Available online: https://land.copernicus.eu/content/corine-land-cover-nomenclature-guidelines/docs/pdf/CLC2018_Nomenclature_illustrated_guide_20190510.pdf (accessed on 12 March 2026).
- Petit, C.C.; Lambin, E.F. Integration of multi-source remote sensing data for land cover change detection. Int. J. Geogr. Inform. Sci. 2001, 15, 785–803. [Google Scholar] [CrossRef] [Scilit]
- Petit, C.C.; Lambin, E.F. Impact of data integration technique on historical land-use/land-cover change: Comparing historical maps with remote sensing data in the Belgian Ardennes. Landsc. Ecol. 2002, 17, 117–132. [Google Scholar] [CrossRef] [Scilit]
- Lo Curzio, S.; Magliulo, P. Soil erosion assessment using geomorphological remote sensing techniques: An example from southern Italy. Earth Surf. Process. Landf. 2010, 35, 262–271. [Google Scholar] [CrossRef] [Scilit]
- Strand, G.-H.; Rekdal, Y. Area frame sampling for monitoring land use/land cover changes in Norway. Environ. Monit. Assess. 2002, 79, 91–104. [Google Scholar] [CrossRef] [Scilit]
- Foody, G.M. Status of land cover classification accuracy assessment. Remote Sens. Environ. 2002, 80, 185–201. [Google Scholar] [CrossRef] [Scilit]
- Olofsson, P.; Foody, G.M.; Herold, M.; Stehman, S.V.; Woodcock, C.E.; Wulder, M.A. Good practices for estimating area and assessing accuracy of land change. Remote Sens. Environ. 2014, 148, 42–57. [Google Scholar] [CrossRef] [Scilit]
- Distretto Appennino Meridionale. PAI–Rischio Idraulico: Elaborati di Piano ex ADB Destra Sele–Menu. Available online: https://www.distrettoappenninomeridionale.it/oldsite/index.php/elaborati-di-piano-menu/ex-adb-destra-sele-menu/pai-rischio-idraulico-menu (accessed on 20 February 2026).
- Rivieccio, R.; Sallustio, L.; Paolanti, M.; Vizzarri, M.; Marchetti, M. Where Land Use Changes Occur: Using Soil Features to Understand the Economic Trends in Agricultural Lands. Sustainability 2017, 9, 78. [Google Scholar] [CrossRef] [Scilit]
- Surian, N.; Righini, M.; Lucía, A.; Nardi, L.; Amponsah, W.; Benvenuti, M.; Borga, M.; Cavalli, M.; Comiti, F.; Marchi, L.; et al. Channel response to extreme floods: Insights on controlling factors from six mountain rivers in northern Apennines Italy. Geomorphology 2016, 272, 78–91. [Google Scholar] [CrossRef] [Scilit]
- Nardi, L.; Rinaldi, M. Spatio-temporal patterns of channel changes in response to a major flood event: The case of the Magra River (central–northern Italy). Earth Surf. Process. Landf. 2015, 40, 326–339. [Google Scholar] [CrossRef] [Scilit]
- Righini, M.; Surian, N.; Wohl, E.; Marchi, L.; Comiti, F.; Amponsah, W.; Borga, M. Geomorphic response to an extreme flood in two Mediterranean rivers (northeastern Sardinia, Italy): Analysis of controlling factors. Geomorphology 2017, 290, 184–199. [Google Scholar] [CrossRef] [Scilit]

Disclaimer/Publisher’s Note: The statements, opinions and data contained in all publications are solely those of the individual author(s) and contributor(s) and not of MDPI and/or the editor(s). MDPI and/or the editor(s) disclaim responsibility for any injury to people or property resulting from any ideas, methods, instructions or products referred to in the content. |
© 2026 by the authors. Licensee MDPI, Basel, Switzerland. This article is an open access article distributed under the terms and conditions of the Creative Commons Attribution (CC BY) license.