


Abstract
Urban agglomerations play a pivotal role in the economic and social progress of regions and countries. Substantial urban expansion, particularly in metropolitan areas, has been generally associated with economic and population growth. This study investigates the spatio-temporal urban expansion of Romania’s major metropolitan areas using Cellular Automata (CA). Focusing on eight metropolitan areas, the paper analyzes land cover dynamics from 2015 to 2020 and it develops a model of urban growth for the years 2025 and 2030. The novelty of the paper is represented by the combination of the CA algorithm and economic complexity for predicting the expansion of built-up areas. To our knowledge it is the first attempt to combine these two aspects in modelling urban growth. The analysis incorporates six variables such as land use, population density, distance to roads, slope, restricted areas and economic complexity to offer insights into future urbanization trends. Our study concluded that CA proved to be a valuable approach for modelling urban growth. The great added value of the paper is related to the integration of the economic complexity index into urban growth model. Doing so, our results not only summarize both economic development and demographic dynamics within major metropolitan areas, but they have provided the urban growth model with a novel and more robust basis for prediction. The results indicate variations in the growth rates and spatial patterns of urbanization, emphasizing the importance of informed urban planning for a sustainable urban development. A major conclusion of the paper is that the actual urban fabric will not suffer significant changes, as it is already compact. Only at the peripheries of the major urban centres there are free space reserves which can be densified by future constructions. Thus, the lack of free space in the city’s core areas and the expensive costs drive the expansion of the built-up areas towards the suburban localities located near the urban centres.
1. Introduction
Cities represent a fundamental element for the economic progress of a country or region, and the role of public authorities in supporting and developing them is particularly important. In recent decades, Romania has witnessed significant urban expansion, particularly in metropolitan areas. As urban areas continue to expand, it becomes increasingly imperative to monitor and model urban development in both spatial and temporal contexts to ensure efficient and sustainable urban planning. This necessity has led to the emergence of innovative methods and tools for modelling and projecting future urban growth. One of these techniques for modelling urban growth is Cellular Automata (CA). In recent years, this computational model has found extensive use across various fields. A review study [1] shows that Cellular Automata was primarily used for modelling the dynamics of natural systems, but after 2005, urban growth gain larger popularity as the purpose of using CA. Cellular Automata was used for various purposes: simulations of lava flows [2,3,4,5,6,7]; modelling the land dynamics of a river basin [8]; the impact of land use changes for future flood damage [9]; the impact of future flooding due to sea level rise on urban development [10]; climate and land use change impacts in ground water system [11]; the implications of future forest cover changes on the landslides risk [12]; modelling the Urban Heat Island [13]; simulation of urban mobility [14,15,16,17]; wildfire simulation [18,19].
As shown in the previous short review, although CA models are widely used in many research fields, their primarily purpose is linked to the simulation of land use/land cover (LULC) changes. The urban growth is a recurring research topic which gained momentum in the last two decades especially for making predictions. Researchers try to anticipate the urban areas expansion [20,21] for designing the most appropriate planning strategies [7,22,23,24,25,26,27,28], for preventing negative effects of the climate changes [9,10,11], and for a sustainable management of the natural resources [29,30]. In this case, various CA-based models and tools are used for predictions: MOLAND [31], MOLUSCE [32], SLEUTH [33,34], and others. Regardless of the chosen model, the variables have the main importance, and they should be selected according to the specifics of the study area and the research purpose. Most of the mentioned studies use geophysical variables (land use, slope, elevation), distance-related variables (distance from transport infrastructure, central business district), socio-demographic variables (population density). Based on these variables, optimal results could be obtained if the model is carefully calibrated, and the appropriate threshold values are used. Reference [35] analyzed land cover changes from 1989 to 2014 and modelled urban growth for the 1994–2024 period in Delhi, India, applying a Cellular Automata (CA) algorithm. In addition to land cover data extracted from satellite images, they utilized parameters such as population density, distance to the central business district (CBD), and road networks for modelling. The statistical accuracy of 95.62% indicated high precision of the model. Ref. [23] analyzed land use changes in Torres Vedras Municipality (Portugal) by modelling four scenarios for the year 2025: A0—current social and economic trend (Business as Usual); A1—regional food security; A2—climate change; and B0—farming under urban pressure. The factors used in CA model were distance to artificial surfaces, road network, agricultural land, slope, and non-building areas. The study also emphasizes the role of decision-makers in identifying the most suitable areas for land conversion. Ref. [7] used CA for predicting the evolution of Night-Time Light (NTL) for twelve NUTS-3 European metropolitan regions (Amsterdam, Barcelona, Brussels, Hamburg, London, Lyon, Madrid, Milan, Munich, Paris, Rome and Vienna). Three scenarios were derived from NTL for 2032: business as usual, expansion and contraction scenario. Ref. [27] also included socioeconomic parameters, such as gross domestic product (GDP) and population per pixel (PPP) to predict the urban growth for two scenarios: business-as-usual (BAU) and rapid urban growth (RUG) scenario. These studies show that CA models can be successfully implemented for predicting progress based on economic activity. However, to the best of our knowledge, no urban growth model—whether CA-based or otherwise—has incorporated the economic complexity of urban agglomerations as a distinct parameter. The literature on economic complexity—following the seminal work of [36]—has focused on national and regional level, contributing significantly to the understanding of economic development and to the establishment of new policy interventions [37].
Recently, hybrid models have been developed that integrate CA with advanced Machine Learning (ML) or Deep Learning (DL) models for better spatial and temporal prediction of urban growth: CA–Artificial Neural Networks [38,39], CA–Support Vector Machine [40], CA–Logistic Regression [41,42], CA–Random Forest [43], CA–Long Short-Term Memory [44], CA-CNN [45,46].
A synthesis of the reviewed literature indicates that CA is a powerful tool for urban modelling. Model performance depends heavily on variable selection and calibration, with studies reporting high predictive accuracy when properly configured. Furthermore, hybrid models combining CA with Machine Learning and Deep Learning techniques have improved predictive capabilities. However, we have identified a key gap in the literature: existing CA-based urban growth models often rely on static or spatially rigid parameters, such as distance from a central business district, which limits their applicability in cities with polycentric or diffuse economic structures; this motivates the incorporation of economic complexity to better capture real-world urban dynamics.
We add to this literature by considering economic complexity as one important factor driving urban growth and development, alongside a number of other factors like population, accessibility, and land use. Doing so, we propose an integrated perspective on urban growth by combining classical factors of urban development with a relatively new approach based on economic complexity.
Our main argument for the considering of economic complexity is that the economic diversity of a city’s economy, or in other words the economic complexity, is strongly interconnected to urban expansion through a mechanism described in the economic geography literature as cumulative-circular causation process [47,48]: cities with a higher economic complexity attract more investments which generates more firms and more employees across many industries and services. Additional workforce is attracted through immigration to respond to the increased labour demand. As a result, there is a greater need for built-up areas for housing, services, and industry as well as for household-oriented services, all of which contribute to urban growth and expansion. This mechanism with many multiplier effects is able to generate more cycles of urban expansion until the achievement of a tipping point where urban agglomeration disadvantages (related to increased environmental pollution, housing prices or traffic congestion) hinder further cumulation of urban concentration, generating a diffusion process of urban growth into the periphery.
Based on this integration of economic complexity and conventional urban-geographical factors (population, accessibility and land use), the present study proposes the forecasting of the future patterns of urban growth for the years 2025 and 2030 in the main eight metropolitan areas of Romania using CA (Cellular Automata) model. The novelty of this study lies in the first-time application of the Cellular Automata algorithm together with the economic complexity index as variables to predict the built-up area of major metropolitan areas for the years 2025 and 2030. Modelling urban growth will contribute to a better understanding of urbanization trends and the formulation of appropriate policies, thus promoting a more sustainable future for the metropolitan areas and cities.
2. Study Area
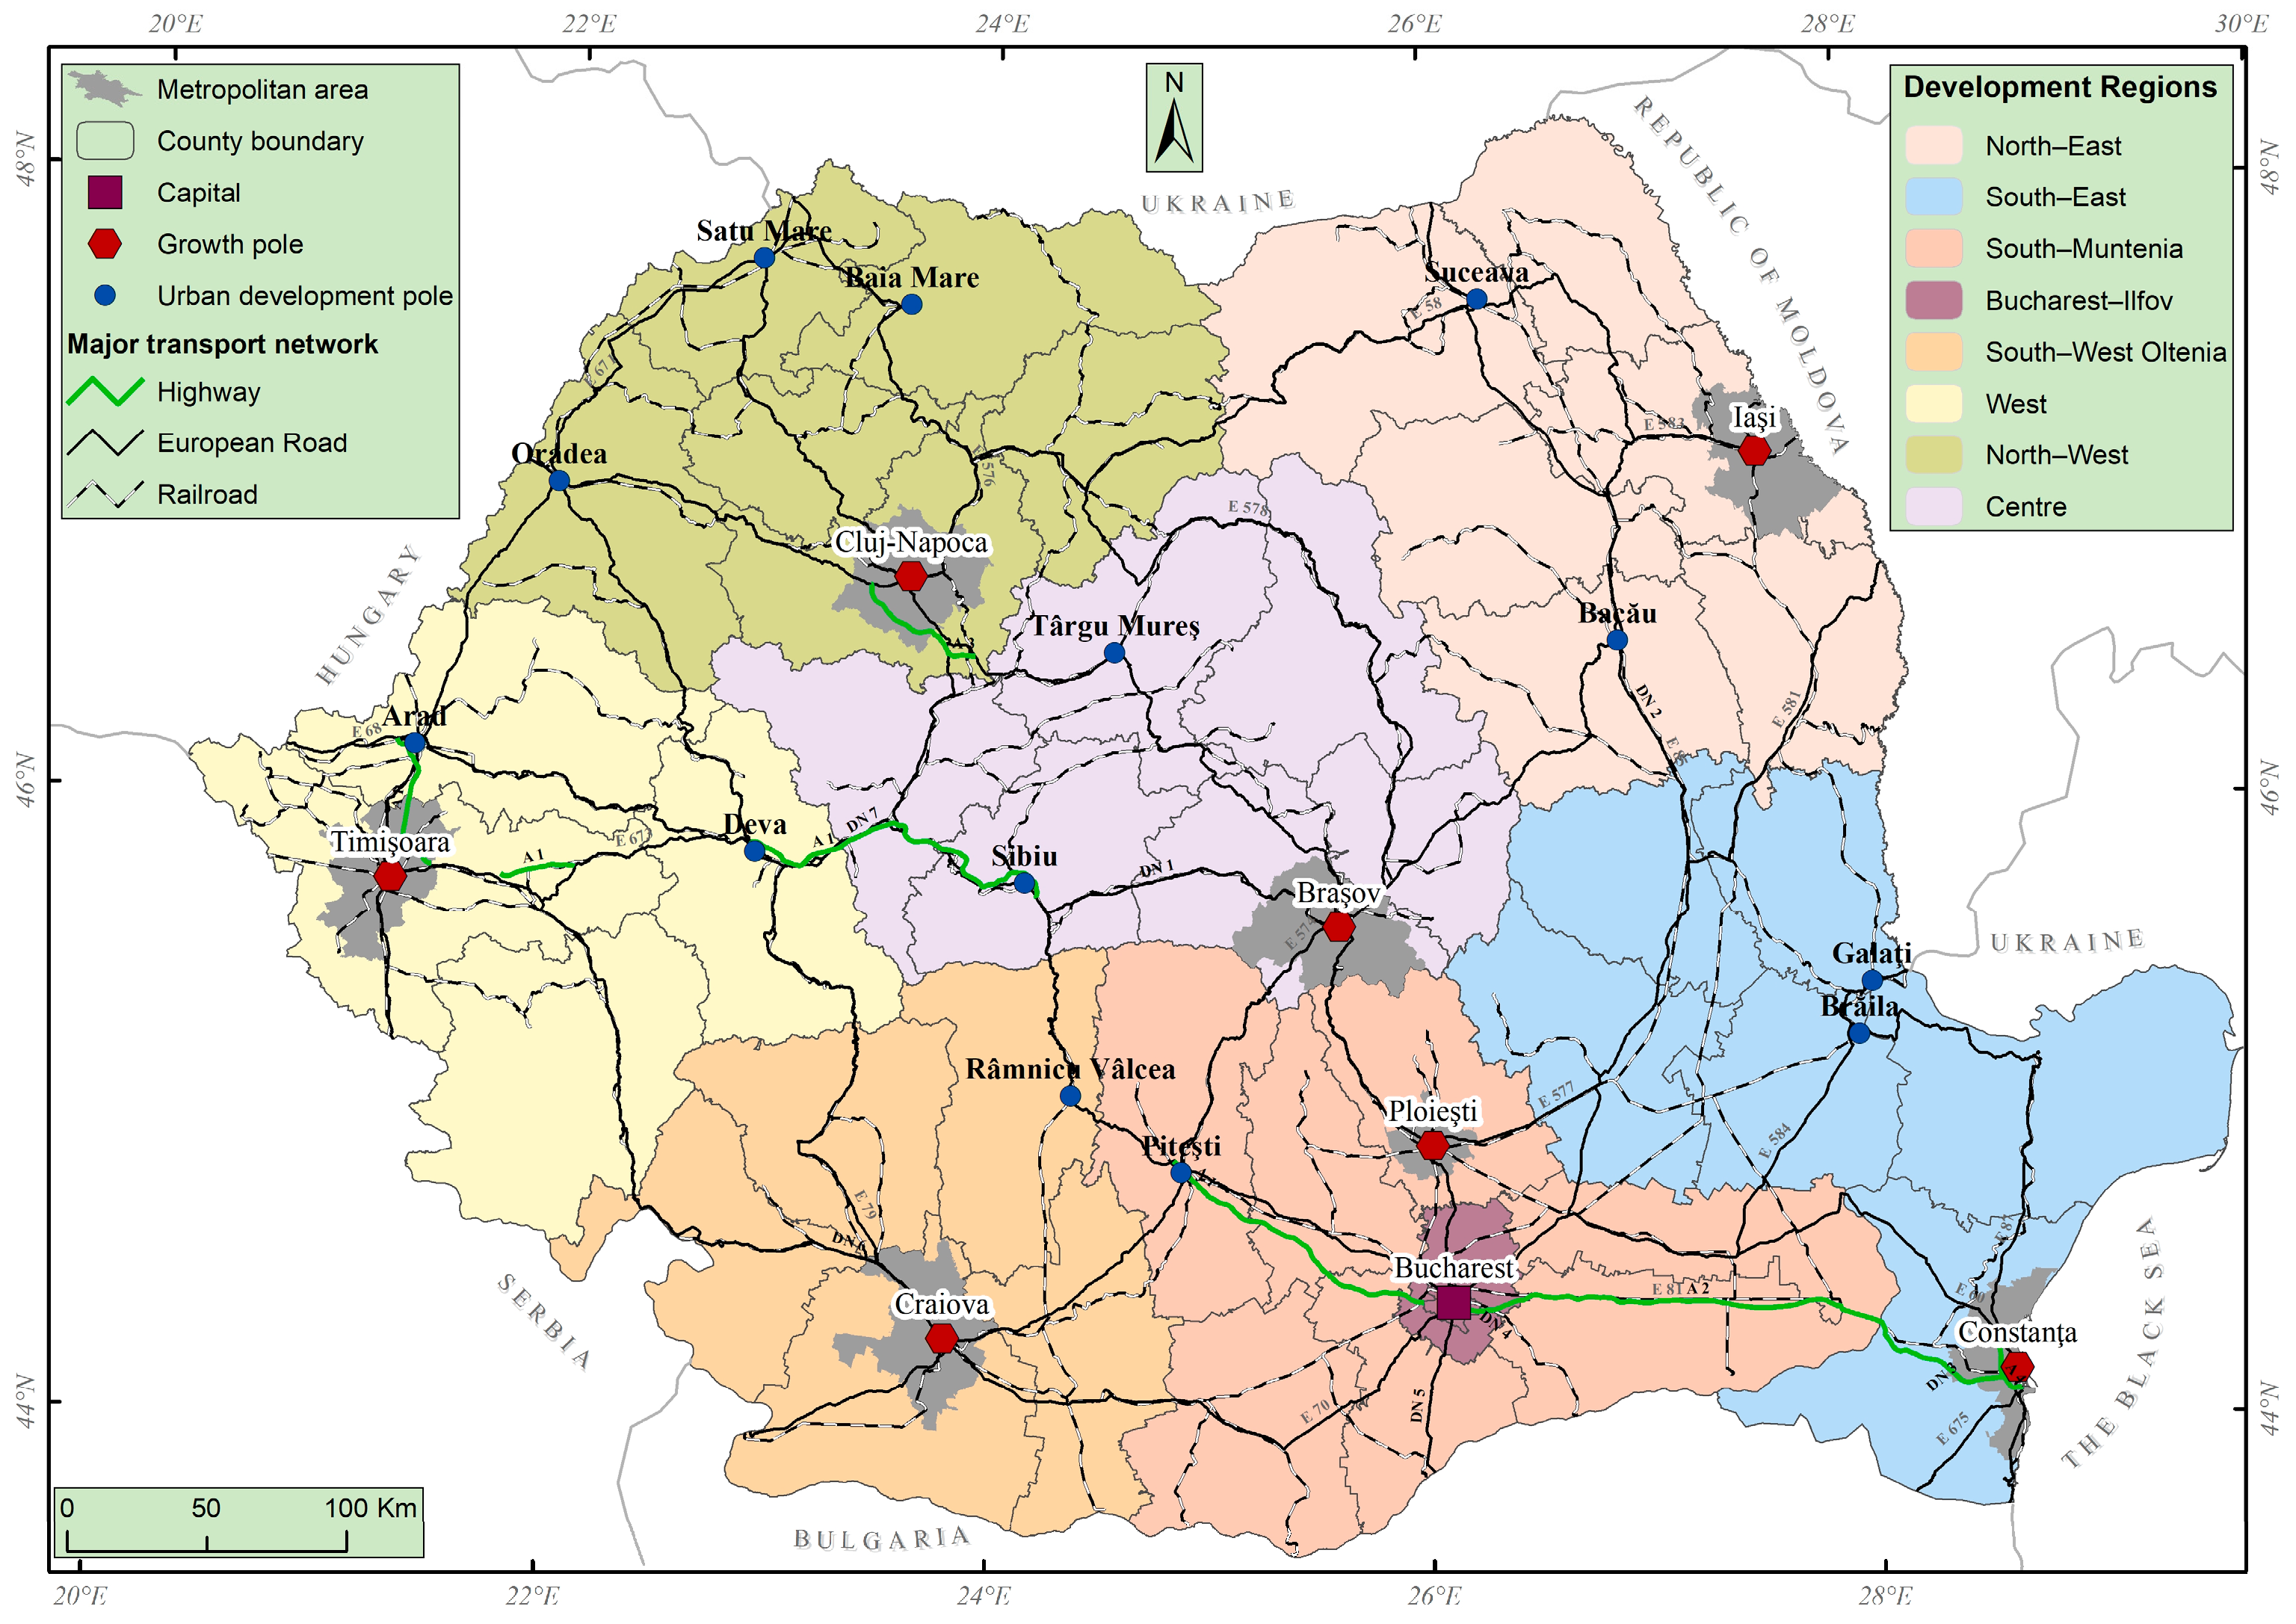
The degree of urbanization of Romania in 2022 was 56%, and according to the World Bank, while 76% of Romanians live in a city or a peri-urban area [49]. Romania’s major metropolitan areas (Figure 1) including Bucharest, Cluj-Napoca, Iași, Timișoara, as well as Constanța, Craiova, Ploiești, and Brașov—account for more than half of the country’s population and play a significant role in its socio-economic development [50,51]. They have concentrated the largest part of the intensive economic growth of the country following the EU accession from 2007, generating immense spatial inequalities and socio-economic polarization [52,53,54]. During the last two decades these urban agglomerations have experienced a strong suburbanization process of the population and services. This trend of residential and commercial expansion from urban cores toward the peripheries has exerted significant pressure on non-built land in areas with good accessibility and urban infrastructure, resulting in a new spatial population distribution characterized by declining numbers in the urban cores and rapidly increasing populations in suburban localities [55].
Analyzing the population dynamics at the level of the eight metropolitan areas [56], the highest growth rate was recorded in the metropolitan areas of Iași (15.6%) and Cluj-Napoca (10.1%), followed by the metropolitan areas of Bucharest (6.8%), Timișoara (6.1%), Brașov (2.3%). A population decrease rate in the period 2014–2022 was recorded in the metropolitan areas of Constanța (−1%), Craiova (−3%), Ploieşti (−5.2%), reflecting major differences in the economic development of these areas. In the case of Iași, the population is artificially overestimated due to citizens from the Republic of Moldova registering their residence in the city to obtain Romanian citizenship [55] (Table 1).
Table 1.
Population growth rate (annual %) in the main eight metropolitan areas of Romania.
Figure 1.
The location of the eight metropolitan areas in Romania. Source: [57], own computation.
3. Methodology
3.1. Data
The database used for the actual built space is provided by Copernicus High Resolution Layers (HRL)—Imperviousness density for the year 2015, at a resolution of 20 m [57]. For 2020, given the fact that no recent Copernicus data is available, the update was based on Google Earth satellite images. Other land use categories used for simulation are forest density and water, downloaded from Copernicus High Resolution Layers. Further, for the simulation of built areas we have used the ‘distance from roads’ parameter, calculated from the Open Street Maps database, downloaded from Geofabrik [58] (Table 2). Then, Euclidian distance was generated using ArcMap 10.6.1. The parameter ‘slope’ was derived from the digital elevation model (EU-DEM version 1.1) at a resolution of 25 m [59].
Table 2.
Data source.
The parameter “national protected areas (restricted areas)” was obtained from the official website of the Ministry of the Environment [60] for the year 2015. All data were projected in ETRS89/LAEA Europe, in accordance with the software requirements.
For the ‘population density’, the GHS-POP R2019A data set was used for the years 2015 and 2020. The estimation of resident population was overtaken form the calculations made by the Colombia University, which disaggregated the data from the level of administrative units to grid cells (SEDAC) [61]. The projection of population density was carried out based on data series obtained from the Romanian National Institute of Statistics (RNIS) [56]. The annual evolution of the resident population by domicile was extracted from the RNIS database for each Territorial Administrative Unit (TAU) in the studied area for the period 1992–2021. The data series was integrated into the IBM SPSS Statistics (version 26.0) software, where the population projection for 2025 and 2030 was calculated using an ARIMA model. The ARIMA model was evaluated using standard residual diagnostics and goodness-of-fit criteria to ensure that the generated population projections are statistically consistent with historical trends. Finally, the projection of population density for each UAT for the years 2025 and 2030 was calculated and rasterized.
To calculate the economic complexity at local level, we have used company data obtained from the National Trade Register Office for the 2008–2018 period [62]. This database contains information about the number of companies, the number of employees, and turnover for all 4-digit NACE—rev.2 codes (Nomenclature des Activités Économiques dans la Communauté Européenne—Statistical Classification of Economic Activities of the European Community) [63]. All input datasets from multiple sources and resolutions were resampled and aligned to a common spatial resolution and coordinate system to ensure consistency, while standard model diagnostics were applied to minimize potential inconsistencies.
3.2. Methods
The Cellular Automata (CA) algorithm is a method of mathematical modelling and simulating complex dynamic systems. It involves a set of simple rules applied to discrete cells in a three-dimensional grid [64]. Each cell has a particular state, which can be one of a finite set of possible states, such as “active” or “inactive.” In each step of the algorithm, the state of each cell is updated based on the states of its neighbouring cells, according to predetermined rules. These rules can be defined through a series of conditions and actions, dictating how the cell states will change based on their current state and that of their surroundings.
Over time, CA has been used to model a variety of phenomena, such as the spread of wildfires in a forest [65], the evolution of animal populations [66], the behaviour of moving fluids [67], or built environments [68]. This algorithm is particularly useful for problems that can be described through symmetry, simple rules, and local evolution.
In general, CA can be classified based on the type of region, update rules, and grid type. Some of the most well-known CA applications include Conway’s Game of Life, created by British mathematician John Horton Conway [69], and the Sandpile System, developed by American physicist Per Bak in 1996 [70].
For predicting the evolution of the built environment in our study area, we utilized the Python 3.4 script proposed by [35], which is freely available. We have used five identic parameters with those employed by [35], namely: land use, population density, distance from roads, slope, restricted areas (protected areas). The arguments for the indicator selections are the following: 1. Methodological consistency and validation: the five key parameters already validated in previous research ensure comparability and robustness; 2. Relevance to urban growth processes: each indicator captures a main driver of urban expansion: the land use defines the current spatial structure and land conversion potential; the population density reflects demand for build space; the distance from roads captures accessibility and infrastructure influence; the slope represents physical constraints on construction and the restricted areas incorporate legal constrains for urban expansion.
Because Cluj-Napoca has a polycentric and diffuse economic structure without a clearly defined central business district, CA models relying on distance from a business district cannot be meaningfully applied, which motivated the use of economic complexity as a more general and economically grounded parameter. In this context, we have replaced the parameter ‘distance from the business district’ employed in the original model with the parameter ‘economic complexity’. This replacement improves the original model in two ways: 1. It makes it more applicable in various spatial and economic context, especially in those places and cities where central business districts are not clearly defined; 2. It brings it much closer to the economic realities, economic complexity reflecting much closer economic dynamics resulting in the diversification of economic activities that the previous parameter, which was static and mechanic [71].
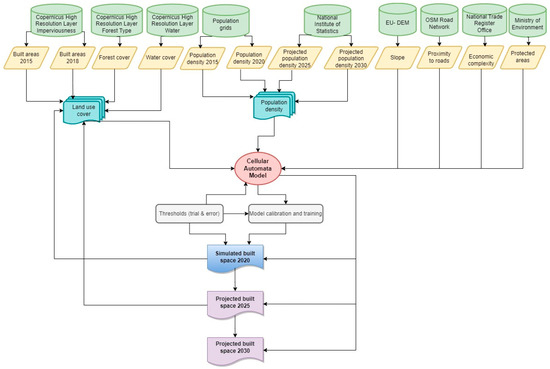
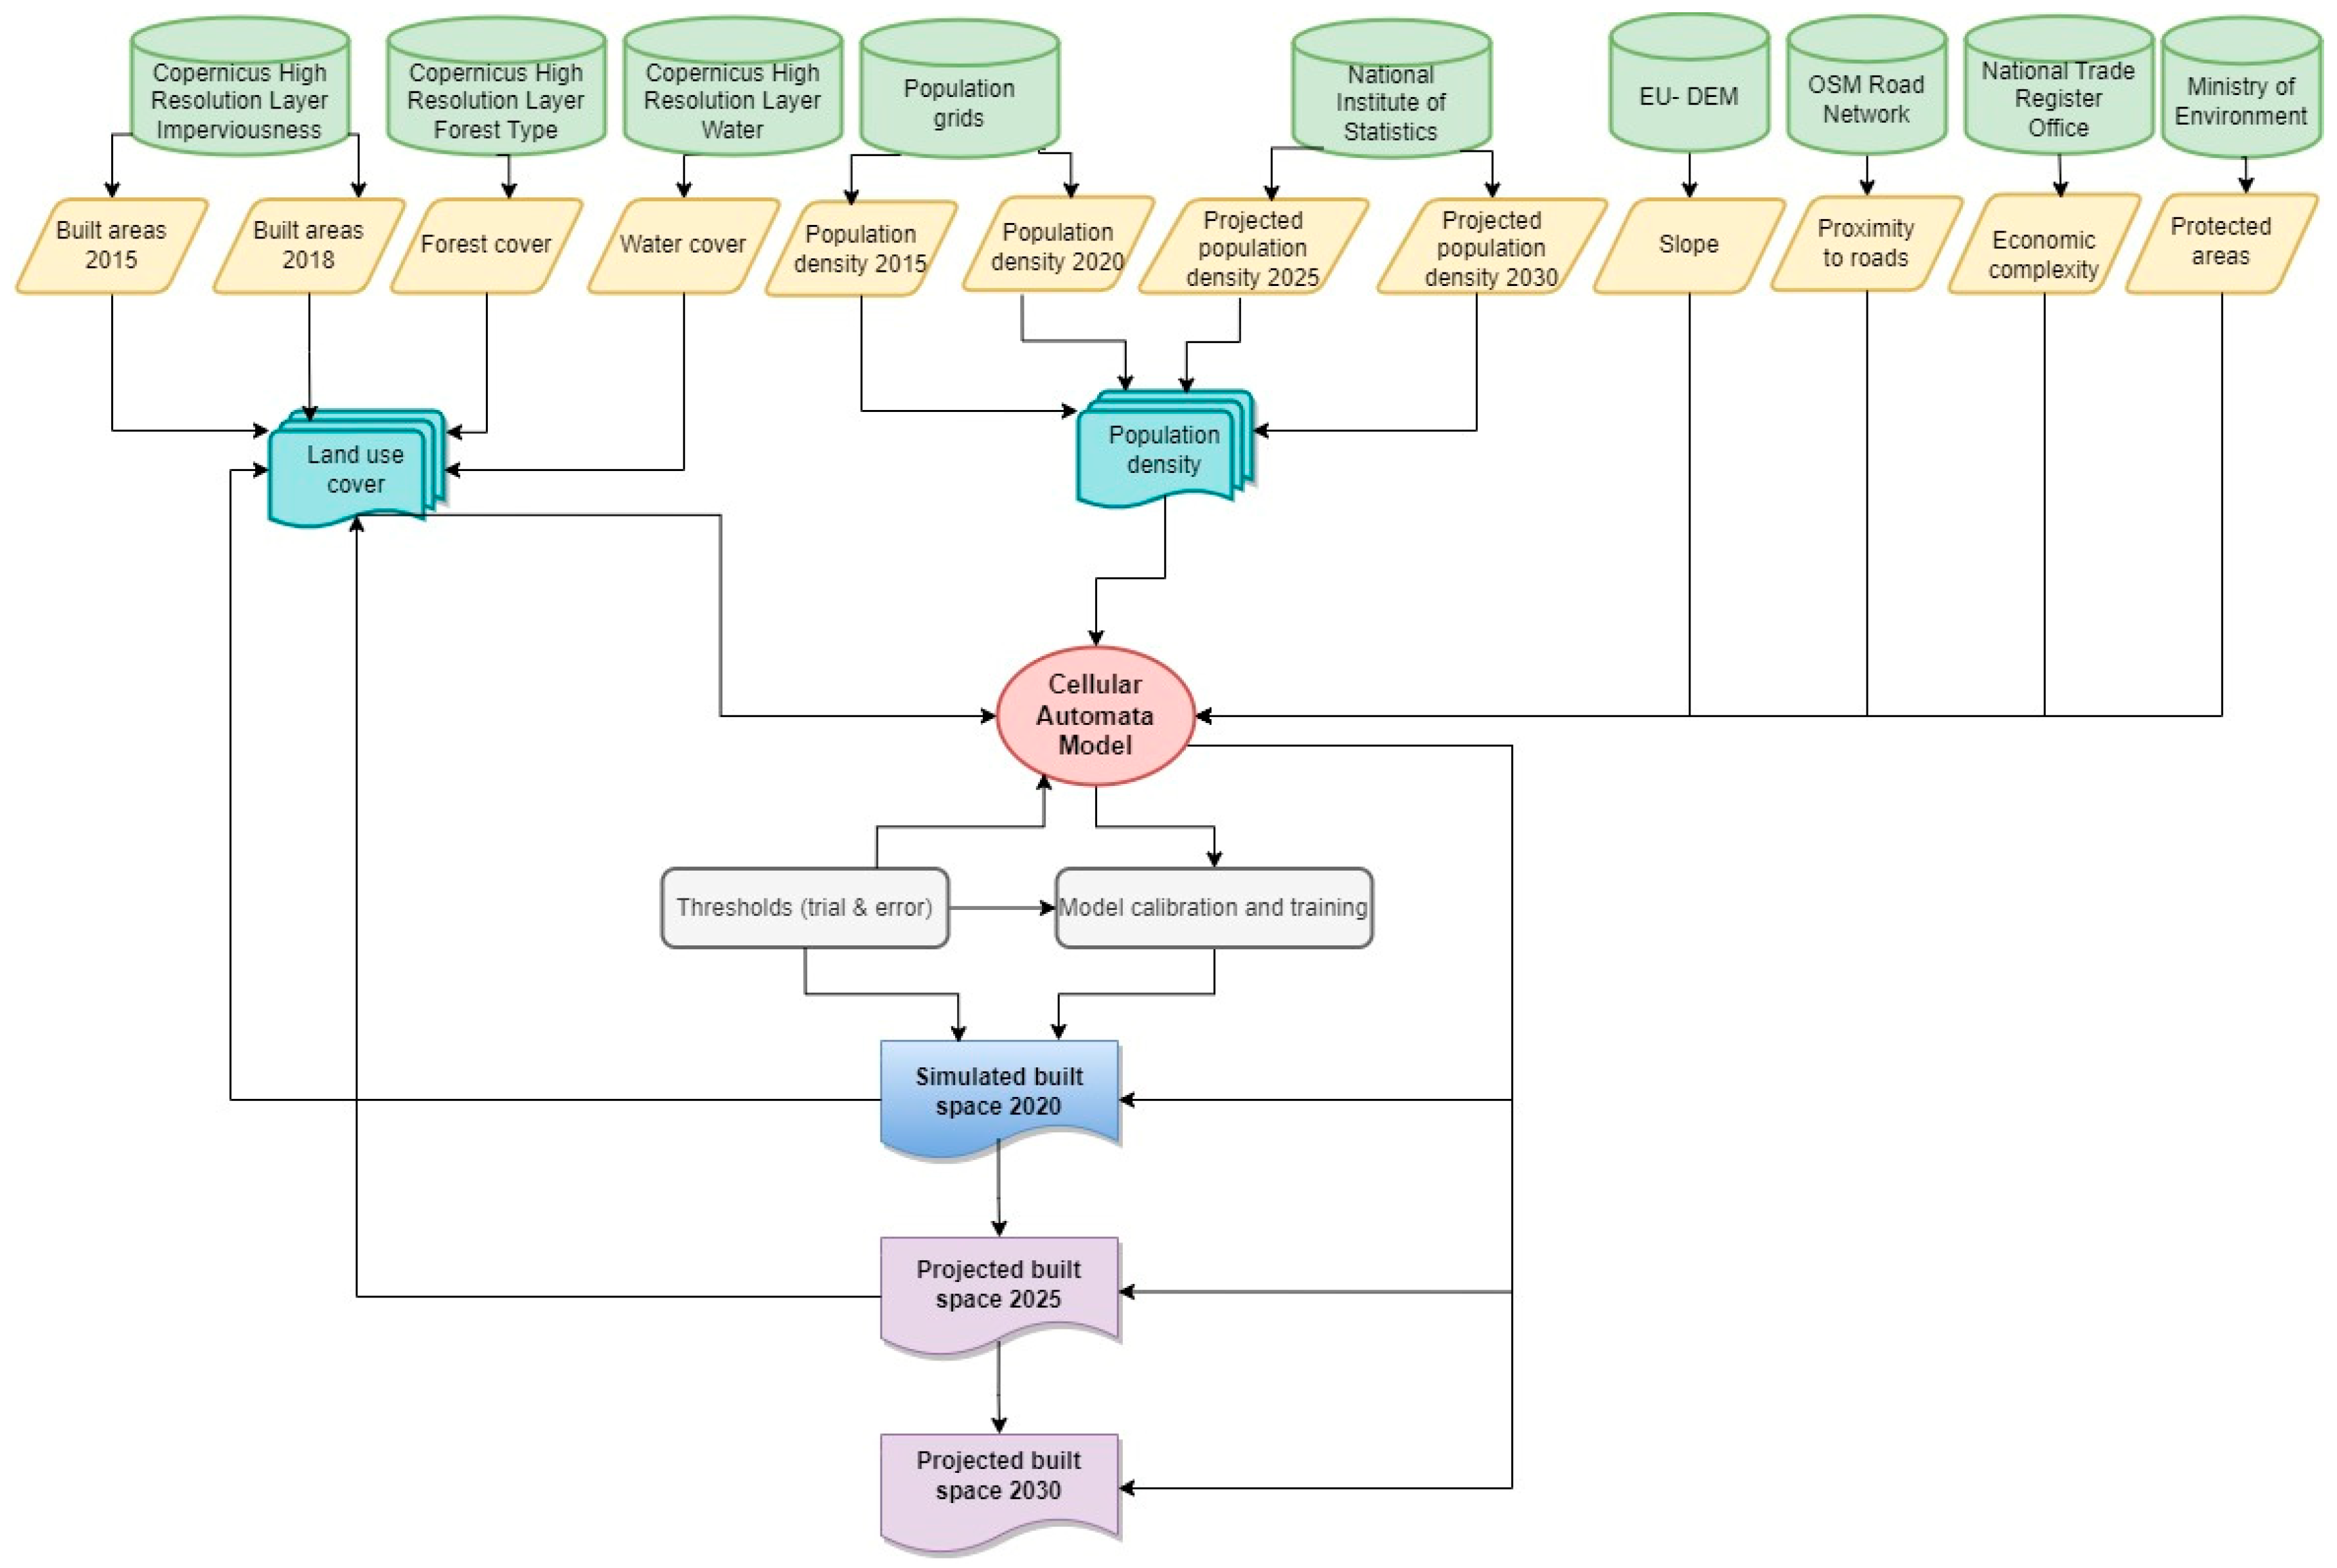
The model calibration process began with the use of land use data from 2015 to generate simulations for 2020 (Figure 2). Subsequently, land use data for 2020 was used to simulate conditions in 2025, and this sequential series continued until simulating land use data for 2030, using the 2025 dataset. Thresholds were also established for each set of input data. We followed the same threshold selection principle as [35], which is by trial and error. Ref. [27] also tried different thresholds of the population change to determine the optimal value for urban growth simulation.
Figure 2.
Flow chart of the model.
To determine the optimal thresholds for the Cellular Automata (CA) urban growth model, we employed the Optuna optimization framework [72]. The thresholds for the continuous growth factor (population density, distance to roads, economic complexity index, and slope) were sampled within their empirical minimum–maximum ranges derived from the corresponding raster datasets. Each optimization trial involved assigning a candidate set of thresholds, running the CA simulation for the 2015–2020 period, and evaluating model performance by comparing predicted and observed built-up areas. Spatial accuracy was computed as the proportion of correctly predicted built-up pixels relative to the 2020 reference map. A total of 100 trials were conducted using Optuna’s Tree-structured Parzen Estimator (TPE) sampler. The threshold combination that achieved the highest spatial accuracy was selected and used for the predictions of built-up areas for each city.
To calculate the economic complexity index, we applied a three-step method [36,71,73] and we used the final index to determine the economic complexity of the eight metropolitan areas (MA) (in total 174 communes and cities).
First, we calculated the revealed comparative advantage (RCA) to determine the specialization pattern of each MA. For this, we have used the mathematical measure known as the Location Quotient or Balassa index [74]. Location Quotients analyze the concentration of industrial employment in a specific region (Equation (1)):
where ps,a is the number of people working in county s in economic activity a; represents the total number of people employed in county s; is the total number of people employed in economic activity a throughout the country; represents the total number of people employed countrywide [36]. Afterwards, this is transformed into a contiguity matrix (ms,a) where ms,a = 1 if LQ is above a certain threshold (in our case the threshold of LQ = 1). This means that a MA has a revealed comparative advantage or is specialized in a certain economic activity if the calculated index is equal to- or greater than 1 (Equation (2)).
In the second step, the defined msa matrix (Equation (2)) calculates the MA’s economic diversity and the ubiquity of the respective products. The economic diversity of a MA is determined by the number of products with high RCA [75]. The ubiquity of economic activity shows the number of MA’s they are specialized in a product, i.e., they have the advantage to export the respective product (Equations (3) and (4)).
The MR consists of a sequential combination of the measures of diversity and ubiquity over a (n) number of iterations. Ref. [36] suggest that n = 12 iteration is large enough to achieve a convergence process. In our analysis we have used more than 12 iterations until the point where no further information could be extracted—i.e., when the variable has not changed for three consecutive iterations [73] (Equations (5) and (6)).
Thus, the complexity of a MA’s economy is given by the variety of exported products with a comparative advantage (high diversity) while for a product to be considered complex, it is essential for it not to be exported on a large scale by many counties (low ubiquity) [76].
Since the ECI is a relative metric, in the last step we applied a normalization process using the Z-score transformation as follows (Equation (7)):
where and std (K) are the mean and standard deviation of vector Kc.
Similarly, the Product Complexity Index is defined as ECI from the previous definition, i.e., by simply changing the MA’s index with that of the products [77] (Equation (8)).
Thus, the more diverse the scale of exported products and the less ubiquitous the goods, the more complex the economic structure of a MA. Therefore, the measurement of ECI using diversity and ubiquity can deeply explain the economic diversity and economic growth potential of MA’s. Higher ECI values are interpreted as complex and diversified economies, while lower ECI values are signs of lower economic complexity and diversification.
4. Results
The analysis started from the existing built space for 2015 and 2020 and based on this, the predictions for 2025 and 2030 were realized (Table 3). Looking at the built space for all years, there is no surprise that the capital Bucharest has the highest values of built areas of all MAs, given the fact that it is the largest urban agglomeration in terms of population and economic development. On the second place is Constanţa, which maintained its position through all the analyzed intervals. We explain this fact by the coastal tourism, the port-related industrial development and the flat relief that encourages the built space extension. In the third position we find Craiova, which benefits not only from low altitudes and large land reserves for urban expansion but also from the fact that suburbanization processes were less intensive until 2020, which left more open space for new urban expansion. These are the only MAs that maintained their positions for all four years. For the rest of the areas, differences can be noticed between existing and predicted built areas. Even if for 2015 and 2020, Timişoara had the fifth largest built area, the growth in 2025 and 2030 will be lower than in other MAs.
Table 3.
Built space growth rate (%).
Further, the differences can be explained by looking at the built areas growth rate (Table 3, Figure 3). For 2015–2020, Cluj MA had an increase of 14%, the largest of all areas, being followed by Braşov (13.6%). Timişoara and Bucharest MAs registered increases of approx. 12%, whereas in Constanţa, Iaşi and Ploieşti, the growth rate is around 11%. Craiova had the lowest value of approx. 9%, but the situation changes for the next interval (2020–2025), when its growth rate will position it on the first place (approx. 22%). Cluj and Iaşi will grow in 2025 with approx. 18% as opposed to 2020, Braşov will record a 16% growth and Constanţa approx. 13%. Bucharest and Ploieşti MAs’ growth rate will be under 10%, while in Timişoara, the built space will grow with only 3%, due to the reduced speed of economic development.
Figure 3.
Built space growth rate for 20152020, 2020–2025 and 2025–2030 (%). Source: [56], own computation.
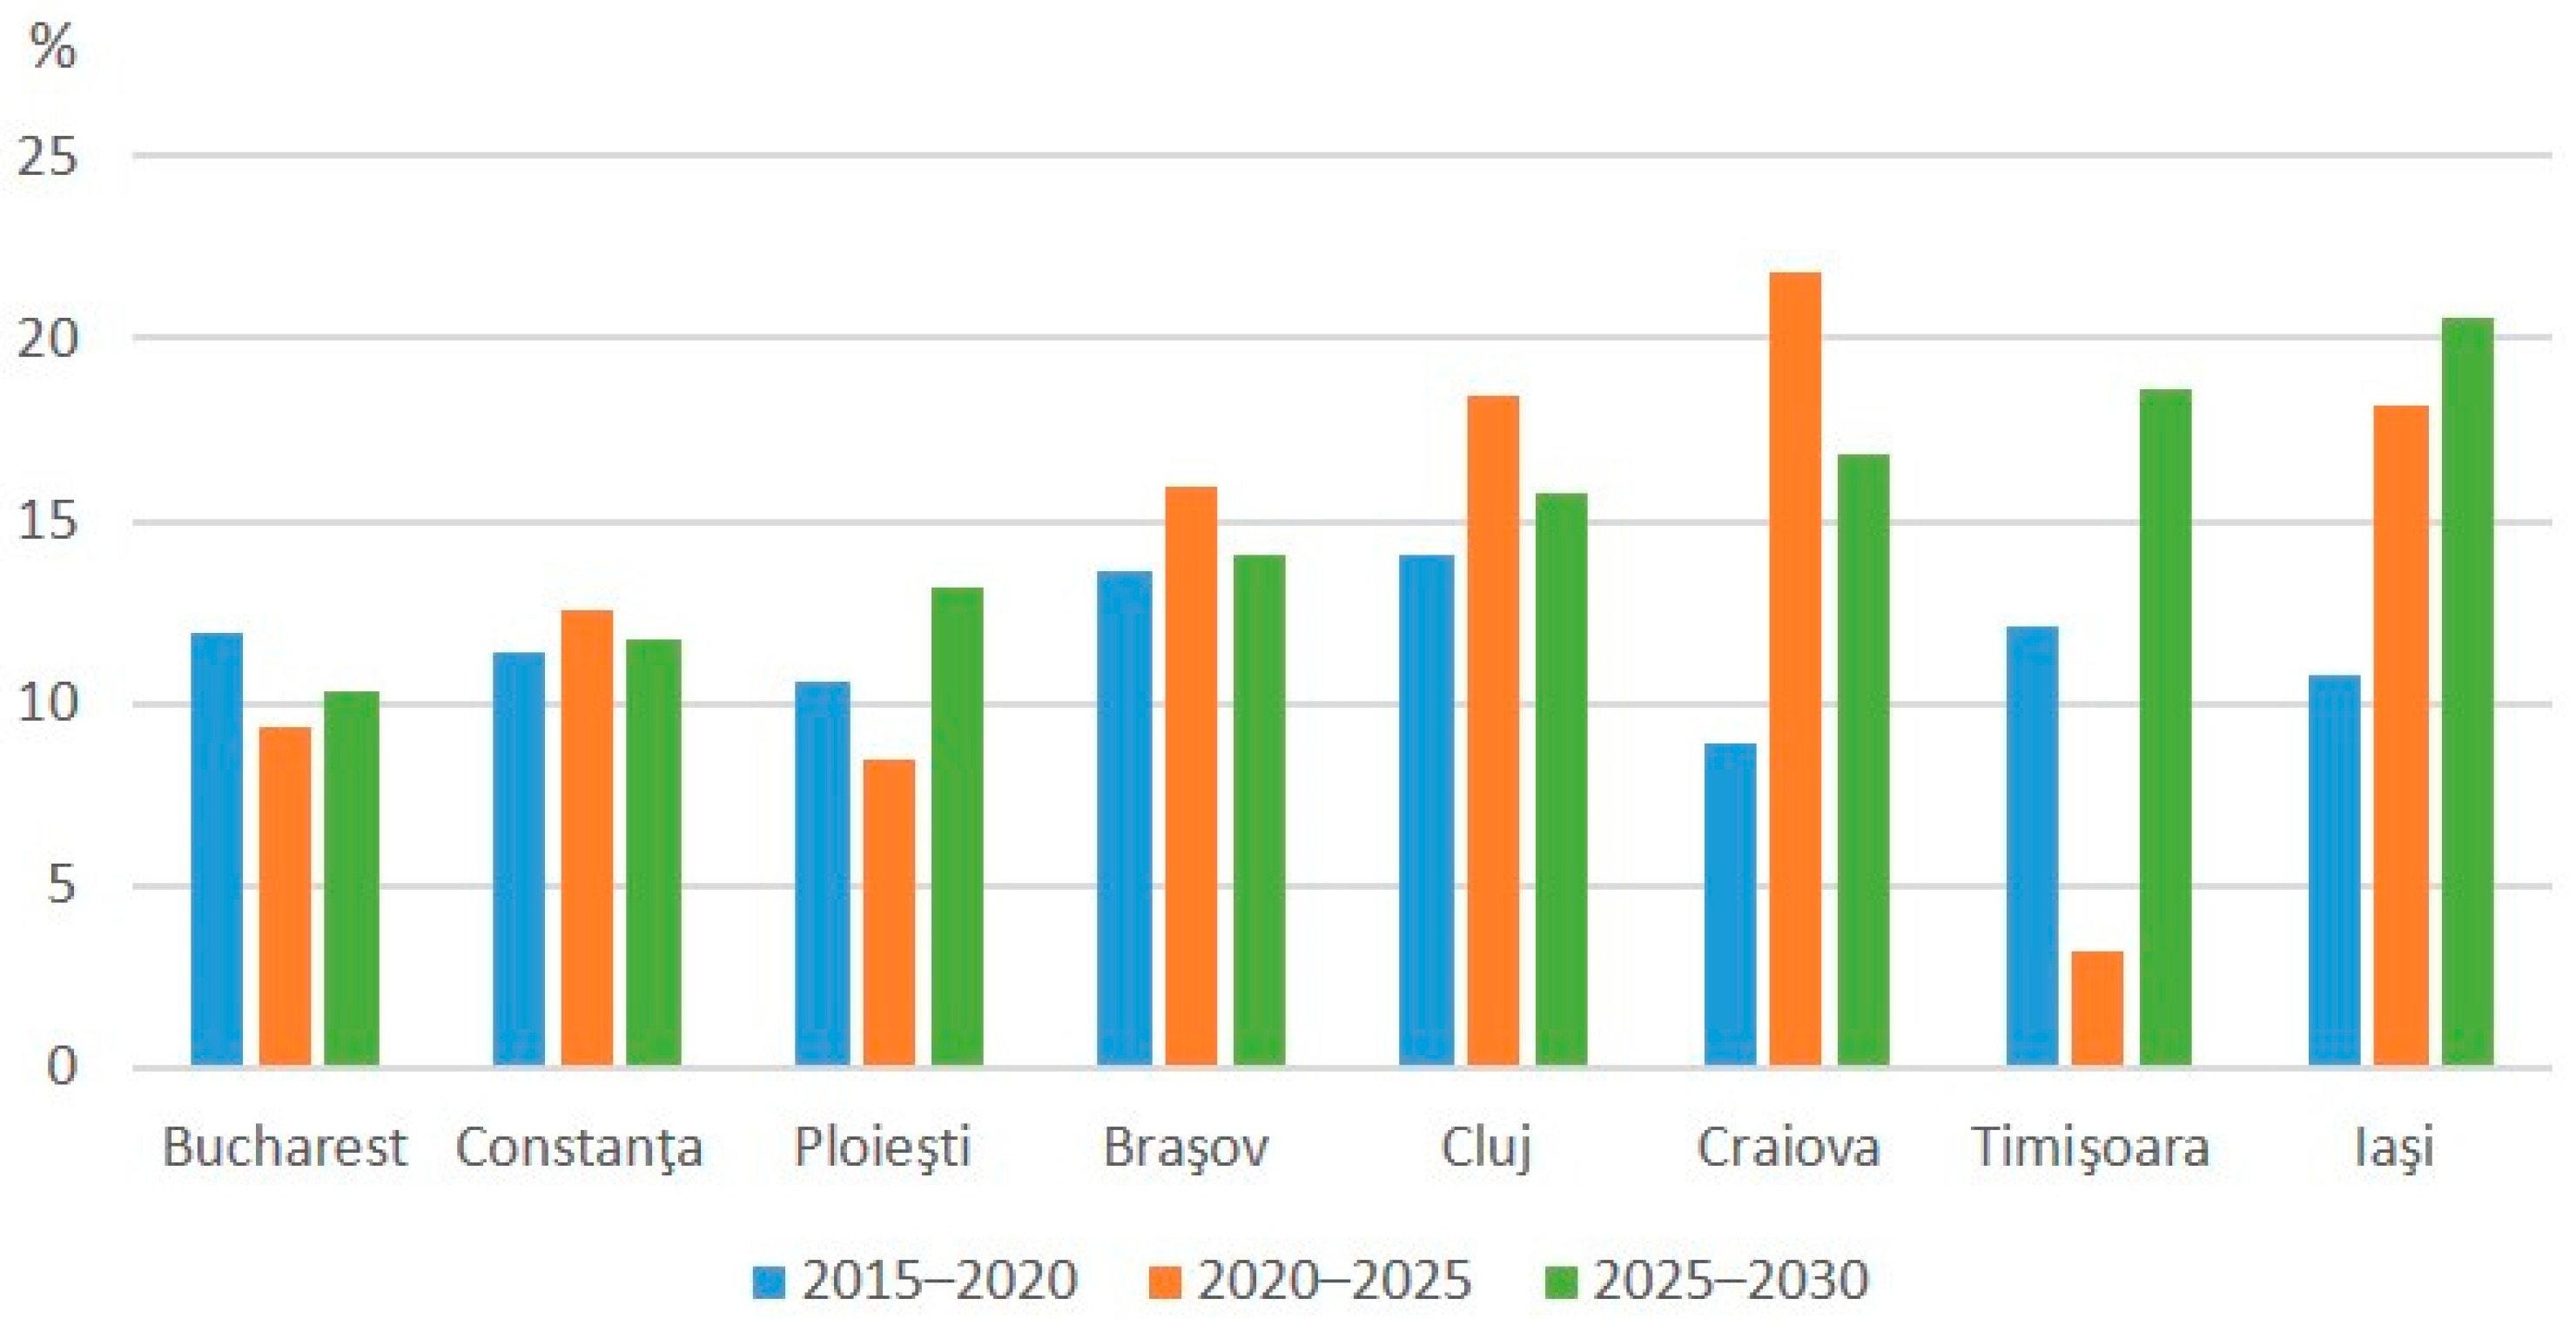
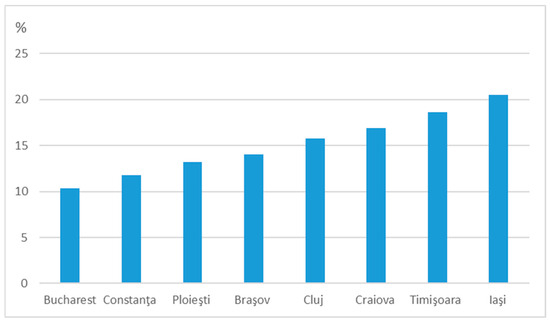
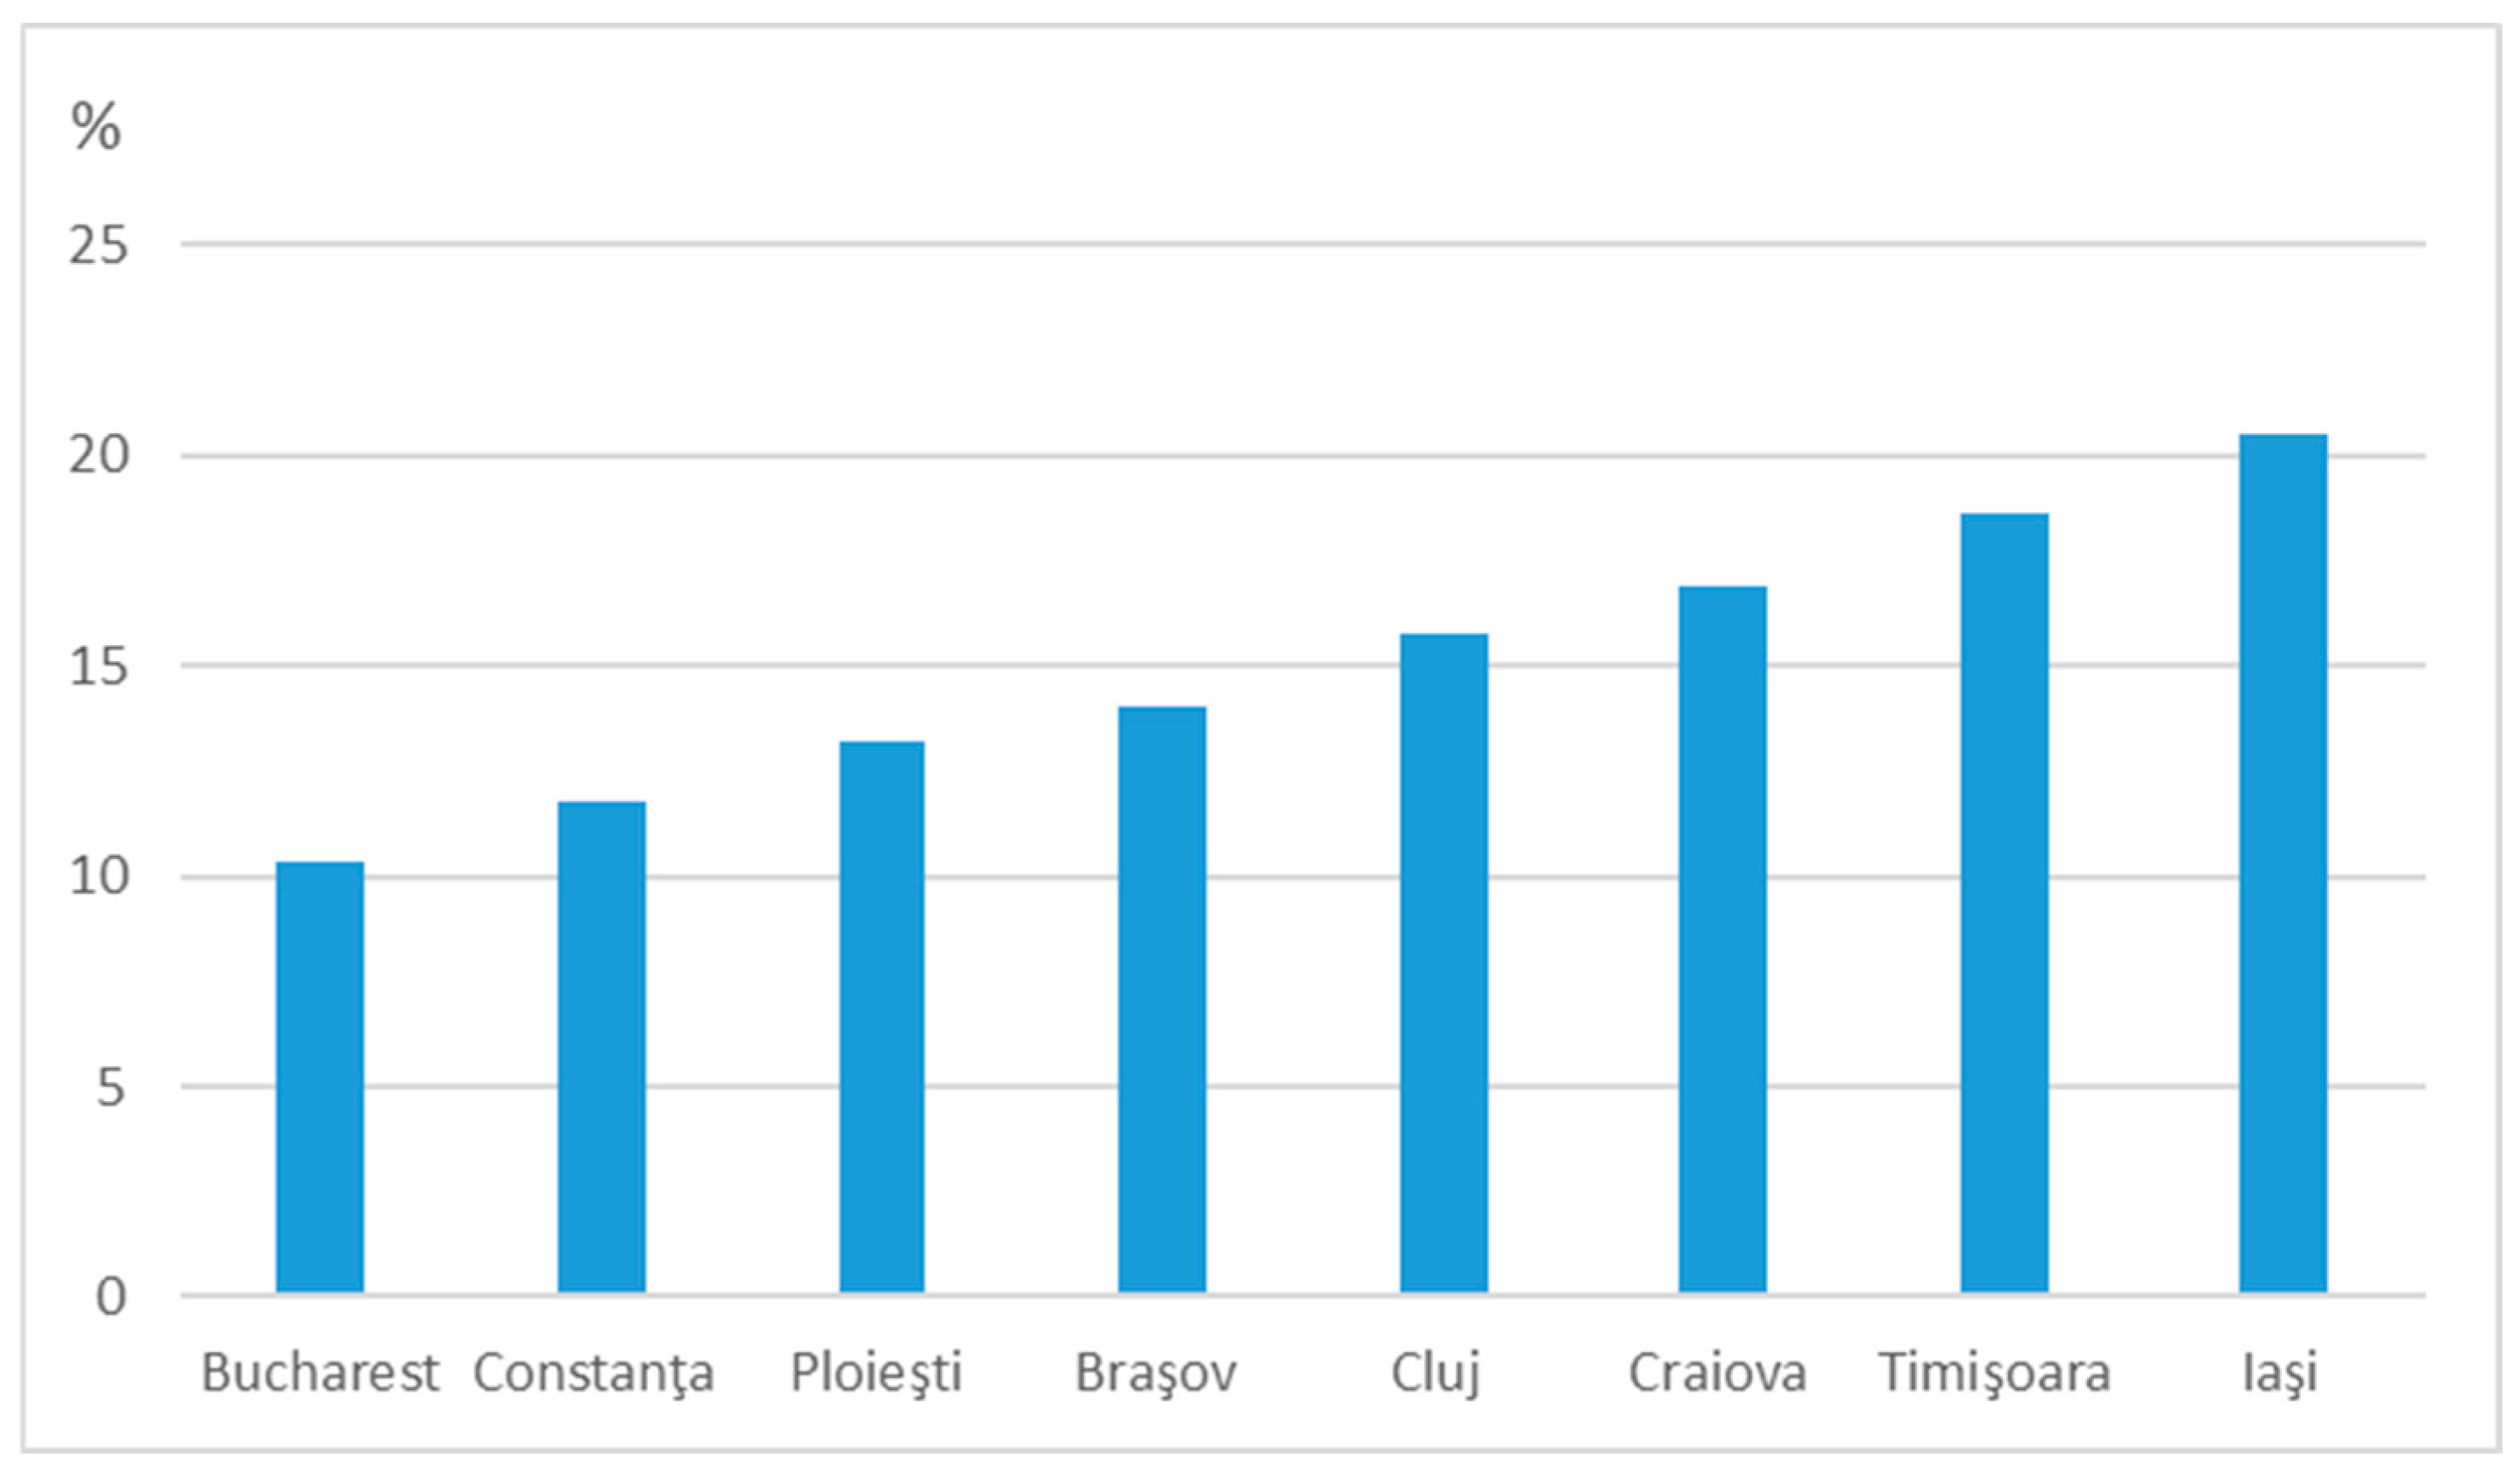
The situation seems to change in the 2025–2030 interval (Figure 4), when Iaşi will have the highest growth rate (over 20%). Timişoara will reach approx. 19% more built space in 2030 than in 2025, whereas Craiova and Cluj growth will be around 16%. Braşov and Ploieşti will have similar growth rate, but they are under 15%. Finally, Constanţa MA built space will grow with approx. 12%, and Bucharest with only 10%.
Figure 4.
The evolution of predicted built space between 2025 and 2030 (%).
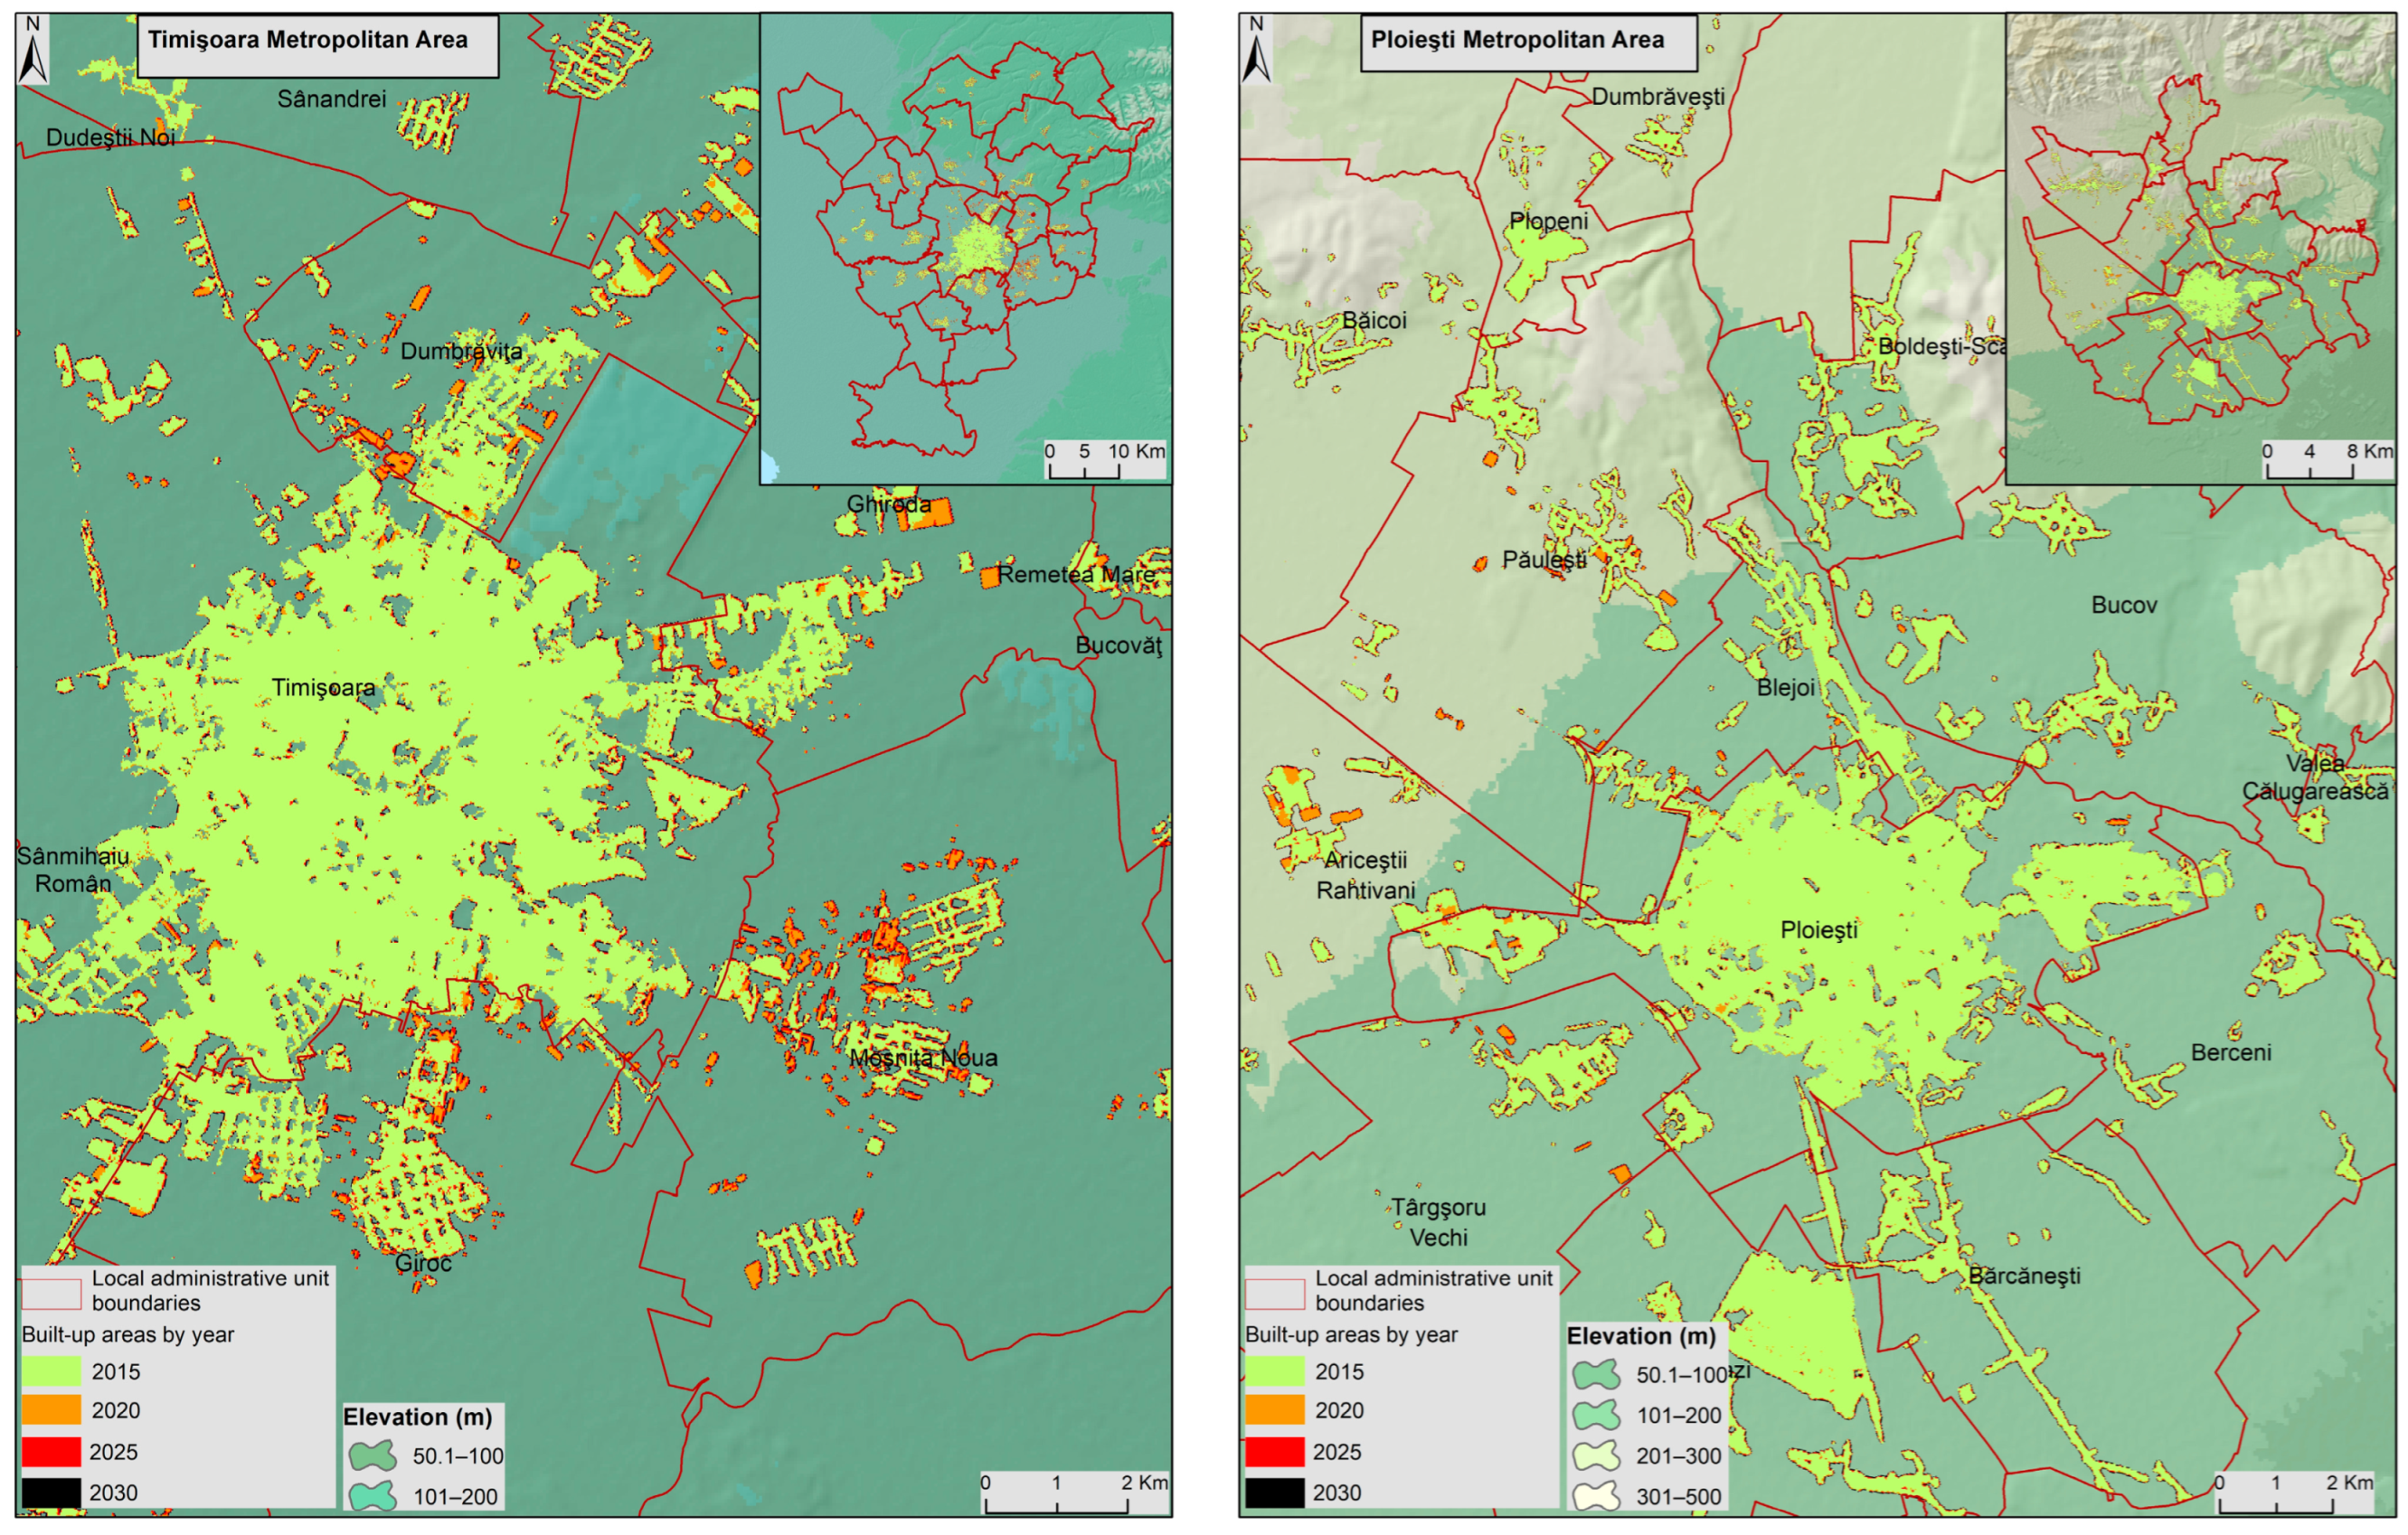
The built space has been spatially represented for each metropolitan area for 2015, 2020, 2025 and 2030 (Appendix A). As a general observation, we can remark that the predicted built areas are surrounding the existing ones which will expand in the future. The actual urban fabric will not suffer significant changes, as it is already compact. Only at the peripheries of the major urban centres there are free space reserves which can be densified by future constructions. Thus, the lack of free spaces in the city core areas and the expensive costs drive the built expansion towards the suburban localities located near the urban centres. This is the case not only for the residential buildings, but also for industrial sites.
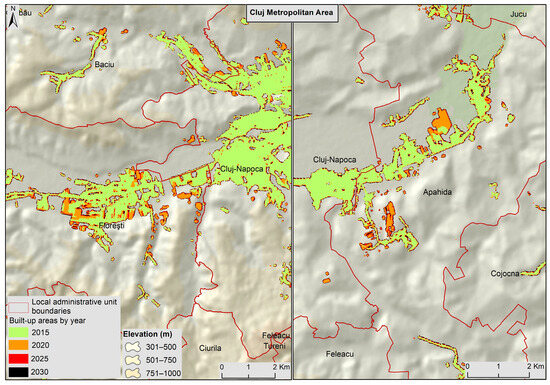
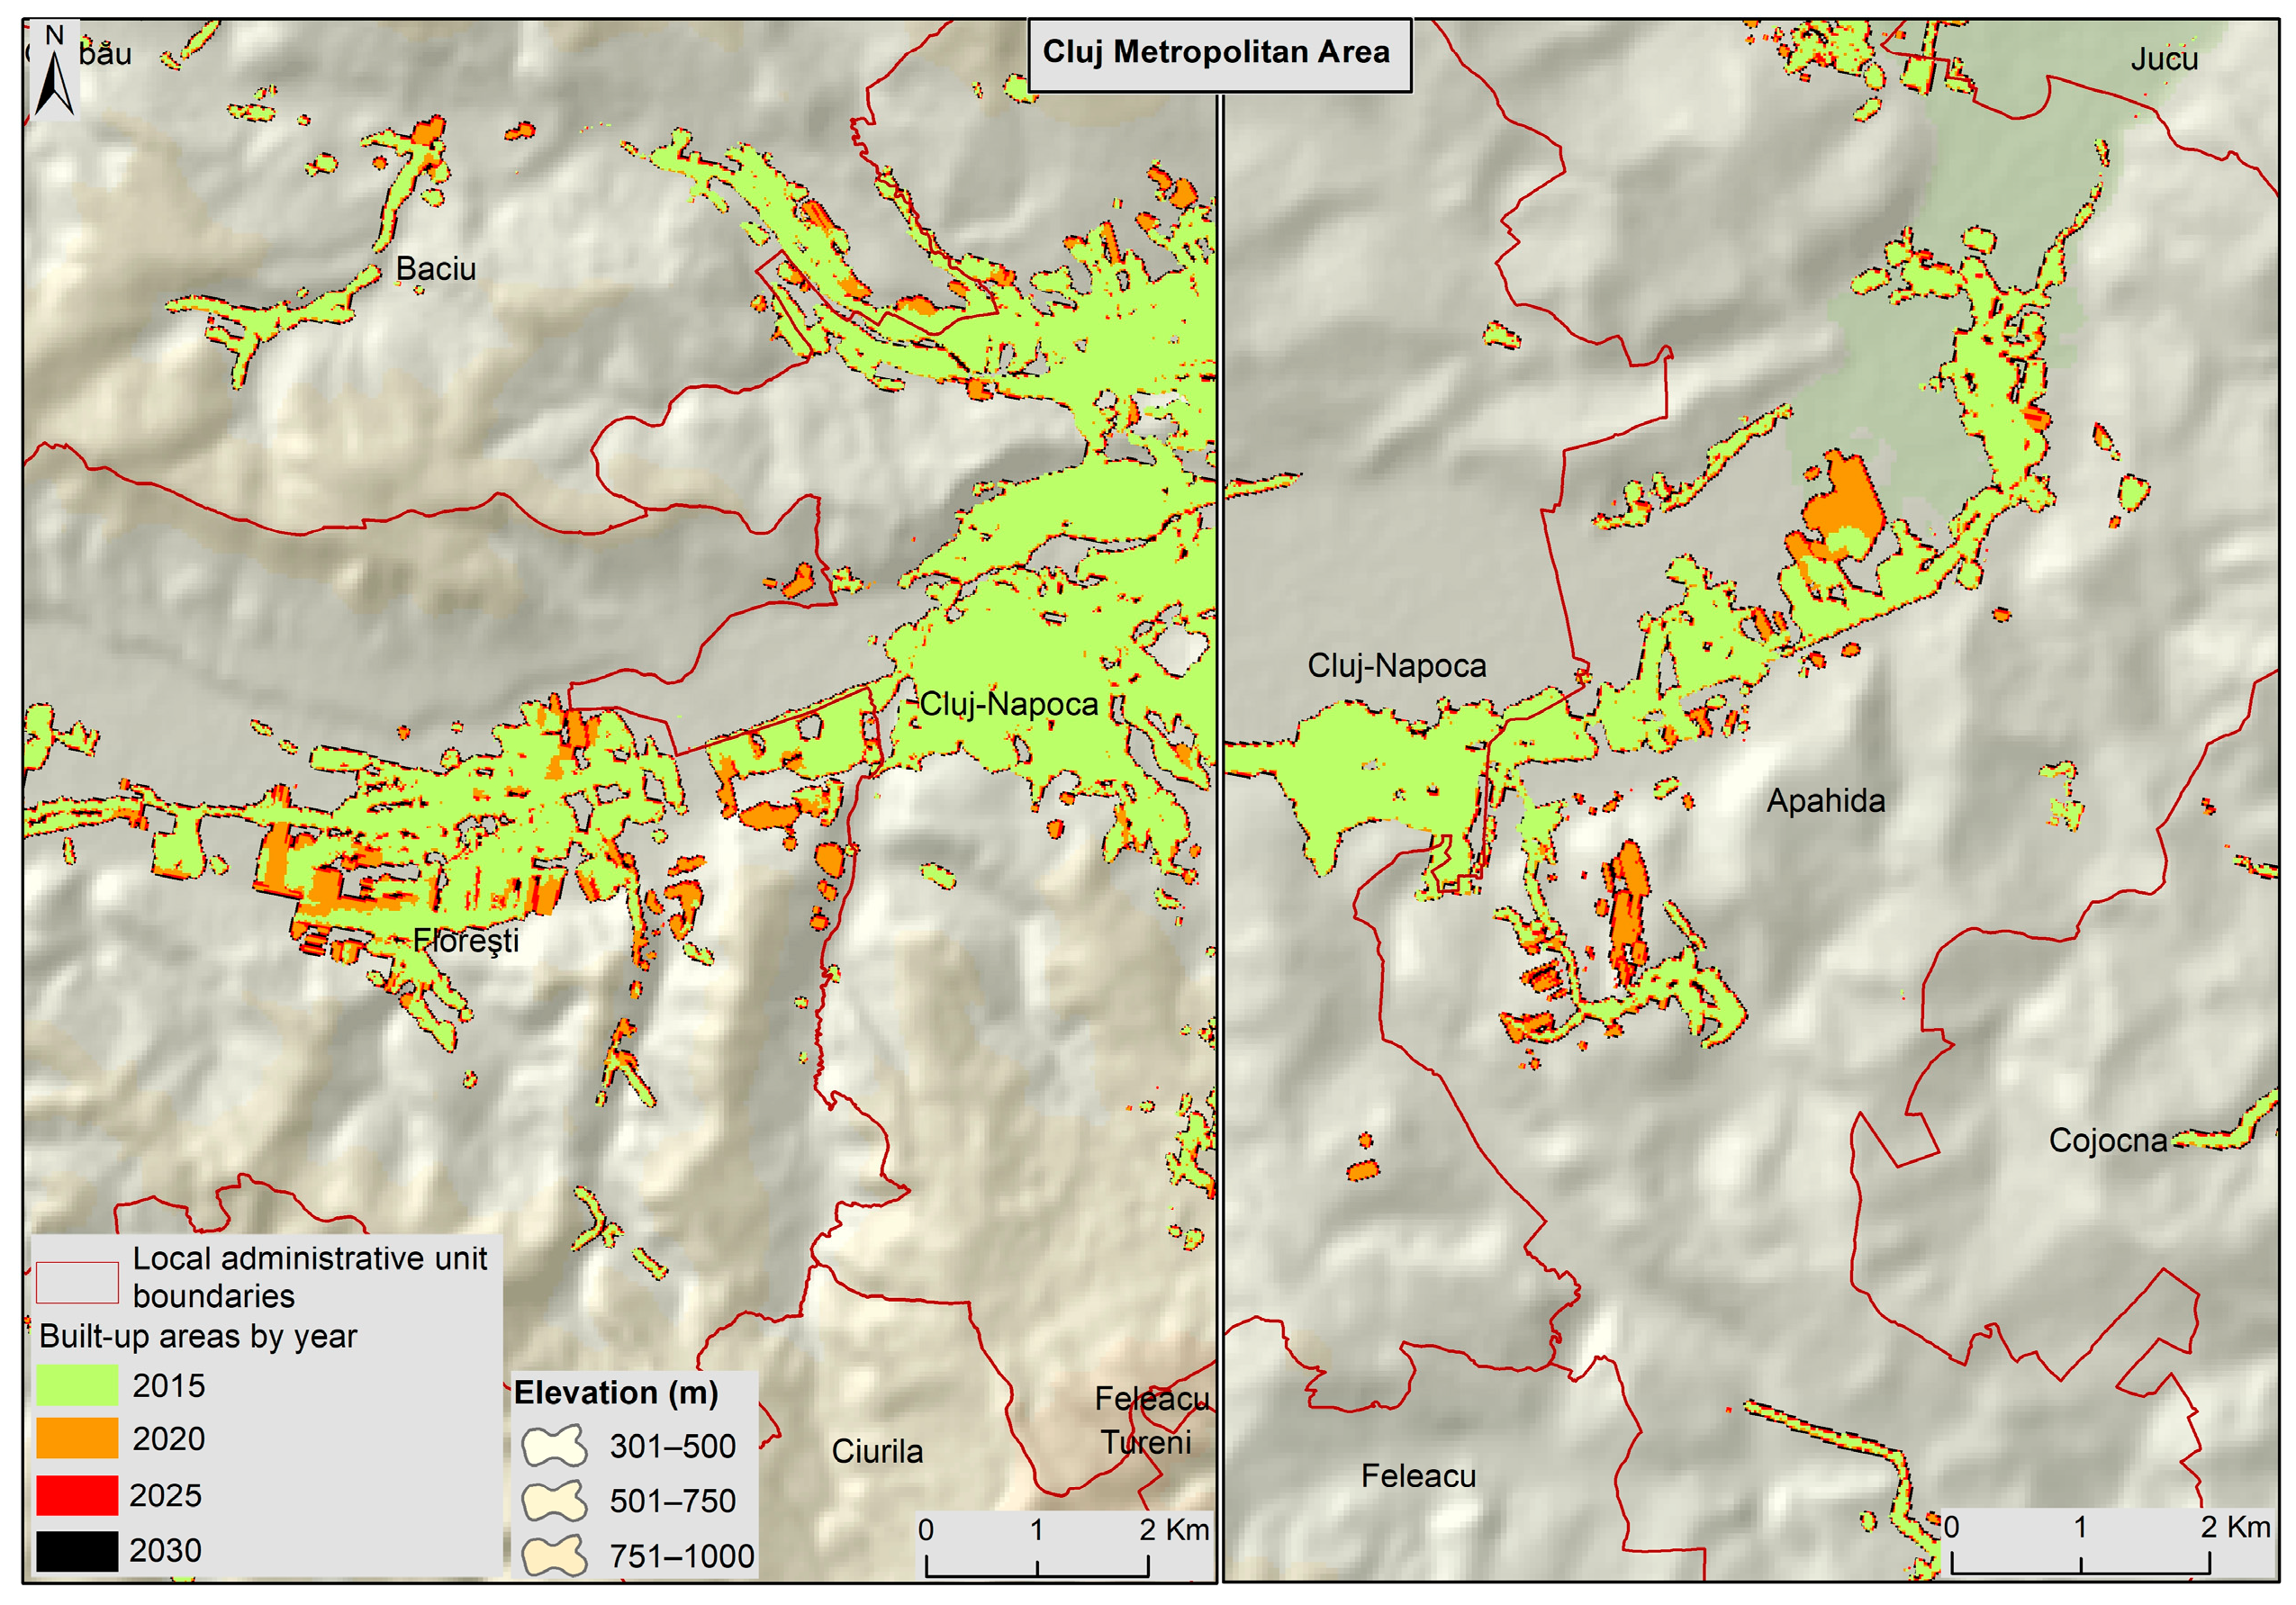
For example, in Cluj MA, Floreşti and Apahida suburban communes registered the highest growth in 2015–2020 and the existing built areas are likely to expand in the next years following the same pattern. Also, in the south-east of Cluj-Napoca MA, due to existing free land, new residential neighbourhoods are projected (Figure 5).
Figure 5.
Built space in Cluj MA.
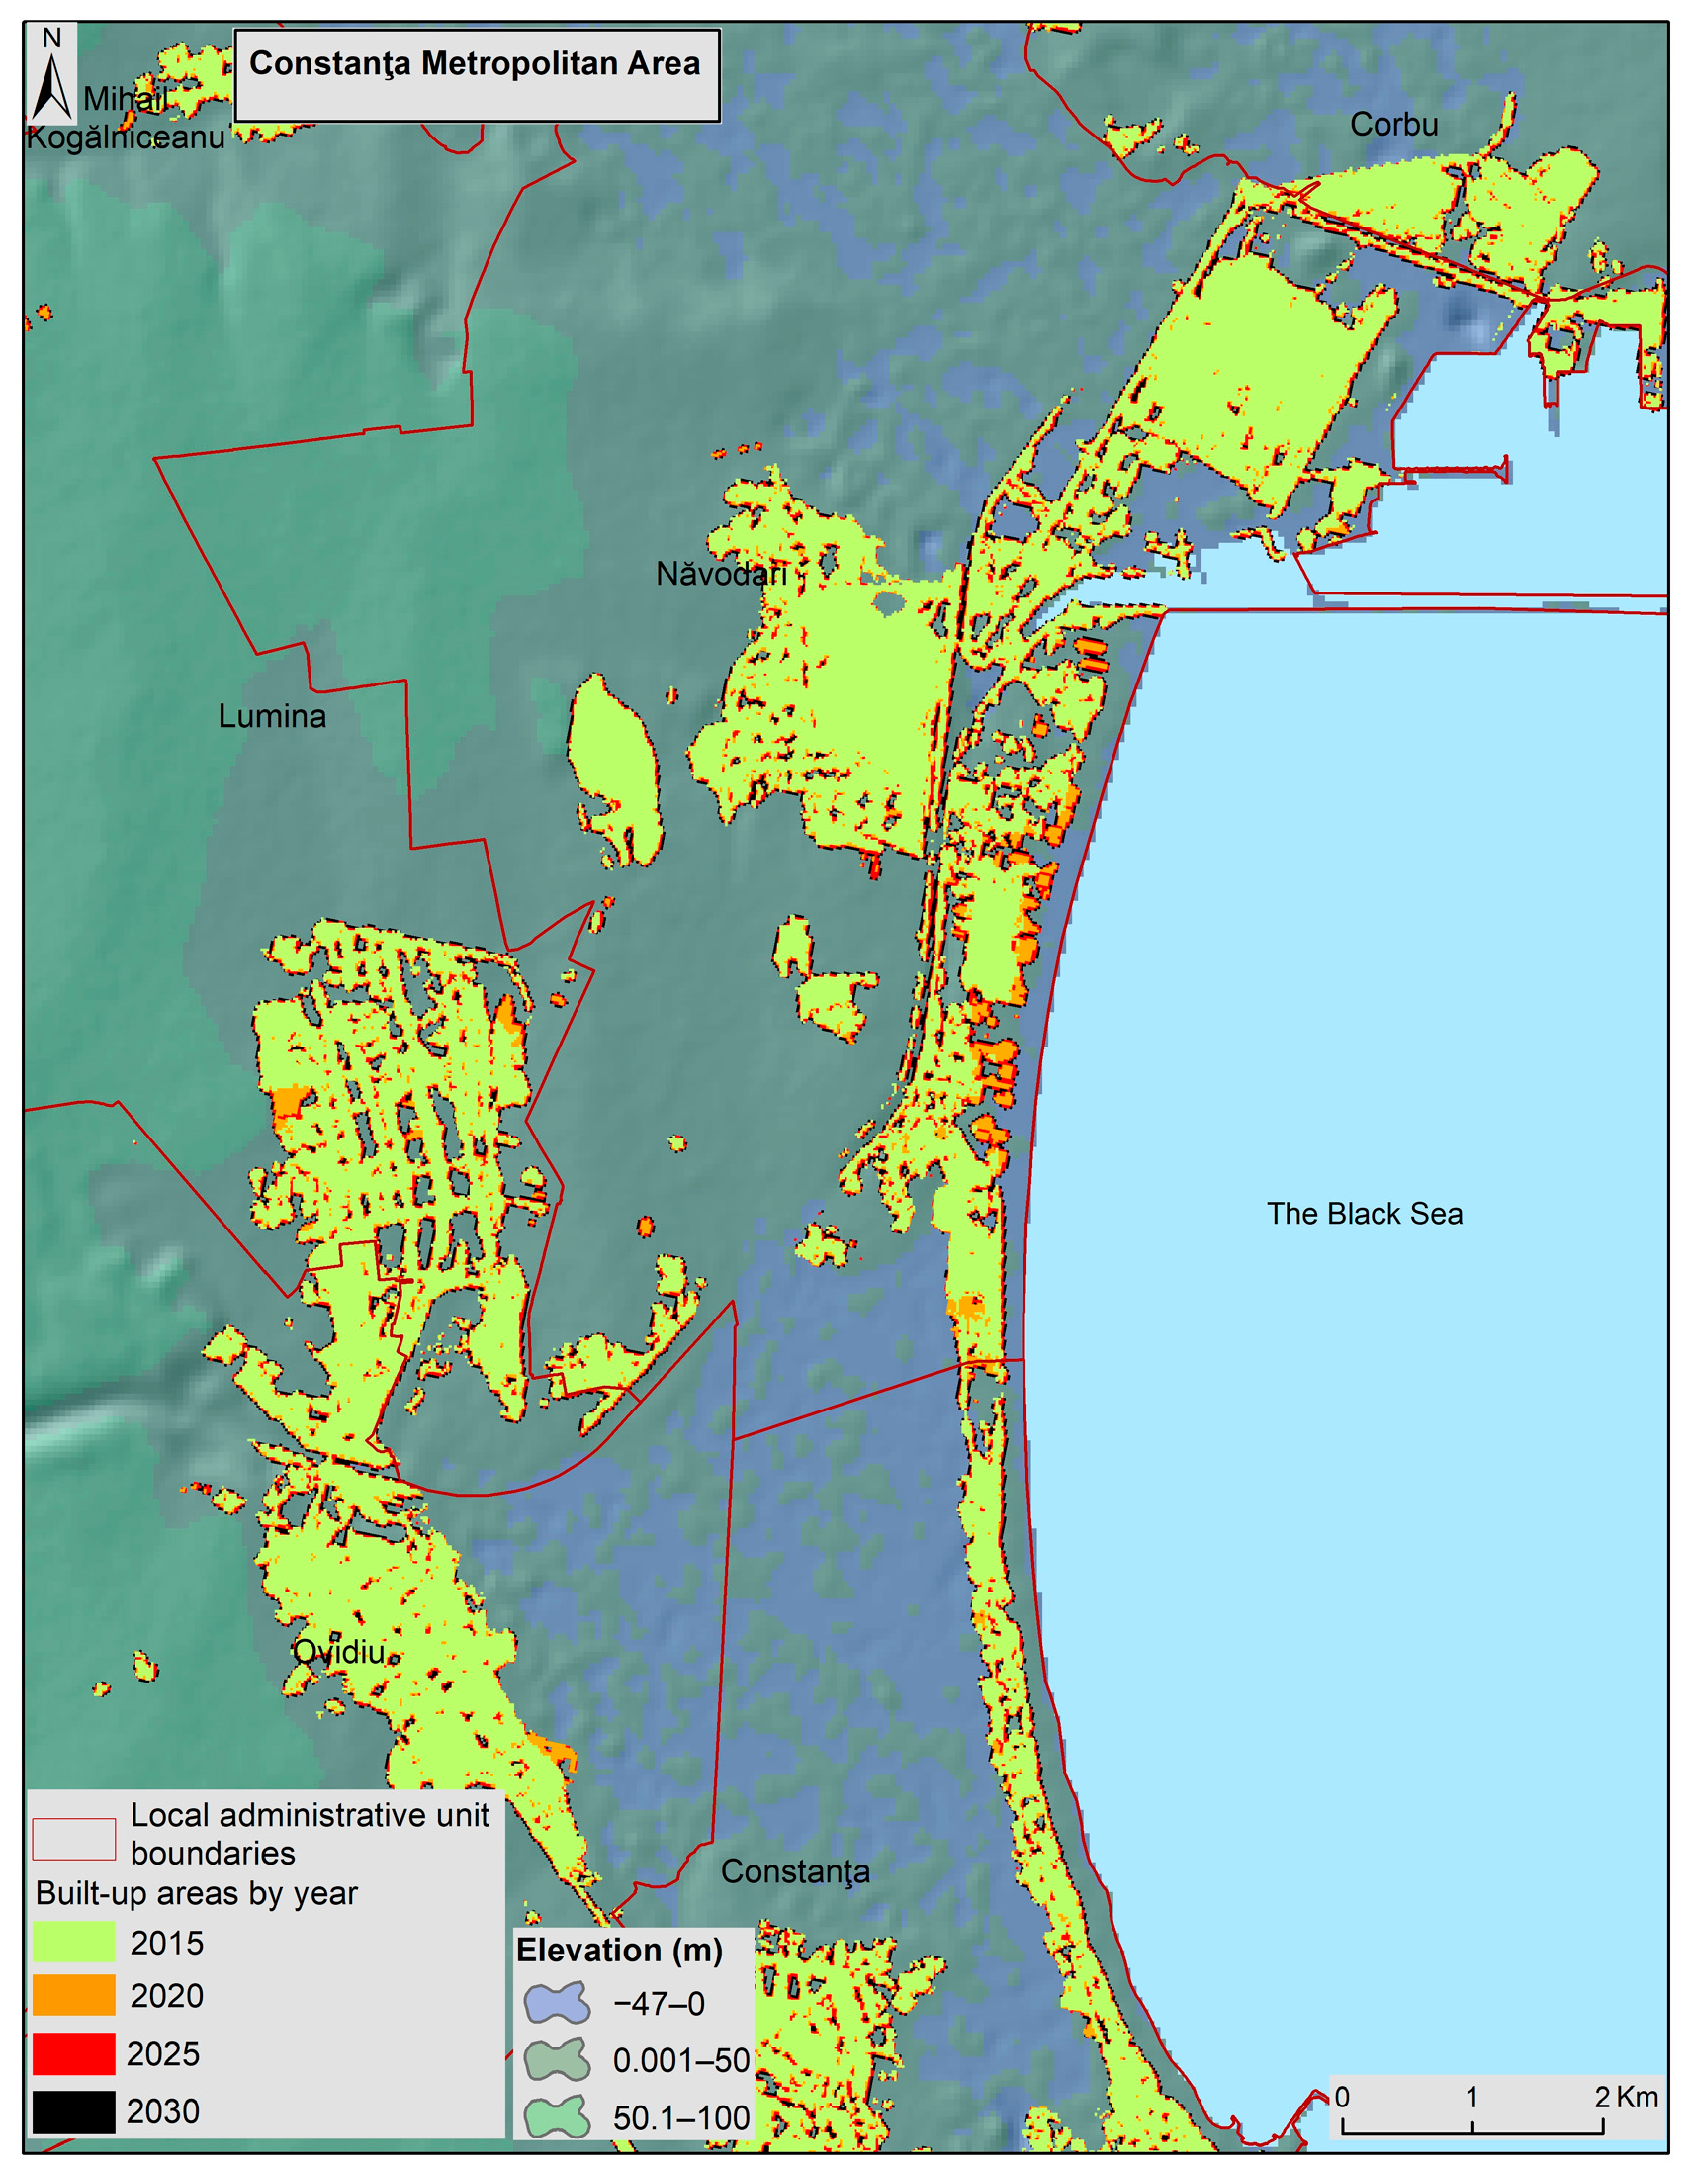
In Constanţa MA, increases in the built space could be noticed in the case of coastal areas of the Black Sea (Năvodari city), which tend to expand the touristic accommodation in one of the major Romanian regions for mass tourism (Figure 6).
Figure 6.
Built space in Constanţa MA.
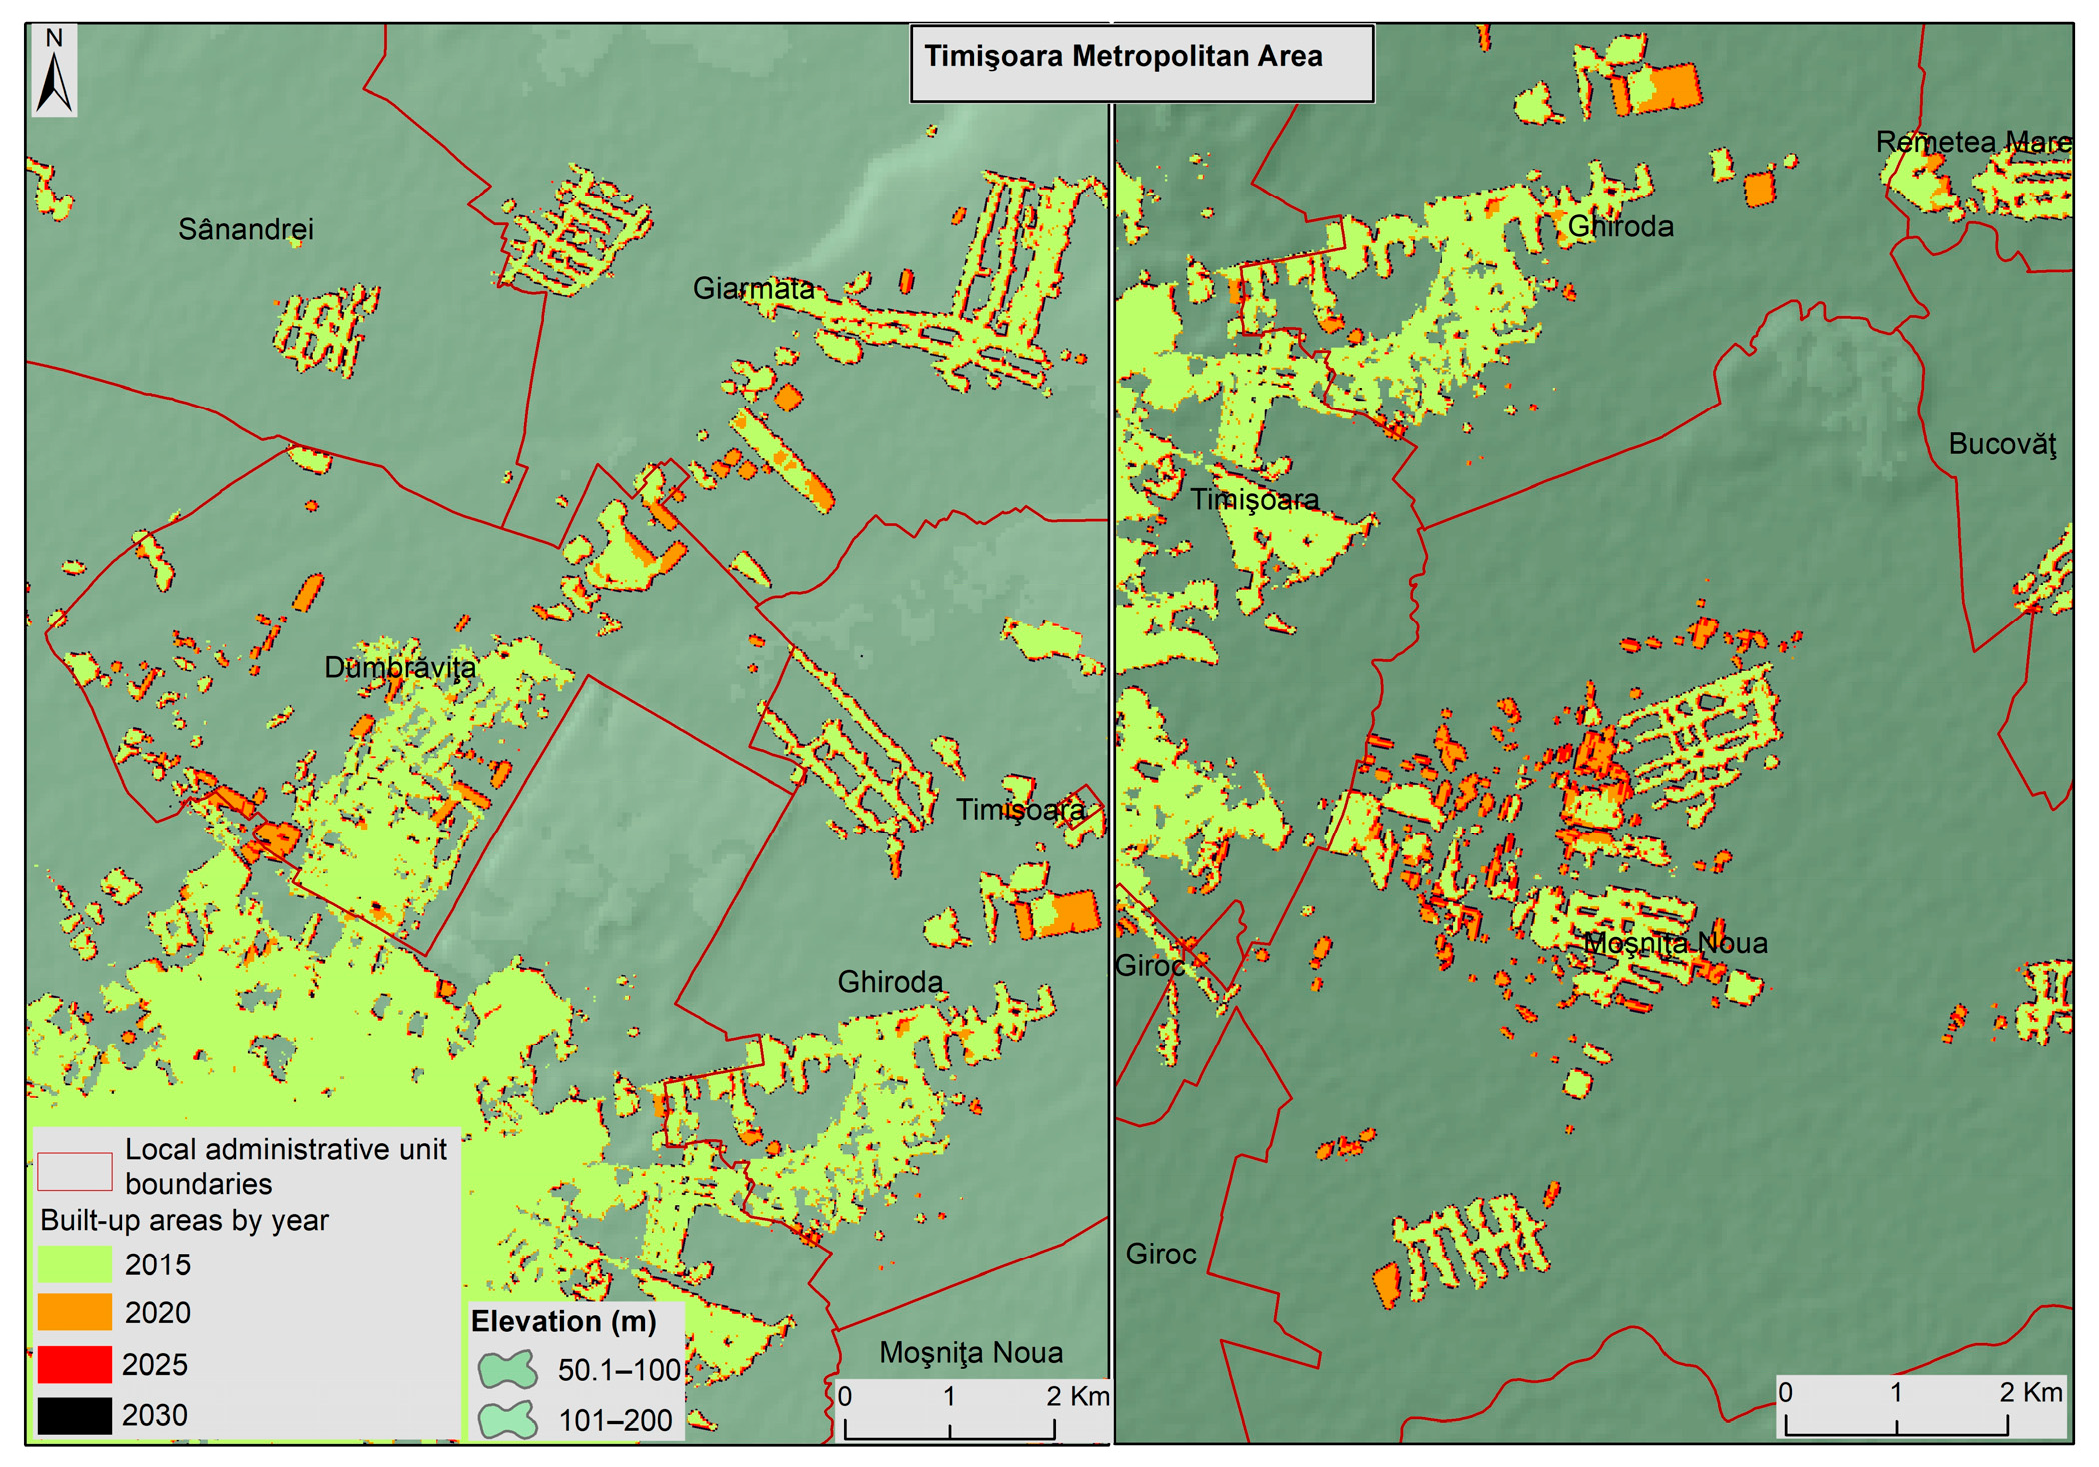
When it comes to urban expansion into suburban areas, Timişoara MA represents a particular case (Figure 7), a large number of rural communes surrounding the urban centre extending intensively their residential built space as a benefit of suburbanization, proximity and free space reserves. The availability of space reserves and lower prices will generate further urban expansion into these suburban localities, according to our model.
Figure 7.
Built space in Timişoara MA.
The accuracy of the projections was calculated for each Metropolitan Area (Table 4). Taking into account the fact that the metropolitan areas under consideration are complex spatial systems with high spatial heterogeneity, the obtained accuracy levels are good, with the notable exception of Timișoara.
Table 4.
Accuracy results.
5. Discussions
Our results demonstrate that urban growth follows a core–periphery pattern where the urban core areas are already compact and densified with limited available land (which makes land prices grow). This saturation of the urban cores generates a mechanism of shifting the urban growth towards the peripheries represented by the suburban areas due to the availability of free land reserves (which makes land prices lower) and the proximity to urban cores, where jobs are concentrating. This shifting mechanism of growth from the urban core areas to the suburban areas occurs mainly through residential suburbanization and industrial relocation, with clear examples offered by the urban cores of Cluj (concentrated expansion in few suburban areas), Constanța (coastal tourism-expansion) or Timișoara (widespread suburban growth in rural communes). The predicted result of this shifting mechanism is an urban sprawl and peri-urban densification, while the urban cores remain relatively stable. The temporal evolution of this mechanism shows no regularities; urban growth is uneven and dynamic across periods, the growth trajectories being non-linear and city-specific.
The projections made using Cellular Automata show the spatial direction and intensity of built areas expansion for 2025 and 2030 for each metropolitan area. According to these projections, the urban centres will not register major transformations as the urban fabric is already densified. Thus, the main changes are predicted to occur in the neighbouring suburban communes, which benefit from the proximity advantages, space reserves, and the diversification of urban economy, taking continuously over residential functions from the urban cores. Looking at the satellite imagery in Google Earth, there is a mixture of residential spaces and industrial sites, especially in the case of Cluj, Bucharest, Iaşi and Ploieşti MAs. The rest of the MAs are focused mainly on residential expansion. These findings are in line with the results from previous studies on built space, also focused on metropolitan areas [51,78].
The results of the study are consistent with those obtained for Delhi [35], and Urumqi city from Northwest China [27], with an uneven rate of increase in built-up area over time and a similar spatial pattern involving densification of the urban centre and suburban sprawl.
As mentioned in the introduction of this study, to our knowledge, we use the economic complexity index as a variable within the CA model for the first time in the CA based urban growth modelling. This approach is novel, providing an improved element of prediction for economic dynamics and urban expansion. Regarding population dynamics (2014–2022), there is a significant increase in the population of the two largest regional economic centres, namely in Cluj (10.09%) and Iași (15.63%), while there is a decrease in Ploiești (−5.17%), Craiova (−2.95%) and Constanța (−1.02%). However, there is no direct correlation with the expansion of the built-up area, which has increased by metropolitan areas in population decline: by 10.6% in Ploiești, 8.93% in Craiova, and 11.37% in Constanța. Consequently, our results show that population dynamics alone are not a reliable parameter for urban expansion, while economic complexity, and the change in economic complexity has strongly contributed to an improved prediction of urban expansion.
From the perspective of spatial planning, any built-up area development is regulated by local urban plans, which establishes an efficient land use regulation, in accordance with the appropriate urban planning functions [79]. Therefore, our results can be strongly used for the forecasting of built-up areas and the according revision of urban planning documents.
Limitations
The results of this study demonstrate that incorporating economic complexity into the CA-based land-use model influences spatial patterns of urban growth, with areas exhibiting higher economic diversification showing increased built-up expansion. However, several limitations should be acknowledged: the polycentric structure of Cluj-Napoca makes it impossible to benchmark the model against classical CA formulations based on distance from a central business district; the model relies on a limited set of input parameters, which could be expanded to capture additional socio-economic, policy, or environmental factors; the quality and representativeness of the input data have a significant impact on the results. In this context, we have the example of the population density of Iași MA, where the population is overestimated in the official statistics due to the resident population from the Republic of Moldova declaring their domicile in Romania; the model faces difficulty adapting to possible changes in population and economic dynamics in the future, because it relies on patterns observed in the past to predict similar dynamics in the future. A direct comparison between the projected built-up expansion and existing urban planning frameworks (e.g., local spatial plans) was not carried out in this study. This is partly due to the fact that, in the Romanian context, many planning documents are outdated and not regularly actualized, limiting their relevance for current urban dynamics. In addition, there is no direct correspondence between the modelled built-up areas and the officially designated intravilan boundaries, as the latter include not only built-up surfaces but also other categories of land (e.g., vacant or agricultural land reserved for future development). Therefore, a consistent comparison would require a dedicated methodological framework and harmonized datasets, representing a potential direction for future research. Moreover, these limitations could be addressed by incorporating a broader range of drivers, performing multi-scenario simulations, and applying the methodology to other urban areas to evaluate its generalizability and robustness.
6. Conclusions
Cellular Automata (CA) proved to be a valuable approach in modelling urban growth. The great added value of the paper is related to the integration of the economic complexity index into the urban growth model. Doing so, our results not only summarize both economic development and demographic dynamics within major metropolitan areas, but they have provided the urban growth model with a novel and more robust basis for prediction. It should be noted that the improvement demonstrated in this study refers to methodological and conceptual enhancements, particularly in economic realism and applicability to polycentric cities, rather than a quantified increase in predictive accuracy compared to classical CA models. Identifying an urban growth model and the growth rates of varying intensities for each analyzed metropolitan area can offer valuable information for local authorities, aiding in decision-making and the development of sustainable urban planning strategies. In the future, we propose the testing of dynamic variables to enhance the model’s adaptability and with the emergence of new datasets, we aim to extend both the analysis period and the study areas.
Author Contributions
Conceptualization, J.B. and I.H.; Methodology, J.B., I.H., I.T. and C.-D.U.; Software, I.H.; Validation, I.H., C.-D.U., K.T.-I. and M.A.; Formal Analysis, I.H., I.T. and C.-D.U.; Investigation, I.H. and I.T.; Resources, J.B., I.H., I.T., K.T.-I. and M.A.; Data Curation, I.H. and C.-D.U.; Writing—Original Draft Preparation, J.B., I.H., I.T., C.-D.U., K.T.-I. and M.A.; Writing—Review and Editing, J.B., I.H., I.T., C.-D.U. and M.A.; Visualization, C.-D.U.; Supervision, J.B.; Project Administration, J.B. and K.T.-I.; Funding Acquisition, J.B. All authors contributed equally to the research presented in this paper and to the preparation of the final manuscript. All authors have read and agreed to the published version of the manuscript.
Funding
This work was supported by a grant of the Ministry of Research and Innovation, CNCS-UEFISCDI, project number PN-III-P4-ID-PCE-2020-0920, within PNCDI III. The publication of this article was also supported by the 2022 Development Fund of the Babeş-Bolyai University.
Data Availability Statement
The original contributions presented in this study are included in the article. Further inquiries and access to the datasets can be requested from the corresponding author.
Acknowledgments
Thanks for the funding support.
Conflicts of Interest
The authors declare no conflict of interest.
Appendix A. Built-Up Spaces of Metropolitan Areas for the Years 2015, 2020, 2025 and 2030
Figure A1.
Built-up areas in Braşov MA (left); Bucureşti MA (right).
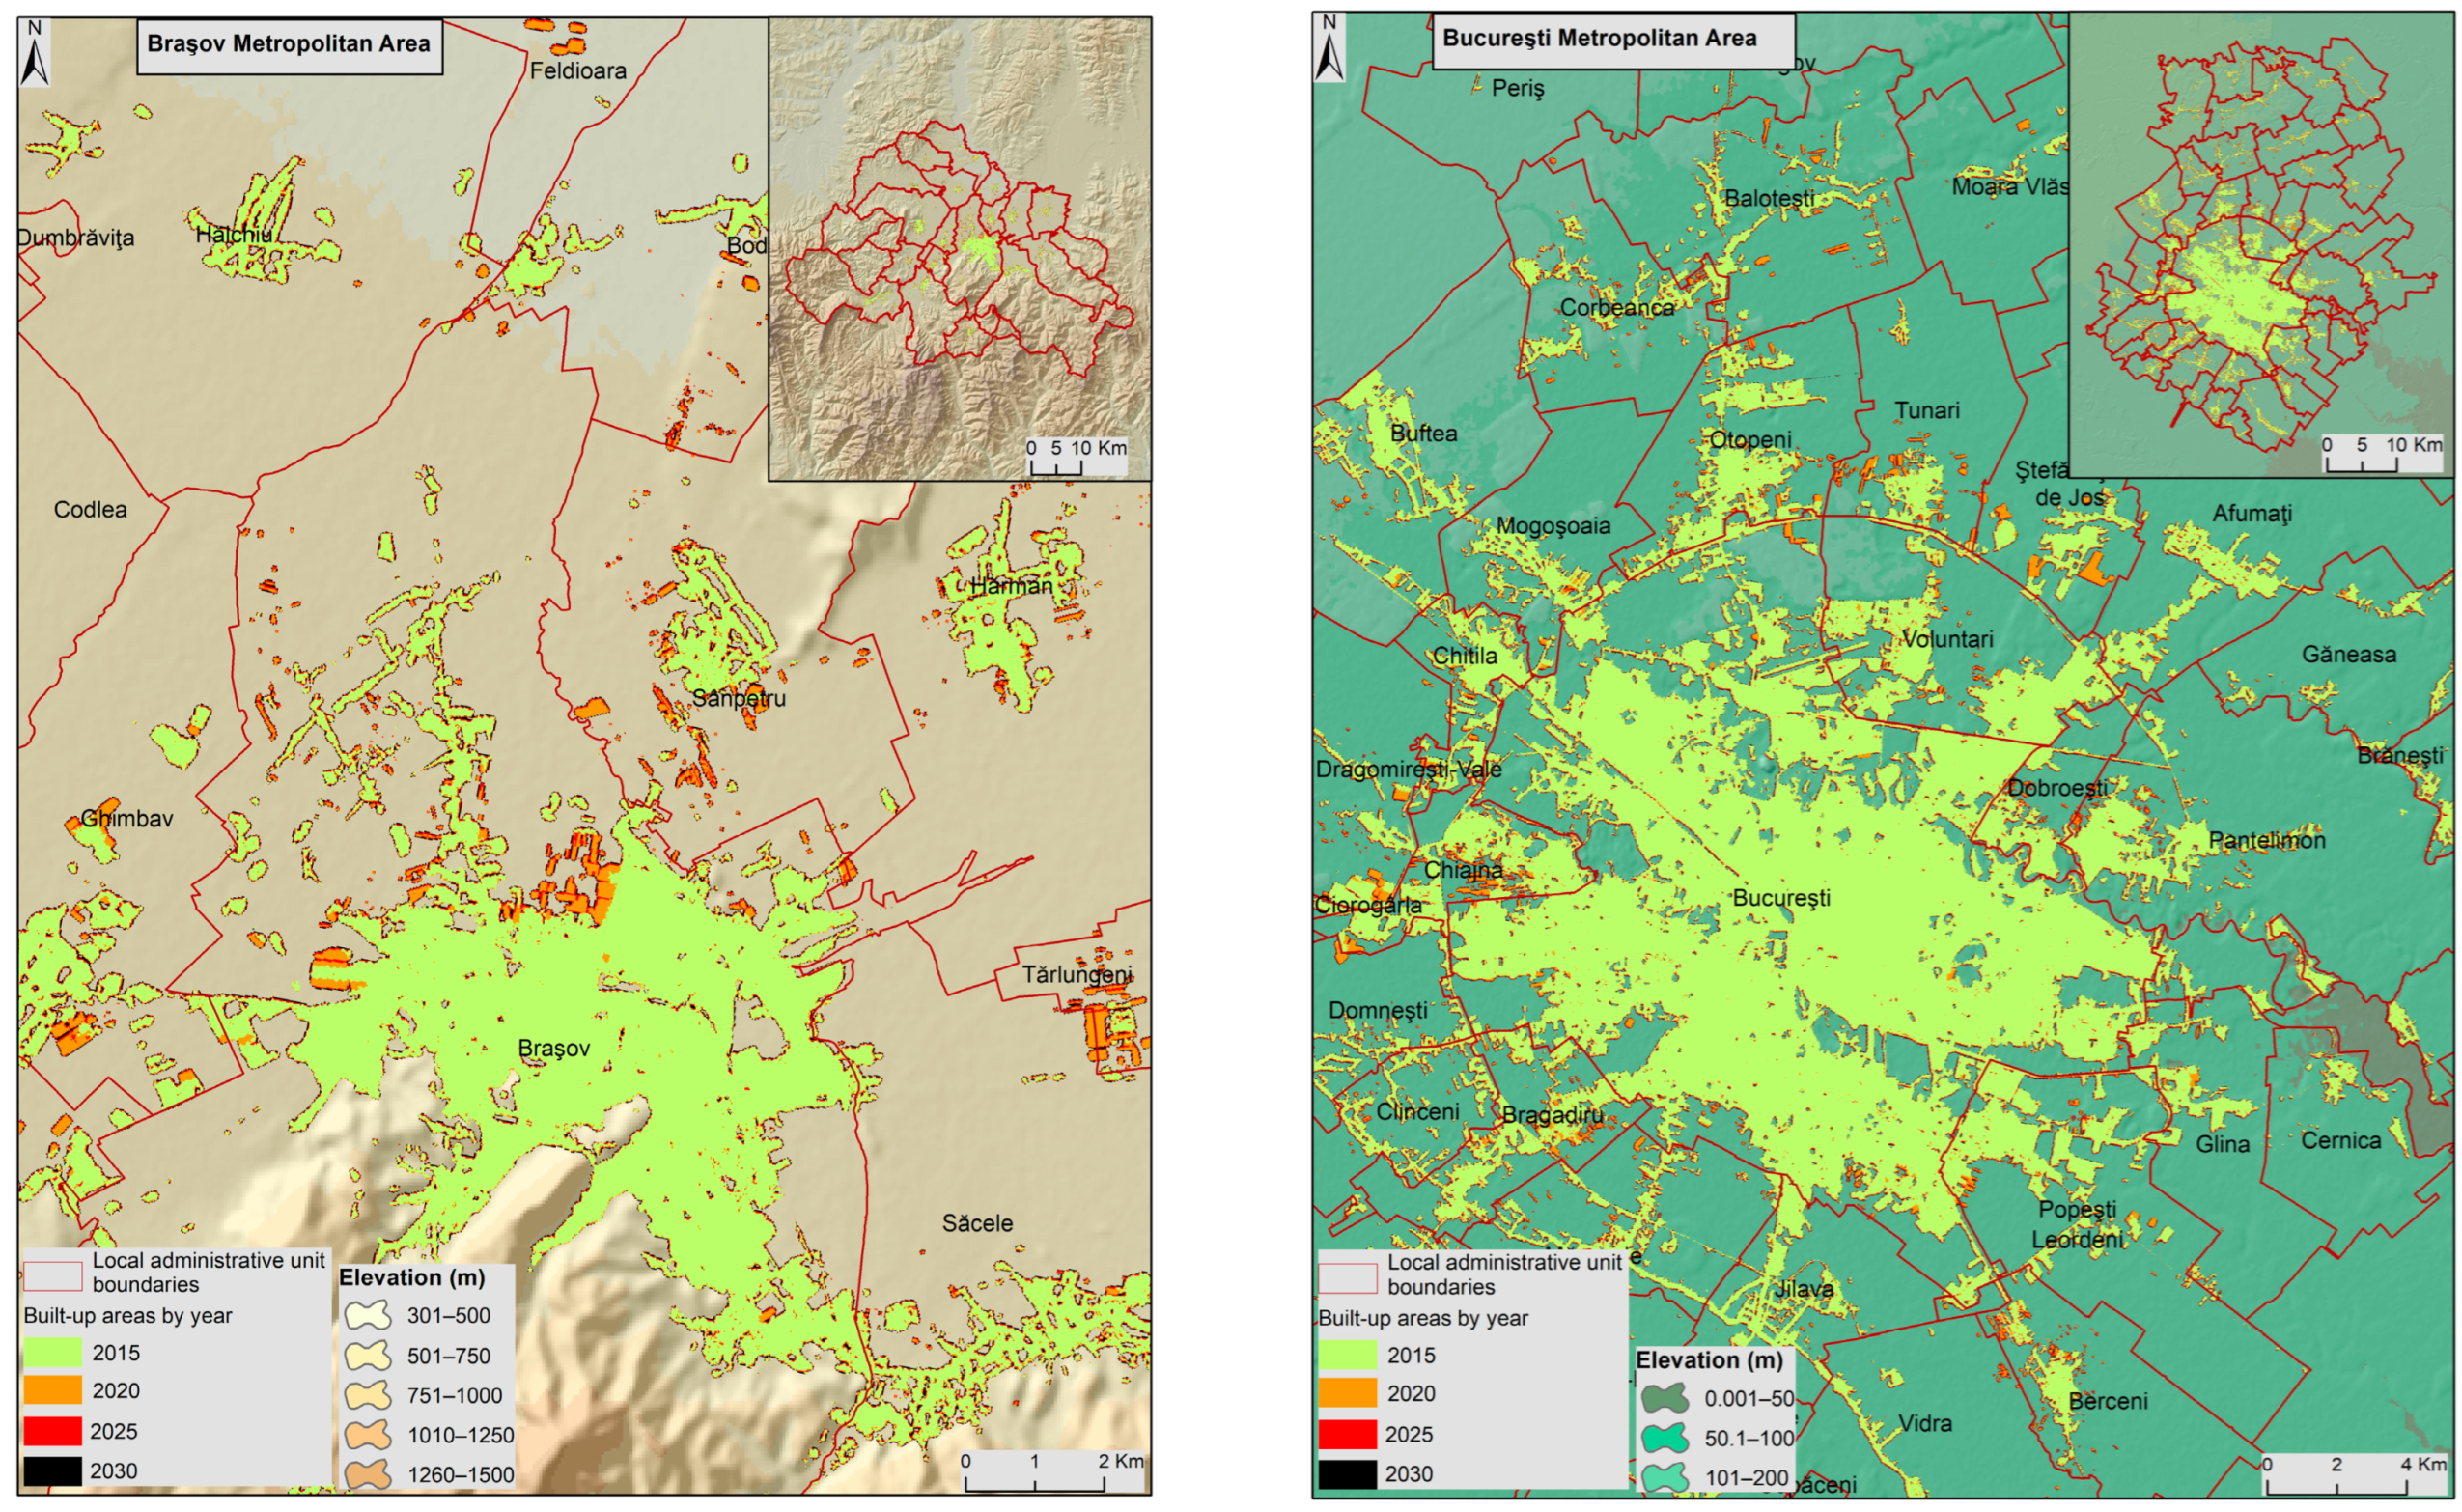
Figure A2.
Built-up areas in Cluj MA (left); Constanţa MA (right).
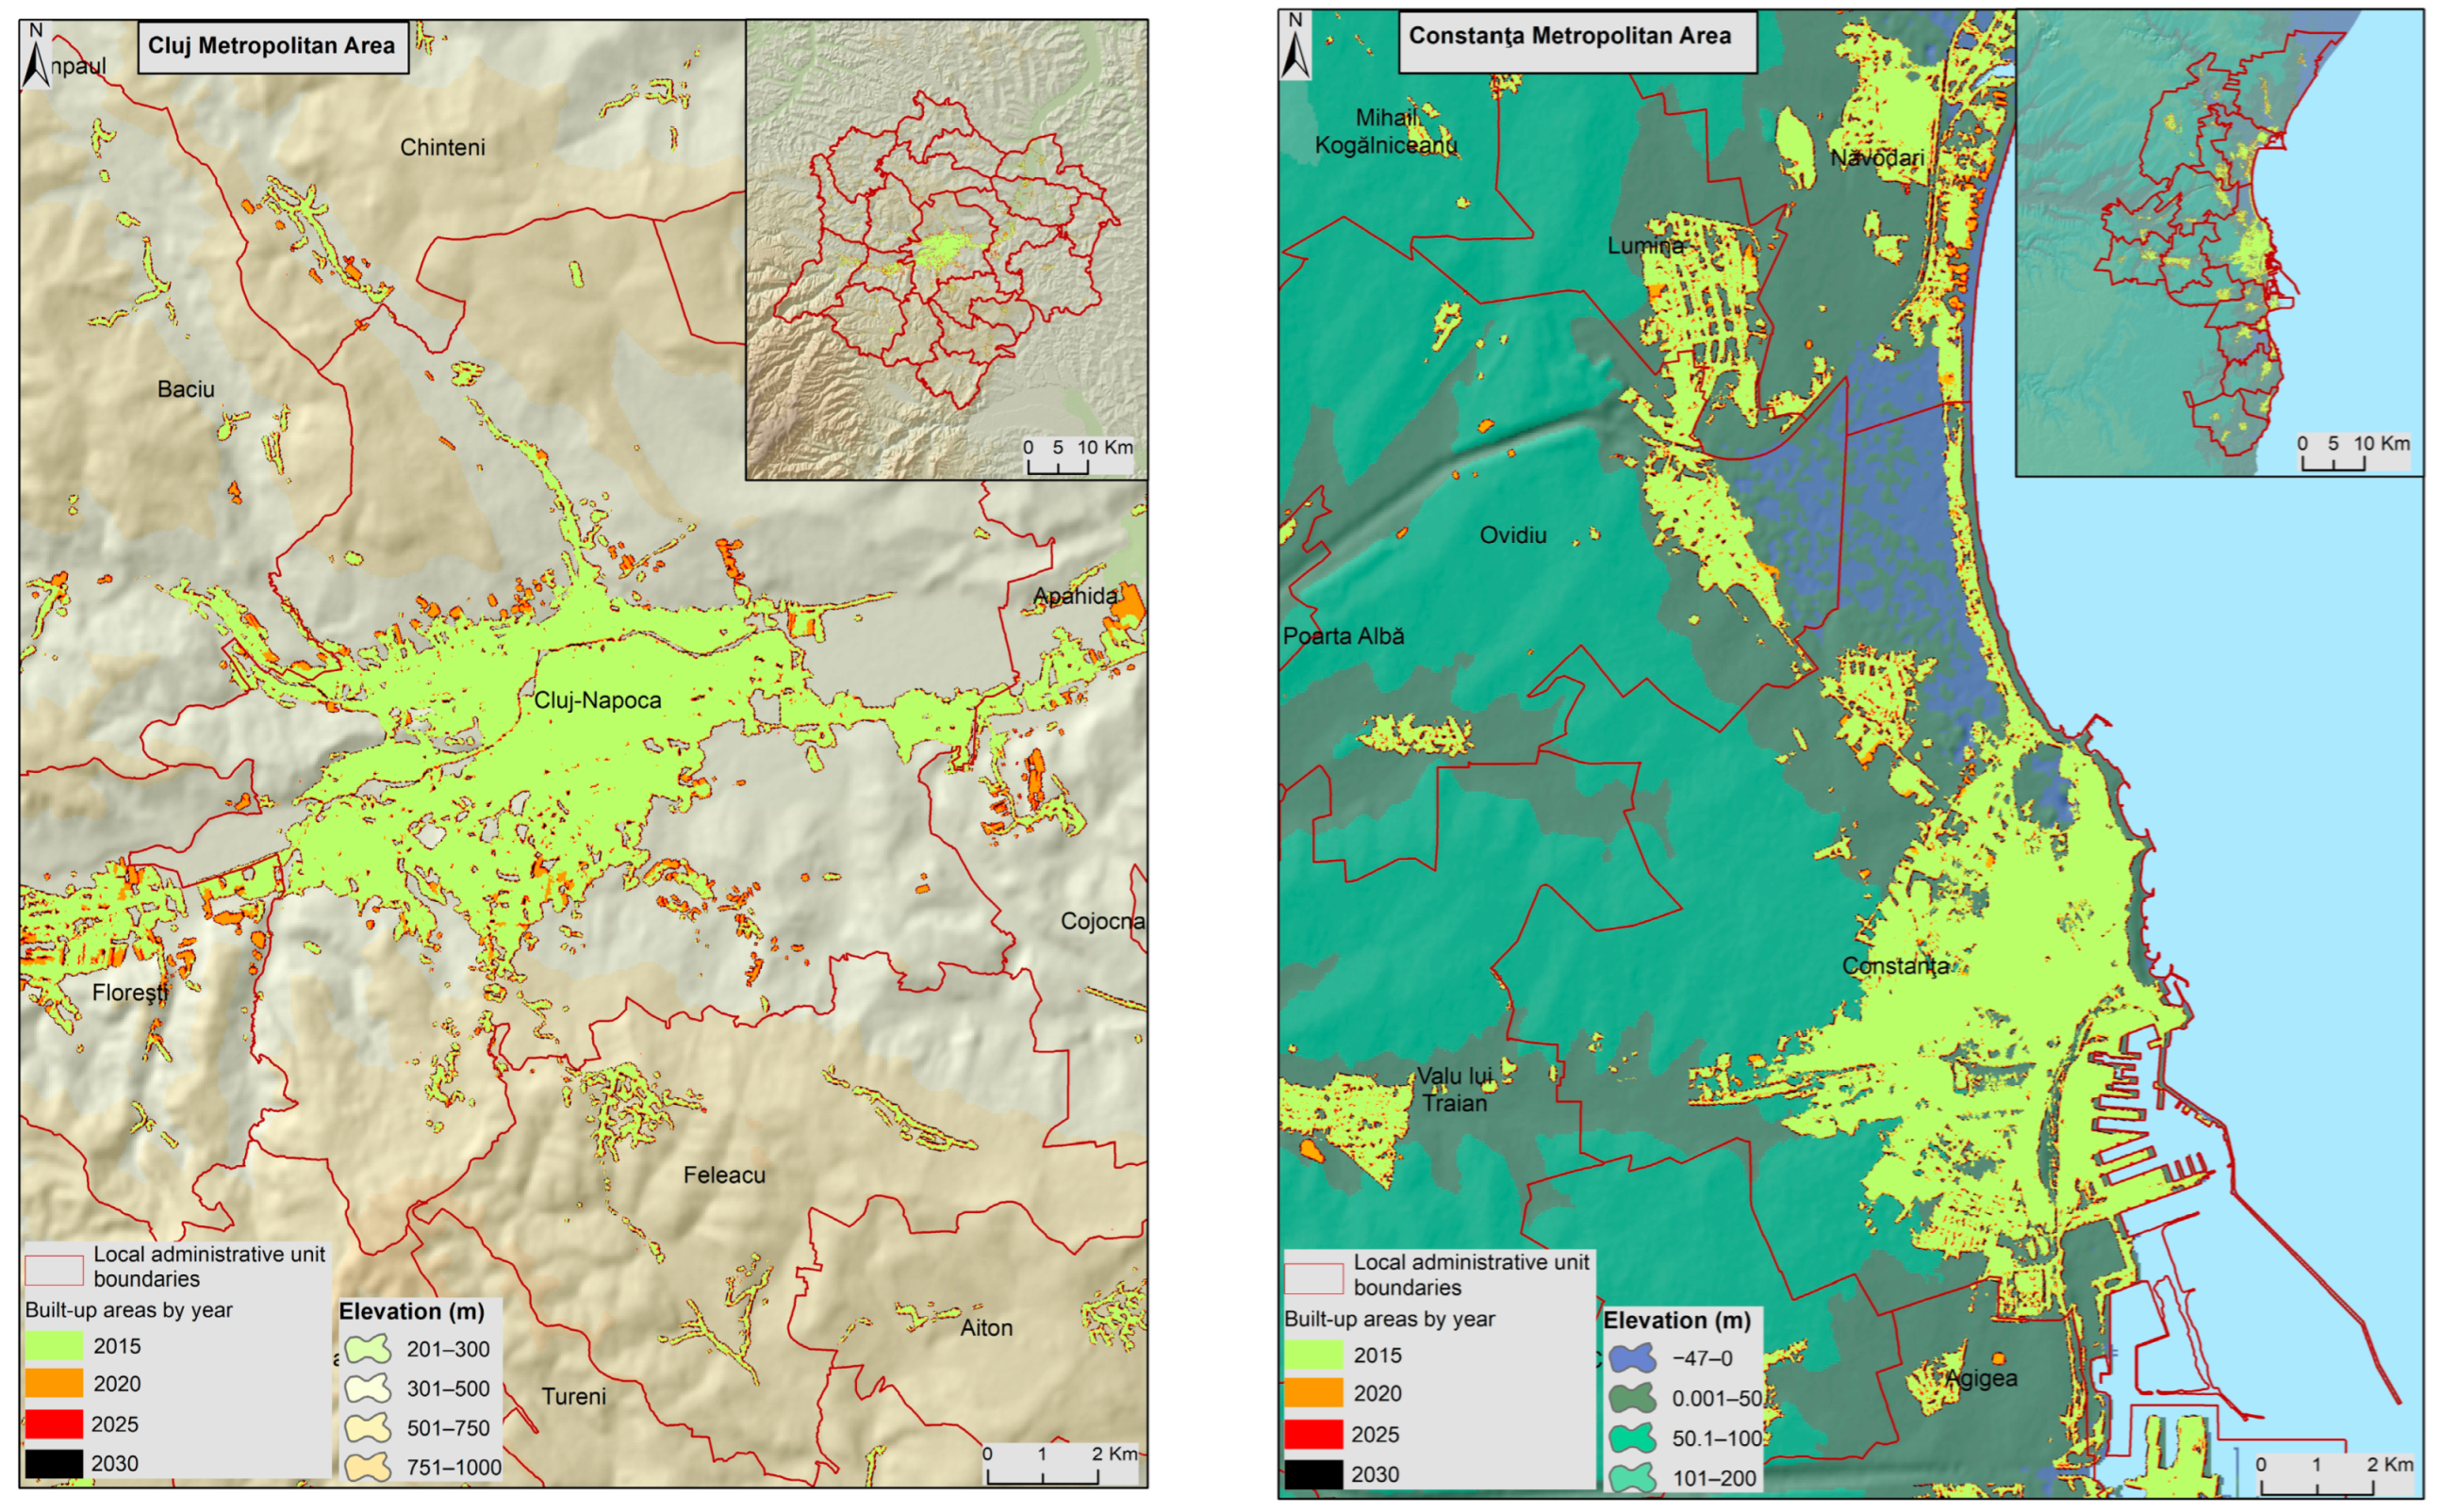
Figure A3.
Built-up areas in Craiova MA (left); Iaşi MA (right).
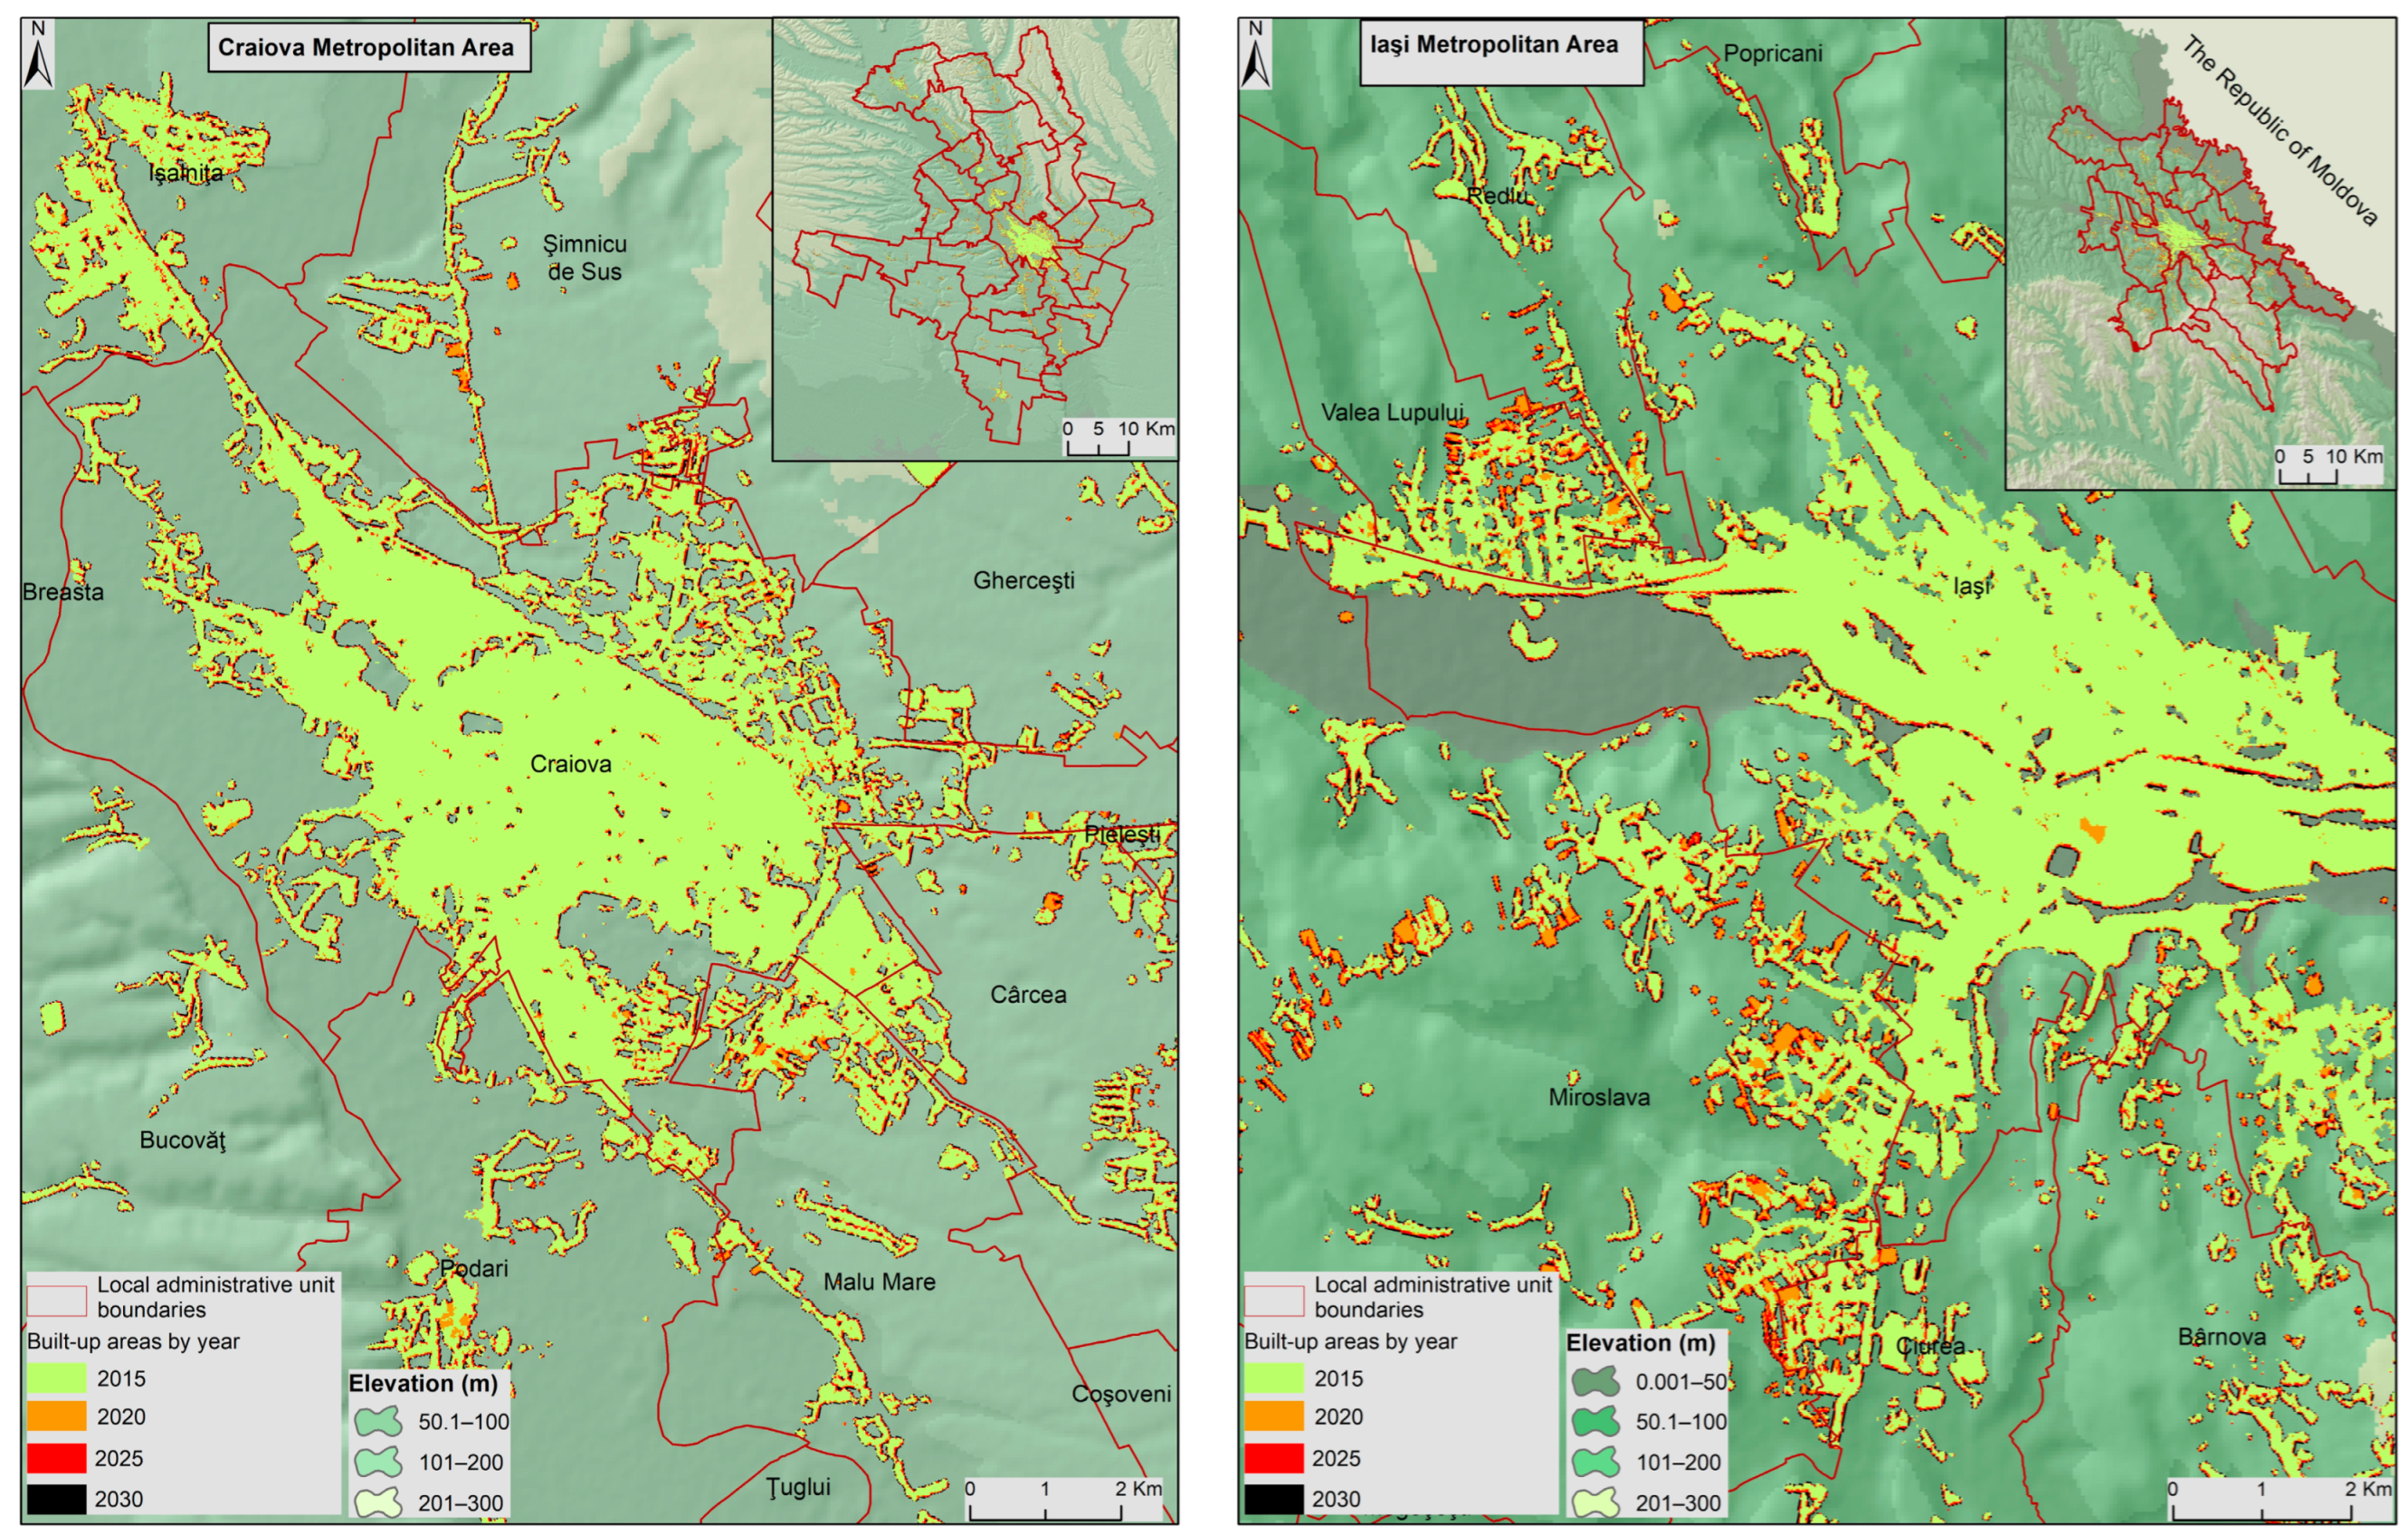
Figure A4.
Built-up areas in Timişoara MA (left); Ploieşti MA (right).
References
- Zhuang, Y.; Li, W.Y.; Wang, H.; Hong, S.; Wang, H. A Bibliographic Review of Cellular Automaton Publications in the Last 50 Years. J. Cell. Autom. 2017, 12, 475–492. [Google Scholar]
- Avolio, M.V.; D’Ambrosio, D.; Lupiano, V.; Rongo, R.; Spataro, W. Evaluating lava flow hazard at Mount Etna (Italy) by a cellular automata-based methodology. In Parallel Processing and Applied Mathematics, Proceedings of the 8th International Conference, Wroclaw, Poland, 13–16 September 2009; Revised Selected Papers, Part II; Springer: Berlin/Heidelberg, Germany, 2010; Volume 6068, pp. 495–504. [Google Scholar]
- Cappello, A.; Vicari, A.; Del Negro, C. Retrospective validation of a lava flow hazard map for Mount Etna volcano. Ann. Geophys. 2011, 54, 634–640. [Google Scholar] [CrossRef] [Scilit]
- Rongo, R.; Avolio, M.A.; Behncke, B.; D’Ambrosio, D.; Di Gregorio, S.; Lupiano, V.; Neri, M.; Spataro, W.; Crisci, G.M. Defining high-detail hazard maps by a cellular automata approach: Application to Mount Etna (Italy). Ann. Geophys. 2011, 54, 568–578. [Google Scholar] [CrossRef] [Scilit]
- Rongo, R.; Lupiano, V.; Avolio, M.V.; D’Ambrosio, D.; Spataro, W.; Trunfio, G.A. Cellular Automata Simulation of Lava Flows-Applications to Civil Defense and Land Use Planning with a Cellular Automata based Methodology. In Proceedings of the International Conference on Simulation and Modeling Methodologies, Technologies and Applications (Simultech), Noordwijkerhout, The Netherlands, 29–31 July 2011; pp. 37–44. [Google Scholar]
- Spataro, W.; Rongo, R.; Lupiano, V.; Avolio, M.V.; D’Ambrosio, D.; Trunfio, G.A. High Detailed Lava Flows Hazard Maps by a Cellular Automata Approach. In Simulation and Modeling Methodologies, Technologies and Applications; Advances in Intelligent Systems and Computing; Pina, N., Kacprzyk, J., Filipe, J., Eds.; Springer: Berlin/Heidelberg, Germany, 2013; Volume 197. [Google Scholar] [CrossRef] [Scilit]
- Alabert, A.; Marull, J.; Ruiz, A.; Coll, F.; Miranda, M.; Padró, R. Space-time dynamics of urban systems from satellite images of night lighting. Urban progress scenarios for European metropolitan regions. Comput. Environ. Urban Syst. 2021, 86, 101587. [Google Scholar] [CrossRef] [Scilit]
- Cabello, A.; Velasco, M.; Barredo, J.I.; Hurkmans, R.T.W.L.; Barrera-Escoda, A.; Sempere-Torres, D.; Velasco, D. Assessment of future scenarios of climate and land-use changes in the IMPRINTS test-bed areas. Environ. Sci. Policy 2011, 14, 884–897. [Google Scholar] [CrossRef] [Scilit]
- Feyen, L.; Barredo, J.I.; Dankers, R. Implications of global warming and urban land use change on flooding in Europe. In Water and Urban Development Paradigms—Towards an Integration of Engineering, Design and Management Approaches; Feyen, J., Shannon, K., Neville, M., Eds.; CRC Press-Balkema: Leiden, The Netherlands, 2009; pp. 217–225. [Google Scholar]
- Hansen, H.S. Modelling the future coastal zone urban development as implied by the IPCC SRES and assessing the impact from sea level rise. Landsc. Urban Plann. 2010, 98, 141–149. [Google Scholar] [CrossRef] [Scilit]
- Pulido-Velazquez, M.; Peña-Haro, S.; García-Prats, A.; Mocholi-Almudever, A.F.; Henríquez-Dole, L.; Macian-Sorribes, H.; Lopez-Nicolas, A. Integrated assessment of the impact of climate and land use changes on groundwater quantity and quality in the Mancha Oriental system (Spain). Hydrol. Earth Syst. Sci. 2015, 19, 1677–1693. [Google Scholar] [CrossRef] [Scilit]
- Malek, Ž.; Boerboom, L.; Glade, T. Future forest cover change scenarios with implications for landslide risk: An example from Buzau Subcarpathians, Romania. Environ. Manag. 2015, 56, 1228–1243. [Google Scholar] [CrossRef] [Scilit]
- Berger, M. The manifold challenges for modeling the urban heat island. Procedia Comput. Sci. 2016, 80, 2000–2007. [Google Scholar] [CrossRef] [Scilit]
- Zia, K.; Farrahi, K.; Riener, A.; Ferscha, A. An agent-based parallel geo-simulation of urban mobility during city-scale evacuation. Simulation 2013, 89, 1184–1214. [Google Scholar] [CrossRef] [Scilit]
- Bandini, S.; Briola, D.; Dennunzio, A.; Gasparini, F.; Giltri, M.; Vizzari, G. Integrating the Implications of Distance-Based Affective States in Cellular Automata Pedestrian Simulation. In Cellular Automata, Proceedings of the ACRI 2022, Geneva, Switzerland, 12–15 September 2022; Lecture Notes in Computer Science; Chopard, B., Bandini, S., Dennunzio, A., Arabi Haddad, M., Eds.; Springer: Cham, Switzerland, 2022; Volume 13402. [Google Scholar] [CrossRef] [Scilit]
- Georgiadi, I.; Georgoudas, I.G.; Trunfio, G.A.; Sirakoulis, G.C. An Interactive Cellular Automata Based Application to Foster Sustainable Forms of Movement in the Urban Fabric. J. Cell. Autom. 2022, 16, 491. [Google Scholar]
- Vaxevanellis, E.; Liolis, O.; Chatzinikolaou, T.P.; Sirakoulis, G.C. Cellular Automata-Based System for Traffic and Parking Management in Urban Centers. J. Cell. Autom. 2024, 18, 207. [Google Scholar]
- Ferreira, M.E.A.; Quinta, A.L.M.P.; Lima, D.A.; Martins, L.G.A.; Oliveira, G.M.B. Automatic Evolutionary Adjustment of Cellular Automata Model for Forest Fire Propagation. In Cellular Automata, Proceedings of the ACRI 2022, Geneva, Switzerland, 12–15 September 2022; Lecture Notes in Computer Science; Chopard, B., Bandini, S., Dennunzio, A., Arabi Haddad, M., Eds.; Springer: Cham, Switzerland, 2022; Volume 13402. [Google Scholar] [CrossRef] [Scilit]
- Tinoco, C.R.; Ferreira, H.F.; Martins, L.G.A.; Oliveira, G.M.B. Wildfire Simulation Model Based on Cellular Automata and Stochastic Rules. In Cellular Automata, Proceedings of the ACRI 2022, Geneva, Switzerland, 12–15 September 2022; Lecture Notes in Computer Science; Chopard, B., Bandini, S., Dennunzio, A., Arabi Haddad, M., Eds.; Springer: Cham, Switzerland, 2022; Volume 13402. [Google Scholar] [CrossRef] [Scilit]
- Zhang, D.; Peng, J.; Yang, Z. Identifying urban agglomeration’s range: Integrating clustering and accessibility analysis. Cities 2026, 171, 106708. [Google Scholar] [CrossRef] [Scilit]
- Wang, J.; Chen, J.; Liu, X.; Wang, W.; Min, S. Exploring the spatial and temporal characteristics of China’s four major urban agglomerations in the luminous remote sensing perspective. Remote Sens. 2023, 15, 2546. [Google Scholar] [CrossRef] [Scilit]
- Lauf, S.; Haase, D.; Hostert, P.; Lakes, T.; Kleinschmit, B. Uncovering land-use dynamics driven by human decision-making—A combined model approach using cellular automata and system dynamics. Environ. Model. Softw. 2012, 27–28, 71–82. [Google Scholar] [CrossRef] [Scilit]
- Gomes, E.; Banos, A.; Abrantes, P.; Rocha, J.; Schläpfer, M. Future land use changes in a peri-urban context: Local stakeholder views. Sci. Total Environ. 2020, 718, 137381. [Google Scholar] [CrossRef] [Scilit]
- Navarro Cerrillo, R.M.; Palacios Rodríguez, G.; Clavero Rumbao, I.; Lara, M.Á.; Bonet, F.J.; Mesas-Carrascosa, F.J. Modeling major rural land-use changes using the GIS-based cellular automata metronamica model: The case of Andalusia (Southern Spain). ISPRS Int. J. Geo-Inf. 2020, 9, 458. [Google Scholar] [CrossRef] [Scilit]
- Asif, M.; Kazmi, J.H.; Tariq, A.; Zhao, N.; Guluzade, R.; Soufan, W.; Aslam, M. Modelling of land use and land cover changes and prediction using CA-Markov and Random Forest. Geocarto Int. 2023, 38, 2210532. [Google Scholar] [CrossRef] [Scilit]
- Mansour, S.; Ghoneim, E.; El-Kersh, A.; Said, S.; Abdelnaby, S. Spatiotemporal Monitoring of Urban Sprawl in a Coastal City Using GIS-Based Markov Chain and Artificial Neural Network (ANN). Remote Sens. 2023, 15, 601. [Google Scholar] [CrossRef] [Scilit]
- Tang, X.; Liu, F.; Hu, X. Urban growth simulation and scenario projection for the arid regions using heuristic cellular automata. Sci. Rep. 2024, 14, 21106. [Google Scholar] [CrossRef] [Scilit] [PubMed]
- Yadav, P.K.; Mishra, V.N.; Kumari, M.; Kumar, A.; Kumar, P.; Bhatla, R. Spatially explicit simulation and forecasting of urban growth using weights of evidence based cellular automata model in a millennium city of India. Phys. Chem. Earth 2024, 136, 103739. [Google Scholar] [CrossRef] [Scilit]
- Petrov, L.O.; Shahumyan, H.; Williams, B.; Convery, S. Scenarios and indicators supporting urban regional planning. Procedia Soc. Behav. Sci. 2011, 21, 243–252. [Google Scholar] [CrossRef] [Scilit]
- Jogun, T.; Lukić, A.; Gašparović, M. Simulation model of land cover changes in a post-socialist peripheral rural area: Požega-Slavonia County, Croatia. Croat. Geogr. Bull. 2019, 81, 31–59. [Google Scholar] [CrossRef] [Scilit]
- Barredo, J.I.; Kasanko, M.; McCormick, N.; Lavalle, C. Modelling dynamic spatial processes: Simulation of urban future scenarios through cellular automata. Landsc. Urban Plan. 2003, 64, 145–160. [Google Scholar] [CrossRef] [Scilit]
- Yeasmin, T.; Karmaker, S.; Islam, M.S.; Hasan, I.; Rahman, S.; Hasan, M. Prediction of land cover changes in an Urban City of Bangladesh using artificial neural network-based cellular automata. Urban Lifeline 2025, 3, 7. [Google Scholar] [CrossRef] [Scilit]
- Li, F.; Wang, L.; Chen, Z.; Clarke, K.C.; Li, M.; Jiang, P. Extending the SLEUTH model to integrate habitat quality into urban growth simulation. J. Environ. Manag. 2018, 217, 486–498. [Google Scholar] [CrossRef] [Scilit]
- Liu, Y.; Wu, C.; Wu, J.; Zhang, Y.; Bi, X.; Wang, M.; Yan, E.; Song, C.; Li, J. Projected Spatiotemporal Evolution of Urban Form Using the SLEUTH Model with Urban Master Plan Scenarios. Remote Sens. 2025, 17, 270. [Google Scholar] [CrossRef] [Scilit]
- Tripathy, P.; Kumar, A. Monitoring and modelling spatio-temporal urban growth of Delhi using Cellular Automata and geoinformatics. Cities 2019, 90, 52–63. [Google Scholar] [CrossRef] [Scilit]
- Hidalgo, C.A.; Hausmann, R. The building blocks of economic complexity. Proc. Natl. Acad. Sci. USA 2009, 106, 10570–10575. [Google Scholar] [CrossRef] [Scilit]
- Hidalgo, C.A. The policy implications of economic complexity. Res. Policy 2023, 52, 104863. [Google Scholar] [CrossRef] [Scilit]
- Gantumur, B.; Wu, F.; Vandansambuu, B.; Tsegmid, B.; Dalaibaatar, E.; Zhao, Y. Spatiotemporal dynamics of urban expansion and its simulation using CA-ANN model in Ulaanbaatar, Mongolia. Geocarto Int. 2020, 37, 494–509. [Google Scholar] [CrossRef] [Scilit]
- Kumar, G.; Vyas, S.; Sharma, S.N.; Dehalwar, K. Urban growth prediction using CA-ANN model and spatial analysis for planning policy in Indore city, India. GeoJournal 2025, 90, 139. [Google Scholar] [CrossRef] [Scilit]
- Yang, Q.; Li, X.; Shi, X. Cellular automata for simulating land use changes based on support vector machines. Comput. Geosci. 2008, 34, 592–602. [Google Scholar] [CrossRef] [Scilit]
- Cao, Y.; Zhang, X.; Fu, Y.; Lu, Z.; Shen, X. Urban spatial growth modeling using logistic regression and cellular automata: A case study of Hangzhou. Ecol. Indic. 2020, 113, 106200. [Google Scholar] [CrossRef] [Scilit]
- Wang, H.; Guo, J.; Zhang, B.; Zeng, H. Simulating urban land growth by incorporating historical information into a cellular automata model. Landsc. Urban Plan. 2021, 214, 104168. [Google Scholar] [CrossRef] [Scilit]
- Kamusoko, C.; Gamba, J. Simulating Urban Growth Using a Random Forest-Cellular Automata (RF-CA) Model. ISPRS Int. J. Geo-Inf. 2015, 4, 447–470. [Google Scholar] [CrossRef] [Scilit]
- Zhou, Z.; Chen, Y.; Wang, Z.; Lu, F. Integrating cellular automata with long short-term memory neural network to simulate urban expansion using time-series data. Int. J. Appl. Earth Obs. 2024, 127, 103676. [Google Scholar] [CrossRef] [Scilit]
- Zeng, H.; Wang, H.; Zhang, B.; Wang, Q. A methodology to quantify the neighborhood decay effect of urban cellular automata models. Int. J. Geogr. Inf. Sci. 2023, 37, 1236–1263. [Google Scholar] [CrossRef] [Scilit]
- Hasan, F.; Liu, J.; Liu, X. Hybrid CA–Deep Learning Model for 3D Urban Growth Simulation. Trans. GIS 2025, 29, e70139. [Google Scholar] [CrossRef] [Scilit]
- Myrdal, G. Economic Theory and Underdeveloped Regions; Gerald Duckworth: London, UK, 1957. [Google Scholar]
- Benedek, J.; Moldovan, A. Economic convergence and polarization: Towards a multi-dimensional approach. Hung. Geogr. Bull. 2015, 64, 187–203. [Google Scholar] [CrossRef] [Scilit]
- Ionescu-Heroiu, M.; Cristea, M.; China, A.M.; Butacu, B.C.; Dolean, B.E.; Vinţan, A.D.; Franţ, O.; Mihăilescu, G.M.; Moldovan, S.C.; Sfârlea, E.V. Romania Catching-Up Regions: Metropolitan Romania; World Bank: Washington, DC, USA, 2019; Volume 145528, pp. 1–91. [Google Scholar]
- Cristea, M.; Mare, C.; Moldovan, C.; China, A.M.; Farole, T.; Vințan, A.; Park, J.; Garrett, K.P.; Ionescu-Heroiu, M. Magnet Cities: Migration and Commuting in Romania (English); World Bank Group: Washington, DC, USA, 2017. [Google Scholar]
- Holobâcă, I.-H.; Benedek, J.; Ursu, C.-D.; Alexe, M.; Temerdek-Ivan, K. Ratio of Land Consumption Rate to Population Growth Rate in the Major Metropolitan Areas of Romania. Remote Sens. 2022, 14, 6016. [Google Scholar] [CrossRef] [Scilit]
- Benedek, J.; Varvari, Ş.; Litan, C.M. Urban growth pole policy and regional development: Old wine in new bottles? In Regional and Local Development in Times of Polarisation: Re-Thinking Spatial Policies in Europe; Lang, T., Görmar, F., Eds.; Springer Nature: Singapore, 2019; pp. 173–195. [Google Scholar] [CrossRef] [Scilit]
- Eva, M.; Cehan, A.; Corodescu-Roșca, E.; Bourdin, S. Spatial patterns of regional inequalities: Empirical evidence from a large panel of countries. Appl. Geogr. 2022, 140, 102638. [Google Scholar] [CrossRef] [Scilit]
- Egyed, I.; Zsibók, Z. Exploring firm performance in Central and Eastern European regions: A foundational approach. Hung. Geogr. Bull. 2023, 72, 257–285. [Google Scholar] [CrossRef] [Scilit]
- Ivan, K.; Holobâcă, I.-H.; Benedek, J.; Török, I. VIIRS Nighttime Light Data for Income Estimation at Local Level. Remote Sens. 2020, 12, 2950. [Google Scholar] [CrossRef] [Scilit]
- Romanian National Institute of Statistics. Available online: http://statistici.insse.ro:8077/tempo-online/ (accessed on 15 November 2022).
- European Environment Agency (EEA). High Resolution Layer, Imperviousness, Status Maps-Imperviousness Density. 2015. Available online: https://land.copernicus.eu/pan-european/high-resolution-layers/imperviousness/status-maps (accessed on 20 November 2022).
- Geofabrik. Open Street Map—Romania Latest Free. 2022. Available online: https://download.geofabrik.de/europe/romania.html (accessed on 10 November 2022).
- European Environment Agency (EEA). EU-DEM (Raster)—Version 1.1. 2016. Available online: https://sdi.eea.europa.eu/catalogue/srv/api/records/3473589f-0854-4601-919e-2e7dd172ff50 (accessed on 21 November 2022).
- Ministry of Environment. GIS Data. 2015. Available online: http://www.mmediu.ro/articol/date-gis/434 (accessed on 15 November 2022).
- NASA Earth Data—Socioeconomic Data and Applications Center (SEDAC). Gridded Population of the World, Version 4 (GPWv4): Population Density, Revision 11. Available online: https://earthdata.nasa.gov/data/catalog/sedac-ciesin-sedac-gpwv4-popdens-r11-4.11 (accessed on 28 February 2026).
- National Trade Register Office (NTRO). 2021. Available online: www.onrc.ro (accessed on 1 June 2021).
- European Commission. European Observatory for Clusters and Industrial Change. 2020. Available online: https://op.europa.eu/mt/publication-detail/-/publication/6e791ca2-fae0-11e9-8c1f-01aa75ed71a1/language-en (accessed on 28 February 2026).
- Banks, E. Information Processing and Transmission in Cellular Automata. Ph.D. Thesis, Massachusetts Institute of Technology, Cambridge, MA, USA, 1971. [Google Scholar]
- Sullivan, A.L. Wildland surface fire spread modelling, 1990–2007. 3: Simulation and mathematical analogue models. Int. J. Wildland Fire 2009, 18, 387–403. [Google Scholar] [CrossRef] [Scilit]
- Silvertown, J.; Holtier, S.; Johnson, J.; Dale, P. Cellular Automaton Models of Interspecific Competition for Space—The Effect of Pattern on Process. J. Ecol. 1992, 80, 527–533. [Google Scholar] [CrossRef] [Scilit]
- Wolfram, S. Cellular automaton fluids 1: Basic theory. J. Stat. Phys. 1985, 45, 471–526. [Google Scholar] [CrossRef] [Scilit]
- Batty, M. Urban Evolution on the Desktop: Simulation with the Use of Extended Cellular Automata. Environ. Plan. A 1998, 30, 1943–1967. [Google Scholar] [CrossRef] [Scilit]
- Gardner, M. The fantastic combinations of John Conway’s new solitaire game “life”. Sci. Am. 1970, 223, 120–123. [Google Scholar] [CrossRef] [Scilit]
- Bak, P. How Nature Works: The Science of Self-Organized Criticality; Copernicus: New York, NY, USA, 1996; -4. [Google Scholar]
- Török, I.; Benedek, J.; Gómez-Zaldívar, M. Quantifying Subnational Economic Complexity: Evidence from Romania. Sustainability 2022, 14, 10586. [Google Scholar] [CrossRef] [Scilit]
- Akiba, T.; Sano, S.; Yanase, T.; Ohta, T.; Koyama, M. Optuna: A next-generation hyperparameter optimization framework. In Proceedings of the 25th ACM SIGKDD International Conference on Knowledge Discovery & Data Mining (KDD ’19), Anchorage, AK, USA, 4–8 August 2019; ACM: New York, NY, USA, 2019; pp. 2623–2631. [Google Scholar] [CrossRef] [Scilit]
- Chávez, J.C.; Mosqueda, M.T.; Gómez-Zaldívar, M. Economic Complexity and Regional Growth Performance: Evidence from the Mexican Economy. Rev. Reg. Stud. 2017, 47, 201–219. [Google Scholar] [CrossRef] [Scilit]
- Balassa, B. Trade Liberalisation and Revealed Comparative Advantage. Manch. Sch. Econ. Soc. Stud. 1965, 33, 99–123. [Google Scholar] [CrossRef] [Scilit]
- Hartmann, D.; Guevara, M.R.; Jara-Figueroa, C.; Aristaran, M.; Hidalgo, C.A. Linking Economic Complexity, Institutions, and Income Inequality. World Dev. 2017, 93, 75–93. [Google Scholar] [CrossRef] [Scilit]
- Lee, K.K.; Vu, T.V. Economic complexity, human capital and income inequality: A cross-country analysis. Jpn. Econ. Rev. 2020, 71, 695–718. [Google Scholar] [CrossRef] [Scilit]
- Hausmann, R.; Hidalgo, C.A.; Bustos, S.; Coscia, M.; Simoes, A.; Chung, S.; Jimenez, J.; Simoes, A.; Yildirim, M.A. The Atlas of Economic Complexity: Mapping Paths to Prosperity, 1st ed.; MIT Press: Cambridge, MA, USA; London, UK, 2011; pp. 1–71. [Google Scholar]
- Ursu, C.-D.; Benedek, J. Evolution of Built Surfaces Based on Copernicus High Resolution Layers. The Case of Growth Poles-Based Metropolitan Areas, Romania. J. Settl. Spat. Plan. 2022, 13, 45–59. [Google Scholar] [CrossRef] [Scilit]
- Romanian Parliament. Law No. 350/2001 Regarding Territorial Development and Urban Planning. 2001. Available online: https://legislatie.just.ro/Public/DetaliiDocumentAfis/29453 (accessed on 10 October 2023). (In Romanian)

Disclaimer/Publisher’s Note: The statements, opinions and data contained in all publications are solely those of the individual author(s) and contributor(s) and not of MDPI and/or the editor(s). MDPI and/or the editor(s) disclaim responsibility for any injury to people or property resulting from any ideas, methods, instructions or products referred to in the content. |
© 2026 by the authors. Licensee MDPI, Basel, Switzerland. This article is an open access article distributed under the terms and conditions of the Creative Commons Attribution (CC BY) license.