


Abstract
Rapid urbanization-induced extreme rainstorms severely disrupt social functions. Previous research often focused on “de-densification” strategies, which are difficult to adapt to high-density Sponge City Stormwater Management Units (SMUs) that carry core development functions. This study uses Shenzhen as a case study, utilizing Keep movement big data as a “social sensor” for system function perception and introducing the Socio-Ecological-Technological Systems (SETS) theory to construct a “recovery (RCN)–resistance (MI)” binary assessment framework. Through systematic clustering and hierarchical regression models, the driving mechanisms of blue landscape patterns, topography, road networks, and the built environment on social behavioral resilience are systematically parsed. The results show: (1) Road network morphology dominates resistance, while multi-dimensional elements collaborate for recovery. Resistance (MI) is primarily dominated by macro road network detour resistance (TPD2000, β = 0.956), while recovery depends on the synergistic support of blue space interspersion (Blue_IJI), topography, and micro-circulation road networks. (2) Green infrastructure fails in the model due to efficiency bottlenecks, empirical evidence of weakened regulation caused by green space fragmentation in ultra-high-density environments. (3) Low-density, eco-centric built environments provide dual synergistic gains for resilience. Based on this, a “Bidirectional Socio-Ecological Resilience Needs Pyramid” model is constructed, identifying four governance types such as the “Synergistic Balanced Type”. This study provides a quantitative basis for the transition from administrative control to precise morphological governance in high-density cities.
1. Introduction
In the global context of climate change and frequent extreme rainstorms, high urban density is frequently cited as a primary driver of urban vulnerability. Previous mainstream studies almost unanimously regarded the high-density built environment as the root cause of urban vulnerability. Fereshtehpour and Najafi (2025) pointed out in their global rainwater resilience review that current adaptation strategies urgently need to be integrated, and high-density environments are often the greatest obstacle to enhancing resilience [1]. Specifically, the empirical research by Wang et al. (2024) emphasizes that high-intensity physical development inevitably leads to the spread of impervious surfaces, cutting off the natural hydrological cycle and thereby significantly increasing the risk of urban flooding [2]. Meanwhile, Chen et al. (2012) and Yang et al. (2025) found through quantitative analysis of sky openness (SVF) that tall and dense architectural forms hinder heat dissipation [3,4]. This leads to a vicious spatial superposition of the heat island effect and flood risk.
However, this academic ideal of “de-densification” faces severe challenges in practical management systems. Xu et al. (2020) pointed out that the delineation of environmental management units in China is still primarily based on administrative boundaries and macroeconomic demands rather than refined hydrological processes [5]. As confirmed by Zhang et al. (2025) in their study on construction land supply, these designated management units are precisely the core areas with the highest investment intensity, carrying the mission of high-quality urban development [6]. This creates a significant paradox: management units are delineated in high-density areas based on development needs, yet the guiding management theories demand “low density” by criticizing density itself. Since “high density” is inseparable from these core units, the urgent question we need to answer is not “whether to have density,” but rather: “Under the prerequisite of necessary high density, what combination of spatial morphological factors can balance both development and safety?”.
Enhancing urban stormwater resilience requires a systematic consideration of the interaction between natural backgrounds and artificial systems. As emphasized by Ghofrani et al. (2017), blue landscapes serve as natural carriers for stormwater regulation; the integrity and connectivity of their patterns (e.g., low fragmentation) form the ecological foundation for enhancing surface infiltration and delaying runoff concentration [7]. In contrast, O’Donnell et al. (2021) pointed out that gray infrastructure (such as road networks and underground pipe systems), acting as the city’s “artificial veins,” directly determines the capacity for rapid collection and discharge of rainwater, providing the engineering guarantee for maintaining basic functions under rainstorm impacts [8]. Research indicates that blue and gray systems exhibit significant complementary characteristics, where blue landscapes effectively alleviate the peak pressure on gray systems [8,9]. However, in ultra-high-density units, constrained by the “Green Space Paradox” [10], blue and gray infrastructures with stronger morphological rigidity play a dominant role in maintaining system resilience.
Previous studies have extensively explored the impact of the built environment on physical activity under normal conditions. For instance, in Bangkok, increasing park proximity through the “15 min park policy” significantly improved residents’ exercise levels and health well-being [11]. However, extreme environmental stressors (such as extreme temperatures or rainstorms) significantly alter this relationship. Ho et al. (2023), in a study on subtropical Chinese cities, found that extreme temperatures lead more than one-third of residents to significantly reduce outdoor physical activity, a decline moderated by socio-demographic characteristics and health conditions [12]. Wu (2025) further proposed that under climate change pressure, the “resilient design” of street network structures and facility layouts is more effective than simple accessibility in maintaining activity continuity [13].
To scientifically assess this “real resilience,” this study moves beyond a reliance on static physical indicators and introduces the Socio-Ecological-Technological Systems (SETS) theoretical framework. The SETS framework views the city as a complex driven by technological systems (lifeline security provided by gray infrastructure like road networks), ecosystems (natural regulation capacity afforded by blue-green spaces), and social systems (functional status characterized by human behavioral responses). Under this perspective, the recovery (RCN) and resistance (MI) of sports and recreational activities during rainstorms are not merely behavioral metrics, but sensitive “social sensors” perceiving the overall operational state of the SETS.
Currently, accurately quantifying social behavioral responses under extreme weather still faces data bottlenecks. Although data from crowdsourced fitness applications (e.g., Keep) exhibit a demographic bias toward younger populations, this “sample specificity” constitutes the core advantage for resilience assessment in this study: the goal of resilience measurement is not a population census, but to capture the subtle functional evolution curve through the most environment-sensitive “Pro-samples.” Active Keep users are highly sensitive to environmental changes such as surface friction and slipperiness, providing a complete data gradient from “baseline–decay–minimum–recovery.” In contrast, groups such as the elderly often exhibit a complete cessation of behavior during disasters (zero-samples), making it difficult to characterize the refined evolution of resilience through statistical testing.
Based on this, this study performs a re-clustering and typological identification of Shenzhen’s Sponge City Management Units (SMUs) based on the “morphology-resilience” relationship. This approach aims to explore which combinations of three-dimensional morphology can maximize the retention of social vitality and stormwater resilience while maintaining development intensity, thereby providing a basis for the transition from administrative-oriented “one-size-fits-all” control to “precise morphological governance”.
2. Theoretical Framework
2.1. Hierarchical Response Logic Based on the SETS Framework
This study adopts the Socio-Ecological-Technological Systems (SETS) as the core theoretical framework to decode the response mechanisms of urban systems under extreme rainstorm disturbances. Recent scholars have further pointed out that a purely physical perspective is no longer sufficient to address complex urban flooding risks; planning theories must be integrated with the SETS framework to identify social equity and system balance mechanisms within non-engineering measures [14]. Breaking away from the singular physical or ecological perspectives in traditional research, this framework establishes a synergistic resilience logic across three levels:
Technological System: Corresponds to gray infrastructure such as macro road networks. Serving as the “bottom-line defense layer,” its core task is to maintain survival baselines and essential mobility under extreme disturbances, acting as the primary source of resistance (MI).
Ecological System: Corresponds to blue landscape patterns and topography. As the “functional regulation layer,” it determines the efficiency of the system’s “bounce back” from interference through natural infiltration and detention functions, providing the physical foundation for recovery (RCN).
Social System: Corresponds to sports and recreational activity trajectories. The dynamic changes in human behavioral needs—ranging from basic safety to high-level functional integration—serve as key indicators for measuring the overall functional evolution of the SETS.
From this perspective, the city is not merely a carrier for material and energy metabolism [15], but a place that satisfies multi-level human needs. This logic echoes the classic view of ecosystem service assessment, suggesting a hierarchical correspondence between human needs (safety, belonging, and self-actualization) and the regulatory and cultural services provided by ecosystems [16]. Such hierarchical decision-making logic has been applied in environmental management, such as integrating hierarchical needs with hydrological–environmental management to coordinate land planning [17], or serving as a framework for methodological evolution in ecological footprint assessment [18]. Therefore, the stormwater resilience of an urban system is essentially the evolutionary process of the system’s ability to maintain and restore its multi-level functional needs under extreme disturbance. By integrating the baseline support of the technological system, the functional regulation of the ecological system, and the demand response of the social system, this study aims to identify the morphological synergistic mechanisms that balance development intensity and social vitality in high-density contexts.
2.2. Performance Perception and the “Pro-Sample” Logic
Accurately quantifying resilience performance during catastrophic events requires highly sensitive proxy indicators. Running trajectories act as a high-resolution “social sensor” with extreme sensitivity to environmental stress. While data from crowdsourced fitness applications (e.g., Keep) exhibit a demographic bias toward younger active populations, this constitutes a methodological advantage for resilience measurement. The core objective of resilience assessment is not a population census but capturing the “functional evolution curve” under extreme pressure. Compared to “zero-sample” groups (such as the elderly) who often completely cease activities during disasters due to safety concerns or physical limitations, active Keep users provide a complete behavioral gradient from “baseline–decay–minimum–recovery”.
This data gradient forms the statistical basis for constructing performance evolution curves and identifying morphological friction. Distinct from accessibility studies under normal conditions, this framework focuses on identifying how morphological features support or inhibit social vitality under extreme “pressure tests,” thereby providing a quantitative basis for “precise morphological governance”.
3. Materials and Methods
3.1. Basis for the Construction of the Resilience Evaluation Index System for Sports Recreation
This study constructs an indicator system aiming to precisely analyze the resilience support mechanism of spatial forms in the Stormwater Management Units (SMUs) for human recreational behaviors from the perspective of “society–ecology” coupling (Table 1). In the dimension of the dependent variable, different from traditional hydrodynamic simulations, this study refers to the theoretical frameworks of Social Sensing and resilience assessment proposed by Lu et al. [19], and selects MI and RCN based on real trajectory data from Keep (Beijing Calorie Information Technology Co., Ltd., Beijing, China; https://www.gotokeep.com/) to quantitatively characterize the “real travel resilience” under rainstorm stress. All spatial calculations and data cleaning were implemented using ArcGIS Pro (v3.0, Esri, Redlands, CA, USA) and Python (v3.11, Python Software Foundation, Wilmington, DE, USA). In the dimension of the independent variable, it follows the systematic framework of “natural background–infrastructure–built environment”: First, based on the landscape ecology and hydro-geomorphic mechanisms elaborated by Ghofrani et al. [7] and Palazzo [20], blue landscape pattern and Elevation Features are selected as the basic physical constraints determining the storage and confluence paths. Second, according to the gray infrastructure theory of O’Donnell et al. [8], road network topology is selected to represent the emergency transportation and distribution efficiency within the unit. Finally, drawing mainly on the three-dimensional spatial form research of Gao & Zhao [21], Floor Area Ratio (FAR), Building Density (BD), and Mean Building Height (MBH) are integrated into a core indicator group representing the “runoff generation pressure” and “vulnerability of disaster-bearing bodies” of the high-density built environment, thus forming a set of scientific and systematic morphological assessment criteria for stormwater resilience.
Table 1.
Literature basis for variable selection in stormwater resilience assessment.
3.2. Overview of the Study Area
This study selects the Stormwater Management Units (SMUs) in Shenzhen as the basic analysis units, primarily because they serve as key spatial carriers for the coordinated implementation of “policy-engineering-management”. Under the background of high-density urbanization, this scale offers a clear policy foundation, systematic integration advantages, and research feasibility.
As pointed out by Li et al. (2024) and Leng et al. (2024), Shenzhen is a typical high-density coastal city [22], facing severe rainstorm and flood risks [23]. To address these challenges, Shenzhen has actively promoted Sponge City construction and established SMUs as core implementation and control units (Figure 1). The selection of this scale is supported by multiple factors:
Figure 1.
The study area (the blue area within the red border).
Policy and Management Level: The “Regulations of Shenzhen Municipality on the Administration of Building Sponge City” and the “Shenzhen Sponge City Construction Special Plan and Implementation Plan (Optimized)” demarcated 27 key areas as specific implementation carriers with corresponding construction goals and control indicators (Detailed information on key Sponge City construction areas in Shenzhen is provided in Appendix A (Table A1)). Academic Research and Planning Practice: Studies generally support systematic integration and differentiated governance at the meso-scale indicators (the literature and policy basis supporting the selection of SMUs are summarized in Appendix A (Table A2)). Zevenbergen et al. (2018) advocated for differentiated stormwater management strategies across different urban areas [24]; Che et al. (2010) emphasized the synergy between natural and artificial systems on a larger scale [25]; and Zhang et al. (2018) proposed the functional layout of “blue-green-gray” systems at the meso-scale [26].
The SMUs align precisely with these concepts, effectively integrating blue landscape patterns, gray infrastructure (road and pipe networks), and urban building forms to realize the collaborative coupling of “natural-artificial” systems. Notably, these 27 units cover all statutory units defined in Shenzhen’s current Sponge City planning (Total Population). In research targeting ultra-high-density global cities (such as Tokyo) or specific policy boundaries, full-sample analysis based on administrative units is a recognized research paradigm. For instance, Xiao et al. (2026) adopted an administrative unit-based path when studying Tokyo’s morphological response to extreme stress, proving that Policy Validity takes precedence over a simple increase in sample size [27]; similarly, Asadollahi et al. (2025) provided precise guidance for urban planning in Ahvaz, Iran, based on only 8 administrative districts (n = 8) [28]. This “small sample, full coverage” approach ensures consistency between spatial analysis and administrative boundaries, making research conclusions more practically actionable.
More importantly, land development in Shenzhen has reached a stage of “extreme spatial saturation”. According to a quantitative threshold analysis of 21 Asian megacity centers, Shenzhen’s morphological intensity ranks among the highest, with its construction land scale essentially touching the Development Threshold. Due to severe land scarcity, Shenzhen’s urbanization rate has exceeded 99%, with the remaining large-scale green spaces predominantly consisting of mountainous terrain. This ultra-high-intensity built environment makes Shenzhen an ideal “extreme case” for observing the conflict between high-intensity development and stormwater safety resilience. To clearly define the global reference value of this study, we benchmarked Shenzhen against cities facing similar restrictive elements (Table 2): for example, Hong Kong is limited by natural terrain thresholds, while Bangkok is constrained by linear aggregation forms caused by water systems and infrastructure.
Table 2.
Comparison of morphological restrictive elements in typical high-density Asian city centers.
In addition, this study selects the “extraordinary rainstorm exceeding historical records” that Shenzhen City encountered in September 2023, which was comprehensively reviewed by Song et al. (2024). This event broke multiple historical rainfall extremes and caused severe flood disasters [29]. This extreme event provides a typical and challenging empirical scenario for exploring the real impact of rainstorm disturbances on urban physical activity (PA). This study selects the five days before and after this rainstorm event (from 3 to 12 September 2023) as the analysis window. This period fully covers the key stages of “baseline–disturbance–recovery” of the disaster event and has complete process representativeness.
3.3. Research Framework
This study constructs a systematic analytical framework to reveal the influence mechanism of Urban Morphology on the stormwater resilience of physical activity (PA) layer by layer. First, the study integrates multi-source data such as Keep physical activity (PA), land cover, elevation, and buildings to construct a standardized spatial database (Figure 2a). Based on the dynamic changes in activity intensity before and after rainstorm events, the resilience performance curve is plotted, and the core indicators of MI and RCN are quantitatively extracted (Figure 2b). Then, systematic clustering is used to classify the built environment into high-, medium-, and low-density types, which are incorporated as control variables into the Hierarchical Regression Analysis model (Figure 2c). Subsequently, through the Hierarchical Regression Analysis model, variables are gradually introduced from the natural background (blue landscape, topography) to the artificial system (road network, Building Type), and the differential influence mechanisms of various morphological elements on different resilience indicators are systematically analyzed to verify the element support of “basic safety” and “system integration”. Finally, a multi-indicator combined boxplot is constructed based on the regression results, and a resilience spatial type map is drawn. The statistical conclusions are translated into planning types corresponding to different resilience requirement levels, providing a visualization tool for differential intervention.
Figure 2.
Systematic analytical framework: (a) Construction of the standardized spatial database from multi-source data; (b) Quantitative extraction of resilience indicators (MI and RCN) via performance curves; (c) Built environment classification and the Hierarchical Regression Analysis model structure.
3.4. Data Sources and Preprocessing
This study utilized running trajectory data retrieved from the Keep platform, spanning from 3 to 12 September 2023. Through spatial filtering via geofencing and a velocity threshold algorithm, 2954 high-confidence core trajectories were extracted from an original dataset of 9699. Statistical analysis indicates a robust distribution across 27 spatial units, with a mean of 109.4 trajectories per unit (median: 86), and over 85% of the units carrying more than 40 trajectories.
Methodologically, this research adopts a “pro-sample” detection logic. Although Keep users exhibit a demographic bias toward younger populations, they function as highly sensitive “social sensor” capable of providing a complete data gradient from “attenuation” to “rebound”. The advantage of this specific sample lies in its ability to effectively isolate the “morphological friction” exerted by environmental disturbances on social vitality. This approach circumvents the statistical challenge of “zero-sample” scenarios, where the complete cessation of behavior by general citizens due to risk avoidance would otherwise hinder the construction of a resilience evolution model. To ensure data reliability, the velocity threshold method (retaining the 4–15 km/h running range) was applied to eliminate vehicular drift, while geofencing excluded indoor exercise interference, thereby ensuring the purity of “high-confidence data” in its response to the outdoor physical environment. It should be noted that these 27 SMUs constitute the statutory total population of management units defined by the Shenzhen Sponge City Master Plan within the study area, rather than a randomly selected sample. This ‘total population’ approach for policy-defined spatial units is a recognized paradigm in urban governance research, as seen in studies analyzing finite administrative entities such as the EU-27 member states [30] or specific metropolitan districts (n = 8) [28].
In the dimension of independent variables, the calculation process also exhibits extremely high complexity and resolution, encompassing massive data operations ranging from natural backgrounds to artificial environments. The blue landscape indicators are calculated through refined ecological pattern operations based on SinoLC-1 data with a super-high resolution of 1 m. The building environment indicators are obtained by calculating the three-dimensional morphological parameters (density, Floor Area Ratio, height) of tens of thousands of individual buildings in the region one by one based on Baidu Map vector data and then performing spatial aggregation. The terrain features are extracted from a digital elevation model (DEM) with a resolution of 30 m, ensuring pixel-level accuracy in hydrological terrain analysis. The road network indicators are derived from multi-scale complex topological analysis of tens of thousands of road segments across the entire area using the sDNA (version 4.1, Cardiff University, Cardiff, UK) model based on OpenStreetMap. To ensure validity during the data generation process, all external vector datasets underwent topological error correction and alignment with a unified coordinate system. For instance, the SinoLC-1 land cover data was cross-verified with high-resolution remote sensing imagery for accuracy validation. Simultaneously, the sDNA road network model employed a “fully connected network” pre-processing approach to eliminate interference from “isolated road segments”—caused by inconsistent data sources—on the TPD calculations.
3.5. Data Standardization and Index System Construction
3.5.1. Data Standardization
To address the diverse scales and units in the dataset, we implemented targeted standardization strategies. Variables that were not standardized among continuous variables underwent Z-score standardization, while bounded variables were processed using the min–max scaling method [19]. Standardization ensured data compatibility while preserving important statistical characteristics.
represents the data values to be evaluated, represents the population mean, and represents the population standard deviation.
3.5.2. Resilience Assessment Framework and Quantitative Indicators
Resilience refers to the ability of a system to absorb, adapt, and transform when disturbed while maintaining its core functions, which is crucial for the sustainable recovery of urban physical activity (PA) [31]. This study draws on the comprehensive framework proposed by Lu et al. (2025) for evaluating the resilience of electric vehicle charging networks [19]. In this study, the core logic of this framework is creatively applied to the analysis of the social-ecological system of physical activity (PA), and a dedicated evaluation model is constructed. This framework defines resilience as the entire process of the system’s performance evolution during a disturbance event and visually depicts it through the resilience curve. Its core advantage lies in the ability to separately quantify the system’s performance in the two dimensions of resistance and recovery [31,32].
In the resilience curve diagram (Figure 3), the red solid line represents the curve of the actual number of runners in the study area from 3 to 12 September 2023, and the red dashed line represents the theoretical recovery curve after the disaster. It is worth noting that the actual recovery level of physical activity (PA) significantly exceeded the pre-disaster baseline value during some periods. This “excessive recovery” phenomenon is formally identified in resilience assessment as the “Rebound Effect.” While the temporal overlap between the recovery period (9–10 September) and the weekend may have contributed to a portion of the vitality increment, this supra-baseline rebound more fundamentally reflects a “compensatory recall” of social behavior within urban spaces. Specifically, the outdoor exercise demand suppressed during extreme weather events was intensively discharged once environmental pressures were released. Furthermore, the statistical surplus in recovery confirms that these spatial units possess not only the capacity to return to their original state under extreme disturbances but also the systemic resilience to trigger an overflow of social vitality.
Figure 3.
Resilience curve.
The resilience assessment based on the system performance curve emphasizes the overall disaster resistance, recovery, and adaptability of the system. It typically measures the comprehensive resilience of the system by calculating the functional losses during disasters [31,33]. Based on this framework, this study selects and defines two core resilience indicators: resistance and recovery. To ensure the transparency of the calculations, the research follows a three-step quantification process: first, the baseline performance (B) is established based on the average activity during the four days preceding the rainstorm; second, the drop depth at the peak of the disturbance is captured via ; finally, Simpson’s rule is employed to calculate the area between the performance curve and the baseline (TPL), from which the recovery indicator (RCN) is derived. This process translates qualitative behavioral fluctuations into comparable mathematical parameters.
Resistance is quantified by the Maximum Impact (MI). This indicator is derived from the research on infrastructure resilience and is used to measure the maximum performance loss that a system can withstand under disturbances [34]. Its calculation formula is:
The benchmark performance B is defined as the average level during the stable period before the heavy rain (3–6 September). P() denotes the minimum value of the performance function during the rainstorm and identifies the time at which performance is lowest. designates the time point at which system performance reaches its overall minimum during the disturbance, namely 7 September 2023. As described by Lu et al. [19], “The maximum impact quantifies the severity of the damage by measuring the difference between the Baseline Performance and the lowest performance value.” A smaller MI value indicates a stronger resistance of the system, meaning a lower degree of functional impairment under the impact of the rainstorm.
In the formula, RCN denotes Recovery Capacity. TPL (Total Performance Loss) is the principal integrative index in resilience curve analysis, defined as the area between the performance curve and the baseline from the onset of disruption to the completion of recovery. It therefore quantifies the system’s total functional deficit over the entire event period [19,31]. Its calculation is based on the integral principle:
Among them, represents the start time of the interference (6 September 2023), and represents the time when the system recovers to stability (10 September 2023). As pointed out by Lu et al. [19], “TPL is a key indicator for measuring the degree of system performance degradation during extreme events.” On this basis, we define Recovery Capacity as:
The theoretical basis for this definition lies in that for a system with high resilience, its performance degradation should be as small as possible, and its recovery should be as fast as possible, which is jointly reflected in the decrease in the TPL value [35]. Therefore, the larger the RCN value is, the stronger the comprehensive recovery of the system is, that is, the more prominent its ability to “bounce back” from disturbances and reduce the overall functional loss is.
In summary, through the two indicators of MI and RCN, this study can accurately and comprehensively evaluate the static resistance and dynamic recovery capabilities of each Stormwater Management Units (SMUs) when facing extreme rainfall from the two dimensions of “depth of impact” and “overall recovery efficiency”, respectively.
3.5.3. Quantitative Indicators of Morphological Elements
This study constructed a multi-dimensional morphological indicator quantification system (Table 3), with variable selection strictly adhering to OLS significance tests and multicollinearity diagnostics (VIF < 5). During the pre-screening phase, green infrastructure indicators (e.g., NDVI) were excluded due to minimal spatial variance and non-significant regression (p > 0.1) in high-density environments, thereby avoiding overfitting and collinearity interference. The final core variables encompass four dimensions:
Table 3.
Types of morphological indicators.
Blue Landscape Patterns: The Interspersion and Juxtaposition Index (Blue_IJI) was selected to measure the adjacency complexity between water bodies and other patches; high values represent frequent spatial interweaving, which tends to increase risk exposure.
Topographic Characteristics: The median elevation (DEM_MEDIAN) was adopted as a fundamental physical constraint for runoff collection and drainage efficiency.
Road Network Morphology: TPD2000 and DivE (200/800) were introduced to quantify detouring levels and transport resistance; high values reflect low topological efficiency, serving as core bottlenecks that restrict accessibility during disasters.
Built Environment: Floor Area Ratio (FAR), Building Density (BD), and Mean Building Height (MBH) were utilized to characterize development intensity and surface imperviousness, which determine runoff pressure and the vulnerability of disaster-bearing bodies.
This indicator system systematically reveals the differentiated driving mechanisms of the “Natural Substrate–Infrastructure–Building Integration” framework on functional loss (MI) and Recovery Capacity (RCN).
3.6. Research Methods
This study adopts Sequential Morphological Typology Analysis as its core methodology to systematically reveal the driving mechanisms of Urban Morphology on the stormwater resilience of physical activity (PA). Anchored in the Socio-Ecological-Technological Systems (SETS) theoretical framework, this approach transcends mere statistical modeling; it represents a spatial analysis paradigm that translates SETS logic into a three-dimensional design language. By deconstructing complex Urban Morphology into the theoretical hierarchy of “Natural Substrate–Infrastructure–Built Environment,” the study observes the performance evolution of spatial resilience prototypes. Inspired by research on “Sponge Landscape” pattern recognition within morpho-typological pathways, this study employs a step-wise analytical approach. Through hierarchical regression models, variables are introduced layer by layer to align with the hierarchical influence mechanisms of the system. Concurrently, dynamic changes in explanatory power (R2) are utilized to effectively isolate the interactions of multi-dimensional factors, identifying their independent and synergistic contributions. Ultimately, spatial translation is achieved through a combination of multi-indicator boxplots and typological mapping, transforming statistical regularities into actionable planning and design tools.
3.6.1. Cluster Analysis
In this study, the Python 3.11 programming environment was employed, combined with libraries such as scikit-learn (1.3.0), pandas (2.0.3), numpy (1.24.3), and scipy (1.11.1), to conduct Cluster Analysis on building characteristic indicators (Building Density, Floor Area Ratio, Mean Building Height). First, the Z-score standardization method was used to standardize each indicator to eliminate the influence of dimensions and ensure consistent weights. Subsequently, three methods, namely K-means, hierarchical clustering, and weighted clustering, were respectively adopted for Cluster Analysis. The clustering effects were comprehensively evaluated using the Silhouette Score, Calinski–Harabasz Index, Davies–Bouldin Index, and uniformity indicators, and the optimal method was selected to generate the Building Type dummy variable. In the study, the number of clusters was determined by the elbow method, and the clustering performance was preliminarily evaluated based on the sum of squared errors (SSE).
The specific clustering process was as follows: For K-means clustering, the number of clusters was set to 3 (n_clusters = 3), and the random seed is set to 42 (random_state = 42). The classic Lloyd algorithm is used for iterative optimization. For hierarchical clustering, the AgglomerativeClustering algorithm is employed with the ward linkage method, and the number of clusters is also set to 3. This method gradually merges similar clusters based on the principle of variance minimization. Weighted clustering improves K-means based on feature importance. First, the absolute values of the correlation coefficients between each building indicator and the dependent variable (RCN/MI) are calculated. After normalization, these values are used as feature weights for data weighting. Subsequently, K-means clustering is performed on the weighted data.
In the evaluation of clustering effects, the silhouette coefficient is used to measure the compactness and separation of clustering results, and the closer the value is to 1, the better the effect. The uniformity index reflects the balance of the distribution of each type of sample by calculating the ratio of the standard deviation to the mean of the number of samples in each category. A larger value indicates a more uniform distribution. The results show that the hierarchical clustering method performs best in both the silhouette coefficient (0.3828) and the uniformity index (0.8429), indicating that it achieves relative balance in the number of samples of each category while maintaining intra-class compactness and inter-class separation, which is beneficial for subsequent statistical analysis (Figure 4).
Figure 4.
Evaluation and comparison of clustering methods.
3.6.2. OLS Hierarchical Regression Analysis
OLS is a modeling method used to evaluate the relationship between a dependent variable and multiple independent variables. It is necessary to gradually introduce multi-level independent variables into the OLS model, and finally introduce the core variable of the study into the model to examine the contribution of this variable to the regression equation after excluding the contributions of other variables [36]. The core of Hierarchical Regression Analysis is to examine the independent contribution of the newly added variable group to the dependent variable by gradually introducing variable blocks into the model. The following is the formula for a model with two levels, and the same principle applies to multi-level models:
In the first layer, control variables or basic variables are usually included:
Let be the dependent variable, be the intercept term, , ⋯ be the control variable at the first level, , , , be the regression coefficient of the first variable, and be the random error term.
In the second layer, on the basis of controlling the variables in the first layer, the core independent variables that are truly of concern are usually added:
, , , is the newly added core independent variable in the second layer. , , , is the regression coefficient of the new variable in the second layer. , , , indicates that the coefficients of the control variables may change on the basis of the model in the first layer.
The introduction sequence of variables strictly adheres to the Socio-Ecological-Technological Systems (SETS) theoretical framework, establishing a hierarchical logic from “natural substrate” to “human intervention” to clearly isolate the explanatory power of each systemic element:
Layer 1: Ecosystem Substrate (Models 1 and 5): The Blue Landscape Pattern index (Blue_IJI) is incorporated first. As the natural foundation of urban space, blue landscapes determine the initial characteristics of stormwater processes and serve as the fundamental physical constraint affecting the resilience of human behavior. Layer 2: Geographic Constraints (Models 2 and 6): Topographic characteristics (DEM_MEDIAN) are introduced next. Topography not only dictates runoff paths but also directly influences the travel resistance of residents during extreme weather events. Layer 3: Technological System Support (Models 3 and 7): Road network morphological indicators (DivE, TPD) are added. As the meso-scale element connecting natural substrates with artificial environments, the road network structure serves as the lifeline for maintaining social vitality during disasters. Layer 4: Social Form Integration (Models 4 and 8): Finally, building clustering dummy variables are included. The built environment is the most direct carrier of human activities; after controlling for natural and infrastructural factors, the regulatory efficacy of micro-spatial types on recreational activities can be accurately measured.
To ensure the robustness of model estimation given the small sample size (n = 27), rigorous multicollinearity diagnostics were performed for all models. Results indicate that the Variance Inflation Factors (VIF) for all selected variables range between 1.25 and 2.84, significantly below the strict threshold of 5.0, thereby effectively preventing parameter estimation failure. Although the number of units (n = 27) is constrained by statutory boundaries, the model demonstrates strong directional consistency and passes rigorous multi-collinearity diagnostics (VIF < 3.0). This aligns with the emerging consensus in spatial policy research that exploratory depth within finite, policy-relevant units provides valid evidence for urban planning interventions, particularly in hyper-dense Asian contexts [27]. Furthermore, sensitivity analysis—conducted by varying the entry order of variables—confirms that the current “Nature–Technology–Society” hierarchical path achieves the optimal balance between statistical significance and theoretical consistency, scientifically revealing the driving mechanisms of high-density Urban Morphology on human behavioral resilience.
4. Results
The results section of this study will be presented in a logical sequence of “from classification to association, from quantification to interpretation”. First, Cluster Analysis will be used to objectively classify the built environment in the study area, providing a typological basis for subsequent analyses. Then, the Hierarchical Regression Analysis model will be employed to precisely quantify the influencing mechanisms and contributions of blue landscapes, topography, road networks, and Building Type to each stormwater resilience indicator (RCN and MI). Based on this, multi-indicator combination boxplots will be used to intuitively reveal the differences and synergistic mechanisms in resilience performance under different combinations of elements. Finally, by integrating the conclusions from regression and boxplot analyses, a resilience spatial type map will be drawn to translate the statistical patterns into spatial types with clear planning guidance.
4.1. System Cluster Analysis
Through a comprehensive comparison of three methods: K-means, hierarchical clustering, and weighted clustering (evaluated by indicators such as silhouette coefficient and homogeneity index), the hierarchical clustering method was identified as the optimal solution. It achieved a relatively balanced sample size for each class while ensuring the compactness within classes and the separation between classes. The number of clusters was determined to be three using the elbow method (Figure 5).
Figure 5.
Hierarchical clustering dendrogram.
The final clustering results clearly divide the study area into three categories with significant differences in spatial development intensity (Figure 6a–d):
Figure 6.
Clustering results. (a) Represents the spatial distribution of the clustering results; (b) represents the proportion of the clustering results; (c) represents the 2D view of the clustering of two types of indicators (FAR, BD); and (d) represents the 3D view of the clustering of three types of indicators (FAR, BD, MBH).
High-density type (Cluster 2): It includes 10 units (37.0%), such as SZ Hi-tech Park (North) and Sungang-Qingshuihe Area. Its characteristic is “high density and low capacity”; that is, the Building Density is extremely high, but the Floor Area Ratio and building height are relatively low, reflecting the early intensive development model.
Medium-Density type (Cluster 0): It includes 7 units (25.9%), such as Futian Bonded Area and Houhai Central District. Its characteristic is “medium density and high capacity”, manifested as medium Building Density, high Floor Area Ratio, and high building height, which is a typical form of modern service industry and headquarters economy.
Low-density type (Cluster 1): It includes 10 units (37.0%), such as Shekou FTZ (Free Trade Zone), Qianhai Cooperation Zone, and Dameisha Area. It shows significantly low values in all three indicators. Most of these areas are ecological protection areas, parks, or undeveloped regions, representing the ecological low-density background.
To quantitatively analyze the effects of different categories on stormwater indices, this study incorporated the classification results as dummy variables into the regression model. By creating two variables, cluster_0 (representing Medium Density) and cluster_1 (representing low-density), and using the cluster_1 (high density) region as the reference baseline, the problem of multicollinearity in the model was effectively avoided [36] (Table 4).
Table 4.
Dummy variable settings for Building Type.
4.2. Results of Hierarchical Regression Analysis
To precisely quantify the impacts of each dimension of Urban Morphology and control the interactions among variables, this study constructed eight Hierarchical Regression Analysis models (Model 1–4 for RCN, Model 5–8 for MI). The introduction of model variables follows the logical hierarchy from the macro-natural background to the micro-artificial environment.
4.2.1. Regression Results of Recovery Capacity (RCN)
As shown in Table 5, with the gradual introduction of the variable layer, the explanatory power of the model for RCN continuously and significantly improved (the adjusted R2 increased from 0.2613 in Model 1 to 0.6806 in Model 4), indicating that recovery is a complex process jointly shaped by multi-dimensional features (Figure 7a).
Table 5.
Results of the OLS Hierarchical Regression Analysis model for RCN.
Figure 7.
(a) Evolution of adjusted R2 for Recovery Capacity (RCN) model; (b) evolution of adjusted R2 for Maximum Impact (MI) model.
The Interspersion and Juxtaposition Index of blue landscapes (Blue_IJI) exhibits a consistently significant negative impact on recovery (β = −1.017, p < 0.001). This suggests that a higher degree of interweaving between blue landscapes and the surrounding built environment is detrimental to the restoration of social vitality. An overly interspersed landscape pattern may facilitate the extensive penetration of stormwater pressure throughout the spatial fabric. The absence of large-scale ecological buffers for risk mitigation consequently suppresses the rapid resurgence of physical and recreational activities. Elevation (DEM_MEDIAN) also had a significant negative impact (β = −0.564, p < 0.001). Relatively high-altitude areas exhibited a slower recovery rate, which may be related to comprehensive factors such as slow soil moisture saturation in highlands, lagging vegetation recovery, and relatively sparse sports and recreational facilities.
Road network indicators exhibited significant scale effects. The small-scale road network diversity (DivE200) has a significant positive impact on recovery (β = 0.389, p < 0.05). This indicator represents the diversity of accessible opportunities within a 200 m travel cost. Its positive influence implies that a well-developed microcirculation road network can provide residents with more alternative routes and flexible short-distance activity spaces, thereby rapidly restoring local vitality after a disaster. In contrast, the medium-scale road network diversity (DivE800) shows a significant negative impact (β = −0.690, p < 0.01). This indicates that at the typical ‘neighborhood living circle’ scale of 800 m, an overly complex road network topology becomes a hindering factor for post-disaster vitality recovery. From the perspective of behavioral geography, a high DivE800 value usually means denser intersections and circuitous paths. In the slippery environment after heavy rain, this network complexity not only increases the potential risk of local waterlogging but also significantly enhances the ‘Environmental Friction’ of running behavior. Frequent street-crossing waits and traffic interruptions severely damage the coherence and safety experience required for medium- and long-distance running, thus significantly reducing residents’ willingness to resume outdoor sports and recreation at this scale.
After controlling for the above natural and infrastructure factors, low-density Building Type (cluster_hierarchical_1) showed a strong positive impact (β = 1.138, p = 0.001). This finding strongly confirms that the configuration of a low-density and ecological built environment itself is a key positive factor in enhancing recovery, supporting the theoretical hypothesis that the built environment indirectly promotes stormwater runoff absorption and activity recovery by altering the local microclimate and enhancing surface permeability.
From the perspective of the dynamic changes in the variable coefficients, the absolute value of the coefficient of Blue_IJI continuously increases from −0.538 in Model 1 to −1.017 in Model 4, indicating that after controlling for other dimensional features, the essential impact of the blue landscape pattern on recovery becomes more prominent. Meanwhile, DivE200 changes from marginally significant to statistically significant, further confirming the existence of complex interactions among multi-dimensional features.
4.2.2. Regression Results of Maximum Impact (MI)
As shown in Table 6, in Models 5 and 6, the adjusted R2 values are negative (−0.0068 and −0.0316), a statistical “nullity” that essentially reveals a “defense vacuum” within high-density urban areas under extreme pressure. This demonstrates empirically that, in the absence of infrastructural intervention, natural geographic elements (landscape and topography) possess almost no explanatory power in preventing the drastic decline of social activities. The lack of explanatory power conversely underscores the irreplaceability of technological systems (road networks). Subsequently, in Model 7, the introduction of road network variables leads to a non-linear leap in explanatory power (with R2 increasing to 0.5365). This significant turning point is not a random error but reveals the “threshold effect” of infrastructure as a “lifeline” in determining the system’s damage depth: the system’s resistance can only be effectively mobilized when the efficiency of the technological substrate is guaranteed (Figure 7b). Within the MI model, the low-density Building Type (cluster_hierarchical_1) exhibits a negative impact trend (β = −0.639). Since MI serves as a loss indicator, a negative coefficient signifies that this Building Type effectively reduces the depth of functional decline during disasters, thereby simultaneously enhancing the system’s resistance. This finding suggests that low-density, high-ecology architectural characteristics not only strengthen Recovery Capacity but also provide active support for resistance. This reveals a “synergistic effect” between multi-dimensional resilience indicators, rather than the trade-off relationship previously hypothesized.
Table 6.
Results of the OLS Hierarchical Regression Analysis model for MI.
4.3. Boxplot Analysis
To reveal the synergistic effects of urban morphological elements on physical activity (PA) resilience, this study employs a sequential clustering analysis. Rather than a blind superposition of multiple variables, this method strictly adheres to the logical sequence dictated by the Socio-Ecological-Technological Systems (SETS) theoretical framework. Such a “sequential” approach ensures methodological robustness when addressing complex coupled systems, as it allows for the clear identification of how variables at different hierarchical levels reshape the clustering structure upon entering the system.
Specifically, the analytical process is structured into four logical tiers: “Building Infrastructure Only” (Socio-Technical Integration), “Landscape Addition” (ecological regulation), “Topographic Superposition” (Natural Constraints), and “Road Network Integration” (Technological Support). This progressive analysis not only validates the findings of the hierarchical regression but also uncovers the underlying mechanisms of resilience through the spatial evolution of morphological prototypes. (Figure 8).
Figure 8.
Correspondence between the evolution of resilience types under multi-index combinations and the pyramid hierarchy: (a) boxplot of RCN distribution differences; (b) boxplot of MI distribution differences.
4.3.1. Multi-Index Combined Analysis of Recovery Capacity (RCN)
The multi-index clustering results of recovery reveal significant synergistic effects among factors and stage-wise trade-offs (Figure 8a). The analysis starts with building indicators, dividing the space into three categories: high-, medium-, and low-intensity development. Among them, the medium-intensity development type shows the optimal recovery foundation (median: 0.235).
After introducing the blue landscape pattern (Blue_IJI), the clusters were re-classified into types based on landscape fragmentation. The median of recovery in the Compact Development (low Blue_IJI) jumped to 0.393, while in the Scattered Development (high Blue_IJI), it dropped to −0.333. This confirms that the integrity and low fragmentation of the blue landscape are crucial positive factors promoting post-disaster recovery, which is logically consistent with the significant negative impact of Blue_IJI (β = −1.017) in the regression model.
When further overlaying the terrain elevation (DEM_MEDIAN) index, the analysis results show that the introduction of terrain elements has an optimization effect on the recovery pattern similar to that of the blue landscape pattern. The median recovery value of Midland Development remains at 0.393, exactly the same as that in the previous stage (Compact Development). This finding indicates that after controlling for building and landscape characteristics, moderate elevation conditions (Midland Development) and low landscape fragmentation (Compact Development) play equally important positive roles in promoting recovery. This ‘equilibrium state’ characterized by moderation and coordination in terms of building, landscape, and terrain elements statistically and precisely maps to the highest level of the aforementioned social-ecological resilience pyramid, the ‘water-city integration layer’, which maximizes the system’s recovery through the organic integration of multiple elements. Both can accelerate post-disaster vitality recovery by optimizing the local microclimate, enhancing surface permeability, or providing a more stable activity environment.
Ultimately, after introducing the key road network indicator (DivE800), the synergistic effects of the elements exhibited complexity. The median recovery of the high detour development type (high DivE800) decreased from 0.393 in the previous stage to 0.303, while that of the medium detour development type dropped to 0.250. This turning point indicates that at the medium scale of 800 m, a relatively high road network detour degree (DivE800), when combined with other elements (such as specific terrain and Building Density), may generate negative synergistic effects due to the exacerbation of the complexity of local rainwater confluence, partially offsetting the recovery advantages brought by the landscape and terrain, and revealing the non-linear effects under the combined action of multiple factors.
4.3.2. Multi-Index Combined Analysis of Maximum Impact (MI)
The multi-indicator progressive analysis of resistance (MI) reveals the dominant logic of the technological system, centered on the road network, in determining the depth of disturbance (Figure 8b). The analysis demonstrates that within the foundational damage pattern shaped by building intensity and natural substrates, the introduction of road network detouring resistance (TPD2000) triggers a significant differentiation in functional responses: “High-detouring development types” experience a near-total collapse of social vitality due to topological inefficiency (median MI reaches 0.973). In contrast, the substantially lower functional losses observed in “Medium- and High-accessibility development types” (0.095 and 0.318, respectively) empirically confirm that high-efficiency infrastructure serves as the “lifeline” for maintaining resistance and mitigating functional decline. This result not only provides a direct visual validation of the positive driving effect of road network resistance on functional loss identified in the hierarchical regression (β = 0.956) but also clarifies the practical value of optimizing road network morphology to reduce “morphological friction” and ensure that basic functions do not collapse in high-density environments.
In summary, the progressive analysis of boxplots not only intuitively validates the theoretical framework of the “recovery–resistance binary structure” but also precisely depicts the complex interactions during the element superposition process: landscape and topography have similar positive effects on enhancing recovery; while road network elements play entirely different and even conflicting roles at different spatial scales (DivE800 and TPD2000) and in different resilience dimensions (recovery and resistance).
5. Discussion
The nuanced distinction observed in this study—“road network-dominated resistance versus multi-dimensionally supported recovery”—profoundly reflects the operational logic of Urban Morphology across different disaster phases. Resistance (MI) manifests as a form of “rigid defense,” fundamentally constrained by the topological efficiency of the technological system (TPD2000). In contrast, recovery (RCN) functions as a form of “systemic synergy,” relying on the flexible regulation provided by the ecological substrate and the built environment (Figure 9). The discovery of this dual structure provides differentiated tools for Sponge City planning: enhancing resistance should prioritize optimizing the connectivity of “gray” road networks, whereas strengthening recovery requires the deep coupling of “blue-green-gray” spaces.
Figure 9.
(a) RCN Coefficient Value; (b) MI Coefficient Value.
5.1. Differential Mechanism of Multi-Dimensional Urban Morphology
The influence of Urban Morphology on the stormwater resilience of physical activity (PA) exhibits significant scale effects and stage dependence.
5.1.1. Scale Effect of Road Network and Lifeline Protection
The scale effect of the road network is the core evidence supporting the dual structure. The small-scale road network (DivE200) significantly promotes recovery by providing flexible microcirculation paths (β = 0.389, p < 0.05), which is consistent with the research consensus on promoting local vitality [5]. The absolute dominance of macro-scale road network detouring resistance (TPD2000) on functional loss (MI) underscores that road network topological efficiency is critical for preventing systemic collapse. The data reveals a “road network bottleneck effect”: for every unit increase in path detouring, the loss magnitude of physical and recreational activities expands significantly. This validates the role of the road network as lifeline infrastructure; its core contribution lies in reducing “morphological friction” during disasters through high-efficiency topological connections (low TPD values), thereby safeguarding the fundamental resistance of social functions. This is consistent with international recognition: although professionals appreciate the multi-functional benefits of blue-green infrastructure, they generally believe that gray infrastructure is indispensable for ensuring core flood control and drainage safety, and an integrated system is the optimal strategy [8]. This finding also echoes the assessment results of Li et al. [19] on regional climate resilience. Their research points out that although ecological resilience is crucial, the perfection degree of infrastructure is often the key “Obstacle factor” restricting the overall adaptability of the system [37]. This study further confirms through micro-behavior data that a well-developed road network infrastructure is the bottom-line guarantee for maintaining social functions (sports activities) during disasters.
5.1.2. Phased Differences Between Blue Landscapes and Terrain
The roles of blue landscapes and terrain show significant stage differences. The spatial interweaving logic of blue landscapes (Blue_IJI) exhibits a consistently significant negative effect throughout the entire stormwater process. During the disaster phase, highly interspersed patterns (high IJI) amplify the Maximum Impact (MI) by increasing the exposure surface of urban functions. Post-disaster, these fragmented patterns restrict recovery efficiency (RCN) due to the lack of centralized detention and storage spaces. These findings suggest that resilience governance in high-density urban areas should move away from pursuing fragmented “blue-green embellishments”. Instead, emphasis must be placed on the relative integrity of the blue skeleton and its centralized regulation capacity to mitigate the coupled disaster risks arising from the intense interweaving of water and urban fabrics. This indicates that the same spatial element may play different or even opposite roles throughout the entire process of stormwater management [19], suggesting that planning decisions must incorporate dynamic and process-based thinking.
5.1.3. “Blue Framework” and “Green Invisibility” Under High-Density Constraints
The statistical absence of green infrastructure indicators in this study is essentially an empirical conclusion derived from rigorous model testing. The introduction of NDVI in the preliminary models resulted in a regression coefficient approaching zero. This validates the “green space paradox” proposed by Haaland et al. (2015) [10]: in high-density Sponge City units, the fragmentation of greenery makes it difficult to form a scale effect sufficient to withstand the impact of extreme rainstorms. Paradoxically, this statistical non-significance underscores the irreplaceability of blue landscapes and gray road networks as the “rigid framework for resilience support” during extreme disasters.
5.1.4. The Built Environment as an Interface for Performance Integration
The type of built environment is a key predictor of recovery and serves as an “efficacy integration point” for natural and infrastructure elements. Building Type with low density and high ecological characteristics makes the strongest positive contribution to recovery, confirming the value of the ecological background in promoting rainwater infiltration, improving the microclimate, and accelerating the recovery of vitality. The results of Hierarchical Regression Analysis in Table 3 show that after controlling for previous variables such as landscape, topography, and road network, the built environment type still has an independent and the largest explanatory contribution to RCN. This proves that the building layer is not a passive recipient but an “integration interface” for the effects of previous natural and infrastructure elements. Based on this, the boxplot analysis designed in this study takes Building Type as the core anchor point, aiming to deeply examine, on different building bases, how the regulatory effects (synergy or trade-off) of other elements such as landscape, topography, and road network vary, so as to reveal the “context-dependence” of resilience generation. Low-density and highly ecological building types provide the most significant contribution to recovery (RCN) and exhibit a consistent trend of mitigating functional loss within the resistance (MI) model. This demonstrates that the built environment functions as an “integrated interface,” capable of achieving dual gains in both recovery and resistance through morphological optimization, even under high-density constraints.
5.1.5. Discussion on Resident Behavioral Resilience in a Cross-City Context
In the context of high-density Asian metropolises, the phenomena observed in this study reveal unique challenges under the impact of extreme disasters. Research by Arifwidodo et al. (2025) indicated that increasing proximity through the “15 min park policy” in Bangkok significantly enhanced daily vitality [11]; similarly, their 2021 study confirmed that minor renovations to park facilities could significantly induce positive behavioral changes [38]. However, this study observes in Shenzhen that under extreme environments—such as the “9·7” record-breaking rainstorm—relying solely on “spatial proximity” or “facility beautification” is insufficient to safeguard vitality. Instead, the “morphological friction” generated by the coupling of blue landscapes and high-density buildings becomes the dominant obstacle. This suggests that for cities reaching the saturation stage of governance (e.g., Shenzhen, Hong Kong, and Tokyo), the focus must shift from “incremental proximity” toward “fine-grained morphological governance”.
5.1.6. Behavioral Rebound Effect and the “Pro-Sample” Logic
The “excessive recovery” phenomenon observed in Figure 4 reveals the “Rebound Effect” of social systems following a disturbance. This phenomenon is not merely a result of random access; rather, it is a collective outcome of microclimate improvements post-storm (e.g., temperature drops, fresher air) and the concentrated discharge of suppressed exercise demand.
The capture of such nuanced performance curves is attributed to the “pro-sample” detection logic employed in this research. Unlike the elderly or inactive groups, who often exhibit “zero-sample” scenarios (complete cessation of behavior) during extreme weather, Keep users function as a “social sensor” highly sensitive to environmental quality, providing a complete data gradient from “attenuation” to “rebound.” Capturing this sensitive feedback of social behavior provides a scientific basis for identifying high-quality morphological units that can not only withstand disasters but also rapidly reconstruct social vitality.
5.2. Explanatory Framework: The Bidirectional Socio-Ecological Resilience Hierarchy Pyramid
The “Bidirectional Socio-Ecological Resilience Hierarchy Pyramid” constructed in this study, grounded in the Socio-Ecological-Technological Systems (SETS) framework, elucidates the bidirectional feedback mechanism between Urban Morphology and behavioral resilience (Figure 10). In the upward evolutionary logic, the system follows a “hierarchy of needs”: progressing from the foundational “Technological Defense Layer” (centered on TPD2000 to ensure resistance) to the intermediate “Recovery Transition Layer” (synergistically driven by Blue_IJI and DivE200), and ultimately reaching the apex “Synergistic Equilibrium Layer” (socio-ecological integration via building typologies). This represents a stepped escalation from fundamental safety to high-order functions.
Figure 10.
Dual-directional socio-ecological resilience pyramid.
Concurrently, in the downward feedback logic, the high-order objectives of “water-city integration” at the apex redefine the intensity of ecological regulation at the intermediate level and the configurational redundancy of technological infrastructure at the base by triggering the “Rebound Effect.” This forms a morphological optimization closed loop guided by social vitality. Through explicit morphological thresholds, this bidirectional architecture provides a quantitative basis for the transition of high-density cities from passive defense to proactive governance.
5.3. Limitations of the Study
There are certain limitations to this study: first, while Keep data serves as a highly environment-sensitive “pro-sample” capable of perceiving resilience evolution, its sample specificity and the context of a single typhoon event limit the broad generalization of the findings. However, the focus of this study is on the exhaustive analysis of a specific planning framework (SMUs) rather than large-sample statistical inference. Previous empirical studies have successfully utilized similar or smaller samples to derive targeted governance guidelines for administrative districts (e.g., n = 8 in Ahwaz [28]; n = 27 in the EU [30]). Thus, the findings remain statistically valid for identifying the morphological mechanisms within the statutory governance structure of Shenzhen. Additionally, the delineation of research units was constrained by the specific policy framework of Shenzhen.
However, as an “extreme case” where the built-up rate is approaching its physical limit, Shenzhen’s morphological-resilience contradictions exposed under stress testing hold significant scientific value. These findings provide forward-looking insights for other high-density Asian cities (such as Bangkok and Tokyo) facing similar challenges of the “green space paradox” and hyper-densification. Future research will further incorporate multi-source data and cross-city comparisons to validate the robustness of the SETS explanatory framework across diverse climatic conditions and governance regimes.
6. Conclusions
In the face of the spatial game between the “development red-line” and the “ecological bottom-line” in high-density cities, previous studies often fall into the single path of “de-densification”, making it difficult to adapt to the Stormwater Management Units (SMUs) that bear core development functions. This study took Shenzhen as an empirical object and confirmed that the Morphological Typology based on the evolutionary logic of “Dispersed–Compact–Balanced” was a key scientific tool to reconcile the contradiction between the “demand for density development” and the “goal of stormwater resilience”. By integrating Social Sensing data and multi-dimensional morphological indicators, this study not only quantifies the influencing mechanism but also provides a set of differentiated governance paradigms. The main conclusions are as follows:
(1) Validation of the “Resistance-Recovery Dual Structure” Logic. The study confirms that resistance manifests as a “rigid defense” dominated by macro-scale road network topological efficiency, which determines the lower limit of disturbance. In contrast, recovery functions as a “systemic synergy” driven collectively by natural, technological, and social elements, determining the efficiency of the rebound. This dual categorization breaks through the singular perspective of traditional resilience measurement, revealing differentiated driving mechanisms across distinct disaster phases.
(2) Identification of Phase-specific and Scale Effects of Morphological Elements. Road network detouring resistance (TPD2000) is identified as the “core bottleneck” for functional loss, while micro-circulation diversity (DivE200) serves as the catalyst for accelerated recovery. Furthermore, the persistent negative effect of the Blue Landscape Interspersion and Juxtaposition Index (Blue_IJI) throughout the process serves as a critical reminder: in high-density urban areas, emphasis should be placed on the relative integrity of the blue skeleton rather than fragmented, ornamental embellishments.
(3) Built Environment as the Pivotal Hub for Balancing Intensity and Resilience. Clustering analysis proves that low-density ecological areas (Cluster 1) provide the strongest positive contribution to recovery, while high-density areas exhibit the highest initial functional loss (MI) and lower recovery efficiency. However, the regression models validate the existence of a “Morphological Compensation Effect”: by optimizing road network topological efficiency (reducing detouring resistance), high-density units can significantly mitigate functional decline. This provides powerful evidence that the built environment is not a passive recipient of disturbances but rather an integrated efficiency interface that dynamically balances “resilience deficits” by synthesizing technological and ecological elements.
(4) Construction of a Spatial Typology Governance System. This study establishes a governance system based on the “Dispersed–Compact–Balanced” evolutionary logic, utilizing field imagery to verify the built environment’s role as an integrated efficiency interface for balancing “resilience deficits” (Figure 11).
Figure 11.
Spatial distribution of four resilience typologies.
Type I (synergistic equilibrium): Represented by the Guiwan River Blueway in Qianhai, this type demonstrates a paradigm of high-intensity development integrated deeply with blue-gray infrastructure at the “Equilibrium Layer” of the evolutionary hierarchy.
Type II (recovery advantage): Exemplified by the Dameisha Artificial Lake Blueway, it leverages the low-density substrate and ecological buffering of the “recovery layer” to drive the efficient rebound of physical activity.
Type III (resistance guarantee): Typical of the Xinzhou River Blueway, it proves that in the ultra-high-density environments of the “Compact Layer,” “morphological compensation” achieved through optimized road topology (low TPD) can significantly alleviate functional loss (MI), achieving “co-existence with density”.
Type IV (under-improvement): Such as the canalized sections of the Maozhou River, this reflects a “resilience deficit” caused by singular hardened interfaces within the initial “Dispersed Layer”.
This typology not only visually presents the impact of spatial layouts on active leisure behavior under diverse environmental conditions but also provides a typological guide for high-density cities to precisely bridge their resilience gaps.
(5) Validation of Crowdsourced Trajectory Big Data as “Social Sensors.” This study empirically demonstrates the scientific validity and effectiveness of utilizing crowdsourced movement trajectory data as “social sensors” to perceive urban systemic resilience. Through the “pro-sample” detection logic, the research not only captures the complete behavioral gradient—from “functional attenuation” to the “rebound effect”—but also effectively isolates the “morphological friction” exerted by extreme environments on social vitality. This provides an innovative data paradigm and methodological pathway for the dynamic resilience assessment of complex coupled systems in high-density urban areas.
(6) Support the implementation of differentiated and precise stormwater resilience planning paradigms and related institutions.
In response to the two extremes in current planning practices, namely “administrative demarcation emphasizing density” and “academic research simply criticizing density”, the refined typology tool proposed in this study offers a third path that both coordinates the demand for high-intensity development and takes into account the protection of ecological resilience. Based on the “Development Pyramid” model, institutional design should establish a hierarchical control paradigm adapted to the evolution of Urban Morphology to resolve the inherent contradiction between density and safety.
Firstly, in the “Dispersed Development Stage” (To-be-Improved Type) at the base of the pyramid, mandatory “short-board-making-up” assessments should be implemented to address the basic safety issues caused by the lack of infrastructure. Secondly, in the “Compact Development Stage” in the middle layer, the typology tool should be used to implement precise dual-space access. On the one hand, the legitimacy of high-density development should be established in the “Resistance-Guaranteed Type” areas, and the density pressure should be balanced by strengthening engineering facilities (TPD2000) to avoid blindly implementing inefficient density-reduction measures. On the other hand, in the “recovery-Advantaged Type” areas with a good ecological background, the development intensity should be strictly restricted, and their function as “ecological regulators” should be established to give full play to the natural background’s restoration ability. Finally, the “Balanced Development Stage” (Synergistic Balanced Type) at the top of the pyramid should be established as the guiding goal for high-quality development, and policy incentives should be used to promote the in-depth integration of artificial facilities and blue-green spaces.
This hierarchical and refined governance path fundamentally transcends the static “one-size-fits-all” thinking and provides an operable institutional approach for high-density cities to achieve a win-win situation between “development and resilience”.
Author Contributions
Conceptualization, Y.F., C.X., Y.Y., X.G. and H.L.; methodology, Y.F., C.X. and Y.Y.; software, Y.F. and C.X.; validation, Y.Y.; formal analysis, C.X. and Y.Y.; investigation, Y.F., C.X. and X.G.; resources, Y.F., C.X. and Y.Y.; data curation, Y.F., C.X., X.G. and Y.L.; writing—original draft preparation, Y.F., C.X. and Y.L.; writing—review and editing, Y.F., C.X., Y.Y. and H.L.; visualization, Y.F., C.X., X.G. and Y.L.; supervision, Y.F. and Y.Y.; project administration, Y.F., Y.Y. and H.L.; funding acquisition, Y.Y. and H.L. All authors have read and agreed to the published version of the manuscript.
Funding
This research was funded by the National Natural Science Foundation of China [52408029], project “Research on guidance and regulation index of developing three-dimensional railway transit block with public space vitality”, and the National Natural Science Foundation of China [52308026], project “The Research on Design Planning of Urban Water-Sensitive Open Space for the Composite Utilization of Disaster and Quality based on ‘Space-Use’ Mechanism”.
Data Availability Statement
The data supporting the reported results are not publicly available due to privacy and ethical restrictions. The data were stored on the second author’s personal computer and shared with the first author. They can only be made available upon a necessary and specific request.
Acknowledgments
The authors would like to thank the State Key Laboratory of Subtropical Building and Urban Science, Shenzhen University, for providing the necessary research facilities and academic platform support. We extend our gratitude to the Keep platform for providing the trajectory data, and to the OpenStreetMap (OSM) contributors for the urban infrastructure data used in this study. Furthermore, we would like to thank the anonymous reviewers for their insightful comments and suggestions that helped improve this manuscript.
Conflicts of Interest
The authors declare no conflicts of interest.
Appendix A
Appendix A.1. Overview of the Key Areas for the Recent Construction of the Sponge City in Shenzhen
Table A1.
Overview of the Key Areas for the Recent Construction of the Sponge City in Shenzhen.
Appendix A.2. Domestic and International Literature and Policy Basis Supporting the Research Scale of Stormwater Management Units (SMUs)
Table A2.
Summary of domestic and international literature and policy frameworks supporting the research scale of Stormwater Management Units (SMUs).
References
- Fereshtehpour, M.; Najafi, M.R. Urban stormwater resilience: Global insights and strategies for climate adaptation. Urban Clim. 2025, 59, 102290. [Google Scholar] [CrossRef] [Scilit]
- Wang, Q.; Zhang, R.; Li, H.; Zang, X. Analysis of mechanism and optimal value of urban built environment resilience in response to stormwater flooding. Ecol. Indic. 2024, 158, 111625. [Google Scholar] [CrossRef] [Scilit]
- Chen, L.; Ng, E.; An, X.; Ren, C.; Lee, M.; Wang, U.; He, Z. Sky view factor analysis of street canyons and its implications for daytime intra-urban air temperature differentials in high-rise, high-density urban areas of Hong Kong: A GIS-based simulation approach. Int. J. Climatol. 2012, 32, 121–136. [Google Scholar] [CrossRef] [Scilit]
- Yang, Q.; Lin, Z.; Li, Q. Quantitative Simulation and Planning for the Heat Island Mitigation Effect in Sponge City Planning: A Case Study of Chengdu, China. Land 2025, 14, 264. [Google Scholar] [CrossRef] [Scilit]
- Xu, K.; Wang, J.; Wang, J.; Wang, X.; Chi, Y.; Zhang, X. Environmental function zoning for spatially differentiated environmental policies in China. J. Environ. Manag. 2020, 255, 109485. [Google Scholar] [CrossRef] [Scilit] [PubMed]
- Zhang, L.; Zhang, Y.; Li, J.; Yang, C.; Liu, Y. A Spatiotemporal Analysis of the Relationship Between Construction Land Supply and High-Quality Urban Development: Evidence from 285 Chinese Cities. Land 2025, 14, 2359. [Google Scholar] [CrossRef] [Scilit]
- Ghofrani, Z.; Sposito, V.; Faggian, R. A Comprehensive Review of Blue-Green Infrastructure Concepts. Int. J. Environ. Sustain. 2017, 6, 15–36. [Google Scholar] [CrossRef] [Scilit]
- O’Donnell, E.C.; Gosling, S.N.; Netusil, N.R.; Ka Shun Chan, F.; Dolman, N.J. Perceptions of blue-green and grey infrastructure as climate change adaptation strategies for urban water resilience. J. Br. Acad. 2021, 9s9, 143–182. [Google Scholar] [CrossRef] [Scilit]
- Zhu, L.; Gao, C.; Wu, M.; Zhu, R. Integrating Blue–Green Infrastructure with Gray Infrastructure for Climate-Resilient Surface Water Flood Management in the Plain River Networks. Land 2025, 14, 634. [Google Scholar] [CrossRef] [Scilit]
- Haaland, C.; Van Den Bosch, C.K. Challenges and strategies for urban green-space planning in cities undergoing densification: A review. Urban For. Urban Green. 2015, 14, 760–771. [Google Scholar] [CrossRef] [Scilit]
- Arifwidodo, S.D.; Chandrasiri, O.; Rueangsom, P. Is Proximity to Parks Associated with Physical Activity and Well-Being? Insights from 15-Minute Parks Policy Initiative in Bangkok, Thailand. Sustainability 2025, 17, 7457. [Google Scholar] [CrossRef] [Scilit]
- Ho, J.Y.; Lam, H.Y.C.; Huang, Z.; Liu, S.; Goggins, W.B.; Mo, P.K.H.; Chan, E.Y.Y. Factors affecting outdoor physical activity in extreme temperatures in a sub-tropical Chinese urban population: An exploratory telephone survey. BMC Public Health 2023, 23, 101. [Google Scholar] [CrossRef] [Scilit] [PubMed]
- Wu, D. Towards Resilient Urban Design: Revealing the Impacts of Built Environment on Physical Activity Amidst Climate Change. Buildings 2025, 15, 3470. [Google Scholar] [CrossRef] [Scilit]
- Lee, Y.; Tanaka, K.; Hong, C.-Y. Integrating Planning Theory with Socio-Ecological-Technological Systems for Urban Flood Risk Management: A Case Study of Chiba Prefecture, Japan. Land 2025, 14, 1754. [Google Scholar] [CrossRef] [Scilit]
- Li, Z.J.; Zhang, X.G.; Zeng, H.; Chang, W.J. Paradigm and framework construction of urban human settlement metabolism based on landscape ecology. Acta Ecol. Sin. 2020, 40, 6738–6748. [Google Scholar]
- Wissing, R.; Jones, D.; Klas, A. The crucial role of private domestic gardens in achieving sustainable cities: A model linking the person, Maslow’s Hierarchy and Millennium Ecosystem Assessment to sustainably meeting ecological and human needs. In Proceedings of the 8th State of Australian Cities National Conference, Adelaide, Australia, 28–30 November 2017. [Google Scholar]
- Lee Collin, M.; Jacob Melloul, A. Land-Use Planning Guidelines for Optimal Coastal Environmental Management. J. Environ. Prot. 2012, 3, 485–501. [Google Scholar] [CrossRef]
- Ruževičius, J. Ecological footprint: Evaluation methodology and international benchmarking. Verslo Ir Teisės Aktual. 2010, 6, 11–30. [Google Scholar] [CrossRef] [Scilit]
- Lu, Y.; Zhang, Y.; Zhai, W.; Zhai, G. Understanding electric vehicle charging network resilience: Resilience curves and interpretable machine learning. Transp. Res. Part Transp. Environ. 2025, 142, 104709. [Google Scholar] [CrossRef] [Scilit]
- Palazzo, E. Sponge Landscapes: Flood Adaptation Landscape Type Framework for Resilient Agriculture. Land 2025, 14, 2023. [Google Scholar] [CrossRef] [Scilit]
- Gao, Y.J.; Zhao, J.Y. Assessing the impact and contribution of block morphological factors on surface thermal environment based on multi-source data. J. Hum. Settl. West China 2023, 38, 30–37. [Google Scholar] [CrossRef]
- Li, Y.; Liu, H.K.; Fan, Y.T.; Zheng, H.Q.; Chen, Z.L. Analysis of the evolution of reclamation space and benefit-oriented mechanism in Shenzhen from 1980 to 2020. Ocean Dev. Manag. 2024, 41, 67–78. [Google Scholar] [CrossRef]
- Leng, Y.B.; Liu, S.; Zheng, J.W.; Zhang, Y.; Liu, X.P.; Wang, Z. Research and application of urban flood model in the Shenzhen River and Bay Basin. Pearl River 2024, 45, 75–87. [Google Scholar]
- Zevenbergen, C.; Fu, D.; Pathirana, A. Transitioning to Sponge Cities: Challenges and Opportunities to Address Urban Water Problems in China. Water 2018, 10, 1230. [Google Scholar] [CrossRef] [Scilit]
- Che, W.; Zhang, W.; Li, J.Q.; Li, H.Y.; Wang, J.L.; Liu, H.; He, J.P.; Meng, G.H. Study on patterns of urban stormwater management in China. China Water Wastewater 2010, 26, 51–57. [Google Scholar] [CrossRef]
- Zhang, Y.L.; Li, X.; Shao, M.; Tang, L.Z. Study on stormwater management planning for green spaces based on urban green space system optimization: A case study of Tongliao City. Urban Dev. Stud. 2018, 25, 97–102. [Google Scholar]
- Xiao, Y.; Sho, K.; Shibuya, Y.; Hino, K.; Zhao, S.; Bardhan, R. Nonlinear relationships between urban morphology, socioeconomic conditions, and infectious disease risk: Evidence from COVID-19 in Tokyo. Environ. Res. Health 2026, 4, 015008. [Google Scholar] [CrossRef] [Scilit]
- Asadollahi, A.; Firozjaee, S.F.; Januchta-Szostak, A.; Musavi, V.; Rakhshani, T.; Hosseini, S.N.; Keyhanmehr, S. Evaluation of indicators of aging-friendly urban indicators in 8 districts of Ahwaz metropolitan, southwest Iran. Discov. Appl. Sci. 2025, 7, 986. [Google Scholar] [CrossRef] [Scilit]
- Song, L.X.; Chen, J.L.; Liu, Z.T.; Wu, H.M. Retrospective simulation and analysis of the “9·7” extreme extraordinary rainstorm and flood in Shenzhen in 2023: A case study of the Guanlan River Basin in Longhua District. China Flood Drought Manag. 2024, 34, 19–23. [Google Scholar] [CrossRef]
- Efthalitsidou, K.; Spinthiropoulos, K.; Vittas, G.; Sariannidis, N. Digital Governance, Democracy and Public Funding Efficiency in the EU-27: Comparative Insights with Emphasis on Greece. Information 2025, 16, 795. [Google Scholar] [CrossRef] [Scilit]
- Bruneau, M.; Chang, S.E.; Eguchi, R.T.; Lee, G.C.; O’Rourke, T.D.; Reinhorn, A.M.; Shinozuka, M.; Tierney, K.; Wallace, W.A.; von Winterfeldt, D. A Framework to Quantitatively Assess and Enhance the Seismic Resilience of Communities. Earthq. Spectra 2003, 19, 733–752. [Google Scholar] [CrossRef] [Scilit]
- Nan, C.; Sansavini, G. A quantitative method for assessing resilience of interdependent infrastructures. Reliab. Eng. Syst. Saf. 2017, 157, 35–53. [Google Scholar] [CrossRef] [Scilit]
- Ouyang, M.; Dueñas-Osorio, L.; Min, X. A three-stage resilience analysis framework for urban infrastructure systems. Struct. Saf. 2012, 36–37, 23–31. [Google Scholar] [CrossRef] [Scilit]
- Henry, D.; Emmanuel Ramirez-Marquez, J. Generic metrics and quantitative approaches for system resilience as a function of time. Reliab. Eng. Syst. Saf. 2012, 99, 114–122. [Google Scholar] [CrossRef] [Scilit]
- Liu, Y.; Wang, X.; Song, C.; Chen, J.; Shu, H.; Wu, M.; Guo, S.; Huang, Q.; Pei, T. Quantifying human mobility resilience to the COVID-19 pandemic: A case study of Beijing, China. Sustain. Cities Soc. 2023, 89, 104314. [Google Scholar] [CrossRef] [Scilit] [PubMed]
- Dong, W.; Jiang, R.S.; Dong, Y.; Pei, M.H. Relationship between heat risk perception and physical activity of residents in the context of climate change. Landsc. Archit. 2024, 31, 21–28. [Google Scholar] [CrossRef] [Scilit]
- Li, X.; Du, M.; Song, Y. Research on Climate Resilience Assessment and Enhancement Strategies for Hebei Province in Response to Climate Change. Land 2025, 14, 2189. [Google Scholar] [CrossRef] [Scilit]
- Arifwidodo, S.D.; Chandrasiri, O. The Effects of Park Improvement on Park Use and Park-Based Physical Activity. J. Archit. Urban. 2021, 45, 73–79. [Google Scholar] [CrossRef] [Scilit]
- Novaes, C.; Marques, R. Stormwater Utilities: A Sustainable Answer to Many Questions. Sustainability 2022, 14, 6179. [Google Scholar] [CrossRef] [Scilit]
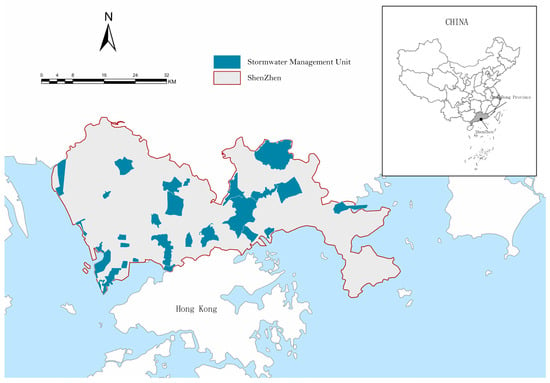
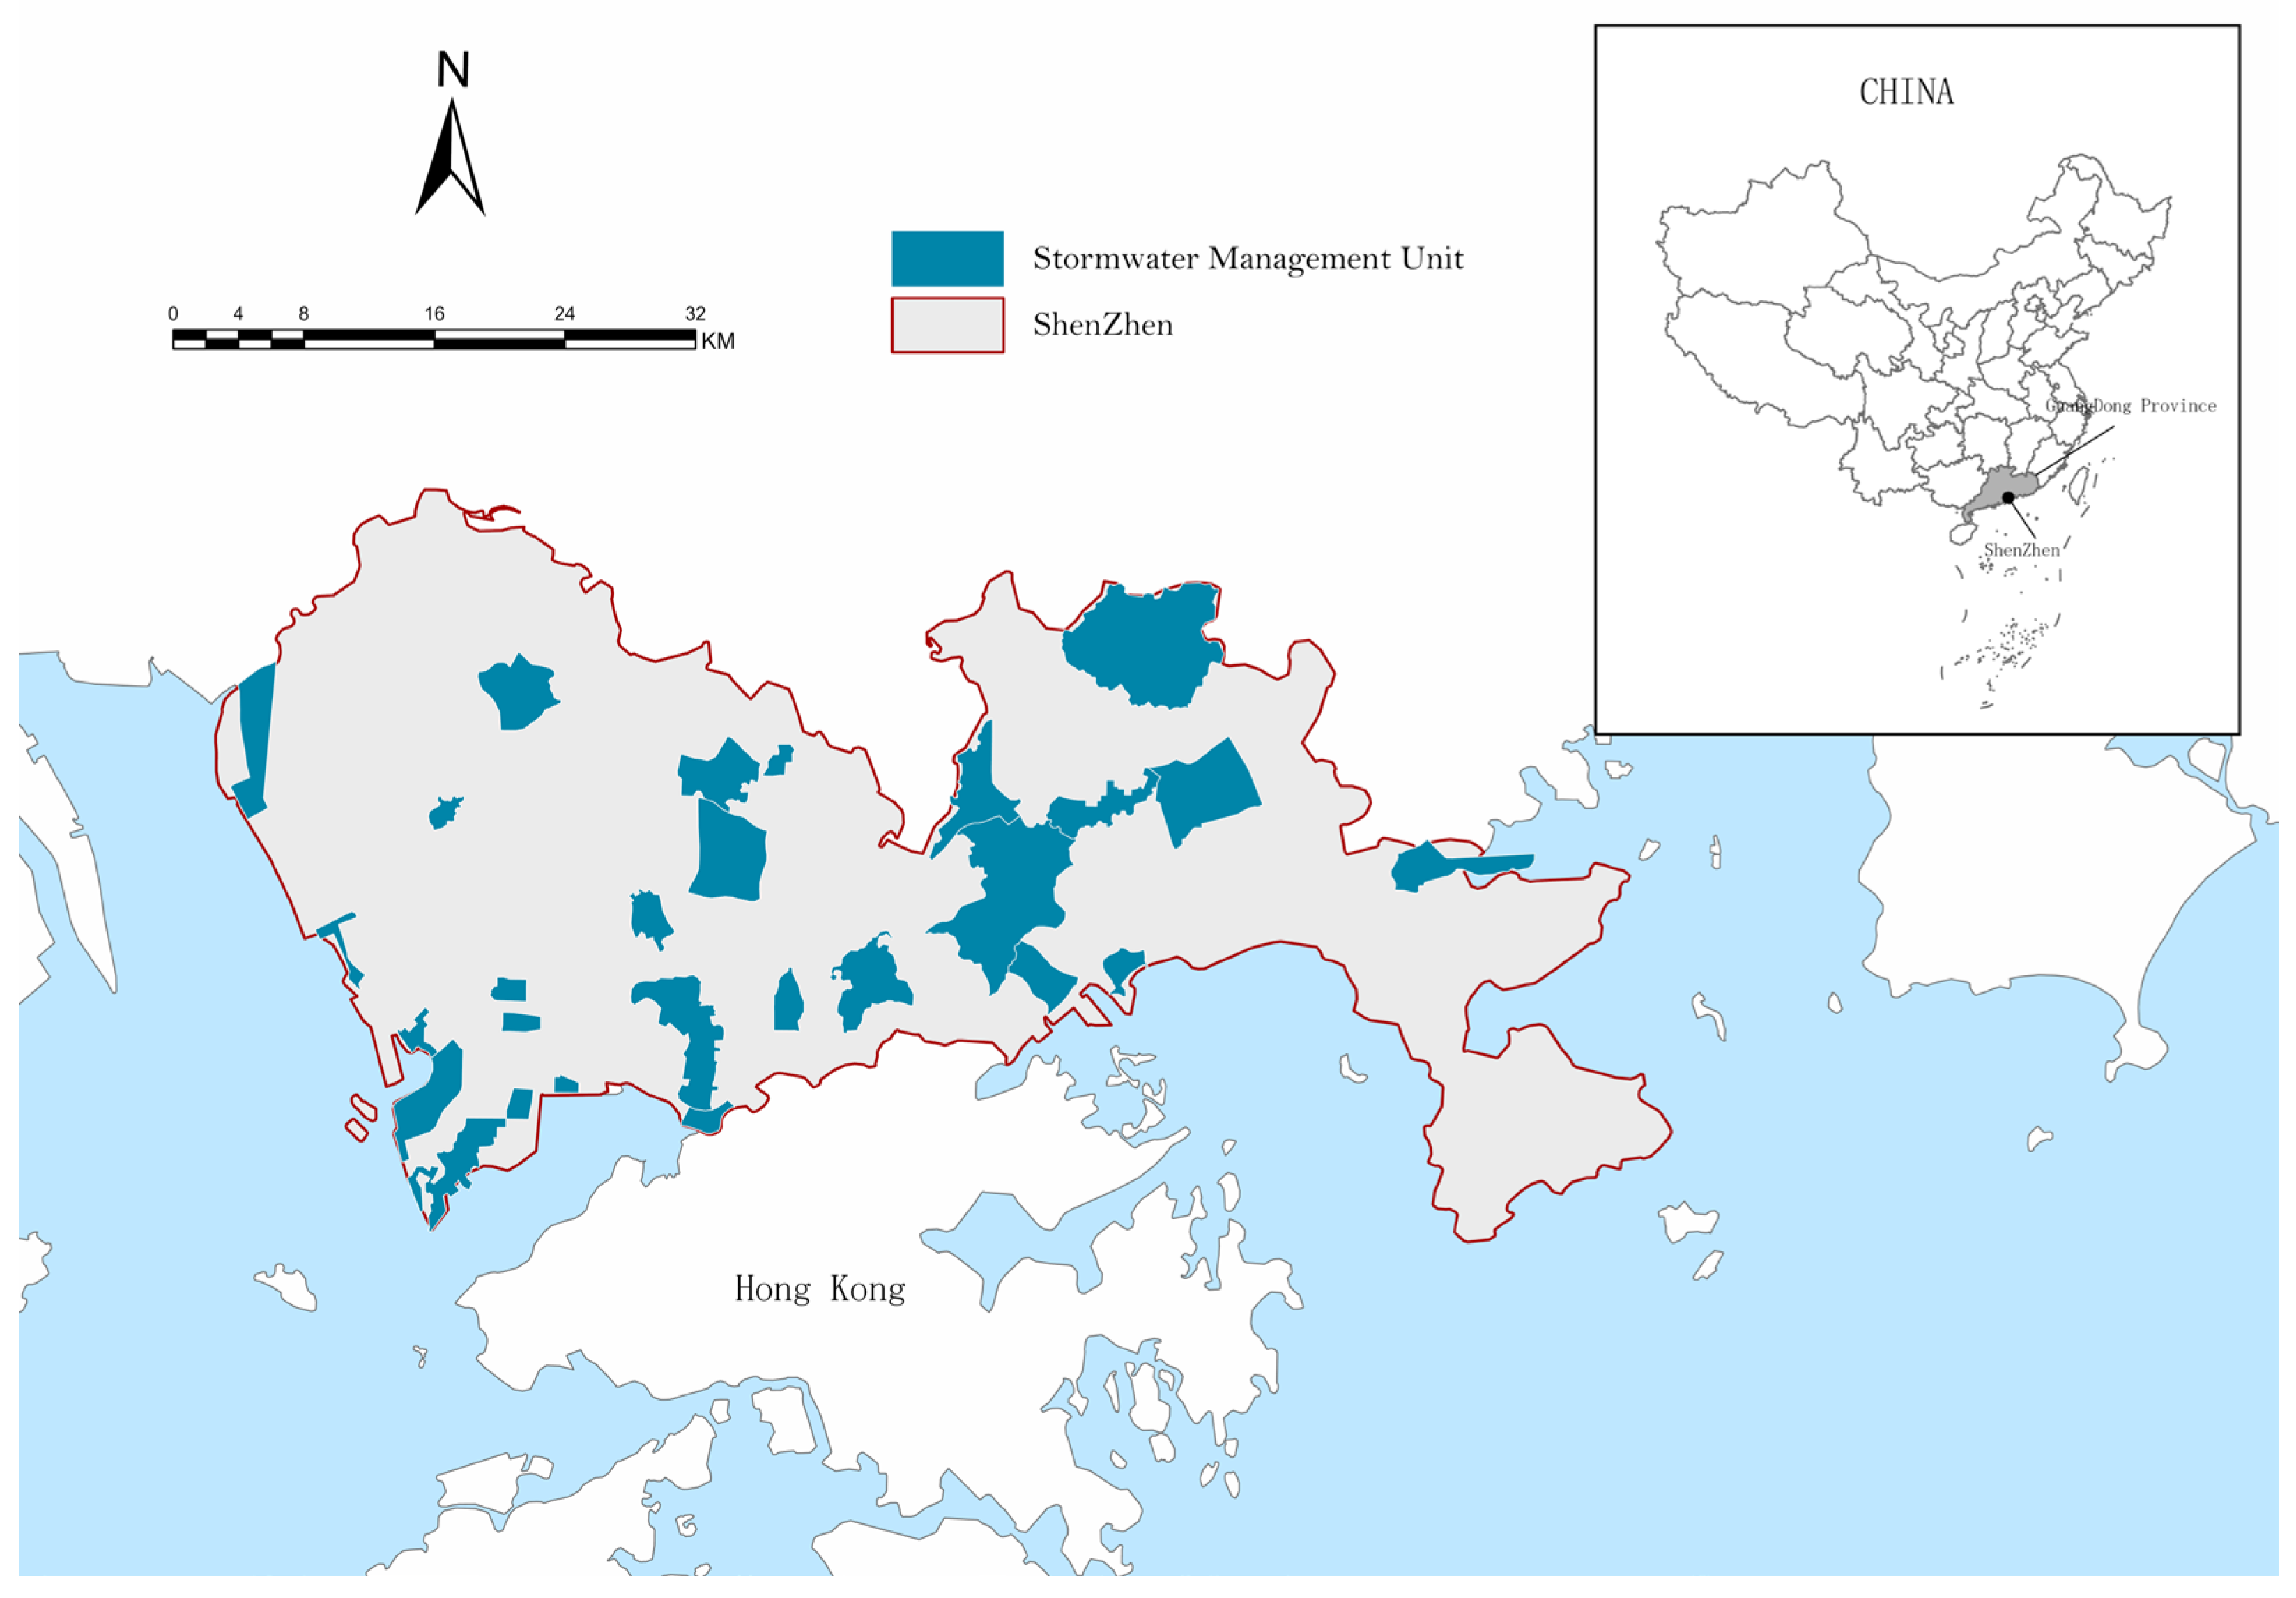
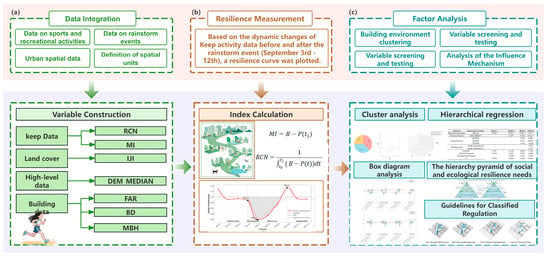
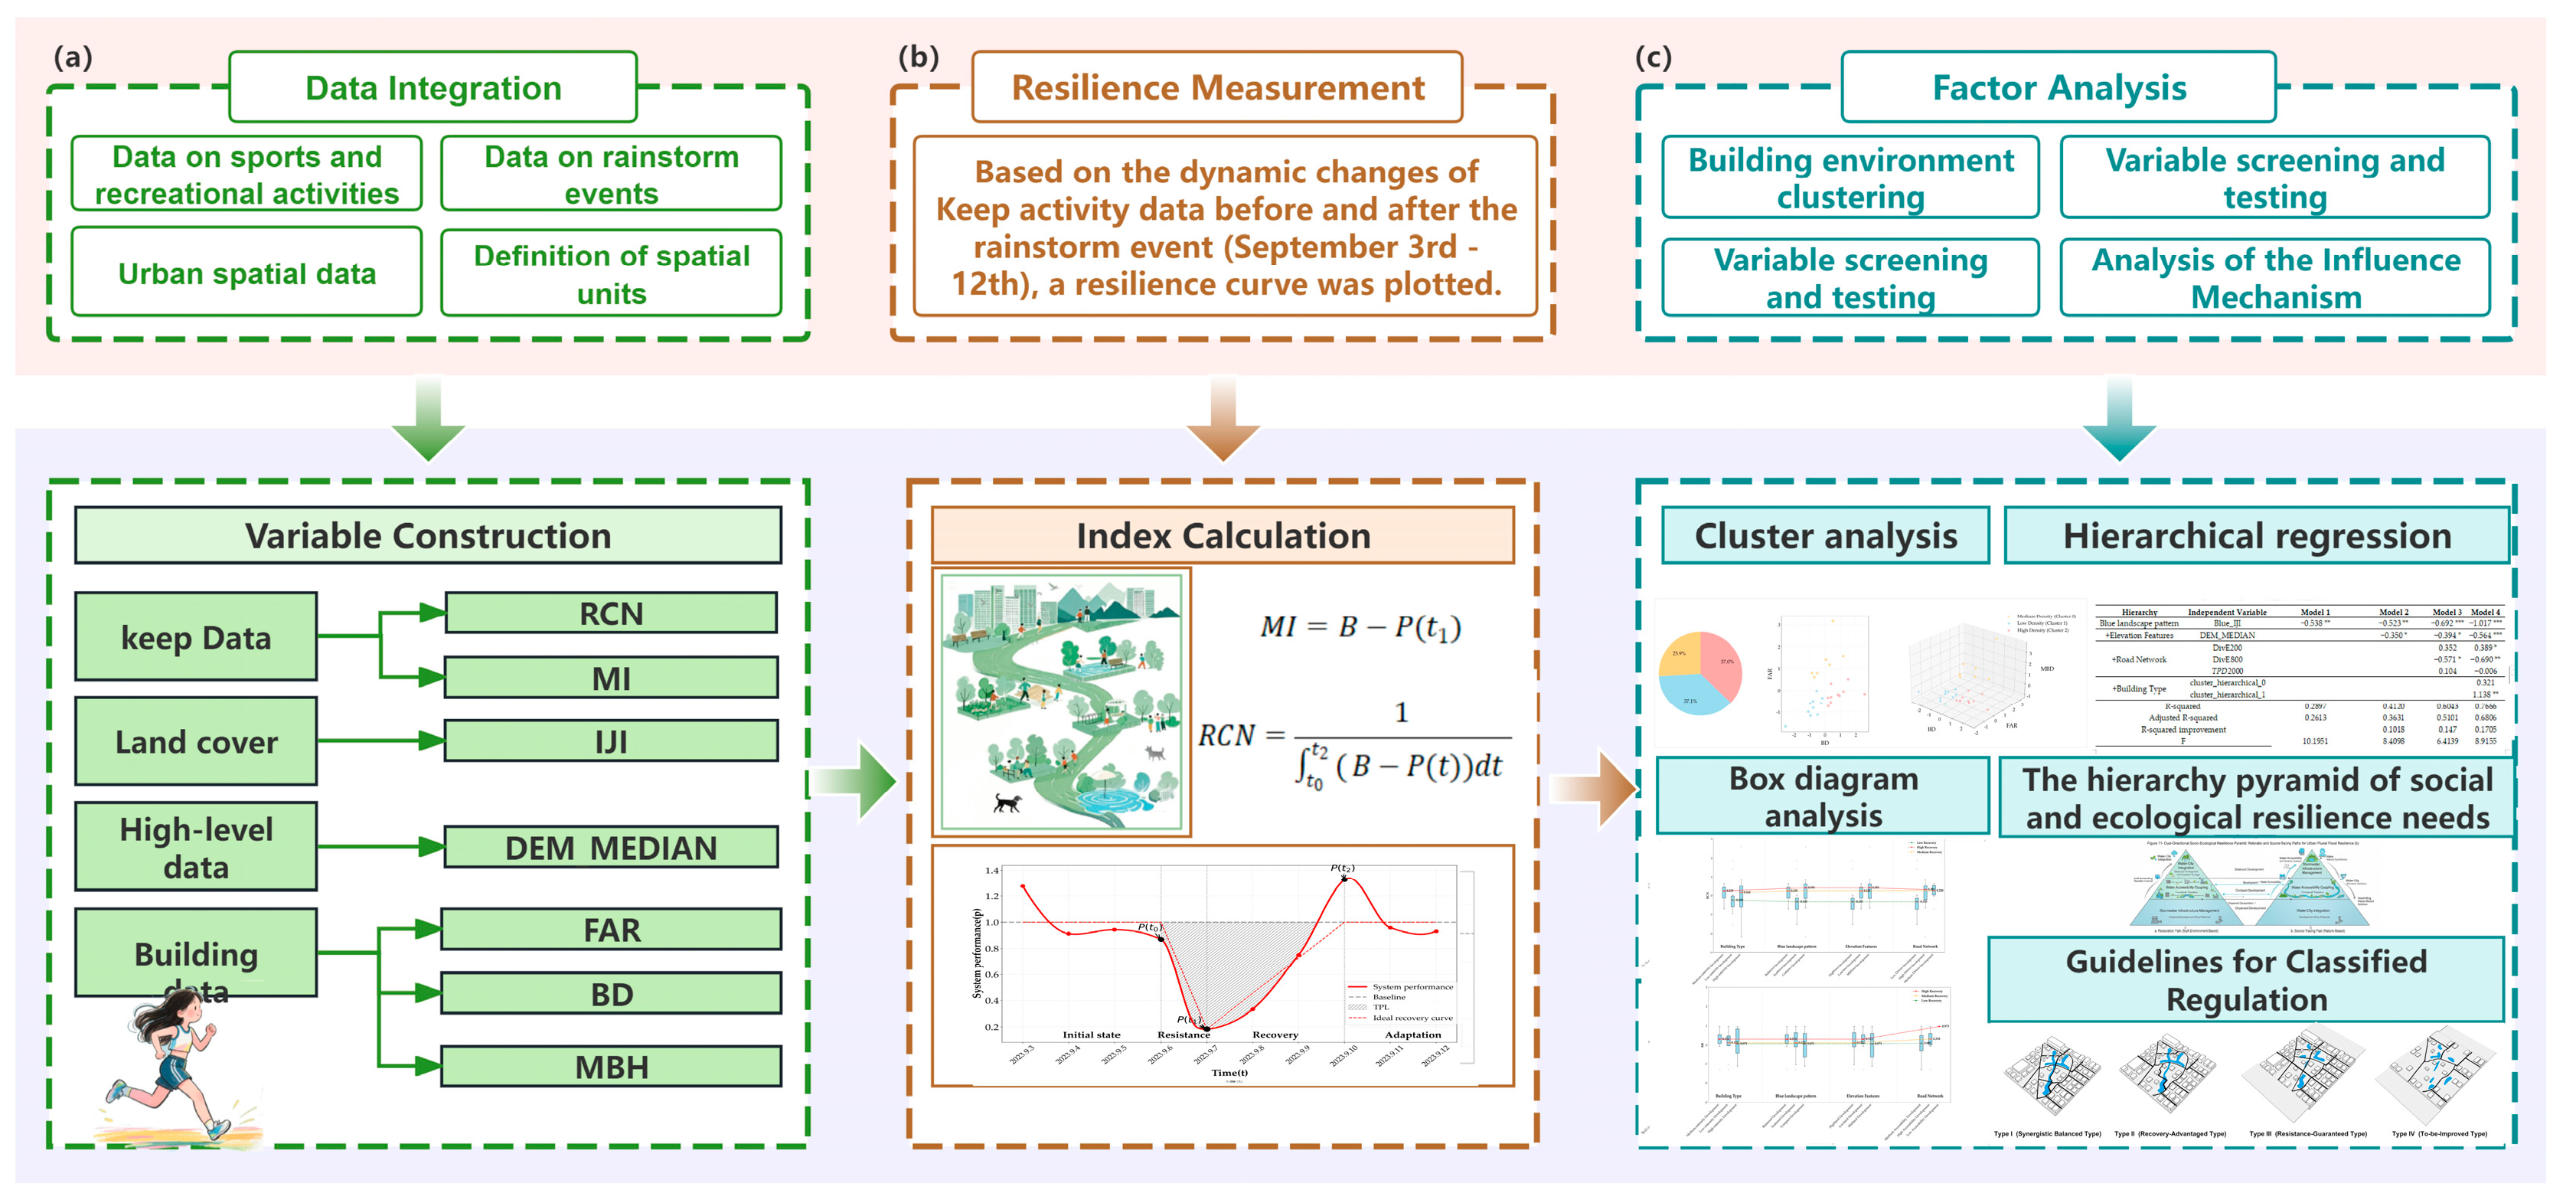
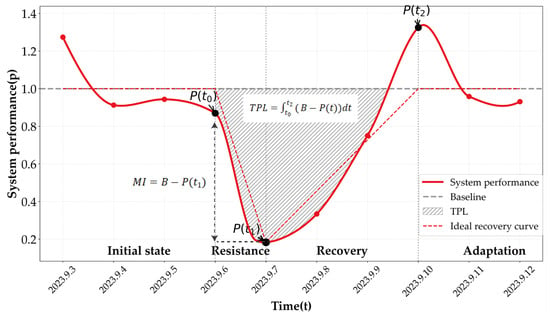
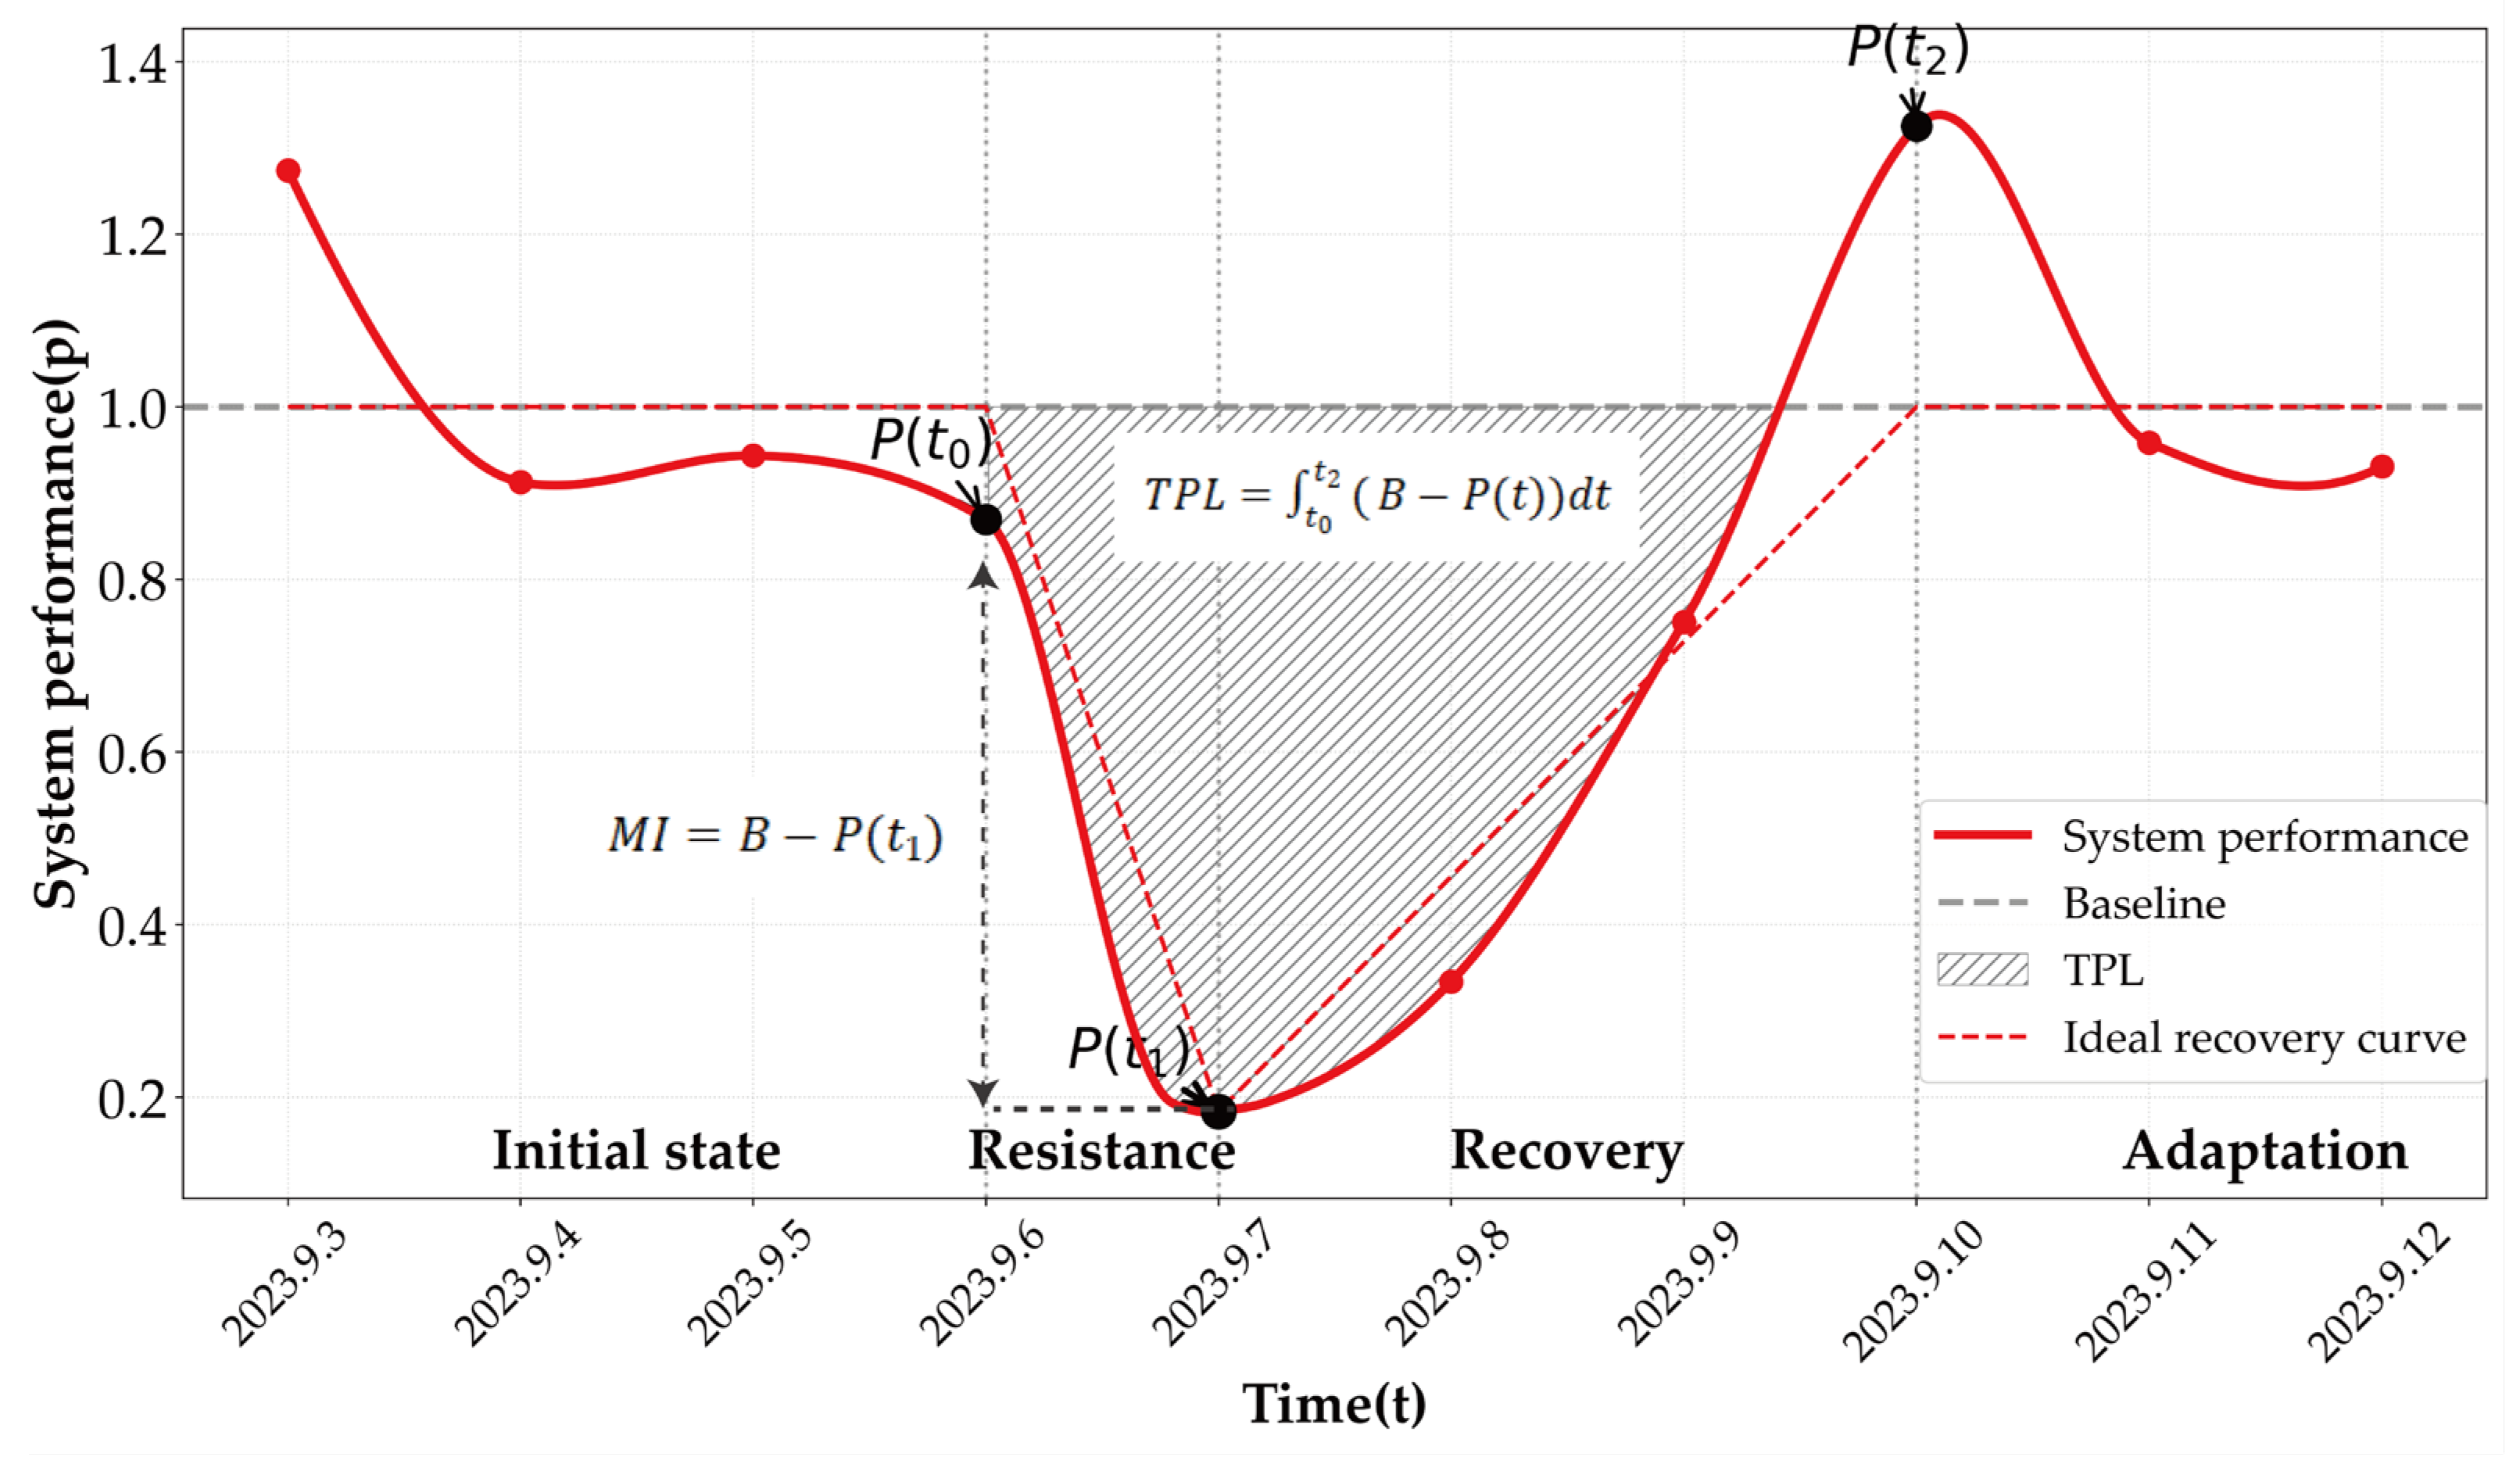
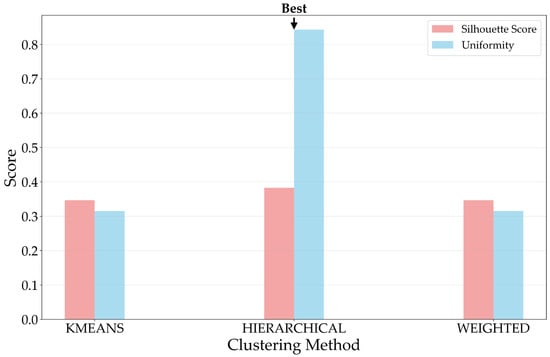
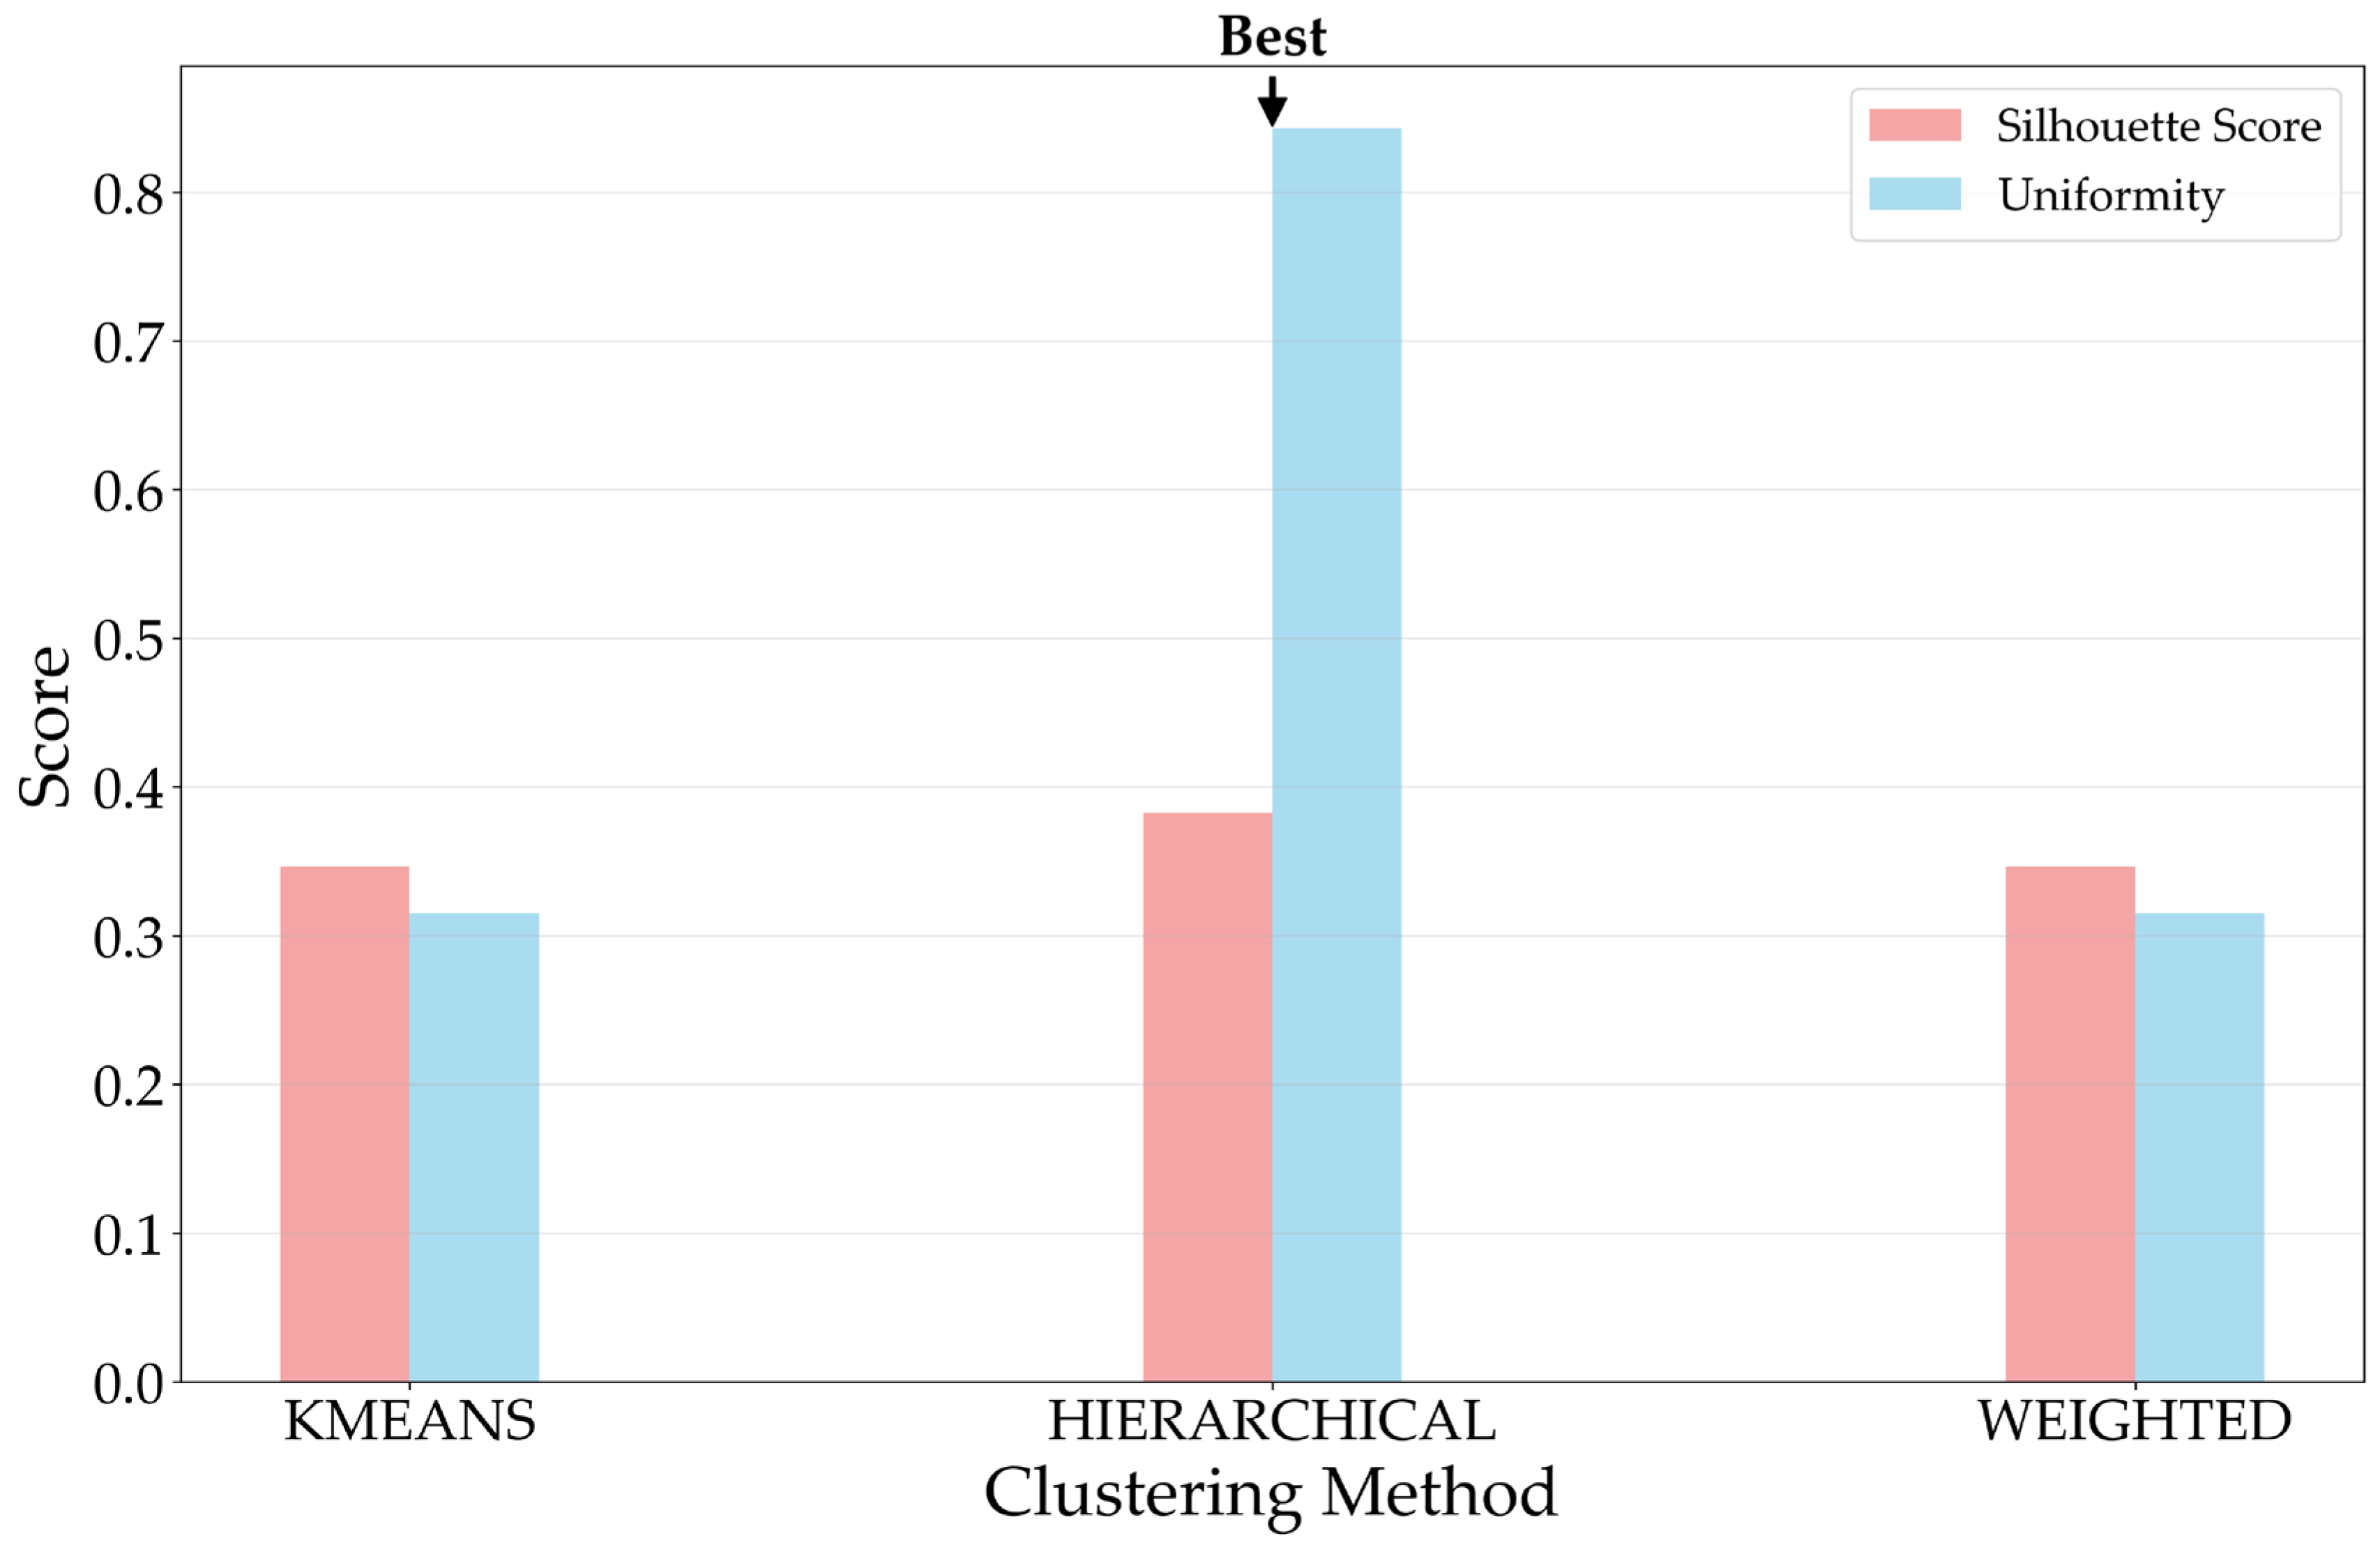
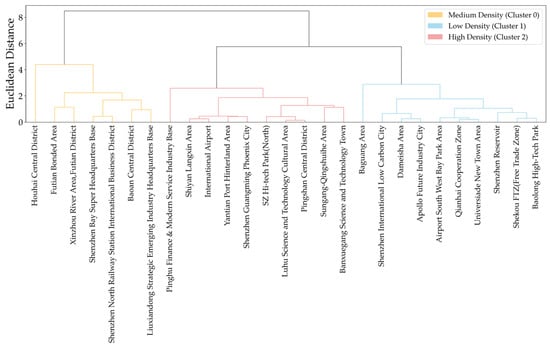
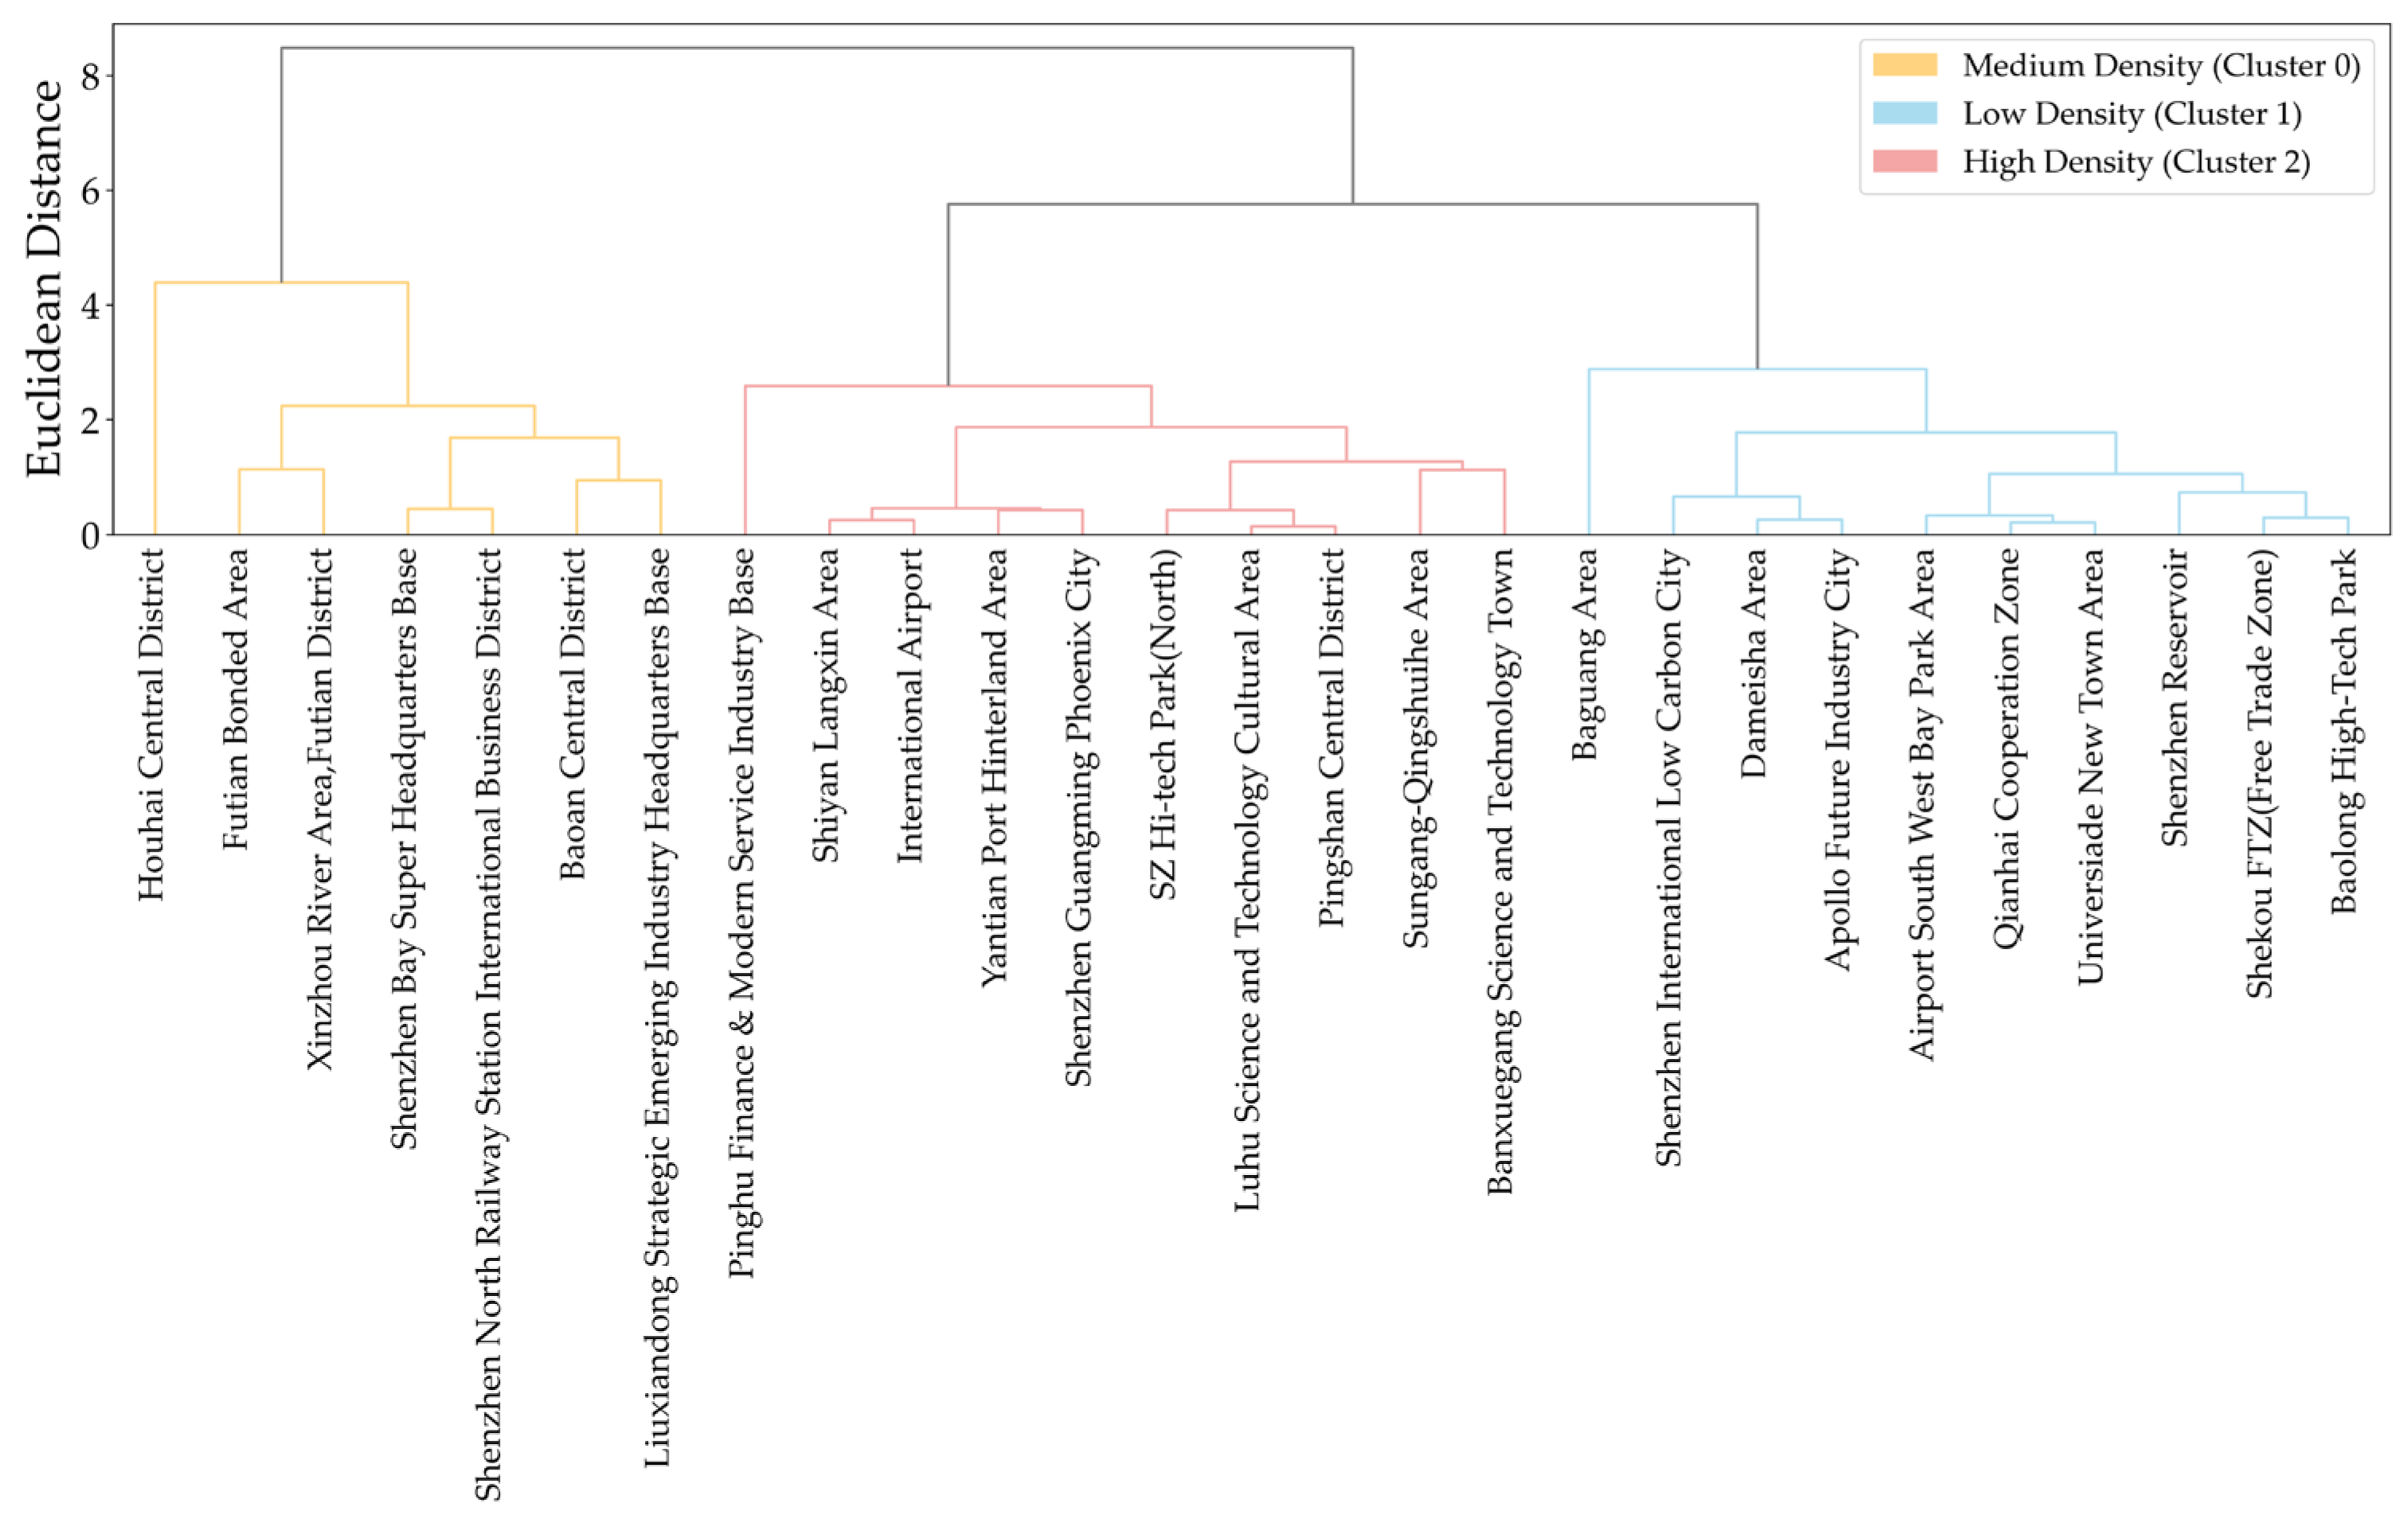
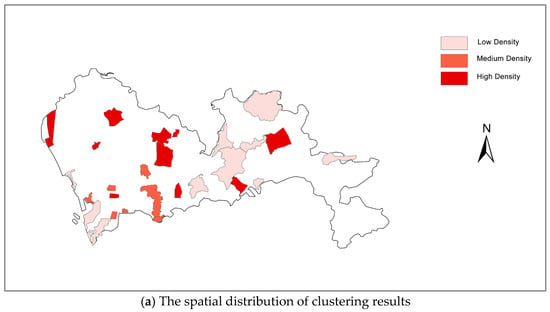
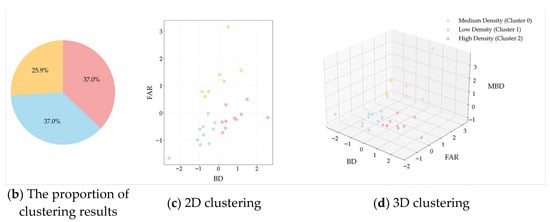
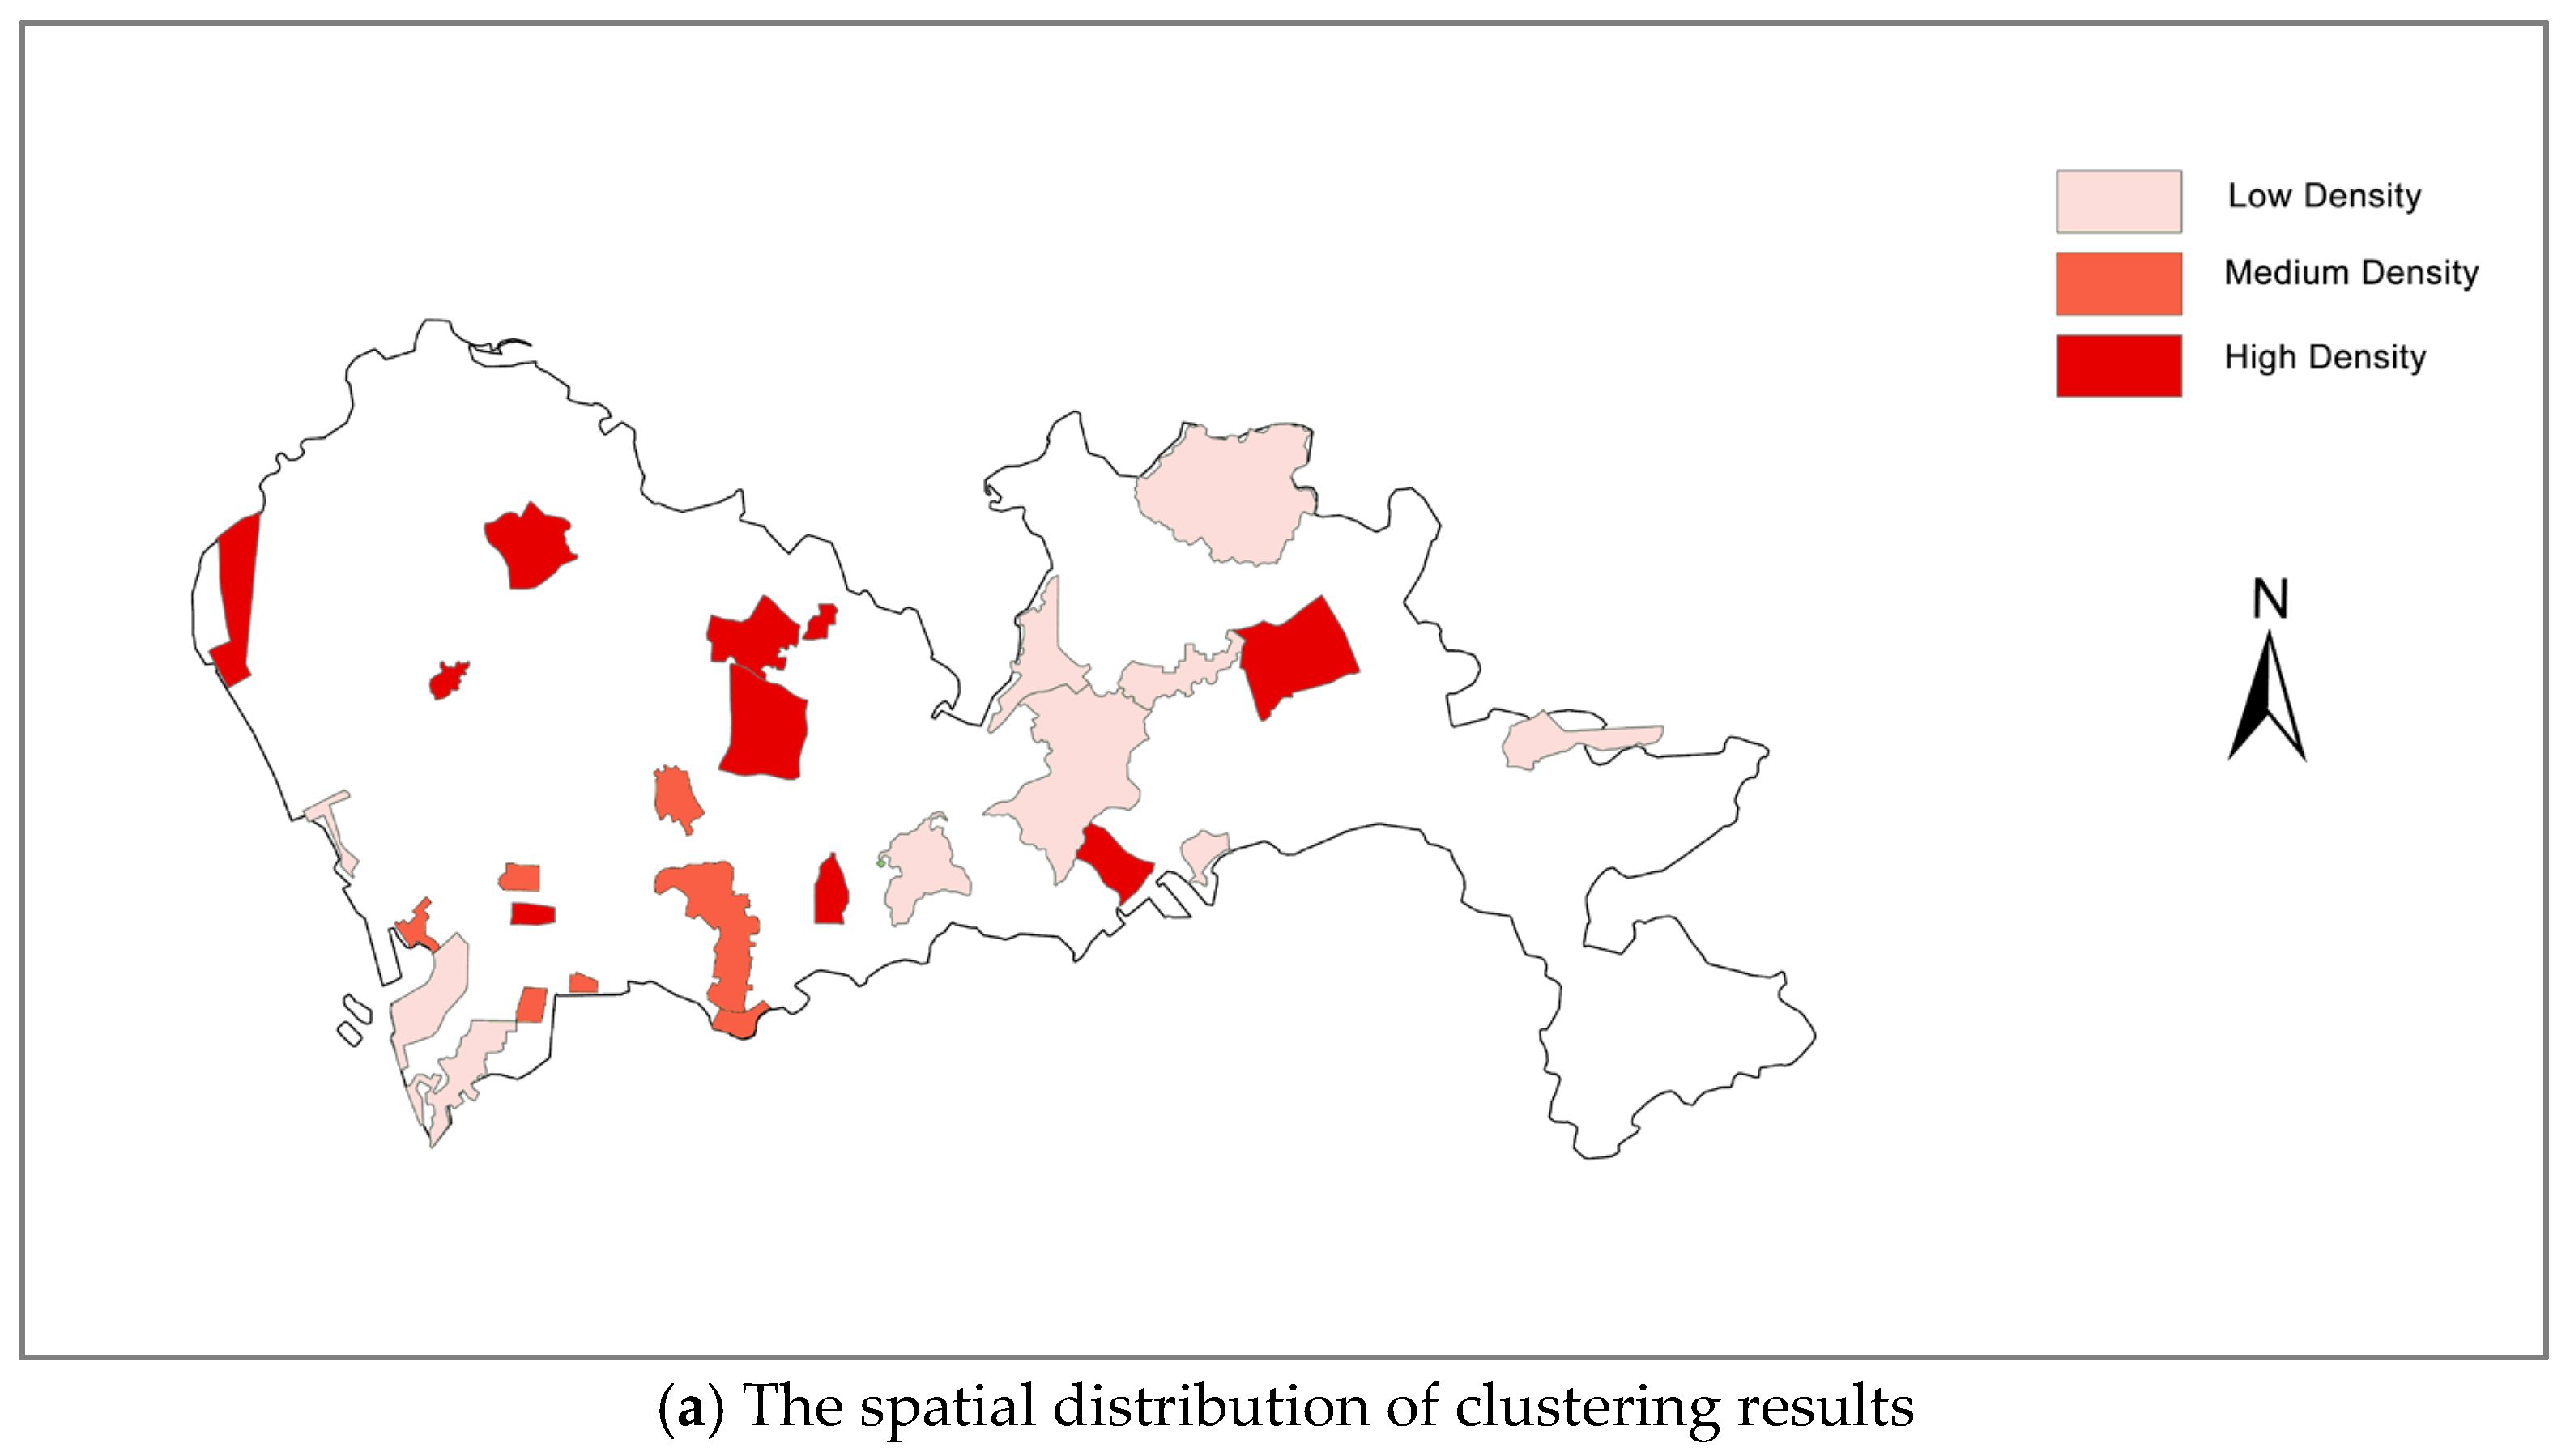
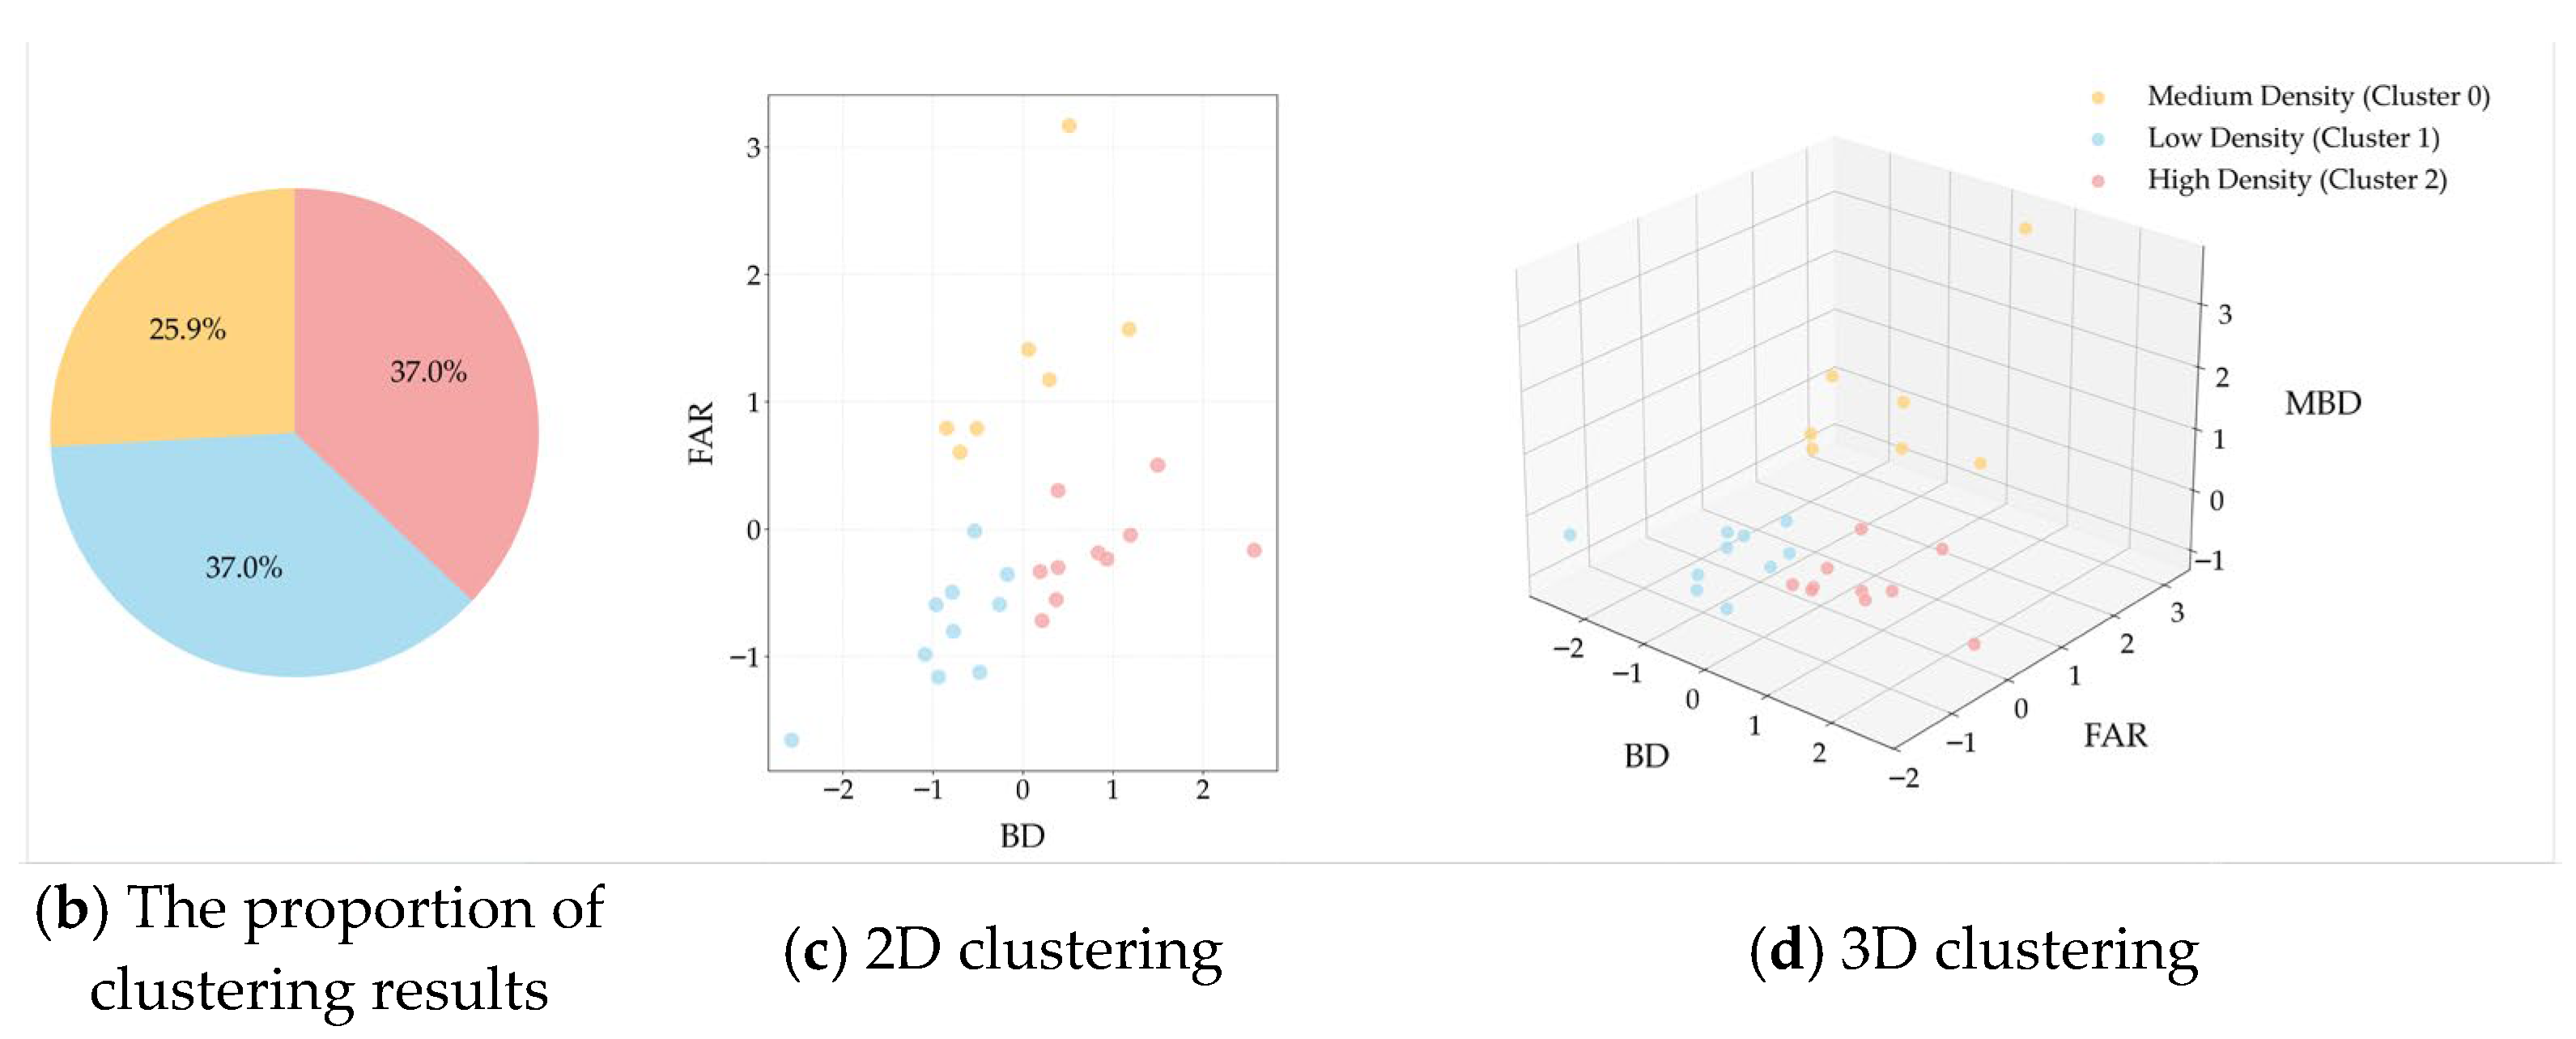
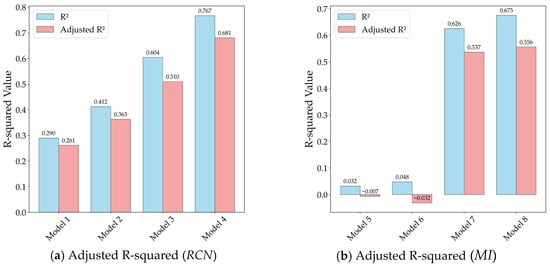
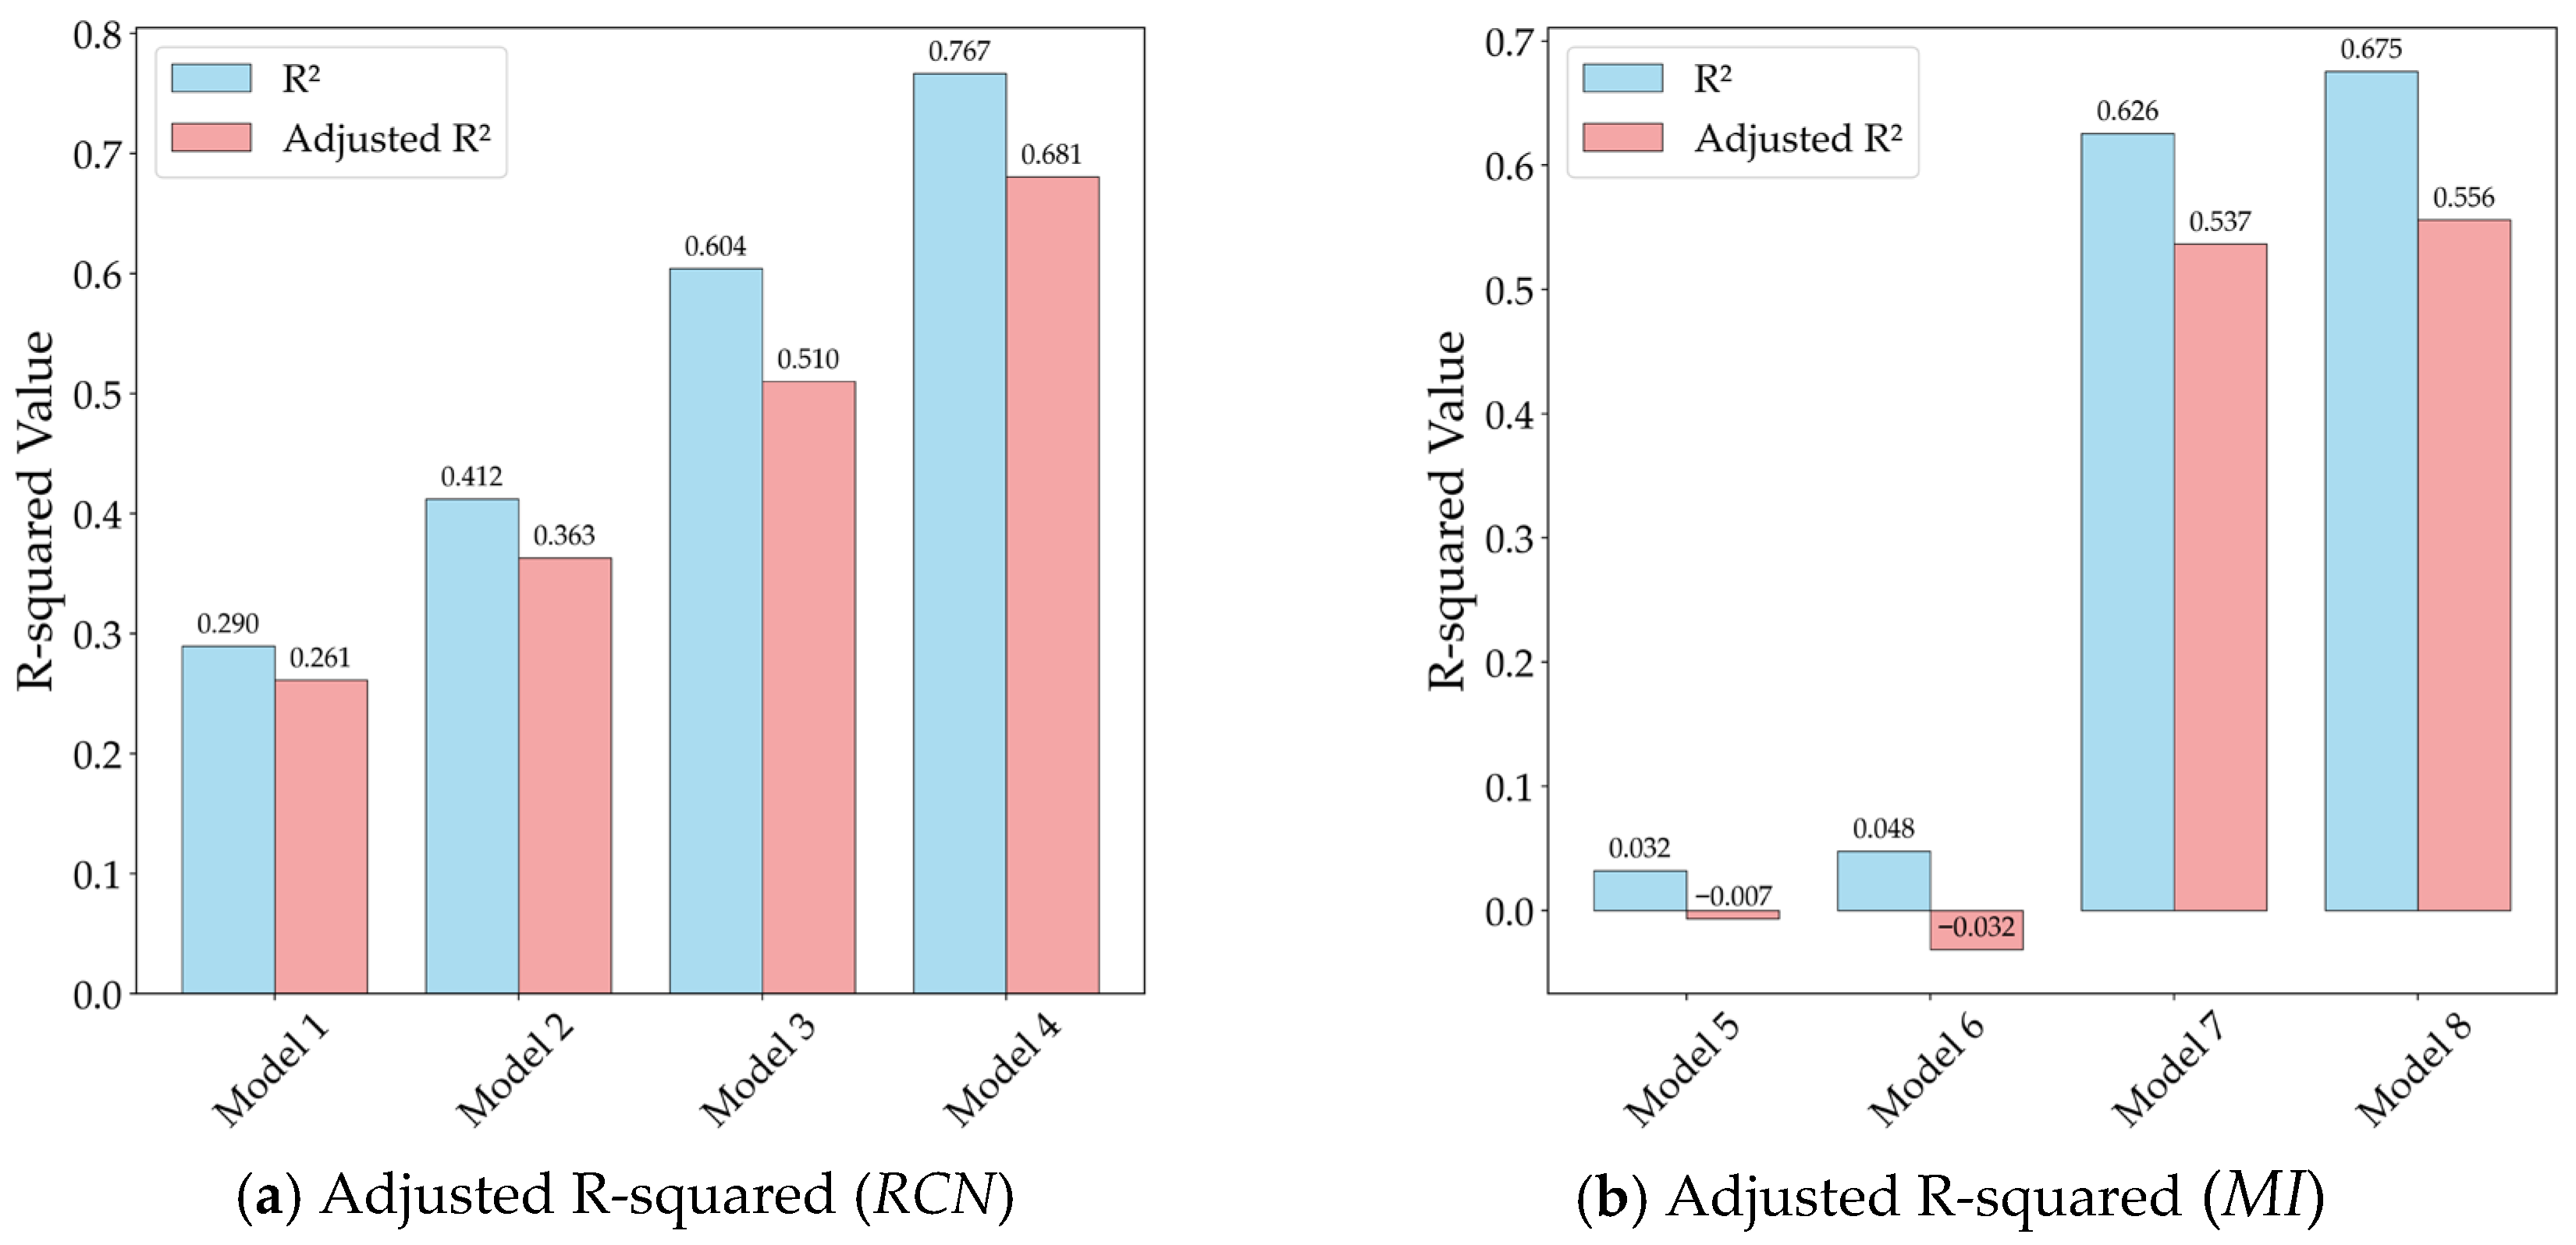
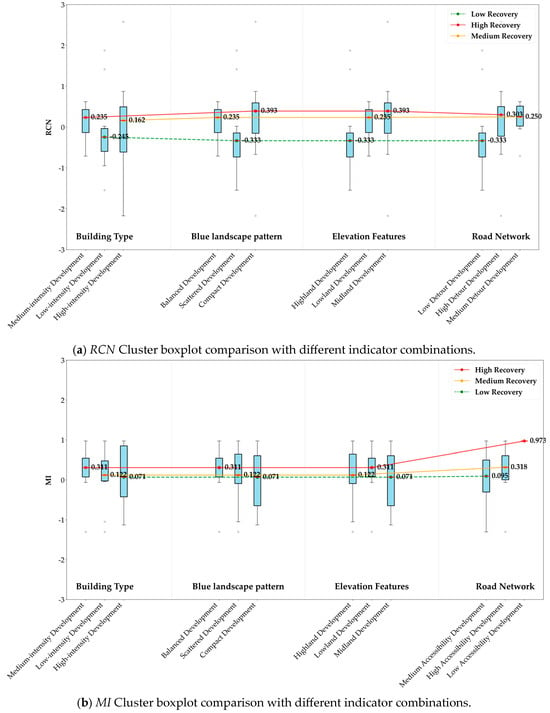
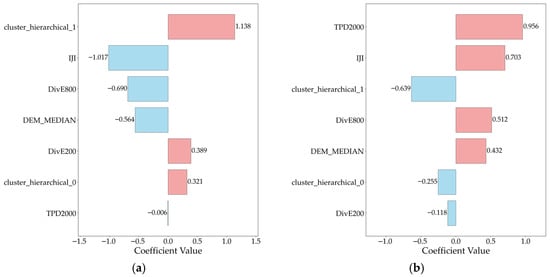
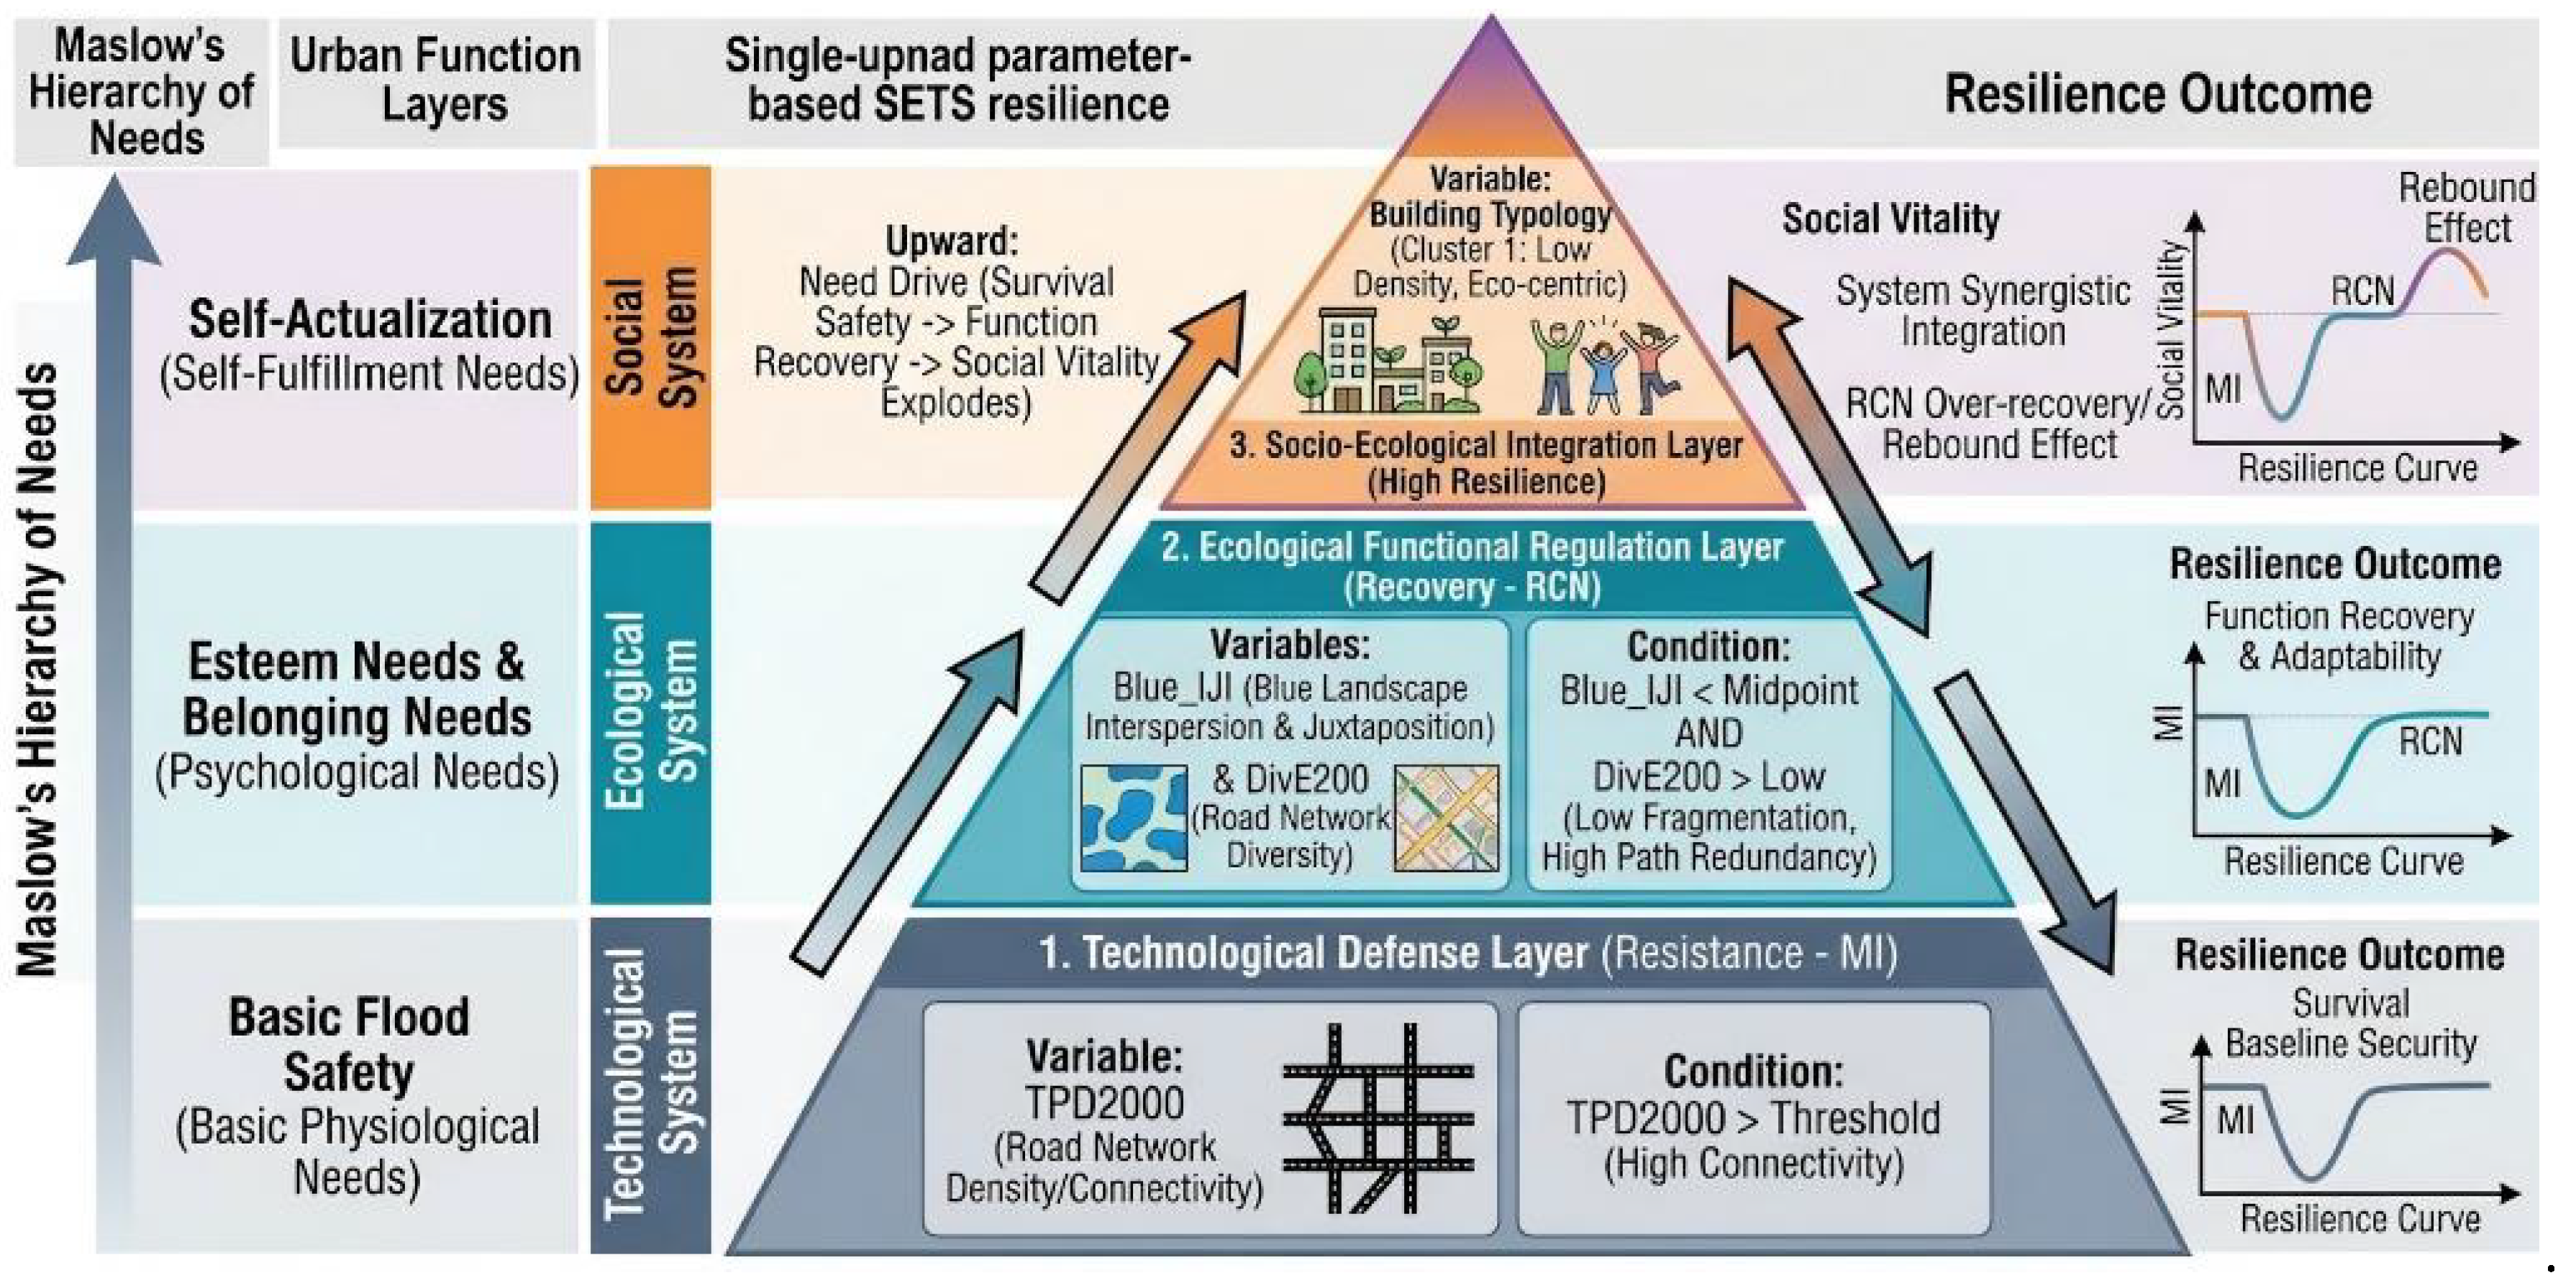
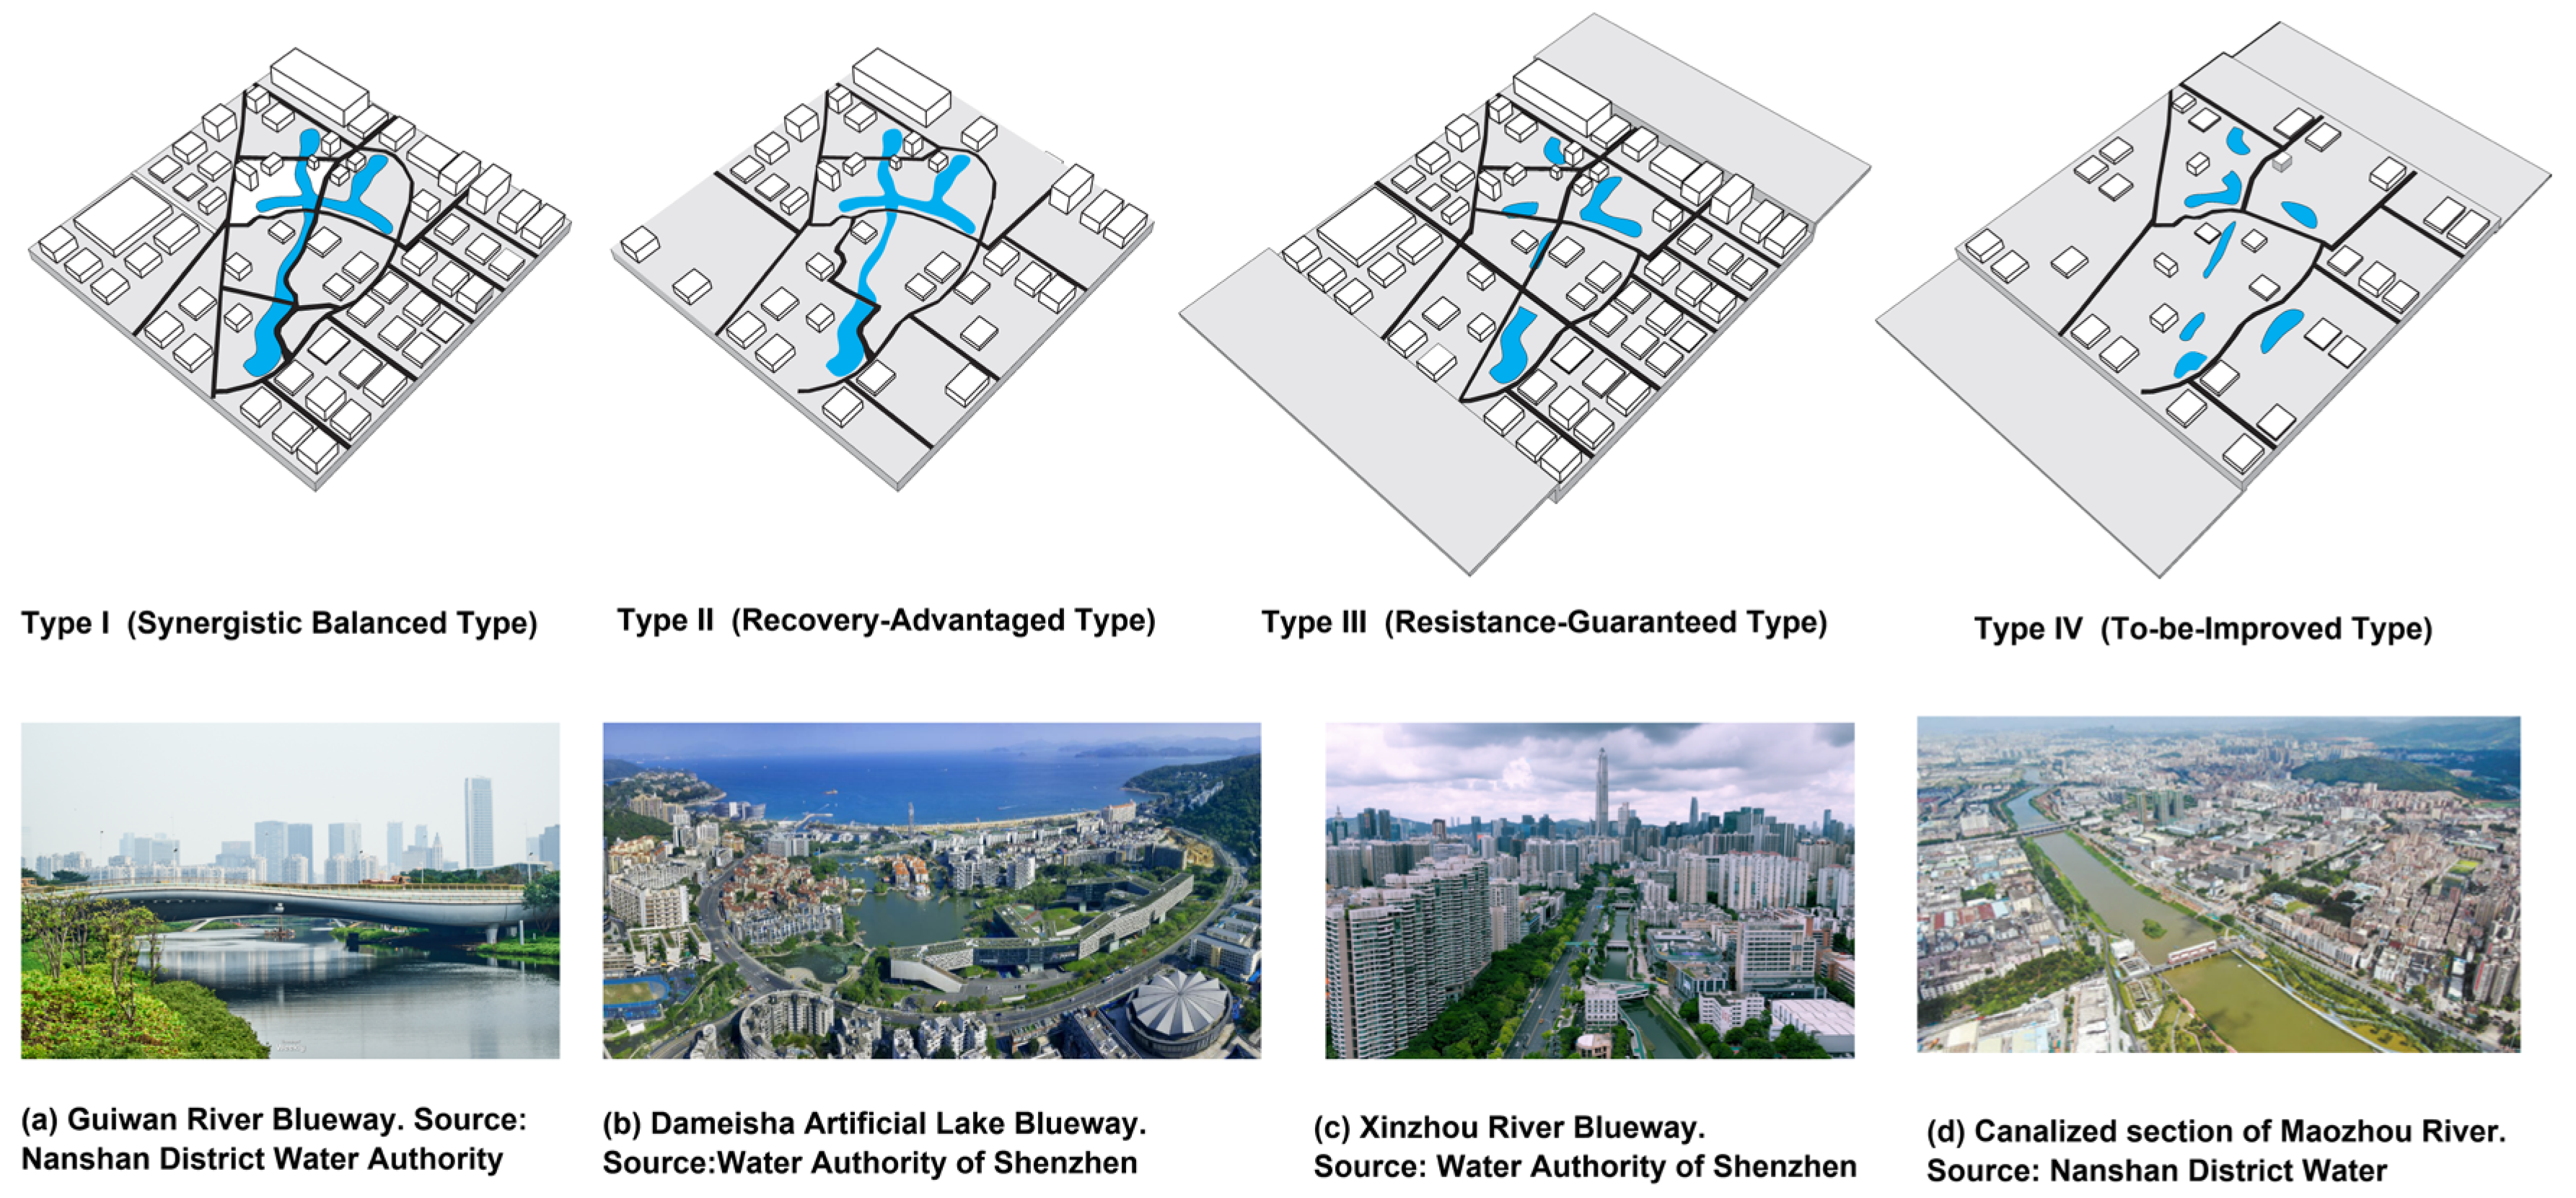

Disclaimer/Publisher’s Note: The statements, opinions and data contained in all publications are solely those of the individual author(s) and contributor(s) and not of MDPI and/or the editor(s). MDPI and/or the editor(s) disclaim responsibility for any injury to people or property resulting from any ideas, methods, instructions or products referred to in the content. |
© 2026 by the authors. Licensee MDPI, Basel, Switzerland. This article is an open access article distributed under the terms and conditions of the Creative Commons Attribution (CC BY) license.