


Abstract
Against the backdrop of dietary structure evolution and the “big food concept” strategy, there has been a shift from the traditional grain-centric perspective toward a diversified supply system. Taking Hubei Province—a major grain-producing region in China—as a case study, this research establishes a multi-criteria evaluation system and conducts analysis using statistical yearbooks and land survey data. By integrating natural conditions, economic benefits, and production capacity, the suitability of cultivated land for growing grain crops, cash crops, and forage crops is assessed. Concurrently, landscape pattern indices were applied to quantify the degree of farmland fragmentation. Employing a self-organizing mapping (SOM) neural network model, we synthesized suitability and fragmentation data to delineate differentiated farmland conservation zones. The results revealed significant spatial heterogeneity in crop suitability and fragmentation levels. High-suitability zones for grain crops were concentrated in the Jianghan Plain, while forage crops exhibited higher suitability in northeastern and southeastern Hubei. Farmland fragmentation showed a spatial pattern of lower levels in central Jianghan Plain, gradually increasing toward surrounding hilly and mountainous areas. SOM clustering effectively partitioned farmland into six functional zones: multifunctional agricultural zones, mixed farming zones, grain crop zones, cash crop zones, forage crop zones, and production improvement zones. This multi-source geographic and statistical data-driven zoning framework provides scientific basis for targeted policy interventions. It enables the quantitative management, quality enhancement, and spatial optimization of farmland resources, thereby operationalizing the big food concept to strengthen regional food security.
1. Introduction
Farmland resources serve as the cornerstone of national food security and as a vital lifeline for sustainable social development [1,2,3]. Over the past few decades, China has steadfastly upheld its farmland protection red line while continuously enhancing agricultural productivity, achieving nineteen consecutive years of grain production growth (2004–2022). With only 9% of the world’s farmland, China has sustained nearly 20% of the global population [4,5], effectively safeguarding the fundamental foundation of food security. However, as living standards rise and dietary patterns evolve, societal demands have shifted from merely “eating enough” to “eating well and healthily.” The traditional approach to farmland conservation, centered solely on grain output, struggles to adapt to the trend toward diversified and nutritious food consumption. Against this backdrop, the concept of a big food concept has emerged, emphasizing the comprehensive and multi-pathway development of food resources from farmland, grasslands, oceans, microorganisms, and beyond to build a more sustainable food supply system [6,7]. This concept also implies that the conservation and utilization of farmland resources should not be measured solely by grain output. There is an urgent need to transform farmland protection strategies, requiring a shift from single-crop grain production toward crop structure transformation and coordinated production layouts across agricultural sectors [7,8]. In recent years, scholars have further deepened the theoretical implications of the big food concept. Li Wenbo et al. [9] adopting a synergistic perspective of “storing grain in land” and “storing grain in technology,” propose that developing non-traditional farmland is a crucial pathway to expand agricultural production space. This approach aims to overcome the bottleneck of arable land resources through technological innovation and cultivate new-quality productive forces in agriculture. The big food concept advocates treating grain production as the cornerstone, emphasizing the necessity of self-sufficiency in cereals and food security, while also promoting the stable supply of major grains from farmland [7]. This concept maintains the importance of farmland protection and drives its functional evolution from single-purpose grain production toward a diversified, synergistic “grain-cash crops-forage” model, thereby systematically addressing national food security strategy requirements.
Currently, research on farmland utilization zoning has established a relatively mature paradigm, yet it still faces three major limitations. In terms of research perspectives, studies have focused on aspects such as the level of intensive farmland utilization [10,11], quality grading assessments [12,13], and the coordinated coupling of “production, living, and ecological” functions [14,15,16,17]. Li Wuyan et al. pointed out that the concept of optimizing the spatial layout of cultivated land should shift from “food security” to a “broader food perspective,” and from “quantity-based considerations” to a “quantity-quality-ecology-health” to achieve multidimensional synergistic goals in farmland conservation [18]. However, these farmland utilization zoning approaches remain rooted in traditional grain-centric perspectives, concentrating on factors like intensive utilization intensity, quality classification, and productive functions. They fail to adequately reflect the demands of dietary structure transformation on the diversified output capacity of farmland. Recent studies have begun addressing new requirements for crop management arising from dietary upgrades. These efforts construct evaluation frameworks for farmland utilization across multiple dimensions—including production suitability, spatial concentration, and regulatory constraints [19]—and explore self-organizing map (SOM) techniques to identify functional gaps in land use [20]. However, in response to the strategic demands of the “big food concept” approach, the concept of farmland utilization zoning still needs to evolve toward a coordinated “grain-cash crops-forage” tripartite structure. Methodologically, while studies have employed techniques like the Analytic Hierarchy Process, composite index models, and spatial autocorrelation analysis [21,22,23,24,25], or utilized three-dimensional magic methods for typology classification [26,27], most evaluations remain one-dimensional. There is a lack of integrated analytical frameworks combining crop suitability, landscape patterns, and spatial clustering. Chen Guoqing et al. developed a field-scale fragmentation measurement index system based on “natural endowment intensity-ownership dispersion-cultivation accessibility,” forming classification remediation guidance plans through the TOPSIS model and three-dimensional cube model [28]. Separate research developed a four-dimensional assessment framework for farmland fragmentation at the “field-household” scale, encompassing resource scale, spatial agglomeration, production management, and ownership division, providing a new tool for precisely identifying fragmentation drivers [29]. Regarding practical integration, existing zoning strategies often remain confined to academic classifications or “land use zoning”within territorial spatial planning. They fail to effectively link with the multi-departmental coordination mechanisms, spatial industrial chain layouts, and differentiated control policies essential for implementing the “big food concept” policy. This results in a structural disconnect between farmland resource allocation and food security objectives.
Regional food security serves as a crucial cornerstone of China’s national food security [30]. As one of the nation’s thirteen major grain-producing provinces, Hubei maintains an annual grain-sown area of approximately 4.67 million hectares. Despite occupying only 3.7% of China’s farmland, it contributes 4.1% of the country’s total grain output [4,5]. While Hubei’s existing farmland resources—in terms of quantity, quality, and productivity—can fully guarantee the goal of “eating enough,” transitioning to the goal of “eating well” still requires rational allocation and regulation of regional farmland resources. Therefore, this paper adopts a “big food concept” and conducts empirical research using Hubei Province as a case study. It constructs a systematic analysis framework of “goal-setting, evaluation, adjustment, and zoning”: First, guided by the objective of transitioning from “eating enough” to “eating well,” it promotes the transformation of the cropping structure from a “grain-cash crops” duality to a “grain-cash crops-forage” triad. Second, it establishes a multidimensional evaluation system for crop suitability on farmland, encompassing natural conditions, economic benefits, and production capacity. Third, it introduces spatial adjustment factors, such as landscape fragmentation and shape regularity, to optimize layout. Finally, it delineates differentiated farmland protection zones to achieve spatial adaptation and precise management of grain crops, cash crops, and forage crops, thereby systematically enhancing regional food security capabilities.
The significance of this study manifests in three aspects: Theoretically, it integrates food security objectives into the farmland protection framework, advancing farmland zoning from “grain-centric” to “diverse adaptation,” thereby expanding the theoretical scope of farmland resource management. Methodologically, it constructs a system for evaluating suitability for “grain-cash crop-forage” integration, combining landscape pattern indices with SOM neural network clustering models to establish a scalable, replicable zoning methodology, enhancing the scientific rigor and precision of farmland utilization classification. At the practical level, by delineating six functional zones—including multifunctional agricultural zones, cash crop zones, and forage crop zones—and proposing differentiated management strategies, this study provides direct decision-making support for implementing the “big food concept” and optimizing farmland resource allocation at the provincial scale. This research not only deepens and expands the traditional framework of farmland zoning but also offers theoretical underpinnings and practical paradigms for advancing regional agricultural structural transformation and achieving sustainable food security objectives.
2. Overview of the Study Area and Research Data
2.1. Overview of the Study Area
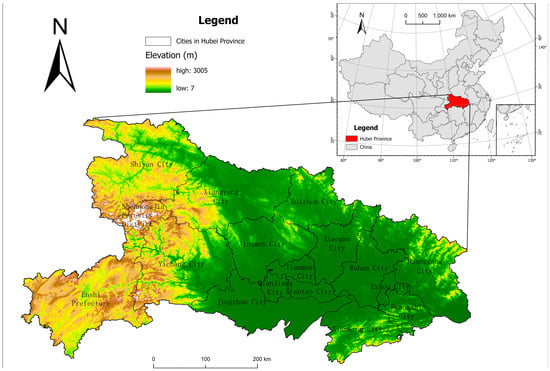
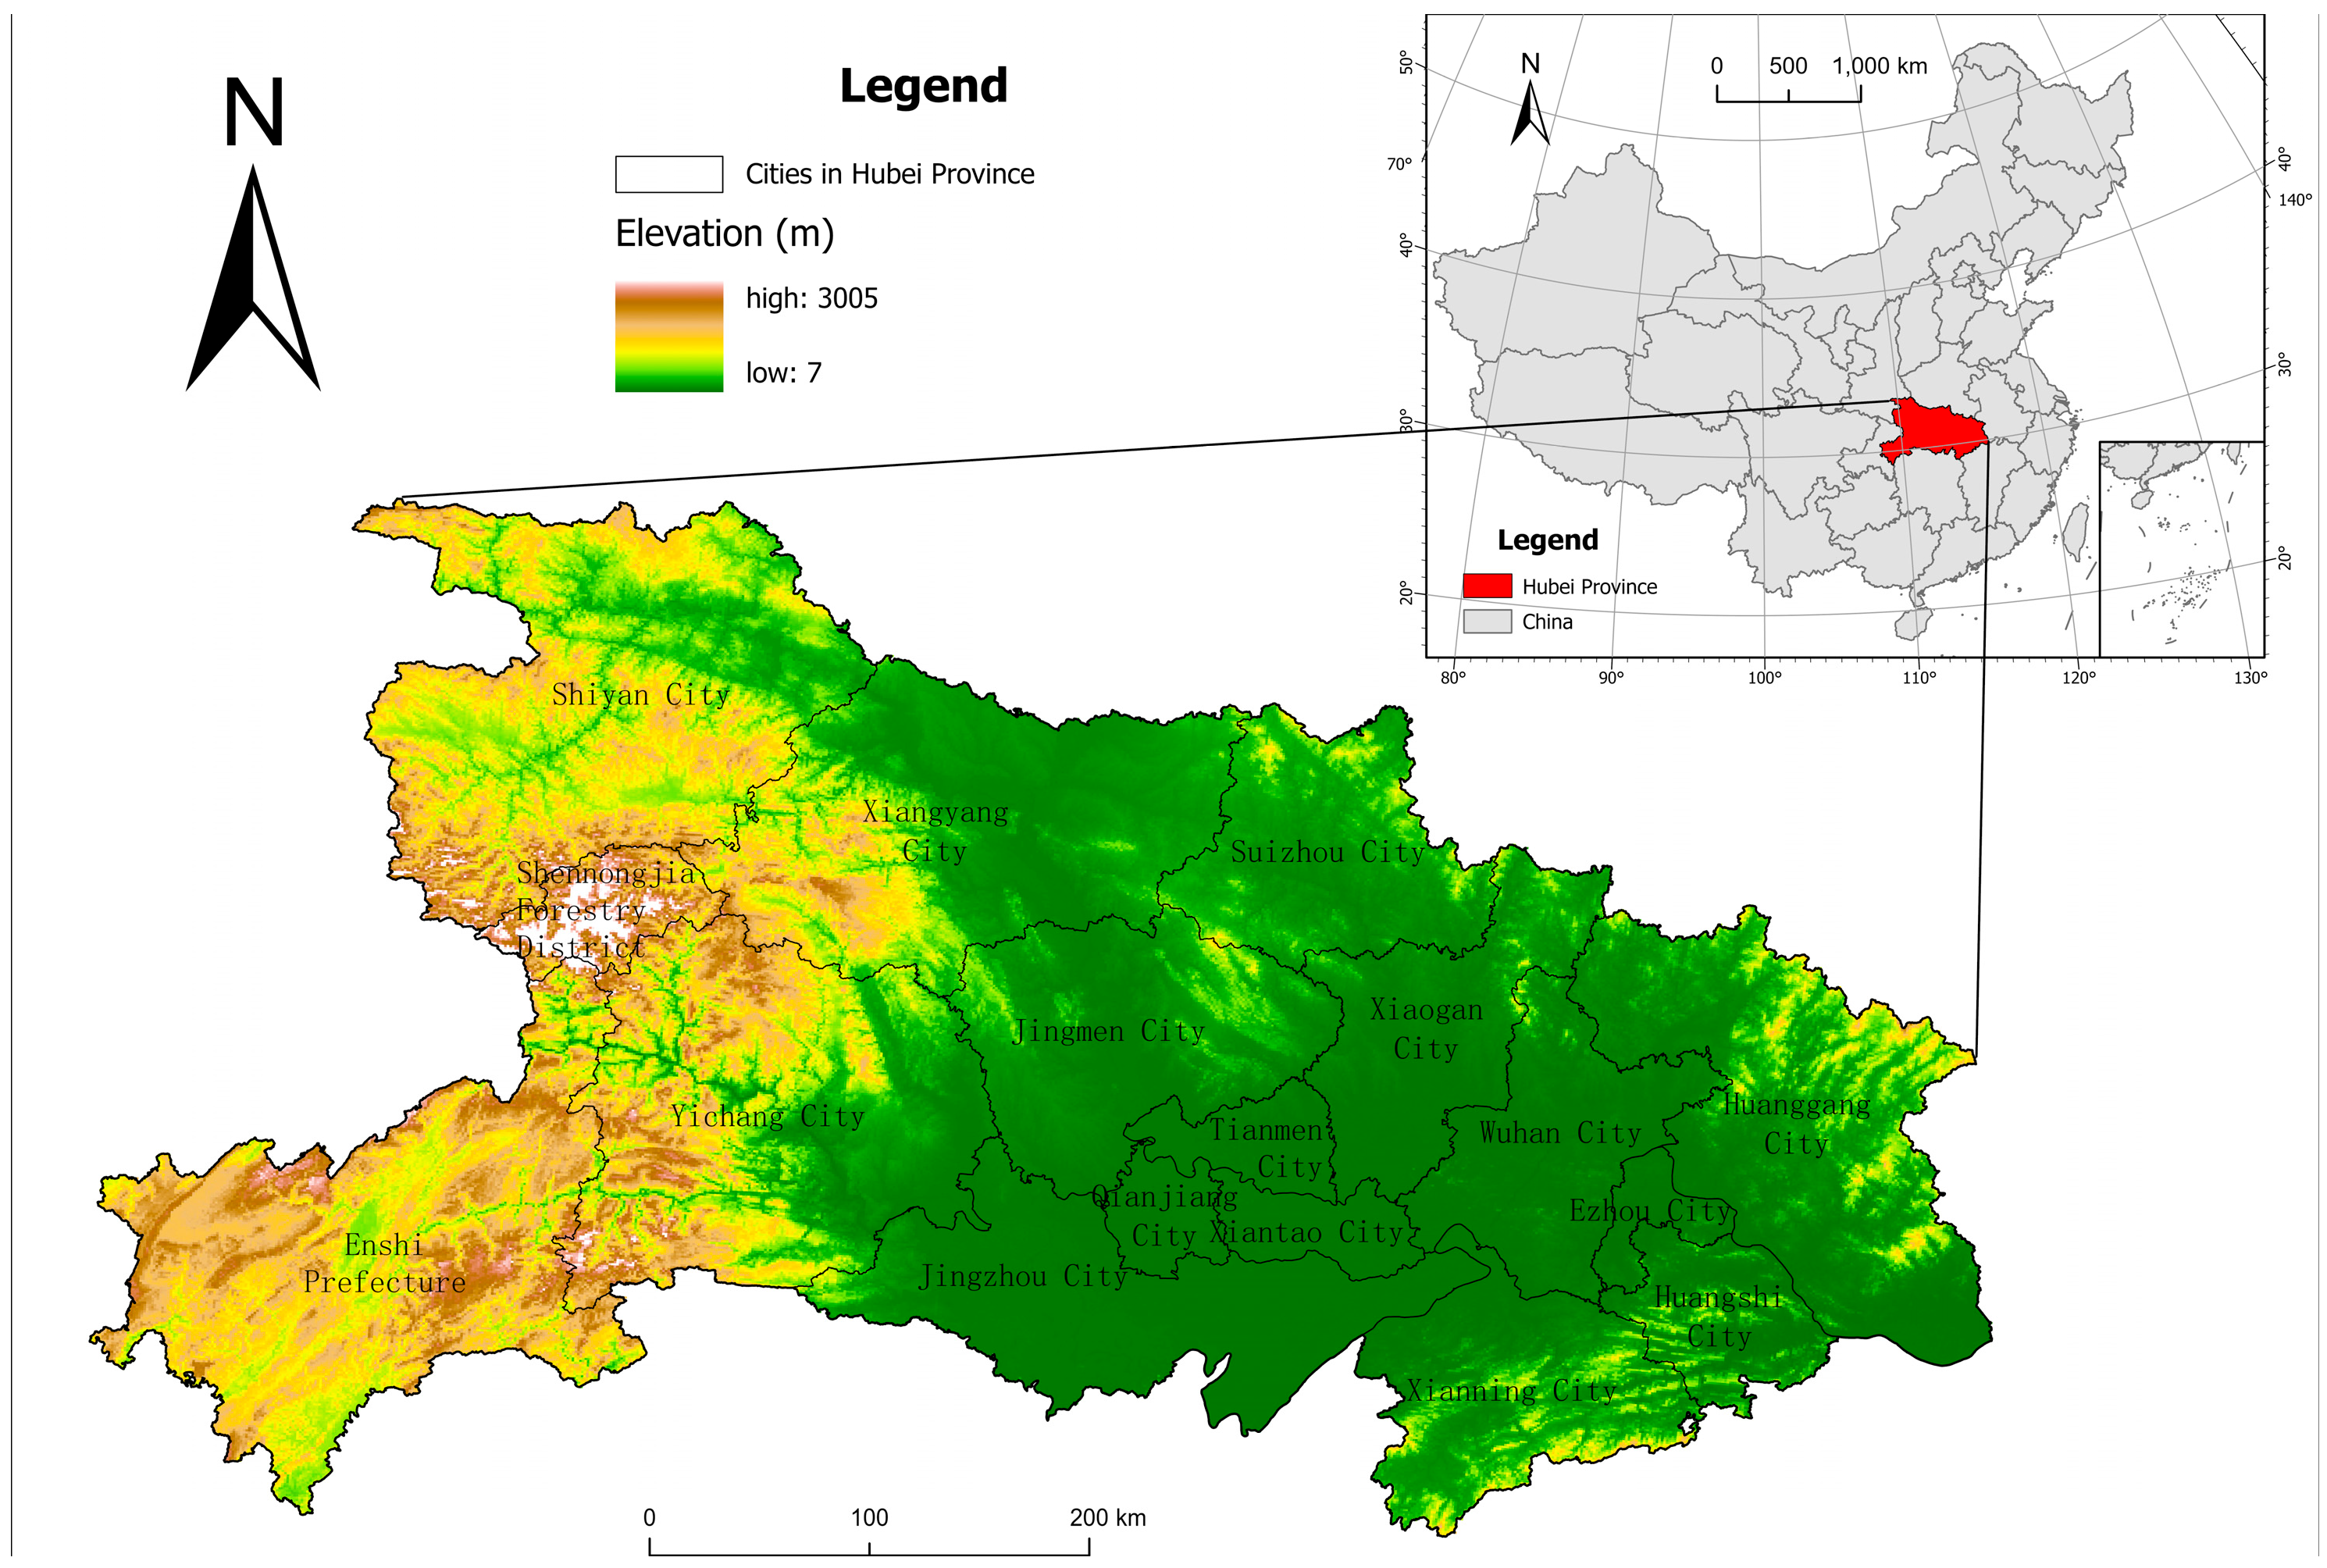
Hubei Province is located in central China, covering a total area of 185,900 square kilometers. It is in charge of 12 prefecture-level cities, 1 autonomous prefecture, and 103 county-level administrative divisions. The land is mostly made up of mountains on the east, west, and north sides, with a flat plain in the middle. Based on these topographical features, Hubei Province can be divided into five regions: Northwestern Hubei, Southwestern Hubei, Northeastern Hubei, Southeastern Hubei, and the Jianghan Plain (Figure 1) [31].
Figure 1.
Sub-regional division of Hubei Province.
In 2023, Hubei Province’s GDP was 5.58 trillion yuan, marking a year-on-year increase of 6.0%. Specifically, the added value of the primary sector was 0.51 trillion yuan, growing by 4.1%; the secondary sector contributed 2.02 trillion yuan, growing by 4.9%; and the tertiary sector added 3.05 trillion yuan, expanding by 7.0%. As one of China’s thirteen major grain-producing provinces, Hubei maintains an annual grain-sown area of approximately 4.67 million hectares. Despite accounting for only 3.7% of the nation’s farmland, it contributes 4.1% of China’s total grain output. Based on the quantity, quality, and productivity of Hubei’s existing farmland resources, the goal of ensuring the people have “enough to eat” can be fully guaranteed. However, the transition toward the goal of “eating well” still requires rational allocation and regulation of regional farmland resources.
2.2. Data Sources and Processing
The data used in this study primarily include socioeconomic data, farmland quality data, land use data, soil organic matter data, meteorological data, and basic geographic data. Socioeconomic data were sourced from statistical materials such as the Hubei Statistical Yearbook and local annual reports. Farmland quality data were obtained from the Hubei Province Farmland Quality Classification Database. land use data primarily from the Hubei Province Land Use Change Survey Database, soil organic matter data mainly from the China Soil Organic Matter Dataset [32], meteorological data mainly from monitoring data at meteorological stations of the Hubei Provincial Meteorological Bureau, DEM data from the Geospatial Data Cloud (http://www.gscloud.cn/), and spatial distribution data on soil erosion from the Hubei Provincial Department of Ecology and Environment.
3. Research Approach and Methodology
3.1. Research Approach
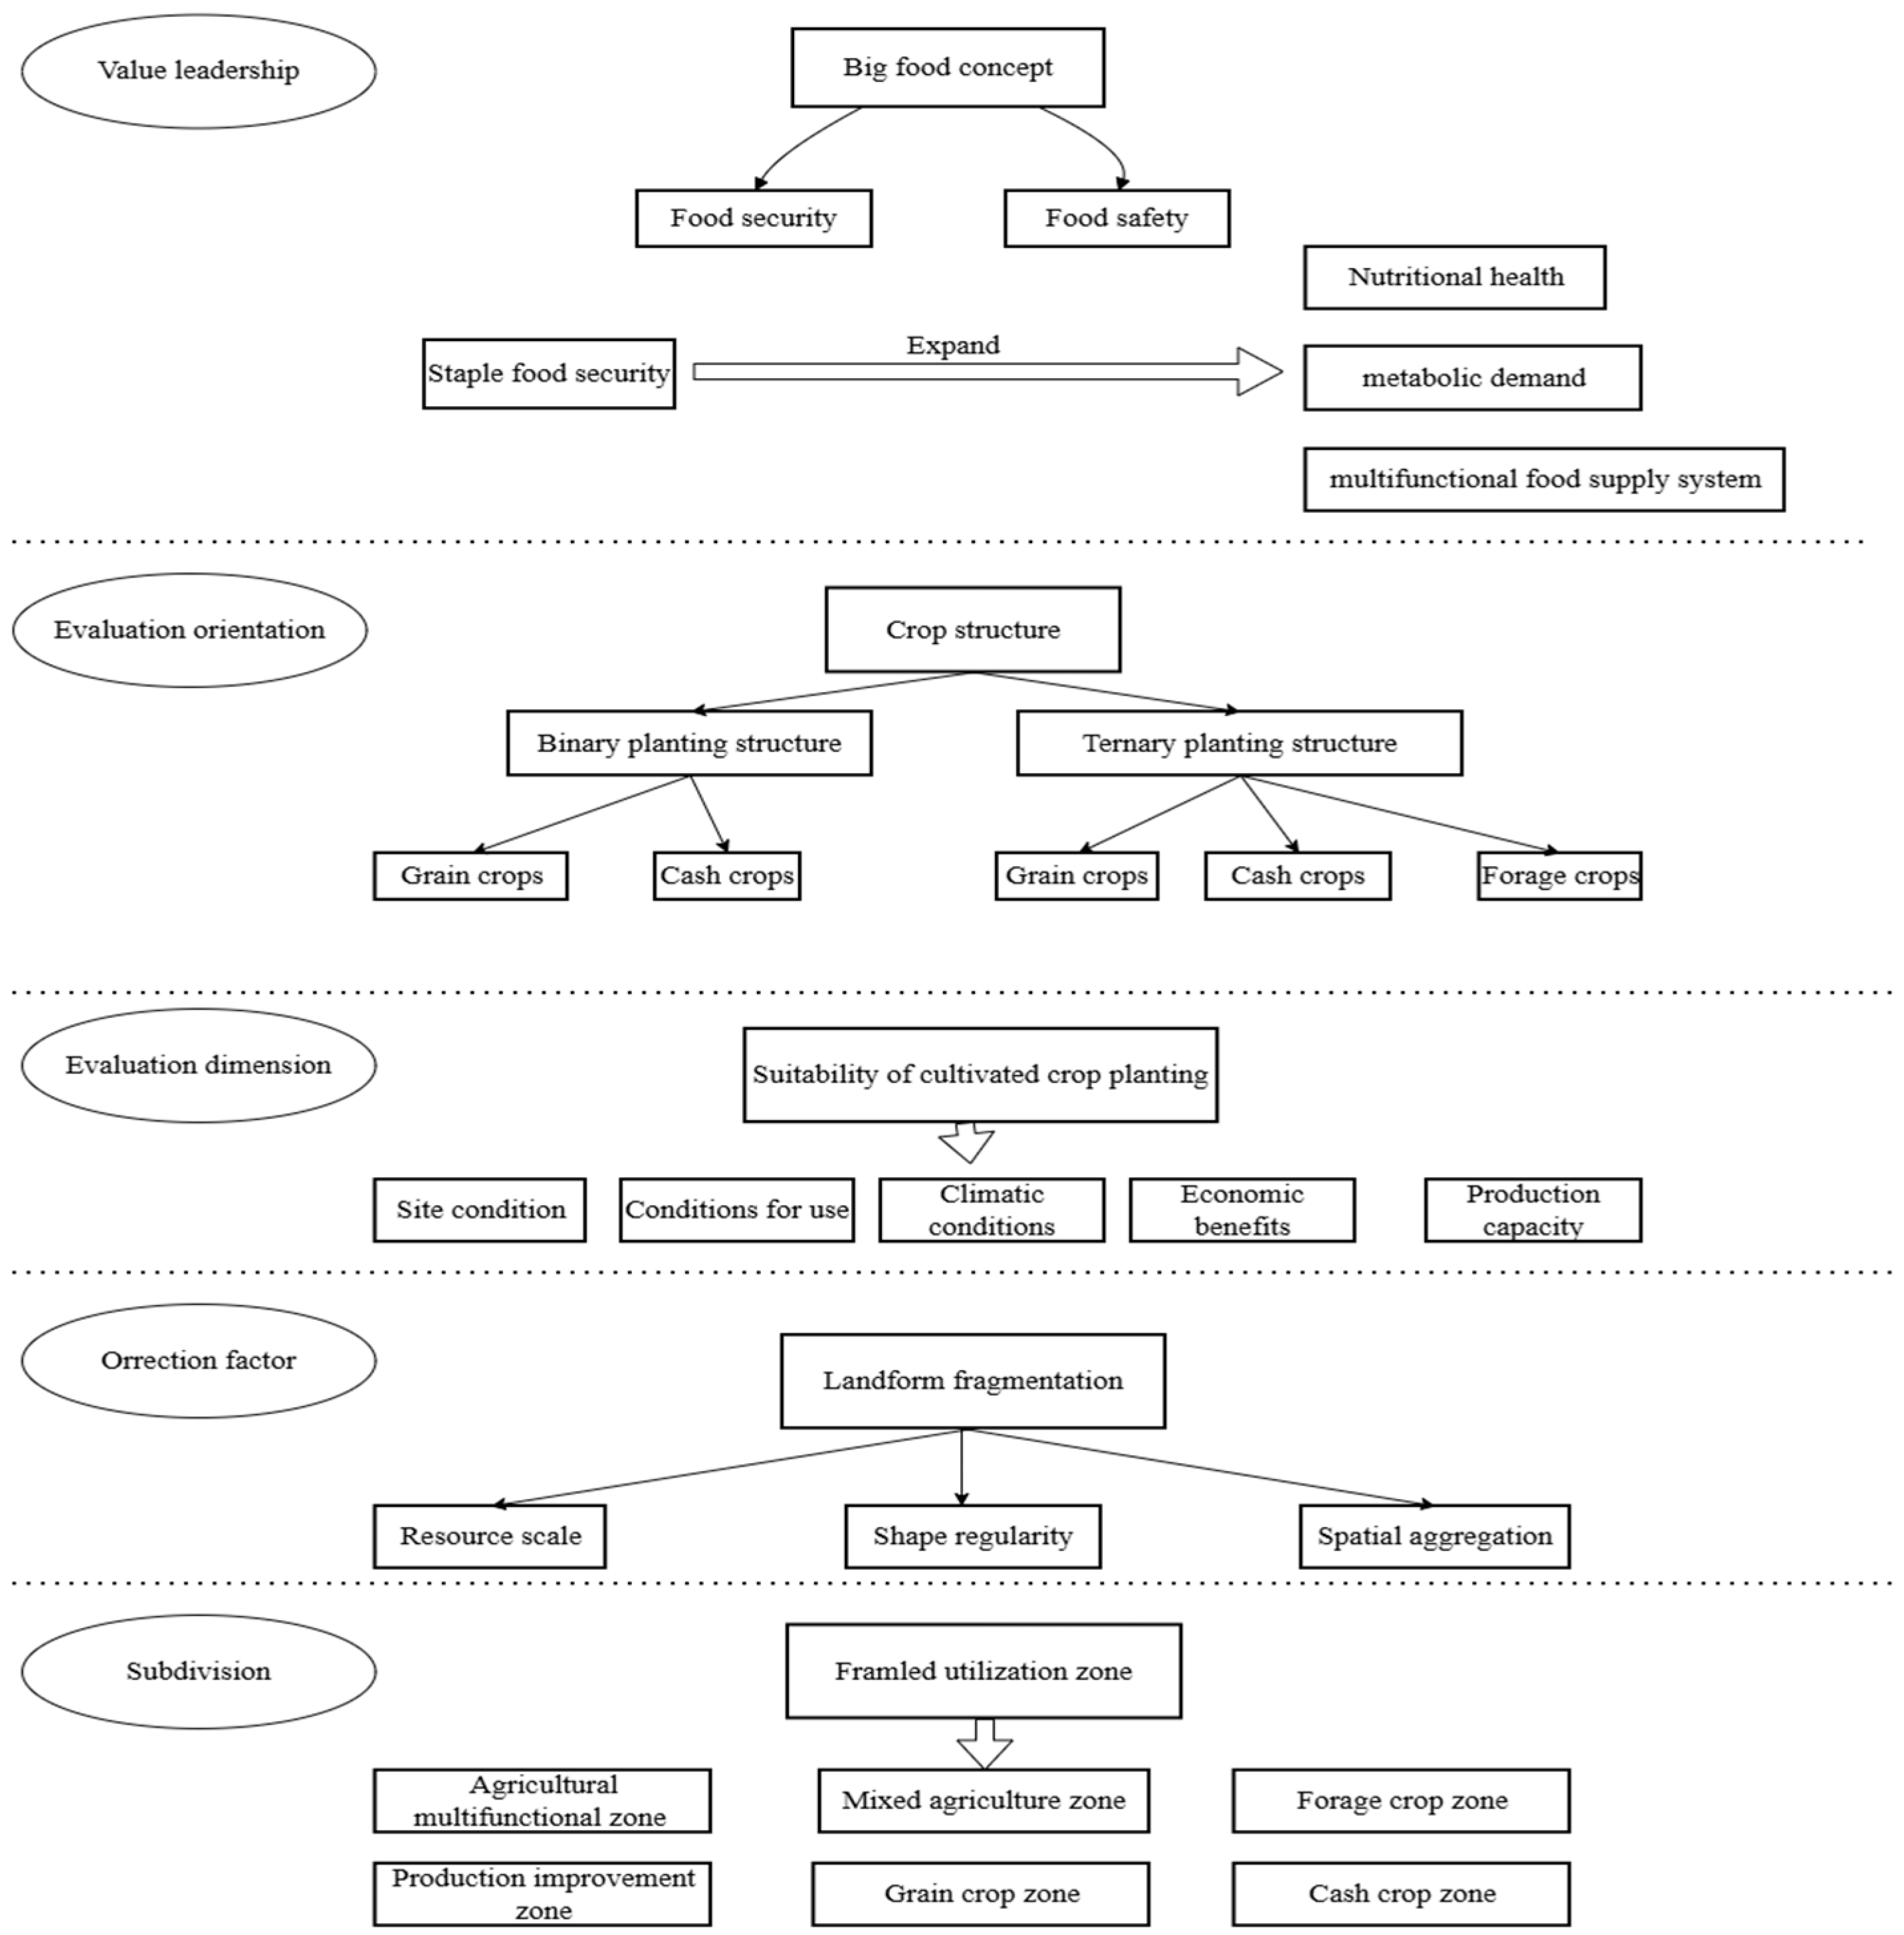
At the value-guidance level, food security under the broader food perspective represents an expansion and extension of grain security. Alongside China’s rapid economic development, the nation’s agriculture and food production are shifting toward meeting the nutritional and health needs of urban and rural residents. This transition marks a new phase moving from “eating enough” to “eating well.” Consequently, the mission of food security has evolved from ensuring staple food security to establishing a diversified food supply system that satisfies residents’ varied food demands and safeguards their nutritional and health standards.
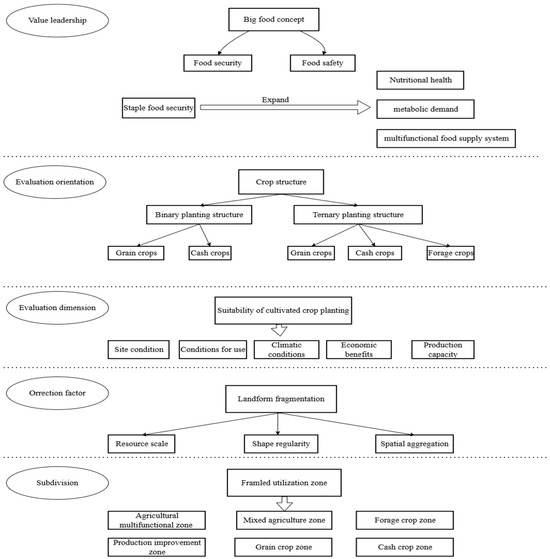
At the operational level, while the broad food perspective emphasizes the comprehensive and multi-pathway development of food resources—expanding food production land from arable resources to encompass the entire national territory—arable resources remain the critical foundational support for implementing this vision. The cropping structure of farmland determines whether these resources can fulfill their pivotal role. First, the cropping structure must transition from the traditional “grain-cash crops” dual structure to a new “grain-cash crops-forage” tripartite structure. Therefore, it is necessary to establish a corresponding evaluation index system for farmland suitability. Based on the suitability for different crop types, factors such as site conditions, utilization conditions, climate conditions, economic benefits generated, and production capacity should be considered to categorically select suitability evaluation indicators for grain crops, cash crops, and forage crops. Secondly, farmland fragmentation should be selected as a key corrective factor. Finally, the SOM neural network model is introduced to delineate farmland utilization zones based on resource characteristics, proposing corresponding farmland resource conservation strategies (Figure 2).
Figure 2.
Framework for delimiting cultivated land utilization zones.
3.2. Evaluation of Crop Suitability for Cultivated Land
This paper establishes an evaluation system for crop suitability on farmland by considering the suitability of three distinct crop types: grain crops, cash crops, and forage crops. The selected indicators cover the primary dimensions commonly used internationally (Table 1) [33]. For land designated for grain crops, the focus is on advancing grain production. The suitability evaluation for grain crops is primarily constructed from three perspectives: site conditions, utilization conditions, and production capacity. For farmland cultivating cash crops, economic benefits serve as the guiding principle. The suitability for cash crop cultivation is primarily evaluated from three perspectives: location conditions, economic conditions, and production capacity. An evaluation indicator system for cash crop cultivation suitability is constructed accordingly. Farmland cultivating forage crops primarily aims to provide high-quality, nutrient-rich feed to meet the growth and development needs of livestock and poultry. The suitability for forage crop cultivation is primarily evaluated from three perspectives: climate conditions, soil conditions, and production capacity. An evaluation indicator system for forage crop cultivation suitability is constructed accordingly.
Table 1.
Cultivated land crop suitability evaluation index system.
First, to eliminate differences in units, magnitude, and positive/negative trends among indicators, the range standardization method was applied, with normalization performed according to each indicator’s influence direction. Next, to ensure all indicators’ contributions were fully and objectively considered, the entropy weighting method was used to calculate their respective weights. Finally, to comprehensively measure the impact of changes in a single or multiple indicators on suitability, the comprehensive evaluation method was employed to compute the suitability index based on the above steps. The specific calculation formula is as follows:
where Si represents the suitability index for crop type i, ranging from 0 to 1, with higher values indicating greater suitability; Wj denotes the weight of indicator j; and Yij signifies the processed value of indicator j for crop type i. Based on the evaluation results of the suitability indices for grain crops, cash crops, and forage crops, the natural breakpoint method was employed to classify them into four categories: Suitable Grade I Areas, Suitable Grade II Areas, Suitable Grade III Areas, and Suitable Grade IV Areas.
3.3. Evaluation of Fragmented Farmland Landscape
The fragmentation of farmland refers to the division of farmland into numerous scattered patches of varying sizes due to natural or human-induced interventions, resulting in a dispersed and disorderly state. This is primarily manifested in the fragmented and disorganized spatial layout of farmland. This fragmentation contradicts the principles of large-scale land management, not only reducing effective arable land area but also exacerbating spatial dispersion and significantly diminishing land productivity [37]. As a quantitative tool, the landscape pattern index effectively quantifies the characteristics of this spatial distribution pattern. By highly condensing landscape pattern information, this index reflects structural composition and spatial configuration information and features.
It is generally recognized that the extent of fragmentation is highly correlated with the size, shape, and spatial distribution characteristics of farmland patches. Typically, smaller patch size, more complex patch shape, and more dispersed spatial distribution indicate higher levels of farmland fragmentation. Therefore, this study constructs an evaluation index system for farmland landscape fragmentation based on three dimensions: resource scale, shape regularity, and spatial aggregation, selecting corresponding landscape pattern indices (Table 2).
Table 2.
Evaluation index system for cultivated land landscape fragmentation.
After completing the calculations for each indicator, the raw data was processed using the range-standardization method. For positive indicators (where higher values indicate lower fragmentation levels, such as MPS, LPI, and AI), standardization was performed using Formula (2). For negative indicators (where higher values indicate higher fragmentation levels, such as PD, LSI, ED, AWMSI, MNN, and FS), standardization was performed using Formula (3):
Here, Xij denotes the raw value of the jth indicator for the ith evaluation unit, represents its standardized value, and max(Xj) and min(Xj) denote the maximum and minimum values of the jth indicator, respectively.
The entropy weight method was employed to calculate the weights Wj for each indicator (see Table 2 for weight values). Based on this, the “1 minus weighted sum” approach was used to construct the farmland fragmentation index [38], with the calculation formula as follows:
Among these, Fi represents the farmland fragmentation index for the ith evaluation unit, with values ranging from [0, 1]. A higher Fi value indicates a greater degree of farmland fragmentation. n denotes the total number of indicators.
3.4. Farmland Utilization Zoning Based on the Som Neural Network Model
The Self-Organizing Map (SOM) is an unsupervised clustering algorithm proposed by Finnish scholar Tenvo Kohonen [39]. As an auxiliary clustering method that simultaneously considers spatial and attribute characteristics, SOM has been widely applied in farmland productivity zoning [25], ecological sensitivity zoning [40], rural revitalization zoning [40,41]. This model achieves data clustering by mapping high-dimensional data onto a low-dimensional (typically two-dimensional) space while preserving the data’s topological structure. The SOM clustering process involves: (1) Initializing the output layer’s neural grid and randomly initializing each neuron’s weight vector. (2) Randomly selecting an input vector from the input data. (3) Calculating the distance between this input vector and each neuron’s weight vector. (4) Select the neuron with the smallest distance as the winning neuron. (5) Update the weights of the winning neuron and its neighboring neurons to bring them closer to the current input vector. The specific formula is as follows:
In the equation, W(t) denotes the neuron’s weight vector, η(t) represents the learning rate, hBMU(t) indicates the neighborhood function, and D signifies the current input vector. This paper inputs the suitability grades for grain crops, cash crops, and forage crops, along with the fragmentation grade of farmland, into the SOM as input vectors, and selects a clustering number of 6.
4. Results
4.1. Evaluation Results of Cropping Suitability for Farmland
4.1.1. Evaluation Results of Grain Crop Suitability
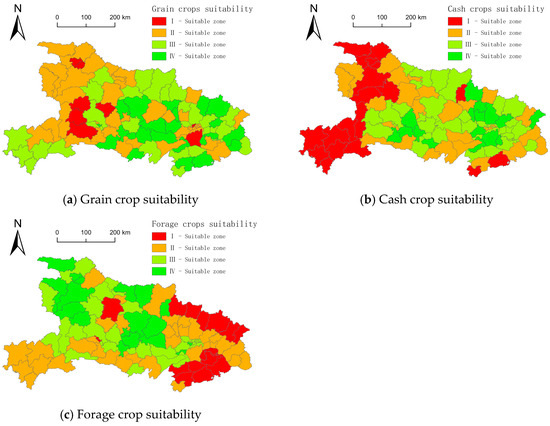
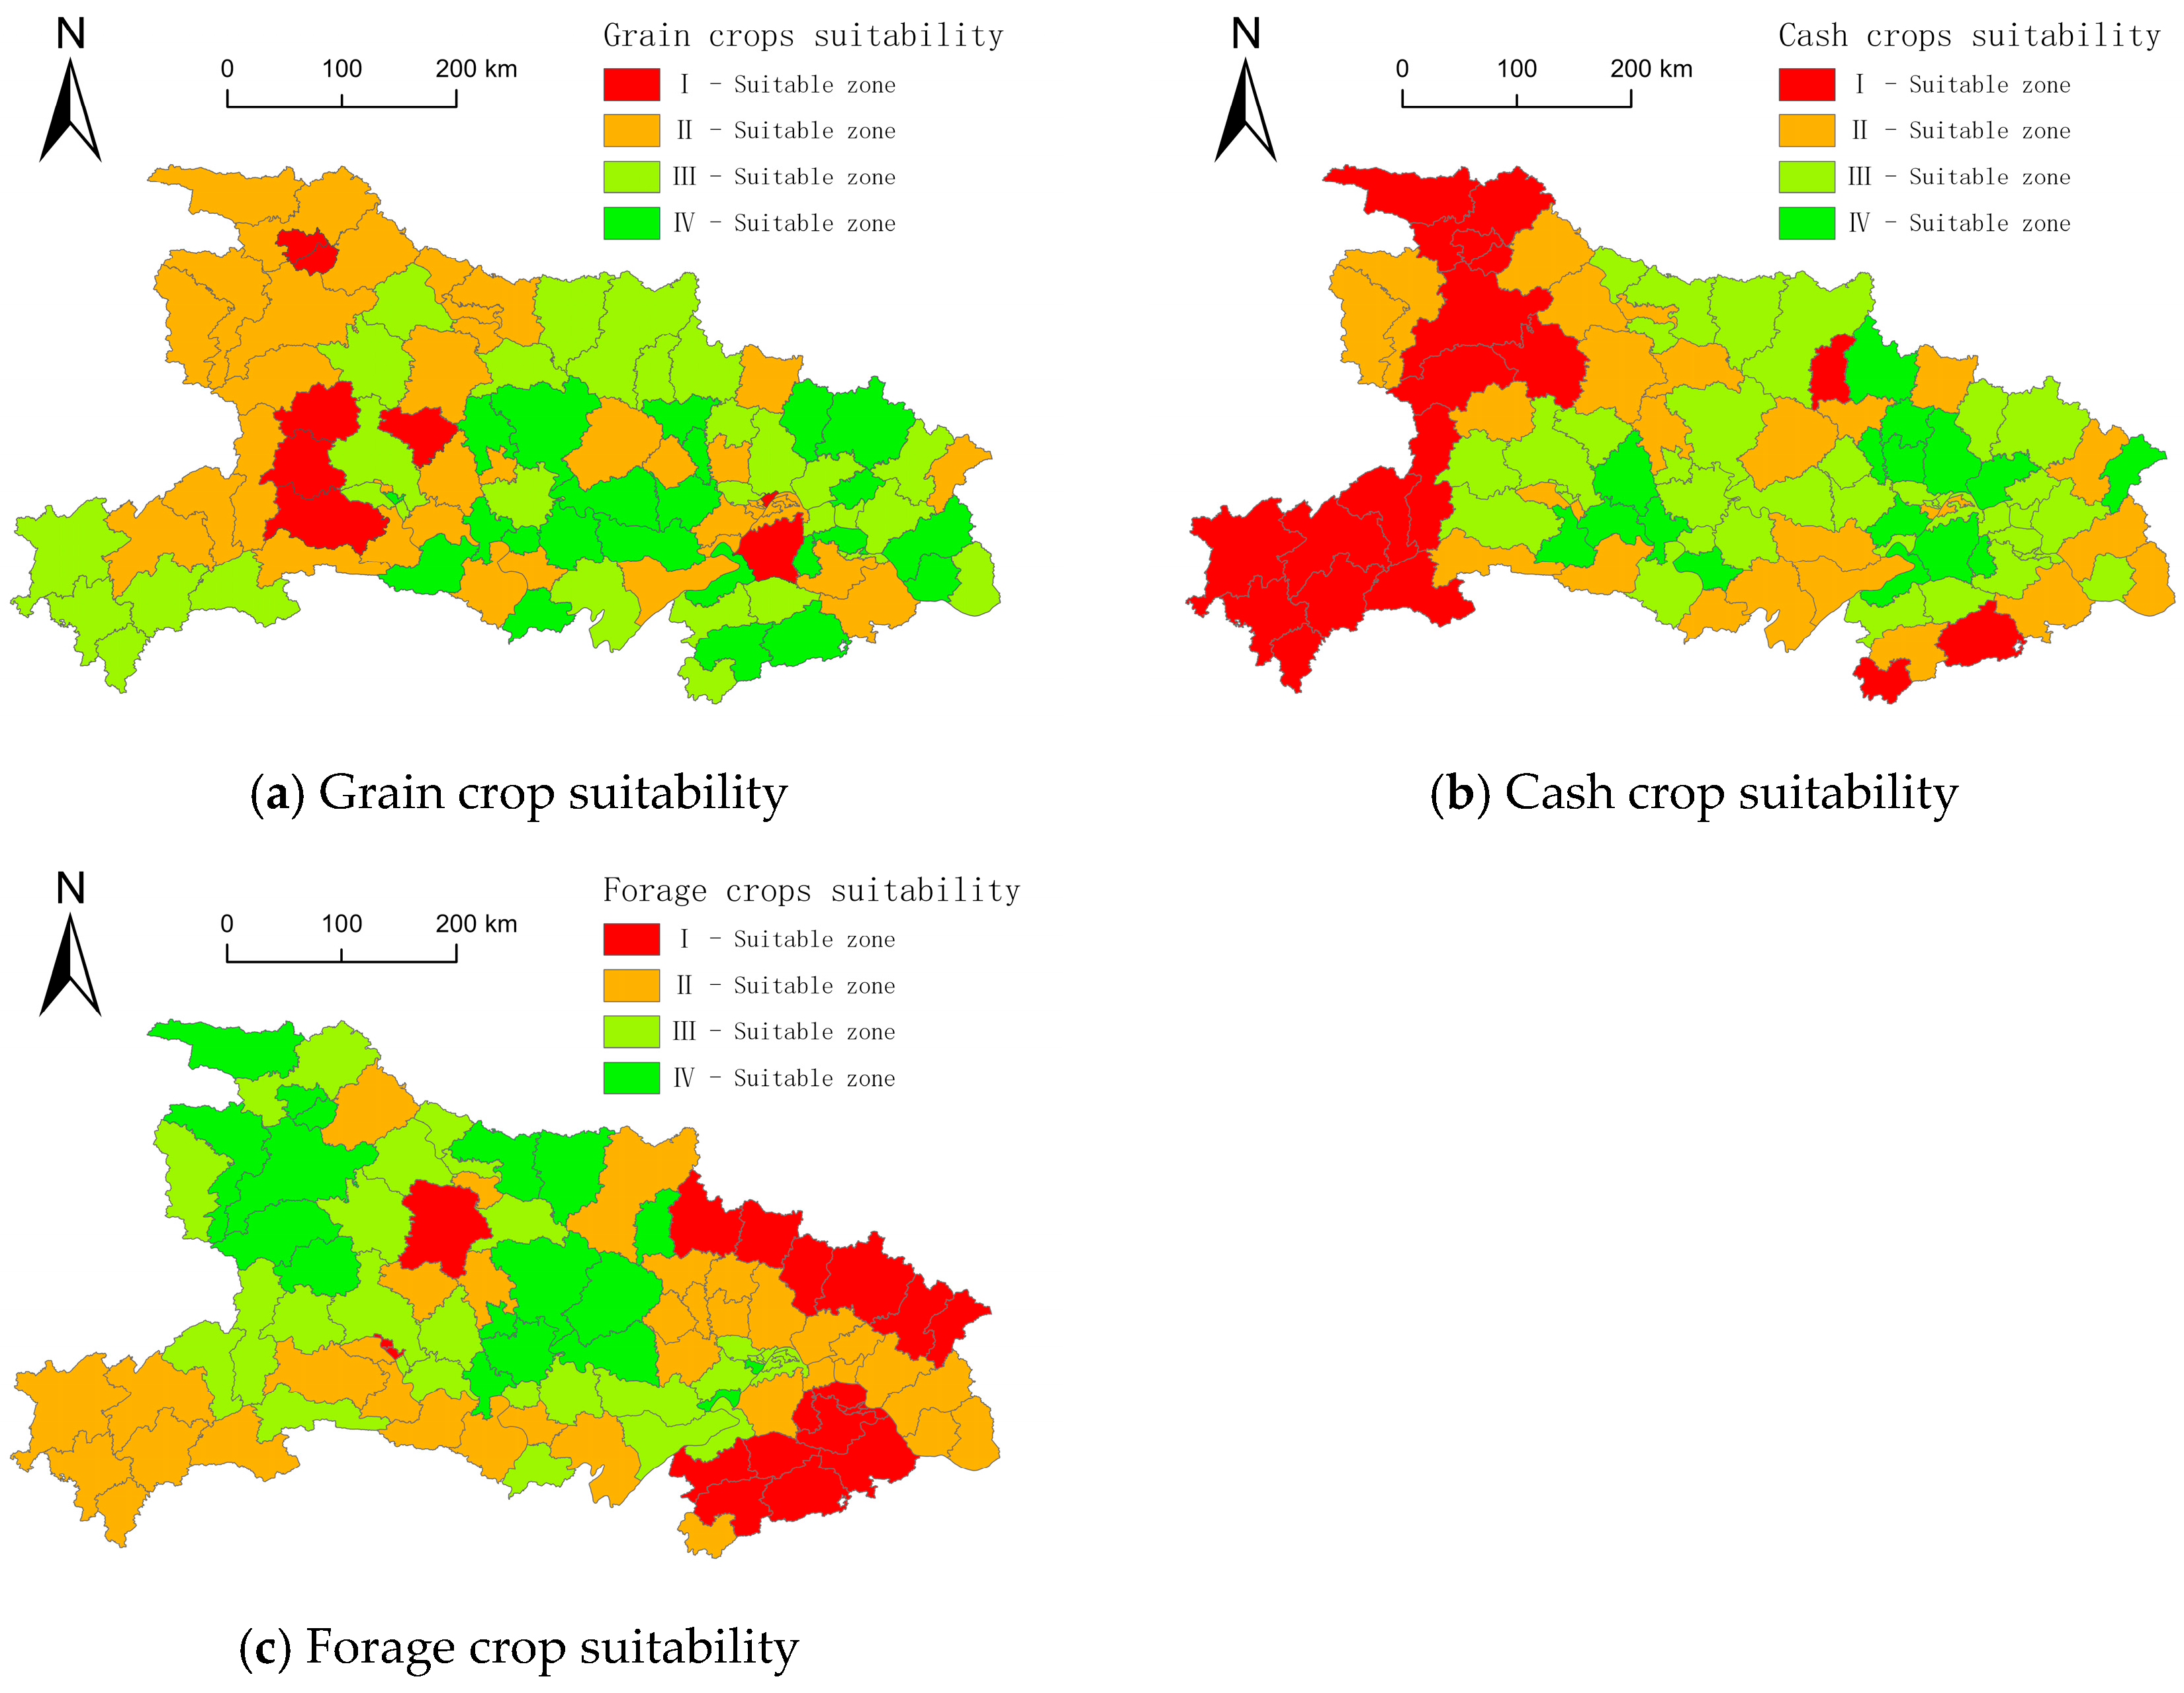
For grain crop cultivation suitability, Hubei Province’s suitability index ranges between [0.246, 0.651]. Using the natural breakpoint method, grain crop suitability values are divided into four zones: Suitable Zone I [0.246, 0.306], Suitable Zone II [0.323, 0.405], Suitable Zone III [0.409, 0.481], and Suitable Zone IV [0.487, 0.651] (as shown in Figure 3a). Among these, Suitable Zone I involved the fewest county-level units (only 8) and the smallest cultivated land area (1552.55 km2), with relatively low irrigation guarantee rates and grain yields. Suitable Level II zones encompass the largest number of county-level units (39) and the greatest cultivated land area (16,365.88 km2). Irrigation guarantee rates show overall improvement within these zones, accompanied by relatively high cropping intensity indices. The Suitable Grade III zone comprises 32 county-level units with 16,045.40 km2 of farmland. This zone exhibits relatively high spatial contiguity of cultivated land. The Suitable Grade IV zone includes 24 county-level units with 14,559.36 km2 of farmland. This zone features relatively flat terrain and a higher concentration of high-quality farmland, resulting in comparatively higher grain yield potential.
Figure 3.
Spatial characteristics of cultivated land crop suitability in Hubei Province.
4.1.2. Evaluation Results of Cash Crop Suitability
In terms of cash crop suitability, Hubei Province’s suitability index ranges between [0.115, 0.538]. Using the natural breakpoint method, suitability values are divided into four zones:
The index ranges for different zones are as follows: Suitable Zone I [0.115, 0.319], Suitable Zone II [0.321, 0.392], Suitable Zone III [0.397, 0.450], and Suitable Zone IV [0.462, 0.538] (as shown in Figure 3b). Among these, Suitable Zone I comprises 18 county-level units with a cultivated land area of 10,860.07 km2. This zone exhibits relatively low road network density and lower agricultural output per unit area, with both the proportion of sown area and yield per unit area for major cash crops being comparatively low. The suitable Grade II zone comprises 28 county-level units with a cultivated area of 10,328.53 km2. Yields of major cash crops in this zone are relatively higher than those in the suitable Grade I zone. Level III suitable areas encompass the largest number of county-level units at 41, with the greatest cultivated land area of 20,046.13 km2. Administrative districts within this zone are relatively close to the city center and exhibit relatively high vegetable yields per unit area. Level IV suitable areas comprise the fewest county-level units (16) and the smallest cultivated land area (7288.46 km2). These areas exhibit relatively high per capita and per unit area agricultural output values, along with higher cropping intensity and yield levels for major cash crops.
4.1.3. Evaluation Results of Forage Crop Suitability
For forage crop suitability, Hubei Province’s suitability index ranges between [0.296, 0.605]. Using the natural breakpoint method, suitability values are divided into four intervals: Suitable Grade I Zone [0.332, 0.383], Suitable Grade II Zone [0.388, 0.428], Suitable Zone III [0.432, 0.476], and Suitable Zone IV [0.481, 0.548] (as shown in Figure 3c). Among these, Suitable Zone I comprises 21 county-level units with a cultivated area of 9615.70 km2. Within this zone, the proportion of sown area and yield per unit area for major forage crops are relatively low, and rainfall during the crop growth period generally fails to meet the growth requirements of forage crops. Zone II encompasses the largest number of county-level units (35) and the greatest cultivated area (19,619.49 km2). Soil texture and organic matter content within this zone generally meet the requirements of major forage crops. Suitable Grade III zones encompass 29 county-level units with 12,755.52 km2 of cultivated land. These zones exhibit higher overall soybean planting ratios and corn yields compared to Suitable Grade I and II zones, along with relatively lower frequency of high-temperature damage during forage crop growth periods. Zone IV has the fewest county-level units (18) and the smallest cultivated area (6532.48 km2). Rainfall during the growth period of forage crops in this zone generally meets crop requirements. Additionally, soybean and corn yields in this zone are relatively high.
4.2. Evaluation Results of Farmland Fragmentation
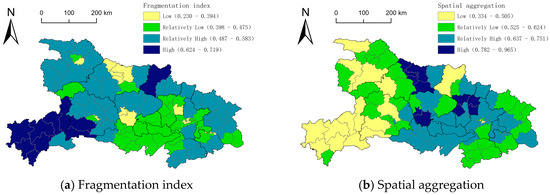
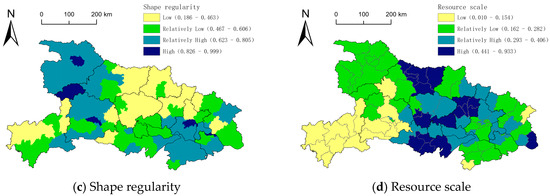
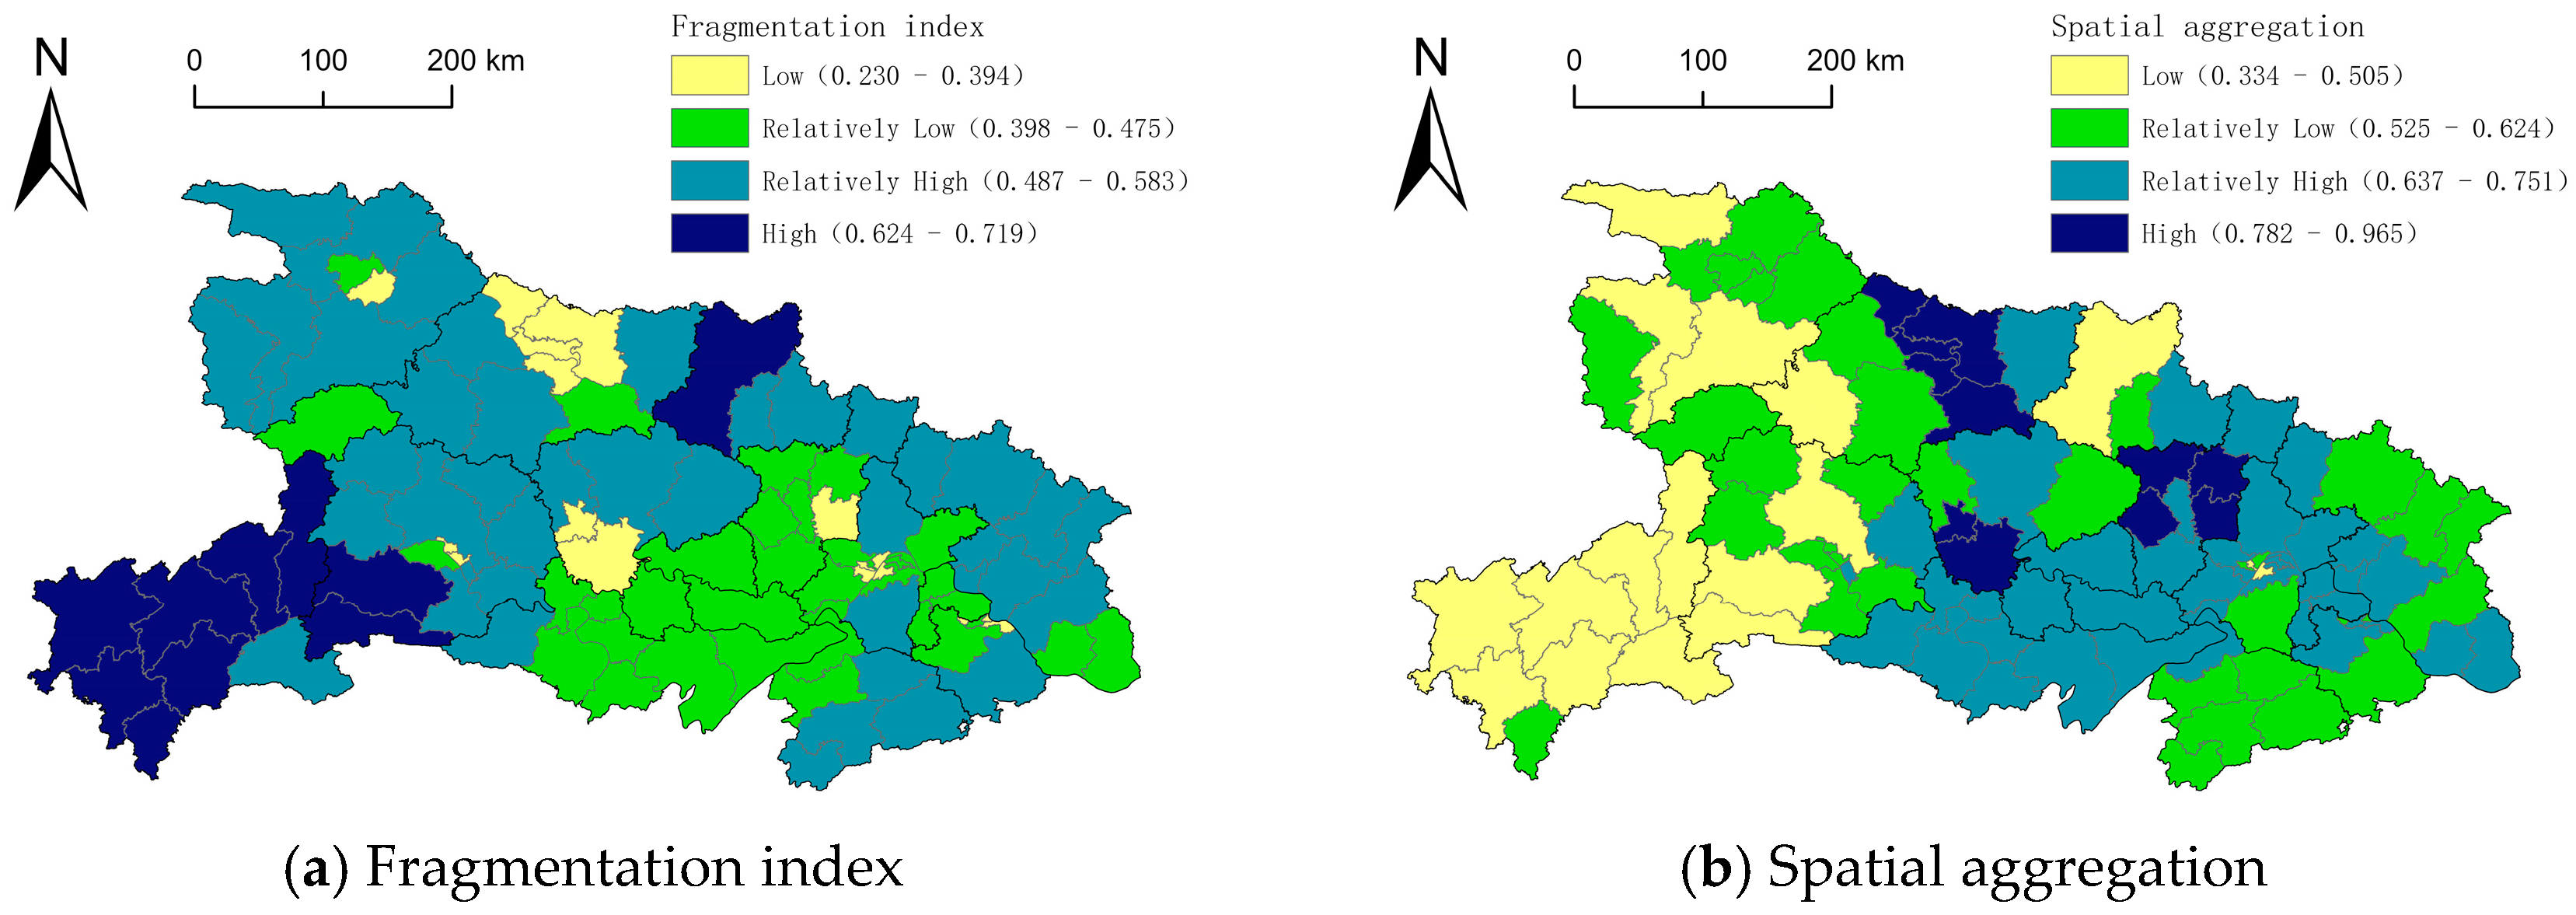
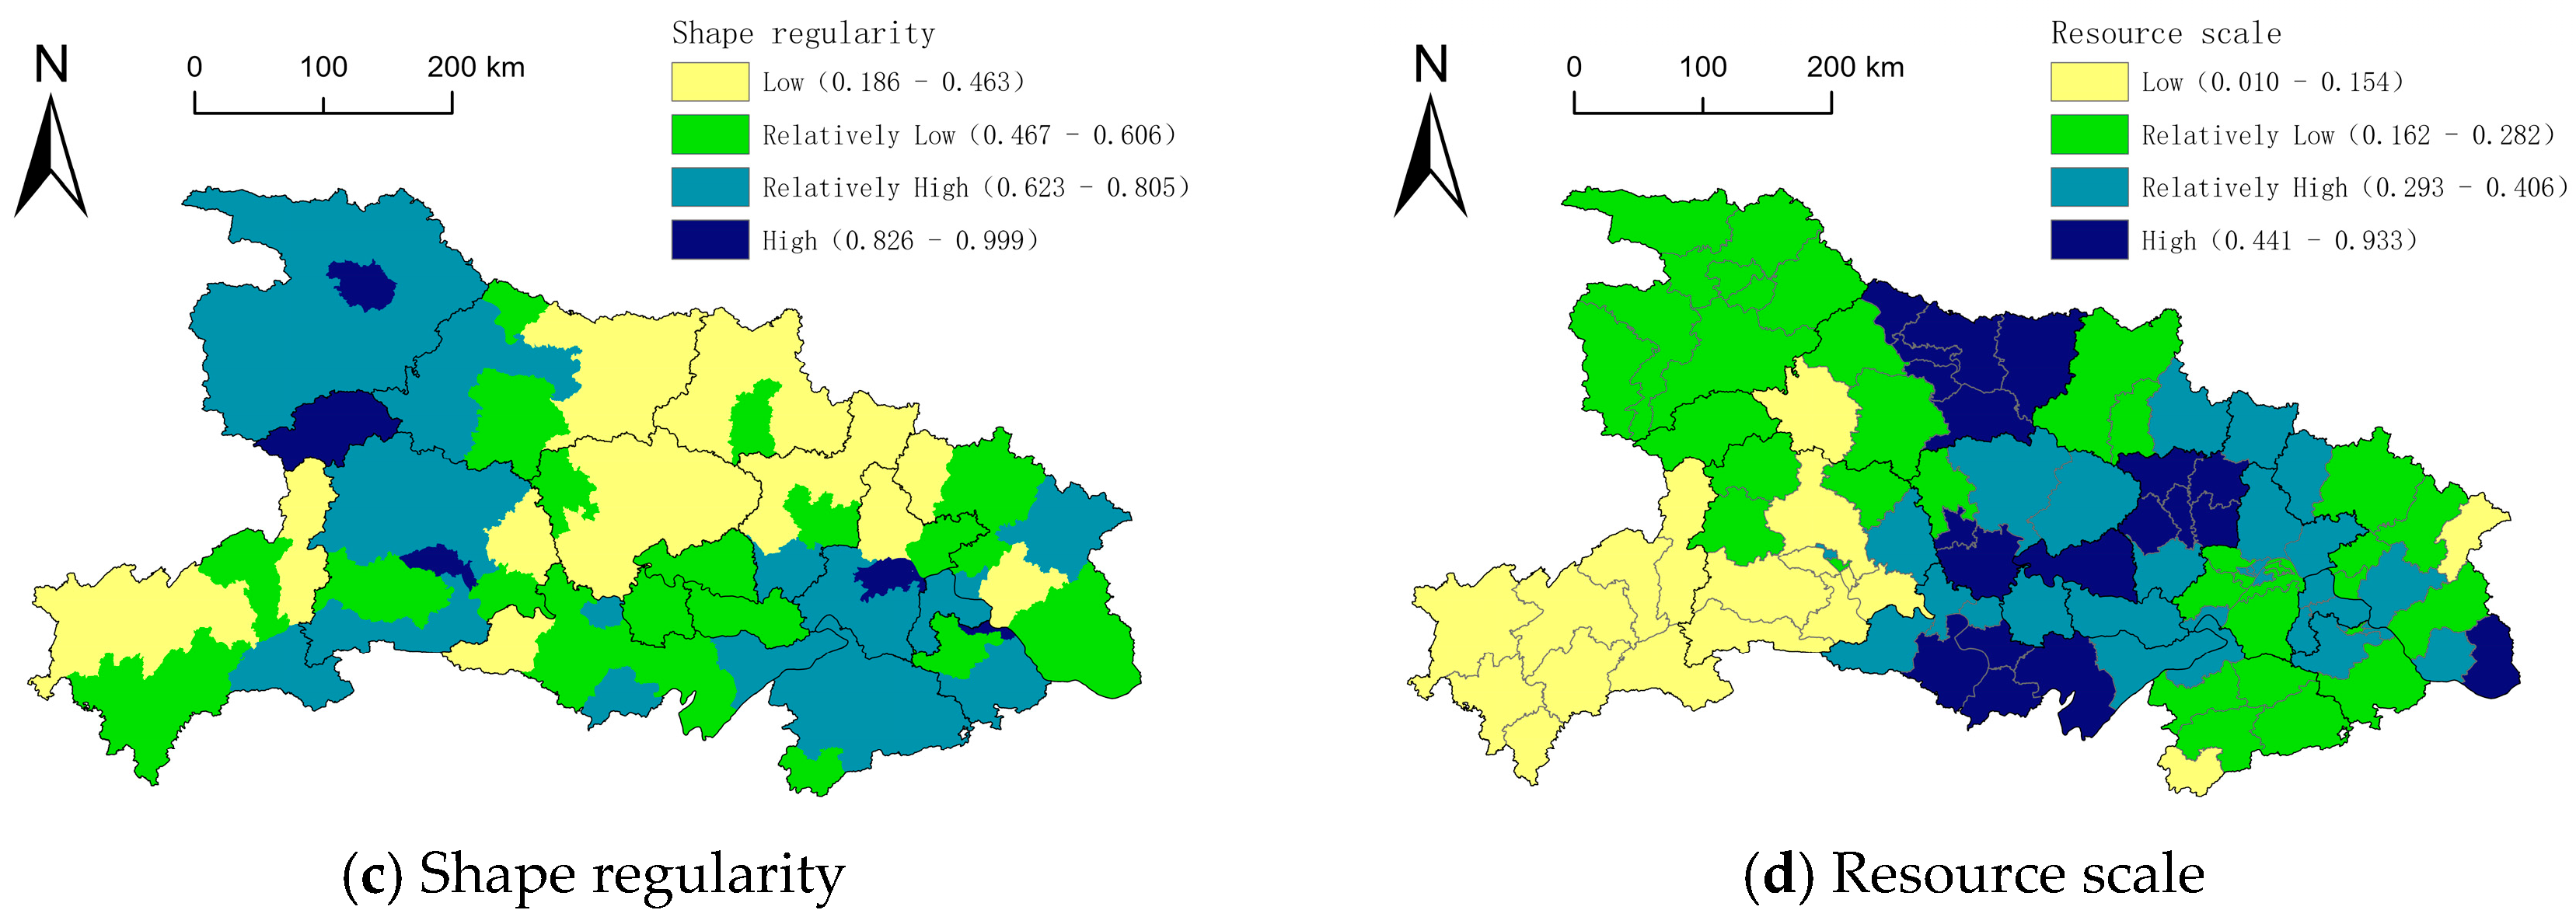
The farmland fragmentation index for Hubei Province was integrated by separately measuring the scale, shape regularity, and spatial concentration of farmland resources. As shown in Figure 4, the maximum fragmentation index in Hubei Province was 0.719, the minimum was 0.230, and the average was 0.483. From a quantitative perspective, the fragmentation of Hubei’s farmland falls into the following categories: mild fragmentation [0.230, 0.394], moderate fragmentation [0.398, 0.475], moderate fragmentation [0.487, 0.583], and severe fragmentation [0.624, 0.719]. The respective proportions of county-level units in these categories are 18.45%, 32.04%, 39.81%, and 9.71%. Among these, the number of county-level units affected by severe fragmentation was the smallest, with the smallest cultivated land area, totaling 10 units covering 5200.32 km2. Moderate fragmentation involved the largest number of county-level units, totaling 41 units with the largest cultivated land area, covering 20,194.35 km2. Spatially, Hubei’s farmland fragmentation index exhibits a pattern of low-to-moderate values in the central regions and high values in the western areas. Specifically, areas with mild and relatively mild fragmentation are primarily distributed across the Jianghan Plain and Xiangyang City in northwest Hubei. Moderate fragmentation is concentrated in northwest and southeast Hubei, while severe fragmentation is predominantly found in southwest Hubei.
Figure 4.
Spatial distribution of cultivated land fragmentation evaluation in Hubei Province.
4.3. Results for the Farmland Utilization Zone
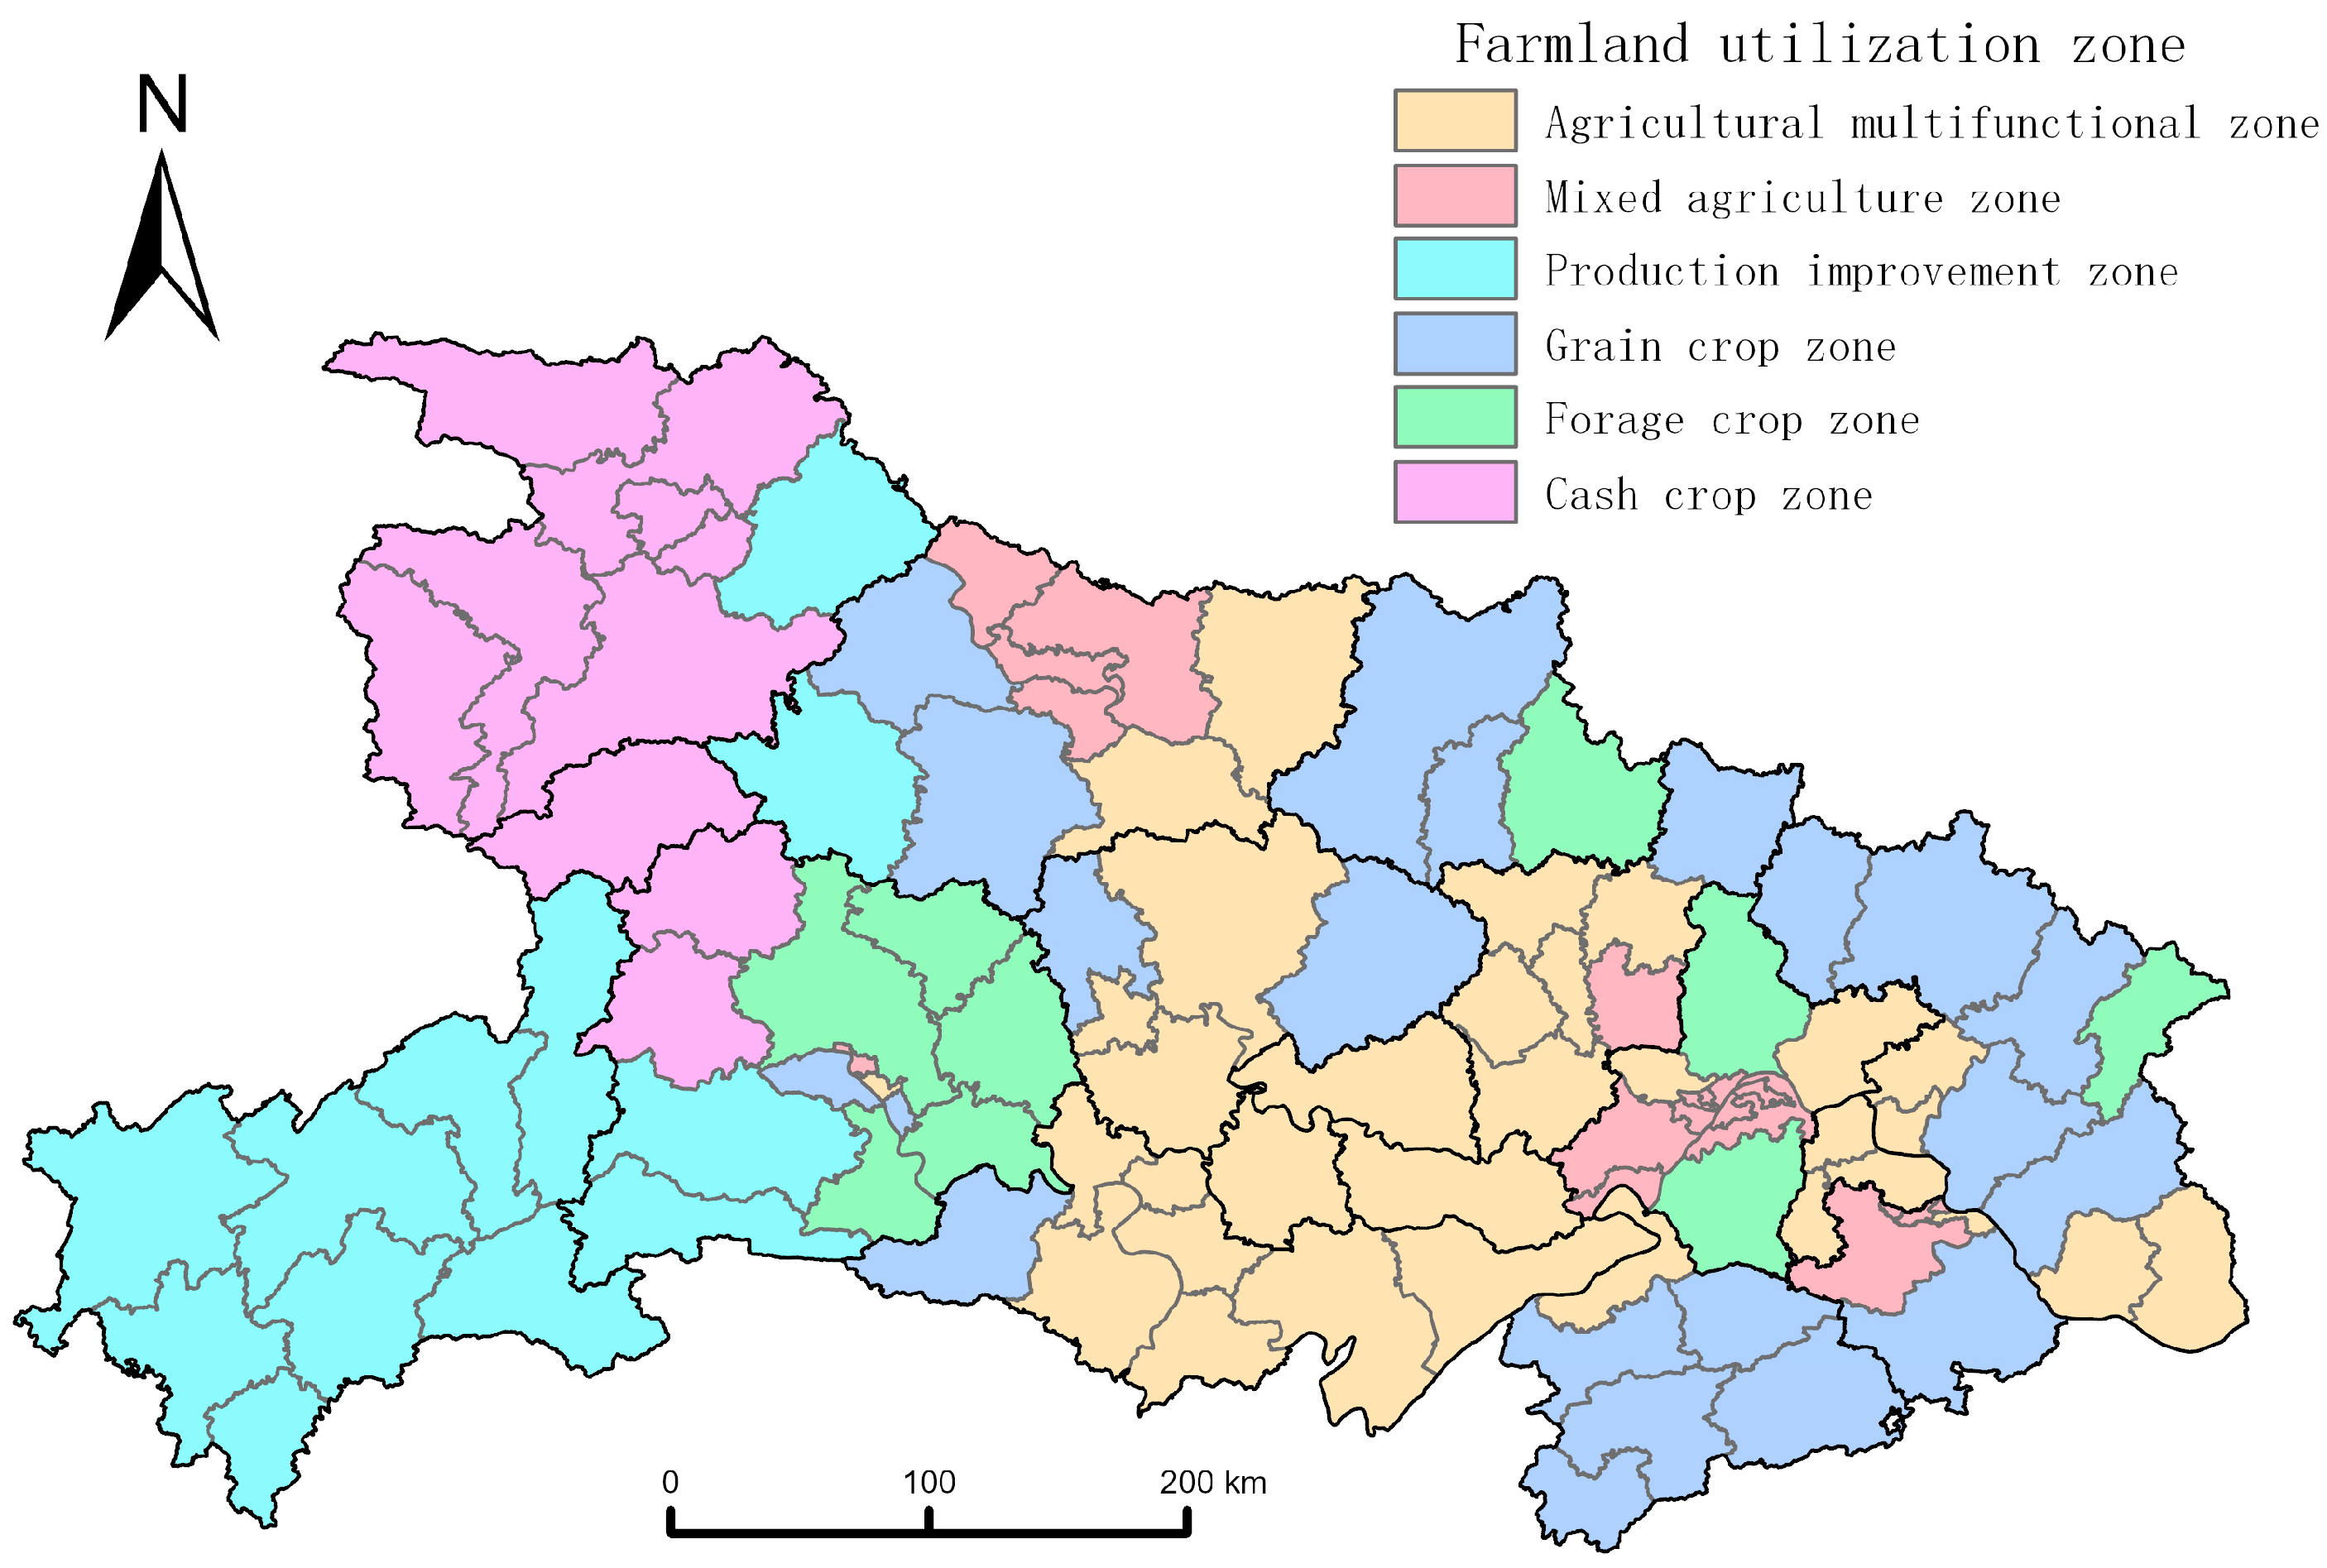
This study input the suitability grades for grain crops, cash crops, and forage crops, along with the farmland fragmentation grade, as input vectors into the SOM. By comparing the ratios of the mean inter-cluster distances to the mean intra-cluster distances across different numbers of clusters, the optimal number of clusters was determined to be 6. Based on SOM clustering, Hubei Province’s farmland utilization was divided into six zones: agricultural multifunctional zone, mixed agricultural zone, grain crop zone, cash crop zone, forage crop zone, and production improvement zone (Figure 5).
Figure 5.
Spatial distribution of cultivated land utilization in Hubei province.
Agricultural multifunctional zone: This zone achieves agricultural production diversity by cultivating different crop types, yielding multiple benefits with regard to economic, social, and environmental aspects. Primarily located on the Jianghan Plain in central Hubei Province, it encompasses 32 county-level administrative units with a total cultivated area of 22,454.66 km2. As shown in Table 3, this zone exhibits high suitability levels for grain, cash, and forage crops, with average values of 0.612, 0.426, and 0.435 respectively, and relatively low levels of land fragmentation. This region requires encouragement and promotion of diversified cropping patterns to optimize crop growth environments. By introducing different crop varieties through rotation or intercropping, the region’s farmland resources can be fully utilized. Diversified cropping structures meet the demand for varied agricultural products under the concept of a broad food perspective, enhancing agricultural economic and social benefits while promoting sustainable agricultural development.
Table 3.
Average values for each partition after normalization.
Mixed agriculture zone: This zone is suitable for growing cash crops and forage crops. Cropping practices can vary based on local agricultural conditions and market demands. Primarily distributed across Xiangyang City, Wuhan City, and Huangshi City, this zone encompasses 19 county-level administrative units with a total farmland area of 4199.60 km2. The suitability levels for economic and forage crops are generally high, averaging 0.503 and 0.429 respectively, while overall land fragmentation is classified as mild. To meet grain crop cultivation needs, this zone continuously increases the proportion of dual-purpose economic-forage cropping systems.
Grain crop zone: Primarily used for cultivating food grains, this zone plays a vital role in regional food security. It spans southeastern and northeastern Hubei, encompassing 21 county-level administrative units with a total farmland area of 10,780.89 km2. The suitability for grain crop cultivation in this zone is significantly higher than that for the other two crop types, with an average suitability index of 0.528. The overall fragmentation of farmland in this zone is classified as moderately fragmented. Building upon farmland quality monitoring and evaluation efforts, this zone should establish a cropping use monitoring network to promptly identify and address issues of declining farmland quality, while strictly controlling the conversion of farmland to non-agricultural uses.
Cash crop zone: This zone primarily cultivates crops for commercial purposes, playing a pivotal role in driving regional agricultural economic development. It is mainly distributed in eastern Yichang City and the outlying suburbs of Wuhan City, comprising a total of 9 county-level administrative units with a total cultivated land area of 4208.02 km2. The suitability for cash crops cultivation in this zone is relatively higher than that for the other two crop types, with an average suitability index of 0.483. The overall fragmentation of farmland in this zone is classified as moderately fragmented. Continuous optimization of the variety structure for cash crops is needed to foster cluster development advantages and promote the integrated development of the cash crops industry.
Forage crop zone: This zone primarily cultivates crops used for animal feed production, supporting the development of the livestock industry. Primarily distributed across areas such as Northwestern Hubei, it encompasses 10 county-level administrative units with a total cultivated land area of 2112.60 km2. The suitability for forage crop cultivation in this zone is significantly higher than that for the other two crop types, with an average suitability index of 0.497. The overall fragmentation of cultivated land in this zone is at a moderate level. Under the “grain-to-feed conversion” policy, this zone continuously adjusts and optimizes its agricultural planting structure, forming an integrated development model combining cultivation, breeding, and harvesting. This transforms the region from a simple “grain granary” into a “grain granary + milk tank + meat warehouse,” providing support for enhancing the quality and efficiency of Hubei’s livestock industry.
Production improvement zone: This zone is generally unsuitable for cultivating any major crop type and requires extensive engineering projects to significantly enhance soil quality, thereby elevating regional agricultural productivity. Primarily located in Enshi Prefecture and western Yichang City in southwestern Hubei, it encompasses 12 county-level administrative units with a total farmland area of 4767.42 km2. This zone exhibits low suitability for grain, cash crops, and forage crops, with average suitability scores of 0.338, 0.297, and 0.418 respectively. Additionally, it suffers from relatively severe fragmentation of farmland. Given the overall poor quality and extensive fragmentation of its farmland, this zone requires vigorous agricultural remediation projects to enhance soil quality and promote intensive land use.
Table 3 presents the standardized mean values of each functional zone across the four-dimensional indicators, quantitatively characterizing the “resource utilization fingerprint” features of each zone. From a multidimensional perspective, the agricultural multifunctional zone exhibits a comprehensive advantage structure characterized by “three highs and one low” (grain 0.612, economic crops 0.426, fodder crops 0.435, and feed crops 0.435); the mixed agricultural zone exhibits a “dual emphasis on cash crops and fodder” structure (cash crops 0.421, fodder 0.429), the grain crop zone features a “grain-specialized” structure (grain 0.528), the forage crop zone displays a “forage-specialized” structure (fodder 0.497), the cash crop zone exhibits a “cash crop dominance” structure (cash crops 0.483), and the production improvement zone presents a comprehensive constraint structure characterized by “three lows and one high.” Significant differences in the combined characteristics of each functional zone within the four-dimensional space validate the rationality of the SOM clustering classification. This quantitative fingerprint provides data support for subsequent formulation of differentiated zoning control measures.
5. Discussion
This study, grounded in the “big food concept,” established a three-tiered framework for farmland utilization zoning based on the “grain-cash crops-forage” tripartite structure and successfully applied it in Hubei Province. The findings validate the methodology’s feasibility and prompt deeper reflection on the implications of zoning outcomes, the approach’s applicability, and future research directions. Based on the zoning results and the strategic orientation of the “big food concept,” this study proposes a set of regionally differentiated farmland use and management recommendations. These recommendations are derived from a synthesis of the empirical findings (i.e., crop suitability and fragmentation levels), existing agricultural policies in Hubei Province, and insights from national guidelines on agricultural structural adjustment and rural revitalization. Furthermore, the proposed measures are aligned with international experiences in multifunctional agriculture and land use planning, ensuring their relevance and adaptability to local conditions while maintaining consistency with global trends in sustainable agricultural development.
- (1)
- Alignment and enhancement of zoning outcomes with the strategic implications of the “big food concept”
The six functional zones delineated in this study precisely identify Hubei Province’s regional division of labor within its diversified food supply system. This result echoes the findings of Zhu et al. [7], who argued that a big food perspective necessitates inter-regional coordination and a shift from a singular focus on grain to a more diversified agricultural system. The agricultural multifunctional zone is highly concentrated in the Jianghan Plain, characterized by superior natural endowments. This area exhibits high suitability for grain, cash, and forage crops, confirming its role as a core bastion for implementing the “big food concept” and ensuring food supply diversity. In contrast, the spatial differentiation of grain crop zones, cash crop zones, and forage crop zones (e.g., forage crop zones concentrated in northeast and southeast Hubei) profoundly reflects the intrinsic logic of agricultural resource allocation and regional comparative advantages, moving beyond traditional “food security”-oriented spatial layout optimization [18]. This zoning outcome spatially demonstrates that the “big food concept” does not diminish grain production but encourages optimizing agricultural structures based on resource endowments while ensuring food security, thereby achieving an overall enhancement of food supply capacity. However, the concentrated distribution of production improvement zones in southwestern Hubei also alerts us that natural geographical conditions remain a rigid constraint on the comprehensive implementation of the “big food concept.” For such regions, future policy formulation must weigh the input-output efficiency of investments in improving farmland quality or, as suggested by Li et al. [9], explore shifting food supply pathways toward developing non-traditional farmland resources.
In the agricultural multifunctional zone (Jianghan Plain), policies should encourage the development of “rice plus” ecological farming models and support the establishment of national modern agricultural demonstration zones and food security industrial belts; explore linking subsidies for high-standard farmland construction to crop diversification (such as winter green manure or forage crops) to maintain and enhance soil fertility. In grain crop zone (Eastern and Northern Hubei); strictly enforce the priority sequence for arable land use to ensure basic self-sufficiency in grains; prioritize high-standard farmland construction, seed industry revitalization initiatives, and the delineation and protection of grain production functional zones in these areas; and increase relevant subsidies to effectively safeguard farmers’ enthusiasm for grain cultivation. Potential policies in the cash crop zone (suburban areas and eastern Yichang) are as follows: Guide integration into the development plans of central cities like Wuhan and Yichang to establish backup bases for urban “vegetable basket” projects. Prioritize support for facility agriculture development, cold-chain logistics infrastructure, and regional public brand building to enhance the added value and market competitiveness of cash crops. Potential policies in the forage crop zone (Northeast and Southeast Hubei) are as follows: Align closely with Hubei’s livestock development plans, particularly the strategic layout for ruminant livestock such as cattle and sheep. Promote models like “corn-legume” intercropping and winter fallow grass planting in these areas. Provide policy incentives for agricultural machinery subsidies and silage production to foster “integrated crop-livestock systems” and transform “grain granaries” into “grain granaries + milk tanks + meat reserves.” Potential policies in production improvement zone (Southwest Hubei): In the short term, the focus should not be on increasing grain yields but rather on comprehensive soil and water conservation management for sloping farmland, land reclamation, and soil fertility enhancement. Long-term efforts should include conducting ecological carrying capacity assessments and exploring the conversion of some farmland in ecologically fragile areas into forest or grassland, drawing on the concept of “farmland replacement” [42]. This would enable the development of mountain-specific agriculture and eco-tourism, achieving a win-win outcome for ecological conservation and improved livelihoods.
- (2)
- Statistical significance of partitioning results and logical explanation of clustering
Regarding the mean characteristics of each functional zone across the four indicators shown in Table 3, the validity of the partitioning results requires in-depth interpretation based on the statistical principles of multidimensional clustering. Although some regions exhibit small differences in single-indicator means at first glance, this division precisely demonstrates the scientific validity of employing the SOM neural network model for multidimensional spatial clustering in this study. The clustering is not based solely on grain crop suitability values but rather on a four-dimensional feature vector combination encompassing “grain-cash crop-forage suitability” and the degree of farmland fragmentation. As shown in Table 3, the “structural patterns” of each zone in the four-dimensional space exhibit significant differences: the multifunctional agricultural zone presents as “three highs (high grain, cash crops, and fodder) and one low (low fragmentation),” representing a comprehensive advantage type with optimal resource endowment; the grain crop zone manifests as “high grain, medium cash crops, low fodder, and medium fragmentation,” belonging to a grain production-dominant type; The forage crop zone exhibits “high forage, low grain, low cash crops, and medium fragmentation,” representing a forage production-dominant type; the production improvement zone shows “three lows (low grain, low cash crops, low forage) and one high (high fragmentation),” representing a comprehensive constraint type. The delineation of functional zones is based on their relative positions and structural characteristics within the entire four-dimensional feature space, rather than solely on the absolute numerical values of any single dimension. Therefore, even though the grain crop suitability scores of the feed crop zone (mean 0.312) and production improvement zone (mean 0.338) show little difference, their significant structural disparities in feed crop suitability (0.497 vs. 0.418) and fragmentation level (0.494 vs. 0.643) justify the SOM model’s classification into distinct categories, consistent with clustering logic. the SOM model’s classification into distinct categories aligns with clustering logic.
For the “forage crop zone,” investments should prioritize technologies and subsidies linked to boosting corn and soybean yields. Conversely, the “production improvement zone” should avoid blindly pursuing crop yields and instead prioritize land reclamation and ecological land conversion.
- (3)
- Advantages, Limitations, and Extension Potential of the Methodological Framework
Introducing the landscape fragmentation index as a corrective factor for suitability evaluation constitutes a key contribution of this study. Many existing zoning studies focus on crop suitability or land quality [12,13,33], often overlooking the significant impact of spatial patterns on agricultural production efficiency and scalability. Our findings confirm that even in areas with high suitability, severe fragmentation (e.g., moderate to severe levels in western Hubei) can constrain agricultural modernization. This aligns with research by Liu et al. [37] and Chen et al. [28], who demonstrated that fragmentation negatively affects land productivity and scalability. By integrating fragmentation, our zoning results—such as the classification of the production improvement zone—not only reflect what crops can be grown but also indicate how easily they can be farmed efficiently. This provides a more realistic and nuanced foundation for policy-making compared to traditional “land use zoning” approaches that primarily focus on quality grades [21,22,23].
Methodologically, this study advances beyond traditional one-dimensional evaluation techniques like the Analytic Hierarchy Process [21] or composite index models [22], which often struggle to handle the complex interactions of multi-dimensional data. By employing the SOM neural network, we were able to integrate suitability assessments for three crop types with fragmentation data in an unsupervised manner, effectively revealing the natural clustering patterns of farmland utilization. This approach addresses the need for more integrated analytical frameworks as highlighted in the recent literature [20,25]. Compared to methods like the three-dimensional magic cube [26,27], SOM offers greater objectivity in identifying functional zones based on the intrinsic properties of the data itself, thereby enhancing the scientific rigor and precision of farmland utilization classification.
However, this methodology has certain limitations. First, in constructing the indicator system, the selection of suitability indicators for grain, cash, and forage crops, as well as the fragmentation indicators, relies heavily on the availability of data. For instance, in evaluating cash crop suitability, indicators for “economic benefits” predominantly use statistical yearbook data at the county level. This macro-scale data struggles to reflect the nuanced planting decisions made by individual farmers, who are micro-level decision-makers, thus introducing a degree of scale effect bias [42]. Second, while the SOM model has advantages in clustering high-dimensional data, its “black box” nature makes it difficult to intuitively explain the contribution of each input indicator (e.g., suitability, fragmentation) to the final clustering outcome [25]. This reduces the transparency of the decision-making process to some extent. Finally, this study primarily focuses on the physical and economic attributes of the farmland system. It inadequately incorporates external environmental risk factors, such as the impact of climate change on crop suitability zones [36] or the effects of market price volatility on farmers’ cropping structures. Future research should integrate higher-resolution remote sensing data (e.g., crop identification at the parcel level) and field survey data to refine the analysis to the township or village scale. It should also combine interpretable machine learning methods to unveil the driving mechanisms behind zoning outcomes, thereby further enhancing the precision and practical applicability of the research.
- (4)
- Policy implications and research outlook
The main purpose of zoning delineation is to help with precise governance. The zoning results from this study provide direct evidence for implementing differentiated management of farmland resources. For instance, in multifunctional agricultural zones, policies should encourage eco-friendly mixed cropping and agritourism integration to maximize their diverse values. In production improvement zones, comprehensive remediation projects—such as constructing high-standard farmland and consolidating land parcels—should be prioritized. Concurrently, assessing ecological carrying capacity is essential to explore adaptive management pathways: cultivating where suitable for farming, reforesting where suitable for forests, and grazing where suitable for pastures. To translate zoning outcomes into tangible governance effectiveness, future research should expand in the following directions: First, enhance mechanistic analysis by employing models such as geographic detectors and multiple regression to quantitatively reveal the influence intensity of various drivers (e.g., slope, distance to markets, policy investments) on zoning formation, thereby identifying targets for regulation. Second, run multi-scenario simulations that combine regional development strategies (like goals for carbon neutrality and rural revitalization) with risk factors (like drought and market volatility) to see how farmland use patterns will change over time with different development paths. This will help national land-use planning be more accurate.
6. Conclusions
This study adopts a macro-food perspective to establish a three-dimensional evaluation system for farmland quality, encompassing grain, cash crops, and forage crops. It assesses the suitability of Hubei Province’s farmland for grain, cash, and forage crops. Integrating results from farmland fragmentation analysis, the study employs a SOM neural network model to achieve farmland utilization zoning. The key findings are as follows:
- (1)
- The proposed system integrates crop suitability, land fragmentation, and spatial clustering to delineate zones, comprehensively assessing agricultural productivity across different crop types. This framework guides tailored conservation strategies for each zone based on fragmentation levels and spatial clustering patterns. This methodology effectively achieves food security-oriented objectives.
- (2)
- Overall, the study area exhibits high suitability for grain crops, moderate suitability for cash crops, and low suitability for forage crops. The farmland fragmentation index displays a spatial pattern characterized by low-to-moderate levels in the east and higher levels in the west.
- (3)
- Based on suitability for grain crops, cash crops, and forage crops, along with land fragmentation status, the SOM model divides farmland into six types: multifunctional agricultural zones, mixed agricultural zones, grain crop zones, cash crop zones, forage crop zones, and production improvement zones. Corresponding optimization and remediation measures are proposed for each zone type, guiding the quantitative regulation, quality enhancement, spatial allocation, and sustainable utilization of farmland resources.
Author Contributions
All authors participated in the conception and design of the study. This research was primarily conceived and designed by X.L. and X.L. was responsible for theoretical derivation and model construction, and drafted the initial manuscript. X.Z. and J.R. completed material preparation and data collection. Q.W. provided academic guidance and performed data analysis and processing. X.L. and Q.W. rigorously reviewed the entire manuscript and made substantial revisions. All authors have read and agreed to the published version of the manuscript.
Funding
This research received funding from the Science and Technology Program of Gansu Province—Key Research and Development Project for Ecological Civilization Construction (NO. 24YFFA050), the University Teachers’ Innovation Foundation of Gansu Province (NO. 2024B-071) and the Natural Science Foundation of Gansu Province (NO. 24JRRA641).
Data Availability Statement
The data supporting the findings of this investigation are accessible from the relevant authors upon reasonable request.
Acknowledgments
The authors extend their appreciation to the editors and anonymous reviewers for their invaluable constructive criticism, which substantially improved the manuscript.
Conflicts of Interest
The authors assert that the research was performed without any commercial or financial affiliations that might be interpreted as potential conflicts of interest.
References
- Liu, Y.S.; Qiao, L.Y. Institutional and Policy Innovations for Farmland Protection in the Context of China’s New Urbanization. Econ. Geogr. 2014, 34, 1–6. [Google Scholar] [CrossRef]
- Jin, X.B.; Liang, X.Y.; Han, B.; Wang, S.L.; Hong, B.T.; Song, J.P. Analysis of Farmland Protection Theory and Geographical Support Framework for Chinese Modernization. Econ. Geogr. 2022, 42, 142–150. [Google Scholar] [CrossRef]
- Ye, S.J.; Song, C.Q.; Gao, P.C.; Cheng, F.; Ren, S.Y.; Du, B. Establishing a New Framework for Understanding Cultivated Land Resources from a Geospatial Perspective. J. Agric. Eng. 2023, 39, 225–240. [Google Scholar]
- Xie, H.L.; Liu, G.Y. Spatiotemporal difference and determinants of multiplecropping index in China during 1998–2012. Acta Geogr. Sin. 2015, 70, 604–614. [Google Scholar]
- Chen, W.G.; Kong, X.B. Exploring China’s Science and Technology Innovation Strategy for Farmland Protection. Soil Bull. 2023, 54, 947–954. [Google Scholar] [CrossRef]
- Chen, F.; Li, Y.H.; Yu, H.C.; Hua, Z.Y.; Ma, L.; Jiang, F.F. The “Big food conceptperspective” guides the restructuring of the national spatial development and conservation framework. Chin. Land Sci. 2023, 37, 1–10. [Google Scholar]
- Zhu, X.H.; Zhang, Y.; Zhu, Y.Y. Regional regulation and interregional coordination of cultivated land protection in China from the perspective of “Greater Food” approach. Acta Geogr. Sin. 2023, 78, 2147–2162. [Google Scholar]
- Zhu, M.; Ke, X.; Du, D. Research on Cultivated Land Planting Control Zoning in China towards Dietary Structure Upgrading. Chin. Land Sci. 2025, 39, 118–130. Available online: https://www.chinalandscience.com.cn/zgtdkxen/article/abstract/20240858 (accessed on 14 February 2026).
- Li, W.B.; Liu, S.H.; Zhu, Y.L.; Zhang, Y.N.; Gong, X.X.; Liu, J.A. Development Pathways and Risk Responses for Non-Traditional Farmland under the Grand Food Perspective. Resour. Sci. 2026, 48, 88–99. [Google Scholar] [CrossRef] [Scilit]
- Bian, T.X.; Wang, M.C.; Huang, X.J.; Dai, J. Logic and Strategies for Addressing Non-Crop Use of Farmland from a Broader Food Perspective. Planner 2023, 39, 14–19. [Google Scholar]
- Du, G.M.; Liu, Y.S. Evaluation and Zoning Study on Intensive Utilization of Farmland in Heilongjiang Province. Resour. Sci. 2013, 35, 554–560. [Google Scholar]
- Liu, Y.; Hao, X.Y.; Pan, Y.C.; Tang, X.M. Spatio-Temporal Variation and Zoning of Intensive Farmland Utilization in Henan Province. Geogr. Sci. 2014, 34, 1218–1225. [Google Scholar] [CrossRef]
- Feng, T.; Zhang, F.R.; Li, C.; Qu, Y.B.; Zhu, F.K. Spatial Layout of Basic Farmland at the County Level Based on Comprehensive Evaluation of Cultivated Land Quality. J. Agric. Eng. 2014, 30, 200–210, 293. [Google Scholar]
- Wen, L.Y.; Kong, X.B.; Zhang, B.B.; Sun, X.B.; Xin, Y.N.; Zhang, Q.P. Development and Application of a Farmland Quality Evaluation System Based on Sustainable Development Requirements. J. Agric. Eng. 2019, 35, 234–242. [Google Scholar]
- Su, H.; Wu, C.F. Analysis of Factors Influencing the Value of Cultivated Land Resources in Black Soil Areas Based on the “Three-Life” Function: A Case Study of Keshan County, Heilongjiang Province. Chin. Land Sci. 2020, 34, 77–85. [Google Scholar]
- Xiong, C.S.; Zhang, Y.L.; Wang, Y.J.; Luan, Q.L.; Liu, X. Multifunctional Evaluation and Zoning Management of China’s farmland. Chin. Land Sci. 2021, 35, 104–114. [Google Scholar]
- Qian, F.K.; Chi, Y.R.; Xu, H.; Pang, R.R.; Wang, S.Z.; Li, H.X.; Wen, L. Analysis of the Evolution of the Multifunctional Trade-off Relationship in Shenyang’s farmland from 2006 to 2020. Chin. Land Sci. 2022, 36, 31–41. [Google Scholar]
- Li, W.Y.; Gao, Y.J. Concepts, Challenges, and Implementation Pathways for Optimizing the Spatial Layout of Farmland in the New Phase of Farmland Compensation Balance—Reflections Based on the “Theory and Practice of Farmland Spatial Layout Optimization Academic Symposium”. Chin. J. Land Sci. 2025, 39, 130–140. [Google Scholar]
- Wei, P.; Yu, D.; Hu, Y.; Hu, H.; Sun, C. Evaluating cultivated land fragmentation and remediation zoning under planning management. Trans. Chin. Soc. Agric. Eng. Trans. CSAE 2024, 40, 283–293. [Google Scholar] [CrossRef]
- Jin, X.Y.; Jiang, C.; Xie, Z.; Zhu, X.; Shi, C.M. Diagnosis and Hierarchical Restoration of Utilization Potential for “Non-Grain” Farmland in Southern Mountainous Regions under the Grand Food Outlook. J. Agric. Eng. 2025, 41, 269–279. [Google Scholar] [CrossRef]
- Zhang, H.M.; Song, G.; Wang, S.Z. A “Quality-Output-Efficiency” Framework for Farmland Utilization Zoning in Liaoning Province. J. Agric. Eng. 2019, 35, 234–242. [Google Scholar]
- Liu, H.F.; Bi, R.T.; Guo, Y.L.; Wang, J. Research on Farmland Protection Zoning Based on a Multi-dimensional Evaluation System of Morphology-Structure-Function. J. Agric. Mach. 2021, 52, 168–177, 354. [Google Scholar]
- Qian, F.K.; Xiang, Z.X.; Wang, H.X.; Sun, F.J. Research on the Zoning Protection of Farmland in Urban Peripheries Based on the Integration of Three Spatial Boundaries. J. Agric. Resour. Environ. 2022, 39, 1164–1173. [Google Scholar] [CrossRef]
- Wei, S.C.; Xiong, C.S.; Luan, Q.L.; Hu, Y.M. Protected Zone Delineation for Farmland Based on Local Spatial Autocorrelation of Farmland Quality Index. J. Agric. Eng. 2014, 30, 249–256. [Google Scholar]
- Huang, Y.J.; Ye, H.C.; Zhang, S.W.; Yun, W.J.; Huang, Y.F. Productivity Zoning of Chinese Farmland Based on Self-Organizing Feature Mapping Neural Networks. Chin. J. Agric. Sci. 2015, 48, 1136–1150. [Google Scholar]
- Shen, Y.; Gong, J.; Ye, J.; Wang, W.W.; Tao, R. Research on the Delineation of Permanent Basic Farmland Based on “Dual Evaluation”—Taking Huangshi City as an Example. Chin. Land Sci. 2021, 35, 27–36. [Google Scholar]
- Weng, R.; Jin, X.B.; Zhang, X.L.; Han, B.; Gu, Z.M.; Zhou, Y.K. Delineation of Permanent Basic Farmland Reserve Areas Integrating Suitability, Aggregation, and Stability. J. Agric. Eng. 2022, 38, 269–278, 331. [Google Scholar]
- Chen, G.Q.; Liu, G.S.; Qiao, Z.Y.; Zhao, L.S.; Wang, H.M.; Lan, Q.; Lan, D.J. Measurement of Fragmentation and Categorized Management Strategies for Farmland Parcels in Hilly and Mountainous Areas. J. Agric. Eng. 2025, 41, 281–291. [Google Scholar] [CrossRef]
- Zou, L.L.; Liang, Y.F.; Lin, C.; Hu, X.D. Evaluation of Farmland Fragmentation at the “Field-Farm Household” Scale and Detection of Influencing Factors. Trans. Chin. Soc. Agric. Eng. 2025, 41, 306–315. Available online: https://www.aeeisp.com/nygcxb/article/doi/10.11975/j.issn.1002-6819.202409050?viewType=HTML (accessed on 14 February 2026).
- Su, B.Q.; Wang, Y.Y.; Shangguan, Z.P. Impact of the Grain-for-Green Program in Northwest China on Grain Production and Farmers’ Livelihoods. Soil Water Conserv. Bull. 2017, 37, 247–252. [Google Scholar] [CrossRef]
- Zou, C.X.; Yan, S.G.; Fang, F. Research on Ecological Functional Zoning in Hubei Province. Environ. Sci. Manag. 2010, 35, 139–143. [Google Scholar]
- Shangguan, W.; Dai, Y.; Liu, B.; Zhu, A.; Duan, Q.; Wu, L.; Ji, D.; Ye, A.; Yuan, H.; Zhang, Q.; et al. A China Data Set of Soil Properties for Land Surface Modeling. J. Adv. Model. Earth Syst. 2013, 5, 212–224. Available online: https://agupubs.onlinelibrary.wiley.com/doi/full/10.1002/jame.20026 (accessed on 1 February 2026). [CrossRef] [Scilit]
- Dang, M. Assessment of Crop-Land Suitability by the Multi-Criteria Evaluation Approach and Geographic Information System: A Scoping Review. Agric. Eng. Int. CIGR J. 2024, 26, 57–78. Available online: https://cigrjournal.org/index.php/Ejounral/article/view/9049 (accessed on 14 February 2026).
- Li, X.M.; Huang, Q.H.; Lv, J.C.; Li, M.C.; Chen, Z.J.; Li, F.X. Evaluation and Remediation of Farmland Fragmentation Based on Functional Zoning and Multi-Cluster Algorithm Integration. J. Agric. Eng. 2022, 38, 274–282. [Google Scholar]
- Xiao, W.Y.; Zhang, L.W.; Liu, Z.X.; Deng, H.; Deng, A.J. Analysis of Optimal Planting Period for Summer Maize in Hubei Province. Agric. Resour. Reg. Plan. China 2020, 41, 36–45. [Google Scholar]
- ZhuoMa, C.; Yuan, J.Y.; Han, B.; Li, G.; Ma, W.W.; Wang, J.; Liu, Q. Impact of Climate Change on Maize Cultivation Zoning in Rain-fed Agricultural Areas of Gansu Province. Agric. Res. Arid Reg. 2021, 39, 211–219. [Google Scholar]
- Liu, J.; Jin, X.B.; Xu, W.Y.; Yang, X.H.; Cao, S.; Xu, C.L.; Sui, X.Y.; Liu, M.; Zhou, Y.K. Evaluation of Farmland Fragmentation and Research on Land Reclamation Zoning in Jiangsu Province. Geogr. Sci. 2019, 39, 817–826. [Google Scholar] [CrossRef]
- Liu, J.P.; Jin, X.B.; Han, B.; Lin, J.H.; Zhang, X.L.; Liang, J.Y.; Zhou, Y.K. The Conceptual Framework, Characteristics, and Identification of Semi-Natural Agricultural Landscapes. Acta Ecol. Sin. 2022, 42, 9199–9212. [Google Scholar]
- Kohonen, T. The Self-Organizing Map. Proc. IEEE 1990, 78, 1464–1480. [Google Scholar] [CrossRef] [Scilit]
- Cai, B.F.; Mu, B.; Fang, H.; Cui, Y. Ecological Sensitivity Zoning Based on Self-Organizing Neural Networks: A Case Study of Fangshan District, Beijing. Chin. Environ. Sci. 2008, 28, 375–379. [Google Scholar]
- Xie, B.P.; Qu, W.; Yang, J.; Chen, Y. A Study on the Zoning of Basic Conditions for Rural Revitalization Based on SOM: The Case of Tianshui City, Gansu Province. Agric. Resour. Reg. Plan. China 2021, 42, 187–197. [Google Scholar]
- Song, Y.M. A Review of Studies on the Impact of Land Fragmentation and Its Implications. China Agric. Abstr. Agric. Eng. 2024, 36, 3–7. [Google Scholar]

Disclaimer/Publisher’s Note: The statements, opinions and data contained in all publications are solely those of the individual author(s) and contributor(s) and not of MDPI and/or the editor(s). MDPI and/or the editor(s) disclaim responsibility for any injury to people or property resulting from any ideas, methods, instructions or products referred to in the content. |
© 2026 by the authors. Licensee MDPI, Basel, Switzerland. This article is an open access article distributed under the terms and conditions of the Creative Commons Attribution (CC BY) license.